2007 Instrumentation Science and Technology Pressure Connecting Tube Response Time
9
This is a preprint of an article whose final and definitive form has been published in the Instrumentation Science and Technology 35 (2007) 399–409 doi: 10.1080/10739140701436579 © Taylor & Francis Group, LLC 1 THE RESPONSE TIME OF A PRESSURE MEASUREMENT SYSTEM WITH A CONNECTING TUBE Ivan Bajsi ć * , Jože Kutin, Tomaž Žagar Laboratory for Measurement in Process Engineering (LMPS), Faculty of Mechanical Engineering, University of Ljubljana, Askerceva 6, SI-1000 Ljubljana, Slovenia * Corresponding author: E-mail: iv [email protected] ABSTRACT A connecting tube between the measured object and the pressure sensing element is a common component part of pressure measurement systems. Dynamic characteristics of the resulting fluid oscillator may significantly influence the magnitudes of dynamic measurement errors. This paper presents an experimental analysis of dynamic characteristics of connecting tubes of different lengths and diameters. Inlet step pressure changes were generated by a system of two loudspeakers, and pressure responses were measured by a piezoelectric measurement system. Using the measured responses, the characteristic natural frequencies and damping of the system under discussion were determined. The results were further employed to estimate the response settling time, which is required to sufficiently reduce dynamic measurement errors. Key Words: Pressure measurement; Connecting tube; Dynamic measurement error. INTRODUCTION Dynamic characteristics of a measurement system are of significance in measurements of time varying quantities. The deviation of a measured quantity from its true value, resulting from non-ideal dynamic characteristics of the measurement system, is described by the dynamic measurement error. In general, its magnitude varies in time and depends on both the dynamic characteristics of the measurement system and on the dynamics of the measured quantity. Understanding the dynamic characteristics of the measurement system allows us to forecast the behaviour of the measurement instrument when measuring quantities varying in time and to estimate the magnitude of the dynamic measurement error, as well as to properly adjust the measurement process. This paper discusses certain dynamic characteristics of pressure measurement systems. Measurement of time varying dynamic pressures is applied in various fields, eg. in the development of internal combustion engines, in automotive and airplane industry, acoustics, manufacturing processes, hydraulics, pneumatics, robotics and medicine [1]. Depending on the particular application, measurement of dynamic pressures is performed in the Pa to GPa amplitude range, and in the Hz to kHz frequency range. These requirements should be considered in the selection of the pressure measurement sensor and the design of the measurement system. To best utilise the dynamic characteristics of the pressure measurement sensor, its ideal location is immediately on the measurement object, at the point where the measured pressure occurs. This is however not possible in all cases, and a tube, connecting the measured object and the pressure sensor, is often met as a component part of the pressure measurement system.
-
Upload
richard-anish -
Category
Documents
-
view
218 -
download
0
Transcript of 2007 Instrumentation Science and Technology Pressure Connecting Tube Response Time
8/2/2019 2007 Instrumentation Science and Technology Pressure Connecting Tube Response Time
http://slidepdf.com/reader/full/2007-instrumentation-science-and-technology-pressure-connecting-tube-response 1/9
This is a preprint of an article whose final and definitive form has been published in the Instrumentation Science and Technology 35 (2007) 399–409
doi: 10.1080/10739140701436579 © Taylor & Francis Group, LLC
1
THE RESPONSE TIME OF A PRESSURE MEASUREMENT SYSTEMWITH A CONNECTING TUBE
Ivan Bajsić *, Jože Kutin, Tomaž Žagar
Laboratory for Measurement in Process Engineering (LMPS), Faculty of Mechanical Engineering, University of Ljubljana, Askerceva 6, SI-1000 Ljubljana, Slovenia
* Corresponding author: E-mail: [email protected]
ABSTRACT
A connecting tube between the measured object and the pressure sensing element is acommon component part of pressure measurement systems. Dynamic characteristics of theresulting fluid oscillator may significantly influence the magnitudes of dynamic measurement
errors. This paper presents an experimental analysis of dynamic characteristics of connectingtubes of different lengths and diameters. Inlet step pressure changes were generated by asystem of two loudspeakers, and pressure responses were measured by a piezoelectricmeasurement system. Using the measured responses, the characteristic natural frequenciesand damping of the system under discussion were determined. The results were further employed to estimate the response settling time, which is required to sufficiently reducedynamic measurement errors.
Key Words: Pressure measurement; Connecting tube; Dynamic measurement error.
INTRODUCTION
Dynamic characteristics of a measurement system are of significance in measurements of time varying quantities. The deviation of a measured quantity from its true value, resultingfrom non-ideal dynamic characteristics of the measurement system, is described by thedynamic measurement error. In general, its magnitude varies in time and depends on both thedynamic characteristics of the measurement system and on the dynamics of the measuredquantity. Understanding the dynamic characteristics of the measurement system allows us toforecast the behaviour of the measurement instrument when measuring quantities varying intime and to estimate the magnitude of the dynamic measurement error, as well as to properlyadjust the measurement process.
This paper discusses certain dynamic characteristics of pressure measurement systems.Measurement of time varying dynamic pressures is applied in various fields, eg. in thedevelopment of internal combustion engines, in automotive and airplane industry, acoustics,manufacturing processes, hydraulics, pneumatics, robotics and medicine [1]. Depending onthe particular application, measurement of dynamic pressures is performed in the Pa to GPaamplitude range, and in the Hz to kHz frequency range. These requirements should beconsidered in the selection of the pressure measurement sensor and the design of themeasurement system.
To best utilise the dynamic characteristics of the pressure measurement sensor, its ideallocation is immediately on the measurement object, at the point where the measured pressureoccurs. This is however not possible in all cases, and a tube, connecting the measured objectand the pressure sensor, is often met as a component part of the pressure measurement system.
8/2/2019 2007 Instrumentation Science and Technology Pressure Connecting Tube Response Time
http://slidepdf.com/reader/full/2007-instrumentation-science-and-technology-pressure-connecting-tube-response 2/9
This is a preprint of an article whose final and definitive form has been published in the Instrumentation Science and Technology 35 (2007) 399–409
doi: 10.1080/10739140701436579 © Taylor & Francis Group, LLC
2
The effects of the connecting tube on the magnitude of dynamic errors in the transmission of measured pressure quantities depend on the transmission medium and on the geometric andmaterial characteristics of the connecting tube itself. In terms of physics, the connecting tubedynamic characteristics are modelled as a fluid oscillator, i.e. Helmholtz resonator (cf. Section
2).
The dynamic characteristics of pressure measurement systems including connecting tubeshave been studied by different authors. Whitemore and his team (cf. eg. [2-4]) have carriedout theoretical and experimental investigations of the influence of the pressure measurementdynamics on the dynamics of airplane control systems. Their paper [2] formulates, based on
Navier-Stokes equations, a numerical model for the prediction of dynamic measurementerrors, paper [3] presents an experimental analysis of the investigated system throughfrequency excitation, and paper [4] defines a method to compensate the effects on dynamiccharacteristics. An example approach to the compensation of dynamic measurement errors in
pressure measurement, practicable in real time, is presented also in paper [5]. The effects of
tube bends and shrinks on the frequency characteristics of the pressure measurement systemwere studied experimentally [6]
The aim of this paper is to present a measurement system designed to study dynamiccharacteristics of pressure sensors, applying a system of two loudspeakers to generate
pressure changes, which was developed in the LMPS laboratory of the Faculty of MechanicalEngineering [7]. The measurement system is described in Section 3. Section 4 presents someresults of the analysis of dynamic characteristics of plastic connecting tubes based on timeresponse to a step change of pressure. Experiments were carried out with air, for a range of connecting tube lengths and internal diameters. The experimental and simulation resultsserved as a basis for the discussion of optimum dimensions of connecting tubes for the fastestresponse times. In part, the results presented here were also presented in a Slovene-language
journal [8].
FLUID OSCILLATOR
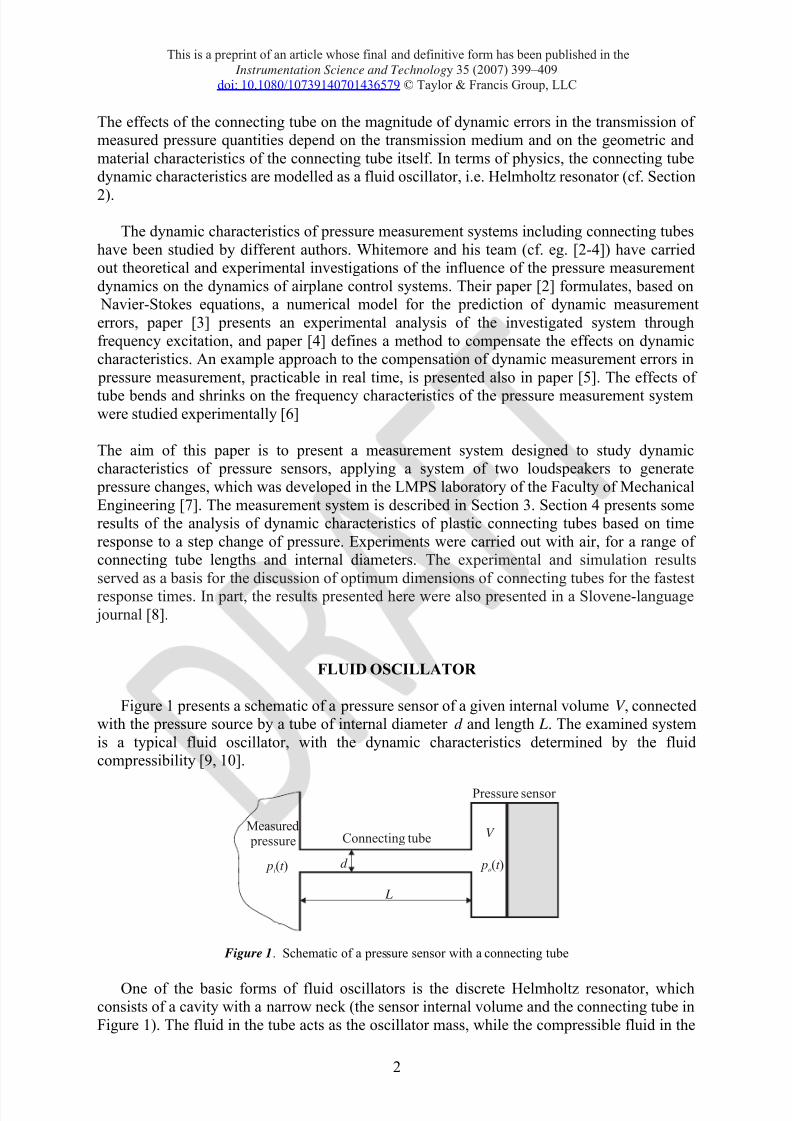
Figure 1 presents a schematic of a pressure sensor of a given internal volume V , connectedwith the pressure source by a tube of internal diameter d and length L. The examined systemis a typical fluid oscillator, with the dynamic characteristics determined by the fluidcompressibility [9, 10].
d
L
Pressure sensor
Measured pressure Connecting tube V
p t i( ) p t o( )
Figure 1. Schematic of a pressure sensor with a connecting tube
One of the basic forms of fluid oscillators is the discrete Helmholtz resonator, whichconsists of a cavity with a narrow neck (the sensor internal volume and the connecting tube inFigure 1). The fluid in the tube acts as the oscillator mass, while the compressible fluid in the

8/2/2019 2007 Instrumentation Science and Technology Pressure Connecting Tube Response Time
http://slidepdf.com/reader/full/2007-instrumentation-science-and-technology-pressure-connecting-tube-response 3/9
This is a preprint of an article whose final and definitive form has been published in the Instrumentation Science and Technology 35 (2007) 399–409
doi: 10.1080/10739140701436579 © Taylor & Francis Group, LLC
3
cavity acts as the oscillator spring. The fundamental analysis of Helmholtz resonators rests onthe assumptions of the rigidity of all the walls, of the absence of standing waves (wavelengthsof pressure oscillation significantly larger than any characteristic dimension) and of the fluidvelocity in the cavity being significantly smaller than the fluid velocity in the tube. In such a
case, the fluid oscillator may be treated as a single degree of freedom dynamic system, which(with the system damping taken into account) yields the following relation between theconnecting tube inlet pressure pi(t ) and the sensor output pressure po(t ):
22 2
0 0 02
d d2
d do o
o i
p p p p
t t , (1)
where 0 = 2 f 0 is the natural angular frequency and the damping ratio. The naturalfrequency of a fundamental form of Helmholtz resonator may be expressed as:
0
1
2
A f c
l V
, (2)
where c is the fluid sound velocity and A = d 2/4 is the internal cross section of the tube.
Even in the case of extending the Helmholtz resonator model (e.g. by taking into accountthe movement of fluid in the cavity or at the connecting tube inlet, the effects of standingwaves etc.), the expression of the characteristic natural frequency remains, in most cases,similar to that in equation (2), except that the length L or volume V are replaced by their effective counterparts, Lef or V ef . In reference [4], the following expression for the first naturalfrequency is derived through the solution of the wave equation:
0
1
2 ef
A f c
L V
,
2ef
L AV V
, (3)
as well as an estimate of the corresponding damping ratio:
0
2
f A
, (4)
where is dynamic viscosity and the fluid density (at inlet parameters). In equation (4), thedamping ratio takes into account pressure losses in the connecting tube, with the fluid flowdriven by pressure variations assumed to be laminar.
DESCRIPTION OF THE MEASUREMENT SYSTEM
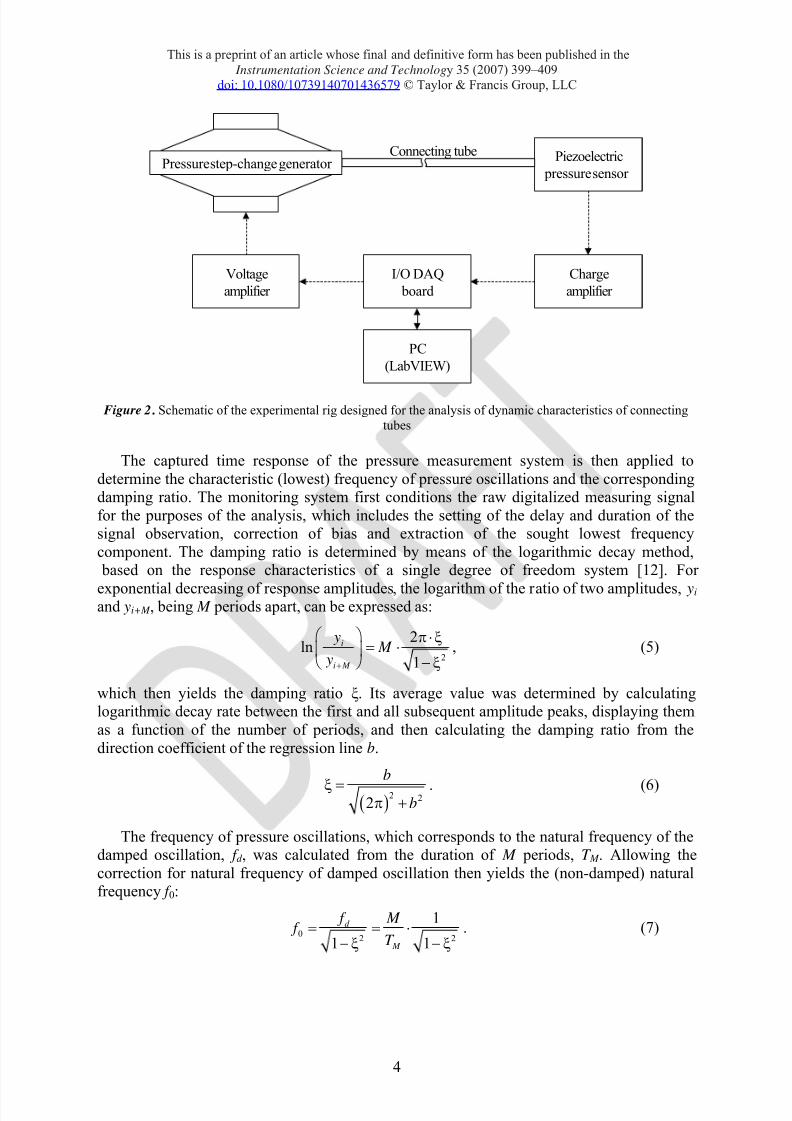
The experiments were carried out in the measurement testing rig, as shown in schematicform in Figure 2. The piezoelectric pressure sensor (Kistler, type 7261) is connected to the air
pressure generator (a system comprising two loudspeakers [6]) through a plastic tube (Festo,type PAN-L) of a given internal diameter and length, the dynamic characteristics of which arethe object of analysis. The charge signal from the pressure sensor is converted into the voltagesignal by the charge amplifier (Kistler, type 5007), which is then measured by a DAQ board(National Instruments, type PCI-6031E). The system monitoring and processing of measurement results are carried out by a computer with monitoring software based on the
LabVIEW platform [11]. The step change of the excitation voltage/current, which generates astep change in pressure, is fed into the two-loudspeaker system through an analog output of the DAQ board and a voltage amplifier.
8/2/2019 2007 Instrumentation Science and Technology Pressure Connecting Tube Response Time
http://slidepdf.com/reader/full/2007-instrumentation-science-and-technology-pressure-connecting-tube-response 4/9
This is a preprint of an article whose final and definitive form has been published in the Instrumentation Science and Technology 35 (2007) 399–409
doi: 10.1080/10739140701436579 © Taylor & Francis Group, LLC
4
I/O DAQ
board
PC
(LabVIEW)
Pressure step-change generator Piezoelectric
pressure sensor
Charge
amplifier
Voltage
amplifier
Connecting tube
Figure 2. Schematic of the experimental rig designed for the analysis of dynamic characteristics of connectingtubes
The captured time response of the pressure measurement system is then applied todetermine the characteristic (lowest) frequency of pressure oscillations and the correspondingdamping ratio. The monitoring system first conditions the raw digitalized measuring signalfor the purposes of the analysis, which includes the setting of the delay and duration of thesignal observation, correction of bias and extraction of the sought lowest frequencycomponent. The damping ratio is determined by means of the logarithmic decay method,
based on the response characteristics of a single degree of freedom system [12]. For
exponential decreasing of response amplitudes, the logarithm of the ratio of two amplitudes, yi and yi+M , being M periods apart, can be expressed as:
2
2ln
1
i
i M
y M
y
, (5)
which then yields the damping ratio ξ. Its average value was determined by calculatinglogarithmic decay rate between the first and all subsequent amplitude peaks, displaying themas a function of the number of periods, and then calculating the damping ratio from thedirection coefficient of the regression line b.
2 22
b
b . (6)
The frequency of pressure oscillations, which corresponds to the natural frequency of thedamped oscillation, f d , was calculated from the duration of M periods, T M . Allowing thecorrection for natural frequency of damped oscillation then yields the (non-damped) naturalfrequency f 0:
0 2 2
1
1 1
d
M
f M f
T
. (7)
8/2/2019 2007 Instrumentation Science and Technology Pressure Connecting Tube Response Time
http://slidepdf.com/reader/full/2007-instrumentation-science-and-technology-pressure-connecting-tube-response 5/9
This is a preprint of an article whose final and definitive form has been published in the Instrumentation Science and Technology 35 (2007) 399–409
doi: 10.1080/10739140701436579 © Taylor & Francis Group, LLC
5
RESULTS AND DISCUSSIONS
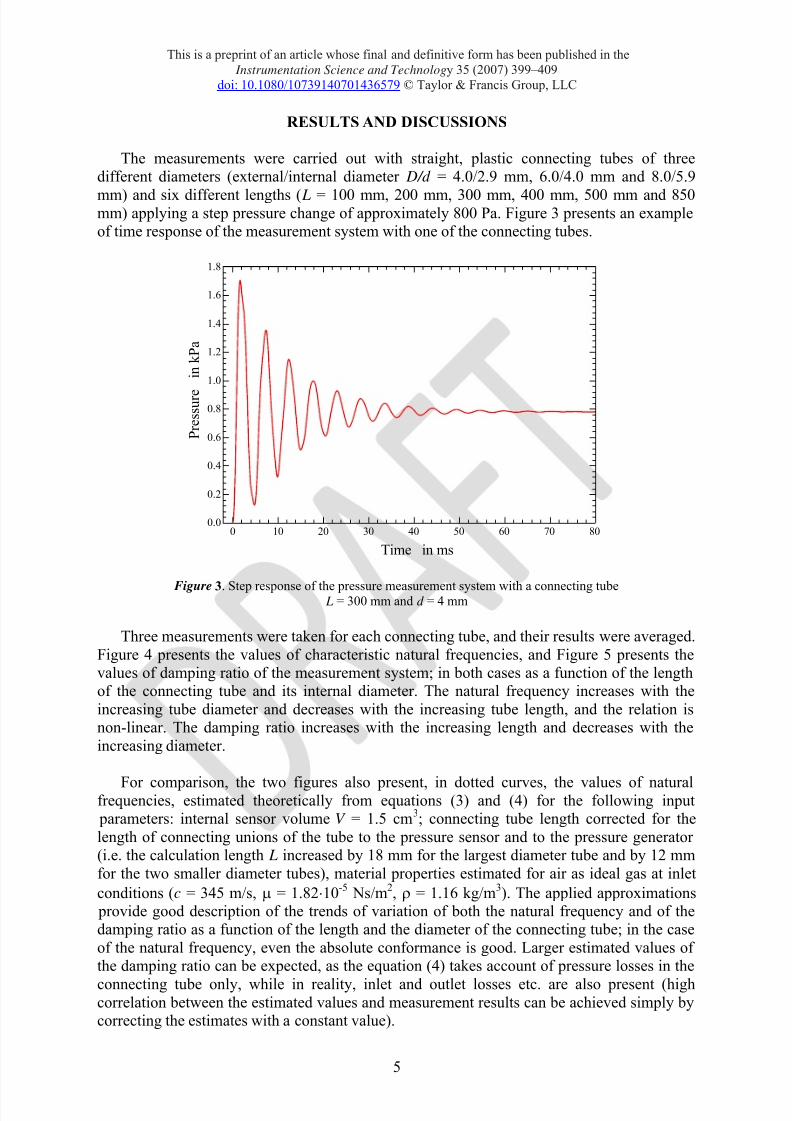
The measurements were carried out with straight, plastic connecting tubes of threedifferent diameters (external/internal diameter D/d = 4.0/2.9 mm, 6.0/4.0 mm and 8.0/5.9
mm) and six different lengths ( L = 100 mm, 200 mm, 300 mm, 400 mm, 500 mm and 850mm) applying a step pressure change of approximately 800 Pa. Figure 3 presents an exampleof time response of the measurement system with one of the connecting tubes.
0 10 20 30 40 50 60 70 800.0
0.2
0.4
0.6
0.8
1.0
1.2
1.4
1.6
1.8
P r e s s u r e
i n k P a
Time in ms
Figure 3. Step response of the pressure measurement system with a connecting tube L = 300 mm and d = 4 mm
Three measurements were taken for each connecting tube, and their results were averaged.Figure 4 presents the values of characteristic natural frequencies, and Figure 5 presents thevalues of damping ratio of the measurement system; in both cases as a function of the lengthof the connecting tube and its internal diameter. The natural frequency increases with theincreasing tube diameter and decreases with the increasing tube length, and the relation isnon-linear. The damping ratio increases with the increasing length and decreases with theincreasing diameter.
For comparison, the two figures also present, in dotted curves, the values of naturalfrequencies, estimated theoretically from equations (3) and (4) for the following input parameters: internal sensor volume V = 1.5 cm3; connecting tube length corrected for thelength of connecting unions of the tube to the pressure sensor and to the pressure generator (i.e. the calculation length L increased by 18 mm for the largest diameter tube and by 12 mmfor the two smaller diameter tubes), material properties estimated for air as ideal gas at inletconditions (c = 345 m/s, = 1.8210-5 Ns/m2, = 1.16 kg/m3). The applied approximations
provide good description of the trends of variation of both the natural frequency and of thedamping ratio as a function of the length and the diameter of the connecting tube; in the caseof the natural frequency, even the absolute conformance is good. Larger estimated values of the damping ratio can be expected, as the equation (4) takes account of pressure losses in the
connecting tube only, while in reality, inlet and outlet losses etc. are also present (highcorrelation between the estimated values and measurement results can be achieved simply bycorrecting the estimates with a constant value).

8/2/2019 2007 Instrumentation Science and Technology Pressure Connecting Tube Response Time
http://slidepdf.com/reader/full/2007-instrumentation-science-and-technology-pressure-connecting-tube-response 6/9
This is a preprint of an article whose final and definitive form has been published in the Instrumentation Science and Technology 35 (2007) 399–409
doi: 10.1080/10739140701436579 © Taylor & Francis Group, LLC
6
0 100 200 300 400 500 600 700 800 9000
100
200
300
400
500
Eq. (3): d = 5,9 mm d = 4,0 mm d = 2,9 mm
Measurement: d = 5,9 mm d = 4,0 mm d = 2,9 mm
N a t u r a l f r e q u e n c y
f 0
i n H z
Tube length L in mm
Figure 4. Variation of the characteristic natural frequency as a function of the length of the connecting tube, for different internal diameters
0 100 200 300 400 500 600 700 800 9000.00
0.03
0.06
0.09
0.12
0.15
Eq. (4): d = 5,9 mm d = 4,0 mm d = 2,9 mm
Measurement: d = 5,9 mm d = 4,0 mm d = 2,9 mm
D a m p i n g f a c t o r
Tube length L in mm
Figure 5. Variation of the damping ratio as a function of the length of the connecting tube, for different internaldiameters
For practical application of the measurement system in the measurement of step variationsof pressure, the relevant dynamic characteristic is the oscillation settling time, i.e. the time inwhich the dynamic measurement error decreases to an acceptable level. Based on the stepresponse of a single degree of freedom dynamic system, the lower envelope of the oscillatingresponse (with the initial value equalling zero) is described by the following exponentialfunction:
* 1t
i p t p e
,0
1 12 f
, (8)

8/2/2019 2007 Instrumentation Science and Technology Pressure Connecting Tube Response Time
http://slidepdf.com/reader/full/2007-instrumentation-science-and-technology-pressure-connecting-tube-response 7/9
This is a preprint of an article whose final and definitive form has been published in the Instrumentation Science and Technology 35 (2007) 399–409
doi: 10.1080/10739140701436579 © Taylor & Francis Group, LLC
7
where is the time constant, inversely proportional to the product of the natural frequencyand the damping ratio. Taking, as an example, 1% of the total pressure step change p for theallowable amplitude of dynamic error, the above equation allows us to determine thecorresponding settling time, which is related to the time constant as follows:
1% ln 0,01t . (9)
Figure 6, which presents the settling time t 1% as a function of the connecting tube dimensions,demonstrates the importance of selecting the connecting tubes of the minimum possiblelength for optimal dynamic characteristics of the measurement system. The results indicatethe decreasing of the settling time with the decreasing tube internal diameter. The internaldiameter exhibits particular impacts with long tubes.
0 100 200 300 400 500 600 700 800 9000
20
40
60
80
100
120
140
d = 5,9 mm d = 4,0 mm d = 2,9 mm
S e t t l i n g t i m e t 1 %
i n m s
Tube length L in mm
Figure 6. Variation of the settling time t 1% as a function of the length of the connecting tube, for differentinternal diameters
So far, the analysis of the pressure measurement system with connecting tubes was limitedto underdamped cases with small damping ratios, ξ << 1. The conditions and thecorresponding conclusions though change when dealing with connecting tubes of larger lengths and/or smaller diameters. While the settling time is inversely proportional to the
damping ratio in underdamped systems with ξ << 1 (see Eqs. (8) and (9)), it starts to increasewith the damping ratio for ξ > 1. A step-response simulation of a single degree of freedomdynamic system (at a fixed natural frequency) demonstrates that the settling time reaches itsminimum at ξ 0.83. Figure 7 presents the simulation results for the settling time t 1% as afunction of the internal diameter of the connecting tube (tubes slenderer than in experimentsof this paper). The natural frequencies and damping ratios, applied as input data insimulations, were defined by Eqs. (3) and (4), with an additional correction of the dampingratio with a constant, ξ ξ + 0.06. Figure 7 clearly shows that the connecting tube has anoptimum range of internal diameters those results in the minimum settling time of the
pressure measurement system. The settling time increases rapidly for tube diameters below
the optimum range. On the other hand, increased diameters are not so critical for the systemdynamics. Irrespective of the case of small or large tube internal diameters, the minimum possible length of the connecting tube is optimal for the fastest response times.

8/2/2019 2007 Instrumentation Science and Technology Pressure Connecting Tube Response Time
http://slidepdf.com/reader/full/2007-instrumentation-science-and-technology-pressure-connecting-tube-response 8/9
This is a preprint of an article whose final and definitive form has been published in the Instrumentation Science and Technology 35 (2007) 399–409
doi: 10.1080/10739140701436579 © Taylor & Francis Group, LLC
8
0.5 1.0 1.5 2.0 2.5 3.00
50
100
150
200
250
300
L = 200 mm L = 500 mm L = 800 mm
S e t t l i n g t i m e t 1 %
i n m s
Tube internal diameter d in mm
Figure 7. Variation of the settling time t 1% as a function of the internal diameter of the connecting tube, for different tube lengths (simulation)
CONCLUSIONS
The analysis of the pressure measurement system applying the response to a step changeof the input pressure indicates the importance of appropriate selection of the dimensions of the connecting tubes for the optimal dynamic characteristics of the measurement system. Theexperiments were carried out with plastic connecting tubes of three different diameters and sixdifferent lengths. The results suggest that natural frequencies are highest with short largeinternal diameter tubes. The system damping increases with the increasing length and thedecreasing diameter. Close correlation of the trends of measured values with a relativelysimple fluid oscillator model confirms the physical description of the system. The observationof the time required for the response to settle within the specified range of the true pressurevalue indicates the best dynamic characteristics with short connecting tubes, with carefullychosen internal diameters. There is an optimum range of internal diameters for a particular tube length to achieve the fastest response times.
REFERENCES
[1] J. Hjelmgren, Dynamic measurement of pressure – A literature survey, SP Report2002:34, Swedish National Testing and Research Institute, 2002.
[2] S. A. Whitmore, Formulation of a general technique for predicting pneumaticattenuation errors in airborne pressure sensing devices, NASA TM 100430, 1988.
[3] S. A. Whitmore, W. T. Lindsey, R. E. Curry, G. B. Gilyard, Experimentalcharacterization of the effects of pneumatic tubing on unsteady pressure measurements,
NASA TM 4171, 1990.
[4] S. A. Whitmore, Pneumatic distorsion compensation for aircraft surface pressuresensing devices, Journal of Aircraft 28(12), 1991, pps. 828-836.

8/2/2019 2007 Instrumentation Science and Technology Pressure Connecting Tube Response Time
http://slidepdf.com/reader/full/2007-instrumentation-science-and-technology-pressure-connecting-tube-response 9/9
This is a preprint of an article whose final and definitive form has been published in the Instrumentation Science and Technology 35 (2007) 399–409
doi: 10.1080/10739140701436579 © Taylor & Francis Group, LLC
9
[5] O. K. Rediniotis, M. M. Pathak, A simple technique for frequency-response enhancmentof miniature pressure probes, AIAA Journal 37(7), 1999, pps. 897-899.
[6] A. Yoshida, Y. Tamura, T. Kurita, Effects of bends in a tubing system for pressuremeasurement, Journal of Wind Engineering and Industrial Aerodynamics 89, 2001, pps.1701-1716.
[7] T. Lokar, A. Smrečnik, I. Bajsić, Generating dynamic pressure with loudspeakers, 16thIMEKO World Congress (Vienna, 25-28. Sept. 2000), Austrian Society for Measurement and Automation, Vienna, 2000, pps. 109-113.
[8] T. Žagar, J. Kutin, I. Bajsić, The effect of connecting-tube dimensions on dynamiccharacteristics of pressure measurement systems, Ventil 11(3), 2005, pps. 161-165 (inSlovene).
[9] R. D. Blevins, Formulas for natural frequency and mode shape, Kreiger, Malabar, 1995.
[10] E. Naudascher, D. Rockwell, Flow-induced vibrations. An engineering guide, A.A.Balkema, Rotterdam, 1994.
[11] M. L. Chugani, A. R. Samant, M. Cerna, LabVIEW signal processing, Prentice-Hall, New York, 1998.
[12] T. D. Burton, Introduction to dynamic systems analysis, McGraw-Hill, New York,1994.