2007 FIELD T L FERTILIZER PROGRAMS AND C...
20
M.J. Schlossberg ' 2008 2007 FIELD TRIAL: LIQUID FERTILIZER PROGRAMS AND CREEPING BENTGRASS PENN A4 OR PENN G2 PUTTING GREEN QUALITY Prepared by: Max Schlossberg, Ph.D. ([email protected]) Asst. Prof. of Turfgrass Nutrition & Soil Fertility The Pennsylvania State University Center for Turfgrass Science. Objectives To compare commercial and basic liquid fertilizer programs in a frequent, spoon-feeding nitrogen fertilization putting green protocol using creeping bentgrass growth, shoot density, disease resistance, and canopy color parameters as measures of putting green quality. General Methods and Data Collection The 2007 fertility trial was conducted on Penn A4 (Exp. 1) and Penn G2 (Exp. 2) creeping bentgrass (Agrostis palustris) putting greens, established in 2005 to a push-up root zone maintained within the PSU Joseph Valentine Turfgrass Research Center, University Park, PA. Preliminary soil fertility levels were evaluated (Table 1) and optimized throughout the season (Fig. 1). Plots were mowed 6-7 times weekly at a height of ⅛ over the 18-week studies (June 1 to October 5, 2007). Clippings were not returned to the putting greens. Minimum and maximum air temperature, relative humidity, and daily rainfall were recorded on site (Fig. 2). Liquid fertilizers were applied at a standard rate of 0.1 lbs N/1000 ft 2 . These treatments were made in a 2 gal/1000 ft 2 spray volume using a CO 2 pressurized, single nozzle wand (Tee-Jet TP11008E, Spraying Systems Co., Wheaton, IL). The reapplication interval averaged 8 days, but ranged from 5 to 13 d (Fig. 1). Delivery rates of other nutrients varied by fertilizer program (Table 2) and experimental putting green (Fig. 1). A digital metronome was employed during spray applications to ensure precise nozzle travel rate across each 3 x 6 ft plot. Potable irrigation water was used to replace evapotranspiration losses over the duration of the study, but fertilizer treatments were not watered in. Total N fertilizer application amounted to 3.0 lbs N/1000 ft 2 in 2007, with 1.3 lbs N equally applied to all plots prior to initiation of the trial (Fig. 1). Table 1. Mean soil fertility level (n=3) measured in the 0-4 soil depth, by experimental putting green; May 20, 2007. CEC Phosphorus Potassium Calcium Magnesium Experiment and bentgrass variety Soil pHw meq / 100g lbs / acre lbs / acre (% saturation of CEC) Exp. 1 Penn A4 7.1 8.9 178 130 (1.9%) 2707 (76%) 452 (21%) Exp. 2 Penn G2 7.3 6.4 154 161 (3.2%) 1891 (74%) 337 (22%) Duplicate simultaneous measures of 660 and 850nm light reflectance from the canopy of each bentgrass putting green plot were recorded 26 days per week using an ambient light-excluding FieldScout TCM500 turfgrass chlorophyll meter (Spectrum Technologies Inc., Plainfield, IL). Reflectance data were used to calculate normalized differential vegetative indices (NDVI). A turfgrass color meter (FieldScout TCM-500-RGB) collected duplicate measures of percent green, red, and blue canopy reflectance; 26 days per week. Data were converted to hue, saturation, and brightness levels to determine dark green color index (DGCI; Karcher & Richardson, 2003).
Transcript of 2007 FIELD T L FERTILIZER PROGRAMS AND C...

M.J. Schlossberg © 2008
2007 FIELD TRIAL: LIQUID FERTILIZER PROGRAMS AND CREEPING BENTGRASS �PENN A4� OR �PENN G2� PUTTING GREEN QUALITY Prepared by: Max Schlossberg, Ph.D. ([email protected]) Asst. Prof. of Turfgrass Nutrition & Soil Fertility The Pennsylvania State University Center for Turfgrass Science.
Objectives To compare commercial and basic liquid fertilizer programs in a frequent, spoon-feeding nitrogen fertilization putting green protocol using creeping bentgrass growth, shoot density, disease resistance, and canopy color parameters as measures of putting green quality.
General Methods and Data Collection The 2007 fertility trial was conducted on Penn A4 (Exp. 1) and Penn G2 (Exp. 2) creeping bentgrass (Agrostis palustris) putting greens, established in 2005 to a �push-up� root zone maintained within the PSU Joseph Valentine Turfgrass Research Center, University Park, PA. Preliminary soil fertility levels were evaluated (Table 1) and optimized throughout the season (Fig. 1). Plots were mowed 6-7 times weekly at a height of ⅛� over the 18-week studies (June 1 to October 5, 2007). Clippings were not returned to the putting greens. Minimum and maximum air temperature, relative humidity, and daily rainfall were recorded on site (Fig. 2). Liquid fertilizers were applied at a standard rate of 0.1 lbs N/1000 ft2. These treatments were made in a 2 gal/1000 ft2 spray volume using a CO2�pressurized, single nozzle wand (Tee-Jet TP11008E, Spraying Systems Co., Wheaton, IL). The reapplication interval averaged 8 days, but ranged from 5 to 13 d (Fig. 1). Delivery rates of other nutrients varied by fertilizer program (Table 2) and experimental putting green (Fig. 1). A digital metronome was employed during spray applications to ensure precise nozzle travel rate across each 3 x 6 ft plot. Potable irrigation water was used to replace evapotranspiration losses over the duration of the study, but fertilizer treatments were not watered in. Total N fertilizer application amounted to 3.0 lbs N/1000 ft2 in 2007, with 1.3 lbs N equally applied to all plots prior to initiation of the trial (Fig. 1).
Table 1. Mean soil fertility level (n=3) measured in the 0-4� soil depth, by experimental putting green; May 20, 2007.
CEC Phosphorus Potassium Calcium MagnesiumExperiment and bentgrass variety
Soil pHw meq / 100g lbs / acre lbs / acre (% saturation of CEC)
Exp. 1 Penn A4 7.1 8.9 178 130 (1.9%) 2707 (76%) 452 (21%) Exp. 2 Penn G2 7.3 6.4 154 161 (3.2%) 1891 (74%) 337 (22%) Duplicate simultaneous measures of 660� and 850�nm light reflectance from the canopy of each bentgrass putting green plot were recorded 2�6 days per week using an ambient light-excluding FieldScout TCM�500 turfgrass chlorophyll meter (Spectrum Technologies Inc., Plainfield, IL). Reflectance data were used to calculate normalized differential vegetative indices (NDVI). A turfgrass color meter (FieldScout TCM-500-RGB) collected duplicate measures of percent green, red, and blue canopy reflectance; 2�6 days per week. Data were converted to hue, saturation, and brightness levels to determine dark green color index (DGCI; Karcher & Richardson, 2003).
2007 Creeping Bentgrass Putting Green Liquid Fertilizers Field Trial
Penn State Univ. Turfgrass Research Report–Max Schlossberg, Ph.D. ([email protected]) 2
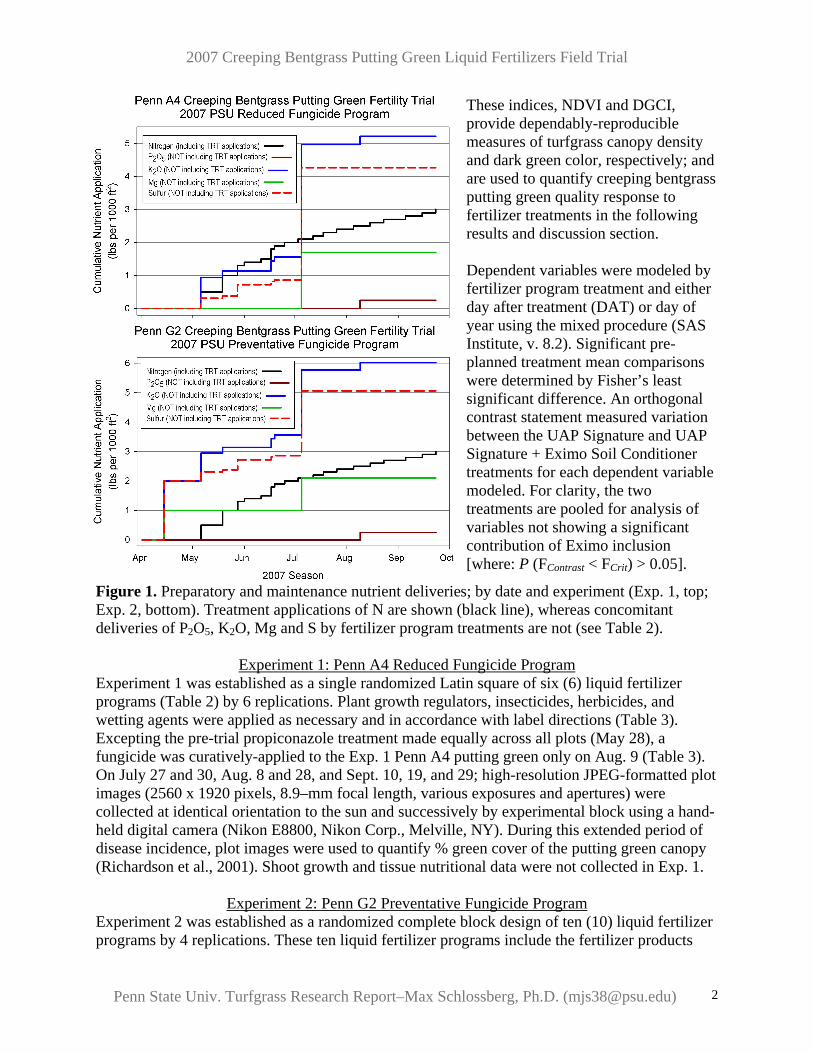
These indices, NDVI and DGCI, provide dependably-reproducible measures of turfgrass canopy density and dark green color, respectively; and are used to quantify creeping bentgrass putting green quality response to fertilizer treatments in the following results and discussion section. Dependent variables were modeled by fertilizer program treatment and either day after treatment (DAT) or day of year using the mixed procedure (SAS Institute, v. 8.2). Significant pre-planned treatment mean comparisons were determined by Fisher’s least significant difference. An orthogonal contrast statement measured variation between the UAP Signature and UAP Signature + Eximo Soil Conditioner treatments for each dependent variable modeled. For clarity, the two treatments are pooled for analysis of variables not showing a significant contribution of Eximo inclusion [where: P (FContrast < FCrit) > 0.05].
Figure 1. Preparatory and maintenance nutrient deliveries; by date and experiment (Exp. 1, top; Exp. 2, bottom). Treatment applications of N are shown (black line), whereas concomitant deliveries of P2O5, K2O, Mg and S by fertilizer program treatments are not (see Table 2).
Experiment 1: Penn A4 Reduced Fungicide Program Experiment 1 was established as a single randomized Latin square of six (6) liquid fertilizer programs (Table 2) by 6 replications. Plant growth regulators, insecticides, herbicides, and wetting agents were applied as necessary and in accordance with label directions (Table 3). Excepting the pre-trial propiconazole treatment made equally across all plots (May 28), a fungicide was curatively-applied to the Exp. 1 Penn A4 putting green only on Aug. 9 (Table 3). On July 27 and 30, Aug. 8 and 28, and Sept. 10, 19, and 29; high-resolution JPEG-formatted plot images (2560 x 1920 pixels, 8.9–mm focal length, various exposures and apertures) were collected at identical orientation to the sun and successively by experimental block using a hand-held digital camera (Nikon E8800, Nikon Corp., Melville, NY). During this extended period of disease incidence, plot images were used to quantify % green cover of the putting green canopy (Richardson et al., 2001). Shoot growth and tissue nutritional data were not collected in Exp. 1.
Experiment 2: Penn G2 Preventative Fungicide Program
Experiment 2 was established as a randomized complete block design of ten (10) liquid fertilizer programs by 4 replications. These ten liquid fertilizer programs include the fertilizer products

M.J
. Sch
loss
berg
, 200
7A
pplic
atio
n%
%%
%%
Den
sity
lbs
Nlb
s P
2O5
lbs
K2O
lbs
Felb
s M
nEm
eral
d Is
leoz
./100
0N
P 2O
5K 2
OFe
Mn
lbs/
gallo
npe
r 100
0pe
r 100
0pe
r 100
0pe
r 100
0pe
r 100
0
CP
R7.
04
01
20.
2510
.00
0.02
190.
000
0.00
50.
0109
0.00
1Tr
ueFo
liar
4.5
100
100.
952
10.6
80.
0375
0.00
00.
038
0.00
360.
008
True
Folia
r3.
03
010
00
9.75
0.00
690.
000
0.02
30.
0000
0.00
0Tr
ueFo
liar
3.0
80
40
011
.68
0.02
190.
000
0.01
10.
0000
0.00
0Tr
ueFo
liar
3.0
60
00
511
.18
0.01
570.
000
0.00
00.
0000
0.01
30.
1039
0.00
00.
077
0.01
450.
022
Per
k U
p *3.
00.
660.
020.
280.
051
<0.0
0111
.28
0.00
17<0
.001
0.00
10.
0001
<0.0
01C
arbo
n P
K (l
abel
)3.
00
2228
00
13.3
60.
0000
0.06
90.
088
0.00
000.
000
Ren
aiss
ance
*1.
00.
340
0.33
3.66
51.
072
9.60
0.00
030.
000
0.00
00.
0027
0.00
1P
rote
syn*
3.0
0.72
3.5
14.7
0.15
70.
003
9.60
0.00
160.
008
0.03
30.
0004
<0.0
01C
arbo
n N
(lab
el)
5.3
230
00
010
.20
0.09
710.
000
0.00
00.
0000
0.00
0* F
. Ros
si, P
h.D. (
GCM,
Sep
t. 200
6)0.
1008
0.07
70.
122
0.00
330.
001
Gar
y's
Gre
en4.
018
34
10.
110
.60
0.05
960.
010
0.01
30.
0033
<0.0
01U
ltrap
lex
3.0
50
32
0.4
10.7
70.
0126
0.00
00.
008
0.00
500.
001
SilC
alB
3.0
80
40
012
.43
0.02
330.
000
0.01
20.
0000
0.00
0P
K P
lus
3.0
321
180.
40.
111
.52
0.00
810.
057
0.04
90.
0011
<0.0
010.
1036
0.06
70.
081
0.00
940.
002
Siri
us5.
3017
011
00
12.6
00.
0887
0.00
00.
057
0.00
000.
000
SilS
tar
3.00
00
260
012
.60
0.00
000.
000
0.07
70.
0000
0.00
0Fe
atur
e P
rof.
0.29
45 lb
s0
00
42
na0.
0000
0.00
00.
000
0.01
180.
006
Alp
haN
ova
4.50
40
20
010
.30
0.01
450.
000
0.00
70.
0000
0.00
0R
egul
as4.
000
06
10
10.5
60.
0000
0.00
00.
020
0.00
330.
000
0.10
320.
000
0.16
10.
0151
0.00
6
Ure
a0.
2198
460
00
0na
0.10
110.
000
0.00
00.
0000
0.00
0Fe
Cl 2
+ 4H
2O0.
0589
00
028
0na
0.00
000.
000
0.00
00.
0165
0.00
00.
1011
0.00
00.
000
0.01
650.
000
† Th
e 6th
Exp.
1 tre
atmen
t app
lied w
as th
e UAP
Sign
ature
liquid
prog
ram
in co
mbina
tion w
ith 3
appli
catio
ns of
Exim
o Soil
Con
dition
er (6
/1, 7/
18, 8
/21).
Tabl
e 2. E
xper
imen
t 1 liq
uid
prog
ram
form
ulat
ions
, sho
wn fe
rtiliz
er g
rade
s rep
orte
d fro
m re
spec
tive l
abels
or r
efer
ence
pub
licat
ions
(whe
n av
ailab
le).
Flor
atin
eEm
erald
Isle
Sing
le Ap
p. To
tal
Grig
g B
ros.
Flora
tine P
rog.
Sing
le Ap
p. To
tal
UA
P Si
gnat
ure†
Ure
a +
Fe
Urea
+ Ir
on S
ingle
App.
Total
lbs/
1000
Grigg
Bro
s. Si
ngle
App.
Total
UAP
Sign
ature
Sing
le Ap
p. To
tal
mjs38
3
2007 Creeping Bentgrass Putting Green Liquid Fertilizer Field Trial
20074/14
5/65/195/28
6/16/116/136/17
6/256/28
7/37/5
7/117/127/187/197/26
8/38/58/9
8/138/21
9/39/5
9/139/21
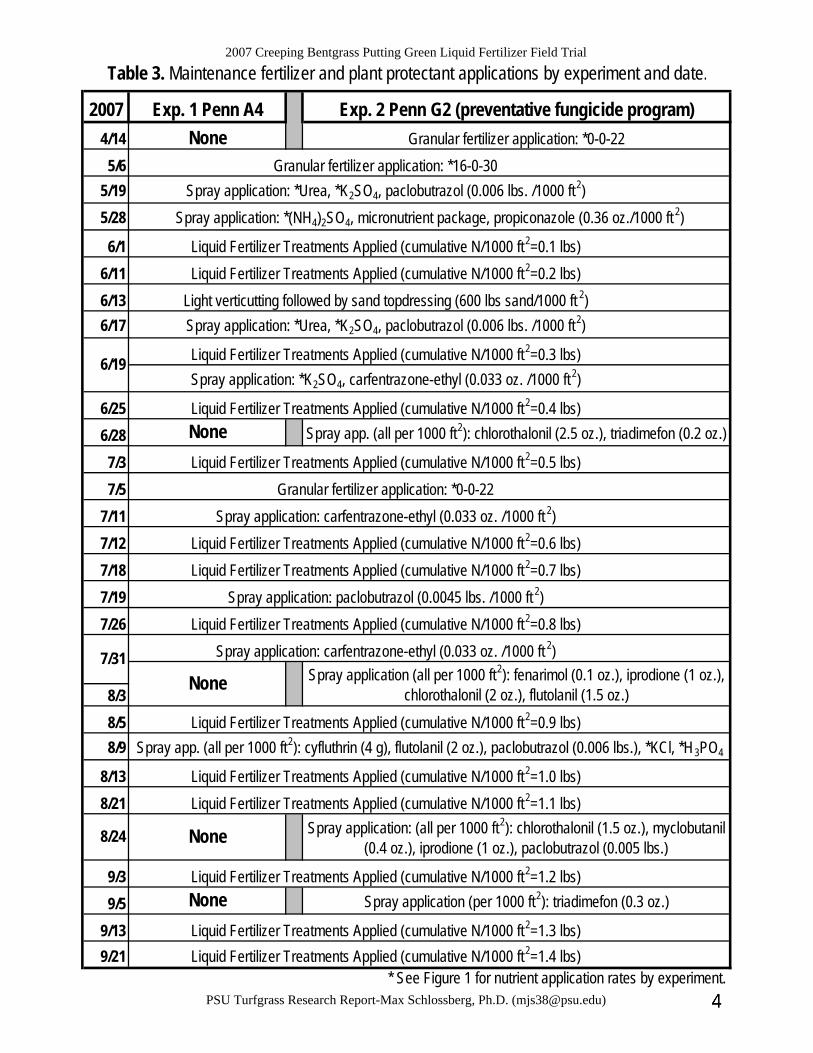
* See Figure 1 for nutrient application rates by experiment.
Liquid Fertilizer Treatments Applied (cumulative N/1000 ft2=1.2 lbs)
Liquid Fertilizer Treatments Applied (cumulative N/1000 ft2=1.3 lbs)
None
Liquid Fertilizer Treatments Applied (cumulative N/1000 ft2=1.4 lbs)
Spray application: (all per 1000 ft2): chlorothalonil (1.5 oz.), myclobutanil (0.4 oz.), iprodione (1 oz.), paclobutrazol (0.005 lbs.)
8/24
Spray application (per 1000 ft2): triadimefon (0.3 oz.)
Granular fertilizer application: *16-0-30Spray application: *Urea, *K2SO4, paclobutrazol (0.006 lbs. /1000 ft2)
Liquid Fertilizer Treatments Applied (cumulative N/1000 ft2=0.1 lbs)
Liquid Fertilizer Treatments Applied (cumulative N/1000 ft2=1.1 lbs)
None
Liquid Fertilizer Treatments Applied (cumulative N/1000 ft2=0.9 lbs)
Liquid Fertilizer Treatments Applied (cumulative N/1000 ft2=1.0 lbs)
Liquid Fertilizer Treatments Applied (cumulative N/1000 ft2=0.2 lbs)Light verticutting followed by sand topdressing (600 lbs sand/1000 ft 2)Spray application: *Urea, *K2SO4, paclobutrazol (0.006 lbs. /1000 ft2)
Liquid Fertilizer Treatments Applied (cumulative N/1000 ft2=0.3 lbs)
7/31
Liquid Fertilizer Treatments Applied (cumulative N/1000 ft2=0.7 lbs)Spray application: paclobutrazol (0.0045 lbs. /1000 ft 2)
Liquid Fertilizer Treatments Applied (cumulative N/1000 ft2=0.8 lbs)Spray application: carfentrazone-ethyl (0.033 oz. /1000 ft 2)
Spray application: *K2SO4, carfentrazone-ethyl (0.033 oz. /1000 ft 2)
Liquid Fertilizer Treatments Applied (cumulative N/1000 ft2=0.4 lbs)
Liquid Fertilizer Treatments Applied (cumulative N/1000 ft2=0.5 lbs)Granular fertilizer application: *0-0-22
Exp. 1 Penn A4 Exp. 2 Penn G2 (preventative fungicide program)None Granular fertilizer application: *0-0-22
Table 3. Maintenance fertilizer and plant protectant applications by experiment and date.
Spray app. (all per 1000 ft2): cyfluthrin (4 g), flutolanil (2 oz.), paclobutrazol (0.006 lbs.), *KCl, *H3PO4
Spray application (all per 1000 ft2): fenarimol (0.1 oz.), iprodione (1 oz.), chlorothalonil (2 oz.), flutolanil (1.5 oz.)
None Spray app. (all per 1000 ft2): chlorothalonil (2.5 oz.), triadimefon (0.2 oz.)
Liquid Fertilizer Treatments Applied (cumulative N/1000 ft2=0.6 lbs)Spray application: carfentrazone-ethyl (0.033 oz. /1000 ft 2)
6/19
Spray application: *(NH4)2SO4, micronutrient package, propiconazole (0.36 oz./1000 ft 2)
None
PSU Turfgrass Research Report-Max Schlossberg, Ph.D. ([email protected])
mjs38
4
2007 Creeping Bentgrass Putting Green Liquid Fertilizers Field Trial
Penn State Univ. Turfgrass Research Report–Max Schlossberg, Ph.D. ([email protected]) 5
shown in Table 4 (below) and the six (6) programs evaluated in Exp. 1 (Table 2). Plant protectants, growth regulators, herbicides, and wetting agents were applied as necessary and in accordance with label directions (Table 3). Shoot growth rate was calculated from clipping yields collected July 20, Aug. 10, Sept. 7, and Oct. 5, 2007. Shoot biomass was measured following a 48 hour period of forced-air drying @ 70 oC. Dry tissue was ground to pass a 40-mesh sieve, then split for medium temperature furnace combustion (Horneck & Miller, 1998) or microwave digestion and inductively coupled plasma (ICP) spectroscopic analysis of nutrient concentrations (Miller, 1998). Multiplication of clipping yield by associated nutrient concentration provided nitrogen or potassium offtake (in lbs N or K per 1000 ft2), permitting subsequent analysis of each as a dependent variable (Schlossberg & Schmidt, 2007).
Table 4. Yet unspecified Experiment 2 liquid fertilizer program formulations (from labels).
Weekly rate N P2O5 K2O Fe Mn Density N P2O5 K2O Fe Mn Fertilizer per 1000 ft2 % % % % % lbs. / gal. lbs. / 1000 ft2 Urea 0.217 lbs. 46 0 0 0 0 na 0.10 0 0 0 0 4-Iron 0.115 lbs. 10 0 0 4 2 na 0.01 0 0 0.005 0.002
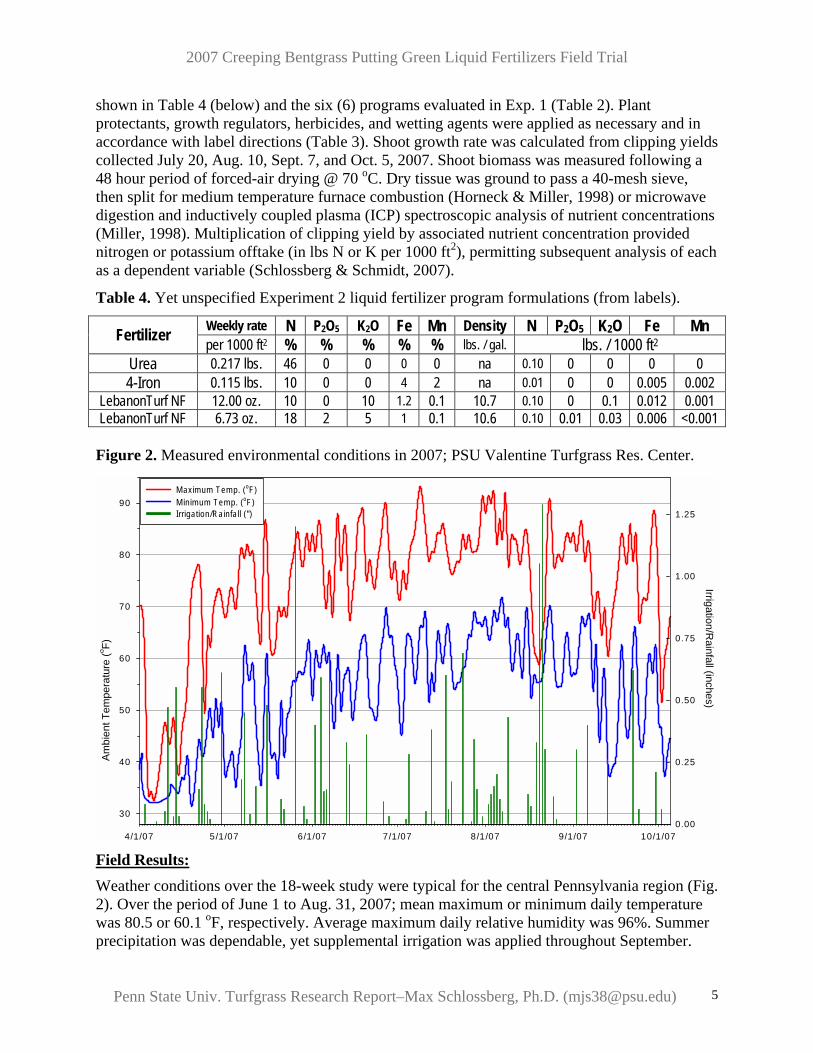
LebanonTurf NF 12.00 oz. 10 0 10 1.2 0.1 10.7 0.10 0 0.1 0.012 0.001 LebanonTurf NF 6.73 oz. 18 2 5 1 0.1 10.6 0.10 0.01 0.03 0.006 <0.001 Figure 2. Measured environmental conditions in 2007; PSU Valentine Turfgrass Res. Center.
Field Results:
Weather conditions over the 18-week study were typical for the central Pennsylvania region (Fig. 2). Over the period of June 1 to Aug. 31, 2007; mean maximum or minimum daily temperature was 80.5 or 60.1 oF, respectively. Average maximum daily relative humidity was 96%. Summer precipitation was dependable, yet supplemental irrigation was applied throughout September.
4/1/07 5/1/07 6/1/07 7/1/07 8/1/07 9/1/07 10/1/07
Am
bien
t Tem
pera
ture
(o F) o
r Rel
. Hum
idity
(%)
30
40
50
60
70
80
90
Irrigation/Rainfall (inches)
0 .00
0.25
0.50
0.75
1.00
1.25
Maximum Temp. (oF)M inimum Temp. (oF)Irrigation/Rainfall (")

2007 Creeping Bentgrass Putting Green Liquid Fertilizers Field Trial
Penn State Univ. Turfgrass Research Report–Max Schlossberg, Ph.D. ([email protected]) 6
Experiment 1: Penn A4 Reduced Fungicide Program
No disease activity was observed in the reduced fungicide trial through the 3rd week of July. As temperatures increased over the first 7 weeks, consistently increasing canopy density (NDVI) and color (DGCI) values were measured. However, few differences in putting green NDVI or DGCI were detected between the liquid programs during this initial experimental period (Fig. 3). Just as the density of the bentgrass green canopies reached their maximum values observed over the experimental period to date, pathogenic fungi became active. Signs of brown patch fungus (Rhizoctonia solani) were first observed July 27 as rainfall accumulated to 1.2” over the 5-d period ending July 29 (Fig. 2). Warm temperatures broke temporarily from July 28 through the 30th, but temperatures >90 oF returned on July 31st and
Penn A4 Creeping Bentgrass Putting Green Fertility TrialNormalized Differential Vegetative & Dark Green Color Indices (NDVI & DGCI)
2007 PSU Reduced Fungicide Program; Mean Values Weeks 1 thru 7 (7/22)
Emerald Isle Floratine Grigg Bros. UAP Signature Urea + Fe
Inde
xVa
lue
0.380
0.385
0.390
0.395
0.400
0.795
0.800
0.805
0.810
DGCINDVI
Figure 3. Penn A4 NDVI and DGCI data weeks 1 through 7. Fertilizer treatment mean values having overlapping error bars are not significantly different (α = 0.05).
2007 Creeping Bentgrass Putting Green Liquid Fertilizers Field Trial
Penn State Univ. Turfgrass Research Report–Max Schlossberg, Ph.D. ([email protected]) 7
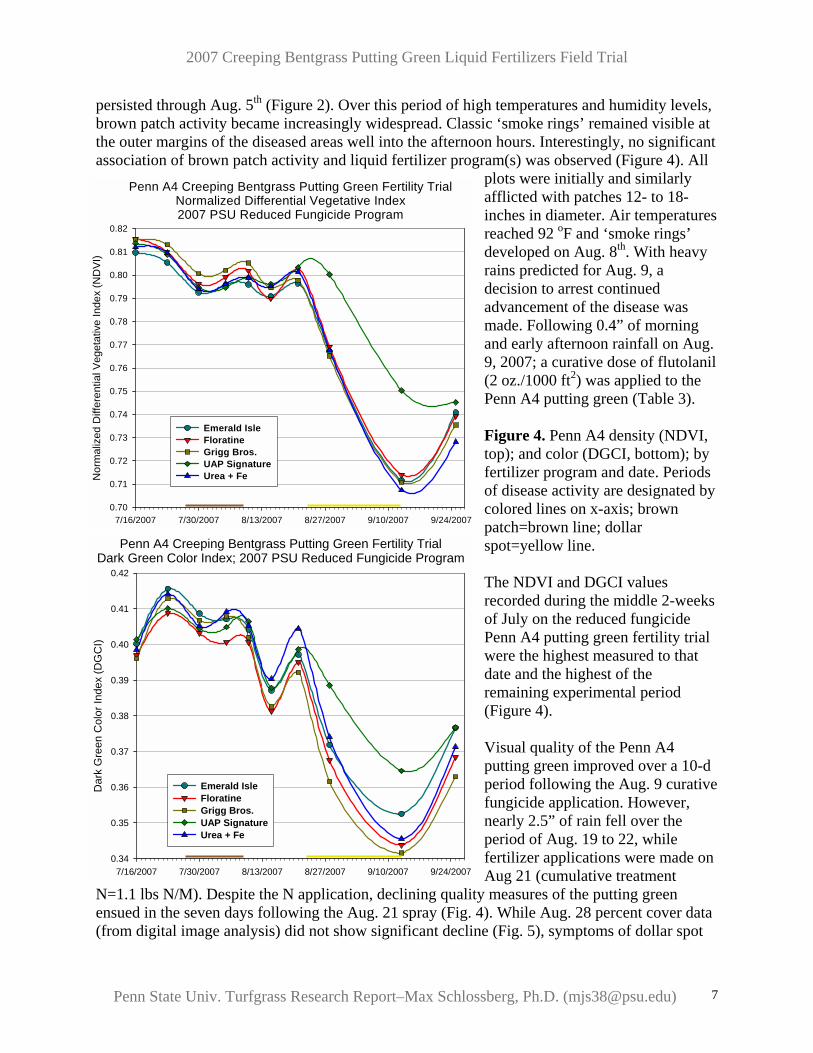
persisted through Aug. 5th (Figure 2). Over this period of high temperatures and humidity levels, brown patch activity became increasingly widespread. Classic ‘smoke rings’ remained visible at the outer margins of the diseased areas well into the afternoon hours. Interestingly, no significant association of brown patch activity and liquid fertilizer program(s) was observed (Figure 4). All
plots were initially and similarly afflicted with patches 12- to 18-inches in diameter. Air temperatures reached 92 oF and ‘smoke rings’ developed on Aug. 8th. With heavy rains predicted for Aug. 9, a decision to arrest continued advancement of the disease was made. Following 0.4” of morning and early afternoon rainfall on Aug. 9, 2007; a curative dose of flutolanil (2 oz./1000 ft2) was applied to the Penn A4 putting green (Table 3). Figure 4. Penn A4 density (NDVI, top); and color (DGCI, bottom); by fertilizer program and date. Periods of disease activity are designated by colored lines on x-axis; brown patch=brown line; dollar spot=yellow line. The NDVI and DGCI values recorded during the middle 2-weeks of July on the reduced fungicide Penn A4 putting green fertility trial were the highest measured to that date and the highest of the remaining experimental period (Figure 4). Visual quality of the Penn A4 putting green improved over a 10-d period following the Aug. 9 curative fungicide application. However, nearly 2.5” of rain fell over the period of Aug. 19 to 22, while fertilizer applications were made on Aug 21 (cumulative treatment
N=1.1 lbs N/M). Despite the N application, declining quality measures of the putting green ensued in the seven days following the Aug. 21 spray (Fig. 4). While Aug. 28 percent cover data (from digital image analysis) did not show significant decline (Fig. 5), symptoms of dollar spot
Penn A4 Creeping Bentgrass Putting Green Fertility TrialNormalized Differential Vegetative Index2007 PSU Reduced Fungicide Program
7/16/2007 7/30/2007 8/13/2007 8/27/2007 9/10/2007 9/24/2007
Nor
mal
ized
Diff
eren
tial V
eget
ativ
e In
dex
(ND
VI)
0.70
0.71
0.72
0.73
0.74
0.75
0.76
0.77
0.78
0.79
0.80
0.81
0.82
Emerald IsleFloratineGrigg Bros.UAP SignatureUrea + Fe
Penn A4 Creeping Bentgrass Putting Green Fertility TrialDark Green Color Index; 2007 PSU Reduced Fungicide Program
7/16/2007 7/30/2007 8/13/2007 8/27/2007 9/10/2007 9/24/2007
Dar
k G
reen
Col
or In
dex
(DG
CI)
0.34
0.35
0.36
0.37
0.38
0.39
0.40
0.41
0.42
Emerald IsleFloratineGrigg Bros.UAP SignatureUrea + Fe
2007 Creeping Bentgrass Putting Green Liquid Fertilizers Field Trial
Penn State Univ. Turfgrass Research Report–Max Schlossberg, Ph.D. ([email protected]) 8
Penn A4 Creeping Bentgrass Putting Green Fertility TrialPercent Green Canopy Cover; Disease Pressure Period
2007 PSU Reduced Fungicide Program
2007 Season7/29/07 8/5/07 8/12/07 8/19/07 8/26/07 9/2/07 9/9/07 9/16/07 9/23/07 9/30/07
Per
cent
Gre
en C
anop
y C
over
(%)
95
96
97
98
99
100Emerald IsleFloratineGrigg Bros.UAP SignatureUrea + Fe
Mean Green Canopy Cover %; July 27-Sept. 292007 PSU Reduced Fungicide Program
Emerald Isle Floratine Grigg Bros. UAP Signature Urea + Fe
Perc
ent G
reen
Can
opy
Cov
er (%
)
97.5
98.0
98.5
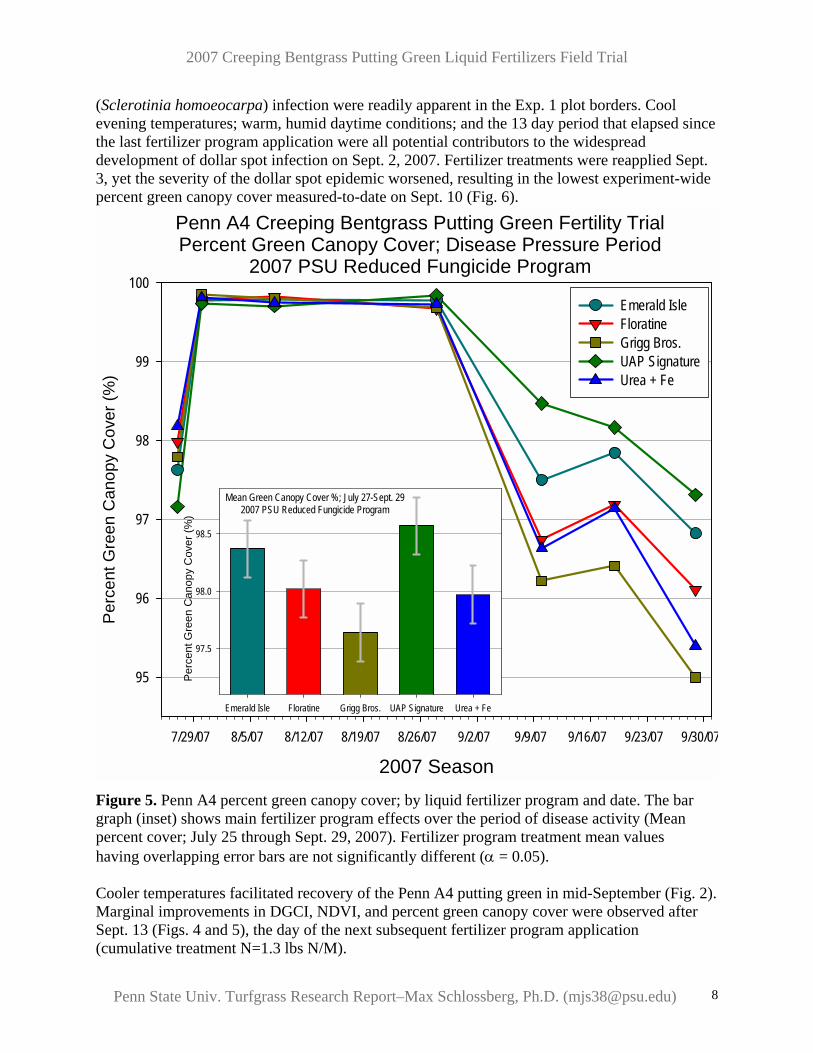
(Sclerotinia homoeocarpa) infection were readily apparent in the Exp. 1 plot borders. Cool evening temperatures; warm, humid daytime conditions; and the 13 day period that elapsed since the last fertilizer program application were all potential contributors to the widespread development of dollar spot infection on Sept. 2, 2007. Fertilizer treatments were reapplied Sept. 3, yet the severity of the dollar spot epidemic worsened, resulting in the lowest experiment-wide percent green canopy cover measured-to-date on Sept. 10 (Fig. 6).
Figure 5. Penn A4 percent green canopy cover; by liquid fertilizer program and date. The bar graph (inset) shows main fertilizer program effects over the period of disease activity (Mean percent cover; July 25 through Sept. 29, 2007). Fertilizer program treatment mean values having overlapping error bars are not significantly different (α = 0.05). Cooler temperatures facilitated recovery of the Penn A4 putting green in mid-September (Fig. 2). Marginal improvements in DGCI, NDVI, and percent green canopy cover were observed after Sept. 13 (Figs. 4 and 5), the day of the next subsequent fertilizer program application (cumulative treatment N=1.3 lbs N/M).

2007 Creeping Bentgrass Putting Green Liquid Fertilizers Field Trial
Penn State Univ. Turfgrass Research Report–Max Schlossberg, Ph.D. ([email protected]) 9
Figure 6. Digital images of originally-randomized Penn A4 creeping bentgrass putting green plots (n=36), collected Sept. 10, 2007. Alphabetically-arranged liquid fertilizer program treatments (left to right) shown above with percent green cover means (Sept. 10 ONLY). Fertilizer mean values sharing a similar letter are not significantly different (α = 0.05).
Penn A4 putting green canopy density and color varied by fertilizer treatment in August and September (Figs. 4 and 5).While earlier brown patch infection showed no correlation to fertilizer treatments, severity of dollar spot occurrences were significantly influenced by the liquid fertilizer program treatments (Fig. 6). Dollar spot, a primary limitation of creeping bentgrass putting green quality (Walsh et al., 1999), is effectively managed through integration of culture and chemical control. Nitrogen sufficiency of turfgrass limits dollar spot susceptibility simply by fostering natural shoot/leaf elongation (Couch, 1973). In times of reduced pathogenicity, sustained vegetative growth facilitates ‘mowing-off’ of necrotic tissue and latent mycelium. From July 27 to Aug. 29, the liquid fertilizer programs residing in the highest statistical grouping of percent green cover were Emerald Isle and both UAP Signature programs (Fig. 5). Similar observations were collected Sept. 10, when overall percent green cover of the Penn A4 plots was at the experiment-wide low (Fig. 6). Upon evaluating the feasibility of no-fungicide management programs in New York, Grant and Rossi (2004) identified dollar spot as a highly-dependable saboteur of putting green quality over the mid- to late-summer period. Dollar spot control is likely the most common objective of fungicide applications to golf course putting greens in the US. As the potential for dollar spot to reduce putting green quality both exists and reportedly correlates to creeping bentgrass fertility/nutritional status; generation of data showing frequent applications of N-standardized liquid fertilizer programs to significantly affect Penn A4 disease susceptibility is relatively exciting. However, lack of supporting Exp. 1 tissue nutrient concentration data precludes meaningful correlation of nutritional parameters to these observed

2007 Creeping Bentgrass Putting Green Liquid Fertilizers Field Trial
Penn State Univ. Turfgrass Research Report–Max Schlossberg, Ph.D. ([email protected]) 10
Penn A4 Creeping Bentgrass Putting Green Fertility TrialExperiment-wide Dark Green Color Index Means
2007 PSU Reduced Fungicide Program
Emerald Isle Floratine Grigg Bros. UAP Signature Urea+Fe
Dar
k G
reen
Col
or In
dex
(DG
CI)
0.380
0.385
0.390
0.395
responses. Interestingly, 4 of the 6 liquid fertilizer programs (Emerald Isle, Floratine, and the UAP Signatures) contained naturally-occurring organic N compounds (e.g. active culture, kelp extracts, and/or amino acids). Yet in a long and increasingly-predictable tradition of turfgrass nutritional research, wide variations in disease susceptibility across the four ‘natural-organic-fortified’ liquid programs has again thwarted definitive linkage of natural organic fertilizer use and turfgrass disease suppression.
Figure 7. (above) Experiment 1 mean canopy DGCI by Fertilizer program. Mean values having overlapping error bars are not significantly different (α=0.05). Figure 8. (right) Experiment 1 predicted mean canopy DGCI by days after treatment (DAT) and fertilizer program. Arrows indicate DAT of maximum DGCI. Penn A4 bentgrass DGCI values averaged across 39 collection dates (Fig. 7) summarize the experiment-wide canopy color differences by liquid fertilizer. Polynomial regression estimates of the intra-application daily dark green color indices by day after treatment (DAT) were derived from 6 replicate plots over 39 observation dates, and show specific time-response of each fertilizer program (Fig. 8). As one might expect, the fertilizer programs showing the darkest green canopy color immediately following treatment in the image taken July 3 (p. 6), also show the greatest DGCI values 1-2 DAT in Fig. 8. The derivative of each prediction equation was used to identify the precise DAT of maximum DGCI observation (arrows; Fig. 8). Predicted DGCI values and the difference between the predicted maxima and minima values are shown for each liquid fertilizer program (Table 5).

2007 Creeping Bentgrass Putting Green Liquid Fertilizers Field Trial
Penn State Univ. Turfgrass Research Report–Max Schlossberg, Ph.D. ([email protected]) 11
Table 5. Polynomial regression estimates of Penn A4 creeping bentgrass putting green canopy dark green color index (DGCI) by fertilizer program and 1 to 8 days after treatment (DAT).
Dark Green Color Indices (DGCI)
Emerald Isle
Floratine
Grigg Bros.
UAP Signature (avg. both TRTs)
Urea + Fe
Predicted minimum 0.3789 0.3741 0.3755 0.3842 0.3779 Predicted maximum 0.3989 0.3911 0.3911 0.3958 0.3991 Difference (max.–min.) 0.2000 0.0170 0.0156 0.0116 0.0212
While the magnitude of bentgrass DGCI values indicate darker green canopy color, golf course superintendents are wise to base their own canopy color preference on conditions and experience. Yet most superintendents will agree on the importance of consistent canopy color throughout the fertilizer reapplication interval. At a given monthly N rate, Bowman (2003) showed frequent N delivery to turfgrass fostered greater leaf tissue chlorophyll concentrations than infrequently fertilized turfgrass. Likewise, steady N-supply recipients demonstrated more consistent shoot growth and greater root-to-shoot ratios than less frequently fertilized turves. While whole plant response was not measured in our field studies, intensity and duration of canopy color response varied by fertilizer program over the average 8-day interval spanning liquid fertilizer program reapplications (Table 5).
Experiment 2: Penn G2 Preventative Fungicide Program
No signs or symptoms of disease were observed over the course of this 18-week Penn G2 preventative fungicide program trial. Consistently increasing canopy density (NDVI) and color (DGCI) values were measured over the first 6 weeks, followed by a leveling-off through August and September. Compared with Exp. 1, less week-to-week variability in canopy density and color was observed in this trial. While differences between the two experiments were observed, similarities also emerged. Canopies of both varieties showed a notable darkening in green color

2007 Creeping Bentgrass Putting Green Liquid Fertilizers Field Trial
Penn State Univ. Turfgrass Research Report–Max Schlossberg, Ph.D. ([email protected]) 12
Penn G2 Bentgrass Putting Green Fertility Trial2007 PSU Preventative Fungicide Program: Experiment-wide Clipping Yield Means
Clipp
ing yi
eld (lb
s dry
clipp
ings /
1000
ft2 )
0.50
0.55
0.60
0.65
2007 PSU Preventative Fungicide ProgramExperiment-wide Normalized Diff. Vegetative Index (NDVI) Means
Emerald IsleFloratine
Grigg Bros.
UAP SignatureUrea+Fe Urea 4-Iron
LebSea10LebSea18
Norm
alize
d Diff.
Veg
etativ
e Ind
ex (N
DVI)
0.76
0.77
0.78
as few as 20 minutes after application of certain fertilizer programs. Other programs showed more a subtle early-greening response that often intensified later and lasted longer. Clipping yield was measured once each month of the Penn G2 fertility trial. Clipping yield was statistically influenced by liquid fertilizer program but not by fertilizer interactions with day of year or days after treatment (DAT). Essentially, the observed growth response to any fertilizer program was consistent over the months of July, August, Sept. and October. While absolute values of all shoot biomass production varied over these months, relative differences between fertilizer programs did not. From this it can be inferred that despite the uniquity of each liquid fertilizers program’s components, nutrient delivery associated with each fertilizer treatment more significantly governed shoot growth than environmental conditions and/or time elapsed from last treatment. This result supports the effectiveness of frequent fertilizer applications in maintaining consistent performance of intensively managed creeping bentgrass putting greens.
Figure 9. (a; top) Experiment-wide mean Penn G2 shoot growth rate (clipping yield) and (b; bottom) normalized differential vegetative index (NDVI); by fertilizer program. Treatment means having overlapping error bars are not significantly different (α = 0.05).

2007 Creeping Bentgrass Putting Green Liquid Fertilizers Field Trial
Penn State Univ. Turfgrass Research Report–Max Schlossberg, Ph.D. ([email protected]) 13
All fertilizer programs (excepting 4-Iron) supplied 0.1011 to 0.1039 lbs N / 1000 ft2, per application. Yet across the seven fertilizer programs, variation in Penn G2 shoot growth exceeded the slight disparity in N delivery rates (±1.4%) in either direction from the mean (Fig. 9a). The experiment-wide clipping yield grand mean (all fertilizer programs) was 0.637 lbs per 1000 ft2, nearly the exact mean growth observed of the Urea + Fe treatment. Floratine and Grigg Bros. treatments fostered significantly more daily growth than all others, and no significant differences were observed between the remaining (0.1 lbs N) treatment programs (Fig. 9a). The normalized differential vegetative index (NDVI) is an indirect measure of vegetative biomass residing between the ground and a multi-spectral radiometer. Contrary to popular opinion, NDVI is not the same as canopy color or DGCI. A remotely significant correlation of the two measures was observed in 1,866 pairs of Penn G2 putting green NDVI and DGCI data collected in 2007 (r = 0.248). These data reveal a much stronger correlation between putting green canopy NDVI measures and clipping yield than DGCI (Figs. 9a & b). Moreover, similarly ostensible associations of canopy NDVI and clipping yield have emerged from additional, independent field studies of creeping bentgrass putting greens conducted in 2006 and 2007. For most turfgrass field researchers, the potential substitution of field clipping yield collections by this rapid and repeatable application could be the most exciting development since personal computers. Apart from these ridiculously mundane things we researchers get excited about, the NDVI measurement is much more sensitive to biomass accumulation in putting green canopies than the human eye. In theory, a maximum lateral shoot density, or carrying capacity, exists for each and every intensively-managed turfgrass cultivar. It is the professional opinion of the principle investigator that this upper-threshold of Penn G2 lateral density was reached by the first clipping yield (7/20). Thus, the remaining source of NDVI variation among the fertilizer programs was vertical extention of vegetation occuring between the last mowing event and NDVI measurement (Fig. 9). Experiment-wide Penn G2 DGCI values pooled across 47 collection dates (Fig. 10) summarize canopy color differences by fertilizer program. As in Exp. 1, mean DGCI of common fertilizer
Penn G2 Creeping Bentgrass Putting Green Fertility Trial2007 PSU Preventative Fungicide Program: Experiment-wide Dark Green Color Index Means
Emerald IsleFloratine
Grigg Bros.
UAP SignatureUrea+Fe Urea 4-Iron
LebSea10LebSea18
Dar
k G
reen
Col
or In
dex
(DG
CI)
0.378
0.381
0.384
0.387
0.390
0.393
0.396
Figure 10. Exp. 2 mean canopy DGCI by fertilizer program. Program treatment means showing overlapping error bars are not significantly different (α = 0.05).

2007 Creeping Bentgrass Putting Green Liquid Fertilizers Field Trial
Penn State Univ. Turfgrass Research Report–Max Schlossberg, Ph.D. ([email protected]) 14
programs (sans both LebanonTurf products, urea, and 4-iron) ranged from 0.385 to 0.395. Experiment-wide Penn G2 DGCI values of most commercial fertilizer programs fell in the second statistical grouping, having significantly less dark green color than the urea + Fe treatment (Fig. 10). As mentioned, many superintendents prioritize consistent canopy color over a rapid, intense, dark greening of canopy color that is not retained more than 3-4 days. As in Exp. 1, polynomial regression estimates of the intra-application daily dark green color indices were developed by day after treatment (DAT). More Penn G2 data was available in this experimental model than in Exp. 1; four replicate plots over 47 dates of observation. Regression derivatives identified the specific DAT of maximum DGCI observation (arrows; Fig. 11). While, the disparity in canopy DGCI between fertilizer programs over an average 8-day fertilizer reapplication interval was more pronounced in Exp.1 (Penn A4), differences in canopy color consistency were observed in Exp. 2 (Fig. 11). For each fertilizer program, the range of predicted DGCI values and the difference between the maximum and minimum predicted values are shown (Table 6). Penn G2 bentgrass tissue collected in clipping yield measurements was analyzed for nutritional content. As with NDVI, DGCI, and shoot growth data; the frequently-applied liquid fertilizer programs significantly affected tissue nutrient concentrations of Penn G2. However, no significant interactions between Table 6. (right) Polynomial regression estimates of Penn G2 creeping bentgrass putting green canopy dark green color index (DGCI) by fertilizer program and 1 to 8 days after treatment (DAT).
Fertilizer Program
Maximum DGCI
DAT Max. DGCI
Minimum DGCI
DGCI Diff. Max–Min
Emerald Isle 0.4014 3.2 0.3894 0.01196 Floratine 0.3950 3.1 0.3829 0.01210 Grigg Bros. 0.3982 3.5 0.3877 0.01050 UAP Signature 0.3981 4.1 0.3916 0.00651 Urea + Fe 0.4051 2.7 0.3960 0.00906 Urea 0.3911 3.8 0.3820 0.00906 4-Iron 0.3876 1.9 0.3762 0.01143 LebSea-10 0.4006 3.5 0.3900 0.01065 LebSea-18 0.3955 3.6 0.3848 0.01073
Figure 11. Experiment 2 predicted mean canopy DGCI by days after treatment (DAT) and fertilizer program. Arrows indicate DAT of maximum DGCI.
Penn G2 Creeping Bentgrass Putting Green Fertility Trial2007 PSU Preventative Fungicide Program: Dark Green Color Index by DAT
Days After Treatment (DAT)1 2 3 4 5 6 7 8
Dar
k G
reen
Col
or In
dex
(DG
CI)
0.375
0.380
0.385
0.390
0.395
0.400
0.405
Emerald IsleFloratineGrigg Bros.UAP SignatureUrea + FeUrea4-IronLebSea10LebSea18
2007 Creeping Bentgrass Putting Green Liquid Fertilizers Field Trial
Penn State Univ. Turfgrass Research Report–Max Schlossberg, Ph.D. ([email protected]) 15
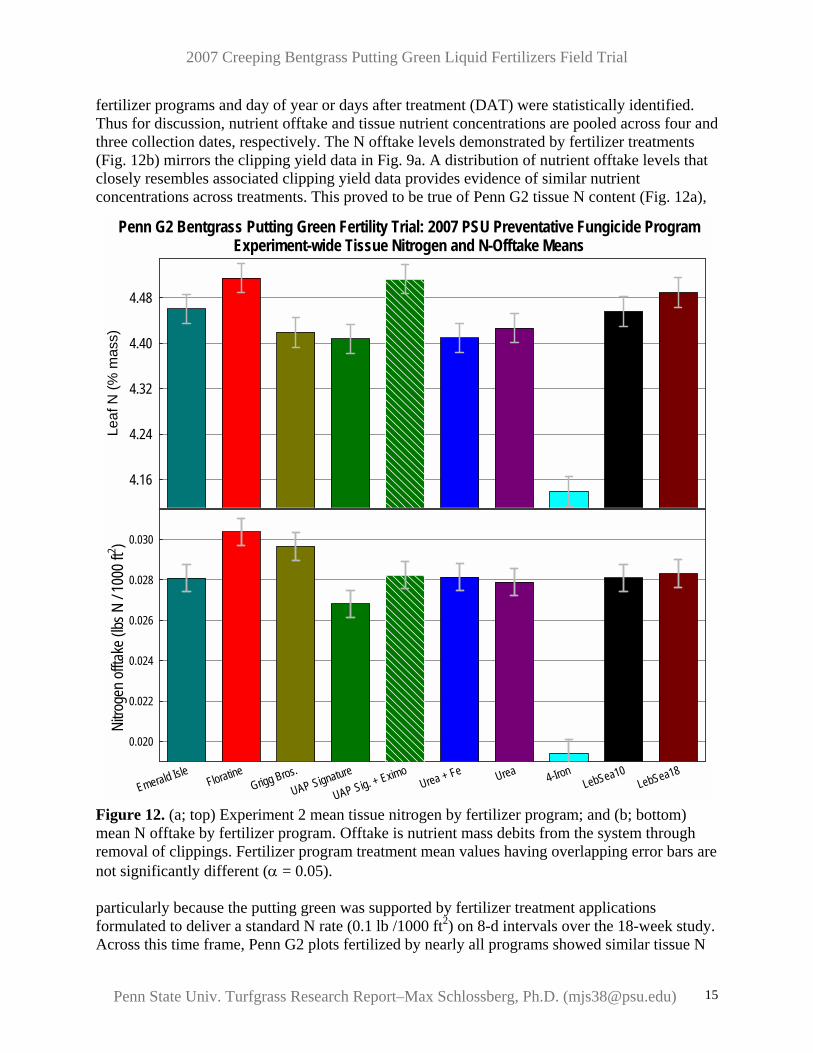
fertilizer programs and day of year or days after treatment (DAT) were statistically identified. Thus for discussion, nutrient offtake and tissue nutrient concentrations are pooled across four and three collection dates, respectively. The N offtake levels demonstrated by fertilizer treatments (Fig. 12b) mirrors the clipping yield data in Fig. 9a. A distribution of nutrient offtake levels that closely resembles associated clipping yield data provides evidence of similar nutrient concentrations across treatments. This proved to be true of Penn G2 tissue N content (Fig. 12a),
Figure 12. (a; top) Experiment 2 mean tissue nitrogen by fertilizer program; and (b; bottom) mean N offtake by fertilizer program. Offtake is nutrient mass debits from the system through removal of clippings. Fertilizer program treatment mean values having overlapping error bars are not significantly different (α = 0.05). particularly because the putting green was supported by fertilizer treatment applications formulated to deliver a standard N rate (0.1 lb /1000 ft2) on 8-d intervals over the 18-week study. Across this time frame, Penn G2 plots fertilized by nearly all programs showed similar tissue N
Penn G2 Bentgrass Putting Green Fertility Trial: 2007 PSU Preventative Fungicide ProgramExperiment-wide Tissue Nitrogen and N-Offtake Means
Leaf
N (%
mas
s)
4.16
4.24
4.32
4.40
4.48
Emerald IsleFloratine
Grigg Bros.
UAP Signature
UAP Sig. + EximoUrea + Fe Urea 4-Iron
LebSea10LebSea18
Nitro
gen o
fftake
(lbs N
/ 100
0 ft2 )
0.020
0.022
0.024
0.026
0.028
0.030

2007 Creeping Bentgrass Putting Green Liquid Fertilizers Field Trial
Penn State Univ. Turfgrass Research Report–Max Schlossberg, Ph.D. ([email protected]) 16
Penn G2 Bentgrass Putting Green Fertility Trial: 2007 PSU Preventative Fungicide ProgramExperiment-wide Tissue Potassium and K-Offtake Means
Leaf
K (%
mas
s)
2.16
2.19
2.22
2.25
2.28
Emerald IsleFloratine
Grigg Bros.
UAP SignatureUrea + Fe Urea 4-Iron
LebSea10LebSea18
Potas
sium
offtak
e (lbs
K / 1
000 f
t2 )
0.010
0.011
0.012
0.013
0.014
0.015
levels in clippings, but significantly less tissue N than Floratine and the UAP Signature + Eximo treatment programs (LebanonTurf 18-2-5 also resided in the highest statistical grouping; Fig. 12a). Across all programs, the greatest tissue N levels (4.81–4.91 %) were detected 8/10. This was likely due to sustained high soil temperatures favoring mineralization of the soil organic matter present. In early October the lowest tissue N levels were registered (4.00–4.12 %) and no significant differences by fertilizer programs were observed. This was likely due to the 14-d period between spray and yield collection and the occurrence of the coolest temperatures recorded in the study. It is important to note that the four clipping yields were measured 2 days after treatment (DAT; 7/20), 4 DAT (9/7), 5 DAT (8/10), and 14 DAT (10/5), and that clipping yield collections (with tissue nutrient analyses) quickly followed fertilizer spray applications. As stimulation of bentgrass shoot growth increases with delivery of plant available N, large N offtake levels in this early interval are less than desireable (Fig. 12). Figure 13. (a; top) Exp. 2 mean tissue potassium by fertilizer program; and (b; bottom) mean K offtake by fertilizer program. Fertilizer program treatment mean values having overlapping error bars are not significantly different (α = 0.05). As potassium (K) serves as a critical osmoregulant of leaf and shoot tissue, the improtance of K sufficiency in intensively managed turfgrasses really cannot be over-emphasized. The general K sufficiency threshold of creeping bentgrass is 2.2 %. Many historic references list the bentgrass tissue K sufficiency level as 2.8-3.0 %, yet more recent research proves this threshold is nearly
2007 Creeping Bentgrass Putting Green Liquid Fertilizers Field Trial
Penn State Univ. Turfgrass Research Report–Max Schlossberg, Ph.D. ([email protected]) 17
Emerald IsleFloratine
Grigg Bros.
UAP SignatureUrea + Fe Urea 4-Iron
LebSea10LebSea18
Leaf
Mn
(par
ts p
er m
illio
n)
44
48
52
56
60
64
68
135
138
141
Emerald IsleFloratine
Grigg Bros.
UAP SignatureUrea + Fe Urea 4-Iron
LebSea10LebSea18
Leaf
Fe
(par
ts p
er m
illion
)
250
300
350
400
450
Leaf
Ca
(% m
ass)
0.46
0.47
0.48
0.49
0.50
0.51
0.52
0.53
0.54
Leaf
Mg
(% m
ass)
0.29
0.30
0.31
Leaf
S (%
mas
s)
0.58
0.59
0.60
0.61
0.62
Penn G2 Bentgrass Putting Green Fertility Trial2007 PSU Preventative Fungicide Program: July, August, and September (Pooled) Tissue Concentrations
Leaf
P (%
mas
s)
0.61
0.62
0.63
0.64
0.65
0.66
0.67
impossible to attain and more accurate of other cool season turfgrass species. For example, mean leaf K levels in the UAP Signature, Floratine, LebanonTurf 10-0-10, Grigg Bros., and Emerald Isle; rank by K2O delivery rates associated with their formulations (Tables 2 and 3). In the case of both UAP Signature and Floratine, K2O delivery rates exceeded those of N; yet tissue N exceeded tissue K by nearly 2X. Were creeping bentgrass capable of assimilating K to tissue levels near 3.0%, greater K levels in Exp. 2 Penn G2 clippings would have been reported. Application of LebanonTurf 18-2-5 delivered the least amount of K2O (0.028 lbs K2O / 1000 ft2) among the 8 commercial program treatments. Turfgrass vegetation generally requires 5 and 9 times more K than Ca and Mg, respectively. Fertilizer programs showing the greatest clipping yield generally resided in the highest statistical grouping of K offtake. Over the four monthly data collections, UAP Signature treatments were the only resident of both the top statistical grouping of leaf K (Fig. 13a) and the bottom statistical grouping of K offtake (Fig. 13b). As plant water regulation and drought tolerance are critical functions of resident tissue K, large K offtake
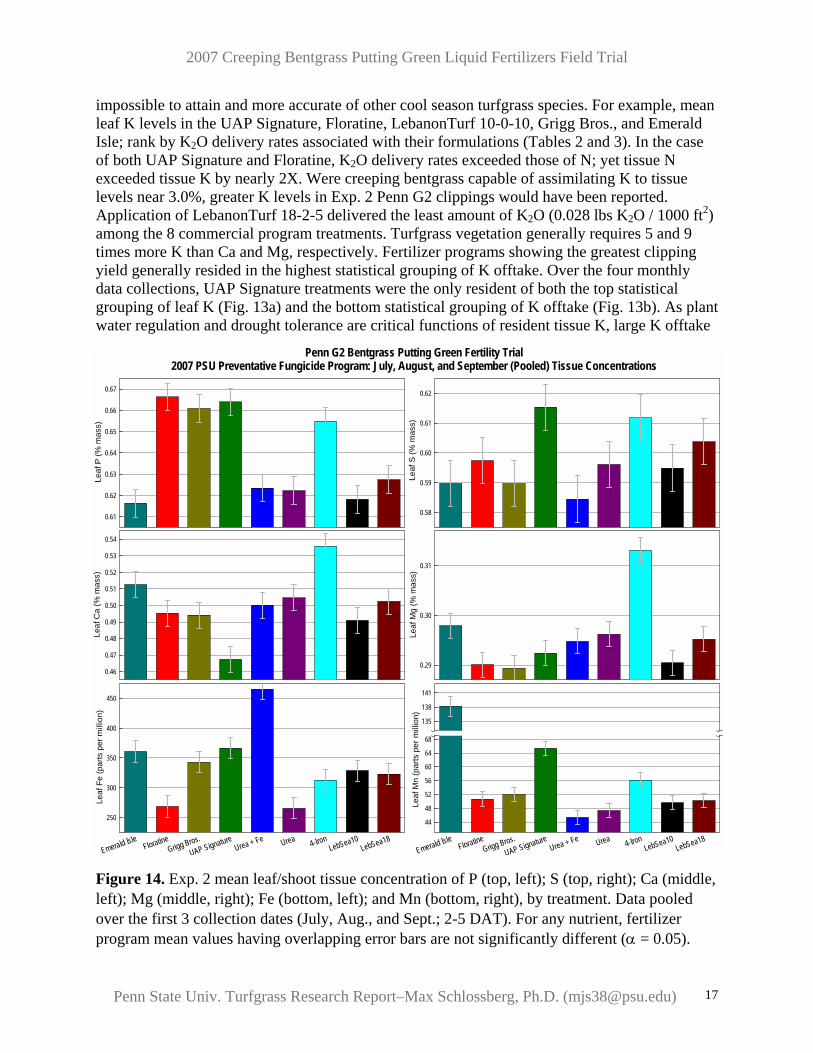
Figure 14. Exp. 2 mean leaf/shoot tissue concentration of P (top, left); S (top, right); Ca (middle, left); Mg (middle, right); Fe (bottom, left); and Mn (bottom, right), by treatment. Data pooled over the first 3 collection dates (July, Aug., and Sept.; 2-5 DAT). For any nutrient, fertilizer program mean values having overlapping error bars are not significantly different (α = 0.05).
2007 Creeping Bentgrass Putting Green Liquid Fertilizers Field Trial
Penn State Univ. Turfgrass Research Report–Max Schlossberg, Ph.D. ([email protected]) 18
levels in the 2-5 DAT interval are considered undesireable (Fig. 13b). Loss of K through clipping removal is particularly problematic in systems where clippings are not returned, and/or during periods of drought or supraoptimal soil temperatures. Under the conditions of Exp. 2, nearly all fertilizer programs fostered sufficient nutrient concentrations in Penn G2 creeping bentgrass vegetation (Fig. 14). Tissue nutrient concentrations mirrored delivery rates associated with the fertilizer programs. In the immediate time frame following fertilizer applications (2-5 DAT), tissue N levels departed from the standard delivery rate across all programs as shown in Fig. 12a. This is likely a response to immediately available N forms, but variability between program N delivery and associated tissue N levels preclude relationships from being definitively developed. The tissue K disparity between the urea + Fe or urea treatments (devoid of K2O) and commercial programs (containing K2O) is likely to be the result of the commercial programs’ loading of Ca, and subsequent competition with K for uptake. Across all of Exp. 2, general nutrient sufficiency of Penn G2 creeping bentgrass was high. The leaf S levels measured in this study challenge conventional S interpretations of creeping bentgrass putting green tissue levels and justify future evaluation. Discussion: While the two experiments described herein represent two popular creeping bentgrass cultivars currently surfacing golf course putting greens worldwide, both experiments were conducted in a common location, under identical environmental conditions, and on a common root zone medium. Beneath the 2.5” topdressing layer, the underlying ‘push-up’ root zones were both neutral and relatively fertile silt loams having high organic matter content, despite the subtle differences shown in Table 1. Likewise, these experiments were managed similarly to golf course putting greens but likely endured comparatively less foot traffic. Mowing, growth regulation, and topdressing practices were employed, but under less-intense regimes than conducted on most golf course putting greens. Conversely, the reduced fungicide program employed in Exp. 1 facilitated observations of a condition proven difficult to reproduce on operational putting greens, and provides new information to the many interested stewards of integrated pest management programs. While fertilizer efficacy under reduced- and zero-fungicide programs has been evaluated on a golf course, Grant and Rossi (2004) reported the experimental conditions to be challenging. The scope and effort associated with their ambitious evaluation was most admirable, but the psuedo-replicated design weakened its statistical power. Furthermore, frequent applications of numerous biological control agents confound strict interpretation of the results. Overall, the concensus among turfgrass researchers is that the Grant and Rossi study ingeniously produced unique and invaluable results when they were needed most. Their results single-handedly provided the evidence necessary to rapidly reverse enactment of numerous county/municipal ordinances restricting all pesticide applications. While the purpose of the research described herein is more limited in scope; it provides simple, objective, and useful information to practitioners. A Latin square experimental design was employed for its inference power and advantageous reduction of

2007 Creeping Bentgrass Putting Green Liquid Fertilizers Field Trial
Penn State Univ. Turfgrass Research Report–Max Schlossberg, Ph.D. ([email protected]) 19
spatial variability. Furthermore a second year of Exp. 1 (reduced fungicide program) data collection is scheduled for 2008. Skeptics are free to brand the described experimental conditions as ‘limited’ or ‘unrepresentative of actual golf course conditions’, but the imposed features of the Exp. 1 reduced fungicide program could not be easily reproduced elsewhere. For instance, multiple ‘no pesticide’ putting greens were closed to play for portions of each year in the Grant and Rossi (2004) study. Conclusions: Under the environmental and cultural conditions described in Experiment 1 (Penn A4–reduced fungicide program), and:
• During a 2-month period of severe disease activity, plots treated with the UAP Signature liquid fertilizer programs showed significantly greater percent canopy cover than all programs except Emerald Isle (July 27 to Sept. 29, 2007).
• During a 3-week period of severe disease activity (dollar spot), plots treated with the UAP Signature liquid fertilizer programs showed significantly greater canopy density (NDVI) than all programs (Aug. 23 to Sept. 13, 2007).
• Of the fertilizer programs evaluated over the 18-week study, the UAP Signature treated plots demonstrated the highest predicted minimum dark green color index (DGCI) over the average reapplication interval of 8 days.
Under typical putting green culture and the environmental conditions described in Experiment 2 (Penn G2–preventative fungicide program), and of the ten fertilizer programs evaluated:
• Experiment-wide leaf/shoot growth response to the Floratine and Grigg Bros. fertilizer programs was significantly greater than all other programs.
• After the Urea + Fe treatment; UAP Signature, LebanonTurf 10-0-10, Grigg Bros., and Emerald Isle treatments resided within the second-highest statistical grouping of Penn G2 experiment-wide putting green canopy dark green color index (DGCI) response.
• Fertilizer nutrient recovery and retention varied over the 0.1 lbs N /1000 ft2 programs; yet only the UAP Signature fertilizer program resided in the top statistical grouping for experiment-wide leaf/shoot tissue P, K, and S concentration, while residing in the bottom statistical grouping of experiment-wide N and K offtake by clippings.
The following observations are common to the putting green culture and the environmental conditions described in both 18-week experiments (Penn A4 and G2):
• Predicted dark green color index (DGCI) response to UAP Signature treatments demonstrated the least predicted daily variation over the 8-day reapplication intervals.
• Maximum predicted dark green color index (DGCI) response to the UAP Signature fertilizer program occurred latest over the 8-day reapplication intervals; 3.2 and 4.1 days after treatment in Exp. 1 and 2, respectively.
• Of the 5 commercial programs evaluated, only UAP Signature and Emerald Isle treatments resided within the top statistical grouping of both experiment-wide putting green canopy dark green color index (DGCI) responses.
2007 Creeping Bentgrass Putting Green Liquid Fertilizers Field Trial
Penn State Univ. Turfgrass Research Report–Max Schlossberg, Ph.D. ([email protected]) 20
Disclaimer: Trade and/or manufacturer’s names mentioned in this report are for information only and do not constitute endorsement, recommendation, or exclusion by the author or PSU. Above-mentioned turfgrass responses resulted from treatment applications to specific sites SOLELY AS DESCRIBED herein, as allowed by regulations governing agronomic use of such materials. References: Bowman, D.C. 2003. Daily vs. periodic nitrogen addition affects growth and tissue nitrogen in perennial ryegrass turf. Crop Sci. 43:631–638. Couch, H.B. 1973. Diseases of turfgrass (2nd ed.). Krieger Publishing Co., Malabar, FL. Grant, J.A., and F.S. Rossi. 2004. Evaluation of reduced chemical management systems for
putting green turf. USGA Turfgrass & Environmental Res. Online. 3(4):1–13. Horneck, D.A., and R.O. Miller. 1998. Determination of total nitrogen in plant tissue. In Y.P.
Kalra (ed.) Handbook and Reference Methods for Plant Analysis. CRC Press, New York. Karcher, D.E., and M.D. Richardson. 2003. Quantifying turfgrass color using digital image analysis. Crop Sci. 43:943–951. Miller, R.O. 1998. Microwave digestion of plant tissue in a closed vessel. In Y.P. Kalra (ed.)
Handbook and Reference Methods for Plant Analysis. CRC Press, New York. Richardson, M.D., D.E. Karcher, and L.C. Pursell. 2001. Quantifying turfgrass cover using
digital image analysis. Crop Sci. 41:1884–1888. Rossi, F. 2006. Effects of microbial and organic products on putting green performance. Golf
Course Management. 10:101–105 http://www.gcsaa.org/gcm/2006/oct/WebEx%20copy.asp Schlossberg, M.J., and J.P. Schmidt. 2007. Influence of nitrogen rate and form on quality of
putting greens cohabited by creeping bentgrass and annual bluegrass. Agron. J. 99:99–106. Walsh, B., S.S. Ikeda, and G.J. Boland. 1999. Biology and management of dollar spot
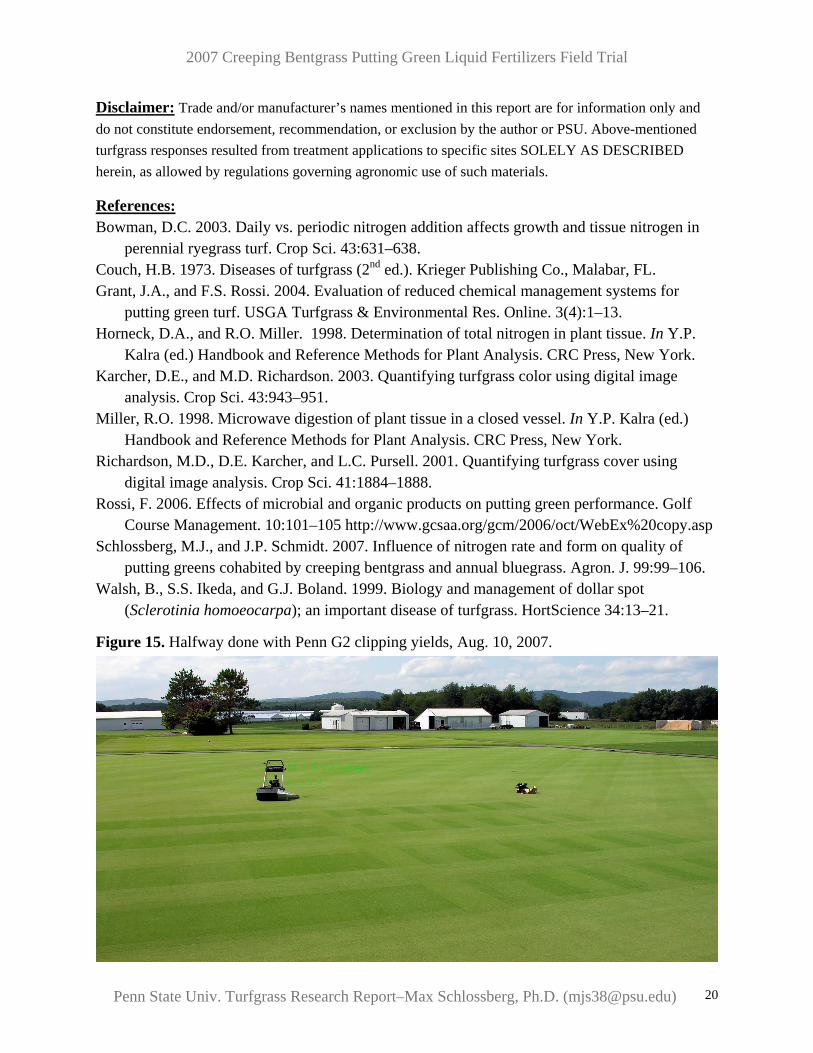
(Sclerotinia homoeocarpa); an important disease of turfgrass. HortScience 34:13–21. Figure 15. Halfway done with Penn G2 clipping yields, Aug. 10, 2007.