
2007 Benchmarking and Data Book of Water Utilities in … partnership between Ministry of Urban...
106
A partnership between Ministry of Urban Development Government of India and Asian Development Bank 2007 Benchmarking and Data Book of Water Utilities in India 2007 Benchmarking and Data Book of Water Utilities in India
Transcript of 2007 Benchmarking and Data Book of Water Utilities in … partnership between Ministry of Urban...

A partnership between Ministry of Urban Development Government of India and Asian Development Bank
2007Benchmarking andData Book of Water Utilities in India
2007Benchmarking andData Book of Water Utilities in India

A partnership between Ministry of Urban Development Government of India and Asian Development Bank
2007Benchmarking andData Book of Water Utilities in India


iii
PREFACE
Water supply is crucial to addressing the challenge of urban development. It is one of the five urban basic services being addressed by the Government of India, under the Jawaharlal Nehru National Urban Renewal Mission (JNNURM), which is probably the single most important initiative in the history of our country in developing its urban areas. Reform in the urban water supply sector under the mission is about change to reach the ultimate objective of making water available on a 24 x 7 basis to everyone, especially to the urban poor.
The publication of the 2007 Benchmarking and Data Book of Water Utilities in India is very timely as it
is a first step in benchmarking service levels for the urban water supply sector. Reliable performance data for planning will be necessary to monitor and sustain the reforms under JNNURM over the 7-year period and beyond. Fifty percent of our cities do not have piped water supplies, and performance information on the 20 cities in the Data Book will help us plan for sustainable water supplies for them. Reforms that are mandated and incentivized under JNNURM are focused on service improvement, which is aimed at bringing more accountability and transparency in utility operations. Transparency and community participation in service delivery can go a long way in improving performance. The Data Book supports all these especially in helping bring financial discipline in water utility operations through public–private partnerships (PPP), which is an important element of the JNNURM program.
Recognizing the importance of benchmarking, the Ministry is encouraging utilities to mainstream
benchmarking activities in their operations and annual business planning. The benchmarking project is showing the way for standardizing benchmarking for the five urban services under JNNURM. However, these benchmarking efforts should lead toward the vision of 24x7 water supplies for all. The results presented in the Data Book tell us that we have to make changes in our management practices, such as metering; applying appropriate user charges; reducing our water losses; and increasing water availability, coverage, and access in partnership with our customers, stakeholders, and development partners.
We would like to thank the Asian Development Bank, the members of the project team, and the 20
participating water utilities for preparing and publishing the Indian Water Utilities Data Book that should help us take the necessary first steps toward 24x7 water for all.
M. Rajamani Joint Secretary (UD) and
Mission Director (JNNURM) Ministry of Urban Development Government of India


v
FOREWORD
In December 2005, the Government of India (GOI) launched the Jawaharlal Nehru National Urban Renewal Mission (JNNURM), which formally envisages central government investment of potentially up to US$11 billion on basic urban infrastructure and services (water supply, waste management, public transportation, etc.) in 63 identified cities over the next 7 years. The Asian Development Bank (ADB) and the GOI have agreed that information on selected JNNURM cities would be useful for their work in identifying projects in support of the JNNURM program. The Ministry of Urban Development (MoUD) with support from ADB embarked on a Benchmarking and Water Utilities Data Book Project for 20 selected water utilities in India. Benchmarking has long been proven to be an effective tool for improving an organization’s performance. Data collected from the project will feed into the JNNURM and support utilities to better access MoUD assistance, with good information on their performance. The 2007 Benchmarking and Data Book of Water Utilities in India is a comprehensive compilation of information on the performance of Indian water utilities. It builds on ADB’s experience from the two Water Utilities Data Books for the Asian and Pacific Region published in 1993 and 1997, and the more recent Water in Asian Cities in 2004, which were all well received by stakeholders and have served as useful reference documents. The 2007 Benchmarking and Data Book of Water Utilities in India provides information from water utilities in 20 JNNURM cities and is based largely on 2005–2006 data. It comprises three parts. Part I is a summary of findings and brief comments thereon. Part II consists of comparison charts and tables of a number of important performance parameters. Part III gives the utility and city profiles. Information for the Data Book was derived from questionnaires designed by ADB and agreed upon and completed by the participating utilities. Much effort has gone into confirming the accuracy and consistency of information provided by the utilities. Many clarifications were sought by the project team and much data is presented with footnotes which suggest explanations for apparent discrepancies. Funding for the preparation of the Data Book was provided by the Cooperation Fund for the Water Sector, financed by the Government of The Netherlands and Norway, and administered by ADB. However, it may be noted that the views and analysis expressed herein do not necessarily reflect those of ADB. The Data Book was prepared in ADB’s Energy, Transport, and Water Division, Regional and Sustainable Development Department (RSDD), under the overall guidance of K. E. Seetharam, Principal Water Supply and Sanitation Specialist supported by Theresa Audrey O. Esteban, Sector Officer, RSDD, and staff of South Asia Department’s Urban Development Division and India Resident Mission. The Project was executed and managed in India through a Project Team headed by Mr. M. Rajamani, Joint Secretary, Ministry of Urban Development, India with support from the following team members: Mr. Cesar E. Yñiguez, Benchmarking Adviser; Dr. K.N. Satyanarayana, IIT Madras, Technical Expert; and Mr. S. Krishnamurthy and Ms. Catherine Rose James, ICRA Management Consulting Services Ltd., Benchmarking Coordinators. The provision of adequate, safe, and reliable water supplies on a 24x7 basis in the context of an increasing population and rapid urban development in India will be a major challenge to the Government of India and its development partners. We hope that this Data Book will contribute in understanding the challenge better, and in helping the stakeholders define the best ways of meeting it.
WooChong Um Director
Energy, Transport and Water, RSDD Asian Development Bank
vi
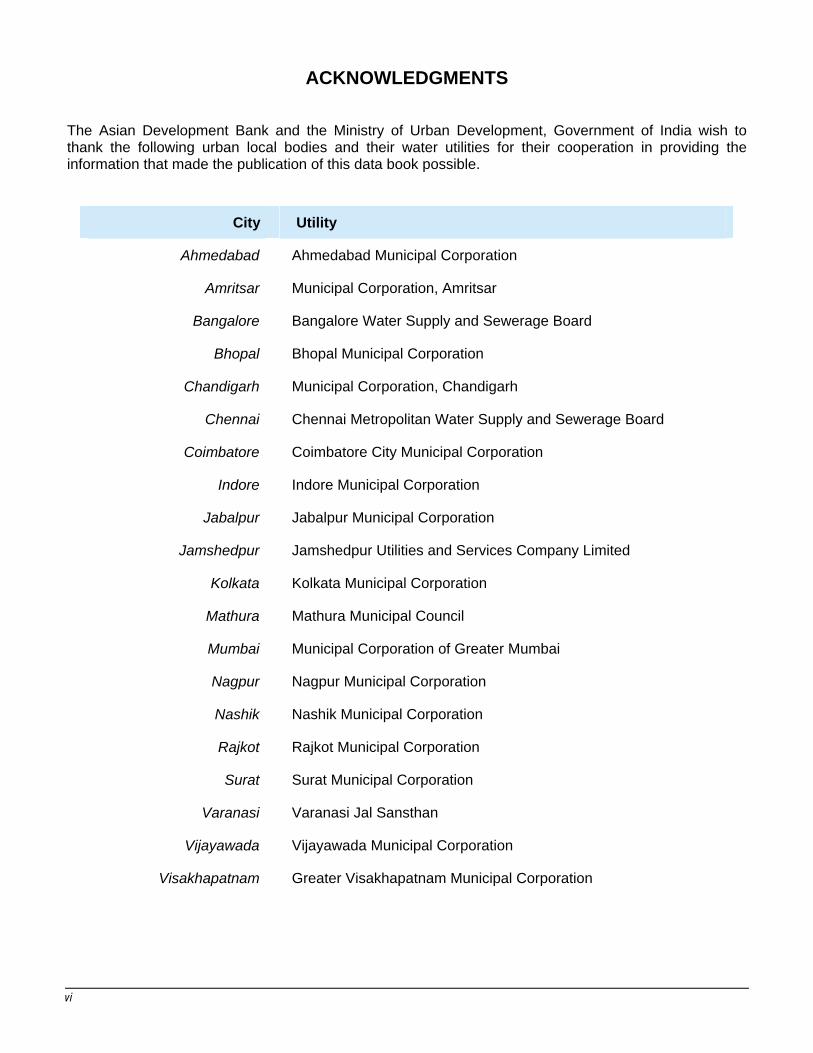
ACKNOWLEDGMENTS The Asian Development Bank and the Ministry of Urban Development, Government of India wish to thank the following urban local bodies and their water utilities for their cooperation in providing the information that made the publication of this data book possible.
City Utility
Ahmedabad Ahmedabad Municipal Corporation
Amritsar Municipal Corporation, Amritsar
Bangalore Bangalore Water Supply and Sewerage Board
Bhopal Bhopal Municipal Corporation
Chandigarh Municipal Corporation, Chandigarh
Chennai Chennai Metropolitan Water Supply and Sewerage Board
Coimbatore Coimbatore City Municipal Corporation
Indore Indore Municipal Corporation
Jabalpur Jabalpur Municipal Corporation
Jamshedpur Jamshedpur Utilities and Services Company Limited
Kolkata Kolkata Municipal Corporation
Mathura Mathura Municipal Council
Mumbai Municipal Corporation of Greater Mumbai
Nagpur Nagpur Municipal Corporation
Nashik Nashik Municipal Corporation
Rajkot Rajkot Municipal Corporation
Surat Surat Municipal Corporation
Varanasi Varanasi Jal Sansthan
Vijayawada Vijayawada Municipal Corporation
Visakhapatnam Greater Visakhapatnam Municipal Corporation

vii
ABBREVIATIONS
Abbreviations and Acronyms
ADB Asian Development Bank AMC Ahmedabad Municipal Corporation BMC Bhopal Municipal Corporation BOT build–operate–transfer BPL below poverty line BWSSB Bangalore Water Supply and Sewerage Board CCMC Coimbatore City Municipal Corporation CMWSSB Chennai Metropolitan Water Supply and Sewerage Board GIS Geographic Information System GOI Government of India GVMC Greater Visakhapatnam Municipal Corporation HC house connection HSC house service connection HUDCO Housing and Urban Development Corporation IIT Indian Institute of Technology IMC Indore Municipal Corporation JMC Jabalpur Municipal Corporation IVRS Interactive Voice Response System JNNURM Jawaharlal Nehru Urban Renewal Mission JUSCO Jamshedpur Utilities and Services Company, Limited KMC Kolkata Municipal Corporation MCA Municipal Corporation, Amritsar MCC Municipal Corporation, Chandigarh MCGM Municipal Corporation of Greater Mumbai MMC Mathura Municipal Council MoUD Ministry of Urban Development NMC Nagpur Municipal Corporation NMC Nashik Municipal Corporation NRW nonrevenue water O&M operation and maintenance PPP Public–Private Partnerships PT public tap RMC Rajkot Municipal Corporation Rs Indian rupee SCADA Supervisory Control and Data Acquisition SMC Surat Municipal Corporation SP stand post UFW unaccounted for water ULB Urban Local Body VJS Varanasi Jal Sansthan VMC Vijayawada Municipal Corporation

viii
Measurement Units and Symbols
km kilometer km2 square kilometer lpcd liter per capita per day m meter m3 cubic meter m3/day cubic meter per day m3/day/c cubic meter per day per capita mm millimeter n.a. not available or not applicable sq km square kilometer % percent '' inch

ix
METHODOLOGY The 2007 Benchmarking and Data Book of Water Utilities in India examined the performance of water utilities in 20 cities in India, with service areas ranging from one city to several towns and cities. An inception workshop was held at the India Institute of Technology Madras, Chennai on 17–18 January 2007 to i) provide the participants an understanding of benchmarking as a tool for performance improvement, ii) select the most appropriate performance indicators to measure performance of water utilities, and iii) plan the implementation of the benchmarking and water utilities data book project.
The water utilities that provided data included 15 municipal corporations, two city boards, a municipal council, a local autonomous body, and a private operator. Data collected through a water utility questionnaire (shown in appendix 1) were for 2005–2006. For purposes of presentation and discussions, the name of the city or town served by the utility is used instead of the utility name, for example, Jamshedpur instead of Jamshedpur Utilities and Services Co., Ltd., or Varanasi instead of Varanasi Jal Sansthan.
Performance indicators were derived using basic data provided by the utilities and following
various computations using the formulas in the following sections below. Almost all the data used in comparing the indicators in the tables, graphs, charts, and figures are found in each utility and area profile; hence, exact values can be extracted.
Many clarifications were sought on the data provided especially for consistency between the data
and indicators; thus, the data finally presented are the best that could be obtained in the circumstances. Nevertheless, ADB is conscious that not all data are 100% reliable. In some instances, estimates were given in the absence of available measures, such as in cases where no total metering of production and consumption is available. This makes unaccounted for water or daily per capita consumption data estimates at best. If there are doubts on the reliability of some data presented, the reader is advised to verify the information from the utility whose contact details are provided in the utility profile.
The suggested evaluation criteria on utility performance are provided in appendix 2. This may be
modified to suit the particular situation in India in measuring the overall utility performance in a particular given period.
The information presented in this book was either taken from the water utility questionnaire or
was based on computations using data from the questionnaire. The formulas used for the computations are shown below.
1. Water supply coverage (%) = [(population served by HC) + (population served by PT)] x 100 / [total population in the area of responsibility]
2. Per capita consumption (lpcd)
= [total annual domestic consumption (m3) x 1,000/365] / [number of people served] 3. Production/population (m3/day/c) = [annual production volume (m3) /365] / [number of people served] 4. Unaccounted for water (%)
= [total annual production (m3) - total annual consumption (m3)] x 100 / [total annual production (m3)]

x
5. Average tariff (Rs/m3) = [total annual billing (Rs)] / [total annual consumption (m3)] 6. Unit production cost (Rs/m3) = [annual O&M cost (Rs)] / [total annual production (m3)] 7. Operating ratio = [annual O&M cost (Rs)] / [annual revenue (Rs)] 8. Revenue collection efficiency (%) = [total annual collections (Rs) / total annual billings (Rs)] x 100 9. Accounts receivable (month’s equivalent) = [accounts receivable at end of the fiscal year] / [total annual billings/12] 10. Staff/1,000 connections ratio = [number of utility staff] / [number of utility connections/1,000]
Some utilities may have collection efficiency higher than 100%. This may indicate that total collections for the period included payment of bills for the previous period. Operating and maintenance costs used in the computations do not include depreciation and debt service.
Data on estimates of population served by house connections and by public taps were provided
by the utilities. Normally, these two values are computed using the number of house connections and public taps multiplied by the corresponding average number of persons served by each type of connection. However, in a number of instances, the reliability of the average number of persons served became suspect when the resulting population served exceeded the total population in the area of responsibility.

B a
y
o f
B
e n
g a
l
A r
a b
i a
n
S e
a
I N
D I
A N
O
C E
A N
Gul
f o
fC
amba
y
Sadiy
aD
ibru
garh
Silc
har
Jorh
at
Am
rits
ar
Am
ba
la
Ch
an
dig
arh
Sh
imla De
lhi Ba
llab
hg
arh
Ma
thu
raA
gra
Gw
aitd
or
Jais
alm
er
Bik
aner
Pa
nip
at
Ja
ipu
rL
uc
kn
ow
Ra
xau
l
Va
ran
asi
Pa
tna
Ba
rhi
De
hri
Dh
an
ba
d
Ga
ng
tok
Dis
pu
r
Sh
illo
ng
Ag
art
ala
Aiz
aw
l
Imp
ha
l
Ko
him
a
Ita
na
ga
r
Ba
ng
ao
nB
an
ga
on
Jam
she
dp
ur
Ko
lka
ta
Da
lu
Bh
ub
an
esw
ar
Pa
rad
ip
Ra
nc
hi
Porb
andar
Kandla
Rajk
ot
Ahm
edabad
Gan
dh
inag
ar
Mu
mb
ai
Nasi
k
Dh
ule
Sho
lap
ur
Anko
la
Pan
aji
Mangalo
reC
he
nn
ai
Na
tava
lesa
An
ah
ap
alle
Vis
akh
ap
atn
am
Vija
yaw
ad
a
Ed
ap
ally
Coim
ba
tore
Ma
du
rai
Din
dig
ul
Tu
tico
rin
Co
chin
Th
iru
van
an
tha
pu
ram
Po
nd
ich
err
y
Cu
dd
alo
re
Po
rt B
lair
Ca
r N
ico
ba
r
And
aman
Isla
nds
Nic
obar
Isla
nds
Be
ng
alu
ru
Sa
lem
Hy
de
rab
ad
Bia
ora
La
khn
ad
on
Ra
ipu
r
Na
gp
ur R
am
ag
un
da
m
Jab
alp
ur
Bh
op
al
Jess
aim
er
Be
lga
um
Dh
arw
ad
Ch
itra
du
rg
Hu
bli
Pune
Au
ran
ga
ba
d
Sura
t
Ind
ore
Jodhpur
Ka
np
ur
Asa
nso
l
Se
cun
de
rab
ad
Thane
Ca
licu
t
Du
rg
Bila
spu
r
Ch
an
dra
pu
r
Udaip
ur
Ajm
er
Lu
dh
ian
a
Fa
rid
ab
ad
De
hra
Du
n
UT
TA
RA
KH
AN
D
R A
J A
S T
H A
N
G U
J A
R A
TM
A D
H Y
AP
R A
D E
S H
UT
TA
R P
RA
DE
SH
PU
NJA
B
HIM
AC
HA
L P
RA
DE
SH
B I
H A
R
JHA
RK
HA
ND
CH
HA
TT
ISG
AR
H
WE
ST
BE
NG
AL
SIK
KIM
A S
S A
M
ME
GH
AL
AY
A
AR
UN
AC
HA
L P
RA
DE
SH
MIZ
OR
AM
TR
IPU
RA
NA
GA
LA
ND
MA
NIP
UR
O R
I S
S A
M A
H A
R A
S H
T R
A
A N
D H
R A
P R
A D
E S
H
KA
RN
AT
AK
A
AN
DA
MA
N A
ND
NIC
OB
AR
ISLA
ND
S
TA
MIL
NA
DU
KE
RA
LA
GO
A
HA
RY
AN
AP
AK
ISTA
N
NE
PA
LB
HU
TA
N
PE
OP
LE
'S R
EP
UB
LIC
OF
CH
INA
PE
OP
LE
'S R
EP
UB
LIC
OF
CH
INA
BA
NG
LA
DE
SH
MY
AN
MA
R
SR
I L
AN
KA
Lo
ca
tio
n o
f W
ate
r U
tilit
ies
Na
tio
na
l C
ap
ita
l
Sta
te C
ap
ita
l
City/T
ow
n
Riv
er
Sta
te o
r U
nio
n T
err
ito
ry B
ou
nd
ary
Inte
rna
tio
na
l B
ou
nd
ary
Bo
un
da
rie
s a
re n
ot
ne
ce
ssa
rily
au
tho
rita
tive
.
I N
D I
A
01
00
20
03
00
Kilo
me
ters
85
0
0'E
o
85
0
0'E
o
75
0
0'E
o
75
0
0'E
o
10
0
0'N
o1
0 0
0'N
o
25
0
0'N
o2
5 0
0'N
o

xiii
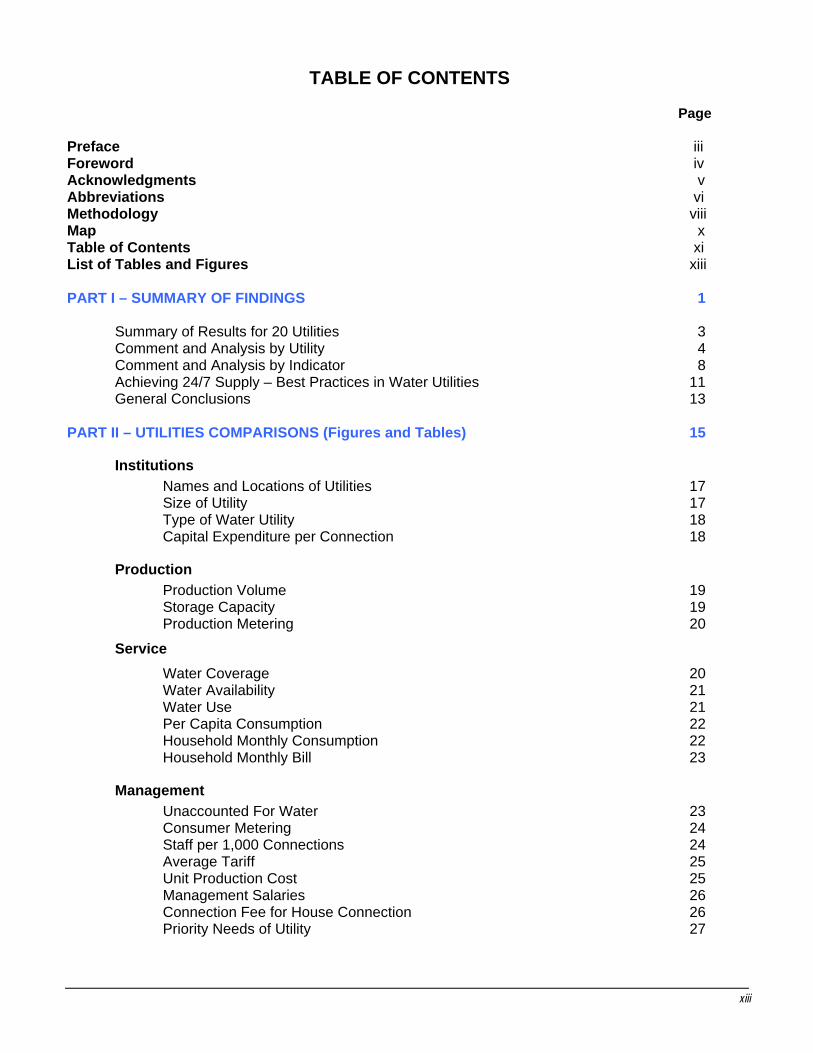
TABLE OF CONTENTS Page
Preface iii Foreword iv Acknowledgments v Abbreviations vi Methodology viii Map x Table of Contents xi List of Tables and Figures xiii PART I – SUMMARY OF FINDINGS 1 Summary of Results for 20 Utilities 3 Comment and Analysis by Utility 4 Comment and Analysis by Indicator 8 Achieving 24/7 Supply – Best Practices in Water Utilities 11 General Conclusions 13 PART II – UTILITIES COMPARISONS (Figures and Tables) 15
Institutions Names and Locations of Utilities 17
Size of Utility 17 Type of Water Utility 18 Capital Expenditure per Connection 18
Production Production Volume 19 Storage Capacity 19 Production Metering 20
Service Water Coverage 20
Water Availability 21 Water Use 21 Per Capita Consumption 22 Household Monthly Consumption 22 Household Monthly Bill 23
Management Unaccounted For Water 23 Consumer Metering 24 Staff per 1,000 Connections 24 Average Tariff 25
Unit Production Cost 25 Management Salaries 26
Connection Fee for House Connection 26 Priority Needs of Utility 27
xiv
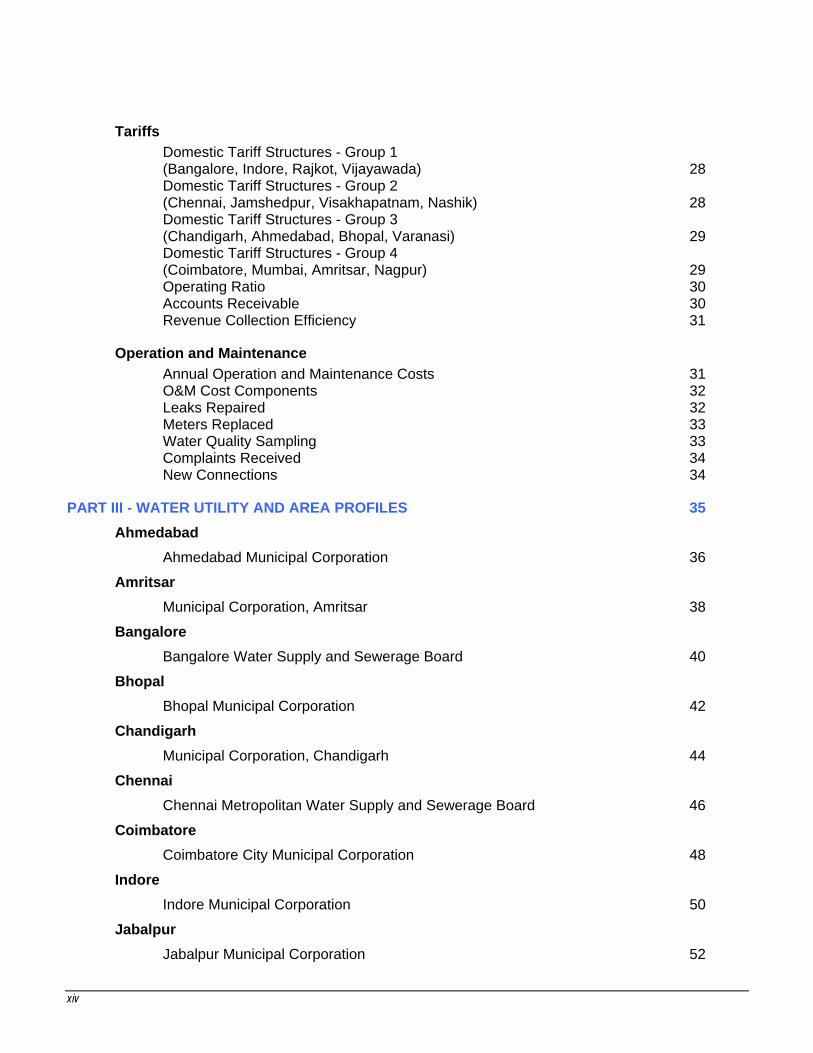
Tariffs Domestic Tariff Structures - Group 1
(Bangalore, Indore, Rajkot, Vijayawada) 28 Domestic Tariff Structures - Group 2
(Chennai, Jamshedpur, Visakhapatnam, Nashik) 28 Domestic Tariff Structures - Group 3
(Chandigarh, Ahmedabad, Bhopal, Varanasi) 29 Domestic Tariff Structures - Group 4
(Coimbatore, Mumbai, Amritsar, Nagpur) 29 Operating Ratio 30 Accounts Receivable 30 Revenue Collection Efficiency 31
Operation and Maintenance Annual Operation and Maintenance Costs 31 O&M Cost Components 32 Leaks Repaired 32 Meters Replaced 33 Water Quality Sampling 33 Complaints Received 34 New Connections 34
PART III - WATER UTILITY AND AREA PROFILES 35 Ahmedabad Ahmedabad Municipal Corporation 36
Amritsar Municipal Corporation, Amritsar 38
Bangalore Bangalore Water Supply and Sewerage Board 40
Bhopal Bhopal Municipal Corporation 42
Chandigarh Municipal Corporation, Chandigarh 44
Chennai Chennai Metropolitan Water Supply and Sewerage Board 46
Coimbatore Coimbatore City Municipal Corporation 48
Indore Indore Municipal Corporation 50
Jabalpur Jabalpur Municipal Corporation 52
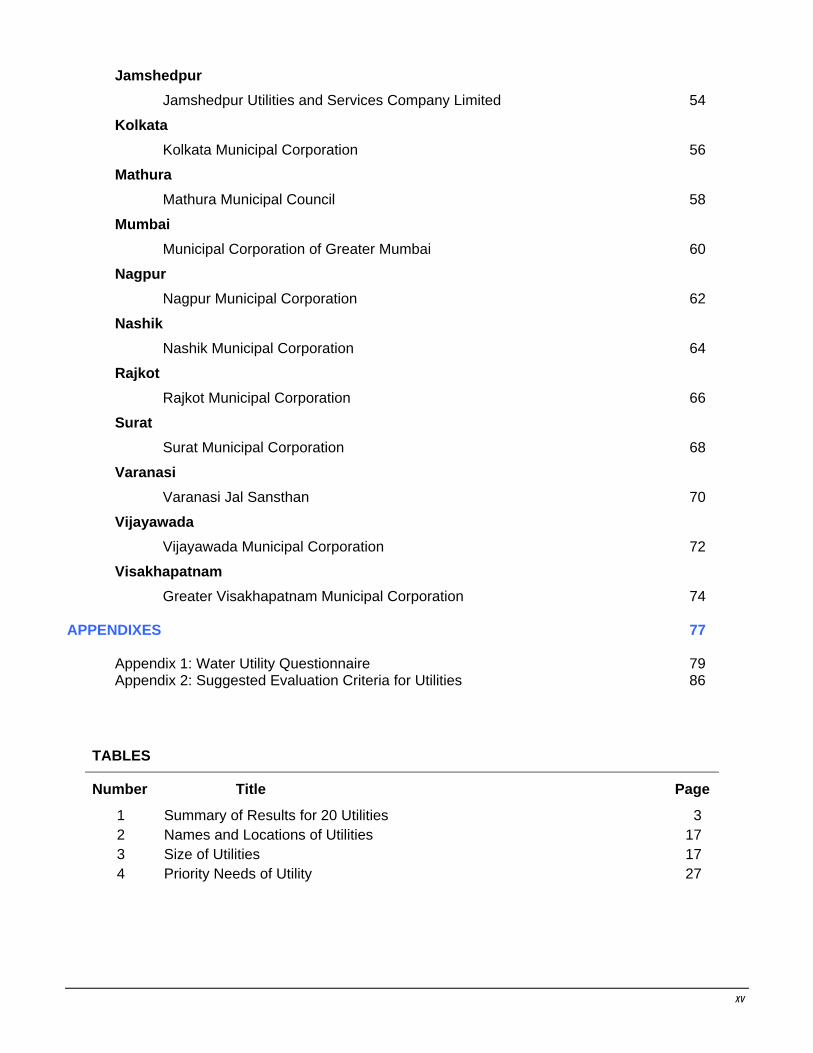
xv
Jamshedpur Jamshedpur Utilities and Services Company Limited 54
Kolkata Kolkata Municipal Corporation 56
Mathura Mathura Municipal Council 58
Mumbai Municipal Corporation of Greater Mumbai 60
Nagpur Nagpur Municipal Corporation 62
Nashik Nashik Municipal Corporation 64
Rajkot Rajkot Municipal Corporation 66
Surat Surat Municipal Corporation 68
Varanasi Varanasi Jal Sansthan 70
Vijayawada Vijayawada Municipal Corporation 72
Visakhapatnam Greater Visakhapatnam Municipal Corporation 74
APPENDIXES 77
Appendix 1: Water Utility Questionnaire 79 Appendix 2: Suggested Evaluation Criteria for Utilities 86
TABLES
Number Title Page
1 Summary of Results for 20 Utilities 3 2 Names and Locations of Utilities 17 3 Size of Utilities 17 4 Priority Needs of Utility 27

xvi
FIGURES
Number Title Page
1 Type of Water Utility 18 2 Capital Expenditure Per Connection 18 3 Production Volume 19 4 Storage Capacity 19 5 Production Metering 20 6 Water Coverage 20 7 Water Availability 21 8 Water Use 21 9 Per Capita Consumption 22 10 Household Monthly Consumption 22 11 Household Monthly Bill 23 12 Unaccounted For Water 23 13 Consumer Metering 24 14 Staff per 1,000 Connections 24 15 Average Tariff 25 16 Unit Production Cost 25 17 Management Salaries 26 18 Connection Fee for House Connection 26
19a Domestic Tariff Structures - Group 1 (Bangalore, Indore, Rajkot, Vijayawada)
28
19b Domestic Tariff Structures - Group 2 (Chennai, Jamshedpur, Visakhapatnam, Nashik)
28
19c Domestic Tariff Structures - Group 3 (Chandigarh, Ahmedabad, Bhopal, Varanasi)
29
19d Domestic Tariff Structures - Group 4 (Coimbatore, Mumbai, Amritsar, Nagpur)
29
20 Operating Ratio 30 21 Accounts Receivable 30 22 Revenue Collection Efficiency 31 23 Annual Operation and Maintenance Costs 31 24 O&M Cost Components 32 25 Leaks Repaired 32 26 Meters Replaced 33 27 Water Quality Sampling 33 28 Complaints Received 34 29 New Connections 34

PPAARRTT II
SSUUMMMMAARRYY OOFF FFIINNDDIINNGGSS


______________________________________________________________________________________________________ 4 2007 Benchmarking and Data Book of Water Utilities in India
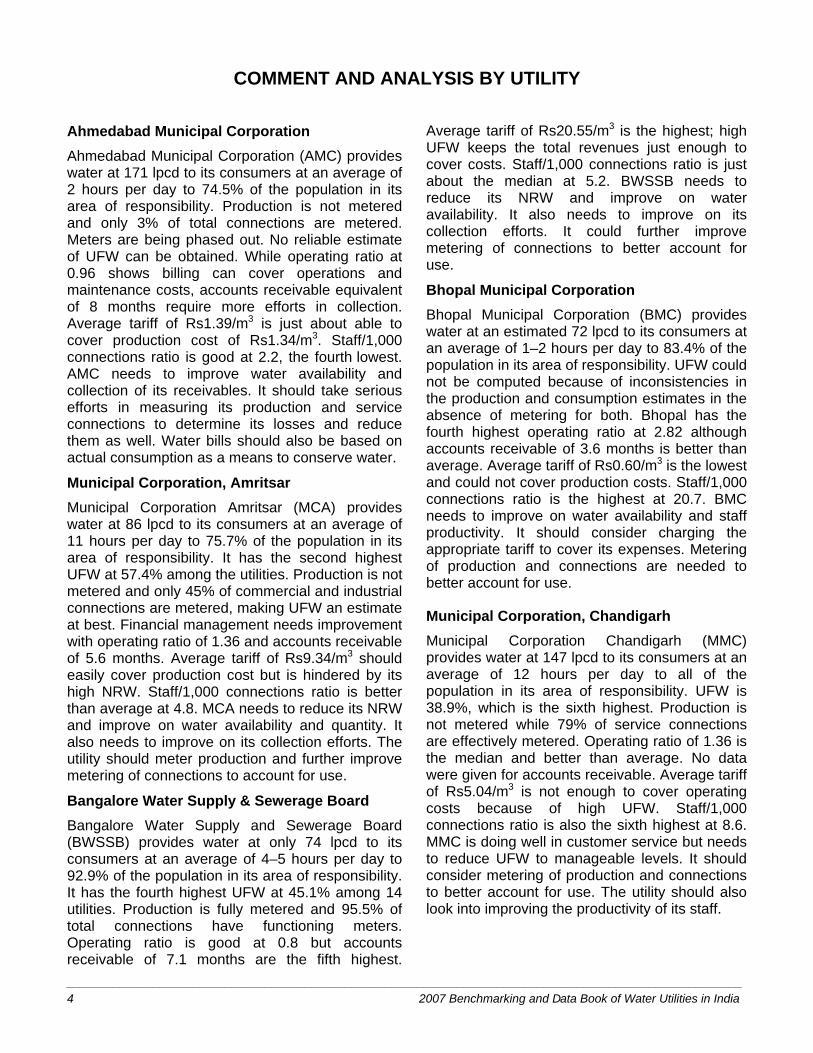
COMMENT AND ANALYSIS BY UTILITY Ahmedabad Municipal Corporation Ahmedabad Municipal Corporation (AMC) provides water at 171 lpcd to its consumers at an average of 2 hours per day to 74.5% of the population in its area of responsibility. Production is not metered and only 3% of total connections are metered. Meters are being phased out. No reliable estimate of UFW can be obtained. While operating ratio at 0.96 shows billing can cover operations and maintenance costs, accounts receivable equivalent of 8 months require more efforts in collection. Average tariff of Rs1.39/m3 is just about able to cover production cost of Rs1.34/m3. Staff/1,000 connections ratio is good at 2.2, the fourth lowest. AMC needs to improve water availability and collection of its receivables. It should take serious efforts in measuring its production and service connections to determine its losses and reduce them as well. Water bills should also be based on actual consumption as a means to conserve water.
Municipal Corporation, Amritsar Municipal Corporation Amritsar (MCA) provides water at 86 lpcd to its consumers at an average of 11 hours per day to 75.7% of the population in its area of responsibility. It has the second highest UFW at 57.4% among the utilities. Production is not metered and only 45% of commercial and industrial connections are metered, making UFW an estimate at best. Financial management needs improvement with operating ratio of 1.36 and accounts receivable of 5.6 months. Average tariff of Rs9.34/m3 should easily cover production cost but is hindered by its high NRW. Staff/1,000 connections ratio is better than average at 4.8. MCA needs to reduce its NRW and improve on water availability and quantity. It also needs to improve on its collection efforts. The utility should meter production and further improve metering of connections to account for use.
Bangalore Water Supply & Sewerage Board Bangalore Water Supply and Sewerage Board (BWSSB) provides water at only 74 lpcd to its consumers at an average of 4–5 hours per day to 92.9% of the population in its area of responsibility. It has the fourth highest UFW at 45.1% among 14 utilities. Production is fully metered and 95.5% of total connections have functioning meters. Operating ratio is good at 0.8 but accounts receivable of 7.1 months are the fifth highest.
Average tariff of Rs20.55/m3 is the highest; high UFW keeps the total revenues just enough to cover costs. Staff/1,000 connections ratio is just about the median at 5.2. BWSSB needs to reduce its NRW and improve on water availability. It also needs to improve on its collection efforts. It could further improve metering of connections to better account for use.
Bhopal Municipal Corporation Bhopal Municipal Corporation (BMC) provides water at an estimated 72 lpcd to its consumers at an average of 1–2 hours per day to 83.4% of the population in its area of responsibility. UFW could not be computed because of inconsistencies in the production and consumption estimates in the absence of metering for both. Bhopal has the fourth highest operating ratio at 2.82 although accounts receivable of 3.6 months is better than average. Average tariff of Rs0.60/m3 is the lowest and could not cover production costs. Staff/1,000 connections ratio is the highest at 20.7. BMC needs to improve on water availability and staff productivity. It should consider charging the appropriate tariff to cover its expenses. Metering of production and connections are needed to better account for use.
Municipal Corporation, Chandigarh Municipal Corporation Chandigarh (MMC) provides water at 147 lpcd to its consumers at an average of 12 hours per day to all of the population in its area of responsibility. UFW is 38.9%, which is the sixth highest. Production is not metered while 79% of service connections are effectively metered. Operating ratio of 1.36 is the median and better than average. No data were given for accounts receivable. Average tariff of Rs5.04/m3 is not enough to cover operating costs because of high UFW. Staff/1,000 connections ratio is also the sixth highest at 8.6. MMC is doing well in customer service but needs to reduce UFW to manageable levels. It should consider metering of production and connections to better account for use. The utility should also look into improving the productivity of its staff.

______________________________________________________________________________________________________ Comment and Analysis by Utility 5
Chennai Metropolitan Water Supply & Sewerage Board Chennai Metropolitan Water Supply and Sewerage Board (CMWWSB) provides water at 87 lpcd to its consumers at an average of 5 hours per day to 89.3% of the population in its service area. It has the fifth lowest UFW at 17.0%. However, while production is fully metered, only 3.5% of total connections are metered making UFW figure an estimate at best. Financial management is good, with the lowest operating ratio at 0.44 and accounts receivable equivalent of 1.1 months, the third lowest. Average tariff of Rs10.87/m3 can easily cover production cost. Staff/1,000 connections ratio is high at 13.3, the fifth highest. CMWSSB needs to increase water availability and staff productivity. It should also improve metering of service connections to account for use.
Coimbatore City Municipal Corporation Coimbatore City Municipal Corporation (CCMC) provides water at 109 lpcd to its consumers at an average of 3 hours per day to 76.1% of the population in its area of responsibility. UFW is the fifth highest at 41.3% with both production and consumption fully metered, which gives an accurate measure of its losses. Financial management is good, with an operating ratio of 0.82 and accounts receivable at 3.0 months, the sixth lowest but can still be reduced. Average tariff of Rs3.66/m3 is enough to cover operating costs. Staff/1,000 connections ratio is fair at 4.0, which is about half of the average. CCMC needs to reduce its UFW and increase the available hours of its supply and coverage as well.
Indore Municipal Corporation Indore Municipal Corporation (IMC) provides water at 87 lpcd to its consumers at an average of 45 minutes per day to 77.3% of the population in its area of responsibility. With both production and connections not metered, available production and consumption estimates do not give a credible UFW value. Operating ratio is highest at 5.33. Accounts receivable are about average at 5.2 months. Average tariff of Rs2.79/m3 is lower than the high production cost of Rs13.18/m3 because of high-cost power most probably for pumping. Staff/1,000 connections ratio is the second highest at 18.7. IMC will need a lot of improvement starting with reducing its operating expenses and improving
collections. Water availability of less than 1 hour a day is not acceptable and should be improved. Staff productivity needs to be enhanced. Production and all connections need to be metered to allow billing based on use and to account for total use and losses.
Jabalpur Municipal Corporation Jabalpur Municipal Corporation (JMC) provides water at 139 lpcd to its consumers at an average of 4 hours per day to 75.2% of the population in its area of responsibility. With both production and service connections not metered, UFW of 14.3% is, at best, an estimate. Operating ratio is 1.68 and accounts receivable equivalent is 3 months. Average tariff of Rs1.50/m3 is the fifth lowest and cannot cover operating expenses. Staff/1,000 connections ratio is lowest at 0.4. JMC needs to address its water availability, its low tariff, and operating ratio of more than 1. Production and all connections need to be metered to allow billing based on use and to account for total use and losses.
Jamshedpur Utilities and Services Company Limited Jamshedpur Utilities and Services Company (JUSCO) provides water at 203 lpcd to its consumers at an average of 6 hours per day to 74.4% of the population in its area of responsibility. While production is metered, less than 1% of service connections are metered. UFW of 12.8% is the lowest. Financial management is very good, with operating ratio of 0.62 and accounts receivable of 0.3 month. Average tariff of Rs4.51/m3 is about average but covers expenses well. Staff/1,000 connections ratio is less than average at 5.6. JUSCO is operating well except for water availability. It can further improve by full metering of all service connections.
Kolkata Municipal Corporation Kolkata Municipal Corporation (KMC) provides water at 130 lpcd to its consumers at an average of 8 hours per day to 79.0% of the population in its area of responsibility. UFW is estimated at a high 35%, with production not metered and less than 1% of service connections metered. Financial management needs improvement with the second highest operating ratio of 4.73 and

______________________________________________________________________________________________________ 6 2007 Benchmarking and Data Book of Water Utilities in India
accounts receivable of 2.4 months. Average tariff of Rs1.13/m3 is the third lowest, which cannot cover expenses at all. Staff/1,000 connections ratio is the fourth highest at 14.7. KMC needs to cover its expenses through appropriate tariffs and by charging domestic users for their use. It also needs to improve collection and water availability, and reduce its high UFW. Staff productivity should also be enhanced. Metering is necessary to account for water use and to determine the extent of losses.
Mathura Municipal Council Mathura Municipal Council (MMC) provides water to its consumers at an average of 1–3 hours per day to 70% of the population in its area of responsibility. Both production and all service connections are not metered. Estimates given show consumption equal to production, giving unrealistic values for per capita consumption and UFW. Financial management needs improvement with the third highest operating ratio of 3.05 and accounts receivable of 12.3 months, which is the highest. Average tariff of Rs0.62/m3 is the second lowest, which could not cover expenses at all. Staff/1,000 connections ratio is better than average at 6.5. MMC needs to cover its expenses through appropriate tariffs. It also needs to improve collection and water availability. Metering is necessary to account for water use and to determine the extent of losses.
Municipal Corporation of Greater Mumbai Municipal Corporation of Greater Mumbai (MCGM) provides water to its consumers at 191 lpcd at an average of 4 hours per day to all of the population in its area of responsibility. Production is metered and 75% of service connections have working meters. UFW of 13.6% is the second lowest. Financial management is mixed with very good operating ratio of 0.49 but accounts receivable of 11.8 months, which is the second highest. Average tariff of Rs4.60/m3 covers expenses with low UFW. Staff/1,000 connections ratio is the third highest at 17.2. MCGM needs to improve collection and water availability. Full metering is necessary to account for water use and to determine the extent of losses. It also needs to address staff productivity.
Nagpur Municipal Corporation Nagpur Municipal Corporation (NMC) provides water to its consumers at 100 lpcd at an average of
5 hours per day to 91.5% of the population in its area of responsibility. Production is metered and 40% of service connections have working meters. UFW of 51.9% is the third highest and should be reduced. While operating ratio is good at 0.76, accounts receivable of 9.6 months are the third highest. Average tariff of Rs6.60/m3 is the fifth highest and is covering expenses well. Staff/1,000 connections ratio is the fifth lowest at 3.2. NMC needs to exert efforts to reduce its UFW and improve collection and water availability. Full metering is necessary to account for water use and to determine the extent of losses if UFW is to be reduced.
Nashik Municipal Corporation Nashik Municipal Corporation (NMC) provides water at 93 lpcd to its consumers at an average of 3–4 hours per day to 92.6% of the population in its area of responsibility. It has the highest UFW at 59.5% among the utilities. However, while production is fully metered, only 80% of total connections are metered, making UFW still an estimate. Financial management is mixed with an operating ratio of 1.18 and accounts receivable equivalent of less than a week. Average tariff of Rs4.32/m3 should be able to cover production cost but is hindered by its high NRW. Staff/1,000 connections ratio is good at 3.4 being the fifth lowest. NMC needs to reduce its NRW, and improve on water availability and its financial management, especially its operating ratio. It should meter production and further improve metering of service connections to account for use.
Rajkot Municipal Corporation Rajkot Municipal Corporation (RMC) provides water at 101 lpcd to its consumers at an average of 20 minutes per day to 98.1% of the population in its area of responsibility. UFW is 23.5% with practically no metering for both production and service connections, making the UFW an estimate. Financial management needs improvement with an operating ratio of 1.61 and accounts receivable equivalent of 6.6 months. Average tariff of Rs5.07/m3 is not covering production cost. Staff/1,000 connections ratio is good at 1.1 being the second lowest. RMC needs to address its very low water availability, and high operating ratio and accounts receivable equivalent. It should meter production and

______________________________________________________________________________________________________ Comment and Analysis by Utility 7
service connections to account for use and determine its losses to reduce UFW.
Surat Municipal Corporation Surat Municipal Corporation (SMC) provides water at an average of 2–3 hours per day to 77.4% of the population in its area of responsibility. With practically no metering for both production and service connections, no estimates of UFW and average per capita consumption was made. Financial management needs improvement with an operating ratio of 1.01 and accounts receivable equivalent of 3.1 months. Average tariff of Rs1.66/m3 could not cover production cost. Staff/1,000 connections ratio is good at 1.7 being the third lowest. SMC needs to address its very low water availability and accounts receivable equivalent. It should meter production and service connections to account for use and determine its losses to reduce UFW.
Varanasi Jal Sansthan Varanasi Jal Sansthan (VJS) provides water at 147 lpcd to its consumers at an average of 7 hours per day to 77.7% of the population in its area of responsibility. UFW is 30.0%, which is about average. Production is not metered and while 69% of service connections are metered, none of them are working. Operating ratio of 1.30 and accounts receivable equivalent of 4.9 months need improvement. Average tariff of Rs3.17/m3 seems not enough to cover production cost. Staff/1,000 connections ratio is better than average at 5.9. VJS needs to address its low water availability and further improve on its accounts receivable equivalent and operating ratio. It should meter production and service connections to account for use and determine its losses to reduce UFW. Lower-than-average coverage also needs to be addressed.
Vijayawada Municipal Corporation Vijayawada Municipal Corporation (VMC) provides water at 158 lpcd to its consumers at an average of 2–4 hours per day to 70.5% of the population in its area of responsibility. UFW is 23.8% but production is not metered and only 6.0% of service connections have working meters. Financial management is mixed with an operating ratio of 1.14 and accounts receivable equivalent of 1.60 months, which is the fourth lowest. Average tariff of Rs2.18/m3 is not enough to cover production cost. Staff/1,000 connections ratio is fair at 5.70, which is at the median. VMC needs to address its low water availability and reduce its operating ratio to less than about 0.75. It should meter production and service connections to account for use and determine its losses to reduce UFW. Lower-than-average coverage also needs to be addressed.
Greater Visakhapatnam Municipal Corporation Greater Visakhapatnam Municipal Corporation (GVMC) provides water at 124 lpcd to its consumers at an average of only 1 hour per day to 49.2% of the population in its area of responsibility. UFW is 14.5% but production is not metered and only 1.3% of service connections have working meters. Financial management is good, with an operating ratio of 0.78 and accounts receivable equivalent of 3.3 months. Average tariff of Rs8.55/m3 is enough to cover production cost. Staff/1,000 connections ratio is fair at 5.4, which is at the median. GVMC needs to address its low water availability and population coverage, which is the lowest among the utilities. It should meter production and service connections to account for use and determine its losses to reduce UFW further.
______________________________________________________________________________________________________ 8 2007 Benchmarking and Data Book of Water Utilities in India
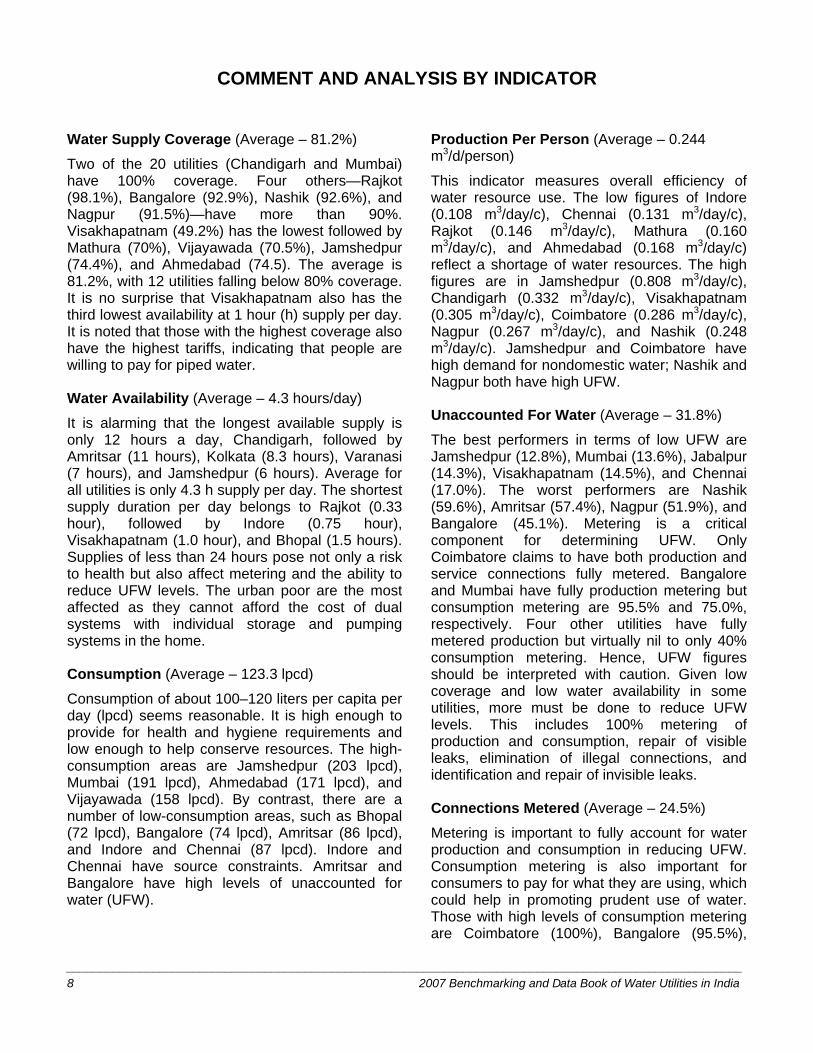
COMMENT AND ANALYSIS BY INDICATOR
Water Supply Coverage (Average – 81.2%)
Two of the 20 utilities (Chandigarh and Mumbai) have 100% coverage. Four others—Rajkot (98.1%), Bangalore (92.9%), Nashik (92.6%), and Nagpur (91.5%)—have more than 90%. Visakhapatnam (49.2%) has the lowest followed by Mathura (70%), Vijayawada (70.5%), Jamshedpur (74.4%), and Ahmedabad (74.5). The average is 81.2%, with 12 utilities falling below 80% coverage. It is no surprise that Visakhapatnam also has the third lowest availability at 1 hour (h) supply per day. It is noted that those with the highest coverage also have the highest tariffs, indicating that people are willing to pay for piped water.
Water Availability (Average – 4.3 hours/day)
It is alarming that the longest available supply is only 12 hours a day, Chandigarh, followed by Amritsar (11 hours), Kolkata (8.3 hours), Varanasi (7 hours), and Jamshedpur (6 hours). Average for all utilities is only 4.3 h supply per day. The shortest supply duration per day belongs to Rajkot (0.33 hour), followed by Indore (0.75 hour), Visakhapatnam (1.0 hour), and Bhopal (1.5 hours). Supplies of less than 24 hours pose not only a risk to health but also affect metering and the ability to reduce UFW levels. The urban poor are the most affected as they cannot afford the cost of dual systems with individual storage and pumping systems in the home.
Consumption (Average – 123.3 lpcd)
Consumption of about 100–120 liters per capita per day (lpcd) seems reasonable. It is high enough to provide for health and hygiene requirements and low enough to help conserve resources. The high-consumption areas are Jamshedpur (203 lpcd), Mumbai (191 lpcd), Ahmedabad (171 lpcd), and Vijayawada (158 lpcd). By contrast, there are a number of low-consumption areas, such as Bhopal (72 lpcd), Bangalore (74 lpcd), Amritsar (86 lpcd), and Indore and Chennai (87 lpcd). Indore and Chennai have source constraints. Amritsar and Bangalore have high levels of unaccounted for water (UFW).
Production Per Person (Average – 0.244 m3/d/person)
This indicator measures overall efficiency of water resource use. The low figures of Indore (0.108 m3/day/c), Chennai (0.131 m3/day/c), Rajkot (0.146 m3/day/c), Mathura (0.160 m3/day/c), and Ahmedabad (0.168 m3/day/c) reflect a shortage of water resources. The high figures are in Jamshedpur (0.808 m3/day/c), Chandigarh (0.332 m3/day/c), Visakhapatnam (0.305 m3/day/c), Coimbatore (0.286 m3/day/c), Nagpur (0.267 m3/day/c), and Nashik (0.248 m3/day/c). Jamshedpur and Coimbatore have high demand for nondomestic water; Nashik and Nagpur both have high UFW.
Unaccounted For Water (Average – 31.8%)
The best performers in terms of low UFW are Jamshedpur (12.8%), Mumbai (13.6%), Jabalpur (14.3%), Visakhapatnam (14.5%), and Chennai (17.0%). The worst performers are Nashik (59.6%), Amritsar (57.4%), Nagpur (51.9%), and Bangalore (45.1%). Metering is a critical component for determining UFW. Only Coimbatore claims to have both production and service connections fully metered. Bangalore and Mumbai have fully production metering but consumption metering are 95.5% and 75.0%, respectively. Four other utilities have fully metered production but virtually nil to only 40% consumption metering. Hence, UFW figures should be interpreted with caution. Given low coverage and low water availability in some utilities, more must be done to reduce UFW levels. This includes 100% metering of production and consumption, repair of visible leaks, elimination of illegal connections, and identification and repair of invisible leaks.
Connections Metered (Average – 24.5%)
Metering is important to fully account for water production and consumption in reducing UFW. Consumption metering is also important for consumers to pay for what they are using, which could help in promoting prudent use of water. Those with high levels of consumption metering are Coimbatore (100%), Bangalore (95.5%),

______________________________________________________________________________________________________ Comment and Analysis by Indicator 9
Nashik (80%), Chandigarh (79%), and Mumbai (75%). Except for Nagpur (40%), the rest have less than 10% metering, with Bhopal, Jabalpur, Mathura, and Varanasi with no metering at all. For Indian water utilities, this is perhaps the single most important area requiring improvement.
Operating Ratio (Average – 1.63)
A low operating ratio means revenues from tariffs cover the operation and maintenance costs comfortably. If we include debt service and depreciation, it will show whether the utility also has the capacity to expand coverage through tariffs without the grants given by most urban local bodies (ULBs). A ratio above 1 means they do not cover these costs. Only one third of the utilities, including Chennai (0.44), Mumbai (0.49), Jamshedpur (0.62), Nagpur (0.76), Visakhapatnam (0.78), Bangalore (0.80), and Coimbatore (0.82), are able to cover their costs. The worst performers requiring much improvement are Indore (5.33), Kolkata (4.73), Mathura (3.05), and Bhopal (2.82), together with nine others with operating ratios of more than 1.0.
Accounts Receivable (Average – 4.9 months)
This indicator is a good measure of the effectiveness of a utility in collecting its receivables or bills. In this case, the receivables are expressed in equivalent of the utility’s average monthly billing. For small utilities, accounts receivable representing less than 2 months of its average billing is manageable; for larger utilities, this could be 3 months. But when it has risen to 6 months or more, it has gone out of hand. Six utilities having accounts receivable of more than 6 months are Mathura (12.3 months), Mumbai (11.8 months), Nagpur (9.6 months), Ahmedabad (8.0 months), Bangalore (7.1 months), and Rajkot (6.6 months). The good performers include Nashik (0.03 month), Jamshedpur (0.3 month), Chennai (1.1 months), and Vijayawada (1.6 months).
Collection Efficiency (Average – 99.5%)
This indicator, along with average tariff, operating ratio, and accounts receivable, impacts on the financial health of a utility. About nine of the utilities have collection efficiencies of 95% or higher. The worst performers (with less than 80% collection efficiencies) are Rajkot (45%), Varanasi (64%), Ahmedabad (67%), Amritsar (69%), and Coimbatore and Jabalpur (75%). Rajkot and Ahmedabad also have high accounts receivable.
These utilities should improve their collection effort and encourage consumers to pay their bills on time. Six utilities—Mumbai (189%), Bhopal (178%), Chennai (152%), Vijayawada (114%), Bangalore (112%), and Mathura (106%)—have collection efficiencies of more than 100%, suggesting that past years’ arrears are being collected.
Average Tariff (Average – Rs4.91/m3)
The average tariff is a good measure of the financial discipline of a utility and its ability to cover operational costs with revenues from tariffs. The water utilities with high average tariffs are Bangalore (Rs20.55/m3), Chennai (Rs10.87/m3), Amritsar (Rs9.34/m3), Visakhapatnam (Rs8.55/m3), Nagpur (Rs6.60/m3), Rajkot (Rs5.07/m3), and Chandigarh (Rs5.04/m3). Despite their high average tariffs, Amritsar and Chandigarh could not cover their operational costs because of high UFW. Those who charge the lowest tariffs are Bhopal (Rs0.60/m3), Mathura (Rs0.62/m3), Kolkata (Rs1.13/m3), Ahmedabad (Rs1.39/m3), and Jabalpur (Rs1.50/m3). Kolkata is not charging its domestic users, resulting in high operating ratio (as with Bhopal and Mathura).
New Connection Fee (Average – Rs1,584)
Apart from reasonable connection fee, allowing payments by installment can assist lower-income households to gain access to direct connection to their homes with significant benefits to their welfare. During the workshop presenting the results of the study, participants from the utilities agreed that Rs2,500 is a reasonable average connection fee. Only Jabalpur and Vijayawada allowed payment by installment over 12 months while the rest required payment prior to connection. However, only Vijayawada (Rs5,500) and Coimbatore (Rs3,000) have connection fees above Rs2,500. Seven utilities have less than Rs1,000 connection fee starting with the lowest, Ahmedabad (Rs100), Jamshedpur (Rs300), Surat (Rs345), Mathura (Rs500), Chandigarh (Rs530), Mumbai (Rs660), and Amritsar (Rs950).

10 2007 Benchmarking and Data Book of Water Utilities in India
Average Capital Expenditure Per Connection (Average – Rs1,591)
Among the utilities with the highest average annual expenditure per connection for capital development are Chennai (Rs10,080), Visakhapatnam (Rs3,892), Mumbai (Rs3,791), Kolkata (Rs2,248), Nashik (Rs1,269), and Surat (Rs1,102). Mumbai, Nashik, and Chennai are among those with the highest coverage while Visakhapatnam has the lowest coverage and is just catching up. Bhopal (Rs39), Varanasi (Rs113), Amritsar (Rs332), Indore (Rs354), and Ahmedabad (Rs427) are five utilities that have invested less than Rs500 per connection per year over the last 5 years. It is not surprising that Amritsar and Ahmedabad, with their low level of capital investment, are among those with the lowest coverage.
Staff Per 1,000 Connections Ratio (Average – 7.4)
This indicator is generally used to measure the efficient use of human resources in a utility as manifested by low staff/1,000 connection ratio. However, two thirds of the utilities have contracted out some of its operations. Those with high staff/1,000 connections ratio are Bhopal (20.7), Indore (18.7), Mumbai (17.2), Kolkata (14.7), Chennai (13.3), and Chandigarh (8.6), with Kolkata and Chandigarh contracting out some services. The utilities with the lowest ratio are Jabalpur (0.4), Rajkot (1.1), Surat (1.7), Ahmedabad (2.2), Nagpur (3.2), and Nashik (3.4). Of this group, only Nagpur and Jabalpur have not contracted out services.

____________________________________________________________________________________________________ Achieving 24/7 Supply – Best Practices in Water Utilities 11
ACHIEVING 24/7 SUPPLY – BEST PRACTICES IN WATER UTILITIES
Introduction Providing 24-hour water supply 7 days a week to India’s growing urban population is possible with political will from the Government and support from the stakeholders, particularly the consumers and civil society. It will require solving chronic inefficiencies in the urban water supply and sanitation sector, which include limited coverage and poor service quality. Previous studies pointed to the underlying problems related to performance of water utilities, such as poor and inadequate investments, poor operation and maintenance (O&M) practices, high nonrevenue water, uneconomic tariff structure and levels, and poor financial management. Poor service delivery is ascribed to inefficient and financially weak utilities that continue to operate without sufficient autonomy, the right incentives, and the necessary accountability to consumers.
Less-than-24-hour water supply exposes consumers to high health risk from contamination entering distribution pipes during vacuum conditions created when water is absent. It makes accurate measurement of consumption impossible. There is evidence that more water is consumed with intermittent supply because people leave their taps open to fill storage, which can often then overflow to waste. The poor suffer the most as they cannot afford the dual system of individual storage and pumping that provides 24-hour supply to the home of the richer segment of the population.
A significant and sustainable improvement in the performance of water utilities is critical to improving services particularly in the areas of customer satisfaction, water resources management, and financial and human resources management.
Customer Satisfaction Customer satisfaction can be measured in
terms of coverage, water availability, and average daily consumption.
Coverage
Many Indian water utilities provide water supply through house connections, public taps, wells with hand pumps, and tankers. The ideal should be provision through pipe connection, which minimizes the risks of contamination from fetching and handling from point sources. Coverage can be increased through appropriate tariffs to finance expansion, as well as through connection fees that can be paid in installments. The urban poor can be connected with lifeline rates and reduced connection fees. Schemes used by small-scale service providers in many parts of Asia for daily billing and collection and distribution for the urban poor should also be explored. Timely redressal of complaints is important in keeping customers satisfied.
Consumption
The average daily consumption of 123 lpcd is sufficient for health requirements and low enough so as not to be wasteful. However, with less than 25% metering of service connections, assessing the actual amount consumed by users is difficult. This is further aggravated by the lack of information on the actual number of people that the utilities serve. While the number of connections is known, the average number of persons that each type of connection serves is not known. This information is not difficult to obtain considering that bill collectors have regular contact with consumers.
Availability
The number of hours of supply per day is the most important service indicator to consumers along with average pressure which, together, determines how much consumers ultimately get from the distribution network. A 24-hour supply is possible regardless of the size of utilities. Many large utilities divide their areas into smaller business units for managers to operate at the lowest possible level and be held

____________________________________________________________________________________________________ 12 2007 Benchmarking and Data Book of Water Utilities in India
accountable for the efficiency of their operations. The costs to the utility and to consumers are less with 24-hour supply. Hydraulics dictate that delivering 123 lpcd over 1 hour will require larger pipes compared to spreading this out over 24 hours. There are costs to wastage and health risks with intermittent supply. The total cost borne by households to get 24-hour supply in the home from intermittent supply by the utility will be more than enough to have the necessary infrastructure for providing 24-hour supply delivered to homes.
Water Resources Management Unaccounted For Water (UFW)
The single most important parameter to indicate performance under water resources management is unaccounted for water (UFW). However, it is equally important that UFW is obtained through accurate measurement of production and consumption with no less than 100% metering of all sources of production and all service connections. Once the levels of UFW at the different areas of the distribution system are determined, the necessary measures can then be taken to reduce losses from all sources to reasonable levels. These include leak detection and control, flushing out illegal connections, meter calibration and replacement, meter protection, training on meter reading to minimize human error, proper supervision during construction, etc. The cost of reducing UFW and the resulting revenue water could be less than the cost of developing new sources for the same amount of recovered losses. At least, it could postpone the development of new sources.
Financial Management The most important measures or indicators of financial management are operating ratio, accounts receivable, and collection efficiency where Indian water utilities are performing poorly. Major factors include tariffs, operating expenses, revenues, and payment arrears.
Operating Ratio
Operating ratio is defined by the operating expenses (excluding debt service and depreciation) and operating revenues. A
healthy utility should have an operating ratio of about 0.75.The average for Indian water utilities is 1.63, which requires huge subsidies from local governments or urban local bodies. A first step in getting the finances of a utility in order is to ring-fence the water utility operations. This will allow management of finances purely from the water utility’s operations. It will require increasing its revenue base, meaning more connections. Tariff level is the most important component of revenues apart from the number of consumers. Reducing the operating ratio will also require reducing operating expenses, which means increasing staff productivity while reducing energy costs and other expenses. For utilities with high energy cost component, energy audits show that using variable-speed motors to suit supply to demand is a way of reducing electric bills. Timely leak interventions reduce costs and losses as well.
Accounts Receivable
Accounts receivable equivalent in months is a measure of collection period or the time it takes to collect water bills. While 2–3 months is reasonable, the average for the Indian water utilities is 4.9 months, with 60% having it greater than 3.0 months. Efficient utilities resort to measures, such as strict disconnection policies against delinquent consumers, information campaigns, collection reminders, incentives and penalty systems for early or late payments, and providing more customer-friendly environment for receiving payments.
Tariffs
In setting tariffs, the first consideration must be a consistent transparent tariff policy endorsed by the Government. Government subsidies to the sector, as well as so-called “cross-subsidies” within the sector, need to be clearly outlined. Demand management through higher rates for high consumption and a lifeline rate where there are urban poor should be considered in the tariff structure. Mechanism for tariff adjustment must be defined. Ideally, an independent regulatory authority to monitor and approve tariffs must be established. Water utilities need to generate from tariffs a cash flow that will cover O&M costs, debt servicing (both capital repayment and interest), and provide a contribution to capital development.
Achieving 24/7 Supply – Best Practices in Water Utilities 13
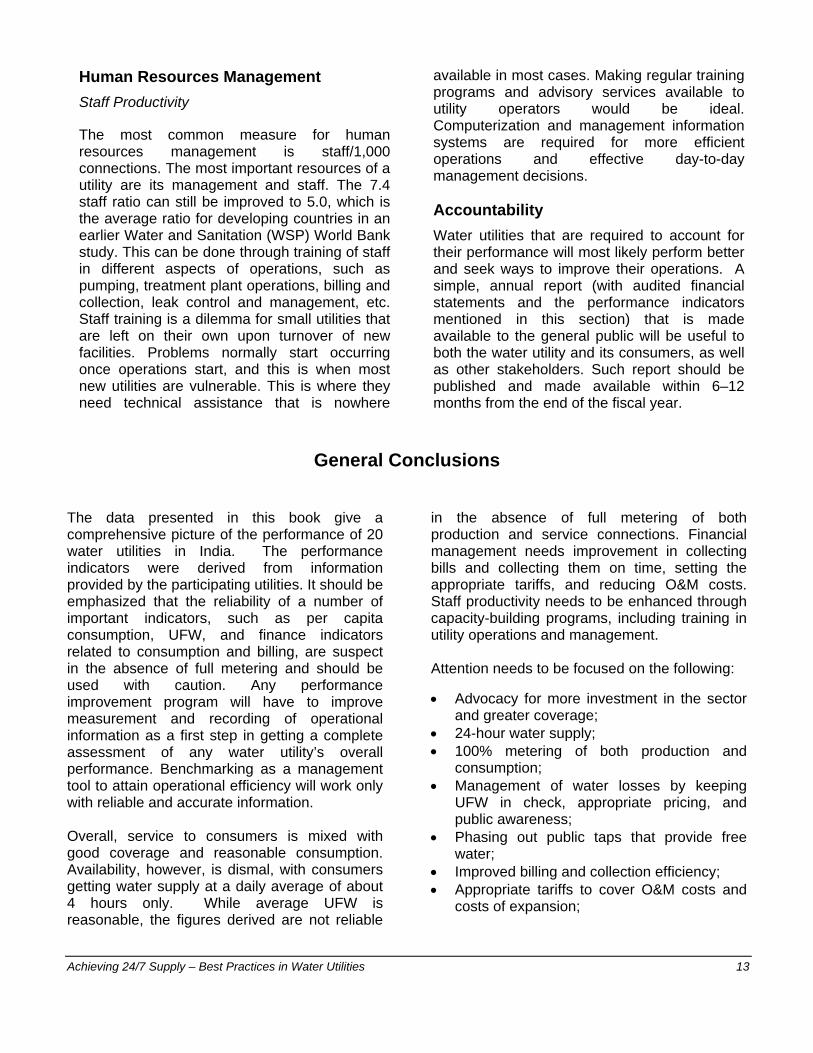
Human Resources Management Staff Productivity
The most common measure for human resources management is staff/1,000 connections. The most important resources of a utility are its management and staff. The 7.4 staff ratio can still be improved to 5.0, which is the average ratio for developing countries in an earlier Water and Sanitation (WSP) World Bank study. This can be done through training of staff in different aspects of operations, such as pumping, treatment plant operations, billing and collection, leak control and management, etc. Staff training is a dilemma for small utilities that are left on their own upon turnover of new facilities. Problems normally start occurring once operations start, and this is when most new utilities are vulnerable. This is where they need technical assistance that is nowhere
available in most cases. Making regular training programs and advisory services available to utility operators would be ideal. Computerization and management information systems are required for more efficient operations and effective day-to-day management decisions.
Accountability Water utilities that are required to account for their performance will most likely perform better and seek ways to improve their operations. A simple, annual report (with audited financial statements and the performance indicators mentioned in this section) that is made available to the general public will be useful to both the water utility and its consumers, as well as other stakeholders. Such report should be published and made available within 6–12 months from the end of the fiscal year.
General Conclusions
The data presented in this book give a comprehensive picture of the performance of 20 water utilities in India. The performance indicators were derived from information provided by the participating utilities. It should be emphasized that the reliability of a number of important indicators, such as per capita consumption, UFW, and finance indicators related to consumption and billing, are suspect in the absence of full metering and should be used with caution. Any performance improvement program will have to improve measurement and recording of operational information as a first step in getting a complete assessment of any water utility’s overall performance. Benchmarking as a management tool to attain operational efficiency will work only with reliable and accurate information. Overall, service to consumers is mixed with good coverage and reasonable consumption. Availability, however, is dismal, with consumers getting water supply at a daily average of about 4 hours only. While average UFW is reasonable, the figures derived are not reliable
in the absence of full metering of both production and service connections. Financial management needs improvement in collecting bills and collecting them on time, setting the appropriate tariffs, and reducing O&M costs. Staff productivity needs to be enhanced through capacity-building programs, including training in utility operations and management. Attention needs to be focused on the following: • Advocacy for more investment in the sector
and greater coverage; • 24-hour water supply; • 100% metering of both production and
consumption; • Management of water losses by keeping
UFW in check, appropriate pricing, and public awareness;
• Phasing out public taps that provide free water;
• Improved billing and collection efficiency; • Appropriate tariffs to cover O&M costs and
costs of expansion;

_____________________________________________________________________________________________________ 14 2007 Benchmarking and Data Book of Water Utilities in India
• Investment in capacity building for staff and management;
• Regular monitoring of performance through appropriate management information systems; and
• Support for services to the urban poor through lifeline rates and installment payment of connection fees.
Performance improvement for each utility will have to be based on the indicators and their operating environment as described in the utility and area profiles in this data book. Additional information will be required in developing performance improvement plans. Utilities are encouraged to learn from those who are performing well by identifying them and communicating with them using the contact details in this book.

PPAARRTT IIII
UUTTIILLIITTIIEESS CCOOMMPPAARRIISSOONNSS (Figures and Tables)


______________________________________________________________________________________________________ Utilities Comparison - Institutions 17
Table 2: Names and Locations of Utilities Area
City State Population Year Name of Utility Ahmedabad Gujarat 4,491,000 2005–2006 Ahmedabad Municipal Corporation
Amritsar Punjab 804,455 2005–2006 Municipal Corporation, Amritsar
Bangalore Karnataka 5,361,500 2005–2006 Bangalore Water Supply and Sewerage Board
Bhopal Madhya Pradesh 1,437,000 2005–2006 Bhopal Municipal Corporation
Chandigarh UT Chandigarh 1,150,000 2005–2006 Municipal Corporation, Chandigarh
Chennai Tamil Nadu 5,320,000 2005–2006 Chennai Metropolitan Water Supply & Sewerage Board
Coimbatore Tamil Nadu 994,000 2005–2006 Coimbatore City Municipal Corporation
Indore Madhya Pradesh 2,200,000 2005–2006 Indore Municipal Corporation
Jabalpur Madhya Pradesh 1,050,000 2005–2006 Jabalpur Municipal Corporation
Jamshedpur Jharkhand 488,000 2005–2006 Jamshedpur Utilities & Services Company, Limited
Kolkata West Bengal 3,998,000 2005–2006 Kolkata Municipal Corporation
Mathura Uttar Pradesh 238,000 2005–2006 Mathura Municipal Council
Mumbai Maharashtra 13,000,000 2005–2006 Municipal Corporation of Greater Mumbai
Nagpur Maharashtra 2,302,990 2005–2006 Nagpur Municipal Corporation
Nashik Maharashtra 1,350,000 2005–2006 Nashik Municipal Corporation
Rajkot Gujarat 980,000 2005–2006 Rajkot Municipal Corporation
Surat Gujarat 2,954,000 2005–2006 Surat Municipal Corporation
Varanasi Uttar Pradesh 1,489,000 2005–2006 Varanasi Jal Sansthan
Vijayawada Andra Pradesh 675,000 2005–2006 Vijayawada Municipal Corporation
Visakhapatnam Andra Pradesh 920,000 2005–2006 Greater Visakhapatnam Municipal Corporation
Table 3: Size of Utilities Production Number of Number of People Utility (m3/day) Utility Connections Utility Staff Utility Served
Mumbai 3,200,000 Ahmedabad 556,734 Mumbai 8,371 Mumbai 13,000,000
Kolkata 971,560 Bangalore 486,850 Chennai 4,578 Bangalore 4,978,330
Bangalore 923,090 Chennai 344,079 Kolkata 3,866 Kolkata 3,948,000
Ahmedabad 623,836 Surat 310,836 Indore 2,979 Ahmedabad 3,716,624
Chennai 623,836 Mumbai 309,226 Bangalore 2,510 Surat 2,954,000
Nagpur 608,220 Nagpur 265,231 Bhopal 2,171 Chennai 2,364,725
Surat 554,685 Kolkata 262,839 Ahmedabad 1,200 Nagpur 2,277,990
Chandigarh 381,280 Rajkot 193,879 Chandigarh 1,196 Indore 1,700,000
Jamshedpur 370,110 Indore 159,104 Nagpur 856 Bhopal 1,418,460
Nashik 310,000 Chandigarh 139,300 Varanasi 676 Nashik 1,250,000
Varanasi 270,000 Amritsar 127,786 Amritsar 617 Varanasi 1,243,000
Bhopal 258,000 Nashik 127,562 Surat 532 Chandigarh 1,150,000
Visakhapatnam 228,451 Varanasi 114,907 Visakhapatnam 466 Rajkot 983,000
Coimbatore 228,400 Coimbatore 113,762 Coimbatore 452 Amritsar 804,455
Indore 183,000 Bhopal 105,012 Vijayawada 445 Coimbatore 799,000
Jabalpur 175,115 Visakhapatnam 85,668 Nashik 440 Jabalpur 790,000
Amritsar 171,005 Vijayawada 78,298 Jamshedpur 298 Visakhapatnam 750,000
Rajkot 143,836 Jabalpur 46,260 Rajkot 211 Vijayawada 600,000
Vijayawada 131,833 Jamshedpur 38,800 Mathura 160 Jamshedpur 458,000
Mathura 38,172 Mathura 24,643 Jabalpur 17 Mathura 238,000

Figure 2: Capital Expenditure Per Connection
Figure 1: Type of Water Utility
Darasa
Tibal-og
Jagna
Nueva Vizcaya
Tagbilaran Calapan
Bansalan
Metro Carigara
Guimba
Muñoz
San Francisco
Santa Rosa
Silay
Tandag
Victorias
No. of Utilities
0 1,000 2,000 3,000 4,000 5,000
Chennai
Visakhapatnam
Mumbai
Kolkata
Nashik
Surat
Jamshedpur
Coimbatore
Jabalpur
Rajkot
Bangalore
Chandigarh
Nagpur
Mathura
Ahmedabad
Indore
Amritsar
Varanasi
Bhopal
Capital Expenditure (Rs per connection)
10,080
Utilities
0
2
4
6
8
10
Municipal Council Municipal Corporation Private City Board Autonomous LocalBody
(15)
AhmedabadAmritsarBhopal
ChandigarhCoimbatore
IndoreJabalpurKolkataMumbaiNagpurNashikRajkotSurat
VijayawadaViskhapatnam
JamshedpurBangaloreChennai
No. of Utilities
Mathura Varanasi
18 2007 Benchmarking and Data Book of Water Utilities in India

Figure 3: Production Volume
Figure 4: Storage Capacity
0.000 0.200 0.400 0.600 0.800 1.000
Mumbai
Kolkata
Bangalore
Ahmedabad
Chennai
Nagpur
Surat
Chandigarh
Jamshedpur
Nashik
Varanasi
Bhopal
Visakhapatnam
Coimbatore
Indore
Jabalpur
Amritsar
Rajkot
Vijayawada
Mathura
Production (million cubic meters per day)
Utilities
0 200 400 600 800 1,000
Mumbai
Ahmedabad
Kolkata
Chennai
Chandigarh
Rajkot
Nagpur
Coimbatore
Indore
Nashik
Bhopal
Visakhapatnam
Varanasi
Bangalore
Jabalpur
Vijayawada
Jamshedpur
Surat
Amritsar
Mathura
Storage Capacity (1,000 cubic meters)
Utilities
3.2
Utilities Comparison - Production 19

Figure 5: Production Metering
Figure 6: Water Coverage
Metro Carigara
Darasa
Nueva Vizcaya
Padada
San Pedro MPC
San Pedro RACI
Calapan
Bansalan
No. of Utilities
Tibal-og
Jagna
Tagbilaran
Argao
Buhi
Guimba
Muñoz
San Francisco
Sta. Rosa
Silay
Tandag
Percentage of production metered
Utilities
0
2
4
6
8
10
12
14
100% metered No metering
Percentage of Production Metered
BangaloreChennai
CoimbatoreJamshedpur
MumbaiNagpurSurat
No. of Utilities
AhmedabadAmritsarBhopal
ChandigarhIndore
JabalpurKolkataMathuraNashikRajkot
VaranasiVijayawada
Visakhapatnam
0 20 40 60 80 100
Chandigarh
Mumbai
Rajkot
Bangalore
Nashik
Nagpur
Chennai
Bhopal
Kolkata
Varanasi
Surat
Indore
Coimbatore
Amritsar
Jabalpur
Ahmedabad
Jamshedpur
Vijayawada
Mathura
Visakhapatnam
Percent of Total Population
Utilities
20 2007 Benchmarking and Data Book of Water Utilities in India

Figure 7: Water Availability
Figure 8: Water Use
0.0 4.0 8.0 12.0 16.0 20.0 24.0
Chandigarh
Amritsar
Kolkata
Varanasi
Jamshedpur
Chennai
Nagpur
Bangalore
Jabalpur
Mumbai
Nashik
Coimbatore
Vijayawada
Surat
Ahmedabad
Mathura
Bhopal
Visakhapatnam
Indore
Rajkot
Average Number of Hours Per Day
Utilities
0 20 40 60 80 100
Mathura*
Ahmedabad*
Surat*
Indore*
Mumbai
Vijayawada
Rajkot
Chennai
Varanasi
Jabalpur
Kolkata
Bangalore
Chandigarh
Visakhapatnam
Amritsar
Bhopal
Coimbatore
Nagpur
Nashik
Jamshedpur
Percent
Domestic Others UFW
Other use includes industrial, commercial,and institutional.
Utilities
* Indore, Surat, Ahmedabad & Mathura excludes UFW
Utilities Comparison - Service 21
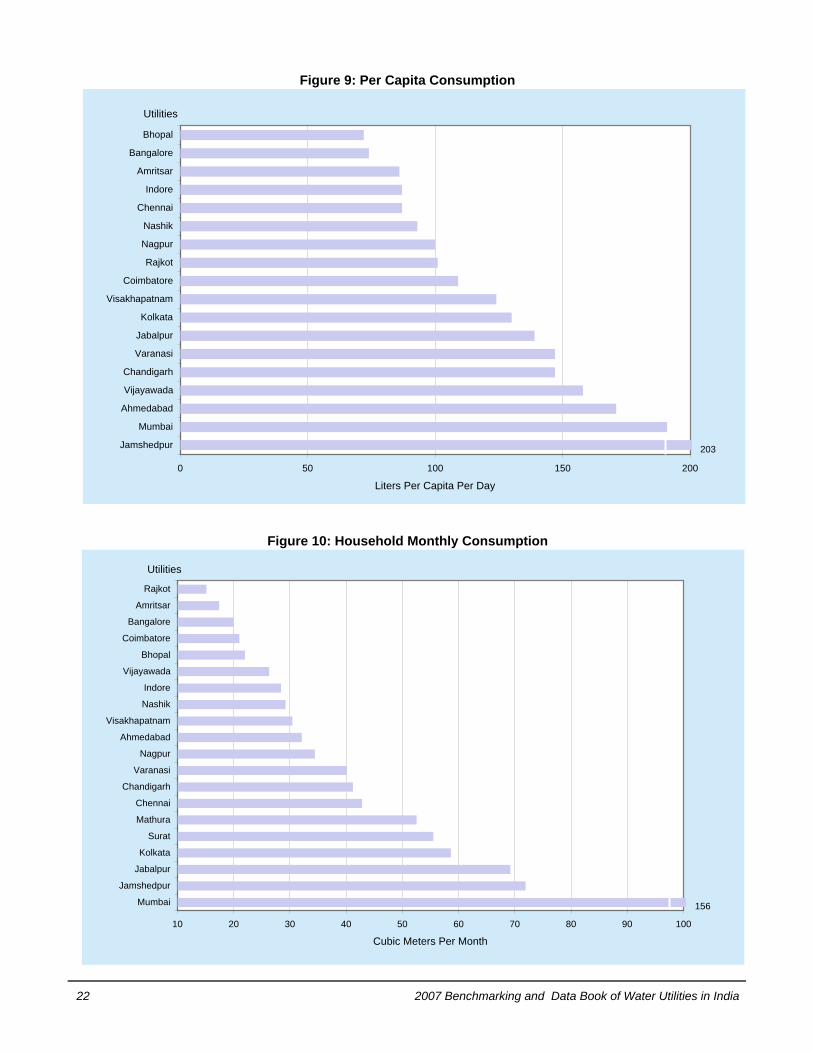
Figure 9: Per Capita Consumption
Figure 10: Household Monthly Consumption
0 50 100 150 200
Jamshedpur
Mumbai
Ahmedabad
Vijayawada
Chandigarh
Varanasi
Jabalpur
Kolkata
Visakhapatnam
Coimbatore
Rajkot
Nagpur
Nashik
Chennai
Indore
Amritsar
Bangalore
Bhopal
Liters Per Capita Per Day
Utilities
10 20 30 40 50 60 70 80 90 100
Mumbai
Jamshedpur
Jabalpur
Kolkata
Surat
Mathura
Chennai
Chandigarh
Varanasi
Nagpur
Ahmedabad
Visakhapatnam
Nashik
Indore
Vijayawada
Bhopal
Coimbatore
Bangalore
Amritsar
Rajkot
Cubic Meters Per Month
Utilities
203
156
22 2007 Benchmarking and Data Book of Water Utilities in India

Figure 11: Household Monthly Bill
Figure 12: Unaccounted For Water
0 10 20 30 40 50 60
Nashik
Amritsar
Nagpur
Bangalore
Coimbatore
Chandigarh
Kolkata
Varanasi
Vijayawada
Rajkot
Chennai
Visakhapatnam
Jabalpur
Mumbai
Jamshedpur
Percentage Unaccounted For Water
Utilities
0 50 100 150 200 250 300
Mumbai
Bangalore
Amritsar
Varanasi
Nashik
Chennai
Jamshedpur
Coimbatore
Jabalpur
Vijayawada
Indore
Visakhapatnam
Rajkot
Ahmedabad
Surat
Bhopal
Mathura
Kolkata
Rs Per Month
Utilities
708.46
Utilities Comparison - Service 23

Figure 13: Consumer Metering
Figure 14: Staff Per 1,000 Connections
0
2
4
6
8
10
<1% 10–1% 99–40% 100%
Percentage of Connections Metered
JamshedpurRajkotIndore
KolkataBhopal
JabalpurMathuraVaranasi
Coimbatore
No. of Utilities
BangaloreNashik
ChandigarhMumbaiNagpur
VijayawadaAmritsarChennai
AhmedabadSurat
Visakhapatnam
0 5 10 15 20 25
Bhopal
Indore
Mumbai
Kolkata
Chennai
Chandigarh
Mathura
Varanasi
Vijayawada
Jamshedpur
Visakhapatnam
Bangalore
Amritsar
Coimbatore
Nashik
Nagpur
Ahmedabad
Surat
Rajkot
Jabalpur
Staff Per 1,000 Connections
Utilities
24 2007 Benchmarking and Data Book of Water Utilities in India

Figure 15: Average Tariff
Figure 16: Unit Production Cost
0.00 5.00 10.00 15.00 20.00 25.00
Bangalore
Chennai
Amritsar
Visakhapatnam
Nagpur
Rajkot
Chandigarh
Mumbai
Jamshedpur
Nashik
Coimbatore
Varanasi
Indore
Vijayawada
Surat
Jabalpur
Ahmedabad
Kolkata
Mathura
Bhopal
Average Tariff (Rs per cubic meter)
Utilities
0.00 3.00 6.00 9.00 12.00 15.00
Indore
Bangalore
Chennai
Visakhapatnam
Chandigarh
Amritsar
Mumbai
Kolkata
Bhopal
Rajkot
Jamshedpur
Vijayawada
Varanasi
Mathura
Nagpur
Nashik
Surat
Jabalpur
Ahmedabad
Coimbatore
Production Cost (Rs per cubic meter)
Utilities
Utilities Comparison - Management 25
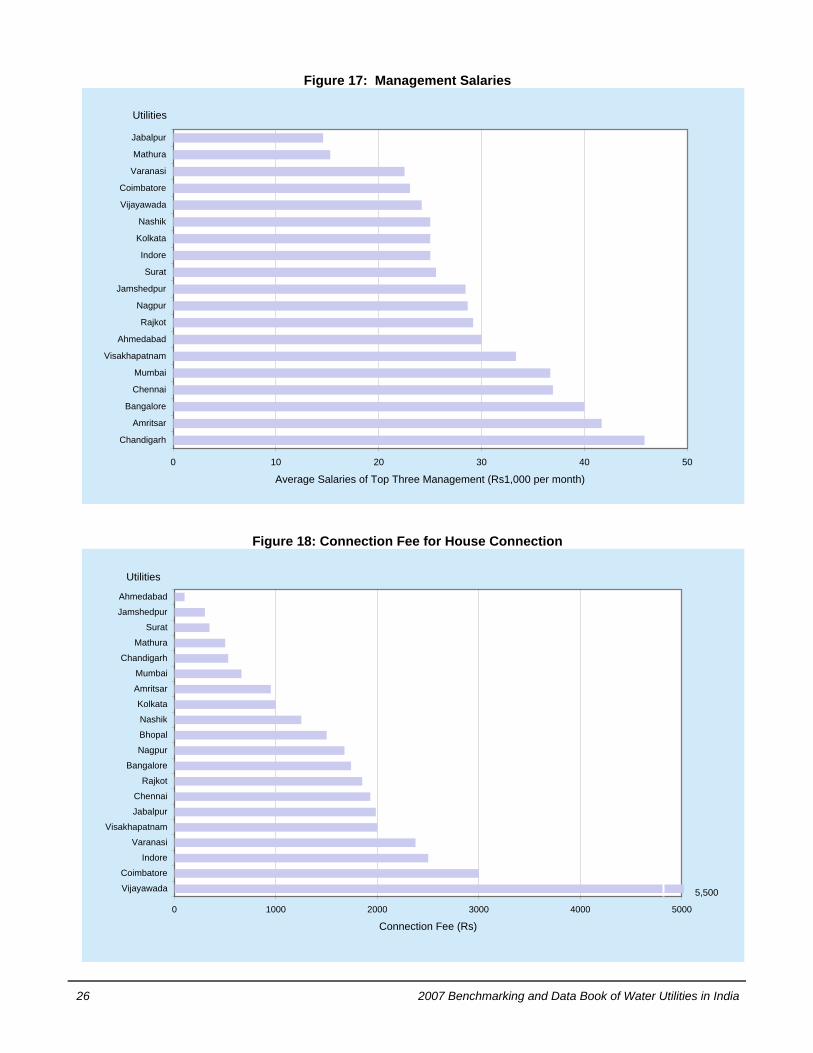
Figure 17: Management Salaries
Figure 18: Connection Fee for House Connection
0 10 20 30 40 50
Chandigarh
Amritsar
Bangalore
Chennai
Mumbai
Visakhapatnam
Ahmedabad
Rajkot
Nagpur
Jamshedpur
Surat
Indore
Kolkata
Nashik
Vijayawada
Coimbatore
Varanasi
Mathura
Jabalpur
Average Salaries of Top Three Management (Rs1,000 per month)
Utilities
0 1000 2000 3000 4000 5000
Vijayawada
Coimbatore
Indore
Varanasi
Visakhapatnam
Jabalpur
Chennai
Rajkot
Bangalore
Nagpur
Bhopal
Nashik
Kolkata
Amritsar
Mumbai
Chandigarh
Mathura
Surat
Jamshedpur
Ahmedabad
Connection Fee (Rs)
Utilities
5,500
26 2007 Benchmarking and Data Book of Water Utilities in India

Utilities Comparison – Management 27
Table 4: Priority Needs of Utility
Utility Priority Needs
Ahmedabad Regular, adequate, safe water supply to citizens
All water supplies must be surface water
Water audit
Amritsar Institutional improvement Access survey and management Leak detection and control
Bangalore Reduce unaccounted for water Reuse water for potable uses and industries
Ensure no flow of sewage in storm water drains
Bhopal 24-hour water supply to all Detect leak to control UFW Meeting the future needs of growing population
Chandigarh Water supply Sewage treatment plant Storm water drainage
Chennai Water conservation Safe disposal of sewage Source identification and development
Coimbatore Nonrevision of tariffs in nearly 10 years
Shortage of staff with ban on fresh recruitments
Limited role of private sector
Indore Augmentation of water supply system capacity
Increase in revenue to make system sustainable
Upgrade existing distribution system
Jabalpur Leakage control Zoning of water distribution system Collection improvement – realization of cess
Jamshedpur Increase service coverage 24 x 7 supply with 100% metering Reduction of nonrevenue water
Kolkata Water supply network management
Management of UFW reduction 24 x 7 water supply with 100% metering
Mathura Master plan for distribution system
Rehabilitation in core of city and expansion
Metering and computerization for billing and collection
Mumbai Reduce UFW Distribution management from service reservoir to consumer end
GIS-based network interlinked with SCADA
Nagpur Reduce raw water losses Rehabilitation and upgrade existing infrastructure
Upgrade and improvement of existing distribution network
Nashik Full coverage in terms of population and area
Reduction in water losses Augmentation of water supply systems for year 2026 requirement
Rajkot Source augmentation Minimize leaks 100% cost recovery
Surat Reducing pollution of its present source of raw water
Exploring alternate sources of water
Rationalize water tariff for sustainability
Varanasi Revenue – billing and collection
Regular supply of potable water to citizens
Upgrade, extension, and improved maintenance of existing water supply
Vijayawada Every house to be provided with a tap
Accountability Decrease in NRW
Visakhapatnam Water supply improvement in quantity and quality
Refurbish and extend the distribution system at uniform service levels
100% coverage with 24 x 7 supply
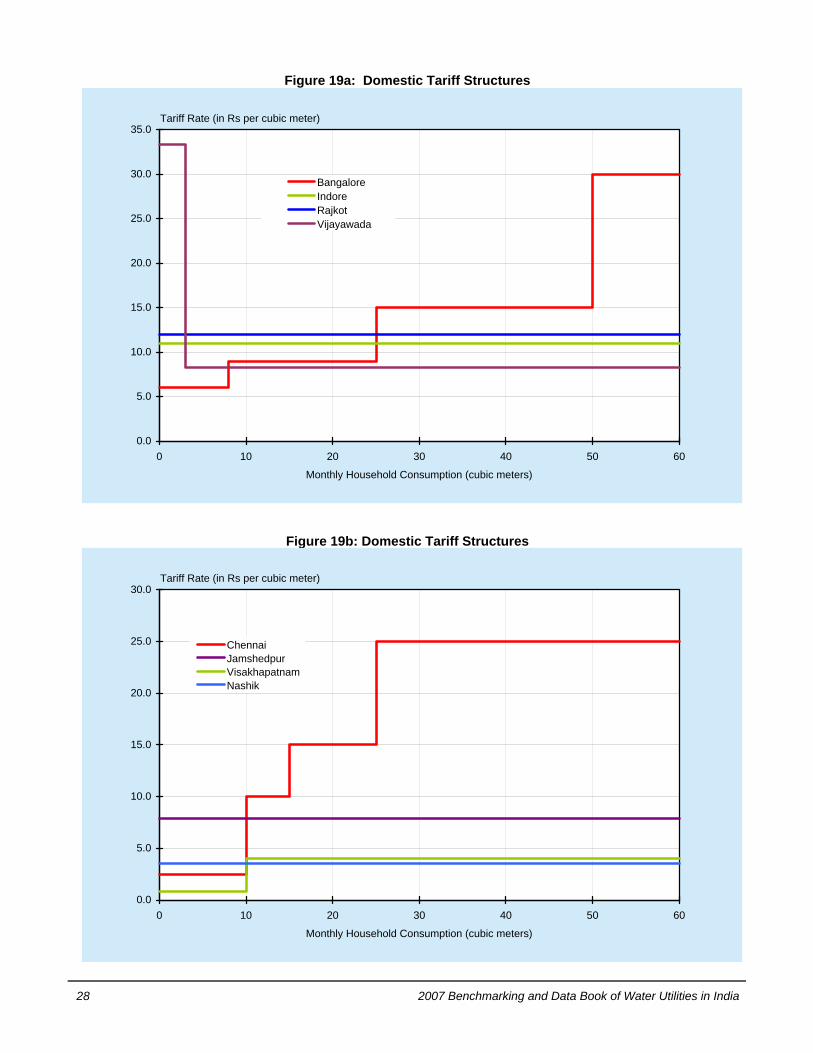
Figure 19a: Domestic Tariff Structures
Figure 19b: Domestic Tariff Structures
Group 2
0.0
5.0
10.0
15.0
20.0
25.0
30.0
35.0
0 10 20 30 40 50 60
Monthly Household Consumption (cubic meters)
BangaloreIndoreRajkotVijayawada
Tariff Rate (in Rs per cubic meter)
0.0
5.0
10.0
15.0
20.0
25.0
30.0
0 10 20 30 40 50 60
Monthly Household Consumption (cubic meters)
ChennaiJamshedpurVisakhapatnamNashik
Tariff Rate (in Rs per cubic meter)
28 2007 Benchmarking and Data Book of Water Utilities in India
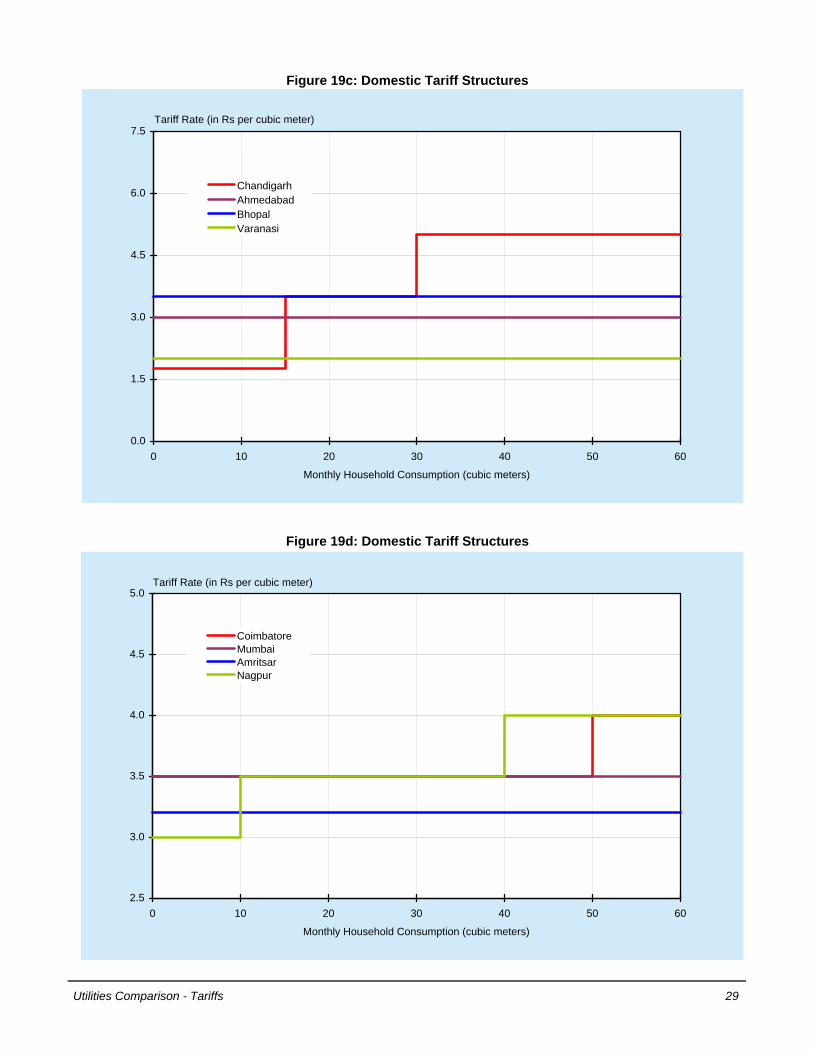
Figure 19c: Domestic Tariff Structures
Figure 19d: Domestic Tariff Structures
0.0
1.5
3.0
4.5
6.0
7.5
0 10 20 30 40 50 60
Monthly Household Consumption (cubic meters)
ChandigarhAhmedabadBhopalVaranasi
Tariff Rate (in Rs per cubic meter)
2.5
3.0
3.5
4.0
4.5
5.0
0 10 20 30 40 50 60
Monthly Household Consumption (cubic meters)
CoimbatoreMumbaiAmritsarNagpur
Tariff Rate (in Rs per cubic meter)
Utilities Comparison - Tariffs 29

Figure 20: Operating Ratio
Figure 21: Accounts Receivable
0.0 2.5 5.0 7.5 10.0 12.5
Mathura
Mumbai
Nagpur
Ahmedabad
Bangalore
Rajkot
Amritsar
Indore
Varanasi
Bhopal
Visakhapatnam
Surat
Coimbatore
Jabalpur
Kolkata
Vijayawada
Chennai
Jamshedpur
Nashik
Accounts Receivable (months equivalent)
Utilities
0.00 1.00 2.00 3.00 4.00 5.00
Indore
Kolkata
Mathura
Bhopal
Jabalpur
Rajkot
Ahmedabad
Amritsar
Chandigarh
Varanasi
Nashik
Vijayawada
Surat
Coimbatore
Bangalore
Visakhapatnam
Nagpur
Jamshedpur
Mumbai
Chennai
Operating Ratio (O&M costs/revenue)
Utilities
5.03
30 2007 Benchmarking and Data Book of Water Utilities in India
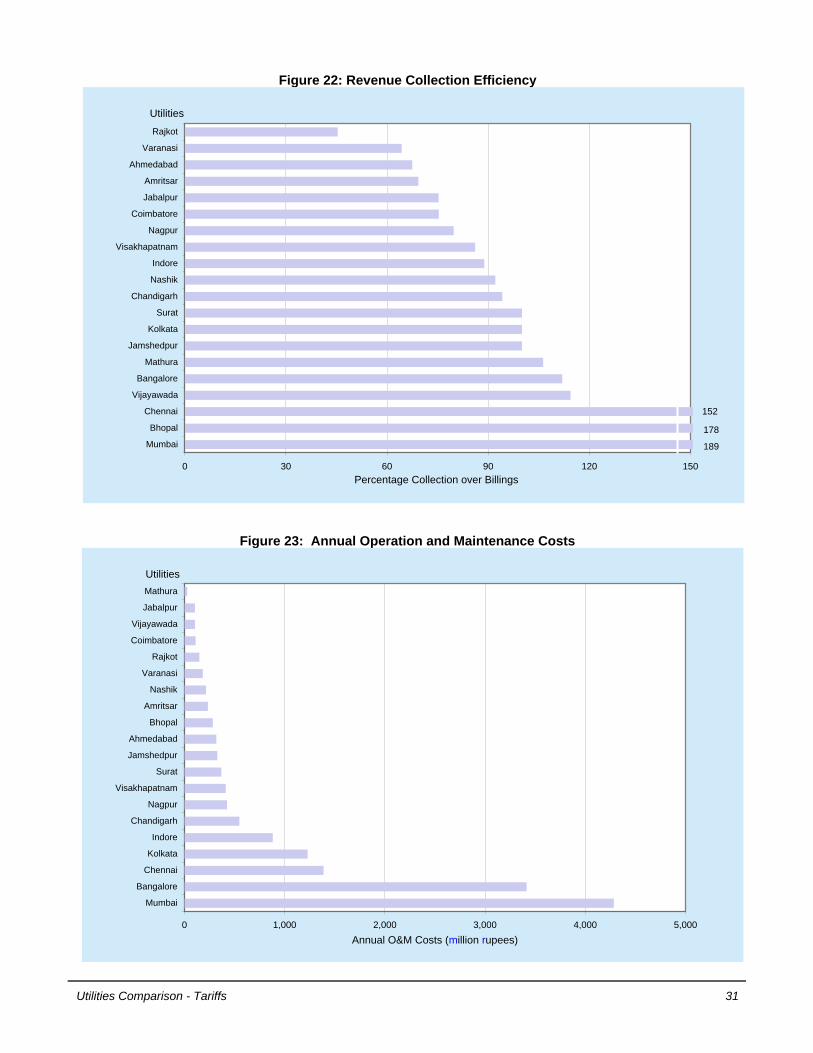
Figure 22: Revenue Collection Efficiency
Figure 23: Annual Operation and Maintenance Costs
0 30 60 90 120 150
Mumbai
Bhopal
Chennai
Vijayawada
Bangalore
Mathura
Jamshedpur
Kolkata
Surat
Chandigarh
Nashik
Indore
Visakhapatnam
Nagpur
Coimbatore
Jabalpur
Amritsar
Ahmedabad
Varanasi
Rajkot
Percentage Collection over Billings
152
Utilities
178
0 1,000 2,000 3,000 4,000 5,000
Mumbai
Bangalore
Chennai
Kolkata
Indore
Chandigarh
Nagpur
Visakhapatnam
Surat
Jamshedpur
Ahmedabad
Bhopal
Amritsar
Nashik
Varanasi
Rajkot
Coimbatore
Vijayawada
Jabalpur
Mathura
Annual O&M Costs (million rupees)
Utilities
189
Utilities Comparison - Tariffs 31
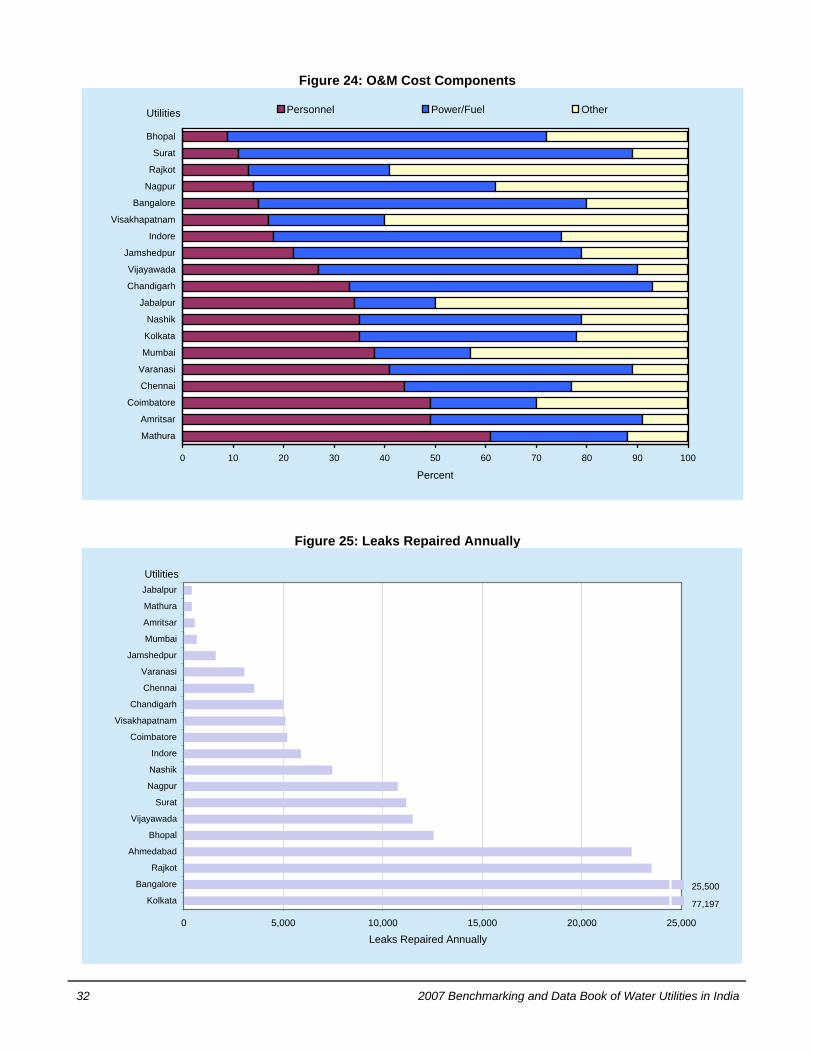
Figure 24: O&M Cost Components
Figure 25: Leaks Repaired Annually
0 10 20 30 40 50 60 70 80 90 100
Mathura
Amritsar
Coimbatore
Chennai
Varanasi
Mumbai
Kolkata
Nashik
Jabalpur
Chandigarh
Vijayawada
Jamshedpur
Indore
Visakhapatnam
Bangalore
Nagpur
Rajkot
Surat
Bhopal
Percent
Personnel Power/Fuel OtherUtilities
0 5,000 10,000 15,000 20,000 25,000
Kolkata
Bangalore
Rajkot
Ahmedabad
Bhopal
Vijayawada
Surat
Nagpur
Nashik
Indore
Coimbatore
Visakhapatnam
Chandigarh
Chennai
Varanasi
Jamshedpur
Mumbai
Amritsar
Mathura
Jabalpur
Leaks Repaired Annually
Utilities
77,197
25,500
32 2007 Benchmarking and Data Book of Water Utilities in India

Figure 26: Meters Replaced Annually
Figure 27: Water Quality Sampling
0 2,000 4,000 6,000 8,000 10,000
Bangalore
Chandigarh
Coimbatore
Nagpur
Amritsar
Visakhapatnam
Surat
Indore
Jamshedpur
Ahmedabad
Bhopal
Jabalpur
Kolkata
Mathura
Rajkot
Varanasi
Meters Replaced Annually
37,145
Utilities
0 20 40 60 80 100
Amritsar
Bangalore
Bhopal
Chandigarh
Chennai
Coimbatore
Indore
Jabalpur
Jamshedpur
Kolkata
Mathura
Mumbai
Nagpur
Nashik
Rajkot
Surat
Varanasi
Vijayawada
Visakhapatnam
Number of Samples Passed/Failed (1,000 samples)
Utilities
218/24
108/0.8
730/0.1
Utilities Comparison - Operation and Maintenance 33

Figure 28: Complaints Received Annually
Figure 29: New Connections Annually
0 10 20 30 40 50
Chennai
Mumbai
Ahmedabad
Bangalore
Nagpur
Jamshedpur
Vijayawada
Visakhapatnam
Varanasi
Surat
Rajkot
Coimbatore
Chandigarh
Bhopal
Amritsar
Jabalpur
Indore
Nashik
Complaints Received Annually (1,000 complaints)
Utilities
156.9
100.0
0.0 3.0 6.0 9.0 12.0 15.0
Bangalore
Nashik
Surat
Mumbai
Chennai
Rajkot
Nagpur
Amritsar
Vijayawada
Coimbatore
Chandigarh
Jamshedpur
Indore
Visakhapatnam
Bhopal
Ahmedabad
Varanasi
Kolkata
Jabalpur
Mathura
New Connections Per Year (1,000 connections)
28.6
Utilities
34 2007 Benchmarking and Data Book of Water Utilities in India
PPAARRTT IIIIII
WWAATTEERR UUTTIILLIITTYY AANNDD AARREEAA PPRROOFFIILLEESS

36 2007 Benchmarking and Data Book of Water Utilities in India
AHMEDABAD Utility Profile
Water Utility
AHMEDABAD MUNICIPAL CORPORATION
Address : Water Project Division, 2nd Floor, Sardar Patel Bhavan, Danapith, Ahmedabad – 380 001, India Telephone : 91 79 2539 1811 Fax : 91 79 2538 1746 E-mail : [email protected] Head : Mr. T. M. Lad, Special City Engineer
Ahmedabad Municipal Corporation (AMC) is a municipal corporation established in 1950. It provides water supply and sewerage services for the city of Ahmedabad, which has a total population of 4,990,000 people. The present service area of AMC has a population density of 26,110 persons/km2. The utility is responsible for water production, distribution, and source development and draws water from the River Sabarmati and Mahi River, as well as from 400 tube wells. The private sector is involved in water production and operations and maintenance through a management contract. The utility is following a development plan covering 2005–2021. Billing and pumping operations are computerized. The utility has a partly-developed management information system.
Mission Statement No mission statement
General Data
About Water Utility
Connections : 556,734 Staff : 1,200 Annual O&M Costs : Rs318,086,000 Annual Revenue : Rs222,600,000 Annual Billings : Rs330,000,000 Total Capital Expenditure : Rs1,189,330,000 Average capital expenditure/connection/year: Rs427.25 (Over the last 5 years) Source of Investment Funds : No data
Tariff Structure
METERED Residential Nonresidential FLAT RATE: Annual Water and Sewerage Charges
Pipe Size (inch) Commercial Aircon/Chantar Residential Annual Rates (Rs) ½”, ¾”, 1” dia. Rs3/m3 Rs8/m3 Rs20/m3 Chawls up to 25 m2 Free
ANNUAL PRORATA CHARGES (Rs/year) – 3’’ to 4” main 25 – 50 m2 100 ½” 879 2,344 5,860 50 – 100 m2 200 ¾” 2,424 6,464 16,160 Above 100 m2 300 1” 4,986 13,296 33,240 Above 200 m2 1,500 ANNUAL PRORATA CHARGES (Rs/year) – 4’’ to 9” main Nonresidential Annual Rates (Rs) ½” 1,065 2,840 7,100 Buildings 400 ¾” 2,958 7,888 19,720 Industrial/Factories 600 1” 6,105 16,280 40,700 Buildings > 150 m2 1,500
Notes: 1. Almost all consumers pay on flat rate annually with the property tax bill. Annual prorata charges are based on the connecting pipe size and the size of the water main to which it connects ranging from 3” to 12”. 2. There were 1,919 new connections in 2005–2006. Prices of new domestic water connection are Rs100 for ½” diameter pipe; Rs600 for ¾”; and Rs1,200 for 1” payable prior to connection.
Priority Needs
of Utility
1. Regular, adequate, safe water supply to citizens
2. All water supplies must be surface water
3. Water audit
Consumer
Service
Average monthly consumption is about 32.1 m3 per connection. The water bill averages Rs49.40 per month per connection. Water is available on an average of 2 hours a day to most users at average pressure of 1.5 meters. Applicants have to wait for about a week for a new connection to be made. The utility claims that sampling for chlorine residual is done daily and most pass the test. There were 30,000 consumers complaints recorded in 2005–2006. Consumers can complain in person at the water utility office or by telephone or letter. The urban poor are provided with free water.
Performance
Highlights
AMC provides water at 171 lpcd to its consumers at an average of 2 hours per day to 74.5% of the population in its area of responsibility. Production is not metered and only 3% of total connections are metered. Meters are being phased out. No reliable estimate of UFW can be obtained. While operating ratio at 0.96 shows billing can cover operations and maintenance costs, accounts receivable equivalent of 8 months require more efforts in collection. Average tariff of Rs1.39/m3 is just about able to cover production cost of Rs1.34/m3. Staff/1,000 connections ratio is good at 2.2, the fourth lowest. AMC needs to improve water availability and collection of its receivables. It should take serious efforts in measuring its production and service connections to determine its losses and reduce them as well. Water bills should also be based on actual consumption as a means to conserve water.

Area Profile AHMEDABADAHMEDABAD WATER SUPPLY
Population: 4,491,000 1
Production/Distribution
Average Daily Production 623,836 m3
Groundwater 7%Surface Water 93%Treatment Type 2 ConventionalStorage 650,000 m3
Service Area 3 172 sq kmDistribution Length 2,747 km
Service Connections
House (5 persons/HC) 546,734Public Tap (— persons/PT) NilCommercial 10,000Industrial NilInstitutional NilBulk NilOther NilTotal 556,734
Service Indicators
Service Coverage 4 74.5%Water Availability 5 2 hours/dayPer Capita Consumption 171 l/c/dAverage Tariff Rs1.39/m3
Efficiency Indicators
Unaccounted Water 6 no dataUnit Production Cost Rs1.34/m3
Operating Ratio 0.96Accounts Receivable 8.0 monthsStaff/1,000 Connections 2.2
Notes:1 The population is for the present area served by the utility.2 Residual chlorine test samples are claimed to be taken daily and mostly all pass the test.3 The total area of responsibility is 449 sq km.4 This is the percentage of population served by house connections and public taps. Those not served
by the utility use tube wells. The urban poor comprise 35% of the population.5 About 30,000 consumer complaints were registered in 2005–2006.6 Production is not metered. Only 3% of connections are metered but meters are being phased out.
Realistic UFW estimate cannot be determined with figures given.About 20,000–25,000 pipe breaks and leaks repaired during the year.
7 This is the breakdown of consumption only.
Data as of 2005–2006.
No breakdown given
Domestic 98%
Commercial Industrial 2%
Annual Water BillingsRs330,000,000
Annual O&M CostsRs318,086,000
Annual Water Use7
237,250,000 m3
No breakdown given
Ahmedabad 37

38 2007 Benchmarking and Data Book of Water Utilities in India
AMRITSAR Utility Profile
Water Utility
MUNICIPAL CORPORATION, AMRITSAR
Address : Town Hall, Amritsar, India Telephone : 91 183 255 2528 Fax : 91 183 254 5155 E-mail : [email protected] Head : Mr. Amardeep S. Dhaliwal, Superintending Engineer (O&M Cell)
Municipal Corporation, Amritsar (MCA) is a municipal corporation established in 1976. It provides water supply and sewerage services for the city, which has a total population of 1,058,500 people. The present service area of MCA has a population density of 7,810 persons/km2. The utility is responsible for water production and distribution. It draws water from groundwater sources through 260 tube wells. The private sector is not involved in the utility’s operations nor does it have a master development plan. MCA has a computerized billing system and so are the house tax and pension cell. The utility has a partly developed management information system.
Mission
Statement
No mission statement.
General Data
About Water Utility
Connections : 127,786 Staff : 617 Annual O&M Costs : Rs233,666,000 Annual Revenue : Rs171,980,000 Annual Billings : Rs248,270,000 Total Capital Expenditure : Rs211,867,000 Average capital expenditure/connection/year: Rs331.60 (Over the last 5 years) Source of Investment Funds : Internally generated reserves and government loan from HUDCO
Tariff Structure UNMETERED CONNECTIONS (Domestic)
Plot Size Rate (Rs/month) Up to 5 marla* 60.00 Above 5 marla & up to 10 marla 90.00 Above 10 marla but less than 1 kanal 120.00
METERED CONNECTIONS (Rs/m3) Domestic 3.20 Commercial 6.40 * Waived as of 11 July 2006. 5 marla = 125 sq yards, 1 kanal = 500 sq yards.
Domestic metered connections are residences with plots of 1 kanal and above. Notes: 1. Institutional and commercial consumers pay on metered use. Domestic users pay a flat rate based on plot sizes with 5 marla domestic connections exempted from payments as of 11 July 2006. All consumers are billed every 3 months. 2. Water bills are paid at the water utility office. 3. There were 3,970 new connections in 2005–2006. The price of a new domestic connection is Rs950 payable prior to connection.
Priority Needs of Utility 1. Institutional improvement 2. Access survey and management 3. Leak detection and control
Consumer Service
Average monthly consumption is about 17.4 m3 per house connection. The water bill averages Rs136.86 per month per house connection. Water is available on an average of 11 hours a day to most users, the second longest to Chandigarh’s 12 hours, and at an average pressure of 2 meters. Applicants have to wait for about 2–3 days for a new connection to be made. A connection fee has to be paid prior to connection. Water quality is good, with 92% of 125 water samples taken during the year passing the residual chlorine test. There were 1,000 consumers complaints recorded and 550 leaks repaired during the year. Consumers can complain in person at the water utility office or by telephone, e-mail, and letter. The urban poor use public taps.
Performance Highlights
MCA provides water at 86 lpcd to its consumers at an average of 11 hours per day to 75.7% of the population in its area of responsibility. It has the second highest UFW at 57.4% among the utilities. Production is not metered and only 45% of commercial and industrial connections are metered, making UFW an estimate at best. Financial management needs improvement with operating ratio of 1.36 and accounts receivable of 5.6 months. Average tariff of Rs9.34/m3 should easily cover production cost but is hindered by its high NRW. Staff/1,000 connections ratio is better than average at 4.8. MCA needs to reduce its NRW and improve on water availability and quantity. It also needs to improve on its collection efforts. The utility should meter production and further improve metering of connections to account for use.

Area Profile AMRITSARAMRITSAR WATER SUPPLY
Population: 804,455 1
Production/Distribution
Average Daily Production 171,005 m3
Groundwater 100%Surface Water NilTreatment Type 2 DisinfectionStorage 24,000 m3
Service Area 3 103 sq kmDistribution Length 952 km
Service Connections
House (6–7 persons/HC) 115,275Public Tap (100 persons/PT) 747Commercial 10,834Industrial 930Institutional NilBulk NilOther NilTotal 127,786
Service Indicators
Service Coverage 4 75.7%Water Availability 5 11 hours/dayPer Capita Consumption 86 l/c/dAverage Tariff Rs9.34/m3
Efficiency Indicators
Unaccounted Water 6 57.4%Unit Production Cost Rs3.74/m3
Operating Ratio 1.36Accounts Receivable 5.6 monthsStaff/1,000 Connections 4.8
Notes:1 The population is for the present area served by the utility.2 About 92% of 125 samples taken passed the residual chlorine test.3 The total area of responsibility is 136 sq m.4 This is the percentage of population served by house connections and public taps. Those not
served by the utility use tube wells and tankers. The urban poor comprise 36% of the population.5 About 1,000 consumer complaints were registered in 2005–2006.6 Production is not metered and only 45% of the total commercial and industrial connections
are metered. About 550 leaks were repaired during the year.7 Commercial and industrial include institutional use and billing.8 Other cost includes transport and chemicals.
Data as of 2005–2006.
Other8
1%
Repair and maintenance
8%
Personnel 49%
Power 42%
Domestic 76%
Commercial Industrial7
24%
Domestic 40% Commercial
Industrial7 3%
UFW 57%
Annual Water BillingsRs248,270,000
Annual O&M CostsRs233,666,000
Annual Water Use62,416,685 m3
Amritsar 39

40 2007 Benchmarking and Data Book of Water Utilities in India
BANGALORE Utility Profile
Water Utility
BANGALORE WATER SUPPLY AND SEWERAGE BOARD
Address : Cauvery Bhavan. K. G. Road, Bangalore – 560 009, India Telephone : 91 80 2294 5100 Fax : 91 80 2294 5100 E-mail : [email protected] Head : Mr. N. C. Muniyappa, Chairman of the Board
Bangalore Water Supply and Sewerage Board (BWSSB) is a city board established in 1964. It provides water supply and sewerage services for Bangalore Mahanagara Palike and surrounding areas developed by the Bangalore Development Authority, which has a total population of 5,361,500 people. The present service area of BWSSB has a population density of 23,311 persons/km2. The utility is responsible for water production, distribution, and source development. It draws water from surface water sources, with 90% coming from the Cauvery River and the rest from the Arkavathi River. The private sector is involved in the operation and maintenance of the water treatment plant and pumping stations and the wastewater treatment plant through service contracts. BWSSB has a computerized billing system and accounting system, as well as the operation of the sewage treatment plant. It has an annual report for 2005–2006 that is available to the public. BWSSB follows a master development plan covering the period 2000–2025. The utility has a partly developed management information system.
Mission
Statement
No mission statement.
General Data
About Water Utility
Connections : 486,850 Staff : 2,510 Annual O&M Costs : Rs3,413,551,100 Annual Revenue : Rs4,254,635,200 Annual Billings : Rs3,800,407,300 Total Capital Expenditure : Rs1,918,000,000 Average capital expenditure/connection/year: Rs787.92 (Over the last 5 years) Source of Investment Funds : All from internally generated reserves
Tariff Structure DOMESTIC NONDOMESTIC OTHERS Consumption
(m3) Rate
(Rs/m3) Consumption
(m3) Rate
(Rs/m3) Category Rate (Rs/m3)
0 – 8* 6.00 0 – 10 36.00 Industries 60.00 8 – 25 9.00 10 – 20 39.00 BIDADI Industrial Area 51.00 25 – 50 15.00 20 – 40 44.00 Lorry loads (per load) 250.00
50 – 75 30.00 40 – 60 51.00 Swimming pool 60.00 75 – 100 36.00 60 – 100 57.00 Public taps 3,000.00 Above 100 36.00 Above 100 60.00 * There is a minimum charge of Rs48.00 for domestic consumers.
Notes: 1. All consumers pay on metered use as 95.5% of service connections have functioning meters. Consumers are billed monthly. 2. Water bills are paid at banks and automated teller machines (ATMs). 3. There were 28,570 new connections in 2005–2006. The price of a new domestic connection is Rs1,740 payable prior to connection.
Priority Needs of Utility
1. Reduce unaccounted for water. 2. Reuse of water for potable uses and industries.
3. Ensure no flow of sewage in storm drains.
Consumer Service
Average monthly consumption is about 20 m3 per house connection. The water bill averages Rs297 per month per house connection. Water is available on an average of 4–5 hours a day to most users, which is just below the average and at an average pressure of 10 meters. Applicants have to wait for about 3–7 days for a new connection to be made. A connection fee of Rs1,740 has to be paid prior to connection. Water quality can still be improved, with only 85% of 19,523 water samples taken during the year passing the residual chlorine test. There were 25,500 consumers complaints recorded and the same number of leaks repaired during the year. Consumers can complain in person at the water utility office or by e-mail, letter, or via IVRS. The urban poor pay only Rs500 for connection fee and Rs6/m3 for up to 8 m3 per month.
Performance Highlights
BWSSB provides water at only 74 lpcd to its consumers at an average of 4–5 hours per day to 92.9% of the population in its area of responsibility. It has the fourth highest UFW at 45.1% among 14 utilities. Production is fully metered and 95.5% of total connections have functioning meters. Operating ratio is good at 0.8 but accounts receivable of 7.1 months are the fifth highest. Average tariff of Rs20.55/m3 is the highest; high UFW keeps the total revenues just enough to cover costs. Staff/1,000 connections ratio is just about the median at 5.2. BWSSB needs to reduce its NRW and improve on water availability. It also needs to improve on its collection efforts. It could further improve metering of connections to better account for use.
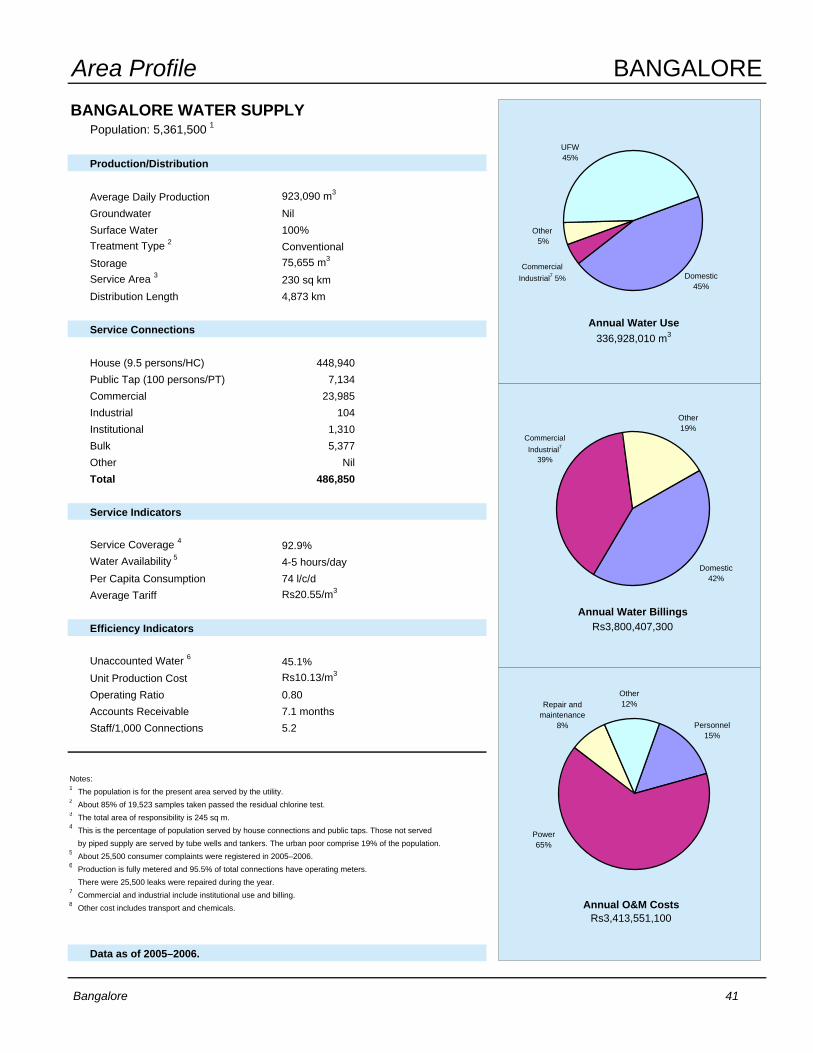
Area Profile BANGALOREBANGALORE WATER SUPPLY
Population: 5,361,500 1
Production/Distribution
Average Daily Production 923,090 m3
Groundwater NilSurface Water 100%Treatment Type 2 ConventionalStorage 75,655 m3
Service Area 3 230 sq kmDistribution Length 4,873 km
Service Connections
House (9.5 persons/HC) 448,940Public Tap (100 persons/PT) 7,134Commercial 23,985Industrial 104Institutional 1,310Bulk 5,377Other NilTotal 486,850
Service Indicators
Service Coverage 4 92.9%Water Availability 5 4-5 hours/dayPer Capita Consumption 74 l/c/dAverage Tariff Rs20.55/m3
Efficiency Indicators
Unaccounted Water 6 45.1%Unit Production Cost Rs10.13/m3
Operating Ratio 0.80Accounts Receivable 7.1 monthsStaff/1,000 Connections 5.2
Notes:1 The population is for the present area served by the utility.2 About 85% of 19,523 samples taken passed the residual chlorine test.3 The total area of responsibility is 245 sq m.4 This is the percentage of population served by house connections and public taps. Those not served
by piped supply are served by tube wells and tankers. The urban poor comprise 19% of the population.5 About 25,500 consumer complaints were registered in 2005–2006.6 Production is fully metered and 95.5% of total connections have operating meters.
There were 25,500 leaks were repaired during the year.7 Commercial and industrial include institutional use and billing.8 Other cost includes transport and chemicals.
Data as of 2005–2006.
Power 65%
Personnel 15%
Repair and maintenance
8%
Other 12%
Domestic 42%
Commercial Industrial7
39%
Other19%
Domestic 45%
Commercial Industrial7 5%
UFW 45%
Other 5%
Annual Water BillingsRs3,800,407,300
Annual O&M CostsRs3,413,551,100
Annual Water Use336,928,010 m3
Bangalore 41

42 2007 Benchmarking and Data Book of Water Utilities in India
BHOPAL Utility Profile
Water Utility
BHOPAL MUNICIPAL CORPORATION
Address : Sadar Manzil, Bhopal – 462 001, India Telephone : 91 755 254 2070 Fax : 91 755 253 9806 E-mail : [email protected] Head : Mr. Manish Singh, Municipal Commissioner
Bhopal Municipal Corporation (BMC) was established as a municipal corporation in 1952. It provides water supply and sewerage services to the city of Bhopal, which has a total population of 1,437,000 people. The present service area of BMC has a population density of 5,024 persons/km2. The utility is responsible for water production, distribution, and source development. It draws water from the Upper Lake fed by the Kolans River, from Kolar Dam fed by the Kolar River, as well as from 642 tube wells. There is no private sector involvement in the utility’s operations. It has a computerized billing and accounting systems, as well as its complaints-handling system. BMC has an annual report for 2004–2005 that is available to the public; it does not have a master development plan. The utility has a partly developed management information system.
Mission
Statement
No mission statement.
General Data
About Water Utility
Connections : 105,012 Staff : 2,171 Annual O&M Costs : Rs282,299,000 Annual Revenue : Rs100,000,000 Annual Billings : Rs56,120,900 Total Capital Expenditure : Rs20,600,000 Average capital expenditure/connection/year: Rs39.23 (Over the last 5 years) Source of Investment Funds : Government loan from HUDCO
Tariff Structure FLAT RATES (Rs/month) Size (inch) Domestic Commercial* Industrial 1/2 60.00 500.00 600.00 3/4 400.00 1,000.00 1,000.00 1 600.00 1,500.00 1,500.00
Tariff for metered domestic connection is Rs3.50/m3
* Commercial includes hotels, restaurants, beauty parlors, nursing homes, and others. Notes: 1. None of the service connections are metered. Tariffs are based on size of connection and category of user to be paid monthly. 2. Water bills are paid at the water utility office. 3. There were 2,273 new connections in 2005–2006. The price of a new domestic connection is Rs1,500 payable prior to connection.
Priority Needs
of Utility
1. 24-hour water supply to all
2. Leak detection to control UFW
3. Meeting the future needs of growing population
Consumer
Service
Average monthly consumption is about 22 m3 per house connection. The water bill averages Rs42 per month per house connection. Water is available on an average of 1–2 hours a day to most users, which is the fourth lowest with an average pressure of 5 meters. Applicants have to wait for a month for a new connection to be made. A connection fee of Rs1,500 has to be paid prior to connection. Water quality is good, with 95% of water samples taken during the year passing the residual chlorine test but from a limited sample size. Monitoring of leaks and complaints started only in January 2006, and 608 complaints and 93 leaks were recorded up to May 2006. Consumers can complain in person at the water utility office or by e-mail, letter, and telephone. Connection charges for the urban poor are only one third of the normal fee, or Rs500.
Performance
Highlights
BMC provides water at an estimated 72 lpcd to its consumers at an average of 1–2 hours per day to 83.4% of the population in its area of responsibility. UFW could not be computed because of inconsistencies in the production and consumption estimates in the absence of metering for both. Bhopal has the fourth highest operating ratio at 2.82 although accounts receivable of 3.6 months is better than average. Average tariff of Rs0.60/m3 is the lowest and could not cover production costs. Staff/1,000 connections ratio is the highest at 20.7. BMC needs to improve on water availability and staff productivity. It should consider charging the appropriate tariff to cover its expenses. Metering of production and connections are needed to better account for use.

Area Profile BHOPALBHOPAL WATER SUPPLY
Population: 1,437,000 1
Production/Distribution
Average Daily Production 258,000 m3
Groundwater 7%Surface Water 93%Treatment Type 2 ConventionalStorage 94,000 m3
Service Area 3 286 sq kmDistribution Length 968 km
Service Connections
House (10 persons/HC) 95,666Public Tap (100 persons/PT) 4,618Commercial 1,284Industrial 130Institutional 3,310Bulk 4Other NilTotal 105,012
Service Indicators
Service Coverage 4 83.4%Water Availability 5 1 to 2 hours/dayPer Capita Consumption 72 l/c/dAverage Tariff Rs0.60/m3
Efficiency Indicators
Unaccounted Water 6 no dataUnit Production Cost Rs3.00/m3
Operating Ratio 2.82Accounts Receivable 3.6 monthsStaff/1,000 Connections 20.7
Notes:1 The population is for the present area served by the utility.2 About 95% of 50 samples taken passed the residual chlorine test.3 This is also the total area of responsibility.4 This is the percentage of population served by house connections and public taps.
About 13% of the population are served by tube wells and tankers from the utility.The urban poor comprise 23% of the population.
5 An estimated 1,460 consumer complaints were registered in 2005–2006.6 Both production and connections are not metered. UFW cannot be computed reliably.
An estimated 12,550 leaks were repaired during the year.7 Commercial and industrial include institutional use and billing.8 Other cost includes transport and chemicals.
Data as of 2005–2006.
Other 11%
Repair and maintenance
17%
Personnel 9%
Power 63%
Domestic 86%
Commercial Industrial7
14%
Other 1%
Commercial Industrial7
59%
Domestic 40%
Annual Water BillingsRs56,120,900
Annual O&M CostsRs282,299,000
Annual Water Use94,170,000 m3
Bhopal 43

44 2007 Benchmarking and Data Book of Water Utilities in India
CHANDIGARH Utility Profile
Water Utility
MUNICIPAL CORPORATION, CHANDIGARH
Address : Sector 17, Chandigarh, India Telephone : 91 172 502 1402 Fax : 91 172 272 1234 E-mail : [email protected] Head : Mr. P. S. Aujla, Municipal Commissioner
Municipal Corporation, Chandigarh (MCC) was established as a municipal corporation in 1994 although the water system dates back to 1949. MCC provides water supply and sewerage services to the city of Chandigarh and the town of Mani Majra, which together have a total population of 1,150,000 people. The present service area of MCC has a population density of 14,495 persons/km2. The utility is responsible for water production, distribution, and source development. It draws water from both groundwater and surface water sources. The private sector is involved in distribution, billing and collection, and leak repair through service contracts. It has computerized billing and accounting systems. MCC recently started implementing a 25-year master development plan covering the period 2006–2031. The utility has a well-developed management information system.
Mission
Statement
No mission statement.
General Data
About Water Utility
Connections : 139,300 Staff : 1,196 Annual O&M Costs : Rs547,526,000 Annual Revenue : Rs403,853,000 Annual Billings : Rs428,942,660 Total Capital Expenditure : Rs525,593,000 Average capital expenditure/connection/year: Rs754.62 (Over the last 5 years) Source of Investment Funds : No data
Tariff Structure METERED CONNECTIONS Domestic Nondomestic Consumption (m3) Rate (Rs/m3) Category Rate (Rs/m3) 1– 15 1.75 Lawn/irrigation 2.50 15 – 30 3.50 Institutional 9.00
30 – 60 5.00 Semicommercial 12.00 Above 60 6.00 Commercial 11.00
Notes: 1. About 79% of service connections are metered. Consumers are billed every 2 months. Those not metered pay a monthly flat rate. 2. Water bills are paid at the water utility office, banks, Sampark, and collection centers. 3. There were 3,076 new connections in 2005–2006. The price of a new domestic connection is Rs530 for a half-inch diameter connection payable prior to connection.
Priority Needs of Utility
1. Water supply 2. Sewage treatment plant 3. Storm water drainage
Consumer
Service
Average monthly consumption is about 41.2 m3 per connection. Water is available on an average of 12 hours a day to most users, which is the longest duration among the utilities and at an average pressure of 11 meters. Applicants have to wait for only a day for a new connection to be made. A connection fee of Rs530 for a half-inch diameter connection has to be paid prior to connection. Water quality is good, with all of 3,700 water samples taken during the year passing the residual chlorine test. About 2,000 complaints were recorded, and 1,500 pipe breaks and 5,000 leaks were repaired in 2005–2006. Consumers can complain in person at the water utility office or by e-mail, letter, or telephone. The urban poor are provided with stand posts in slum areas.
Performance
Highlights
MMC provides water at 147 lpcd to its consumers at an average of 12 hours per day to all of the population in its area of responsibility. UFW is 38.9%, which is the sixth highest. Production is not metered while 79% of service connections are effectively metered. Operating ratio of 1.36 is the median and better than average. No data were given for accounts receivable. Average tariff of Rs5.04/m3 is not enough to cover operating costs because of high UFW. Staff/1,000 connections ratio is also the sixth highest at 8.6. MMC is doing well in customer service but needs to reduce UFW to manageable levels. It should consider metering of production and connections to better account for use. The utility should also look into improving the productivity of its staff.

Area Profile CHANDIGARHCHANDIGARH WATER SUPPLY
Population: 1,150,000 1
Production/Distribution
Average Daily Production 381,280 m3
Groundwater 26%Surface Water 74%Treatment Type 2 ConventionalStorage 236,080 m3
Service Area 3 79.3 sq kmDistribution Length 1,500 km
Service Connections
House (10 persons/HC) 124,227Public Tap (150 persons/PT) 900Commercial 11,793Industrial 1,850Institutional 530Bulk NilOther NilTotal 139,300
Service Indicators
Service Coverage 4 100.0%Water Availability 5 12 hours/dayPer Capita Consumption 147 l/c/dAverage Tariff Rs5.04/m3
Efficiency Indicators
Unaccounted Water 6 38.9%Unit Production Cost Rs3.93/m3
Operating Ratio 1.36Accounts Receivable no dataStaff/1,000 Connections 8.6
Notes:1 The population is for the present area served by the utility.2 All 3,700 samples taken passed the residual chlorine test.3 This is also the total area of responsibility.4 This is the percentage of population served by house connections and public taps.
The utility claims all the population are connected to the water system.5 About 2,000 consumer complaints were registered in 2005–2006.6 Production is not metered while 79% of service connections are metered.
About 1,500 pipe breaks and 5,000 leaks were repaired during the year.7 Commercial and industrial include institutional use.8 Other cost includes transport and chemicals.
Data as of 2005–2006.
Power 60%
Personnel 33%
Repair and maintenance
6%
Other8
1%
UFW 39%Commercial
Industrial7
17%
Domestic 44%
Annual Water BillingsRs428,942,660
Annual O&M CostsRs547,526,000
Annual Water Use139,167,200 m3
No breakdown given
Chandigarh 45

46 2007 Benchmarking and Data Book of Water Utilities in India
CHENNAI Utility Profile
Water Utility
CHENNAI METROPOLITAN WATER SUPPLY AND SEWERAGE BOARD
Address : No.1, Pumping Station Road, Chintadripet, Chennai – 2, India Telephone : 91 44 2845 1300 to 1322 Fax : 91 44 2845 8181 E-mail : [email protected] Head : Mr. Shiv Das Meena, Managing Director
Chennai Metropolitan Water Supply & Sewerage Board (CMWSSB) is a city board established in 1978. It provides water supply and sewerage services for the city of Chennai, which has a total population of 5,320,000 people. The present service area of CMWSSB has a population density of 29,062 persons/km2. The utility is responsible for water production, distribution, and source development and draws water from Viranam Lake and Krishna River, as well as from 11 tube wells. The private sector is involved in water production and distribution through service, management, and build–operate–transfer (BOT) contracts. The utility is following a development plan covering up to 2021. CMWSSB has an annual report for 2005–2006 that is available to the public. CMWSSB has computerized billing and accounting, as well as three water treatment plants and transmission systems. The utility has a partly developed management information system.
Mission Statement
“Our mission is to enhance the health and quality of life for the citizens in Chennai City by providing them with adequate supply of clean and good quality water and safe disposal of sewage/waste water at reasonable price.”
General Data About
Water Utility
Connections : 344,079 Staff : 4,578 Annual O&M Costs : Rs1,387,623,200 Annual Revenue : Rs3,127,162,600 Annual Billings : Rs2,053,389,600 Total Capital Expenditure : Rs17,342,500,000 Average capital expenditure/connection/year: Rs10,080.53 (Over the last 5 years) Source of Investment Funds : Government grants and loans
Tariff Structure METERED* (Rs/m3) UNMETERED (Rs/month)
Consumption (m3) Domestic Partly Commercial Domestic Partly Commercial 0 – 10 2.50 5.00 50.00 150.00
11 – 15 10.00 15.00 Commercial Institutional 16 – 25 15.00 25.00 Others – 400.00 Govt hospital – 200.00
Above 25 25.00 25.00 Private hospital – 800.00 Private school – 400.00
Commercial (Rs/m3) Institutional (Rs/m3) Public TW Supply w/ Sewerage Charge Others – Rs35 up to 500 m3, Rs60
beyond 500 m3 Govt hospital – 20.00 40.00 10.00
Private hospital – Rs50 up to 500 m3, Rs80 beyond 500 m3 Private school – 40.00
*Minimum charges/month, including sewerage charges: Domestic – Rs50/dwelling or flat; Commercial – Rs400 (nonwater intensive), Rs800 (water intensive); Partly commercial – Rs150; Institutional – Rs200 (government hospital), Rs400 (private school). Notes: 1. Industrial and bulk consumers are metered and are billed monthly. Unmetered consumers are billed half yearly. Water bills are paid at the water utility office, banks, and through bill collectors. 2. There were 8,279 new connections in 2005–2006. Price of new domestic water connection is Rs1,930 payable prior to connection. Sewerage connection charge is Rs3,395.
Priority Need of Utility
1. Water conservation 2. Safe disposal of sewage 3. Source identification and development
Consumer Service
Average monthly consumption is about 42.8 m3 per house connection. The water bill averages Rs85.55 per month per house connection. Water is available on an average of 4–6 hours a day to most users with an average pressure of 2 meters. Applicants have to wait for about a month for a new connection to be made. Water quality is good, with 99% of 28,086 water samples taken during the year passing the chlorine residual test. There were 156,984 consumers complaints recorded in 2005–2006. Consumers can complain in person at the water utility office or by telephone, letter, and e-mail. The urban poor are provided with free water from sintex tanks and public fountains. They pay a minimal sewerage connection charge of Rs100.
Performance Highlights
CMWWSB provides water at 87 lpcd to its consumers at an average of 5 hours per day to 89.3% of the population in its service area. It has the fifth lowest UFW at 17.0%. However, while production is fully metered, only 3.5% of total connections are metered making UFW figure an estimate at best. Financial management is good, with the lowest operating ratio at 0.44 and accounts receivable equivalent of 1.1 months, the third lowest. Average tariff of Rs10.87/m3 can easily cover production cost. Staff/1,000 connections ratio is high at 13.3, the fifth highest. CMWSSB needs to increase water availability and staff productivity. It should also improve metering of service connections to account for use.

Area Profile CHENNAICHENNAI WATER SUPPLY
Population: 5,320,000 1
Production/Distribution
Average Daily Production 623,836 m3
Groundwater 9%Surface Water 91%Treatment Type 2 FiltrationStorage 355,480 m3
Service Area 3 183.1 sq kmDistribution Length 2,600 km
Service Connections
House (13.8 persons/HC) 284,965Public Tap (87 persons/PT) 9,399Commercial 48,958Industrial 56Institutional 693Bulk 8Other NilTotal 344,079
Service Indicators
Service Coverage 4 89.3%Water Availability 5 5 hours/dayPer Capita Consumption 87 l/c/dAverage Tariff Rs10.87/m3
Efficiency Indicators
Unaccounted Water 6 17.0%Unit Production Cost Rs6.09/m3
Operating Ratio 0.44Accounts Receivable 1.1 monthsStaff/1,000 Connections 13.3
Notes:1 The population is for the present area served by the utility.2 About 99% of 28,086 samples taken passed the residual chlorine test.3 This is also the total area of responsibility.4 This is the percentage of population served by house connections and public taps. About 1% of the
population are served by tankers. The urban poor comprise 10% of the population.5 About 156,984 consumer complaints were registered in 2005–2006.6 While production is fully metered, only 3.5% of total connections is metered.
There were 494 pipe breaks and 3,538 leaks were repaired during the year.7 Commercial and industrial include institutional use and billing.8 Other cost includes transport and chemicals.
Data as of 2005–2006.
Power 33%
Personnel 44%
Repair and maintenance
19%
Other8
4%
Domestic 14%
Commercial Industrial7
66%
Other20%
Domestic 68%
Commercial Industrial
11%
UFW 17%
Other7
4%
Annual Water BillingsRs2,053,389,600
Annual O&M CostsRs1,387,623,200
Annual Water Use227,700,000 m3
Chennai 47
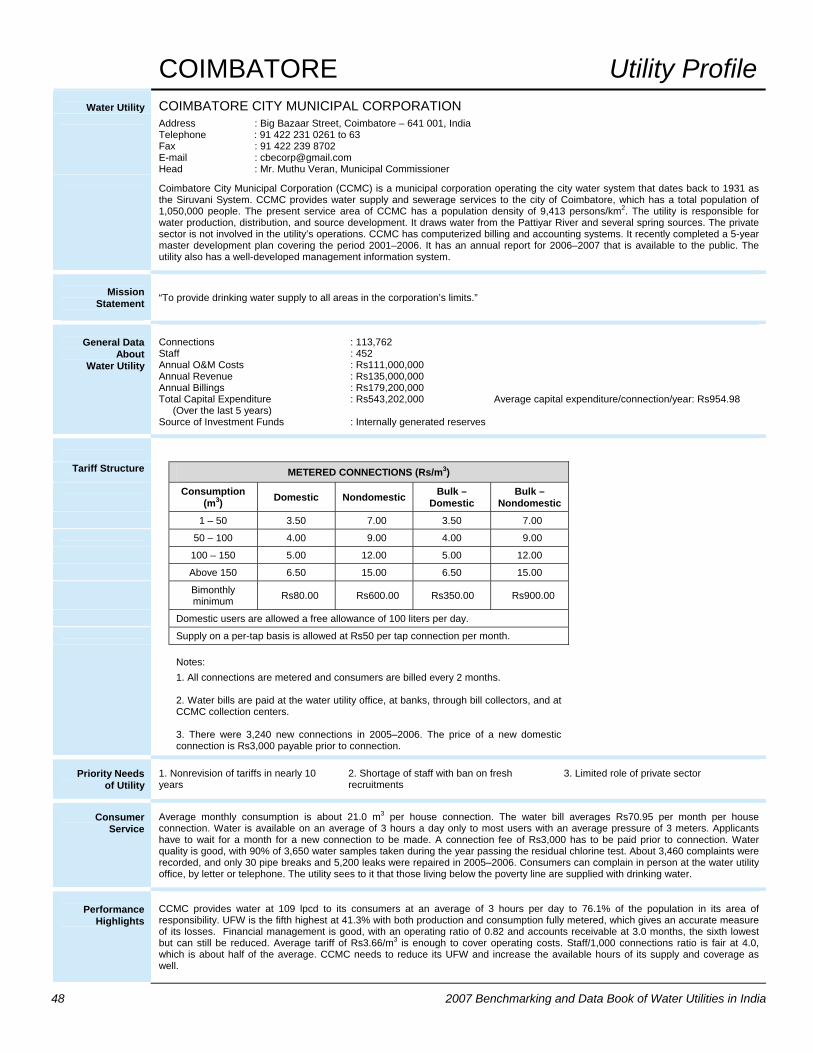
48 2007 Benchmarking and Data Book of Water Utilities in India
COIMBATORE Utility Profile
Water Utility
COIMBATORE CITY MUNICIPAL CORPORATION
Address : Big Bazaar Street, Coimbatore – 641 001, India Telephone : 91 422 231 0261 to 63 Fax : 91 422 239 8702 E-mail : [email protected] Head : Mr. Muthu Veran, Municipal Commissioner
Coimbatore City Municipal Corporation (CCMC) is a municipal corporation operating the city water system that dates back to 1931 as the Siruvani System. CCMC provides water supply and sewerage services to the city of Coimbatore, which has a total population of 1,050,000 people. The present service area of CCMC has a population density of 9,413 persons/km2. The utility is responsible for water production, distribution, and source development. It draws water from the Pattiyar River and several spring sources. The private sector is not involved in the utility’s operations. CCMC has computerized billing and accounting systems. It recently completed a 5-year master development plan covering the period 2001–2006. It has an annual report for 2006–2007 that is available to the public. The utility also has a well-developed management information system.
Mission
Statement
“To provide drinking water supply to all areas in the corporation’s limits.”
General Data
About Water Utility
Connections : 113,762 Staff : 452 Annual O&M Costs : Rs111,000,000 Annual Revenue : Rs135,000,000 Annual Billings : Rs179,200,000 Total Capital Expenditure : Rs543,202,000 Average capital expenditure/connection/year: Rs954.98 (Over the last 5 years) Source of Investment Funds : Internally generated reserves
Tariff Structure METERED CONNECTIONS (Rs/m3) Consumption
(m3) Domestic Nondomestic Bulk – Domestic
Bulk – Nondomestic
1 – 50 3.50 7.00 3.50 7.00 50 – 100 4.00 9.00 4.00 9.00 100 – 150 5.00 12.00 5.00 12.00
Above 150 6.50 15.00 6.50 15.00 Bimonthly
minimum Rs80.00 Rs600.00 Rs350.00 Rs900.00
Domestic users are allowed a free allowance of 100 liters per day. Supply on a per-tap basis is allowed at Rs50 per tap connection per month.
Notes: 1. All connections are metered and consumers are billed every 2 months. 2. Water bills are paid at the water utility office, at banks, through bill collectors, and at CCMC collection centers. 3. There were 3,240 new connections in 2005–2006. The price of a new domestic connection is Rs3,000 payable prior to connection.
Priority Needs of Utility
1. Nonrevision of tariffs in nearly 10 years
2. Shortage of staff with ban on fresh recruitments
3. Limited role of private sector
Consumer Service
Average monthly consumption is about 21.0 m3 per house connection. The water bill averages Rs70.95 per month per house connection. Water is available on an average of 3 hours a day only to most users with an average pressure of 3 meters. Applicants have to wait for a month for a new connection to be made. A connection fee of Rs3,000 has to be paid prior to connection. Water quality is good, with 90% of 3,650 water samples taken during the year passing the residual chlorine test. About 3,460 complaints were recorded, and only 30 pipe breaks and 5,200 leaks were repaired in 2005–2006. Consumers can complain in person at the water utility office, by letter or telephone. The utility sees to it that those living below the poverty line are supplied with drinking water.
Performance
Highlights
CCMC provides water at 109 lpcd to its consumers at an average of 3 hours per day to 76.1% of the population in its area of responsibility. UFW is the fifth highest at 41.3% with both production and consumption fully metered, which gives an accurate measure of its losses. Financial management is good, with an operating ratio of 0.82 and accounts receivable at 3.0 months, the sixth lowest but can still be reduced. Average tariff of Rs3.66/m3 is enough to cover operating costs. Staff/1,000 connections ratio is fair at 4.0, which is about half of the average. CCMC needs to reduce its UFW and increase the available hours of its supply and coverage as well.

Area Profile COIMBATORECOIMBATORE WATER SUPPLY
Population: 994,000 1
Production/Distribution
Average Daily Production 228,400 m3
Groundwater 1%Surface Water 99%Treatment Type 2 ConventionalStorage 125,000 m3
Service Area 3 105.6 sq kmDistribution Length 1,205 km
Service Connections
House (5 persons/HC) 107,000Public Tap (150 persons/PT) 2,811Commercial 3,523Industrial NilInstitutional NilBulk 428Others NilTotal 113,762
Service Indicators
Service Coverage 4 76.1%Water Availability 5 3 hours/dayPer Capita Consumption 109 lpcdAverage Tariff Rs3.66/m3
Efficiency Indicators
Unaccounted for Water 6 41.3%Unit Production Cost Rs1.33/m3
Operating Ratio 0.82Accounts Receivable 3.0 monthsStaff/1,000 Connections 4.0
Notes:
1 The population is for the present area served by the utility.2 About 90% of 3,650 samples taken passed the residual chlorine test.3 This is also the total area of responsibility.4 This is the percentage of population served by house connections and public taps.
About 19% of the population draw water from tankers provided by the utility.The urban poor comprise 25% of the population.
5 About 3,460 consumer complaints registered in 2005–2006.6 Both production and service connections are fully metered.
About 30 pipe breaks and 5,200 leaks were repaired during the year.7 Commercial and industrial include institutional use and billing.8 Other cost includes transport and chemicals.
Data as of 2005–2006.
Other8
15%Repair and maintenance
15%
Personnel 49%
Power 21%
Domestic63%
Commercial Industrial7
14%
Other23%
Other7
9%
UFW 41%
Commercial Industrial7
12%
Domestic 38%
Annual Water BillingsRs179,200,000
Annual O&M CostsRs111,000,000
Annual Water Use83,366,000 m3
Coimbatore 49

50 2007 Benchmarking and Data Book of Water Utilities in India
INDORE Utility Profile
Water Utility
INDORE MUNICIPAL CORPORATION
Address : M. G. Road, Indore – 452 004, M. P., India Telephone : 91 731 243 1610; 271 0695 Fax : 91 731 243 4489 E-mail : [email protected] Head : Mr. Vinod Sharma, Municipal Commissioner
Indore Municipal Corporation (IMC) is a municipal corporation established in 1977. It provides water supply and sewerage services to the cities of Indore, Mhow, and Dewas, which have a total population of 2,200,000 people. The present service area of IMC has a population density of 12,222 persons/km2. The utility is responsible for water production, distribution, and source development. It draws water from the Narmada and Gambhir Rivers and from 2,960 tube wells with pump sets. The private sector is not involved in the utility’s operations. IMC has computerized billing and accounting systems. It does not have an annual report nor does it have a master development plan. The utility has a partly developed management information system.
Mission Statement
No mission statement.
General Data
About Water Utility
Connections : 159,104 Staff : 2,979 Annual O&M Costs : Rs880,616,080 Annual Revenue : Rs165,264,590 Annual Billings : Rs186,038,400 Total Capital Expenditure : Rs543,202,000 Average capital expenditure/connection/year: Rs353.95 (Over the last 5 years) Source of Investment Funds : 30% internally generated reserves; 70% commercial loan (State Bank of Indore)
Tariff Structure FLAT RATE (Rs/month)
Size (inch) Domestic Commercial Industrial 1/2 150 300 600 3/4 250 600 1,200 1 500 1,400 2,400
1 – 1/2 1,000 2,400 5,000 2 2,000 5,000 10,000 3 4,000 10,000 20,000 4 8,000 20,000 35,000 6 14,000 38,000 76,000 METERED CONNECTIONS – Bulk Rates (Rs/m3) Bulk rates 11.00/m3 14.00/m3 24.00/m3
Notes: 1. Only 59 bulk connections are metered and not all are working. Most connections are on flat rate. The metered connections are billed monthly and the flat rates are billed quarterly. 2. Water bills are paid at the water utility office and through bill collectors. 3. There were 2,524 new connections in 2005–2006. The price of a new domestic connection is Rs2,500 payable prior to connection.
Priority Needs of Utility
1. Augmentation of water supply system capacity
2. Increase in revenue to make system sustainable
3. Upgrade of existing distribution system
Consumer Service
Average monthly consumption is about 28.4 m3 per house connection. The water bill averages Rs60.36 per month per house connection. Water is available on an average of 45 minutes a day only to most users with an average pressure of 1 meter. Applicants have to wait for 2–4 weeks for a new connection to be made. A connection fee of Rs2,500 has to be paid prior to connection. Water quality is good, with 98% of about 54,900 water samples taken during the year passing the residual chlorine test. About 550 complaints were recorded, and 5,886 pipe breaks and leaks were repaired in 2005–2006. Consumers can complain in person at the water utility office, by letter, e-mail, or telephone. The urban poor are provided with free water through public taps, tube wells with pumps, and tankers.
Performance Highlights
IMC provides water at 87 lpcd to its consumers at an average of 45 minutes per day to 77.3% of the population in its area of responsibility. With both production and connections not metered, available production and consumption estimates do not give a credible UFW value. Operating ratio is highest at 5.33. Accounts receivable are about average at 5.2 months. Average tariff of Rs2.79/m3 is lower than the high production cost of Rs13.18/m3 because of high-cost power most probably for pumping. Staff/1,000 connections ratio is the second highest at 18.7. IMC will need a lot of improvement starting with reducing its operating expenses and improving collections. Water availability of less than 1 hour a day is not acceptable and should be improved. Staff productivity needs to be enhanced. Production and all connections need to be metered to allow billing based on use and to account for total use and losses.

Area Profile INDOREINDORE WATER SUPPLY
Population: 2,200,000 1
Production/Distribution
Average Daily Production 183,000 m3
Groundwater 7%Surface Water 93%Treatment Type 2 ConventionalStorage 99,000 m3
Service Area 3 180 sq kmDistribution Length 2,040 km
Service Connections
House (7 persons/HC) 156,634Public Tap (2,000 persons/PT) 93Commercial 1,257Industrial 1,024Institutional 20Bulk 72Others 4Total 159,104
Service Indicators
Service Coverage 4 77.3%Water Availability 5 0.75 hours/dayPer Capita Consumption 87 lpcdAverage Tariff Rs2.79/m3
Efficiency Indicators
Unaccounted for Water 6 no dataUnit Production Cost Rs13.18/m3
Operating Ratio 5.33Accounts Receivable 5.2 monthsStaff/1,000 Connections 18.7
Notes:
1 The population is for the present area served by the utility.2 About 98% of 54,897 samples taken passed the residual chlorine test.3 This is also the total area of responsibility.4 This is the percentage of population served by house connections and public taps.
About 9% of the population draw water from tube wells and tankers provided by the utility.The urban poor comprise 10% of the population.
5 About 550 consumer complaints were registered in 2005–2006.6 Both production and all service connections except for 59 connections are not metered.
About 5,886 pipe breaks and leaks were repaired during the year.7 Commercial and industrial include institutional use and billing.8 Other cost includes transport and chemicals.
Data as of 2005–2006.
Power 57%
Personnel 18%
Repair and maintenance
18%
Other 7%
Domestic61%
Commercial Industrial7
4%
Other35%
Other7
9%
Commercial Industrial
10%
Domestic 81%
Annual Water BillingsRs186,038,400
Annual O&M CostsRs880,616,080
Annual Water Use66,760,000 m3
Indore 51

52 2007 Benchmarking and Data Book of Water Utilities in India
JABALPUR Utility Profile
Water Utility
JABALPUR MUNICIPAL CORPORATION
Address : Water Works Department, Jabalpur Municipal Corporation, Jabalpur, M. P., India Telephone : 91 761 240 3020 to 22 Fax : 91 761 241 0892 E-mail : [email protected] Head : Mr. Adjay Sharma, Executive Engineer (Water Works)
Jabalpur Municipal Corporation (JMC) was established as a municipal corporation in 1956. Its Water Works Department provides only water supply services to the city of Jabalpur, which has a total population of 1,050,000 people. The present service area of JMC has a population density of 8,753 persons/km2. The utility is responsible for water production, distribution, and source development. It draws water from the Narmada, Khandari-Gour, and Pariyat Rivers and from 175 tube wells with pump sets. The private sector is not involved in the utility’s operations. None of its operations is computerized nor does it have an annual report or a master development plan. The utility neither has a management information system.
Mission
Statement
No mission statement.
General Data
About Water Utility
Connections : 46,260 Staff : 17 Annual O&M Costs : Rs104,014,350 Annual Revenue : Rs61,923,800 Annual Billings : Rs82,277,000 Total Capital Expenditure : Rs200,000,000 Average capital expenditure/connection/year: Rs864.68 (Over the last 5 years) Source of Investment Funds : 32% internally generated reserves; 64% government grant; 4% commercial loan and other sources
Tariff Structure No tariff structure submitted.
Notes: 1. None of the service connections are metered. All consumers pay on flat rate and are billed annually. 2. Water bills are paid at the water utility office and through bill collectors. 3. There were only 300 new connections in 2005–2006. The price of a new domestic connection is Rs1,984 payable prior to connection but may also be paid in installment over 12 months.
Priority Needs
of Utility
1. Leakage control
2. Zoning of water distribution system
3. Collection improvement – realization of cess
Consumer
Service
Average monthly consumption is about 69.2 m3 per house connection. The water bill averages Rs62.74 per month per house connection. Water is available on an average of 4 hours a day only to most users. Applicants have to wait for about 2 weeks for a new connection to be made. A domestic connection fee of Rs1,984 is paid prior to connection but can also be paid over a 12-month period. Water quality is good, with 96% of 650 water samples taken during the year passing the residual chlorine test. About 700 complaints were recorded, and 400 pipe breaks and leaks were repaired in 2005–2006. Consumers can complain in person at the water utility office, or by letter or telephone. The urban poor pay low monthly charges of Rs30 and connection charge of Rs300 only.
Performance
Highlights
JMC provides water at 139 lpcd to its consumers at an average of 4 hours per day to 75.2% of the population in its area of responsibility. With both production and service connections not metered, UFW of 14.3% is, at best, an estimate. Operating ratio is 1.68 and accounts receivable equivalent is 3 months. Average tariff of Rs1.50/m3 is the fifth lowest and cannot cover operating expenses. Staff/1,000 connections ratio is lowest at 0.4. JMC needs to address its water availability, its low tariff, and operating ratio of more than 1. Production and all connections need to be metered to allow billing based on use and to account for total use and losses.

Area Profile JABALPURJABALPUR WATER SUPPLY
Population: 1,050,000 1
Production/Distribution
Average Daily Production 175,115 m3
Groundwater 9%Surface Water 91%Treatment Type 2 ConventionalStorage 70,000 m3
Service Area 3 123 sq kmDistribution Length 162 km
Service Connections
House (5 persons/HC) 44,000Public Tap (100 persons/PT) 1,600Commercial 648Industrial 8Institutional 2Bulk 2Others NilTotal 46,260
Service Indicators
Service Coverage 4 75.2%Water Availability 5 4 hours/dayPer Capita Consumption 139 lpcdAverage Tariff Rs1.50/m3
Efficiency Indicators
Unaccounted for Water 6 14.3%Unit Production Cost Rs1.63/m3
Operating Ratio 1.68Accounts Receivable 3.0 monthsStaff/1,000 Connections 0.4
Notes:
1 The population is for the present area served by the utility.2 About 96% of 650 samples taken passed the residual chlorine test.3 This is also the total area of responsibility.4 This is the percentage of population served by house connections and public taps.
About 25% of the population draw water from tube wells and tankers provided by the utility.The urban poor comprise 35% of the population.
5 About 700 consumer complaints were registered in 2005–2006.6 Production and service connections are not metered. UFW is at best an estimate.
About 400 pipe breaks and leaks were repaired during the year.7 Commercial and industrial include institutional use and billing.8 Other cost includes transport and chemicals.
Data as of 2005–2006.
Other8
26%
Repair and maintenance
24%
Personnel 34%
Power 16%
Domestic40%
Commercial Industrial7
60%
UFW14%
Commercial Industrial7
23%
Domestic 63%
Annual Water BillingsRs82,277,000
Annual O&M CostsRs104,014,350
Annual Water Use63,917,000 m3
Jabalpur 53
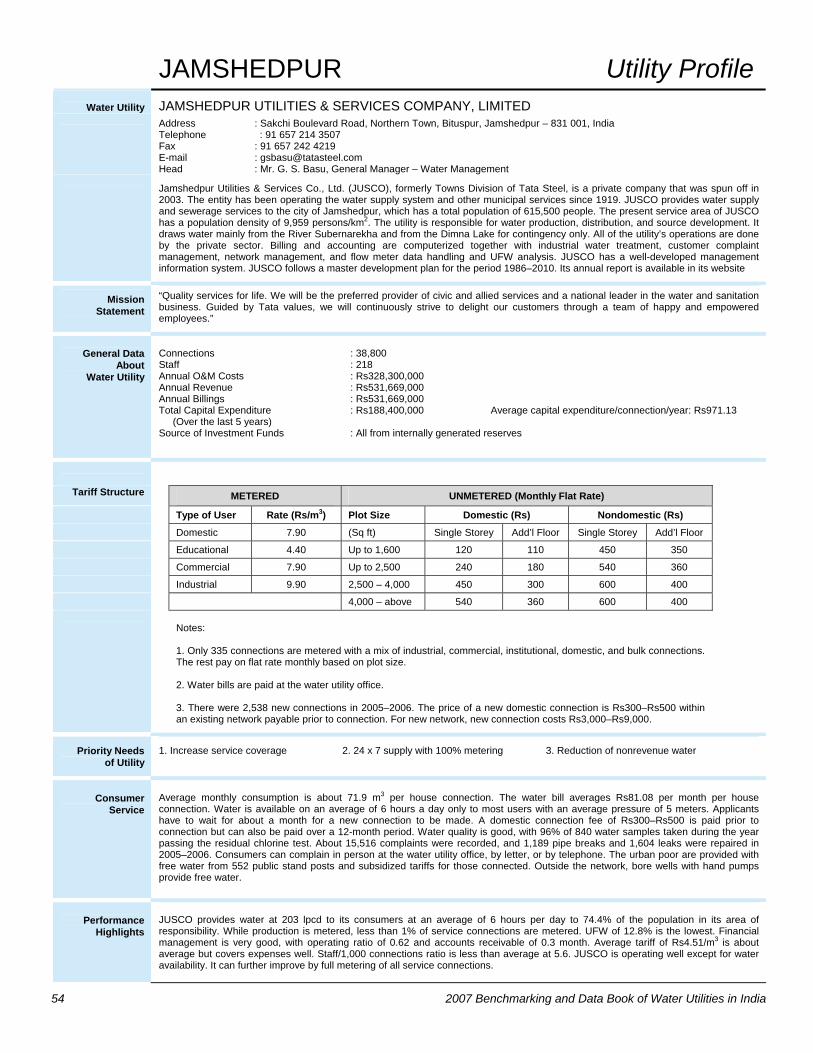
54 2007 Benchmarking and Data Book of Water Utilities in India
JAMSHEDPUR Utility Profile
Water Utility
JAMSHEDPUR UTILITIES & SERVICES COMPANY, LIMITED
Address : Sakchi Boulevard Road, Northern Town, Bituspur, Jamshedpur – 831 001, India Telephone : 91 657 214 3507 Fax : 91 657 242 4219 E-mail : [email protected] Head : Mr. G. S. Basu, General Manager – Water Management
Jamshedpur Utilities & Services Co., Ltd. (JUSCO), formerly Towns Division of Tata Steel, is a private company that was spun off in 2003. The entity has been operating the water supply system and other municipal services since 1919. JUSCO provides water supply and sewerage services to the city of Jamshedpur, which has a total population of 615,500 people. The present service area of JUSCO has a population density of 9,959 persons/km2. The utility is responsible for water production, distribution, and source development. It draws water mainly from the River Subernarekha and from the Dimna Lake for contingency only. All of the utility’s operations are done by the private sector. Billing and accounting are computerized together with industrial water treatment, customer complaint management, network management, and flow meter data handling and UFW analysis. JUSCO has a well-developed management information system. JUSCO follows a master development plan for the period 1986–2010. Its annual report is available in its website
Mission Statement
“Quality services for life. We will be the preferred provider of civic and allied services and a national leader in the water and sanitation business. Guided by Tata values, we will continuously strive to delight our customers through a team of happy and empowered employees.”
General Data
About Water Utility
Connections : 38,800 Staff : 218 Annual O&M Costs : Rs328,300,000 Annual Revenue : Rs531,669,000 Annual Billings : Rs531,669,000 Total Capital Expenditure : Rs188,400,000 Average capital expenditure/connection/year: Rs971.13 (Over the last 5 years) Source of Investment Funds : All from internally generated reserves
Tariff Structure METERED UNMETERED (Monthly Flat Rate) Type of User Rate (Rs/m3) Plot Size Domestic (Rs) Nondomestic (Rs) Domestic 7.90 (Sq ft) Single Storey Add’l Floor Single Storey Add’l Floor Educational 4.40 Up to 1,600 120 110 450 350 Commercial 7.90 Up to 2,500 240 180 540 360
Industrial 9.90 2,500 – 4,000 450 300 600 400 4,000 – above 540 360 600 400
Notes: 1. Only 335 connections are metered with a mix of industrial, commercial, institutional, domestic, and bulk connections. The rest pay on flat rate monthly based on plot size. 2. Water bills are paid at the water utility office. 3. There were 2,538 new connections in 2005–2006. The price of a new domestic connection is Rs300–Rs500 within an existing network payable prior to connection. For new network, new connection costs Rs3,000–Rs9,000.
Priority Needs of Utility
1. Increase service coverage 2. 24 x 7 supply with 100% metering 3. Reduction of nonrevenue water
Consumer
Service
Average monthly consumption is about 71.9 m3 per house connection. The water bill averages Rs81.08 per month per house connection. Water is available on an average of 6 hours a day only to most users with an average pressure of 5 meters. Applicants have to wait for about a month for a new connection to be made. A domestic connection fee of Rs300–Rs500 is paid prior to connection but can also be paid over a 12-month period. Water quality is good, with 96% of 840 water samples taken during the year passing the residual chlorine test. About 15,516 complaints were recorded, and 1,189 pipe breaks and 1,604 leaks were repaired in 2005–2006. Consumers can complain in person at the water utility office, by letter, or by telephone. The urban poor are provided with free water from 552 public stand posts and subsidized tariffs for those connected. Outside the network, bore wells with hand pumps provide free water.
Performance
Highlights
JUSCO provides water at 203 lpcd to its consumers at an average of 6 hours per day to 74.4% of the population in its area of responsibility. While production is metered, less than 1% of service connections are metered. UFW of 12.8% is the lowest. Financial management is very good, with operating ratio of 0.62 and accounts receivable of 0.3 month. Average tariff of Rs4.51/m3 is about average but covers expenses well. Staff/1,000 connections ratio is less than average at 5.6. JUSCO is operating well except for water availability. It can further improve by full metering of all service connections.

Area Profile JAMSHEDPURJAMSHEDPUR WATER SUPPLY
Population: 488,000 1
Production/Distribution
Average Daily Production 370,110 m3
Groundwater NilSurface Water 100%Treatment Type 2 ConventionalStorage 45,650 m3
Service Area 3 49 sq kmDistribution Length 513 km
Service Connections
House (9.4 persons/HC) 36,195Public Tap (140 persons/PT) 552Commercial 1,572Industrial 35Institutional 178Bulk (total of 3,965 housing units) 101Others 167Total 38,800
Service Indicators
Service Coverage 4 74.4%Water Availability 5 6 hours/dayPer Capita Consumption 203 lpcdAverage Tariff Rs4.51/m3
Efficiency Indicators
Unaccounted for Water 6 12.8%Unit Production Cost Rs2.43/m3
Operating Ratio 0.62Accounts Receivable 0.3 monthStaff/1,000 Connections 5.6
Notes:
1 The population is for the present area served by the utility.2 About 96% of 840 samples taken passed the residual chlorine test.3 The total area of responsibility is 64 sq m (km2).4 This is the percentage of population served by house connections, public taps, and apartment units
with bulk connections. About 5% of the population draw water from utility tankers during emergencies. The urban poor comprise 20% of the population.
5 About 15,516 consumer complaints were registered in 2005–2006.6 While production is metered, only 335 service connections (less than 1%) are metered.
About 1,189 pipe breaks and 1,604 leaks were repaired during the year.7 Commercial and industrial include institutional use and billing.8 Other cost includes transport, chemicals, and payment for raw water.
Data as of 2005–2006.
Other8
9%Repair and
maintenance 12%
Personnel 22%
Power 57%
Domestic8%
Commercial Industrial7
92%
UFW 13%
Commercial Industrial7
62%
Domestic 25%
Annual Water BillingsRs531,669,000
Annual O&M CostsRs328,300,000
Annual Water Use135,090,000 m3
Jamshedpur 55

56 2007 Benchmarking and Data Book of Water Utilities in India
KOLKATA Utility Profile
Water Utility
KOLKATA MUNICIPAL CORPORATION
Address : 5, S. N. Bannerjee Road, Kolkata – 700 013, India Telephone : 91 33 2286 1293 Fax : 91 33 2286 1234 E-mail : [email protected] Head : Mr. Bibhas Kumar Maity, Director General (Water Supply)
Kolkata Municipal Corporation (KMC) was established as a municipal corporation in 1924. KMC provides water supply and sewerage services to the city of Kolkata and five other cities and towns, which together have a total population of 4,998,000 people. The present service area of KMC has a population density of 27,014 persons/km2. The utility is responsible for water production, distribution, and source development. It draws water mainly from the River Hooghly and from 260 tube wells. The private sector is involved in source development, production, management, leak repair, and potable water tanker service through service and management contracts. Billing, part of pumping, fund management, record keeping, and network mapping are computerized. The utility has a partly developed management information system. No annual report is available. It has a 20-year master development plan covering 2006–2026.
Mission
Statement
“Water for all, the effort continues.”
General Data
About Water Utility
Connections : 262,839 Staff : 3,866 Annual O&M Costs : Rs1,228,500,000 Annual Revenue : Rs260,000,000 Annual Billings : Rs260,000,000 Total Capital Expenditure : Rs2,953,800,000 Average capital expenditure/connection/year: Rs2,247.61 (Over the last 5 years) Source of Investment Funds : Internally generated reserves and grant from the Government of West Bengal
Tariff Structure NONDOMESTIC CONNECTIONS
Ferrule Size (inch) Monthly Rate (Rs) Ferrule Size (inch) Monthly Rate (Rs)
1/8 200 1/2 700 3/16 250 Above 1/2 1,100 1/4 300 3/4 1,800
3/8 500 1 2,700 7/16 600 – –
Notes: 1. Water supplied for domestic consumption is not charged at all and is supplied free of cost. Only bulk supply for domestic uses is charged. Only 175 bulk connections are metered, of which 84 are for domestic purposes and 91 are industrial, commercial, and institutional connections. 2. Water bills are paid at the water utility office. 3. There were 1,052 new connections in 2005–2006, mostly domestic ferrule connection. The price of a new domestic connection is Rs1,000 for a 10-mm ferrule connection payable prior to connection.
Priority Needs
of Utility
1. Water supply network management
2. Management of UFW reduction
3. 24/7 water supply with 100% metering
Consumer Service
Average monthly consumption is about 58.6 m3 per house connection. Domestic consumption is not billed. Water is available on an average of 8 hours a day with an average pressure of 3 meters to most users. Applicants have to wait for about 3–7 days for a new connection to be made. A domestic connection fee of Rs1,000 is paid prior to connection. Water quality is good, with 90% of 7,000 water samples taken during the year passing the residual chlorine test. Records of complaints are available at the ward level only. About 8,000 pipe breaks and 77,197 leaks were repaired in 2005–2006. Consumers can complain in person at the water utility office or by letter, e-mail, or telephone. The urban poor are provided with free water from public stand posts.
Performance Highlights
KMC provides water at 130 lpcd to its consumers at an average of 8 hours per day to 79.0% of the population in its area of responsibility. UFW is estimated at a high 35%, with production not metered and less than 1% of service connections metered. Financial management needs improvement with the second highest operating ratio of 4.73 and accounts receivable of 2.4 months. Average tariff of Rs1.13/m3 is the third lowest, which cannot cover expenses at all. Staff/1,000 connections ratio is the fourth highest at 14.7. KMC needs to cover its expenses through appropriate tariffs and by charging domestic users for their use. It also needs to improve collection and water availability, and reduce its high UFW. Staff productivity should also be enhanced. Metering is necessary to account for water use and to determine the extent of losses.

Area Profile KOLKATAKOLKATA WATER SUPPLY
Population: 3,998,000 1
Production/Distribution
Average Daily Production 971,560 m3
Groundwater 12%Surface Water 88%Treatment Type 2 ConventionalStorage 474,430 m3
Service Area 3 148 sq kmDistribution Length 5,800 km
Service Connections
House (9.4 persons/HC) 237,912Public Tap (140 persons/PT) 17,000Commercial NilIndustrial 7,752Institutional NilBulk 175Others NilTotal 262,839
Service Indicators
Service Coverage 4 79.0%Water Availability 5 8 hours/dayPer Capita Consumption 130 lpcdAverage Tariff Rs1.13/m3
Efficiency Indicators
Unaccounted for Water 6 35.0%Unit Production Cost Rs3.46/m3
Operating Ratio 4.73Accounts Receivable 2.4 monthsStaff/1,000 Connections 14.7
Notes:
1 The population is for the present area served by the utility.2 About 90% of 7,000 samples taken passed the residual chlorine test.3 The total area of responsibility is 185 sq m (km 2).4 This is the percentage of population served by house connections and public taps. The rest of the
population draw water from tube wells and tankers. The urban poor comprise 35% of the population.5 No record of consumer complaints are kept at the central level but are at the wards.6 Production is not metered and only 175 bulk connections (less than 1%) are metered.
About 8,000 pipe breaks and 77,197 leaks were repaired during the year.7 Domestic consumption are not billed. Commercial and industrial include institutional use and billing.8 Other cost includes transport and chemicals.
Data as of 2005–2006.
Other8
11%
Repair and maintenance
11%
Personnel 35%
Power 43%
Commercial Industrial
14%
Other86%
Other9%
UFW35%
Commercial Industrial
3%
Domestic53%
Annual Water Billings7
Rs260,000,000
Annual O&M CostsRs1,228,500,000
Annual Water Use354,619,400 m3
Kolkata 57
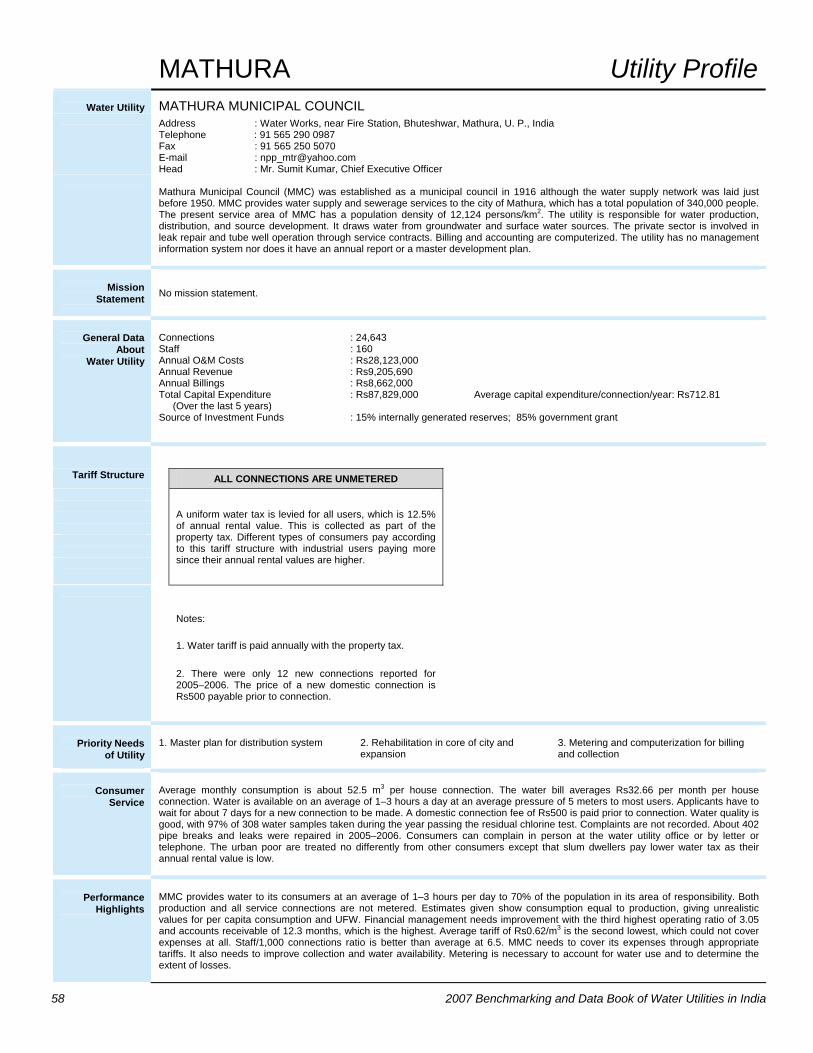
58 2007 Benchmarking and Data Book of Water Utilities in India
MATHURA Utility Profile
Water Utility
MATHURA MUNICIPAL COUNCIL
Address : Water Works, near Fire Station, Bhuteshwar, Mathura, U. P., India Telephone : 91 565 290 0987 Fax : 91 565 250 5070 E-mail : [email protected] Head : Mr. Sumit Kumar, Chief Executive Officer
Mathura Municipal Council (MMC) was established as a municipal council in 1916 although the water supply network was laid just before 1950. MMC provides water supply and sewerage services to the city of Mathura, which has a total population of 340,000 people. The present service area of MMC has a population density of 12,124 persons/km2. The utility is responsible for water production, distribution, and source development. It draws water from groundwater and surface water sources. The private sector is involved in leak repair and tube well operation through service contracts. Billing and accounting are computerized. The utility has no management information system nor does it have an annual report or a master development plan.
Mission
Statement
No mission statement.
General Data
About Water Utility
Connections : 24,643 Staff : 160 Annual O&M Costs : Rs28,123,000 Annual Revenue : Rs9,205,690 Annual Billings : Rs8,662,000 Total Capital Expenditure : Rs87,829,000 Average capital expenditure/connection/year: Rs712.81 (Over the last 5 years) Source of Investment Funds : 15% internally generated reserves; 85% government grant
Tariff Structure ALL CONNECTIONS ARE UNMETERED
A uniform water tax is levied for all users, which is 12.5% of annual rental value. This is collected as part of the property tax. Different types of consumers pay according to this tariff structure with industrial users paying more since their annual rental values are higher.
Notes: 1. Water tariff is paid annually with the property tax. 2. There were only 12 new connections reported for 2005–2006. The price of a new domestic connection is Rs500 payable prior to connection.
Priority Needs
of Utility
1. Master plan for distribution system
2. Rehabilitation in core of city and expansion
3. Metering and computerization for billing and collection
Consumer
Service
Average monthly consumption is about 52.5 m3 per house connection. The water bill averages Rs32.66 per month per house connection. Water is available on an average of 1–3 hours a day at an average pressure of 5 meters to most users. Applicants have to wait for about 7 days for a new connection to be made. A domestic connection fee of Rs500 is paid prior to connection. Water quality is good, with 97% of 308 water samples taken during the year passing the residual chlorine test. Complaints are not recorded. About 402 pipe breaks and leaks were repaired in 2005–2006. Consumers can complain in person at the water utility office or by letter or telephone. The urban poor are treated no differently from other consumers except that slum dwellers pay lower water tax as their annual rental value is low.
Performance
Highlights
MMC provides water to its consumers at an average of 1–3 hours per day to 70% of the population in its area of responsibility. Both production and all service connections are not metered. Estimates given show consumption equal to production, giving unrealistic values for per capita consumption and UFW. Financial management needs improvement with the third highest operating ratio of 3.05 and accounts receivable of 12.3 months, which is the highest. Average tariff of Rs0.62/m3 is the second lowest, which could not cover expenses at all. Staff/1,000 connections ratio is better than average at 6.5. MMC needs to cover its expenses through appropriate tariffs. It also needs to improve collection and water availability. Metering is necessary to account for water use and to determine the extent of losses.
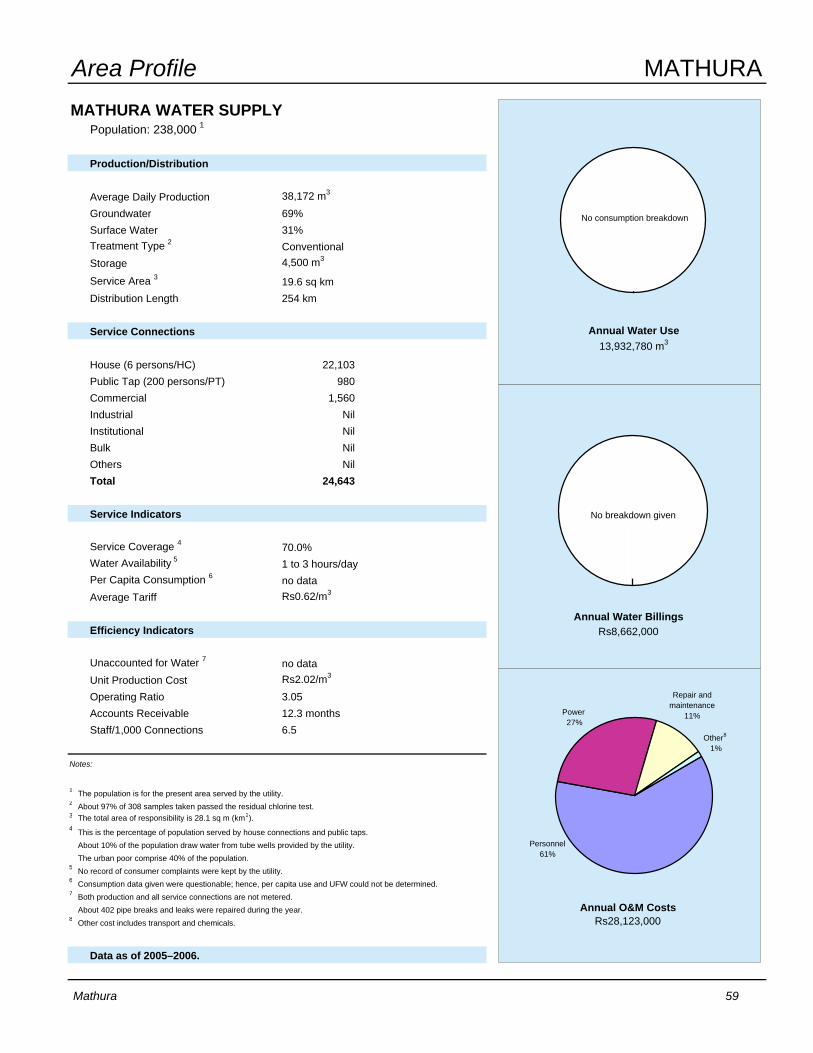
Area Profile MATHURAMATHURA WATER SUPPLY
Population: 238,000 1
Production/Distribution
Average Daily Production 38,172 m3
Groundwater 69%Surface Water 31%Treatment Type 2 ConventionalStorage 4,500 m3
Service Area 3 19.6 sq kmDistribution Length 254 km
Service Connections
House (6 persons/HC) 22,103Public Tap (200 persons/PT) 980Commercial 1,560Industrial NilInstitutional NilBulk NilOthers NilTotal 24,643
Service Indicators
Service Coverage 4 70.0%Water Availability 5 1 to 3 hours/dayPer Capita Consumption 6 no dataAverage Tariff Rs0.62/m3
Efficiency Indicators
Unaccounted for Water 7 no dataUnit Production Cost Rs2.02/m3
Operating Ratio 3.05Accounts Receivable 12.3 monthsStaff/1,000 Connections 6.5
Notes:
1 The population is for the present area served by the utility.2 About 97% of 308 samples taken passed the residual chlorine test.3 The total area of responsibility is 28.1 sq m (km2).4 This is the percentage of population served by house connections and public taps.
About 10% of the population draw water from tube wells provided by the utility. The urban poor comprise 40% of the population.
5 No record of consumer complaints were kept by the utility.6 Consumption data given were questionable; hence, per capita use and UFW could not be determined.7 Both production and all service connections are not metered.
About 402 pipe breaks and leaks were repaired during the year.8 Other cost includes transport and chemicals.
Data as of 2005–2006.
Other8
1%
Repair and maintenance
11%
Personnel 61%
Power 27%
Annual Water BillingsRs8,662,000
Annual O&M CostsRs28,123,000
Annual Water Use13,932,780 m3
No consumption breakdown
No breakdown given
Mathura 59

60 2007 Benchmarking and Data Book of Water Utilities in India
MUMBAI Utility Profile
Water Utility
MUNICIPAL CORPORATION OF GREATER MUMBAI
Address : Municipal Head Office, Fort, Mumbai – 400 001, India Telephone : 91 22 2262 0025 Fax : 91 22 2263 4329 E-mail : [email protected], [email protected] Head : Mr. R. R. Hariname, Hydraulic Engineer
Municipal Corporation of Greater Mumbai (MCGM) was established in 1888. MCGM has separate departments providing water supply and sewerage services to the city of Mumbai, which has a total population of 13,000,000 people. The present service area of MCGM has a population density of 29,613 persons/km2. The utility is responsible for water production, distribution, and source development. It draws water mainly from the following surface water sources: Vaitarna, Tansa, and Bhatsa Rivers, and Lakes Vihar and Tulsi. There is no private sector involvement in the utility’s operations. Billing, accounting, and part of pumping and treatment operations are computerized. The utility has a partly developed management information system. It publishes an annual report that is available to the public. MCGM has no current master development plan.
Mission
Statement
“To provide all users in Mumbai City with continuous, uninterrupted, reliable water treatment services to provide good quality supply of clean water in a safe, environmentally sound, and cost-effective manner.”
General Data
About Water Utility
Connections : 400,000 Staff : 6,865 Annual O&M Costs : Rs4,284,060,400 Annual Revenue : Rs8,789,400,000 Annual Billings : Rs4,640,300,000 Total Capital Expenditure : Rs7,581,173,100 Average capital expenditure/connection/year: Rs3,790.59 (Over the last 5 years) Source of Investment Funds : All from government grant
Tariff Structure UNMETERED CONNECTIONS
Unmetered connections are charged an annual amount equal to 12.5% of annual rental value of the property, which is collected as part of property tax.
METERED CONNECTIONS (Rs/m3) Slums, including chawls Rs2.25/m3
Nonslum domestic users, schools Rs3.50/m3
Dispensaries, municipal swimming pools, halls Rs10.50/m3
Small hotels Rs18.00/m3
Commercial establishments Rs25.00/m3
Notes: 1. About 75% of service connections have working meters. Unmetered connections are charged at 12.5% of annual rental value of the property. Domestic users are billed quarterly while all the others are billed monthly. 2. Water bills are paid at the water utility office. 3. There were 10,485 new connections in 2005–2006. The price of a new domestic connection is Rs660 plus Rs250/m beyond 1 meter service pipe length payable prior to connection.
Priority Needs of Utility
1. UFW reduction 2. Distribution management from service reservoir to consumers
3. GIS-based network interlinked with SCADA
Consumer Service
Average monthly consumption is about 156.3 m3 per house connection. The water bill averages Rs708.46 per month per house connection. Water is available at an average of 4 hours a day with an average pressure of 7 meters to most users. Applicants have to wait for about a month for a new connection to be made. A domestic connection fee is paid prior to connection. Water quality is good, with 90% of 64,000 water samples taken during the year passing the residual chlorine test. About 100,000 consumer complaints were recorded during the year. About 680 pipe breaks and 650 leaks were repaired in 2005–2006. Consumers can complain in person at the water utility office, or by letter or telephone. The urban poor are provided with stand post connection in general washing place for groups of five families at subsidized rates.
Performance
Highlights
MCGM provides water to its consumers at 191 lpcd at an average of 4 hours per day to all of the population in its area of responsibility. Production is metered and 75% of service connections have working meters. UFW of 13.6% is the second lowest. Financial management is mixed with very good operating ratio of 0.49 but accounts receivable of 11.8 months, which is the second highest. Average tariff of Rs4.60/m3 covers expenses with low UFW. Staff/1,000 connections ratio is the third highest at 17.2. MCGM needs to improve collection and water availability. Full metering is necessary to account for water use and to determine the extent of losses. It also needs to address staff productivity.

Area Profile MUMBAIMUMBAI WATER SUPPLY
Population: 13,000,000 1
Production/Distribution
Average Daily Production 3,200,000 m3
Groundwater NilSurface Water 100%Treatment Type 2 ConventionalStorage 997,180 m3
Service Area 3 439 sq kmDistribution Length 4,000 km
Service Connections
House (37 persons/HC) 255,897Public Tap NilCommercial 48,113Industrial 5,216Institutional NilBulk NilOthers (unmetered) 90,774Total 400,000
Service Indicators
Service Coverage 4 100.0%Water Availability 5 4 hours/dayPer Capita Consumption 6 191 lpcdAverage Tariff Rs4.60/m3
Efficiency Indicators
Unaccounted for Water 7 13.6%Unit Production Cost Rs3.67/m3
Operating Ratio 0.49Accounts Receivable 11.8 monthsStaff/1,000 Connections 17.2
Notes:
1 The population is for the present area served by the utility.2 About 90% of 64,000 samples taken passed the residual chlorine test.3 This is also the total area of responsibility.4 The city is totally covered by the utility. The urban poor comprise 35% of the population.5 About 100,000 consumer complaints were registered in 2005–2006.6 Production is metered and 75% of service connections have working meters.
About 680 pipe breaks and 650 leaks were repaired during the year.7 Commercial and industrial include institutional use and billing.8 Other cost includes transport and chemicals expenses and purchase of raw water.
Data as of 2005–2006.
Other8
39%
Repair and maintenance
4%
Personnel 38%
Power 19%
Commercial Industrial7
48%
Domestic52%
UFW13%
Commercial Industrial7
9%
Domestic78%
Annual Water BillingsRs4,640,300,000
Annual O&M CostsRs4,284,060,400
Annual Water Use1,168,000,000 m3
Mumbai 61

62 2007 Benchmarking and Data Book of Water Utilities in India
NAGPUR Utility Profile
Water Utility
NAGPUR MUNICIPAL CORPORATION
Address : Water Works Department, Pandit Jawaharlal Nehru Marg, Sitabuldi, Nagpur – 12, India Telephone : 91 712 256 7041 to 44 Fax : 91 712 256 1584 E-mail : [email protected] Head : Mr. S. S. Hastak, Executive Engineer (WWD)
Nagpur Municipal Corporation (NMC) was established as a municipal corporation in 1952. It provides water supply services to the city of Nagpur, which has a total population of 2,490,000 people. The present service area of NMC has a population density of 12,454 persons/km2. The utility is responsible for water production, distribution, and source development. It draws water mainly from the Pench and Kanhan Rivers. Billing and collection are handled by the private sector through a management contract; billing is computerized. The utility has a partly developed management information system. It publishes an annual report but it is not available to the public. NMC has a 25-year master development plan covering the period 2005–2031.
Mission Statement
“Water for all and 24/7 supply, 100% coverage in water supply and improved service levels.”
General Data
About Water Utility
Connections : 265,231 Staff : 856 Annual O&M Costs : Rs424,413,000 Annual Revenue : Rs561,500,000 Annual Billings : Rs704,300,000 Total Capital Expenditure : Rs953,231,000 Average capital expenditure/connection/year: Rs719.06 (Over the last 5 years) Source of Investment Funds : All from internally generated reserves
Tariff Structure METERED CONNECTIONS
Residential and Small Shops Nonresidential (Hospitals, Institutions, and Colonies) 1st 10 m3 – Rs3.00/m3; next 30 m3 – Rs3.50/m3 ;and Rs4.00 above
30 m3 with minimum monthly charges below Rs12.00/m3 subject to minimum monthly charges below
15 mm Rs 50 80 mm Rs8,000 15 mm Rs500 80 mm Rs11,000 20 mm Rs200 100 mm Rs9,000 20 mm Rs800 100 mm Rs19,000
25 mm Rs500 150 mm Rs15,000 25 mm Rs3,500 150 mm Rs23,000 40 mm Rs1,000 200 mm Rs30,000 40 mm Rs4,500 200 mm Rs45,000 50 mm Rs2,500 250 mm Rs50,000 50 mm Rs9,000 250 mm Rs70,000 UNMETERED RESIDENTIAL (Rs/month) UNMETERED NONRESIDENTIAL (Rs/month) 15 mm* 75 15 mm 300 20 mm 150 20 mm 600 25 mm 350 25 mm 2,000
* In notified slums, rate for 15” diameter connection is charged Rs25/month for houses whose roof has no slab and Rs50/month for those whose roof is with slab. Notes: 1. About 40% of service connections are metered. Public stand-post users pay on flat rate basis. Billing is done quarterly. 2. Water bills are paid at the water utility office and in banks. 3. There were 4,766 new connections in 2005–2006. The price of a new domestic connection is Rs1,675 payable prior to connection.
Priority Needs of Utility
1. Reduce raw water losses 2. Rehabilitation and upgrade of existing infrastructure
3. Upgrade and improvement of existing distribution network
Consumer Service
Average monthly consumption is about 34.4 m3 per house connection. Water is available at an average pressure of 15 meters to most users. Applicants have to wait for 15 days for a new connection to be made. A domestic connection fee of Rs1,675 is paid prior to connection. Water quality is good, with 92% of 36,500 water samples taken during the year passing the residual chlorine test. About 15,900 consumer complaints were recorded during the year. About 100 pipe breaks and 10,745 leaks were repaired in 2005–2006. Consumers can complain in person at the water utility office, or by letter or telephone. The urban poor are provided with house and public stand-post connections with flat rate monthly charges based on the type of house.
Performance Highlights
NMC provides water to its consumers at 100 lpcd at an average of 5 hours per day to 91.5% of the population in its area of responsibility. Production is metered and 40% of service connections have working meters. UFW of 51.9% is the third highest and should be reduced. While operating ratio is good at 0.76, accounts receivable of 9.6 months are the third highest. Average tariff of Rs6.60/m3 is the fifth highest and is covering expenses well. Staff/1,000 connections ratio is the fifth lowest at 3.2. NMC needs to exert efforts to reduce its UFW and improve collection and water availability. Full metering is necessary to account for water use and to determine the extent of losses if UFW is to be reduced.

Area Profile NAGPURNAGPUR WATER SUPPLY
Population: 2,302,990 1
Production/Distribution
Average Daily Production 608,220 m3
Groundwater NilSurface Water 100%Treatment Type 2 ConventionalStorage 150,790 m3
Service Area 3 184.9 sq kmDistribution Length 1,700 km
Service Connections
House (10.5 persons/HC) 201,051Public Tap (75 persons/PT) 3,500Commercial 7,084 Industrial NilInstitutional NilBulk NilOthers 53,596Total 265,231
Service Indicators
Service Coverage 4 91.5%Water Availability 5 5 hours/dayPer Capita Consumption 100 lpcdAverage Tariff Rs6.60/m3
Efficiency Indicators
Unaccounted [for] Water 6 51.9%Unit Production Cost Rs1.91/m3
Operating Ratio 0.76Accounts Receivable 9.6 monthsStaff/1,000 Connections 3.2
Notes:
1 The population is for the present area served by the utility.2 About 92% of 36,500 samples taken passed the residual chlorine test.3 The total area of responsibility is 217.6 sq km (km2).4 This is the percentage of the population served by house connections and public taps.
About 8.5% of the population draw water from tube wells and tankers provided by the utility.5 About 15,900 consumer complaints were registered in 2005–2006.6 Production is metered and 40% of service connections have working meters.
About 100 pipe breaks and 10,745 leaks were repaired during the year.7 Commercial and industrial include institutional use and billing.8 Other cost includes transport, chemicals, and purchase of raw water.
Data as of 2005–2006.
Other8
37%Repair and maintenance
1%
Personnel 14%
Power 48%
Other8%
UFW52%
Commercial Industrial7
3%
Domestic37%
Annual Water BillingsRs704,300,000
Annual O&M CostsRs424,413,000
Annual Water Use222,000,000 m3
No breakdown given
Nagpur 63
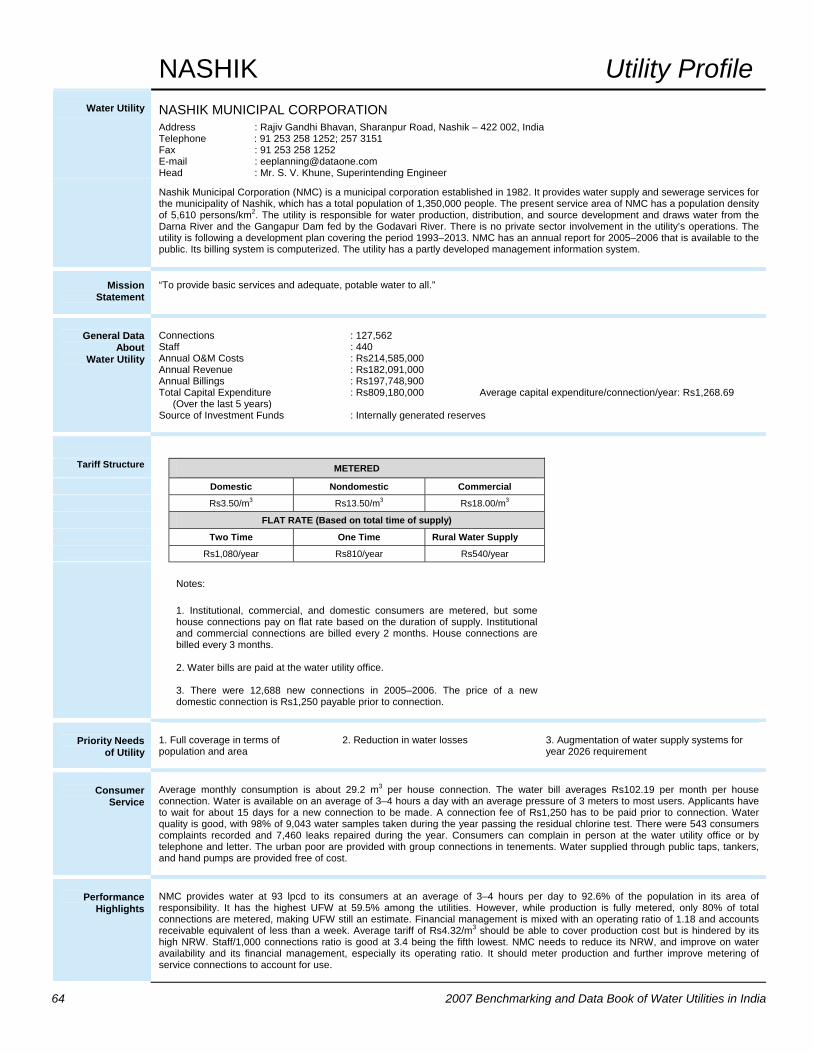
64 2007 Benchmarking and Data Book of Water Utilities in India
NASHIK Utility Profile
Water Utility NASHIK MUNICIPAL CORPORATION
Address : Rajiv Gandhi Bhavan, Sharanpur Road, Nashik – 422 002, India Telephone : 91 253 258 1252; 257 3151 Fax : 91 253 258 1252 E-mail : [email protected] Head : Mr. S. V. Khune, Superintending Engineer
Nashik Municipal Corporation (NMC) is a municipal corporation established in 1982. It provides water supply and sewerage services for the municipality of Nashik, which has a total population of 1,350,000 people. The present service area of NMC has a population density of 5,610 persons/km2. The utility is responsible for water production, distribution, and source development and draws water from the Darna River and the Gangapur Dam fed by the Godavari River. There is no private sector involvement in the utility’s operations. The utility is following a development plan covering the period 1993–2013. NMC has an annual report for 2005–2006 that is available to the public. Its billing system is computerized. The utility has a partly developed management information system.
Mission Statement
“To provide basic services and adequate, potable water to all.”
General Data
About Water Utility
Connections : 127,562 Staff : 440 Annual O&M Costs : Rs214,585,000 Annual Revenue : Rs182,091,000 Annual Billings : Rs197,748,900 Total Capital Expenditure : Rs809,180,000 Average capital expenditure/connection/year: Rs1,268.69 (Over the last 5 years) Source of Investment Funds : Internally generated reserves
Tariff Structure METERED
Domestic Nondomestic Commercial Rs3.50/m3 Rs13.50/m3 Rs18.00/m3
FLAT RATE (Based on total time of supply) Two Time One Time Rural Water Supply Rs1,080/year Rs810/year Rs540/year
Notes: 1. Institutional, commercial, and domestic consumers are metered, but some house connections pay on flat rate based on the duration of supply. Institutional and commercial connections are billed every 2 months. House connections are billed every 3 months. 2. Water bills are paid at the water utility office. 3. There were 12,688 new connections in 2005–2006. The price of a new domestic connection is Rs1,250 payable prior to connection.
Priority Needs
of Utility
1. Full coverage in terms of population and area
2. Reduction in water losses
3. Augmentation of water supply systems for year 2026 requirement
Consumer
Service
Average monthly consumption is about 29.2 m3 per house connection. The water bill averages Rs102.19 per month per house connection. Water is available on an average of 3–4 hours a day with an average pressure of 3 meters to most users. Applicants have to wait for about 15 days for a new connection to be made. A connection fee of Rs1,250 has to be paid prior to connection. Water quality is good, with 98% of 9,043 water samples taken during the year passing the residual chlorine test. There were 543 consumers complaints recorded and 7,460 leaks repaired during the year. Consumers can complain in person at the water utility office or by telephone and letter. The urban poor are provided with group connections in tenements. Water supplied through public taps, tankers, and hand pumps are provided free of cost.
Performance
Highlights
NMC provides water at 93 lpcd to its consumers at an average of 3–4 hours per day to 92.6% of the population in its area of responsibility. It has the highest UFW at 59.5% among the utilities. However, while production is fully metered, only 80% of total connections are metered, making UFW still an estimate. Financial management is mixed with an operating ratio of 1.18 and accounts receivable equivalent of less than a week. Average tariff of Rs4.32/m3 should be able to cover production cost but is hindered by its high NRW. Staff/1,000 connections ratio is good at 3.4 being the fifth lowest. NMC needs to reduce its NRW, and improve on water availability and its financial management, especially its operating ratio. It should meter production and further improve metering of service connections to account for use.

Area Profile NASHIKNASHIK WATER SUPPLY
Population: 1,350,000 1
Production/Distribution
Average Daily Production 310,000 m3
Groundwater NilSurface Water 100%Treatment Type 2 ConventionalStorage 98,500 m3
Service Area 3 240.6 sq kmDistribution Length 1,440 km
Service Connections
House (9.25 persons/HC) 121,072Public Tap (185 persons/PT) 700Commercial 2,797Industrial NilInstitutional 2,993Bulk NilOthers NilTotal 127,562
Service Indicators
Service Coverage 4 92.6%Water Availability 5 3 to 4 hours/dayPer Capita Consumption 93 lpcdAverage Tariff Rs4.32/m3
Efficiency Indicators
Unaccounted for Water 6 59.5%Unit Production Cost Rs1.90/m3
Operating Ratio 1.18Accounts Receivable 0.03 monthStaff/1,000 Connections 3.4
Notes:
1 The population is for the present area served by the utility.2 About 98% of 9,043 samples taken passed the residual chlorine test.3 This is also the total area of responsibility.4 This is the percentage of the population served by house connections and public taps.
About 2% of the population draw water from tube wells and tankers provided by the utility.The urban poor comprise 15% of the population.
5 About 543 consumer complaints were registered in 2005–2006.6 Production is not metered and only 80% of service connections have working meters.
About 5,135 pipe breaks and 7,460 leaks were repaired during the year.7 Commercial and industrial include institutional use and billing.8 Other cost includes transport, chemicals, and purchase of raw water.
Data as of 2005–2006.
Other8
20%Repair and
maintenance 1%
Personnel 35%
Power 44%
Commercial Industrial7
25%
Domestic75%
UFW60%
Commercial Industrial7
3%Domestic
37%
Annual Water BillingsRs197,748,920
Annual O&M CostsRs214,585,000
Annual Water Use113,150,000 m3
Nashik 65

66 2007 Benchmarking and Data Book of Water Utilities in India
RAJKOT Utility Profile
Water Utility
RAJKOT MUNICIPAL CORPORATION
Address : Dr. Ambedkar Bhavan, Dhebarbhai Road, Rajkot – 360 001, India Telephone : 91 281 222 4133 Fax : 91 281 222 4258 E-mail : [email protected] Head : Mr. M. R. Kamaliya, Additional City Engineer
Rajkot Municipal Corporation (RMC) is a municipal corporation established in 1973. It provides water supply and sewerage services for the city of Rajkot, which has a total population of 1,002,000 people. The present service area of RMC has a population density of 9,346 persons/km2. The utility is responsible for water production, distribution, and source development. RMC draws water mainly from the Bhadar, Nyari, Aji, and Narmada Rivers. The private sector is involved in pump operations, mains and lines maintenance, sluice valve operations, and leak repair through service contracts. The utility is following a development plan covering the period 2005–2011. The latest annual report is for 2003, which is available to the public. Its billing, accounting, and redressal systems are computerized. The utility has a partly developed management information system.
Mission
Statement
“By ensuring optimum use of resources and sustainability of urban environment to provide efficient and cost-effective basic services to each and every citizen of Rajkot and facilitating economic, social, cultural, and educational development.”
General Data
About Water Utility
Connections : 193,879 Staff : 211 Annual O&M Costs : Rs148,500,000 Annual Revenue : Rs92,400,000 Annual Billings : Rs203,833,390 Total Capital Expenditure : Rs792,254,000 Average capital expenditure/connection/year: Rs817.27 (Over the last 5 years) Source of Investment Funds : 90% internally generated reserves; 2% government grant; 8% commercial loan
Tariff Structure METERED*
Government School Residential Any Other Use Rs6.00/m3 Rs12.00/m3 Rs24.00/m3
FLAT RATE (Rs/month) (Based connection size and category) Size
(mm) Residential Nonresidential Size (mm) Government School and Residential
Any Other Building
High Rise Residential
10 40.00 80.00 20 360.00 2,900.00 216.00 15 50.00 100.00 25 600.00 4,800.00 360.00 20 120.00 240.00 30 900.00 7,200.00 540.00 : : : :
* Minimum charge is based on flat monthly rate according to category and size 300 24,000.00 192,000.00 14,400.00
Notes: 1. Only 715 institutional, commercial, industrial, and high-rise residential buildings are metered. Residential house connections pay a monthly flat rate. 2. Water bills are paid at the water utility office and city civic centers. 3. There were 7,000 new connections in 2005–2006. The price of a new domestic connection is Rs1,850 payable prior to connection.
Priority Needs of Utility
1. Source augmentation
2. Leak minimization 3. 100% cost recovery
Consumer Service
Average monthly consumption is about 15.1 m3 per house connection. The water bill averages Rs50 per month per house connection. Water is available on an average of merely 20 minutes a day with an average pressure of 10 meters to most users. Applicants have to wait for about 3 days for a new connection to be made. A connection fee of Rs1,850 has to be paid prior to connection. Water quality is fair, with 88% of 58,400 water samples taken during the year passing the residual chlorine test. There were 4,568 consumers complaints recorded, and 23,500 pipe breaks and leaks repaired during the year. Consumers can complain in person at the water utility office and at the city civic center, or by telephone. The urban poor are provided with free water supplied through public stand posts and tankers.
Performance Highlights
RMC provides water at 101 lpcd to its consumers at an average of 20 minutes per day to 98.1% of the population in its area of responsibility. UFW is 23.5% with practically no metering for both production and service connections, making the UFW an estimate. Financial management needs improvement with an operating ratio of 1.61 and accounts receivable equivalent of 6.6 months. Average tariff of Rs5.07/m3 is not covering production cost. Staff/1,000 connections ratio is good at 1.1 being the second lowest. RMC needs to address its very low water availability, and high operating ratio and accounts receivable equivalent. It should meter production and service connections to account for use and determine its losses to reduce UFW.

Area Profile RAJKOTRAJKOT WATER SUPPLY
Population: 980,000 1
Production/Distribution
Average Daily Production 143,836 m3
Groundwater NilSurface Water 100%Treatment Type 2 ConventionalStorage 198,000 m3
Service Area 3 104.9 sq kmDistribution Length 1,850 km
Service Connections
House (5 persons/HC) 192,000Public Tap (20 persons/PT) 1,150Commercial 300Industrial 180Institutional 85Bulk 150Others 14Total 193,879
Service Indicators
Service Coverage 4 98.1%Water Availability 5 0.33 hour/dayPer Capita Consumption 101 lpcdAverage Tariff Rs5.07/m3
Efficiency Indicators
Unaccounted for Water 6 23.5%Unit Production Cost Rs2.83/m3
Operating Ratio 1.61Accounts Receivable 6.6 monthsStaff/1,000 Connections 1.1
Notes:
1 The population is for the present area served by the utility.2 About 8% of 58,400 samples taken passed the residual chlorine test.3 This is also the total area of responsibility.4 This is the percentage of population served by house connections and public taps. Those not served
by the utility draw water from tube wells. The urban poor comprise 2% of the population.5 About 4,568 consumer complaints were registered in 2005–2006.6 Production is not metered and only 0.4 % of service connections have working meters.
About 23,500 pipe breaks and leaks were repaired during the year.7 Commercial and industrial include institutional use and billing.8 Other includes costs of transport, chemicals, and purchase of raw water.
Data as of 2005–2006.
Other8
29%
Repair and maintenance
30%
Personnel 13%
Power 28%
Commercial Industrial7
34%
Domestic66%
UFW23%
Commercial Industrial7
8%
Domestic69%
Annual Water BillingsRs203,833,390
Annual O&M CostsRs148,500,000
Annual Water Use52,500,000 m3
Rajkot 67
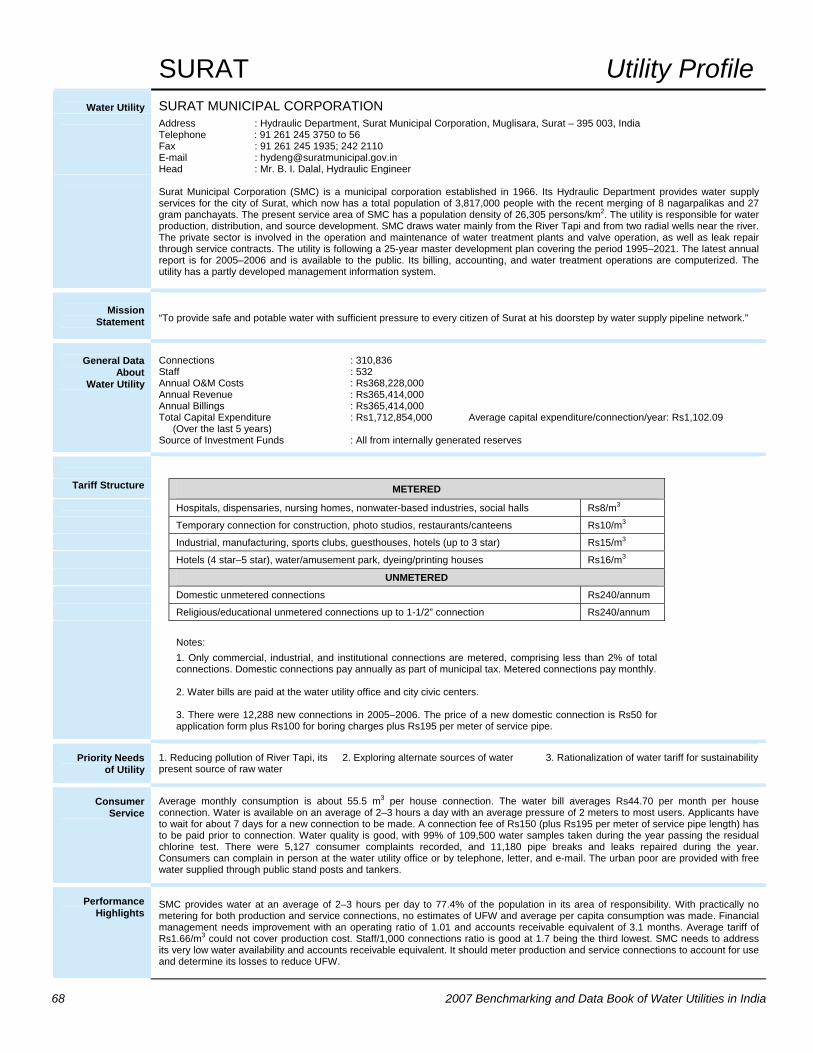
68 2007 Benchmarking and Data Book of Water Utilities in India
SURAT Utility Profile
Water Utility
SURAT MUNICIPAL CORPORATION
Address : Hydraulic Department, Surat Municipal Corporation, Muglisara, Surat – 395 003, India Telephone : 91 261 245 3750 to 56 Fax : 91 261 245 1935; 242 2110 E-mail : [email protected] Head : Mr. B. I. Dalal, Hydraulic Engineer
Surat Municipal Corporation (SMC) is a municipal corporation established in 1966. Its Hydraulic Department provides water supply services for the city of Surat, which now has a total population of 3,817,000 people with the recent merging of 8 nagarpalikas and 27 gram panchayats. The present service area of SMC has a population density of 26,305 persons/km2. The utility is responsible for water production, distribution, and source development. SMC draws water mainly from the River Tapi and from two radial wells near the river. The private sector is involved in the operation and maintenance of water treatment plants and valve operation, as well as leak repair through service contracts. The utility is following a 25-year master development plan covering the period 1995–2021. The latest annual report is for 2005–2006 and is available to the public. Its billing, accounting, and water treatment operations are computerized. The utility has a partly developed management information system.
Mission
Statement
“To provide safe and potable water with sufficient pressure to every citizen of Surat at his doorstep by water supply pipeline network.”
General Data
About Water Utility
Connections : 310,836 Staff : 532 Annual O&M Costs : Rs368,228,000 Annual Revenue : Rs365,414,000 Annual Billings : Rs365,414,000 Total Capital Expenditure : Rs1,712,854,000 Average capital expenditure/connection/year: Rs1,102.09 (Over the last 5 years) Source of Investment Funds : All from internally generated reserves
Tariff Structure METERED Hospitals, dispensaries, nursing homes, nonwater-based industries, social halls Rs8/m3
Temporary connection for construction, photo studios, restaurants/canteens Rs10/m3
Industrial, manufacturing, sports clubs, guesthouses, hotels (up to 3 star) Rs15/m3
Hotels (4 star–5 star), water/amusement park, dyeing/printing houses Rs16/m3
UNMETERED Domestic unmetered connections Rs240/annum Religious/educational unmetered connections up to 1-1/2” connection Rs240/annum
Notes: 1. Only commercial, industrial, and institutional connections are metered, comprising less than 2% of total connections. Domestic connections pay annually as part of municipal tax. Metered connections pay monthly. 2. Water bills are paid at the water utility office and city civic centers. 3. There were 12,288 new connections in 2005–2006. The price of a new domestic connection is Rs50 for application form plus Rs100 for boring charges plus Rs195 per meter of service pipe.
Priority Needs of Utility
1. Reducing pollution of River Tapi, its present source of raw water
2. Exploring alternate sources of water 3. Rationalization of water tariff for sustainability
Consumer Service
Average monthly consumption is about 55.5 m3 per house connection. The water bill averages Rs44.70 per month per house connection. Water is available on an average of 2–3 hours a day with an average pressure of 2 meters to most users. Applicants have to wait for about 7 days for a new connection to be made. A connection fee of Rs150 (plus Rs195 per meter of service pipe length) has to be paid prior to connection. Water quality is good, with 99% of 109,500 water samples taken during the year passing the residual chlorine test. There were 5,127 consumer complaints recorded, and 11,180 pipe breaks and leaks repaired during the year. Consumers can complain in person at the water utility office or by telephone, letter, and e-mail. The urban poor are provided with free water supplied through public stand posts and tankers.
Performance Highlights
SMC provides water at an average of 2–3 hours per day to 77.4% of the population in its area of responsibility. With practically no metering for both production and service connections, no estimates of UFW and average per capita consumption was made. Financial management needs improvement with an operating ratio of 1.01 and accounts receivable equivalent of 3.1 months. Average tariff of Rs1.66/m3 could not cover production cost. Staff/1,000 connections ratio is good at 1.7 being the third lowest. SMC needs to address its very low water availability and accounts receivable equivalent. It should meter production and service connections to account for use and determine its losses to reduce UFW.
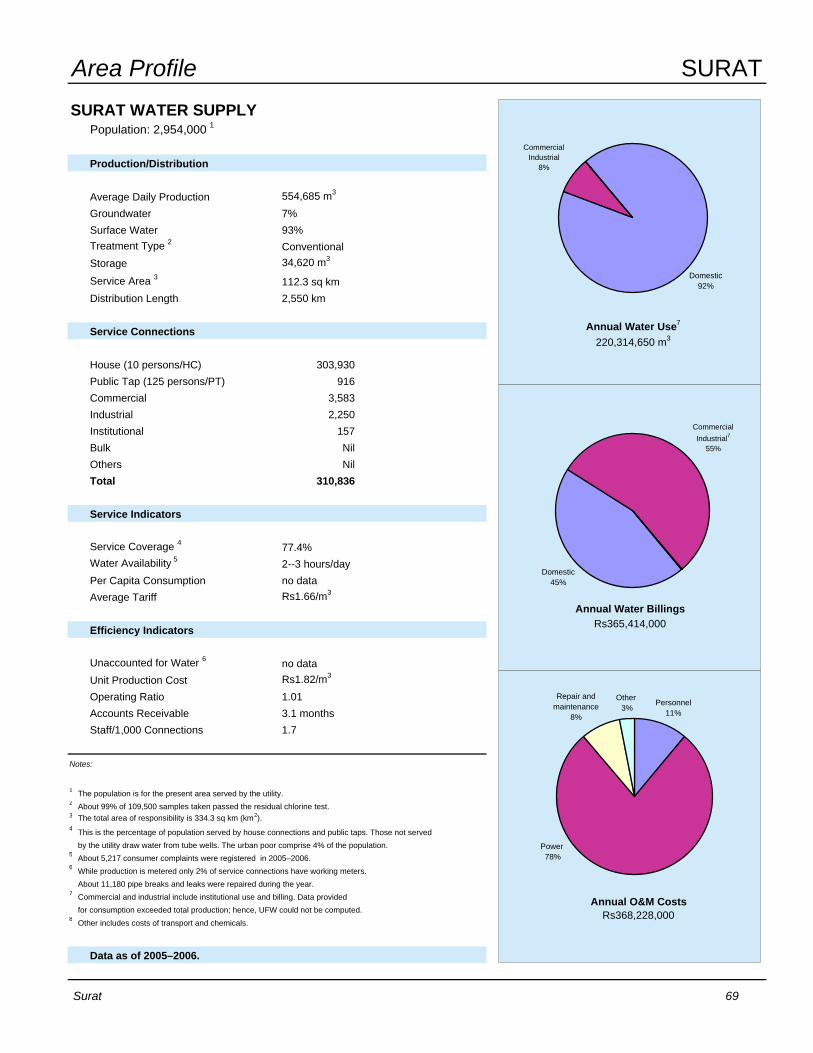
Area Profile SURATSURAT WATER SUPPLY
Population: 2,954,000 1
Production/Distribution
Average Daily Production 554,685 m3
Groundwater 7%Surface Water 93%Treatment Type 2 ConventionalStorage 34,620 m3
Service Area 3 112.3 sq kmDistribution Length 2,550 km
Service Connections
House (10 persons/HC) 303,930Public Tap (125 persons/PT) 916Commercial 3,583Industrial 2,250Institutional 157Bulk NilOthers NilTotal 310,836
Service Indicators
Service Coverage 4 77.4%Water Availability 5 2--3 hours/dayPer Capita Consumption no dataAverage Tariff Rs1.66/m3
Efficiency Indicators
Unaccounted for Water 6 no dataUnit Production Cost Rs1.82/m3
Operating Ratio 1.01Accounts Receivable 3.1 monthsStaff/1,000 Connections 1.7
Notes:
1 The population is for the present area served by the utility.2 About 99% of 109,500 samples taken passed the residual chlorine test.3 The total area of responsibility is 334.3 sq km (km2).4 This is the percentage of population served by house connections and public taps. Those not served
by the utility draw water from tube wells. The urban poor comprise 4% of the population.5 About 5,217 consumer complaints were registered in 2005–2006.6 While production is metered only 2% of service connections have working meters.
About 11,180 pipe breaks and leaks were repaired during the year.7 Commercial and industrial include institutional use and billing. Data provided
for consumption exceeded total production; hence, UFW could not be computed.8 Other includes costs of transport and chemicals.
Data as of 2005–2006.
Other 3%
Repair and maintenance
8%
Personnel 11%
Power 78%
Commercial Industrial7
55%
Domestic45%
Commercial Industrial
8%
Domestic92%
Annual Water BillingsRs365,414,000
Annual O&M CostsRs368,228,000
Annual Water Use7
220,314,650 m3
Surat 69
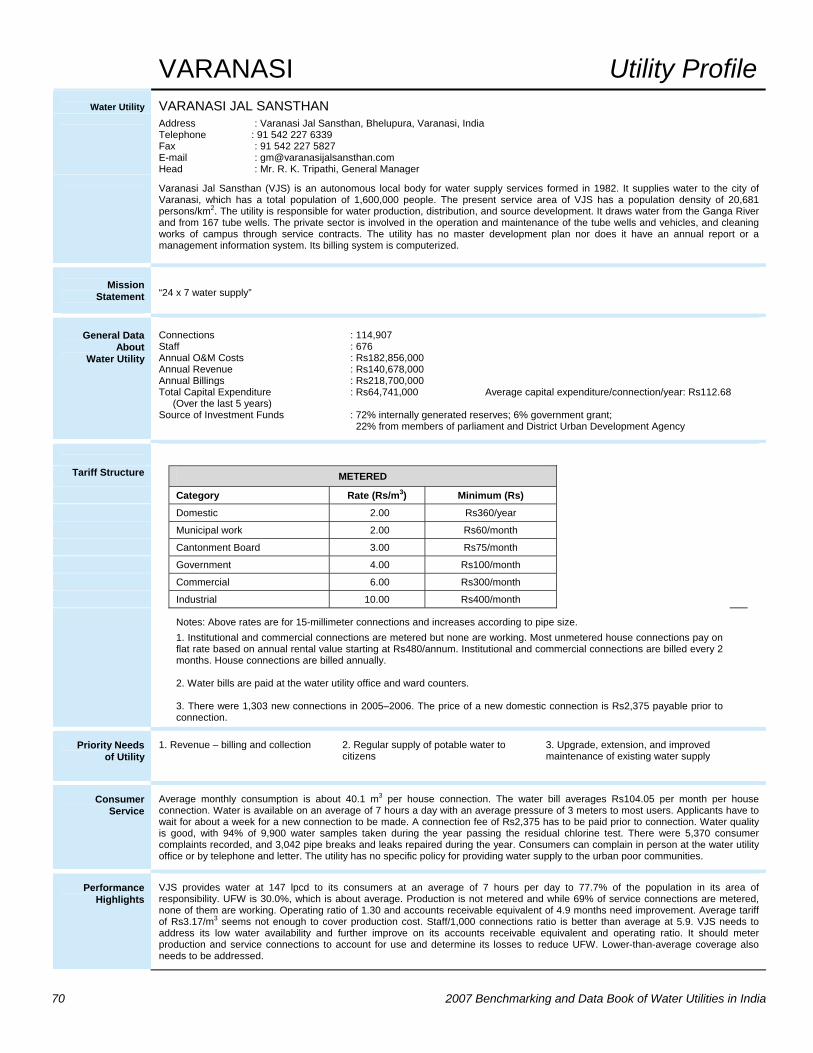
70 2007 Benchmarking and Data Book of Water Utilities in India
VARANASI Utility Profile
Water Utility
VARANASI JAL SANSTHAN
Address : Varanasi Jal Sansthan, Bhelupura, Varanasi, India Telephone : 91 542 227 6339 Fax : 91 542 227 5827 E-mail : [email protected] Head : Mr. R. K. Tripathi, General Manager
Varanasi Jal Sansthan (VJS) is an autonomous local body for water supply services formed in 1982. It supplies water to the city of Varanasi, which has a total population of 1,600,000 people. The present service area of VJS has a population density of 20,681 persons/km2. The utility is responsible for water production, distribution, and source development. It draws water from the Ganga River and from 167 tube wells. The private sector is involved in the operation and maintenance of the tube wells and vehicles, and cleaning works of campus through service contracts. The utility has no master development plan nor does it have an annual report or a management information system. Its billing system is computerized.
Mission
Statement
“24 x 7 water supply”
General Data
About Water Utility
Connections : 114,907 Staff : 676 Annual O&M Costs : Rs182,856,000 Annual Revenue : Rs140,678,000 Annual Billings : Rs218,700,000 Total Capital Expenditure : Rs64,741,000 Average capital expenditure/connection/year: Rs112.68 (Over the last 5 years) Source of Investment Funds : 72% internally generated reserves; 6% government grant; 22% from members of parliament and District Urban Development Agency
Tariff Structure METERED Category Rate (Rs/m3) Minimum (Rs) Domestic 2.00 Rs360/year Municipal work 2.00 Rs60/month
Cantonment Board 3.00 Rs75/month Government 4.00 Rs100/month Commercial 6.00 Rs300/month Industrial 10.00 Rs400/month
Notes: Above rates are for 15-millimeter connections and increases according to pipe size. 1. Institutional and commercial connections are metered but none are working. Most unmetered house connections pay on flat rate based on annual rental value starting at Rs480/annum. Institutional and commercial connections are billed every 2 months. House connections are billed annually. 2. Water bills are paid at the water utility office and ward counters. 3. There were 1,303 new connections in 2005–2006. The price of a new domestic connection is Rs2,375 payable prior to connection.
Priority Needs of Utility
1. Revenue – billing and collection 2. Regular supply of potable water to citizens
3. Upgrade, extension, and improved maintenance of existing water supply
Consumer Service
Average monthly consumption is about 40.1 m3 per house connection. The water bill averages Rs104.05 per month per house connection. Water is available on an average of 7 hours a day with an average pressure of 3 meters to most users. Applicants have to wait for about a week for a new connection to be made. A connection fee of Rs2,375 has to be paid prior to connection. Water quality is good, with 94% of 9,900 water samples taken during the year passing the residual chlorine test. There were 5,370 consumer complaints recorded, and 3,042 pipe breaks and leaks repaired during the year. Consumers can complain in person at the water utility office or by telephone and letter. The utility has no specific policy for providing water supply to the urban poor communities.
Performance Highlights
VJS provides water at 147 lpcd to its consumers at an average of 7 hours per day to 77.7% of the population in its area of responsibility. UFW is 30.0%, which is about average. Production is not metered and while 69% of service connections are metered, none of them are working. Operating ratio of 1.30 and accounts receivable equivalent of 4.9 months need improvement. Average tariff of Rs3.17/m3 seems not enough to cover production cost. Staff/1,000 connections ratio is better than average at 5.9. VJS needs to address its low water availability and further improve on its accounts receivable equivalent and operating ratio. It should meter production and service connections to account for use and determine its losses to reduce UFW. Lower-than-average coverage also needs to be addressed.

Area Profile VARANASIVARANASI WATER SUPPLY
Population: 1,489,000 1
Production/Distribution
Average Daily Production 270,000 m3
Groundwater 54%Surface Water 46%Treatment Type 2 ConventionalStorage 79,800 m3
Service Area 3 72 sq kmDistribution Length 590 km
Service Connections
House (10 persons/HC) 110,344Public Tap (100 persons/PT) 1,402Commercial 3,161Industrial NilInstitutional NilBulk NilOthers NilTotal 114,907
Service Indicators
Service Coverage 4 77.7%Water Availability 5 7 hours/dayPer Capita Consumption 147 lpcdAverage Tariff Rs3.17/m3
Efficiency Indicators
Unaccounted for Water 6 30.0%Unit Production Cost Rs2.07/m3
Operating Ratio 1.30Accounts Receivable 4.9 monthsStaff/1,000 Connections 5.9
Notes:
1 The population is for the present area served by the utility.2 About 94% of 9,900 samples taken passed the residual chlorine test.3 The total area of responsibility is 80 sq km (km 2).4 This is the percentage of population served by house connections and public taps.
About 15% of the population draw water from tube wells with hand pumps provided by the utility.5 About 5,370 consumer complaints were registered in 2005–2006.6 Production is not metered and while 69% of service connections are metered, none are working.
About 3,042 pipe breaks and leaks were repaired during the year.7 Commercial and industrial include institutional use and billing. 8 Other includes costs of transport and chemicals.
Data as of 2005–2006.
Other 8%
Repair and maintenance
3% Personnel 41%
Power 48%
Commercial Industrial7
30%
Domestic70%
UFW30%Commercial
Industrial7
2%
Domestic68%
Annual Water BillingsRs218,700,000
Annual O&M CostsRs182,856,000
Annual Water Use98,550,000 m3
Varanasi 71

72 2007 Benchmarking and Data Book of Water Utilities in India
VIJAYAWADA Utility Profile
Water Utility
VIJAYAWADA MUNICIPAL CORPORATION
Address : Jawaharlal Nehru Buildings, Vijayawada – 520 001, India Telephone : 91 866 242 2400 Fax : 91 866 242 4338 E-mail : [email protected] Head : Mr. N. Gulzar, Municipal Commissioner
Vijayawada Municipal Corporation (VMC) was established as a municipal corporation in 1983. It supplies water and sewerage services to the city of Vijayawada, which has a total population of 851,000 people. The present service area of VMC has a population density of 16,875 persons/km2. The utility is responsible for water production, distribution, and source development. It draws water solely from the Krishna River. The private sector is involved in billing and collection through a service contract. The utility follows a 15-year master development plan from 2006 to 2020. It does not have an annual report nor a management information system. Its billing and accounting systems are computerized.
Mission
Statement
“To provide 100% coverage by 2015, access to the poor by 2020. To achieve 24 hours supply for the city by 2015 and for the poor by 2020. To reduce NRW to 30% in 2010, 20% in 2015, and 10% in 2020. To achieve 80% cost recovery in 2010 and 100% in 2015.”
General Data
About Water Utility
Connections : 78,298 Staff : 445 Annual O&M Costs : Rs104,076,190 Annual Revenue : Rs91,283,640 Annual Billings : Rs79,784,020 Total Capital Expenditure : No data Average capital expenditure/connection/year: No data (Over the last 5 years) Source of Investment Funds : No data
Tariff Structure METERED Domestic Nondomestic 1st 3 m3 Rs100 minimum 1st 3 m3 Rs100 minimum Above 3 m3 Rs100 + Rs8.25/m3 3 m3 – 25 m3 Rs100 + Rs15.75/m3
25 m3 – 50 m3 Rs100 + Rs18.40/m3
50 m3 – above Rs100 + Rs21.00/m3
FLAT RATE Residential HSC (Regular) HSC (NSDP & BPL Card Holders) Rs80.00/month Rs50.00/month
Notes: 1. Metered connections are billed monthly while unmetered connections paying flat rates are billed every 6 months. 2. Water bills are paid at E-Seva where residents pay their taxes. 3. There were 3,769 new connections in 2005–2006. The price of a new domestic connection is Rs5,500 payable prior to connection. The poor pays Rs1,200 payable over 12 months.
Priority Needs of Utility
1. Every house to be provided with a tap
2. Accountability
3. Decrease in NRW
Consumer
Service
Average monthly consumption is about 26.3 m3 per house connection. The water bill averages Rs61.09 per month per house connection. Water is available on an average of 2–4 hours a day with an average pressure of 1–6 meters to most users. Applicants have to wait for about 7 days for a new connection to be made. A connection fee of Rs5,500 has to be paid prior to connection. Water quality is good, with 90% of 242,600 water samples taken during the year passing the residual chlorine test. There were 11,500 consumers complaints recorded, and 8,900 pipe breaks and 11,500 leaks repaired during the year. Consumers can complain in person at the water utility office or by telephone and letter. The utility collects lower connection and monthly charges for the urban poor.
Performance
Highlights
VMC provides water at 158 lpcd to its consumers at an average of 2–4 hours per day to 70.5% of the population in its area of responsibility. UFW is 23.8% but production is not metered and only 6.0% of service connections have working meters. Financial management is mixed with an operating ratio of 1.14 and accounts receivable equivalent of 1.60 months, which is the fourth lowest. Average tariff of Rs2.18/m3 is not enough to cover production cost. Staff/1,000 connections ratio is fair at 5.70, which is at the median. VMC needs to address its low water availability and reduce its operating ratio to less than about 0.75. It should meter production and service connections to account for use and determine its losses to reduce UFW. Lower-than-average coverage also needs to be addressed.
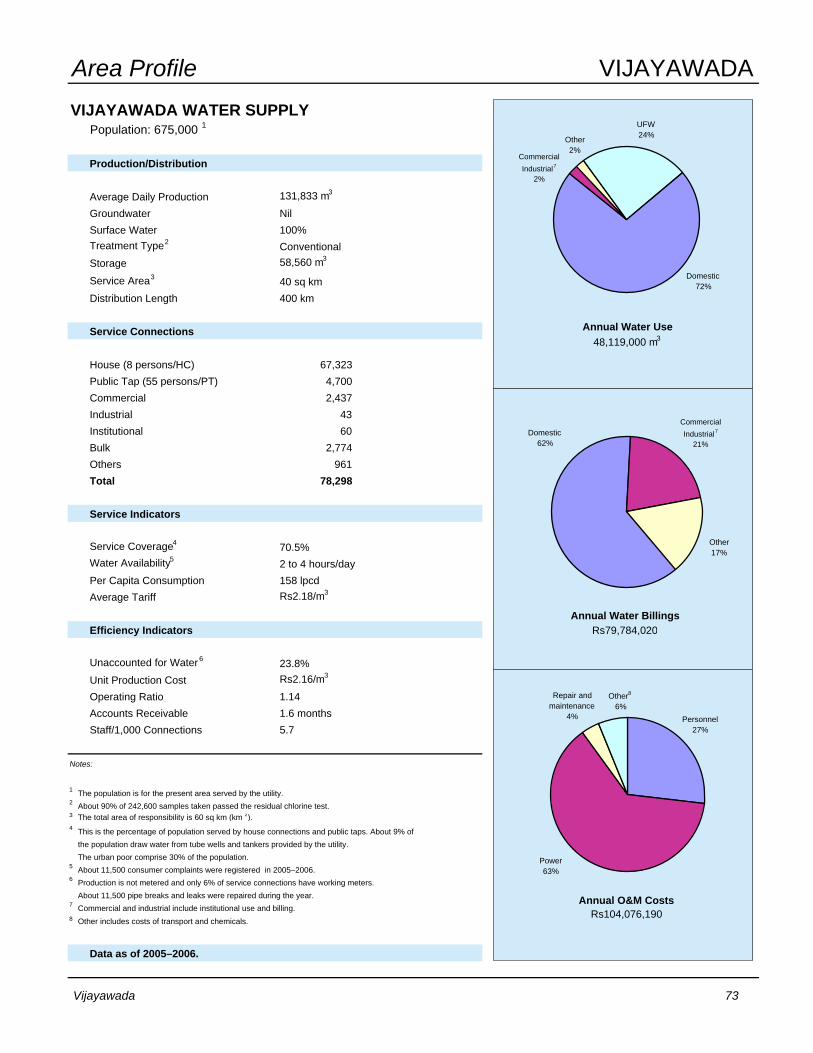
Area Profile VIJAYAWADAVIJAYAWADA WATER SUPPLY
Population: 675,000 1
Production/Distribution
Average Daily Production 131,833 m3
Groundwater NilSurface Water 100%Treatment Type 2 ConventionalStorage 58,560 m3
Service Area 3 40 sq kmDistribution Length 400 km
Service Connections
House (8 persons/HC) 67,323Public Tap (55 persons/PT) 4,700Commercial 2,437Industrial 43Institutional 60Bulk 2,774Others 961Total 78,298
Service Indicators
Service Coverage 4 70.5%Water Availability 5 2 to 4 hours/dayPer Capita Consumption 158 lpcdAverage Tariff Rs2.18/m3
Efficiency Indicators
Unaccounted for Water 6 23.8%Unit Production Cost Rs2.16/m3
Operating Ratio 1.14Accounts Receivable 1.6 monthsStaff/1,000 Connections 5.7
Notes:
1 The population is for the present area served by the utility.2 About 90% of 242,600 samples taken passed the residual chlorine test.3 The total area of responsibility is 60 sq km (km 2).4 This is the percentage of population served by house connections and public taps. About 9% of
the population draw water from tube wells and tankers provided by the utility.The urban poor comprise 30% of the population.
5 About 11,500 consumer complaints were registered in 2005–2006.6 Production is not metered and only 6% of service connections have working meters.
About 11,500 pipe breaks and leaks were repaired during the year.7 Commercial and industrial include institutional use and billing. 8 Other includes costs of transport and chemicals.
Data as of 2005–2006.
Other8
6%Repair and
maintenance 4% Personnel
27%
Power 63%
Other17%
Commercial Industrial7
21%Domestic
62%
Other2%
UFW24%
Commercial Industrial7
2%
Domestic72%
Annual Water BillingsRs79,784,020
Annual O&M CostsRs104,076,190
Annual Water Use48,119,000 m3
Vijayawada 73

74 2007 Benchmarking and Data Book of Water Utilities in India
VISAKHAPATNAM Utility Profile
Water Utility
GREATER VISAKHAPATNAM MUNICIPAL CORPORATION
Address : Tenneti Bhavan, Asilmetta, Visakhapatnam – 02, India Telephone : 91 891 274 6300 Fax : 91 891 256 8545 E-mail : [email protected] Head : Mr. Mukhesh Kumar Meena, Municipal Commissioner
Greater Visakhapatnam Municipal Corporation (GVMC) was established as a municipal corporation in 1901. It provides water supply and sewerage services to the Greater Visakhapatnam area, which has a total population of 1,523,000 people. The present service area of GVMC has a population density of 5,750 persons/km2. The utility is responsible for water production, distribution, and source development. It draws water from the Gostani, Godavari, Sarada, and Yeluru Rivers and from 5,053 tube wells. There is no private sector involvement in the utility’s operations. The utility follows a 15-year master development plan covering 2006–2020. It has an annual report for 2005–2006 that is available to the public and a partly developed management information system. Its billing and accounting systems, as well as the handling and monitoring of complaints and grievances, are computerized.
Mission
Statement
“To provide wholesome round-the-clock water supply to every household at affordable cost even to the poor.”
General Data
About Water Utility
Connections : 85,668 Staff : 466 Annual O&M Costs : Rs411,600,000 Annual Revenue : Rs525,000,000 Annual Billings : Rs609,700,000 Total Capital Expenditure : Rs1,667,000,000 Average capital expenditure/connection/year: Rs3,891.77 (Over the last 5 years) Source of Investment Funds : 60% internally generated reserves; 40% bonds
Tariff Structure METERED Category Minimum Rates (beyond minimum) Residential Rs4.00 up to 5 m3 Rs4.00/m3 beyond 5 m3
Apartments Rs4.00 up to 5 m3 Rs4.00/m3 for 5 m3 – 20 m3
Rs8.00/m3 beyond 20 m3
Bulk water Rs30.00/m3 up to agreed limit; Rs60.00/m3 beyond limit UNMETERED (Flat rate) Rs80.00/tap/month
Notes: 1. House connections pay on flat rate and are billed every 3 months. The rest are metered, with bulk supplies billed monthly and commercial apartments every 3 months. 2. Water bills are paid at the bank and E-seva centers. 3. There were 2,500 new connections in 2005–2006. The price of a new domestic connection is Rs2,000 payable prior to connection.
Priority Needs of Utility
1. Water supply improvement in quantity and quality
2. Refurbish and extend the distribution system at uniform service levels.
3. 100% coverage with 24/7 supply
Consumer
Service
Average monthly consumption is about 30.4 m3 per house connection. The water bill averages Rs56.12 per month per house connection. Water is available on an average of 1 hour a day with an average pressure of 4.0 meters to most users. Applicants have to wait for about a week for a new connection to be made. A connection fee of Rs2,000 has to be paid prior to connection. Water quality is good, with practically all of 730,000 water samples taken during the year passing the residual chlorine test. There were 6,180 consumer complaints recorded, and 5,000 pipe breaks and 5,112 leaks repaired during the year. Consumers can complain in person at the water utility office or by telephone, e-mail, SMS text messaging, and letter. The utility allows the urban poor to pay only Rs1,200 for connection fee payable in 12 monthly installments.
Performance
Highlights
GVMC provides water at 124 lpcd to its consumers at an average of only 1 hour per day to 49.2% of the population in its area of responsibility. UFW is 14.5% but production is not metered and only 1.3% of service connections have working meters. Financial management is good, with an operating ratio of 0.78 and accounts receivable equivalent of 3.3 months. Average tariff of Rs8.55/m3 is enough to cover production cost. Staff/1,000 connections ratio is fair at 5.4, which is at the median. GVMC needs to address its low water availability and population coverage, which is the lowest among the utilities. It should meter production and service connections to account for use and determine its losses to reduce UFW further.

Area Profile VISAKHAPATNAMVISAKHAPATNAM WATER SUPPLY
Population: 920,000 1
Production/Distribution
Average Daily Production 228,451 m3
Groundwater 20%Surface Water 80%Treatment Type 2 ConventionalStorage 86,420 m3
Service Area 3 160 sq kmDistribution Length 1,035 km
Service Connections
House (5 persons/HC) 76,468Public Tap (50 persons/PT) 8,122Commercial 134Industrial 63Institutional 62Bulk 818Others 1Total 85,668
Service Indicators
Service Coverage 4 49.2%Water Availability 5 1 hour/dayPer Capita Consumption 124 lpcdAverage Tariff Rs8.55/m3
Efficiency Indicators
Unaccounted for Water 6 14.5%Unit Production Cost Rs4.94/m3
Operating Ratio 0.78Accounts Receivable 3.3 monthsStaff/1,000 Connections 5.4
Notes:
1 The population is for the present area served by the utility.2 Almost all 730,000 samples taken, except for 83 samples, passed the residual chlorine test.3 Total area of responsibility is 533 sq km (km2).4 This is the percentage of population served by house connections and public taps.
About 13% of the population draw water from tube wells and tankers provided by the utility.The urban poor comprise 7% of the population.
5 About 6,180 consumer complaints were registered in 2005–2006.6 Production is not metered and only 1.3% of service connections have working meters.
About 5,000 pipe breaks and 5,112 leaks were repaired during the year.7 Commercial and industrial include institutional use and billing. 8 Other includes costs of transport, chemicals, and water cess payment.
Data as of 2005–2006.
Other8
41%
Repair and maintenance
19%
Personnel 17%
Power 23%
Other2%
Commercial Industrial7
90%
Domestic8%
Other13%
UFW14%
Commercial Industrial7
32%
Domestic41%
Annual Water BillingsRs609,700,000
Annual O&M CostsRs411,600,000
Annual Water Use83,384,670 m3
Visakhapatnam 75


AAPPPPEENNDDIICCEESS


APPENDIX 1
Indian Water Utilities Data Book
WATER UTILITY QUESTIONNAIRE
Date: ______________________
GENERAL UTILITY INFORMATION
1.1 Name of Water Utility: ____________________________________________________ Short Name/Acronym: ____________________________________________________ 1.2 Address: _______________________________________________________________ 1.3 Telephone Number(s):_________________ 1.4 Fax Number(s): ___________________ 1.5 E-mail address: _______________________________________ 1.6 Head of the Water Utility: Name : ____________________________ Title : ____________________________ 1.7 Year utility was formed: ___________ 1.8 Type of water utility:
___ Municipal Corporation/Council ___ State Board ___ City Board ___ Statewide agency ___ Private water utility ___ Municipal Corporation/Council (ring-fenced operations) ___ Others (Please specify) _______________
1.9 Type of services provided by utility: ___ Water supply services ___ Wastewater and sewerage services ___ Others (Please specify) _______________ 1.10 Is there Private Sector Involvement in the Water Utility? ___ Yes ___ No If Yes, in what aspect(s)? ___ Source Development ___ Production ___ Distribution ___ Management ___ Billing & Collection ___ Leak Repair ___ Other (Please specify) ___________________ 1.11 Type of private sector involvement: ___ Service contract ___ Mangement contract ___ Lease contract ___ Concession contract ___ BOT, BOOT contract ___ Full private ownership 1.12 Latest annual report available ___ none ______ (indicate year if available) 1.13 Is the annual report available to the general public? ___ Yes ___ No
Appendix 1 79
1.14 Management information system: ___ well developed ___ partly developed ___ non-existent 1.15 What aspects of the water utility’s operation are computerized or automated?
___ None ___ Billing ___ Accounting ___ Pumping ___ Treatment ___ Others ________________________ 1.16 Does the utility have a Master Development Plan? ___ Yes ___ No If Yes, indicate period covered. Year _____ to Year ______ 1.17 Does the utility have a mission statement? ___ Yes ___ No If Yes, please provide the mission statement. _______________________________________________________________________________ _______________________________________________________________________________ _______________________________________________________________________________ 1.18 Top three (3) priority needs of the utility: 1. ________________________________________ (As seen by management) 2. _________________________________________ 3. _________________________________________ SERVICE AREA
2.0 Water Utility Responsibility: 2.1 Number of cities/towns served by utility _______ 2.2 Name of cities/towns served ________________________________________ 2.3 Nature of service area ___ urban ___ rural ___ urban & rural 2.4 Province/state where utility is located _____________________ 2.5 Size of utility’s area of responsibility ________ sq. km. 2.6 Size of utility’s present service area ________ sq. km. 2.7 Population of utility’s area of responsibility _________ 2.8 Population of utility’s present service area _________ 2.9 Population served with house connections _________ Population served with public taps _________ Population served by tankers _________ Population served by hand pumps _________ 2.10 Where do households not connected to or served by your utility get their water supply?
___ Other piped water service providers ___ Tube wells ___ Dug wells ___ Ponds ___ Rain collectors ___ Others (please specify) _______________
80 2007 Benchmarking and Data Book of Water Utilities in India

PRODUCTION 3.0 Utility is responsible for ___ Production ___ Distribution ___ Source Development 3.1 Sources of Water: Annual production volume (cu m/year)
___ Surface water ___________________ ___ Groundwater ___________________
___ Other (please specify) _______________ ___________________ Total production: ___________________
3.2 Is total production all metered? (ex treatment plant) ___Yes ___ No If No, what proportion is metered? _____ % How is unmetered volume estimated? ____________________________________________________________________________ 3.3 Do you buy bulk water for distribution? Raw Water ___ Yes ___ No Treated Water ___ Yes ___ No 3.4 Main methods of treatment used: ___ none ___ disinfection ___ filtration ___ sedimentation ___ aeration ___ desalination ___ other (please specify) ______________________ 3.5 Total production capacity: _________ cu m /day 3.6 Storage capacity in network: _________ cu m DISTRIBUTION AND CONSUMPTION 4.10 Total Service Connections ___________ 4.11 Number of House Connections (HC) ___________ Average number of people per HC _______ 4.12 Number of Public Taps (PT) ___________ Average number of people per PT _______ 4.13 Number of Commercial Connections ___________ 4.14 Number of Industrial Connections ___________ 4.15 Number of Institutional Connections ___________ 4.16 Number of Bulk Connections ___________ (Apartments/condominiums) 4.17 Number of Bulk Connections (Others) ___________ 4.18 Number of other Connections ___________ (accounts served by tankers or handpumps) 4.19 Number of connections metered ___________ 4.20 Proportion of metered connections with operating meters: ____ %
Appendix 1 81

4.30 Total length of distribution network: ________ km 4.31 Average age of distribution pipes: ________ years 5.0 Water Consumption (annual volume of water billed/sold in 2006) Metered Estimated* Total (cu.m.) (cu.m.) (cu.m.) 5.1 Total for all HC ____________ ____________ ____________ 5.2 Total for all PT/SP ____________ ____________ ____________ 5.3 Total for all commercial use ____________ ____________ ____________ 5.4 Total for all industrial use ____________ ____________ ____________ 5.5 Total for all institutional use ____________ ____________ ____________ 5.6 Total for all bulk use (apt) ____________ ____________ ____________ 5.7 Total for all bulk use (others)____________ ____________ ____________ 5.8 Total for all other use ____________ ____________ ____________ 5.9 Grand Total ____________ ____________ ____________ * Estimated consumption refer to unmetered consumption (normally flat rate connections) WATER SERVICE PERFORMANCE (annual values for 2006) 6.1 Number of connections with intermittent supply: ______ connections 6.2 Typical duration of supply: ______ hours/day 6.3 Average mains water pressure at consumer points: ______ meters 6.4 Number of pipe breaks in the distribution network ______ 6.5 Number of meters replaced/repaired ______ 6.6 Required number of samples for residual chlorine: ______ 6.7 Number of samples for residual chlorine test taken: ______ 6.8 Number of samples passing residual chlorine test: ______
STAFF INFORMATION 7.1 Number of staff (in full-time equivalent – FTE)
• Corporate services (management, admin., finance, technical, etc) ___________ • Water supply operations (O&M, customer service, support services) ___________ • Other non-water supply services (wastewater, sewerage, drainage) ___________
Total number of staff: ___________
7.2 Number of personnel in contracted out services: _____________
7.3 Number of staff attending training in 2006: _____________
7.4 Total number of training days (sum of staff x training days attended): __________
7.5 Proportion of operating budget spent for training and human resources development: _____ %
7.6 Average annual salary of the three highest paid full-time management personnel:
Rs ________________________ CUSTOMER SERVICE 8.11 Number of new connections installed in 2006: __________
82 2007 Benchmarking and Data Book of Water Utilities in India

8.12 Average waiting time for a new connection __________
8.13 Number of connections disconnected in 2006 __________
8.14 Number of leaks reported/number of leaks repaired in 2006 ______/______
8.15 Number of customer complaints recorded in 2006: __________
8.16 Means of making complaints: ___Letter ___ Telephone ___ In person ___ E-mail ___ SMS (txt msg) ___ Other _________
8.17 How much are the typical connection charges for new customers? • Domestic Rs. ___________
8.18 How are new domestic connection charges paid?
___ all at the start ___ over 12 months or less ___ over more than 12 months 8.19 Does your water utility have a policy for providing water supply to the urban poor? ___Yes ___ No If Yes, briefly state the policy. ______________________________________________________________________
______________________________________________________________________ ______________________________________________________________________ 8.20 What percentage of the population in the service comprise the urban poor? _______ 8.21 Does the ULB have a citizen charter? _____ Yes _____ No
If yes, what does the charter say about water supply services?__________________________
_____________________________________________________________________________ 8.22 Does the ULB carry out citizen satisfaction surveys? _____ Yes _____ No
If yes, how often? ________________. When was the last survey done? ____________ 8.23 Does the ULB have a time frame for grievance redressal? _____ Yes _____ No
If yes, what is the maximum time a grievance should be redressed? ____________________ 8.24 Does the ULB have community participation in its water supply services?
_____ Yes _____ No If yes, describe how it is done. _____________________________
_____________________________________________________________________________
_____________________________________________________________________________
8.25 Does the ULB have a RWA feedback mechanism in place? _____ Yes _____ No FINANCIAL DATA 9.11 Water billing/sales (annual for year 2006) (Rupees)
• Total for all HC Rs. _______________ • Total for all PT/SP Rs. _______________ • Total for all commercial use Rs. _______________ • Total for all industrial use Rs. _______________ • Total for all institutional use Rs. _______________ • Total for all bulk use (apartments) Rs. _______________ • Total for all bulk use (others) Rs. _______________ • Total for all other use Rs. _______________
Appendix 1 83

• Grand Total Rs. _______________ 9.12 Basis for Billing for Water
Consumers Pay on: ___ Metered Use ___ Flat Rate 9.13 How frequent are consumers billed?
___ Monthly ___ Every 2 months ___ Others _____________ 9.14 Methods of Payment
Water bills are paid through ___ Bill Collector ___ Water Utility Office ___ Bank ___ Automated Teller Machine ___ Post Office ___ Others ______________
9.15 Water supply revenue in 2006
• Water sales (consumption charges, connection, etc): Rs. ______________________ • Other revenues (materials sales, construction, etc.): Rs. ______________________ • Subsidies/grants (government and other sources): Rs. ______________________
9.16 Year end accounts receivable (water billing & all other outstanding invoices): Rs. _________________ 9.17 Water supply O & M expenses in 2006:
• Purchase of Bulk Supply (raw water or treated water) Rs. ____________ • Personnel Rs. ____________ • Power/Fuel Rs. ____________ • Chemicals and materials Rs. ____________ • Repair and maintenance Rs. ____________ • Transport Rs. ____________ • Depreciation Rs. ____________ • Other (Identify) _____________________________ Rs. ____________
Total O&M Cost Rs. ____________
The cost of contracted services (cost of services provided by private firms) may be placed under Other.
9.18 Total debt service (interest and principal) in 2006: Rs. ______________________ 9.19 Annual capital development expenses in 2006: Rs. ______________________ 9.20 Total Capital Expenditure in the last 5 years: Rs. ______________________ Funded by: ___ internally generated reserves ______ % ___ government grant ______ % ___ government loan ______ % ___ commercial loan ______ % ___ other ____________________ ______ %
Total: 100 % 9.21 Gross fixed asset value including works in progress: Rs. ____________________
84 2007 Benchmarking and Data Book of Water Utilities in India

TARIFF STRUCTURE 10.0 Please submit a copy of the tariff structure/rates used in 2006. 11.0 What data/information on water supply services are reported or disclosed by the ULB to the
general public? Please enumerate/indicate ______________________________________
_________________________________________________________________________
PLEASE FORWARD COMPLETED QUESTIONNAIRE PLUS: 1) Copy of latest annual report 2) Copy of current Tariff Structure *
* Give details of when it was approved or became effective BY COURIER SERVICE OR MAIL TO:
Mr. S. Krishnamurthy Benchmarking Coordinator Mailing Address in India
This questionnaire may also be sent:
a) by fax to Fax No. xxx xxxx, or b) as an attachment by e-mail to: [email protected] with copy to
[email protected] and [email protected]. (You may request for electronic copies of the questionnaire and guide.)
This Questionnaire was completed by:
Name : _____________________________ Designation : _____________________________ Address : _____________________________ Telephone : _____________________________ Fax : _____________________________ Mobile phone : _____________________________ E-mail : _____________________________
Appendix 1 85

86 2007 Benchmarking and Data Book of Water Utilities in India
APPENDIX 2
SUGGESTED EVALUATION CRITERIA FOR UTILITIES
Consumer Satisfaction 40% Coverage 10% Water Availability 10% Service Level 10% New Connection Fee 10% Water Resources Management 20% Water Production/Population 5% UFW/Metering 10% Consumption 5% Financial Resource Management 20% Grant Financing 5% Operating Ratio 10% Accounts Receivable 5% Human Resource Management 10% Staff/1,000 Connections 5% Management Salaries 5% Accountability 10% Annual Report 10% Total 100% 100%
Notes Coverage (House Connections) 10% 100% 10% >50% 5% <50% 0% Water Availability 10% 24 hours 10% >12 hours 5% <12 hours 0% Service Level 10% (a) No public Taps 5% Public Taps 0% (b) 100-200 l/c/d 5% <100 l/c/d or>200 l/c/d 0%

Appendix 2 87
New Connection Fee1 10% Reasonable Cost 5% High Cost 0% Installments to Pay 5% Total Fee upfront 0% Water Production/Population 5% <0.5 m3/day/person 5% >0.5 m3/day/person 0% UFW/Metering 10% Full Metering 5% Partial Metering 0% UFW < 25% 5% UFW > 25% 0% Consumption 5% <200 l/c/d 5% >200 l/c/d 0% Grant Financing 5% Nil 5% Any 0% Operating Ratio 10% <0.75 10% 0.75 - 1.00 5% > 1.00 0% Accounts Receivable 5% <3 months 5% >3 months 0% Staff/1,000 Connections 5% <10 5% >10 0% Management Salaries2 5% Above Government Level 5% Government Level 0% Accountability 10% Annual Report Available to Public 5% Annual Report Unavailable 0% Timely Report (within 12 months) 5% Reporting after 12 months 0%
During the Results Dissemination Workshop, the participating utilities agreed on the following:
1 Reasonable connection fee : Rs2,500 2 Government level salary : Rs30,000/month

Asian Development Bank6 ADB Avenue, Mandaluyong City1550 Metro Manila, Philippineswww.adb.orgPublication Stock No. 120507ISBN 978-971-561-648-5 Printed in the Philippines
2007 Benchmarking and Data Book of Water Utilities in India
Benchmarking is an effective tool to improve performance. The 2007 Benchmarking and Data Book of Water Utilities in India provides information on water utilities in 20 cities of the Jawaharlal Nehru National Urban Renewal Mission (JNNURM). The analysis and profiles in this data book would be useful in identifying new JNNURM projects to improve water utility performance.
About the Ministry of Urban Development Government of India
In the federal structure of the Indian polity, matters pertaining to housing and urban development have been assigned by the Constitution of India to the state governments. The Constitution (74th Amendment) Act has further cast the responsibility of devolving more functions, finances, and functionaries on urban local bodies to the states. The Ministry of Urban Development, Government of India, is the apex authority at the national level to formulate policies; sponsor and support programs; coordinate the activities of various central ministries, state governments, and other nodal authority; and monitor the programs concerning all urban development and housing issues in the country.
Recognizing the importance of benchmarking the water services, the Ministry is encouraging utilities to mainstream benchmarking activities in their operations. This exercise should lead to cities institutionalizing this process and making it a part of their annual business planning to make it sustainable in the long run.
This data book will help planners and policy makers review and monitor the improvement in water utilities with reference to benchmarks and achieve the targets envisaged by the planners within the time frame.
About the Asian Development Bank
ADB aims to improve the welfare of the people in the Asia and Pacific region, particularly the nearly 1.9 billion who live on less than $2 a day. Despite many success stories, the region remains home to two thirds of the world’s poor. ADB is a multilateral development finance institution owned by 67 members, 48 from the region and 19 from other parts of the globe. ADB’s vision is a region free of poverty. Its mission is to help its developing member countries reduce poverty and improve their quality of life.
ADB’s main instruments for helping its developing member countries are policy dialogue, loans, equity investments, guarantees, grants, and technical assistance.
ADB’s headquarters is in Manila. It has 26 offices around the world and more than 2,000 employees from over 50 countries.