2006 Federal Procurement Report - Section I - Total Federal Views
46
FPDS-NG Federal Procurement Report FY 2007 Section I Total Federal Views
Transcript of 2006 Federal Procurement Report - Section I - Total Federal Views

FPDS-NG
Federal Procurement Report FY 2007
Section I
Total Federal Views

Table of Contents Forward
Section I: Total Federal Views
Procurement History by Quarter Actions
Procurement History by Quarter Dollars
Small Business Ownership Report by Ethnic Group
Small Business Ownership Report by Type of Contractor
Preference Goaling Achievements Report on Method of Awards Small Business
Preference Goaling Achievements Report on Method of Awards – Small Disadvantaged Business
Federal Contract Actions and Dollars by Executive Department and Agency
Contract Actions by Dollar Value
Contract Dollars by Executive Dept and Agencies Bar Graphs – Civilian and Defense
Procurements Performed Outside U.S.
Research and Development Summary by R&D Category – Actions and Dollars
Other Services and Construction Summary by Service Category
Supplies and Equipment Summary by PSC
NAICS Summary by NAICS Code
Small Business Goaling Report
Appendix

FEDERAL PROCUREMENT DATA SYSTEM – NEXT GENERATION
FOREWARD
Public Law 93-400 requires that the Office of Management and Budget (OMB), Office of Federal Procurement Policy (OFPP), “…establish a system for collecting, developing, and disseminating the procurement data which takes into account the needs of the Congress, the executive branch, and the public sector.” Under the guidance of OFPP, design of the Federal Procurement Data System (FPDS) was completed in early 1978 and data collection began October 1, 1978. The Federal Procurement Data Center provides a central point to respond to the requirements of the legislative, executive, and judicial branches of the Government as well as the private sector. Beginning October 1, 2003 Global Computer Enterprises, Inc. became the owner and operator of the Federal Procurement Data System – Next Generation (FPDS-NG) for FY 2004 data and subsequent fiscal years. Historically the Federal Procurement Data Center produced reports that examined the various aspects and impacts of the Federal acquisition process. Now this information is available through the enhanced reporting capabilities of the FPDS-NG. This data can be used for geographical analysis, market analysis, and analysis of the impact of congressional and presidential initiatives in socio-economic areas such as small business. The data is also a reliable basis for measuring and assessing the impact of the Federal acquisition policy and management improvement. Special reports to meet specific data requirements are available through GCE’s reporting system. Basic acquisition data will be published electronically each fiscal year providing the same types of data available in past years through the Federal Procurement Report. Reports are available on GCE’s Web Site https://www.fpds.gov.

Actions Reported
Federal Procurement Data System - Next GenerationFEDERAL PROCUREMENT HISTORY BY QUARTER
ACTIONS
0
200,000
400,000
600,000
800,000
1,000,000
1,200,000
1,400,000
1996 1997 1998 1999 2000 2001 2002 2003 2004 2005 2006 2007
1st Quarter 2nd Quarter 3rd Quarter 4th Quarter
Fiscal Year 1996 To Fiscal Year 2007
1

DOLLARS
$0
$20,000,000,000
$40,000,000,000
$60,000,000,000
$80,000,000,000
$100,000,000,000
$120,000,000,000
$140,000,000,000
1996 1997 1998 1999 2000 2001 2002 2003 2004 2005 2006 2007
1st Quarter 2nd Quarter 3rd Quarter 4th Quarter
FEDERAL PROCUREMENT HISTORY BY QUARTER
Fiscal Year 1996 To Fiscal Year 2007
Federal Procurement Data System - Next Generation
Dollars Reported
2

WOMEN-OWNEDSMALL
BUSINESSFIRMS
WOMEN-OWNEDSMALL
DISADVANTAGEDBUSINESS FIRMS
SMALLDISADVANTAGEDBUSINESS FIRMS
TOTAL DOD 2,624 269 1,030
Federal Procurement Data System - Next Generation
SMALL BUSINESS OWNERSHIP REPORT Number of New Businesses by Ethnic Group
ASIAN INDIAN AMERICAN 48 22 38ASIAN PACIFIC AMERICAN 61 18 25BLACK AMERICAN 80 24 128HISPANIC AMERICAN 163 58 160NATIVE AMERICAN 82 58 262NO REPRESENTATION 2,229 111 455
Actions Reported - Fiscal Year 2007 through Fourth Quarter
WOMEN-OWNEDSMALL
BUSINESSFIRMS
WOMEN-OWNEDSMALL
DISADVANTAGEDBUSINESS FIRMS
SMALLDISADVANTAGEDBUSINESS FIRMS
TOTAL CIVILIAN 5,116 694 1,713ASIAN INDIAN AMERICAN 94 17 40ASIAN PACIFIC AMERICAN 166 74 123BLACK AMERICAN 301 198 255HISPANIC AMERICAN 309 131 241NATIVE AMERICAN 201 47 86NO REPRESENTATION 4,135 244 1,008
3

WOMEN-OWNEDSMALL
BUSINESSFIRMS
WOMEN-OWNEDSMALL
DISADVANTAGEDBUSINESS FIRMS
OTHER SMALLDISADVANTAGEDBUSINESS FIRMS
TOTAL FEDERAL 7,740 963 2,743AGENCY FOR INTERNATIONAL DEVELOPMENT 2 0 0AGRICULTURE, DEPARTMENT OF 394 48 108BROADCASTING BOARD OF GOVERNORS 11 1 1COMMERCE, DEPARTMENT OF 80 12 25CONSUMER PRODUCT SAFETY COMMISSION 15 0 0CORPORATION FOR NATIONAL AND COMMUNITYSERVICE 6 1 1
COURT SERVICES AND OFFENDER SUPERVISIONAGENCY 5 0 2
DEFENSE NUCLEAR FACILITIES SAFETY BOARD 0 0 1DEPT OF DEFENSE 2,624 269 1,030EDUCATION, DEPARTMENT OF 21 1 4ENERGY, DEPARTMENT OF 40 1 7ENVIRONMENTAL PROTECTION AGENCY 54 12 25EQUAL EMPLOYMENT OPPORTUNITY COMMISSION 24 0 0EXECUTIVE OFFICE OF THE PRESIDENT 0 0 1FEDERAL COMMUNICATIONS COMMISSION 1 0 0GENERAL SERVICES ADMINISTRATION 692 88 280HEALTH AND HUMAN SERVICES, DEPARTMENT OF 421 20 50HOMELAND SECURITY, DEPARTMENT OF 186 38 65HOUSING AND URBAN DEVELOPMENT,DEPARTMENT OF 11 1 2
INTERIOR, DEPARTMENT OF THE 392 26 90JUSTICE, DEPARTMENT OF 196 60 98LABOR, DEPARTMENT OF 47 2 7MILLENIUM CHALLENGE CORPORATION 6 0 0NATIONAL AERONAUTICS AND SPACEADMINISTRATION 43 3 14
NATIONAL ARCHIVES AND RECORDSADMINISTRATION 6 1 3
NATIONAL SCIENCE FOUNDATION 2 0 0NATIONAL TRANSPORTATION SAFETY BOARD 1 0 0NUCLEAR REGULATORY COMMISSION 0 0 1OFFICE OF PERSONNEL MANAGEMENT 1 0 0PEACE CORPS 3 3 3
Federal Procurement Data System - Next Generation
SMALL BUSINESS OWNERSHIP REPORT
Actions Reported - Fiscal Year 2007 through Fourth QuarterNumber of New Businesses by Type of Contractor
4

WOMEN-OWNEDSMALL
BUSINESSFIRMS
WOMEN-OWNEDSMALL
DISADVANTAGEDBUSINESS FIRMS
OTHER SMALLDISADVANTAGEDBUSINESS FIRMS
TOTAL FEDERAL 7,740 963 2,743PENSION BENEFIT GUARANTY CORPORATION 1 0 0RAILROAD RETIREMENT BOARD 3 0 0SECURITIES AND EXCHANGE COMMISSION 1 0 0SELECTIVE SERVICE SYSTEM 1 0 0SMALL BUSINESS ADMINISTRATION 8 0 0SMITHSONIAN INSTITUTION 63 7 11SOCIAL SECURITY ADMINISTRATION 17 1 9STATE, DEPARTMENT OF 91 9 28TRANSPORTATION, DEPARTMENT OF 59 16 52TREASURY, DEPARTMENT OF THE 56 7 11UNITED STATES TRADE AND DEVELOPMENTAGENCY 0 0 1
VETERANS AFFAIRS, DEPARTMENT OF 2,156 336 813
5

Federal Procurement Data System - Next Generation
REPORT ON ANNUAL PROCUREMENT PREFERENCE GOALING ACHIEVEMENTSReport on Method of Awards - Small Business Concerns
NONCOMPETITIVE RESTRICTED COMP UNRESTRICTED COMP
Number ofActions Dollars Number of
Actions Dollars Number ofActions Dollars
TOTAL FEDERAL 301,451 $20,600,282,545 259,883 $23,194,818,995 529,494 $26,374,258,690
AGENCY FOR INTERNATIONAL DEVELOPMENT (7200) 346 $23,787,589 167 $13,366,921 464 $33,278,503
AGRICULTURE, DEPARTMENT OF (1200) 9,361 $441,994,686 11,833 $627,728,098 12,658 $827,848,124
BROADCASTING BOARD OF GOVERNORS (9568) 162 $2,012,818 7 $1,948,386 786 $4,047,879
COMMERCE, DEPARTMENT OF (1300) 3,321 $213,859,575 2,921 $258,694,480 2,910 $93,142,841
COMMISSION ON CIVIL RIGHTS (9517) 3 $217,304 0 $0 0 $0
COMMITTEE FOR PURCHASE FROM PEOPLE WHO AREBLIND OR SEVERELY DISABLED (9518) 1 $75,000 0 $0 0 $0
COMMODITY FUTURES TRADING COMMISSION (9507) 12 $213,298 24 $244,376 26 $127,101
CONSUMER PRODUCT SAFETY COMMISSION (6100) 287 $3,427,038 5 $76,739 23 $418,664
CORPORATION FOR NATIONAL AND COMMUNITYSERVICE (9577) 23 $3,123,708 1 $3,399 2 $-24,540
COURT SERVICES AND OFFENDER SUPERVISIONAGENCY (9594) 115 $4,247,917 5 $41,909 69 $1,534,444
DEFENSE NUCLEAR FACILITIES SAFETY BOARD (9516) 22 $1,957,125 0 $0 6 $137,499
DEPT OF DEFENSE (9700) 132,976 $12,730,403,273 177,899 $17,348,360,403 253,660 $20,362,095,088
EDUCATION, DEPARTMENT OF (9100) 497 $42,274,972 114 $27,978,935 192 $15,476,182
ENERGY, DEPARTMENT OF (8900) 2,529 $503,156,135 2,345 $412,453,347 614 $77,203,394
ENVIRONMENTAL PROTECTION AGENCY (6800) 2,582 $104,207,588 1,588 $147,761,932 1,223 $20,028,212
EQUAL EMPLOYMENT OPPORTUNITY COMMISSION(4500) 1,095 $4,262,669 18 $921,408 492 $2,443,913
EXECUTIVE OFFICE OF THE PRESIDENT (1100) 95 $3,224,522 29 $1,673,055 78 $2,481,721
FEDERAL COMMUNICATIONS COMMISSION (2700) 129 $7,597,627 0 $0 0 $0
FEDERAL ELECTION COMMISSION (9506) 15 $227,134 0 $0 170 $464,728
FEDERAL ENERGY REGULATORY COMMISSION (8961) 38 $1,587,857 0 $0 12 $2,882,717
FEDERAL HOUSING FINANCE BOARD (9540) 4 $93,471 0 $0 0 $0
FEDERAL MARITIME COMMISSION (6500) 11 $62,768 0 $0 2 $571
FEDERAL TRADE COMMISSION (2900) 147 $6,884,879 12 $1,271,846 6 $1,594,852
GENERAL SERVICES ADMINISTRATION (4700) 31,313 $1,126,518,986 2,266 $144,571,158 194,093 $593,571,428
HEALTH AND HUMAN SERVICES, DEPARTMENT OF (7500) 8,718 $547,380,792 4,269 $652,136,678 7,396 $827,223,883
HOMELAND SECURITY, DEPARTMENT OF (7000) 13,000 $1,122,668,441 6,434 $490,068,377 10,851 $607,254,800
HOUSING AND URBAN DEVELOPMENT, DEPARTMENT OF(8600) 950 $133,060,159 863 $226,924,514 193 $59,703,340
INTERIOR, DEPARTMENT OF THE (1400) 13,539 $597,107,633 10,166 $400,182,922 10,679 $465,572,883
J. F. KENNEDY CENTER FOR THE PERFORMING ARTS(3352) 37 $913,675 1 $-15,000 28 $1,902,810
JUSTICE, DEPARTMENT OF (1500) 9,751 $337,339,733 12,617 $235,018,783 9,804 $230,547,288
LABOR, DEPARTMENT OF (1600) 1,596 $116,031,404 706 $279,971,271 1,055 $136,739,716
MERIT SYSTEMS PROTECTION BOARD (4100) 5 $28,710 0 $0 91 $402,727
MILLENIUM CHALLENGE CORPORATION (9543) 21 $1,782,898 20 $2,014,135 146 $8,432,547
NATIONAL AERONAUTICS AND SPACE ADMINISTRATION(8000) 1,596 $245,008,480 5,658 $1,123,626,012 2,441 $291,010,647
NATIONAL ARCHIVES AND RECORDS ADMINISTRATION(8800) 156 $7,809,180 59 $5,397,017 114 $6,616,519
NATIONAL CAPITAL PLANNING COMMISSION (9502) 7 $293,546 12 $116,908 6 $84,852
NATIONAL ENDOWMENT FOR THE ARTS (5920) 5 $10,405 2 $28,909 1 $19,800
NATIONAL ENDOWMENT FOR THE HUMANITIES (5940) 22 $2,957,560 0 $0 5 $38,827
NATIONAL FOUNDATION ON THE ARTS AND THEHUMANITIES (5900) 8 $235,887 1 $78,395 1 $2,450
NATIONAL GALLERY OF ART (3355) 27 $1,481,561 4 $113,350 20 $757,441
NATIONAL LABOR RELATIONS BOARD (6300) 27 $823,674 3 $157,834 97 $2,602,081
NATIONAL MEDIATION BOARD (9524) 1 $5,797 0 $0 4 $33,506
Actions Reported - Fiscal Year 2007 through Fourth Quarter
6

NATIONAL SCIENCE FOUNDATION (4900) 106 $7,395,800 22 $4,143,267 70 $951,510
NATIONAL TRANSPORTATION SAFETY BOARD (9508) 44 $1,548,847 8 $258,468 0 $0
NUCLEAR REGULATORY COMMISSION (3100) 256 $17,099,808 94 $12,574,221 203 $3,491,711
OCCUPATIONAL SAFETY AND HEALTH REVIEWCOMMISSION (9514) 7 $62,551 17 $249,639 0 $0
OFFICE OF PERSONNEL MANAGEMENT (2400) 197 $13,877,401 42 $1,797,393 153 $18,056,248
OFFICE OF SPECIAL COUNSEL (6201) 6 $89,382 0 $0 3 $25,300
PEACE CORPS (1145) 36 $1,534,378 20 $1,080,371 106 $521,883
PENSION BENEFIT GUARANTY CORPORATION (1665) 10 $897,838 47 $5,793,896 17 $1,347,866
RAILROAD RETIREMENT BOARD (6000) 89 $1,768,814 8 $215,649 91 $2,401,997
SECURITIES AND EXCHANGE COMMISSION (5000) 162 $11,171,963 11 $2,221,158 45 $6,103,031
SELECTIVE SERVICE SYSTEM (9000) 8 $204,751 0 $0 0 $0
SMALL BUSINESS ADMINISTRATION (7300) 262 $25,662,043 48 $3,777,153 112 $23,226,506
SMITHSONIAN INSTITUTION (3300) 755 $29,827,147 181 $25,676,709 605 $30,939,494
SOCIAL SECURITY ADMINISTRATION (2800) 463 $41,248,949 1,079 $37,427,493 273 $6,299,848
STATE, DEPARTMENT OF (1900) 1,862 $243,400,075 910 $64,038,355 2,294 $154,201,170
TRANSPORTATION, DEPARTMENT OF (6900) 2,135 $289,787,611 541 $106,111,280 3,170 $874,327,413
TREASURY, DEPARTMENT OF THE (2000) 5,235 $233,993,827 1,077 $67,715,665 2,321 $264,182,793
UNITED STATES TRADE AND DEVELOPMENT AGENCY(1153) 22 $4,091,646 0 $0 128 $5,393,538
VETERANS AFFAIRS, DEPARTMENT OF (3600) 55,246 $1,336,262,240 15,729 $458,821,786 9,485 $305,088,942
7

Federal Procurement Data System - Next Generation
REPORT ON ANNUAL PROCUREMENT PREFERENCE GOALING ACHIEVEMENTSReport on Method of Awards - Small Disadvantaged Business Concerns
NONCOMPETITIVE RESTRICTED COMP UNRESTRICTED COMP
Number ofActions Dollars Number of
Actions Dollars Number ofActions Dollars
TOTAL FEDERAL 79,220 $10,923,709,902 49,065 $6,929,741,944 35,881 $3,418,033,210
AGENCY FOR INTERNATIONAL DEVELOPMENT (7200) 33 $4,600,651 7 $1,190,990 82 $7,091,527
AGRICULTURE, DEPARTMENT OF (1200) 2,883 $246,313,152 858 $87,700,392 691 $63,552,370
BROADCASTING BOARD OF GOVERNORS (9568) 12 $198,990 2 $27,206 10 $30,898
COMMERCE, DEPARTMENT OF (1300) 1,301 $142,052,577 703 $94,361,246 272 $19,090,873
COMMODITY FUTURES TRADING COMMISSION (9507) 3 $83,107 0 $0 1 $-1,679
CONSUMER PRODUCT SAFETY COMMISSION (6100) 7 $465,110 0 $0 1 $6,993
CORPORATION FOR NATIONAL AND COMMUNITYSERVICE (9577) 11 $2,965,354 0 $0 0 $0
COURT SERVICES AND OFFENDER SUPERVISIONAGENCY (9594) 39 $1,580,763 0 $0 10 $118,251
DEFENSE NUCLEAR FACILITIES SAFETY BOARD (9516) 7 $1,229,483 0 $0 0 $0
DEPT OF DEFENSE (9700) 48,365 $7,134,699,045 36,077 $5,014,443,679 21,304 $2,379,941,160
EDUCATION, DEPARTMENT OF (9100) 78 $23,831,931 24 $6,828,436 24 $758,196
ENERGY, DEPARTMENT OF (8900) 1,263 $309,604,296 361 $101,339,703 69 $10,276,191
ENVIRONMENTAL PROTECTION AGENCY (6800) 753 $56,386,419 282 $54,366,674 151 $4,427,434
EQUAL EMPLOYMENT OPPORTUNITY COMMISSION(4500) 34 $777,765 7 $794,541 15 $121,028
EXECUTIVE OFFICE OF THE PRESIDENT (1100) 8 $519,292 6 $321,226 11 $211,515
FEDERAL COMMUNICATIONS COMMISSION (2700) 101 $4,762,095 0 $0 0 $0
FEDERAL ELECTION COMMISSION (9506) 5 $120,000 0 $0 3 $24,752
FEDERAL ENERGY REGULATORY COMMISSION (8961) 1 $144,588 0 $0 7 $2,506,717
FEDERAL MARITIME COMMISSION (6500) 1 $31,480 0 $0 0 $0
FEDERAL TRADE COMMISSION (2900) 24 $1,251,235 12 $1,271,846 1 $1,489,720
GENERAL SERVICES ADMINISTRATION (4700) 5,344 $381,305,593 617 $59,703,335 7,381 $60,465,472
HEALTH AND HUMAN SERVICES, DEPARTMENT OF (7500) 1,857 $279,872,369 1,186 $255,607,241 726 $96,201,504
HOMELAND SECURITY, DEPARTMENT OF (7000) 2,857 $417,759,758 958 $144,353,905 756 $186,580,464
HOUSING AND URBAN DEVELOPMENT, DEPARTMENT OF(8600) 648 $108,581,040 214 $156,138,746 31 $7,117,026
INTERIOR, DEPARTMENT OF THE (1400) 4,002 $392,454,531 958 $109,784,362 610 $59,620,303
J. F. KENNEDY CENTER FOR THE PERFORMING ARTS(3352) 11 $135,700 0 $0 3 $24,444
JUSTICE, DEPARTMENT OF (1500) 798 $91,293,353 1,355 $31,700,738 1,049 $15,525,406
LABOR, DEPARTMENT OF (1600) 503 $78,575,980 218 $72,295,670 248 $41,037,485
MERIT SYSTEMS PROTECTION BOARD (4100) 0 $0 0 $0 4 $10,588
MILLENIUM CHALLENGE CORPORATION (9543) 8 $1,268,877 2 $1,390,000 5 $199,730
NATIONAL AERONAUTICS AND SPACE ADMINISTRATION(8000) 767 $178,642,859 2,352 $459,249,054 213 $34,507,683
NATIONAL ARCHIVES AND RECORDS ADMINISTRATION(8800) 25 $1,272,994 5 $1,401,018 3 $-285
NATIONAL CAPITAL PLANNING COMMISSION (9502) 2 $6,840 1 $7,061 0 $0
NATIONAL ENDOWMENT FOR THE HUMANITIES (5940) 0 $0 0 $0 1 $8,450
NATIONAL FOUNDATION ON THE ARTS AND THEHUMANITIES (5900) 5 $221,750 0 $0 0 $0
NATIONAL GALLERY OF ART (3355) 3 $102,381 1 $78,400 0 $0
NATIONAL LABOR RELATIONS BOARD (6300) 0 $0 2 $133,396 9 $714,733
NATIONAL MEDIATION BOARD (9524) 0 $0 0 $0 4 $40,747
NATIONAL SCIENCE FOUNDATION (4900) 53 $5,860,362 7 $1,929,690 11 $513,600
NATIONAL TRANSPORTATION SAFETY BOARD (9508) 6 $261,567 7 $258,468 0 $0
NUCLEAR REGULATORY COMMISSION (3100) 145 $14,502,156 5 $703,244 101 $579,455
OCCUPATIONAL SAFETY AND HEALTH REVIEWCOMMISSION (9514) 0 $0 4 $60,760 0 $0
Actions Reported - Fiscal Year 2007 through Fourth Quarter
8

OFFICE OF PERSONNEL MANAGEMENT (2400) 49 $7,910,112 10 $154,255 22 $6,140,996
OFFICE OF SPECIAL COUNSEL (6201) 0 $0 0 $0 1 $17,688
PEACE CORPS (1145) 15 $1,359,760 2 $386,818 9 $95,842
PENSION BENEFIT GUARANTY CORPORATION (1665) 3 $34,161 16 $3,087,030 3 $460,600
RAILROAD RETIREMENT BOARD (6000) 2 $19,795 7 $212,599 6 $754,270
SECURITIES AND EXCHANGE COMMISSION (5000) 18 $2,126,339 2 $74,994 2 $181,881
SMALL BUSINESS ADMINISTRATION (7300) 145 $21,903,888 6 $1,989,516 47 $19,652,801
SMITHSONIAN INSTITUTION (3300) 99 $12,926,688 32 $12,339,347 56 $9,888,972
SOCIAL SECURITY ADMINISTRATION (2800) 119 $31,536,632 53 $14,506,605 32 $3,817,293
STATE, DEPARTMENT OF (1900) 692 $171,629,018 154 $40,952,137 350 $43,327,717
TRANSPORTATION, DEPARTMENT OF (6900) 676 $128,239,586 213 $63,506,922 805 $241,537,179
TREASURY, DEPARTMENT OF THE (2000) 966 $100,163,940 230 $25,155,911 177 $25,806,919
UNITED STATES TRADE AND DEVELOPMENT AGENCY(1153) 4 $866,458 0 $0 10 $242,070
VETERANS AFFAIRS, DEPARTMENT OF (3600) 4,469 $561,258,081 2,109 $109,934,784 554 $73,316,230
9

Federal Contract Actions and Dollars by Executive Department and AgencyFederal Procurement Data System - Next Generation
All Reported ActionsNumber of Actions Percent of Actions Dollars Percent of Dollars
Total Federal 3,973,578 100.000 % $459,998,278,356 100.000 %
AGENCY FOR INTERNATIONAL DEVELOPMENT (7200) 8,775 0.221 % $3,550,094,483 0.772 %
AGRICULTURE, DEPARTMENT OF (1200) 56,812 1.430 % $4,350,607,196 0.946 %
BROADCASTING BOARD OF GOVERNORS (9568) 2,624 0.066 % $38,049,344 0.008 %
COMMERCE, DEPARTMENT OF (1300) 22,478 0.566 % $2,141,521,660 0.466 %
COMMISSION ON CIVIL RIGHTS (9517) 20 0.001 % $2,088,696 0.000 %
COMMITTEE FOR PURCHASE FROM PEOPLE WHO ARE BLIND OR SEVERELYDISABLED (9518)
2 0.000 % $88,290 0.000 %
COMMODITY FUTURES TRADING COMMISSION (9507) 394 0.010 % $27,543,737 0.006 %
CONSUMER PRODUCT SAFETY COMMISSION (6100) 865 0.022 % $9,046,778 0.002 %
CORPORATION FOR NATIONAL AND COMMUNITY SERVICE (9577) 608 0.015 % $44,213,517 0.010 %
COURT SERVICES AND OFFENDER SUPERVISION AGENCY (9594) 511 0.013 % $21,865,342 0.005 %
DEFENSE NUCLEAR FACILITIES SAFETY BOARD (9516) 88 0.002 % $3,606,987 0.001 %
DEPT OF DEFENSE (9700) 1,408,325 35.442 % $330,757,977,244 71.904 %
EDUCATION, DEPARTMENT OF (9100) 3,454 0.087 % $1,417,196,523 0.308 %
ENERGY, DEPARTMENT OF (8900) 12,034 0.303 % $23,153,543,593 5.033 %
ENVIRONMENTAL PROTECTION AGENCY (6800) 23,320 0.587 % $1,375,777,114 0.299 %
EQUAL EMPLOYMENT OPPORTUNITY COMMISSION (4500) 3,778 0.095 % $54,098,111 0.012 %
EXECUTIVE OFFICE OF THE PRESIDENT (1100) 859 0.022 % $38,228,915 0.008 %
FEDERAL COMMUNICATIONS COMMISSION (2700) 1,384 0.035 % $93,104,610 0.020 %
FEDERAL ELECTION COMMISSION (9506) 735 0.018 % $6,475,988 0.001 %
FEDERAL ENERGY REGULATORY COMMISSION (8961) 131 0.003 % $63,236,924 0.014 %
FEDERAL HOUSING FINANCE BOARD (9540) 9 0.000 % $145,906 0.000 %
FEDERAL MARITIME COMMISSION (6500) 92 0.002 % $775,627 0.000 %
FEDERAL TRADE COMMISSION (2900) 565 0.014 % $31,726,780 0.007 %
GENERAL SERVICES ADMINISTRATION (4700) 810,106 20.387 % $12,423,150,338 2.701 %
HEALTH AND HUMAN SERVICES, DEPARTMENT OF (7500) 63,549 1.599 % $13,772,768,520 2.994 %
HOMELAND SECURITY, DEPARTMENT OF (7000) 78,955 1.987 % $11,959,978,438 2.600 %
HOUSING AND URBAN DEVELOPMENT, DEPARTMENT OF (8600) 3,567 0.090 % $820,689,525 0.178 %
INTERIOR, DEPARTMENT OF THE (1400) 81,650 2.055 % $4,040,841,014 0.878 %
INTERNATIONAL TRADE COMMISSION (3400) 24 0.001 % $789,233 0.000 %
Actions Reported - Fiscal Year 2007 through Fourth Quarter
10

All Reported ActionsNumber of Actions Percent of Actions Dollars Percent of Dollars
Total Federal 3,973,578 100.000 % $459,998,278,356 100.000 %
J. F. KENNEDY CENTER FOR THE PERFORMING ARTS (3352) 168 0.004 % $21,424,749 0.005 %
JUSTICE, DEPARTMENT OF (1500) 98,989 2.491 % $6,746,026,152 1.467 %
LABOR, DEPARTMENT OF (1600) 9,640 0.243 % $1,806,431,963 0.393 %
MERIT SYSTEMS PROTECTION BOARD (4100) 252 0.006 % $5,087,285 0.001 %
MILLENIUM CHALLENGE CORPORATION (9543) 569 0.014 % $62,413,989 0.014 %
NATIONAL AERONAUTICS AND SPACE ADMINISTRATION (8000) 26,354 0.663 % $12,926,610,615 2.810 %
NATIONAL ARCHIVES AND RECORDS ADMINISTRATION (8800) 1,435 0.036 % $152,982,251 0.033 %
NATIONAL CAPITAL PLANNING COMMISSION (9502) 53 0.001 % $775,297 0.000 %
NATIONAL ENDOWMENT FOR THE ARTS (5920) 18 0.000 % $393,111 0.000 %
NATIONAL ENDOWMENT FOR THE HUMANITIES (5940) 104 0.003 % $5,890,254 0.001 %
NATIONAL FOUNDATION ON THE ARTS AND THE HUMANITIES (5900) 39 0.001 % $569,871 0.000 %
NATIONAL GALLERY OF ART (3355) 189 0.005 % $23,571,352 0.005 %
NATIONAL LABOR RELATIONS BOARD (6300) 253 0.006 % $12,873,255 0.003 %
NATIONAL MEDIATION BOARD (9524) 111 0.003 % $1,217,846 0.000 %
NATIONAL SCIENCE FOUNDATION (4900) 1,070 0.027 % $381,737,509 0.083 %
NATIONAL TRANSPORTATION SAFETY BOARD (9508) 280 0.007 % $7,077,953 0.002 %
NUCLEAR REGULATORY COMMISSION (3100) 2,025 0.051 % $152,096,402 0.033 %
OCCUPATIONAL SAFETY AND HEALTH REVIEW COMMISSION (9514) 42 0.001 % $676,342 0.000 %
OFFICE OF PERSONNEL MANAGEMENT (2400) 9,040 0.228 % $450,331,977 0.098 %
OFFICE OF SPECIAL COUNSEL (6201) 29 0.001 % $467,738 0.000 %
PEACE CORPS (1145) 601 0.015 % $27,476,687 0.006 %
PENSION BENEFIT GUARANTY CORPORATION (1665) 736 0.019 % $101,306,324 0.022 %
RAILROAD RETIREMENT BOARD (6000) 474 0.012 % $13,224,769 0.003 %
SECURITIES AND EXCHANGE COMMISSION (5000) 754 0.019 % $117,730,241 0.026 %
SELECTIVE SERVICE SYSTEM (9000) 293 0.007 % $3,818,299 0.001 %
SMALL BUSINESS ADMINISTRATION (7300) 976 0.025 % $86,221,236 0.019 %
SMITHSONIAN INSTITUTION (3300) 3,185 0.080 % $200,475,505 0.044 %
SOCIAL SECURITY ADMINISTRATION (2800) 6,666 0.168 % $629,811,157 0.137 %
STATE, DEPARTMENT OF (1900) 51,433 1.294 % $5,621,912,832 1.222 %
TRANSPORTATION, DEPARTMENT OF (6900) 16,149 0.406 % $3,813,584,244 0.829 %
TREASURY, DEPARTMENT OF THE (2000) 38,609 0.972 % $4,091,868,522 0.890 %
UNITED STATES TRADE AND DEVELOPMENT AGENCY (1153) 154 0.004 % $9,790,167 0.002 %
VETERANS AFFAIRS, DEPARTMENT OF (3600) 1,117,174 28.115 % $12,323,172,027 2.679 %
Appendix:Summary data is being phased out.As of FY2007, all actions under $25,000 formerly reported in summary are now reported as individual actions for all agencies.This completesa process begun in FY2004.
11

83 %
10 %
6 %
1 %
< $25,000 3,280,263Between $25,000 and $100,000 394,087Between $100,000 and $1,000,000 244,209>=$1,000,000 55,019
Actions Reported - Fiscal Year 2007 through Fourth QuarterCONTRACT ACTIONS BY DOLLAR VALUE
Federal Procurement Data System - Next Generation
Number of actions for action dollar ranges
2 %
4 %
15 %
79 %
< $25,000 $11,054,768,303Between $25,000 and $100,000 $18,491,543,257Between $100,000 and $1,000,000 $68,202,986,756>=$1,000,000 $362,248,980,040
Sum of dollars for action dollar ranges
12

2%1%
54%
6%
35%
BPA Call $270,208,445 Definitive Contracts $148,100,267Delivery Order $6,068,567,512 Modifications $666,058,319Purchase Order $3,947,938,977 Terminations -$46,105,216
Number of actions for action dollar ranges
Contract actions under $25,000 showing type of action
Sum of dollars for action dollar ranges
6%1%
42%
16%35%
0.4%
BPA Call 208,711 Definitive Contracts 17,774Delivery Order 1,369,784 Modifications 529,602Purchase Order 1,141,330 Terminations 13,062
13

1%3%
51%
22%
22%
BPA Call 5,530 Definitive Contracts 11,551Delivery Order 202,187 Modifications 86,122Purchase Order 87,288 Terminations 1,404
Number of actions for action dollar ranges
2%4%54%
16%
24%
BPA Call $279,656,436 Definitive Contracts $672,627,409Delivery Order $10,143,350,936 Modifications $3,047,161,145Purchase Order $4,417,184,528 Terminations -$68,788,401
Sum of dollars for action dollar ranges
Contract actions greater than or equal to $25,000 and less than $100,000 showing type of actions
14

Contract actions greater than or equal to $100,000 and less than $1,000,000 showing type of actions
Sum of dollars for action dollar rangesNumber of actions for action dollar ranges
1 %
10 %
46 %
37 %
6 %
BPA Call $703,282,184 Definitive Contracts $6,733,045,808Delivery Order $31,443,185,457 Modifications $25,331,028,930Purchase Order $4,190,428,554 Terminations -$199,067,934
1 %
8 %44 %
40 %
7 %
BPA Call 2,442 Definitive Contracts 19,775Delivery Order 107,689 Modifications 96,788Purchase Order 16,736 Terminations 773
15

Number of actions for action dollar ranges
0.7%
10%34%
53%
2%
BPA Call 360 Definitive Contracts 5,463Delivery Order 18,867 Modifications 29,253Purchase Order 946 Terminations 128
Contract actions over $1,000,000 showing type of actions
Sum of dollars for action dollar ranges
0.3%
10%
29%
60%
BPA Call $1,122,415,777 Definitive Contracts $35,020,434,960Delivery Order $106,304,583,753 Modifications $217,884,628,905Purchase Order $2,175,745,734 Terminations -$261,458,315
16
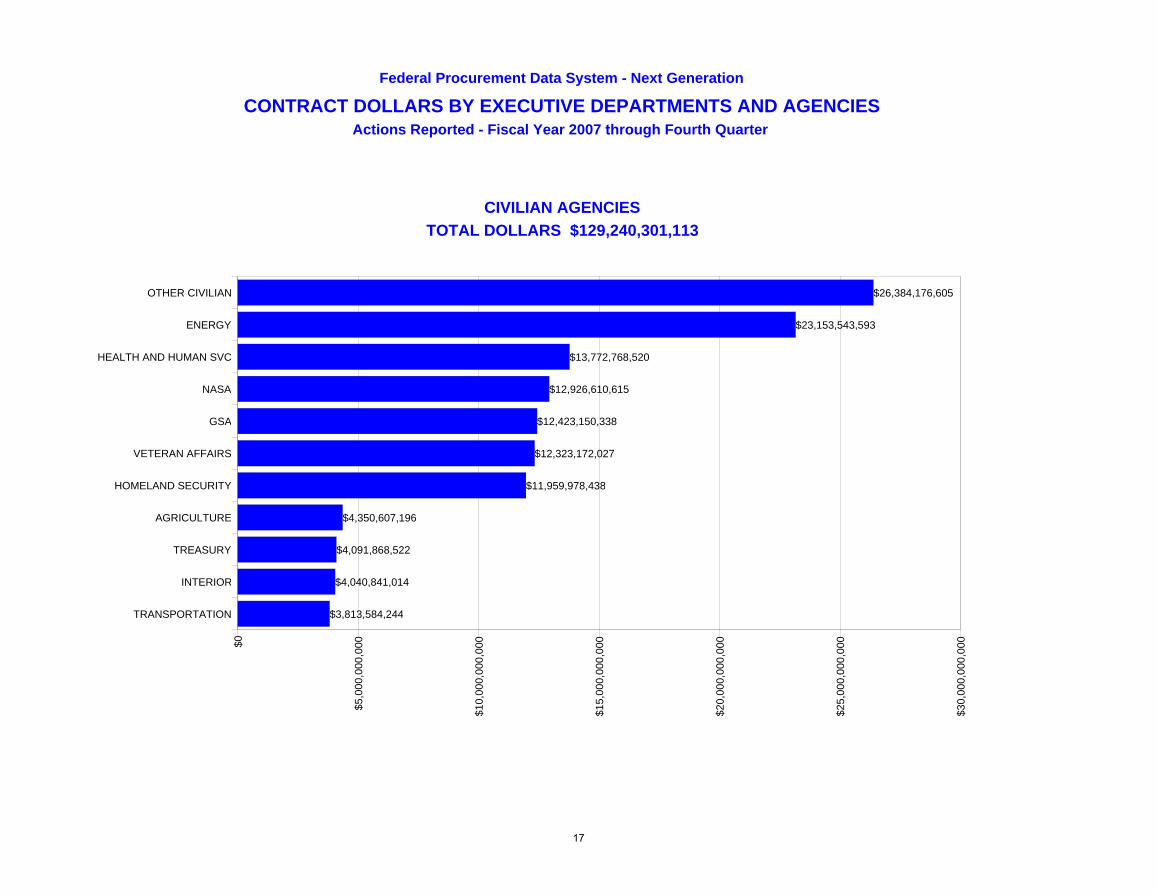
$3,813,584,244
$4,040,841,014
$4,091,868,522
$4,350,607,196
$11,959,978,438
$12,323,172,027
$12,423,150,338
$12,926,610,615
$13,772,768,520
$23,153,543,593
$26,384,176,605
$0
$5,0
00,0
00,0
00
$10,
000,
000,
000
$15,
000,
000,
000
$20,
000,
000,
000
$25,
000,
000,
000
$30,
000,
000,
000
TRANSPORTATION
INTERIOR
TREASURY
AGRICULTURE
HOMELAND SECURITY
VETERAN AFFAIRS
GSA
NASA
HEALTH AND HUMAN SVC
ENERGY
OTHER CIVILIAN
Federal Procurement Data System - Next Generation
CONTRACT DOLLARS BY EXECUTIVE DEPARTMENTS AND AGENCIESActions Reported - Fiscal Year 2007 through Fourth Quarter
CIVILIAN AGENCIESTOTAL DOLLARS $129,240,301,113
17

$28,855,844,014
$30,548,877,090
$69,843,284,373
$85,129,455,186
$116,380,516,580
$0
$20,
000,
000,
000
$40,
000,
000,
000
$60,
000,
000,
000
$80,
000,
000,
000
$100
,000
,000
,000
$120
,000
,000
,000
OTHER DOD
DEFENSE LOGISTICS AGENCY
DEPT OF THE AIR FORCE
DEPT OF THE NAVY
DEPT OF THE ARMY
DEPARTMENT OF DEFENSETOTAL DOLLARS $330,757,977,244
18

Federal Procurement Data System - Next Generation
PROCUREMENTS PERFORMED OUTSIDE U.S. AND U.S. TERRITORIES BYCONTINENT
Actions Reported - Fiscal Year 2007 through Fourth Quarter
Continent/Island Group Name DollarsTotal $42,413,412,118ASIA $29,385,709,897WESTERN EUROPE $7,406,192,203AFRICA $1,562,043,661NORTH AMERICA $1,376,500,792EASTERN EUROPE $1,022,353,131SOUTH AND CENTRAL AMERICA $694,225,242CARIBBEAN $294,005,364PACIFIC OCEAN / AUSTRALIA $269,934,205INDIAN OCEAN $243,311,820ANTARCTICA $159,135,802
AFRICA
Country Name DollarsTotal $1,562,043,661SUDAN $455,887,483ETHIOPIA $144,016,522EGYPT $126,832,967DJIBOUTI $107,348,436LIBERIA $99,698,018BURKINA FASO $84,410,646CONGO,DEMOCRATIC REPUBLIC OF THE (KINSHASA) $70,044,322UGANDA $67,131,093KENYA $65,472,228MOZAMBIQUE $46,118,029TANZANIA $30,960,616NIGERIA $29,695,113MALI $28,536,379SOUTH AFRICA $23,862,322MALAWI $18,166,736SENEGAL $15,197,658SIERRA LEONE $15,076,312GHANA $14,009,878BOTSWANA $12,718,276RWANDA $10,533,232TOGO $9,140,065MOROCCO $8,927,793
19

Country Name DollarsTotal $1,562,043,661ZIMBABWE $8,099,519GABON $6,579,588SOMALIA $5,545,969LIBYA $5,127,888ANGOLA $5,016,547NIGER $4,798,019GUINEA $4,733,055ZAMBIA $4,639,552CENTRAL AFRICAN REPUBLIC $4,376,367CAMEROON $3,709,057COTE DIVOIRE $3,465,658NAMIBIA $3,231,214CHAD $3,142,618LESOTHO $3,076,531BURUNDI $2,744,322ALGERIA $2,490,223BENIN $2,011,613GAMBIA,THE $1,567,915TUNISIA $1,445,499CONGO,REPUBLIC OF THE (BRAZZAVILLE) $956,053MAURITANIA $822,918ERITREA $528,217CAPE VERDE $474,778SAO TOME AND PRINCIPE $428,810WESTERN SAHARA [UNDETERMINED] $149,315GUINEA-BISSAU $43,599SWAZILAND $-945,309
ANTARCTICA
Country Name DollarsTotal $159,135,802ANTARCTICA $155,732,464SAINT HELENA [UNITED KINGDOM] $3,403,338
ASIA
Country Name DollarsTotal $29,385,709,897IRAQ $14,156,399,392KUWAIT $4,167,995,741AFGHANISTAN $4,135,865,716SOUTH KOREA $1,735,479,663JAPAN $1,087,741,652
20
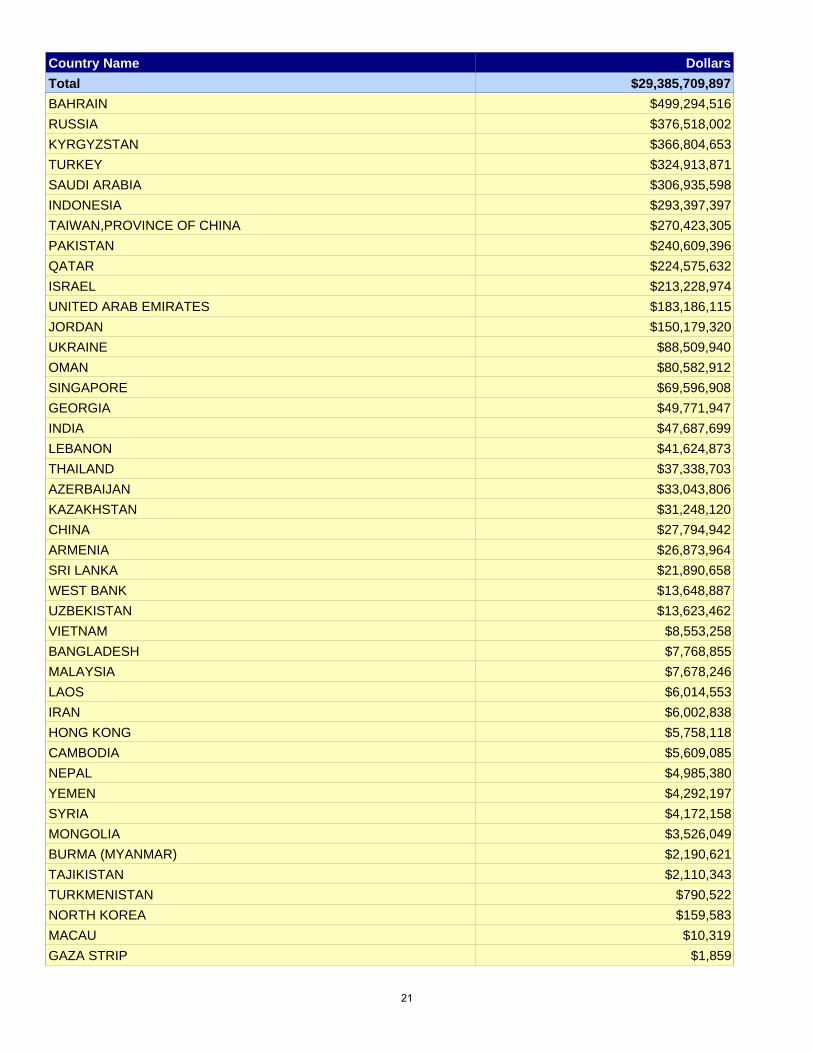
Country Name DollarsTotal $29,385,709,897BAHRAIN $499,294,516RUSSIA $376,518,002KYRGYZSTAN $366,804,653TURKEY $324,913,871SAUDI ARABIA $306,935,598INDONESIA $293,397,397TAIWAN,PROVINCE OF CHINA $270,423,305PAKISTAN $240,609,396QATAR $224,575,632ISRAEL $213,228,974UNITED ARAB EMIRATES $183,186,115JORDAN $150,179,320UKRAINE $88,509,940OMAN $80,582,912SINGAPORE $69,596,908GEORGIA $49,771,947INDIA $47,687,699LEBANON $41,624,873THAILAND $37,338,703AZERBAIJAN $33,043,806KAZAKHSTAN $31,248,120CHINA $27,794,942ARMENIA $26,873,964SRI LANKA $21,890,658WEST BANK $13,648,887UZBEKISTAN $13,623,462VIETNAM $8,553,258BANGLADESH $7,768,855MALAYSIA $7,678,246LAOS $6,014,553IRAN $6,002,838HONG KONG $5,758,118CAMBODIA $5,609,085NEPAL $4,985,380YEMEN $4,292,197SYRIA $4,172,158MONGOLIA $3,526,049BURMA (MYANMAR) $2,190,621TAJIKISTAN $2,110,343TURKMENISTAN $790,522NORTH KOREA $159,583MACAU $10,319GAZA STRIP $1,859
21

Country Name DollarsTotal $29,385,709,897BELARUS $-699,852
CARIBBEAN
Country Name DollarsTotal $294,005,364CUBA $142,657,023BAHAMAS,THE $62,849,555HAITI $29,078,630DOMINICAN REPUBLIC $16,271,156ARUBA [NETHERLANDS] $14,264,477JAMAICA $11,803,379NETHERLANDS ANTILLES [NETHERLANDS] $6,761,603ANGUILLA [UNITED KINGDOM] $3,341,789BARBADOS $3,069,693ANTIGUA AND BARBUDA $1,382,782TRINIDAD AND TOBAGO $1,341,277BRITISH VIRGIN ISLANDS [UNITED KINGDOM] $324,205SAINT LUCIA $206,035SAINT KITTS AND NEVIS $187,774DOMINICA $178,377GUADELOUPE [FRANCE] $103,736CAYMAN ISLANDS [UNITED KINGDOM] $60,540GRENADA $54,428MARTINIQUE [FRANCE] $35,482TURKS AND CAICOS ISLANDS [UNITED KINGDOM] $33,422
EASTERN EUROPE
Country Name DollarsTotal $1,022,353,131GREECE $466,351,152BOSNIA AND HERZEGOVINA $198,825,112LATVIA $92,445,671ROMANIA $70,181,706ALBANIA $28,446,963SERBIA $25,445,750MOLDOVA $22,177,720POLAND $20,566,841CZECH REPUBLIC $19,916,712MACEDONIA $14,797,261LITHUANIA $13,197,041CROATIA $12,331,215BULGARIA $11,221,057
22

Country Name DollarsTotal $1,022,353,131SLOVAKIA $10,128,728HUNGARY $5,917,230CYPRUS $3,931,595ESTONIA $2,770,609FINLAND $2,494,504SLOVENIA $1,206,264
INDIAN OCEAN
Country Name DollarsTotal $243,311,820BRITISH INDIAN OCEAN TERRITORY [UNITED KINGDOM] $112,185,727MADAGASCAR $108,736,895SEYCHELLES $16,994,472COMOROS $4,845,951MAURITIUS $428,887EUROPA ISLAND [FRANCE] $80,695COCOS (KEELING) ISLANDS [AUSTRALIA] $15,632JUAN DE NOVA ISLAND [FRANCE] $8,654CHRISTMAS ISLAND [AUSTRALIA] $7,707MALDIVES $6,300TROMELIN ISLAND [FRANCE] $900FRENCH SOUTHERN AND ANTARCTIC LANDS [FRANCE] $0HEARD ISLAND AND MCDONALD ISLANDS [AUSTRALIA] $0
NORTH AMERICA
Country Name DollarsTotal $1,376,500,792CANADA $1,179,332,643MEXICO $109,639,556GREENLAND [DENMARK] $86,400,670BERMUDA [UNITED KINGDOM] $1,127,924
PACIFIC OCEAN / AUSTRALIA
Country Name DollarsTotal $269,934,205PHILIPPINES $172,394,408AUSTRALIA $79,256,583NEW ZEALAND $8,866,154FIJI $4,074,564VANUATU $1,121,392NIUE [NEW ZEALAND] $1,065,482
23

Country Name DollarsTotal $269,934,205PAPUA NEW GUINEA $1,030,492NEW CALEDONIA [FRANCE] $685,368TOKELAU [NEW ZEALAND] $399,281KIRIBATI $346,034BRUNEI $257,530TUVALU $115,990TONGA $105,304SAMOA $87,618SPRATLY ISLANDS [UNDETERMINED] $64,539SOLOMON ISLANDS $37,927WALLIS AND FUTUNA [FRANCE] $25,540ASHMORE AND CARTIER ISLANDS $0
SOUTH AND CENTRAL AMERICA
Country Name DollarsTotal $694,225,242COLOMBIA $265,713,127PANAMA $71,184,445ECUADOR $66,329,369PERU $54,457,821HONDURAS $36,298,985EL SALVADOR $33,115,816COSTA RICA $32,827,900GUATEMALA $31,428,351BOLIVIA $30,317,298NICARAGUA $20,285,553PARAGUAY $10,748,524GUYANA $10,681,205BRAZIL $10,253,389BELIZE $6,049,853ARGENTINA $4,414,736CHILE $3,948,890VENEZUELA $3,509,413URUGUAY $1,630,509SURINAME $992,988FALKLAND ISLANDS (ISLAS MALVINAS) [UNITED KINGDOM] $37,070
WESTERN EUROPE
Country Name DollarsTotal $7,406,192,203GERMANY $2,934,353,548UNITED KINGDOM $1,578,357,728
24

Country Name DollarsTotal $7,406,192,203DENMARK $540,942,268ITALY $516,348,763SWITZERLAND $467,821,429NORWAY $433,612,231SPAIN $257,747,199SWEDEN $150,606,432FRANCE $132,472,932MALTA $93,658,597BELGIUM $75,918,231LUXEMBOURG $73,347,196AUSTRIA $50,721,235NETHERLANDS $37,397,957PORTUGAL $36,767,127ICELAND $13,773,992IRELAND $10,171,908MONACO $637,255JAN MAYEN [NORWAY] $521,781GIBRALTAR [UNITED KINGDOM] $437,041HOLY SEE (VATICAN CITY) $379,377ANDORRA $164,389JERSEY $17,421LIECHTENSTEIN $13,228SAN MARINO $2,939
25

RESEARCH AND DEVELOPMENT SUMMARY - BY R & D CATEGORYFederal Procurement Data System - Next Generation
Year to DateNumber of
ActionsDollars
TOTAL FEDERAL RESEARCH AND DEVELOPMENT 90,003 $54,854,071,719AA AGRICULTURE RandD 316 $49,399,235AB COMMUNITY SERVICE/DEV. RandD 758 $421,950,914AC DEFENSE SYSTEMS RandD 22,596 $24,801,324,243AD DEFENSE (OTHER) RandD 33,092 $10,624,838,272AE ECONOMIC GROWTH/PRODUCTIVITY RandD 551 $148,408,839AF EDUCATION RandD 540 $161,023,850AG ENERGY RandD 370 $239,492,696AH ENVIRONMENTAL PROTECTION RandD 1,208 $94,930,509AJ GEN. SCIENCE/TECHNOLOGY RandD 5,502 $3,413,961,010AK HOUSING RandD 303 $144,622,215AL INCOME SECURITY RandD 229 $16,940,958AM INTERNATIONAL AFFAIR/COOPERAT RandD 25 $11,212,751AN MEDICAL RandD 6,929 $2,059,386,157AP NATURAL RESOURCES RandD 369 $25,119,835AQ SOCIAL SERVICES RandD 148 $10,676,106AR SPACE RandD 6,689 $6,508,317,792AS TRANSPORTATION (MODAL) RandD 561 $63,422,824AT TRANSPORTATION (OTHER) RandD 292 $35,053,566AU TRANSPORTATION (OBSOLETE GROUP) 7 $142,939AV MINING RandD 152 $9,096,279AZ OTHER RESEARCH/DEVELOPMENT 9,366 $6,014,750,729
Actions Reported - Fiscal Year 2007 through Fourth Quarter
26

OTHER SERVICES AND CONSTRUCTION - SUMMARY BYSERVICE CATEGORY
Federal Procurement Data System - Next Generation
Actions Reported - Fiscal Year 2007 through Fourth Quarter
Year to DateNumber of
ActionsDollars
TOTAL FEDERAL OTHER SERVICES AND CONSTRUCTION 1,088,653 $213,543,500,746B SPECIAL STUDIES/ANALYSIS, NOT RandD 19,138 $3,651,745,921C ARCHITECT/ENGINEER SERVICES 36,107 $5,403,042,199D ADP AND TELECOMMUNICATIONS 80,201 $24,471,194,781F NATURAL RESOURCES MANAGEMENT 25,798 $3,710,882,225G SOCIAL SERVICES 7,775 $1,578,227,750H QUALITY CONTROL, TEST, INSPECTION 8,043 $1,241,753,193J MAINT, REPAIR, REBUILD EQUIPMENT 140,340 $16,379,486,154K MODIFICATION OF EQUIPMENT 4,450 $1,062,655,875L TECHNICAL REPRESENTATIVE SVCS. 5,222 $3,088,267,722M OPERATION OF GOVT OWNED FACILITY 8,432 $20,667,087,510N INSTALLATION OF EQUIPMENT 9,881 $677,926,481P SALVAGE SERVICES 1,392 $294,888,703Q MEDICAL SERVICES 52,057 $12,385,787,299R SUPPORT SVCS (PROF, ADMIN, MGMT) 239,788 $58,569,992,901S UTILITIES AND HOUSEKEEPING 110,980 $13,148,656,306T PHOTO, MAP, PRINT, PUBLICATION 6,954 $303,928,994U EDUCATION AND TRAINING 34,380 $2,525,569,778V TRANSPORT, TRAVEL, RELOCATION 37,449 $6,352,898,358W LEASE/RENT EQUIPMENT 32,457 $991,021,541X LEASE/RENT FACILITIES 109,176 $4,887,501,634Y CONSTRUCT OF STRUCTURES/FACILITIES 38,076 $20,583,213,005Z MAINT, REPAIR, ALTER REAL PROPERTY 80,557 $11,567,772,418
27
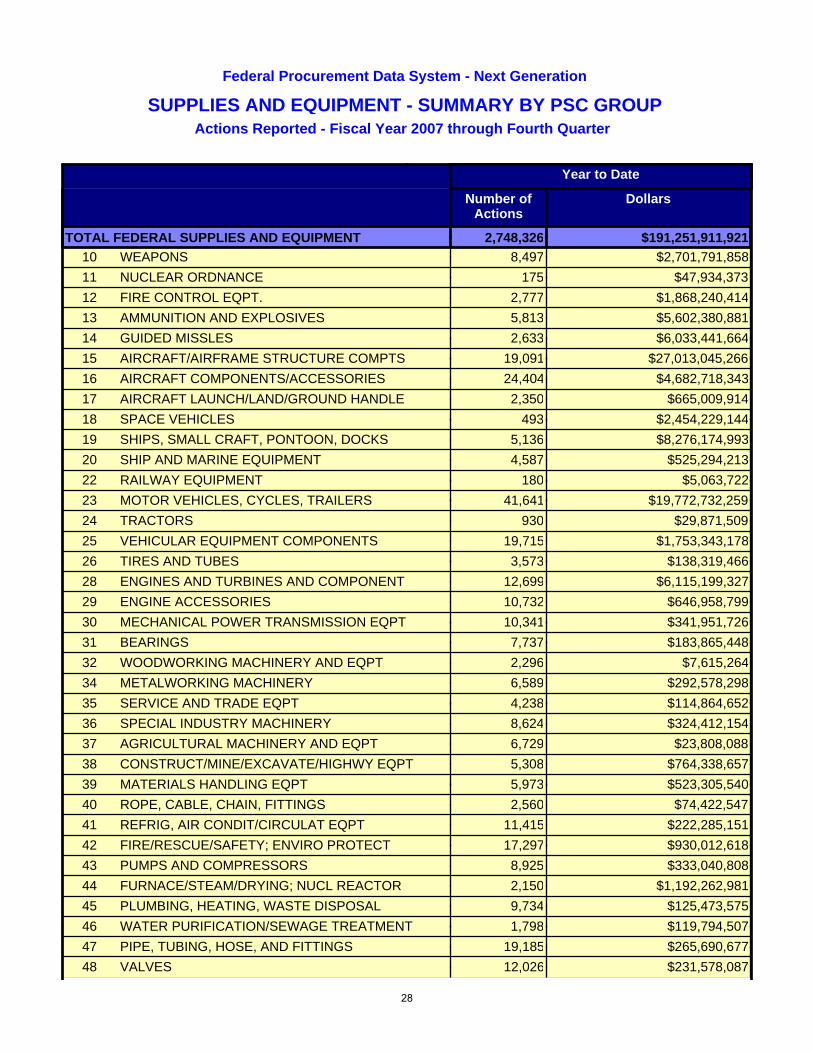
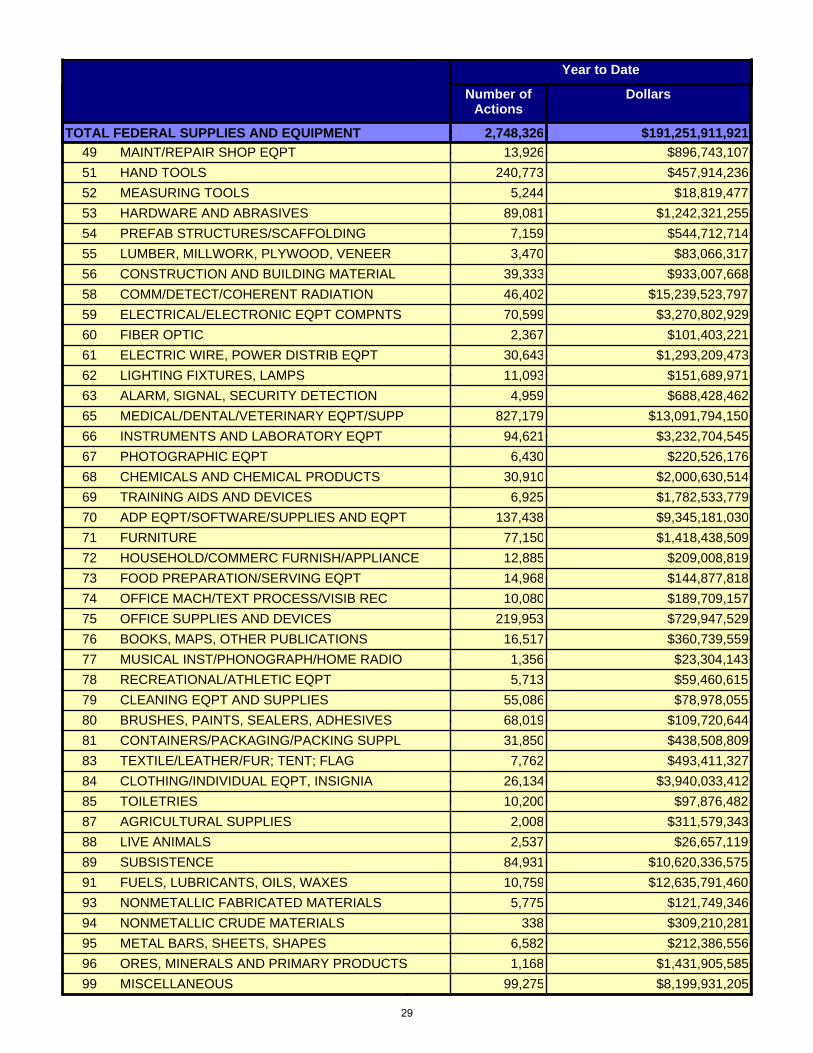
SUPPLIES AND EQUIPMENT - SUMMARY BY PSC GROUPFederal Procurement Data System - Next Generation
Actions Reported - Fiscal Year 2007 through Fourth Quarter
Year to Date
Number ofActions
Dollars
TOTAL FEDERAL SUPPLIES AND EQUIPMENT 2,748,326 $191,251,911,92110 WEAPONS 8,497 $2,701,791,85811 NUCLEAR ORDNANCE 175 $47,934,37312 FIRE CONTROL EQPT. 2,777 $1,868,240,41413 AMMUNITION AND EXPLOSIVES 5,813 $5,602,380,88114 GUIDED MISSLES 2,633 $6,033,441,66415 AIRCRAFT/AIRFRAME STRUCTURE COMPTS 19,091 $27,013,045,26616 AIRCRAFT COMPONENTS/ACCESSORIES 24,404 $4,682,718,34317 AIRCRAFT LAUNCH/LAND/GROUND HANDLE 2,350 $665,009,91418 SPACE VEHICLES 493 $2,454,229,14419 SHIPS, SMALL CRAFT, PONTOON, DOCKS 5,136 $8,276,174,99320 SHIP AND MARINE EQUIPMENT 4,587 $525,294,21322 RAILWAY EQUIPMENT 180 $5,063,72223 MOTOR VEHICLES, CYCLES, TRAILERS 41,641 $19,772,732,25924 TRACTORS 930 $29,871,50925 VEHICULAR EQUIPMENT COMPONENTS 19,715 $1,753,343,17826 TIRES AND TUBES 3,573 $138,319,46628 ENGINES AND TURBINES AND COMPONENT 12,699 $6,115,199,32729 ENGINE ACCESSORIES 10,732 $646,958,79930 MECHANICAL POWER TRANSMISSION EQPT 10,341 $341,951,72631 BEARINGS 7,737 $183,865,44832 WOODWORKING MACHINERY AND EQPT 2,296 $7,615,26434 METALWORKING MACHINERY 6,589 $292,578,29835 SERVICE AND TRADE EQPT 4,238 $114,864,65236 SPECIAL INDUSTRY MACHINERY 8,624 $324,412,15437 AGRICULTURAL MACHINERY AND EQPT 6,729 $23,808,08838 CONSTRUCT/MINE/EXCAVATE/HIGHWY EQPT 5,308 $764,338,65739 MATERIALS HANDLING EQPT 5,973 $523,305,54040 ROPE, CABLE, CHAIN, FITTINGS 2,560 $74,422,54741 REFRIG, AIR CONDIT/CIRCULAT EQPT 11,415 $222,285,15142 FIRE/RESCUE/SAFETY; ENVIRO PROTECT 17,297 $930,012,61843 PUMPS AND COMPRESSORS 8,925 $333,040,80844 FURNACE/STEAM/DRYING; NUCL REACTOR 2,150 $1,192,262,98145 PLUMBING, HEATING, WASTE DISPOSAL 9,734 $125,473,57546 WATER PURIFICATION/SEWAGE TREATMENT 1,798 $119,794,50747 PIPE, TUBING, HOSE, AND FITTINGS 19,185 $265,690,67748 VALVES 12,026 $231,578,087
28
Year to Date
Number ofActions
Dollars
TOTAL FEDERAL SUPPLIES AND EQUIPMENT 2,748,326 $191,251,911,92149 MAINT/REPAIR SHOP EQPT 13,926 $896,743,10751 HAND TOOLS 240,773 $457,914,23652 MEASURING TOOLS 5,244 $18,819,47753 HARDWARE AND ABRASIVES 89,081 $1,242,321,25554 PREFAB STRUCTURES/SCAFFOLDING 7,159 $544,712,71455 LUMBER, MILLWORK, PLYWOOD, VENEER 3,470 $83,066,31756 CONSTRUCTION AND BUILDING MATERIAL 39,333 $933,007,66858 COMM/DETECT/COHERENT RADIATION 46,402 $15,239,523,79759 ELECTRICAL/ELECTRONIC EQPT COMPNTS 70,599 $3,270,802,92960 FIBER OPTIC 2,367 $101,403,22161 ELECTRIC WIRE, POWER DISTRIB EQPT 30,643 $1,293,209,47362 LIGHTING FIXTURES, LAMPS 11,093 $151,689,97163 ALARM, SIGNAL, SECURITY DETECTION 4,959 $688,428,46265 MEDICAL/DENTAL/VETERINARY EQPT/SUPP 827,179 $13,091,794,15066 INSTRUMENTS AND LABORATORY EQPT 94,621 $3,232,704,54567 PHOTOGRAPHIC EQPT 6,430 $220,526,17668 CHEMICALS AND CHEMICAL PRODUCTS 30,910 $2,000,630,51469 TRAINING AIDS AND DEVICES 6,925 $1,782,533,77970 ADP EQPT/SOFTWARE/SUPPLIES AND EQPT 137,438 $9,345,181,03071 FURNITURE 77,150 $1,418,438,50972 HOUSEHOLD/COMMERC FURNISH/APPLIANCE 12,885 $209,008,81973 FOOD PREPARATION/SERVING EQPT 14,968 $144,877,81874 OFFICE MACH/TEXT PROCESS/VISIB REC 10,080 $189,709,15775 OFFICE SUPPLIES AND DEVICES 219,953 $729,947,52976 BOOKS, MAPS, OTHER PUBLICATIONS 16,517 $360,739,55977 MUSICAL INST/PHONOGRAPH/HOME RADIO 1,356 $23,304,14378 RECREATIONAL/ATHLETIC EQPT 5,713 $59,460,61579 CLEANING EQPT AND SUPPLIES 55,086 $78,978,05580 BRUSHES, PAINTS, SEALERS, ADHESIVES 68,019 $109,720,64481 CONTAINERS/PACKAGING/PACKING SUPPL 31,850 $438,508,80983 TEXTILE/LEATHER/FUR; TENT; FLAG 7,762 $493,411,32784 CLOTHING/INDIVIDUAL EQPT, INSIGNIA 26,134 $3,940,033,41285 TOILETRIES 10,200 $97,876,48287 AGRICULTURAL SUPPLIES 2,008 $311,579,34388 LIVE ANIMALS 2,537 $26,657,11989 SUBSISTENCE 84,931 $10,620,336,57591 FUELS, LUBRICANTS, OILS, WAXES 10,759 $12,635,791,46093 NONMETALLIC FABRICATED MATERIALS 5,775 $121,749,34694 NONMETALLIC CRUDE MATERIALS 338 $309,210,28195 METAL BARS, SHEETS, SHAPES 6,582 $212,386,55696 ORES, MINERALS AND PRIMARY PRODUCTS 1,168 $1,431,905,58599 MISCELLANEOUS 99,275 $8,199,931,205
29

E PURCHASE OF STRUCTURES/FACILITIES 377 $90,286,650E1 PURCHASE BUILDINGS 187 $54,020,224E2 PURCHASE FACILITY NOT A BUILDING 182 $34,136,752E3 PURCH RESTORATION OF REAL PROPERTY 8 $2,129,674
30

NORTH AMERICAN INDUSTRY CLASSIFICATION SYSTEM (NAICS) CODESUMMARY BY NAICS GROUP
Federal Procurement Data System - Next Generation
Actions Reported - Fiscal Year 2007 through Fourth Quarter
NAICS Actions DollarsTOTAL FEDERAL - YEAR TO DATE 3,241,593 $438,086,997,158
11 AGRICULTURE, FORESTRY, FISHING AND HUNTING 10,293 $559,562,990111 CROP PRODUCTION 1,037 $169,857,919112 ANIMAL PRODUCTION 1,244 $85,472,454113 FORESTRY AND LOGGING 450 $11,096,510114 FISHING, HUNTING AND TRAPPING 102 $2,083,247115 SUPPORT ACTIVITIES FOR AGRICULTURE AND FORESTRY 7,460 $291,052,860
21 MINING, QUARRYING, AND OIL AND GAS EXTRACTION 2,591 $190,965,024211 OIL AND GAS EXTRACTION 445 $82,545,808212 MINING (EXCEPT OIL AND GAS) 1,708 $63,578,286213 SUPPORT ACTIVITIES FOR MINING 438 $44,840,930
22 UTILITIES 12,548 $2,792,207,587221 UTILITIES 12,548 $2,792,207,587
23 CONSTRUCTION 119,922 $30,894,878,633233 BUILDING, DEVELOPING, AND GENERAL CONTRACTING 5,711 $884,709,932234 HEAVY CONSTRUCTION 575 $792,995,991235 SPECIAL TRADE CONTRACTORS 1,398 $96,379,099236 CONSTRUCTION OF BUILDINGS 47,267 $19,010,527,820237 HEAVY AND CIVIL ENGINEERING CONSTRUCTION 22,500 $7,113,960,836238 SPECIALTY TRADE CONTRACTORS 42,471 $2,996,304,956
31 MANUFACTURING (FOOD, TEXTILE, APPAREL, LEATHER) 51,403 $7,625,821,293311 FOOD MANUFACTURING 9,963 $2,894,419,478312 BEVERAGE AND TOBACCO PRODUCT MANUFACTURING 2,064 $289,827,340313 TEXTILE MILLS 8,268 $150,313,618314 TEXTILE PRODUCT MILLS 11,566 $940,870,198315 APPAREL MANUFACTURING 13,791 $3,137,661,792316 LEATHER AND ALLIED PRODUCT MANUFACTURING 5,751 $212,728,868
32 MANUFACTURING (PAPER, PRINTING, PETROLEUM, COAL,CHEMICAL, PLASTICS, RUBBER, NONMETALIC MINERAL) 240,335 $17,951,159,750
321 WOOD PRODUCT MANUFACTURING 3,098 $117,725,593322 PAPER MANUFACTURING 27,276 $301,315,437323 PRINTING AND RELATED SUPPORT ACTIVITIES 7,963 $96,824,805324 PETROLEUM AND COAL PRODUCTS MANUFACTURING 3,630 $10,080,739,812325 CHEMICAL MANUFACTURING 154,705 $6,485,478,840326 PLASTICS AND RUBBER PRODUCTS MANUFACTURING 23,662 $457,153,557
31

327 NONMETALLIC MINERAL PRODUCT MANUFACTURING 20,001 $411,921,707
33 MANUFACTURING (METALS, MACHINERY, COMPUTER,ELECTRONICS ELECTRICAL TRANSPORTATION EQUIPMENT,FURNITURE, MISCELLANEOUS)
1,153,938 $138,291,810,944
331 PRIMARY METAL MANUFACTURING 11,217 $1,302,651,704332 FABRICATED METAL PRODUCT MANUFACTURING 245,155 $9,725,665,614333 MACHINERY MANUFACTURING 116,392 $5,930,784,563334 COMPUTER AND ELECTRONIC PRODUCT MANUFACTURING 171,013 $28,984,266,236335 ELECTRICAL EQUIPMENT, APPLIANCE, AND COMPONENTMANUFACTURING 36,016 $1,510,876,180
336 TRANSPORTATION EQUIPMENT MANUFACTURING 169,584 $85,877,652,703337 FURNITURE AND RELATED PRODUCT MANUFACTURING 67,852 $1,347,118,567339 MISCELLANEOUS MANUFACTURING 336,709 $3,612,795,377
42 WHOLESALE TRADE 404,781 $22,395,395,683421 WHOLESALE TRADE, DURABLE GOODS 3,832 $145,288,635422 WHOLESALE TRADE, NONDURABLE GOODS 2,047 $88,164,061423 MERCHANT WHOLESALERS, DURABLE GOODS 210,527 $5,319,252,792424 MERCHANT WHOLESALERS, NONDURABLE GOODS 187,975 $16,826,283,942425 WHOLESALE ELECTRONIC MARKETS AND AGENTS ANDBROKERS 400 $16,406,253
44 RETAIL TRADE (MOTOR VEHICLE, FURNITURE, ELECTRONICS,BUILDING MATERIAL, FOOD, HEALTH, GASOLINE, CLOTHING) 172,257 $3,575,311,377
441 MOTOR VEHICLE AND PARTS DEALERS 8,095 $180,265,248442 FURNITURE AND HOME FURNISHINGS STORES 1,640 $25,916,466443 ELECTRONICS AND APPLIANCE STORES 42,794 $2,402,955,817444 BUILDING MATERIAL AND GARDEN EQUIPMENT ANDSUPPLIES DEALERS 115,561 $241,615,557
445 FOOD AND BEVERAGE STORES 1,334 $456,144,660446 HEALTH AND PERSONAL CARE STORES 1,192 $216,182,958447 GASOLINE STATIONS 649 $17,276,589448 CLOTHING AND CLOTHING ACCESSORIES STORES 992 $34,954,083
45 RETAIL TRADE (SPORTING GOODS GENERAL MERCHANDISE,MISCELLANEOUS) 135,912 $973,566,204
451 SPORTING GOODS, HOBBY, BOOK, AND MUSIC STORES 3,703 $222,642,754452 GENERAL MERCHANDISE STORES 533 $19,670,369453 MISCELLANEOUS STORE RETAILERS 128,240 $658,744,554454 NONSTORE RETAILERS 3,436 $72,508,527
48 TRANSPORTATION 28,831 $7,641,654,486481 AIR TRANSPORTATION 6,963 $3,479,915,734482 RAIL TRANSPORTATION 79 $3,356,159483 WATER TRANSPORTATION 2,596 $1,388,669,692484 TRUCK TRANSPORTATION 3,995 $375,871,845485 TRANSIT AND GROUND PASSENGER TRANSPORTATION 3,256 $188,139,050486 PIPELINE TRANSPORTATION 106 $20,884,196
32

487 SCENIC AND SIGHTSEEING TRANSPORTATION 93 $2,436,639488 SUPPORT ACTIVITIES FOR TRANSPORTATION 11,743 $2,182,381,171
49 POSTAL SERVICE, COURIER/MESSANGER, WAREHOUSING 8,696 $796,234,671491 POSTAL SERVICE 774 $45,063,272492 COURIERS AND MESSENGERS 5,849 $107,402,228493 WAREHOUSING AND STORAGE 2,073 $643,769,171
51 INFORMATION 65,971 $9,691,100,008511 PUBLISHING INDUSTRIES (EXCEPT INTERNET) 15,939 $1,245,256,860512 MOTION PICTURE AND SOUND RECORDING INDUSTRIES 1,309 $184,282,635513 BROADCASTING AND TELECOMMUNICATIONS 3,472 $1,082,192,681514 INFORMATION SERVICES AND DATA PROCESSING SERVICES 1,830 $1,109,612,976515 BROADCASTING (EXCEPT INTERNET) 1,627 $35,663,927516 INTERNET PUBLISHING AND BROADCASTING 476 $29,098,885517 TELECOMMUNICATIONS 31,583 $4,286,541,777518 DATA PROCESSING, HOSTING AND RELATED SERVICES 7,551 $1,310,143,097519 OTHER INFORMATION SERVICES 2,184 $408,307,171
52 FINANCE AND INSURANCE 4,899 $9,167,125,966521 MONETARY AUTHORITIES - CENTRAL BANK 12 $257,066522 CREDIT INTERMEDIATION AND RELATED ACTIVITIES 1,423 $182,090,774523 SECURITIES, COMMODITY CONTRACTS, AND OTHERFINANCIAL INVESTMENTS AND RELATED ACTIVITIES 692 $503,125,107
524 INSURANCE CARRIERS AND RELATED ACTIVITIES 1,730 $8,467,816,729525 FUNDS, TRUSTS, AND OTHER FINANCIAL VEHICLES 1,042 $13,836,290
53 REAL ESTATE AND RENTAL AND LEASING 119,059 $4,705,182,601531 REAL ESTATE 97,989 $3,447,651,105532 RENTAL AND LEASING SERVICES 21,026 $1,255,902,092533 LESSORS OF NONFINANCIAL INTANGIBLE ASSETS (EXCEPTCOPYRIGHTED WORKS) 44 $1,629,404
54 PROFESSIONAL, SCIENTIFIC, AND TECHNICAL SERVICES 393,437 $123,378,132,344541 PROFESSIONAL, SCIENTIFIC, AND TECHNICAL SERVICES 393,437 $123,378,132,344
55 MANAGEMENT OF COMPANIES AND ENTERPRISES 49 $2,018,355551 MANAGEMENT OF COMPANIES AND ENTERPRISES 49 $2,018,355
56 ADMINISTRATIVE AND SUPPORT AND WASTE MANAGEMENTAND REMEDIATION SERVICES 146,460 $39,350,773,227
561 ADMINISTRATIVE AND SUPPORT SERVICES 107,224 $33,507,494,531562 WASTE MANAGEMENT AND REMEDIATION SERVICES 39,236 $5,843,278,697
61 EDUCATIONAL SERVICES 27,118 $4,639,889,011611 EDUCATIONAL SERVICES 27,118 $4,639,889,011
62 HEALTH CARE AND SOCIAL ASSISTANCE 54,225 $4,268,654,190621 AMBULATORY HEALTH CARE SERVICES 38,209 $2,977,112,373622 HOSPITALS 7,723 $585,612,555
33

623 NURSING AND RESIDENTIAL CARE FACILITIES 5,197 $397,309,598624 SOCIAL ASSISTANCE 3,096 $308,619,665
71 ARTS, ENTERTAINMENT, AND RECREATION 4,629 $61,182,680711 PERFORMING ARTS, SPECTATOR SPORTS, AND RELATEDINDUSTRIES 3,077 $38,199,073
712 MUSEUMS, HISTORICAL SITES, AND SIMILAR INSTITUTIONS 437 $9,774,691713 AMUSEMENT, GAMBLING, AND RECREATION INDUSTRIES 1,115 $13,208,916
72 ACCOMMODATION AND FOOD SERVICES 24,426 $1,128,086,424721 ACCOMMODATION 16,054 $318,277,375722 FOOD SERVICES AND DRINKING PLACES 8,372 $809,809,049
81 OTHER SERVICES (EXCEPT PUBLIC ADMINISTRATION) 48,538 $4,022,816,685811 REPAIR AND MAINTENANCE 35,197 $3,627,629,340812 PERSONAL AND LAUNDRY SERVICES 7,692 $259,331,656813 RELIGIOUS, GRANTMAKING, CIVIC, PROFESSIONAL, ANDSIMILAR ORGANIZATIONS 5,488 $135,316,935
814 PRIVATE HOUSEHOLDS 161 $538,754
92 PUBLIC ADMINISTRATION 11,275 $3,983,467,025921 EXECUTIVE, LEGISLATIVE, AND OTHER GENERALGOVERNMENT SUPPORT 4,862 $2,145,115,488
922 JUSTICE, PUBLIC ORDER, AND SAFETY ACTIVITIES 2,218 $252,023,021923 ADMINISTRATION OF HUMAN RESOURCE PROGRAMS 1,362 $112,472,301924 ADMINISTRATION OF ENVIRONMENTAL QUALITY PROGRAMS 602 $78,661,837925 ADMINISTRATION OF HOUSING PROGRAMS, URBANPLANNING, AND COMMUNITY DEVELOPMENT 93 $6,991,812
926 ADMINISTRATION OF ECONOMIC PROGRAMS 1,064 $288,817,757927 SPACE RESEARCH AND TECHNOLOGY 514 $983,206,444928 NATIONAL SECURITY AND INTERNATIONAL AFFAIRS 560 $116,178,365
34

--
Funding Department
To
tal S
ma
ll Bu
sin
es
s
Elig
ible
Ac
tion
s
To
tal S
ma
ll Bu
sin
es
s
Elig
ible
Do
llars
Sm
all B
us
ine
ss
Ac
tion
s
Sm
all B
us
ine
ss
Do
llars
Sm
all B
us
ine
ss
Pe
rce
nta
ge
Sm
all D
isa
dv
an
tag
ed
Bu
sin
es
s A
ctio
ns
Sm
all D
isa
dv
an
tag
ed
Bu
sin
es
s D
olla
rs
Sm
all D
isa
dv
an
tag
ed
Bu
sin
es
s P
erc
en
tag
e
8(a
) Pro
ce
du
re A
ctio
ns
8(a
) Pro
ce
du
re D
olla
rs
8(a
) Pro
ce
du
re P
erc
en
tag
e
Ve
tera
n O
wn
ed
Sm
all
Bu
sin
es
s A
ctio
ns
Ve
tera
n O
wn
ed
Sm
all
Bu
sin
es
s D
olla
rs
Ve
tera
n O
wn
ed
Sm
all
Bu
sin
es
s P
erc
en
tag
e
Se
rvic
e D
isa
ble
d V
ete
ran
Ow
ne
d S
ma
ll Bu
sin
es
s
Ac
tion
s
Se
rvic
e D
isa
ble
d V
ete
ran
Ow
ne
d S
ma
ll Bu
sin
es
s
Do
llars
Se
rvic
e D
isa
ble
d V
ete
ran
Ow
ne
d S
ma
ll Bu
sin
es
s
Pe
rce
nta
ge
Wo
me
n O
wn
ed
Sm
all
Bu
sin
es
s A
ctio
ns
Wo
me
n O
wn
ed
Sm
all
Bu
sin
es
s D
olla
rs
Wo
me
n O
wn
ed
Sm
all
Bu
sin
es
s P
erc
en
tag
e
Ce
rtified
HU
BZ
on
e S
ma
ll
Bu
sin
es
s A
ctio
ns
Ce
rtified
HU
BZ
on
e S
ma
ll
Bu
sin
es
s D
olla
rs
Ce
rtified
HU
BZ
on
e S
ma
ll
Bu
sin
es
s P
erc
en
tag
e
DEPT OF DEFENSE (9700) 1,889,101 $269,312,039,976.97 1,018,847 $55,047,154,697.13 20.4399% 143,048 $15,483,505,702.22 5.7493% 37,482 $6,427,087,570.99 2.3865% 125,004 $6,479,372,855.90 2.4059% 29,425 $1,860,328,366.19 0.6908% 191,280 $7,725,076,037.78 2.8684% 57,682 $5,977,808,192.22 2.2197%
ENERGY, DEPARTMENT OF (8900) 11,877 $22,803,051,156.58 7,575 $1,420,660,156.12 6.2301% 2,269 $541,943,836.52 2.3766% 1,085 $327,930,920.66 1.4381% 871 $147,977,986.06 0.6489% 264 $100,012,515.96 0.4386% 1,591 $236,870,225.74 1.0388% 552 $68,173,354.67 0.2990%
HEALTH AND HUMAN SERVICES, DEPARTMENT OF (7500) 65,536 $13,580,806,353.38 31,757 $2,959,569,575.68 21.7923% 5,729 $929,654,608.63 6.8454% 1,269 $354,875,010.14 2.6131% 3,399 $325,905,401.46 2.3998% 413 $79,356,310.20 0.5843% 6,927 $648,676,884.41 4.7764% 1,244 $163,540,180.08 1.2042%
NATIONAL AERONAUTICS AND SPACE ADMINISTRATION (8000) 26,740 $12,811,828,250.24 14,358 $1,967,410,844.42 15.3562% 4,779 $879,096,277.66 6.8616% 1,259 $424,008,672.07 3.3095% 1,576 $390,236,475.12 3.0459% 349 $157,680,733.76 1.2307% 2,079 $290,299,422.87 2.2659% 512 $93,020,377.06 0.7261%
VETERANS AFFAIRS, DEPARTMENT OF (3600) 3,943,523 $11,735,408,740.83 2,506,302 $3,854,684,343.57 32.8466% 89,767 $1,029,410,495.34 8.7718% 2,003 $401,046,153.50 3.4174% 399,541 $1,216,580,370.73 10.3667% 51,304 $831,811,813.84 7.0881% 260,490 $583,653,895.86 4.9734% 171,540 $388,439,407.06 3.3100%
HOMELAND SECURITY, DEPARTMENT OF (7000) 80,746 $10,703,910,556.56 46,789 $3,832,162,724.70 35.8015% 8,173 $1,453,850,575.04 13.5824% 2,320 $404,471,273.55 3.7787% 5,603 $583,288,998.11 5.4493% 1,324 $151,512,452.73 1.4155% 8,499 $845,334,056.27 7.8974% 3,169 $317,177,978.23 2.9632%
JUSTICE, DEPARTMENT OF (1500) 98,783 $6,763,711,433.32 47,540 $1,759,705,543.00 26.0169% 4,917 $311,266,934.94 4.6020% 691 $119,701,947.68 1.7698% 4,437 $174,079,482.34 2.5737% 1,235 $50,643,314.26 0.7488% 8,879 $282,053,265.73 4.1701% 1,096 $46,956,243.43 0.6942%
GENERAL SERVICES ADMINISTRATION (4700) 248,145 $4,892,095,303.71 105,844 $1,674,121,874.79 34.2210% 18,284 $654,122,593.14 13.3710% 4,537 $299,186,428.19 6.1157% 12,930 $241,997,943.04 4.9467% 3,838 $109,872,940.29 2.2459% 25,800 $327,925,105.89 6.7032% 6,902 $272,421,113.00 5.5686%
AGRICULTURE, DEPARTMENT OF (1200) 63,374 $4,603,948,617.13 48,354 $2,509,214,703.13 54.5014% 6,155 $559,139,193.94 12.1448% 2,513 $270,698,080.11 5.8797% 5,696 $304,192,463.29 6.6072% 1,677 $116,178,951.41 2.5235% 8,065 $321,412,230.16 6.9812% 4,283 $402,578,574.64 8.7442%
INTERIOR, DEPARTMENT OF THE (1400) 74,771 $2,684,949,566.56 46,443 $1,594,489,772.92 59.3862% 6,766 $570,423,614.26 21.2452% 2,977 $307,425,477.89 11.4500% 4,737 $161,265,985.53 6.0063% 854 $37,143,876.11 1.3834% 7,826 $281,532,391.29 10.4856% 3,344 $302,305,200.70 11.2593%
COMMERCE, DEPARTMENT OF (1300) 22,887 $2,160,394,751.79 13,654 $993,918,185.18 46.0063% 3,154 $355,450,236.24 16.4530% 1,367 $141,028,336.73 6.5279% 1,591 $86,085,295.32 3.9847% 706 $43,038,917.27 1.9922% 2,495 $217,886,556.18 10.0855% 732 $41,902,788.51 1.9396%
STATE, DEPARTMENT OF (1900) 23,151 $2,147,045,500.35 10,779 $902,596,218.74 42.0390% 2,510 $349,352,137.35 16.2713% 647 $107,945,211.88 5.0276% 1,621 $192,885,930.05 8.9838% 369 $49,900,561.78 2.3242% 2,131 $109,984,761.37 5.1226% 301 $53,146,983.05 2.4754%
LABOR, DEPARTMENT OF (1600) 10,231 $1,940,054,938.45 4,758 $604,681,611.84 31.1683% 1,190 $219,542,938.05 11.3163% 388 $76,916,266.33 3.9646% 640 $89,294,551.67 4.6027% 307 $48,005,485.30 2.4744% 1,286 $118,744,906.01 6.1207% 215 $22,649,263.02 1.1675%
TREASURY, DEPARTMENT OF THE (2000) 22,058 $1,926,095,839.51 12,397 $553,970,446.72 28.7613% 1,493 $155,371,320.23 8.0666% 619 $57,574,677.34 2.9892% 1,128 $68,069,950.41 3.5341% 318 $20,773,648.34 1.0785% 3,085 $146,560,803.21 7.6092% 371 $21,437,886.36 1.1130%
TRANSPORTATION, DEPARTMENT OF (6900) 11,229 $1,485,258,128.86 5,657 $755,741,873.46 50.8829% 1,695 $286,642,941.37 19.2992% 619 $158,473,701.03 10.6698% 628 $74,227,862.39 4.9976% 270 $34,747,021.80 2.3395% 1,096 $154,505,074.04 10.4026% 511 $112,237,647.66 7.5568%
ENVIRONMENTAL PROTECTION AGENCY (6800) 23,744 $1,452,848,839.82 11,011 $601,718,070.55 41.4164% 2,545 $216,209,829.20 14.8818% 875 $69,561,178.15 4.7879% 1,119 $81,690,691.10 5.6228% 559 $57,946,034.31 3.9884% 1,686 $74,271,053.05 5.1121% 536 $33,539,781.91 2.3086%
EDUCATION, DEPARTMENT OF (9100) 3,415 $1,437,744,325.93 1,405 $225,238,554.66 15.6661% 266 $74,056,294.05 5.1509% 50 $17,453,339.79 1.2139% 121 $15,734,917.23 1.0944% 27 $3,137,963.29 0.2183% 391 $80,191,217.98 5.5776% 54 $7,947,676.48 0.5528%
OFFICE OF PERSONNEL MANAGEMENT (2400) 11,954 $1,402,367,371.77 4,296 $352,452,255.84 25.1327% 1,101 $104,265,371.53 7.4350% 196 $41,121,514.73 2.9323% 296 $21,885,988.22 1.5606% 72 $6,199,295.91 0.4421% 1,429 $79,529,153.98 5.6711% 118 $26,075,309.49 1.8594%
HOUSING AND URBAN DEVELOPMENT, DEPARTMENT OF (8600) 3,998 $880,999,394.89 2,861 $560,455,963.43 63.6159% 1,384 $352,450,808.60 40.0058% 691 $177,398,063.40 20.1360% 493 $115,325,021.27 13.0902% 101 $21,111,564.18 2.3963% 857 $164,795,606.82 18.7055% 354 $14,383,132.52 1.6326%
SOCIAL SECURITY ADMINISTRATION (2800) 9,100 $783,589,205.49 5,880 $250,412,644.37 31.9571% 489 $87,290,098.38 11.1398% 206 $43,645,180.71 5.5699% 385 $36,949,393.82 4.7154% 62 $9,689,149.05 1.2365% 1,377 $27,831,996.04 3.5519% 128 $23,927,862.22 3.0536%
FEDERAL EMERGENCY MANAGEMENT AGENCY (5800) 2,448 $482,236,453.13 1,835 $121,417,822.12 25.1781% 158 $42,833,684.60 8.8823% 72 $51,587,579.00 10.6976% 224 $16,070,112.71 3.3324% 26 $88,147.00 0.0183% 315 $47,265,980.70 9.8014% 102 $29,993,072.90 6.2196%
BROADCASTING BOARD OF GOVERNORS (9568) 3,080 $251,466,501.97 2,595 $38,028,791.88 15.1228% 74 $6,347,271.02 2.5241% 15 $1,921,208.15 0.7640% 83 $907,137.18 0.3607% 16 $165,287.71 0.0657% 373 $2,468,914.71 0.9818% 13 $2,475,986.24 0.9846%
NATIONAL SCIENCE FOUNDATION (4900) 1,110 $229,260,514.03 460 $39,463,198.96 17.2133% 98 $21,287,369.82 9.2852% 59 $7,868,774.84 3.4322% 41 $8,789,727.00 3.8339% 6 $470,432.50 0.2052% 132 $12,551,307.05 5.4747% 11 $2,049,866.70 0.8941%
ARMED FORCES RETIREMENT HOME (84AF) 442 $217,642,048.98 310 $18,665,670.04 8.5763% 120 $14,932,127.06 6.8609% 67 $10,235,030.40 4.7027% 91 $2,132,952.98 0.9800% 67 $1,635,430.88 0.7514% 61 $2,068,945.34 0.9506% 66 $1,981,696.33 0.9105%
AGENCY FOR INTERNATIONAL DEVELOPMENT (7200) 1,347 $215,536,167.70 212 $22,325,335.22 10.3580% 61 $7,963,749.39 3.6949% 5 $787,708.96 0.3655% 15 $1,199,418.59 0.5565% 5 $13,337.59 0.0062% 42 $3,697,453.22 1.7155% 14 $1,930,192.21 0.8955%
SMITHSONIAN INSTITUTION (3300) 3,215 $201,333,720.43 1,919 $103,895,560.76 51.6037% 316 $44,589,347.66 22.1470% 34 $9,927,647.67 4.9309% 131 $5,324,438.91 2.6446% 21 $2,371,698.35 1.1780% 434 $27,689,663.87 13.7531% 59 $7,267,328.59 3.6096%
EXECUTIVE OFFICE OF THE PRESIDENT (1100) 1,197 $179,973,147.99 622 $33,657,965.14 18.7017% 93 $5,639,556.67 3.1336% 20 $1,503,063.27 0.8352% 110 $3,489,819.07 1.9391% 16 $800,939.78 0.4450% 130 $4,671,074.46 2.5954% 11 $1,095,272.44 0.6086%
NUCLEAR REGULATORY COMMISSION (3100) 2,120 $159,304,010.75 1,045 $68,579,786.92 43.0496% 408 $21,922,713.97 13.7616% 162 $17,516,228.97 10.9955% 115 $9,400,804.55 5.9012% 22 $2,505,129.66 1.5725% 212 $14,288,437.00 8.9693% 52 $7,295,529.10 4.5796%
NATIONAL ARCHIVES AND RECORDS ADMINISTRATION (8800) 1,458 $140,473,716.84 615 $31,773,718.09 22.6190% 115 $8,506,348.63 6.0555% 37 $3,141,250.04 2.2362% 76 $5,662,802.71 4.0312% 19 $1,722,731.14 1.2264% 128 $8,310,380.46 5.9160% 17 $1,421,345.44 1.0118%
SECURITIES AND EXCHANGE COMMISSION (5000) 821 $122,159,140.69 336 $41,432,996.53 33.9172% 49 $6,946,299.64 5.6863% 5 $692,375.00 0.5668% 22 $1,204,358.84 0.9859% 4 $298,392.71 0.2443% 59 $16,198,451.96 13.2601% 7 $845,481.68 0.6921%
SMALL BUSINESS ADMINISTRATION (7300) 1,060 $93,625,011.28 597 $64,552,332.13 68.9477% 231 $44,727,826.31 47.7734% 71 $19,687,676.16 21.0282% 49 $6,190,849.57 6.6124% 25 $3,984,863.78 4.2562% 131 $23,069,612.74 24.6404% 21 $7,388,561.55 7.8917%
FEDERAL COMMUNICATIONS COMMISSION (2700) 1,394 $91,052,299.04 712 $20,730,541.95 22.7677% 248 $10,039,481.61 11.0261% 4 $0.00 0.0000% 66 $5,183,304.89 5.6927% 16 $3,222,244.64 3.5389% 248 $9,230,420.69 10.1375% 8 $81,827.66 0.0899%
THE LEGISLATIVE BRANCH (0000) 212 $81,345,628.41 153 $33,755,954.82 41.4970% 104 $11,426,570.00 14.0469% 33 $2,520,107.00 3.0980% 10 $466,974.00 0.5741% 3 $74,254.00 0.0913% 38 $3,066,221.50 3.7694% 27 $2,007,695.00 2.4681%
PEACE CORPS (1145) 724 $77,352,218.60 358 $61,056,686.12 78.9333% 61 $2,900,330.98 3.7495% 15 $496,244.40 0.6415% 29 $279,233.03 0.3610% 4 $50,000.00 0.0646% 51 $2,534,855.39 3.2770% 0 $0.00 0.0000%
AGENCY FOR INTERNATIONAL DEVELOPMENT (1152) 45 $68,444,363.59 15 $882,261.24 1.2890% 5 $801,492.94 1.1710% 1 $12,957.00 0.0189% 1 $0.00 0.0000% 0 $0.00 0.0000% 4 $41.00 0.0001% 1 $0.00 0.0000%
EQUAL EMPLOYMENT OPPORTUNITY COMMISSION (4500) 3,767 $54,301,591.51 2,538 $12,264,578.74 22.5860% 56 $2,980,962.60 5.4896% 18 $2,783,347.75 5.1257% 265 $2,718,315.12 5.0060% 75 $1,570,739.90 2.8926% 844 $1,982,124.68 3.6502% 12 $32,959.00 0.0607%
CORPORATION FOR NATIONAL AND COMMUNITY SERVICE (9577) 527 $40,777,783.73 216 $8,093,331.46 19.8474% 37 $3,955,165.05 9.6993% 4 $333,416.48 0.8176% 29 $665,026.70 1.6309% 3 $53,362.43 0.1309% 54 $934,238.90 2.2910% 5 $49,985.39 0.1226%
GOVERNMENT PRINTING OFFICE (0400) 138 $32,355,350.01 108 $24,966,335.70 77.1629% 41 $12,804,062.85 39.5732% 31 $9,619,383.34 29.7304% 8 $1,061,189.34 3.2798% 4 $787,832.00 2.4349% 31 $8,709,031.05 26.9168% 13 $3,346,297.65 10.3423%
FEDERAL TRADE COMMISSION (2900) 550 $31,237,018.16 297 $16,279,018.20 52.1145% 52 $5,976,015.24 19.1312% 14 $1,890,547.52 6.0523% 55 $4,962,959.02 15.8881% 34 $4,305,028.35 13.7818% 59 $2,761,437.00 8.8403% 15 $1,502,755.96 4.8108%
ADVISORY COMMISSION ON INTERGOVERNMENTAL RELATIONS (5500) 62 $23,787,742.00 33 $265,200.00 1.1149% 19 $26,961.00 0.1133% 0 $0.00 0.0000% 6 $20,066.00 0.0844% 0 $0.00 0.0000% 1 $0.00 0.0000% 19 $26,961.00 0.1133%
NATIONAL GALLERY OF ART (3355) 187 $23,357,904.49 50 $2,340,023.22 10.0181% 6 $199,227.40 0.8529% 3 $102,381.40 0.4383% 3 $31,448.67 0.1346% 1 $16,502.67 0.0707% 8 $227,384.31 0.9735% 0 $0.00 0.0000%
J. F. KENNEDY CENTER FOR THE PERFORMING ARTS (3352) 164 $21,138,032.92 94 $3,382,312.45 16.0011% 20 $1,828,925.17 8.6523% 1 $42,113.00 0.1992% 7 $26,761.43 0.1266% 0 $0.00 0.0000% 21 $2,278,834.51 10.7807% 9 $157,208.20 0.7437%
MILLENIUM CHALLENGE CORPORATION (9543) 397 $20,014,545.61 215 $11,887,558.06 59.3946% 17 $2,871,606.46 14.3476% 11 $2,658,876.96 13.2847% 15 $399,792.09 1.9975% 0 $0.00 0.0000% 36 $2,394,810.36 11.9653% 1 $0.00 0.0000%
OCCUPATIONAL SAFETY AND HEALTH REVIEW COMMISSION (9514) 117 $19,018,448.70 87 $16,518,415.15 86.8547% 14 $137,881.05 0.7250% 3 $41,648.00 0.2190% 19 $1,979,876.39 10.4103% 2 $127,030.00 0.6679% 24 $2,688,831.33 14.1380% 7 $86,611.15 0.4554%
FEDERAL ENERGY REGULATORY COMMISSION (8961) 106 $15,604,776.11 38 $2,092,227.00 13.4076% 2 $144,588.00 0.9266% 0 $0.00 0.0000% 0 $0.00 0.0000% 0 $0.00 0.0000% 3 $87,913.00 0.5634% 0 $0.00 0.0000%
RAILROAD RETIREMENT BOARD (6000) 471 $13,388,300.75 208 $5,414,676.48 40.4433% 24 $1,041,611.63 7.7800% 0 $0.00 0.0000% 23 $814,780.59 6.0858% 16 $454,593.01 3.3954% 31 $1,199,843.13 8.9619% 2 $418,995.00 3.1296%
COMMODITY FUTURES TRADING COMMISSION (9507) 367 $12,856,136.45 131 $3,120,995.46 24.2763% 23 $164,363.38 1.2785% 2 $78,275.00 0.6089% 12 $58,565.12 0.4555% 3 $10,409.50 0.0810% 53 $310,304.84 2.4137% 2 -$16,989.27 -0.1321%
NATIONAL LABOR RELATIONS BOARD (6300) 262 $11,335,259.92 135 $3,016,826.91 26.6145% 11 $823,765.43 7.2673% 1 $128,095.68 1.1301% 9 $249,819.14 2.2039% 3 $85,008.81 0.7500% 30 $190,450.99 1.6802% 2 $50,732.00 0.4476%
UNITED STATES TRADE AND DEVELOPMENT AGENCY (1153) 163 $9,913,295.99 159 $9,608,312.76 96.9235% 13 $1,078,543.60 10.8798% 0 $0.00 0.0000% 6 $78,617.95 0.7931% 3 $40,000.00 0.4035% 30 $2,659,229.94 26.8249% 0 $0.00 0.0000%
CONSUMER PRODUCT SAFETY COMMISSION (6100) 905 $9,658,374.56 438 $6,172,456.21 63.9078% 35 $2,073,118.48 21.4645% 15 $547,571.04 5.6694% 10 $318,446.84 3.2971% 6 $132,899.24 1.3760% 175 $1,205,517.81 12.4816% 9 $374,383.38 3.8763%
NATIONAL TRANSPORTATION SAFETY BOARD (9508) 279 $6,700,300.54 193 $4,130,731.77 61.6499% 36 $1,117,550.59 16.6791% 9 $373,021.12 5.5672% 29 $1,413,928.09 21.1025% 14 $1,148,716.06 17.1442% 49 $1,181,061.40 17.6270% 12 $288,586.76 4.3071%
FEDERAL ELECTION COMMISSION (9506) 740 $6,404,515.03 246 $4,242,986.22 66.2499% 8 $144,752.00 2.2602% 0 $0.00 0.0000% 29 $81,544.45 1.2732% 1 $3,000.00 0.0468% 80 $224,376.99 3.5034% 2 $6,832.16 0.1067%
LIBRARY OF CONGRESS (0300) 36 $5,036,097.23 17 $1,983,363.00 39.3829% 8 $223,367.00 4.4353% 7 $219,127.00 4.3511% 4 $84,545.00 1.6788% 1 $4,240.00 0.0842% 2 $49,420.00 0.9813% 4 $118,322.00 2.3495%
NATIONAL ENDOWMENT FOR THE HUMANITIES (5940) 100 $3,724,994.00 64 $1,864,262.00 50.0474% 5 $175,118.00 4.7012% 1 $7,600.00 0.2040% 9 $122,589.00 3.2910% 0 $0.00 0.0000% 19 $554,586.00 14.8882% 1 $12,701.00 0.3410%
SELECTIVE SERVICE SYSTEM (9000) 283 $3,610,742.77 169 $1,724,371.95 47.7567% 6 $1,070,536.00 29.6486% 0 $0.00 0.0000% 13 $44,262.45 1.2259% 2 $13,959.00 0.3866% 14 $118,773.64 3.2895% 2 $1,250.00 0.0346%
DEFENSE NUCLEAR FACILITIES SAFETY BOARD (9516) 88 $3,606,986.64 56 $2,982,845.11 82.6963% 12 $1,360,968.63 37.7315% 6 $1,226,025.96 33.9903% 8 $429,750.51 11.9144% 1 $30,382.09 0.8423% 3 $33,482.12 0.9283% 0 $0.00 0.0000%
MERIT SYSTEMS PROTECTION BOARD (4100) 243 $3,081,640.73 129 $683,673.05 22.1854% 6 $16,422.09 0.5329% 0 $0.00 0.0000% 7 $18,035.76 0.5853% 0 $0.00 0.0000% 48 $193,946.34 6.2936% 0 $0.00 0.0000%
CHEMICAL SAFETY AND HAZARD INVESTIGATION BOARD (9565) 159 $1,918,123.36 95 $1,740,737.77 90.7521% 13 $72,992.38 3.8054% 7 $40,934.81 2.1341% 12 $1,151,244.11 60.0193% 2 $15,892.02 0.8285% 22 $126,093.10 6.5738% 13 $134,428.58 7.0083%
NATIONAL CAPITAL PLANNING COMMISSION (9502) 53 $1,782,136.66 27 $1,505,088.57 84.4542% 3 $13,901.03 0.7800% 0 $0.00 0.0000% 3 $22,867.00 1.2831% 1 $16,027.00 0.8993% 7 $288,840.28 16.2075% 0 $0.00 0.0000%
FEDERAL MARITIME COMMISSION (6500) 108 $1,247,167.52 45 $699,739.33 56.1063% 7 $368,669.63 29.5606% 1 $31,480.08 2.5241% 13 $365,603.75 29.3147% 9 $362,503.75 29.0662% 4 $56,137.03 4.5012% 6 $343,118.50 27.5118%
FEDERAL FINANCIAL INSTITUTIONS EXAMINATION COUNCIL (9562) 10 $1,215,126.23 9 $499,766.23 41.1288% 4 $217,490.23 17.8986% 0 $0.00 0.0000% 4 $217,490.23 17.8986% 1 $166,798.00 13.7268% 6 $146,143.23 12.0270% 3 $50,692.23 4.1718%
STATE JUSTICE INSTITUTE (4817) 2 $1,191,817.00 2 $1,191,817.00 100.0000% 0 $0.00 0.0000% 0 $0.00 0.0000% 0 $0.00 0.0000% 0 $0.00 0.0000% 1 -$6,183.00 -0.5188% 0 $0.00 0.0000%
DENALI COMMISSION (9572) 54 $1,146,883.78 45 $1,086,508.54 94.7357% 11 $216,209.12 18.8519% 3 $82,339.28 7.1794% 8 $628,356.68 54.7882% 4 $46,356.68 4.0420% 22 $195,441.36 17.0411% 4 $97,482.83 8.4998%
THE JUDICIAL BRANCH (1000) 15 $1,107,919.02 13 $1,107,919.02 100.0000% 4 $9,483.00 0.8559% 2 $5,280.00 0.4766% 1 $29,548.30 2.6670% 0 $0.00 0.0000% 0 $0.00 0.0000% 0 $0.00 0.0000%
ARCHITECTURAL AND TRANSPORTATION BARRIERS COMPLIANCE BOARD (9532) 97 $995,625.99 54 $215,531.61 21.6478% 5 $27,300.00 2.7420% 0 $0.00 0.0000% 1 $43,844.00 4.4037% 0 $0.00 0.0000% 19 $65,352.06 6.5639% 0 $0.00 0.0000%
NATIONAL FOUNDATION ON THE ARTS AND THE HUMANITIES (5900) 37 $869,533.95 16 $663,809.05 76.3408% 8 $573,171.48 65.9171% 3 $214,860.00 24.7098% 0 $0.00 0.0000% 0 $0.00 0.0000% 5 $273,946.20 31.5049% 0 $0.00 0.0000%
COMMISSION ON CIVIL RIGHTS (9517) 14 $816,720.13 3 $217,304.12 26.6069% 0 $0.00 0.0000% 0 $0.00 0.0000% 0 $0.00 0.0000% 0 $0.00 0.0000% 0 $0.00 0.0000% 0 $0.00 0.0000%
FARM CREDIT ADMINISTRATION (7800) 115 $815,184.45 51 $273,780.28 33.5851% 5 $16,593.00 2.0355% 0 $0.00 0.0000% 1 $0.00 0.0000% 1 $0.00 0.0000% 5 $25,863.92 3.1728% 0 $0.00 0.0000%
INTERNATIONAL TRADE COMMISSION (3400) 26 $740,342.09 16 $446,643.80 60.3294% 4 $189,373.10 25.5791% 0 $0.00 0.0000% 0 $0.00 0.0000% 0 $0.00 0.0000% 1 $44,628.35 6.0281% 1 $44,628.35 6.0281%
NATIONAL MEDIATION BOARD (9524) 52 $486,367.46 6 $40,914.47 8.4123% 3 $21,769.64 4.4760% 0 $0.00 0.0000% 2 $20,157.94 4.1446% 0 $0.00 0.0000% 1 $1,611.70 0.3314% 1 $1,611.70 0.3314%
OFFICE OF SPECIAL COUNSEL (6201) 31 $427,903.11 11 $116,632.60 27.2568% 1 $17,688.00 4.1336% 0 $0.00 0.0000% 1 $37,500.00 8.7637% 1 $37,500.00 8.7637% 2 $1,950.00 0.4557% 0 $0.00 0.0000%
NATIONAL ENDOWMENT FOR THE ARTS (5920) 19 $393,225.57 11 $143,951.94 36.6080% 1 $10,982.40 2.7929% 0 $0.00 0.0000% 1 $4,736.00 1.2044% 0 $0.00 0.0000% 4 $35,384.90 8.9986% 0 $0.00 0.0000%
FEDERAL LABOR RELATIONS AUTHORITY (5400) 8 $313,484.80 4 $163,727.40 52.2282% 1 $148,727.40 47.4433% 1 $148,727.40 47.4433% 1 $0.00 0.0000% 0 $0.00 0.0000% 2 $15,000.00 4.7849% 0 $0.00 0.0000%
ELECTION ASSISTANCE COMMISSION (9523) 5 $307,203.00 4 $262,345.00 85.3979% 0 $0.00 0.0000% 0 $0.00 0.0000% 0 $0.00 0.0000% 0 $0.00 0.0000% 2 $4,500.00 1.4648% 2 $4,500.00 1.4648%
NATIONAL COMMISSION ON LIBRARIES AND INFORMATION SCIENCE (9527) 40 $306,151.69 12 $129,252.00 42.2183% 0 $0.00 0.0000% 0 $0.00 0.0000% 1 $11,500.00 3.7563% 0 $0.00 0.0000% 0 $0.00 0.0000% 0 $0.00 0.0000%
GENERAL ACCOUNTING OFFICE (0500) 6 $279,344.00 3 $73,239.00 26.2182% 0 $0.00 0.0000% 0 $0.00 0.0000% 0 $0.00 0.0000% 0 $0.00 0.0000% 1 $0.00 0.0000% 0 $0.00 0.0000%
U.S. CLAIMS COURT (1005) 7 $230,569.27 7 $230,569.27 100.0000% 3 $86,180.48 37.3773% 3 $86,180.48 37.3773% 1 $7,905.25 3.4286% 0 $0.00 0.0000% 1 $44,128.00 19.1387% 1 $44,128.00 19.1387%
ABRAHAM LINCOLN BICENTENNIAL COMMISSION (0938) 7 $178,470.00 2 $14,440.00 8.0910% 1 $0.00 0.0000% 0 $0.00 0.0000% 0 $0.00 0.0000% 0 $0.00 0.0000% 1 $0.00 0.0000% 0 $0.00 0.0000%
FEDERAL HOUSING FINANCE BOARD (9540) 9 $142,897.41 5 $93,027.64 65.1010% 0 $0.00 0.0000% 0 $0.00 0.0000% 0 $0.00 0.0000% 0 $0.00 0.0000% 0 $0.00 0.0000% 0 $0.00 0.0000%
FEDERAL RESERVE SYSTEM, BOARD OF GOVERNORS (9559) 1 $100,320.00 0 $0.00 0.0000% 0 $0.00 0.0000% 0 $0.00 0.0000% 0 $0.00 0.0000% 0 $0.00 0.0000% 0 $0.00 0.0000% 0 $0.00 0.0000%
COMMITTEE FOR PURCHASE FROM PEOPLE WHO ARE BLIND OR SEVERELY DISABLED
(9518) 8 $88,290.00 7 $75,000.00 84.9473% 0 $0.00 0.0000% 0 $0.00 0.0000% 0 $0.00 0.0000% 0 $0.00 0.0000% 0 $0.00 0.0000% 0 $0.00 0.0000%
OFFICE OF GOVERNMENT ETHICS (9549) 3 $83,051.84 3 $83,051.84 100.0000% 0 $0.00 0.0000% 0 $0.00 0.0000% 0 $0.00 0.0000% 0 $0.00 0.0000% 0 $0.00 0.0000% 0 $0.00 0.0000%
MISSISSIPPI RIVER COMMISSION (9668) 1 $54,579.81 1 $54,579.81 100.0000% 1 $54,579.81 100.0000% 0 $0.00 0.0000% 0 $0.00 0.0000% 0 $0.00 0.0000% 0 $0.00 0.0000% 1 $54,579.81 100.0000%
FEDERAL PUBLIC DEFENDERS (1023) 3 $54,065.35 3 $54,065.35 100.0000% 0 $0.00 0.0000% 0 $0.00 0.0000% 2 $53,970.85 99.8252% 0 $0.00 0.0000% 0 $0.00 0.0000% 0 $0.00 0.0000%
COMMISSION ON EXECUTIVE, LEGISLATIVE, AND JUDICIAL SALARIES (4836) 2 $50,000.00 0 $0.00 0.0000% 0 $0.00 0.0000% 0 $0.00 0.0000% 0 $0.00 0.0000% 0 $0.00 0.0000% 0 $0.00 0.0000% 0 $0.00 0.0000%
U.S. COURT OF VETERAN APPEALS (9593) 2 $34,821.60 2 $34,821.60 100.0000% 0 $0.00 0.0000% 0 $0.00 0.0000% 0 $0.00 0.0000% 0 $0.00 0.0000% 0 $0.00 0.0000% 0 $0.00 0.0000%
FEDERAL MINE SAFETY AND HEALTH REVIEW COMMISSION (9504) 1 $27,783.98 1 $27,783.98 100.0000% 0 $0.00 0.0000% 0 $0.00 0.0000% 0 $0.00 0.0000% 0 $0.00 0.0000% 0 $0.00 0.0000% 0 $0.00 0.0000%
COURT SECURITY (1025) 3 $16,252.15 2 $0.00 0.0000% 2 $0.00 0.0000% 0 $0.00 0.0000% 0 $0.00 0.0000% 0 $0.00 0.0000% 0 $0.00 0.0000% 0 $0.00 0.0000%
SPECIAL RAIL REORGANIZATION COURT (1037) 1 $10,028.88 1 $10,028.88 100.0000% 0 $0.00 0.0000% 0 $0.00 0.0000% 1 $10,028.88 100.0000% 0 $0.00 0.0000% 0 $0.00 0.0000% 0 $0.00 0.0000%
OFF OF THE FED INSPECTOR FOR THE AK NATURAL GAS TRANSPORT (5200) 1 $3,835.00 1 $3,835.00 100.0000% 0 $0.00 0.0000% 0 $0.00 0.0000% 1 $3,835.00 100.0000% 0 $0.00 0.0000% 0 $0.00 0.0000% 0 $0.00 0.0000%
U.S. TAX COURT (2300) 1 $3,074.48 0 $0.00 0.0000% 0 $0.00 0.0000% 0 $0.00 0.0000% 0 $0.00 0.0000% 0 $0.00 0.0000% 0 $0.00 0.0000% 0 $0.00 0.0000%
EXPORT-IMPORT BANK OF THE U.S. (8300) 1 $1,269.00 0 $0.00 0.0000% 0 $0.00 0.0000% 0 $0.00 0.0000% 0 $0.00 0.0000% 0 $0.00 0.0000% 0 $0.00 0.0000% 0 $0.00 0.0000%
NATIONAL CREDIT UNION ADMINISTRATION (2500) 4 $73.50 0 $0.00 0.0000% 0 $0.00 0.0000% 0 $0.00 0.0000% 0 $0.00 0.0000% 0 $0.00 0.0000% 0 $0.00 0.0000% 0 $0.00 0.0000%
U.S. COURT OF INTERNATIONAL TRADE (1004) 1 -$1,205.70 1 -$1,205.70 100.0000% 1 -$1,205.70 100.0000% 0 $0.00 0.0000% 0 $0.00 0.0000% 0 $0.00 0.0000% 1 -$1,205.70 100.0000% 0 $0.00 0.0000%
Total 6,675,895 $378,507,701,469.81 3,964,375 $83,274,871,888.47 22.0008% 308,384 $24,906,169,393.64 6.5801% 62,540 $10,376,108,088.03 2.7413% 573,499 $10,891,538,404.74 2.8775% 93,912 $3,815,922,586.23 1.0081% 541,349 $12,925,549,634.54 3.4149% 254,202 $8,462,735,569.53 2.2358%
Small Business Goaling Report
Fiscal Year 2007
This report displays the dollars, actions, and percentages for small business contracts. The goaling exclusions apply to this report. This report is run by funding agency.
35

--
Appendix:
This is a Department level report that displays Small Business data for a specified date range by Funding Agency. Please note if the Funding Agency is empty, the Contracting Agency is the Funding Agency and will be used for this report.
Data for this report is calculated as follows:
Total Small Business Eligible Actions: This column is an aggregation of Number of Actions, after exclusions are applied.
Total Small Business Eligible Dollars: This column is an aggregation of Dollars Obligated, after exclusions are applied.
Small Business Actions: This column is an aggregation of Number of Actions when the 'Contracting Officer's Business Size Selection is equal to "Small Business."
Small Business Dollars: This column is an aggregation of Dollars Obligated when the 'Contracting Officer's Business Size Selection' is equal to "Small Business."
Small Business Percentage of Dollars Obligated: This column is computed as follows: Small Business Dollars/Total Small Business Eligible Dollars.
Small Disadvantaged Business Actions: This column is an aggregation of Number of Actions when the 'Contracting Officer's Business Size Selection' is equal to "Small Business" AND the vendor's business type is SDB or 8(a).
Small Disadvantaged Business Dollars: This column is an aggregation of Dollars Obligated when the 'Contracting Officer's Business Size Selection' is equal to "Small Business" AND the vendor's business type is SDB or 8(a).
Small Disadvantaged Business Percentage of Dollars Obligated: This column is computed as follows: Small Disadvantaged Business Dollars/Total Small Business Eligible Dollars.
8(a) Procedure Actions: This column is an aggregation of Number of Actions when the 'Type of Set Aside' is one of the following values: 8(a) Sole Source, 8(a) Competed, 8(a) HUBZone.
8(a) Procedure Dollars: This column is an aggregation Dollars Obligated when "Type of Set Aside is one of the following values: 8(a) Sole Source, 8(a) Competed, 8(a) HUBZone.
8(a) Procedure Percentage of Dollars Obligated: This column is computed as follows: 8(a) Procedure Dollars/Total Small Business Eligible Dollars.
Veteran Owned Small Business Actions: This column is an aggregation of Number of Actions when the 'Contracting Officer's Selection of Business Size' is equal to "Small Business" AND the vendor's business type is Veteran Owned.
Veteran Owned Small Business Dollars: This column is an aggregation of Dollars Obligated when the 'Contracting Officer's Selection of Business Size' is equal to "Small Business" AND the vendor's business type is Veteran Owned.
Veteran Owned Small Business Percentage of Dollars Obligated: This column is computed as follows: Veteran Owned Small Business Dollars/Total Small Business Eligible Dollars.
Service Disabled Veteran Owned Small Business Actions: This column is an aggregation of Number of Actions when the 'Contracting Officer's Selection of Business Size' is equal to "Small Business" AND the vendor's business type is Service Disabled Veteran Owned.
Service Disabled Veteran Owned Small Business Dollars: This column is an aggregation of Dollars Obligated when the 'Contracting Officer's Selection of Business Size' is equal to "Small Business" AND the vendor's business type is Service Disabled Veteran Owned.
Service Disabled Veteran Owned Small Business Percentage of Dollars Obligated: This column is computed as follows: Service Disabled Veteran Owned Small Business Dollars/Total Small Business Eligible Dollars.
Women Owned Small Business Actions: This column is an aggregation of Number of Actions when 'Contracting Officer's Selection of Business Size' is equal to "Small Business" AND the vendor's business type is Women Owned.
Women Owned Small Business Dollars: This column is an aggregation of Dollars Obligated when the 'Contracting Officer's Selection of Business Size' is equal to "Small Business" AND the vendor's business type is Women Owned.
Women Owned Small Business Percentage of Dollars Obligated: This column is computed as follows: Women Owned Small Business Dollars/Total Small Business Eligible Dollars.
Certified HUBZone Small Business Actions: This column is an aggregation of Number of Actions when the 'Contracting Officer's Selection of Business Size' is equal to "Small Business" AND the vendor's business type is HUBZone Certified.
Certified HUBZone Small Business Dollars: This column is an aggregation of Dollars Obligated when the when 'Contracting Officer's Selection of Business Size' is equal to "Small Business" AND the vendor's business type is Certified HUBZone.
Certified HUBZone Small Business Percentage of Dollars Obligated: This column is computed as follows: Certified HUBZone Small Business Dollars/Total Small Business Eligible Dollars.
NOTE:
- 8(a) procedures calculations include delivery orders issued against an IDV where the IDV type set aside is 8(a) competed, 8(a) sole source, or 8(a) with HUBZone.
- For DoD, NASA, and United States Coast Guard, Historically Black Colleges or Universities (HBCU) and Minority Institutions (MI) are included in the Small Disadvantaged Business (SDB) category.
The following (goaling) exclusions apply to the Small Business Goaling Report
- Javits-Wagner-O'Day Program (JWOD, Sheltered Workshop): Awards that have a contractor with a CCR based Sheltered Workshop designation Flag equal to "Y" are excluded.
- UNICOR: Exclude the UNICOR DUNS numbers specified in the APPENDIX A.
- American Institute in Taiwan: Awards with the American Institute in Taiwan designated as the contractor for the award and determined by a DUNS number of '161174503'.
- Contracts performed outside of the United States: Awards performed outside of the US are designated when the country in the place of performance is NOT the United States.
- Acquisitions by agencies on behalf of foreign governments or entities or international organizations: Awards in which the contract for foreign entity is yes are excluded from the report.
- Contracts funded predominately with agency generated sources. Accordingly, the following Federal Government agencies are excluded:
- FDIC, 5100
- Postal Service, 1800
- Bureau Of Engraving And Printing, 2041
- United States Mint, 2044
- Office Of The Comptroller Of The Currency, 2046
- Office Of Thrift Supervision, 2047
- Transportation Security Administration, 6965; 7013
- Federal Aviation Administration, 6920
- Tennessee Valley Authority, 6400
- Administrative Office of the US Courts, 1027
- Architect of the Capitol, 0100
- Bankruptcy Courts, 1021
- Central Intelligence Agency, 5600
- Congressional Budget Office, 0800
- Court Services and Offender Supervision Agency, 9594
- Pretrial Services Agency, 959P
- Federal Judicial Center, 1028
- Overseas Private Investment Corporation, 7100
- Supreme Court of US, 1001
- US Courts of Appeals-Judicial Circuits, 1002
- US District and Territorial Courts, 1012
- Contracts awarded for the Defense Commissary Agency, (Awards with a Reason Not Competed value of "RES" for Resale).
- Product Service codes for Leases in the format X***.
- Product Service codes for Utilities S112 (Electric).
- Tricare DODAAC - H94002. (based on Contracting Office Code)
APPENDIX A - List of DUNS - UNICOR/Federal Prison Industries
014723167 177021870
025866133 178845053
027435366 183606490
042811430 185501798
056435894 185930542
057272486 187651752
060771920 199234480
068638951 618879423
072724859 622178747
075399977 624770475
085119121 626627459
086854069 626979314
088695218 794034553
096356964 801970971
098736291 801977273
103385519 801983800
118882161 801984964
126924018 801991969
127300429 883387995
127607732 932169972
129794269 932793250
147374714 933631806
148033947 933631814
148071236 933631939
152000998 942195132
161114251
Report Drill Down capabilities include MACOM, SUBCOM and Functional Dimensions as selection criteria and are relevant to DOD data only.
The Federal Procurement Data System - Next Generation (FPDS-NG) is a dynamic, real-time database. Updates to data, including new actions, modifications, and corrections are made on a regular basis. Such updates could result in changes to the FPDS-NG data used to compile reports on actions for current and/or prior fiscal years. Accordingly, all reports need to be viewed with this in mind. It should also be noted that availability of DoD data entered into FPDS-NG is subject to a 90-day delay for non DoD users.
36

Appendix: Total Federal Views Procurement History by Quarter Actions This report provides total actions for procurement actions for each FY quarter for the fiscal year 2007 and the ten previous fiscal years. Beginning in FY 2004 these action counts began to include individual actions that in previous years were reported as summary contract actions. Only awards (Delivery/Task Order, Purchase Order, Definitive Contract, and BPA Call) in final status are included in the report. NASA-specific award types such as Intragovernmental, Cooperative Agreement, Grant for Research, Funded Space Act Agreement, and Training Grant are not included in the report. Indefinite Delivery Vehicle Awards (IDVs) are not included in this report, but delivery orders and BPA Calls placed against IDVs are included. Procurement History by Quarter Dollars This report provides the total dollars obligated for each FY quarter for the fiscal year 2007 and the ten previous fiscal years. Beginning in FY 2004 these dollars amounts began to include individual actions that in previous years were reported as summary contract actions. Only awards (Delivery/Task Order, Purchase Order, Definitive Contract, and BPA Call) in final status are included in the report. NASA-specific awards such as Intragovernmental, Cooperative Agreement, Grant for Research, Funded Space Act Agreement, and Training Grant are not included in the report. Indefinite Delivery Vehicle awards (IDVs) are not included in this report, but delivery orders and BPA Calls placed against IDVs are included. Small Business Ownership Report – Number of New Businesses by Ethnic Group This report provides the total number of new business actions [contractors registered in Central Contractor Registry (CCR) for the first time from FY 2006 for Department of Defense Agencies and Civilian Agencies for the following categories: Columns
• Women-Owned Small Business Firms – Awards made to Women-owned businesses determined by the Contracting Officer to be a “Small Business” for this procurement.
• Women-Owned Small Disadvantaged Business Firms – Awards made to Women-owned businesses that are also Small Disadvantaged Business firms, determined by the Contracting Officer to be a “Small Business” for this procurement.
• Small Disadvantaged Business Firms – Awards made to Small Disadvantaged Business firms determined by the Contracting Officer to be a “Small Business” for this procurement.
Each of these categories is combined with one of the ethnic groups listed below and limited to businesses that registered in the Central Contractor Registry in the Fiscal Year 2007.
• Asian-Indian American – Contracts with Socio Economic indicator as Asian-Indian
American. • Asian-Pacific American – Contracts with Socio Economic indicator as Asian-Pacific
American. • Black American – Contracts with Socio Economic indicator as Black American. • Hispanic American – Contracts with Socio Economic indicator as Hispanic American. • Native American – Contracts with Socio Economic indicator as Native American.
• No Representation – Contracts with Socio Economic indicators other than those listed above.
37

New businesses are defined as contractors registered in the Central Contractor Registry for the first time in the fiscal year 2006. Beginning in FY 2004 these action counts and dollars began to include individual actions that in previous years were reported as summary contract actions. This report is limited to awards (Delivery/Task Order, Purchase Order, Definitive Contract and BPA Call) in final status. NASA specific award types such as Intragovernmental, Cooperative Agreement, Grant for Research, Funded Space Act Agreement, and Training Grant are not included in the report. Indefinite Delivery Vehicle Awards (IDVs) are not included in this report, but delivery orders and BPA Calls placed against IDVs are included. Small Business Ownership Report – Number of New Businesses by Department This report displays the same information as the “Small Business Ownership Report – Number of New Businesses by Ethnic Group” report, broken down by US Government Department rather than ethnic group. Columns
• Women-Owned Small Business Firms - Awards made to Women-owned businesses determined by the Contracting Officer to be a “Small Business” for this procurement.
• Women-Owned Small Disadvantaged Business Firms - Awards made to Women-owned businesses that are also Small Disadvantaged Business firms, determined by the Contracting Officer to be a “Small Business” for this procurement.
• Small Disadvantaged Business Firms - Awards made to Small Disadvantaged Business firms determined by the Contracting Officer to be a “Small Business” for this procurement.
Each of these categories is combined with one of the federal government departments and limited to businesses that registered in the Central Contractor Registry in the Fiscal Year 2007. Rows Federal Government Departments New businesses are defined as the contractors registered in the Central Contractor Registry for the first time in the Fiscal Year 2006. Beginning in FY 2004 these action counts and dollars began to include individual actions that in previous years were reported as summary contract actions. This report is limited to awards (Delivery/Task Order, Purchase Order, Definitive Contract and BPA Call) in final status. NASA specific award types such as Intragovernmental, Cooperative Agreement, Grant for Research, Funded Space Act Agreement, and Training Grant are not included in the report. Indefinite Delivery Vehicle Awards (IDVs) are not included in this report, but delivery orders and BPA Calls placed against IDVs are included. Note: Some departments and agencies may have an unusually high number of businesses considered to be doing business with the Federal government for the first time because this report shows businesses registering with the Central Contractor Registry (CCR) for the first time. FY2004 was the first year in which businesses were required to register in CCR to be eligible to get government contracts. Previously, some Federal organizations had not required contractors to register with CCR in order to do business.
38

Report on Method of Awards – Small Business This report provides total actions and total dollars obligated to Small Businesses for federal government department in the following three competition categories:
• Non Competitive – Awards with Extent Competed as ‘Not available for competition’ or ‘Not Competed’ or ‘Follow on to competed action’ or ‘Non competitive Delivery Order’
• Restricted Competition – Extent Competed is “Full and Open after Exclusion of Sources.”
• Unrestricted Competition – Extent competed as ‘Full and Open Competition’ or ‘Full and Open Competition after exclusion of sources’ or ‘Competed under SAT’
A Small business is a business determined by the Contracting Officer to be a “Small Business” for this
procurement.
Beginning in FY 2004 these action counts and dollars began to include individual actions that in previous years were reported as summary contract actions. This report is limited to awards (Delivery/Task Order, Purchase Order, Definitive Contract, and BPA Call) in final status. NASA-specific awards such as Intragovernmental, Cooperative Agreement, Grant for Research, Funded Space Act Agreement, and Training Grant are not included in the report. Indefinite Delivery Vehicle Awards (IDVs) are not included in this report, but delivery orders and BPA Calls placed against IDVs are included. Report on Method of Awards – Small Disadvantaged Business The report provides, by federal government department, the total actions and total dollars obligated to Small disadvantaged businesses in the following three competition categories:
• Non Competitive – Awards with Extent Competed as “Not available for competition,” or “Not Competed,” or “Follow on to competed action,” or “Non competitive Delivery Order.”
• Restricted Competition – Extent Competed is “Full and Open after Exclusion of Sources.”
• Un-restricted Competition – Extent competed as ‘Full and Open Competition’ or ‘Full and Open Competition after exclusion of sources’ or ‘Competed under SAT’
A Small Disadvantaged Business is a business determined by Contracting Officer to be a Small Disadvantaged Business” for this procurement. Beginning in FY 2004 these action counts and dollars began to include individual actions that in previous years were reported as summary contract actions. This report is limited to awards (Delivery/Task Order, Purchase Order, Definitive Contract, and BPA Call) in final status. NASA-specific awards such as Intragovernmental, Cooperative Agreement, Grant for Research, Funded Space Act Agreement, and Training Grant are not included in the report. Indefinite Delivery Vehicle Awards (IDVs) are not included in this report, but delivery orders and BPA Calls placed against IDVs are included. Contract Actions by Dollar Value The report provides total actions and total Dollars Obligated for transactions having dollars obligated amounts in the following dollar ranges: (1) $ 0 to $25,000; (2) between $25,000 and $100,000; (3) between $100,000 and $1,000,000 and (4) greater than or equal to $1,000,000.
39

Beginning in FY 2004 these action counts and dollars began to include individual actions that in previous years were reported as summary contract actions. This report is limited to awards (Delivery/Task Order, Purchase Order, Definitive Contract, and BPA Call) in final status. NASA-specific awards such as Intragovernmental, Cooperative Agreement, Grant for Research, Funded Space Act Agreement, and Training Grant are not included in the report. Indefinite Delivery Vehicle Awards (IDVs) are not included in this report, but delivery orders and BPA Calls placed against IDVs are included. Contract Dollars by Executive Departments and Agencies This report displays the total dollars obligated for the Department of Defense and ten Civilian Agencies for Fiscal Year 2007. Beginning in FY 2004 these action counts and dollars began to include individual actions that in previous years were reported as summary contract actions. This report is limited to awards (Delivery/Task Order, Purchase Order, Definitive Contract and BPA Call) in final status. NASA-specific awards such as Intragovernmental, Cooperative Agreement, Grant for Research, Funded Space Act Agreement, and Training Grant are not included in the report. Indefinite Delivery Vehicle Awards (IDVs) are not included in this report, but delivery orders and BPA Calls placed against IDVs are included. Procurements Performed Outside U.S. and U.S. Territories by Continent This report displays the total dollars obligated for contracts performed outside of the U.S (and U.S territories) for the Fiscal Year 2007 by continent or major island group. The report excludes contracts with Place of Performance in the U.S., country codes belonging to the U.S territories: American Samoa, Federated States / Micronesia, Guam, Northern Mariana Islands, Marshall Islands, Palau, Puerto Rico, U.S. Minor Outlying Islands, and U.S. Virgin Islands and where Place of Performance is not reported. Beginning in FY 2004 these action counts and dollars began to include individual actions that in previous years were reported as summary contract actions. This report is limited to awards (Delivery/Task Order, Purchase Order, Definitive Contract, and BPA Call) in final status. NASA-specific awards such as Intragovernmental, Cooperative Agreement, Grant for Research, Funded Space Act Agreement, and Training Grant are not included in the report. Indefinite Delivery Vehicle Awards (IDVs) are not included in this report, but delivery orders and BPA Calls placed against IDVs are included. Research and Development – Summary by R&D Category This report displays the total actions and dollars obligated in Fiscal Year 2007 for R&D categories which are Product and Service Codes (PSC) starting with the letter A.
40

Beginning in FY 2004 these action counts and dollars began to include individual actions that in previous years were reported as summary contract actions. This report is limited to awards (Delivery/Task Order, Purchase Order, Definitive Contract, and BPA Call) in final status. NASA-specific awards such as Intragovernmental, Cooperative Agreement, Grant for Research, Funded Space Act Agreement, and Training Grant are not included in the report. Indefinite Delivery Vehicle Awards (IDVs) are not included in this report, but delivery orders and BPA Calls placed against IDVs are included. Other Services and Construction – Summary by Service Category This report displays the total actions and total dollars obligated in Fiscal Year 2007 for “Other Services and Construction” categories (PSC codes starting with B, C, D, F, G, H, J, K, L, M, N,P, Q, R, S, T, U, V, W, X, Y, or Z). Beginning in FY 2004 these action counts and dollars began to include individual actions that in previous years were reported as summary contract actions. This report is limited to awards (Delivery/Task Order, Purchase Order, Definitive Contract, and BPA Call) in final status. NASA-specific awards such as Intragovernmental, Cooperative Agreement, Grant for Research, Funded Space Act Agreement, and Training Grant are not included in the report. Indefinite Delivery Vehicle Awards (IDVs) are not included in this report, but delivery orders and BPA Calls placed against IDVs are included. Supplies and Equipment – Summary by PSC Group This report displays the total actions and total dollars obligated in Fiscal Year 2007 for supplies and equipments. Beginning in FY 2004 these action counts and dollars began to include individual actions that in previous years were reported as summary contract actions. This report is limited to awards (Delivery/Task Order, Purchase Order, Definitive Contract, and BPA Call) in final status. NASA-specific awards such as Intragovernmental, Cooperative Agreement, Grant for Research, Funded Space Act Agreement, and Training Grant are not included in the report. Indefinite Delivery Vehicle Awards (IDVs) are not included in this report, but delivery orders and BPA Calls placed against IDVs are included. North American Industry Classification System Code – Summary by NAICS Group This report provides the total actions and total dollars obligated in fiscal year 2007 by NAICS code categories using the first two positions of the NAICS code. Beginning in FY 2004 these action counts and dollars began to include individual actions that in previous years were reported as summary contract actions. This report is limited to awards (Delivery/Task Order, Purchase Order, Definitive Contract, and BPA Call) in final status. NASA-specific awards such as Intragovernmental, Cooperative Agreement, Grant for Research, Funded Space Act Agreement, and Training Grant are not included in the report. Indefinite Delivery Vehicle Awards (IDVs) are not included in this report, but delivery orders and BPA Calls placed against IDVs are included. Note: Actions are calculated to the nearest whole percent and dollars to the nearest 100th of a percent.
41

Small Business Goaling Report This report displays goaling data for Federal government departments’ awards to small businesses in fiscal year 2007. Exclusions: The Small Business Administration has specified that the following types of transactions shall be excluded from the Small Business Goaling Report.
• • Awards to JWOD organizations, previously known as Sheltered Workshops. • • Awards to Federal Prison Industries also known as UNICOR. • • Awards to the American Institute in Taiwan (DUNS number 161174503) • • Contracts awarded and performed outside of the United States. • • Acquisitions by agencies on behalf of foreign governments or entities, or international
organizations. • • Contracts funded by agencies using non-appropriated funds following or not required
by the FAR or DFARS to report to FPDS-NG. In general, these Federal Government agencies are excluded:
o FDIC, 5100 o Postal Service, 1800 o Bureau of Engraving and Printing, 2041 o United States Mint, 2044 o Office of the Comptroller of the Currency, 2046 o Office of Thrift Supervision, 2047 o Transportation Security Administration, 6965; 7013 o Federal Aviation Administration, 6920 o Tennessee Valley Authority, 6400 o Administrative Office of the US Courts, 1027 o Architect of the Capitol, 0100 o Bankruptcy Courts, 1021 o Central Intelligence Agency, 5600 o Congressional Budget Office, 0800 o Court Services and Offender Supervision Agency, 9594 o Pretrial Services Agency, 959P o Federal Judicial Center, 1028 o Overseas Private Investment Corporation, 7100 o Supreme Court of the US, 1001 o US Courts of Appeals – Judicial Circuits, 1002 o US District and Territorial Courts, 1012
• Contracts awarded for Defense Commissary Agency (DeCA) are excluded because they are buying for a commissary for resale.
• Awards where Reason Not Competed is Resale.
42

Category Definitions The following are the definitions of the categories; all exclude the categories listed above: Total Actions and Dollars Total Actions and Dollars for federal
government departments for the fiscal year 2007.
Small Business Concerns Awards are included in the Small Business category when the Contracting Officer’s selection of Business Size is Small Business.
Small Disadvantaged Business Concerns (SDB)
Awards are included when the vendor is listed in the Central Contractor Registry as either a small disadvantaged business or as an 8(A) firm. For DoD, NASA, and the United States Coast Guard, Historically Black Colleges or Universities (HBCU) and Minority Institutions (MI) are also included in the Small Disadvantaged Business Program goaling category.
8(a) Contractors
Awards are included in the 8(a) Program small business goaling category when the Type of Set Aside used is one of: 8(a) Sole Source or 8(a) Competed or 8(a) with HUBZone.
Other SDB Contractors
Awards to Small Disadvantaged Businesses that are not 8(a) Businesses.
HUBZONE Small Businesses
Awards to HUBZone small businesses where the Contracting Officer’s Business Size selection is Small Business and the vendor is designated as a HUBZone business in the Central Contractor Registry.
Women Owned Small Business Concerns
Awards to Women Owned Small Businesses where the Contracting Officer’s Business Size selection is Small Business and the vendor is designated as a Women Owned business in the Central Contractor Registry.
Service Disabled Veteran Owned Business Awards to Service Disabled Veteran Owned Business where the Contracting Officer’s Business Size selection is Small Business and the vendor is designated as Service Disabled Veteran Owned Business in the Central Contractor Registry.
43