
2006 ANNUAL REPORT -...
68
2006 ANNUAL REPORT
Transcript of 2006 ANNUAL REPORT -...

2006 ANNUAL REPORT
Dear Shareholders,
2006 was an extraordinary year for Chipotle. We completed a successful IPO in January 2006, made significant progress on our Food With Integrity mission and have taken important steps toward building a culture which appeals only to the highest performing employees.
We continue to serve 100% naturally raised pork in all of our restaurants, and at the end of 2006, about 55% of our chicken and more than 40% of our beef was naturally raised. All of our naturally raised meat comes from animals that are humanely raised, fed a pure vegetarian diet, and never given antibiotics or added hormones. We now serve more naturally raised meat than any restaurant company in the world, yet we are constantly working with existing and potential suppliers to help us serve only naturally raised meat in all our restaurants.
Our food is better today than ever before because our raw ingredients are the best they have ever been. By caring more about our ingredients, and respecting the animals, the land and the farmers who produce the food, our food will continue to taste even better and we will continue to strengthen the bond we have with our customers.
We also took a number of important steps to enhance our restaurant culture during the year, and to develop the very best managers in the industry. Our Restaurateur Program elevated the stature of our best restaurant managers, creating a culture where all of our restaurant managers identify and train our best crew to become the future managers of Chipotle. Many of our best managers started as crew, and we are confident that by having our best managers hire and train our crew, we are developing a strong bench of great managers.
Another step we took this past year was to create a new restaurant staffing structure which allows our crew to follow an efficient and logical path into management roles. We invested in communication and training programs which make the position of manager clearly accessible to those with a strong work ethic and a passion for great customer service. These programs will reduce the costs of recruiting, interviewing and training outside candidates while improving our bench of great managers and lowering crew and manager turnover. Today, more than half of our managers are promoted from crew positions and our turnover at the manager level has decreased to less than 30%.
Throughput enhances customer service by reducing the amount of time our customers wait in line. On top of significant gains we made in 2005, we continued to improve throughput in 2006. We will continue to focus on better throughput in 2007 through better equipment, better training and by improving the management in our restaurants.
In 2006, we grew our revenues by 31.1% to $822.9 million, increased comparable restaurant sales by 13.7%, and opened a total of 94 restaurants. 2006 marks our ninth consecutive year of double-digit comparable restaurant sales increases, which illustrates our ability to attract new customers as well as build strong relationships and greater customer loyalty with our existing customers. We increased average restaurant sales 11.9% to $1.611 million, improved our restaurant margin to 20.9% for the year, and nearly doubled our income from operations to $62.0 million.
Chipotle was originally designed to be a very simple and efficient restaurant with very few moving parts. This allowed us to serve great food using fresh raw ingredients and classic cooking techniques, but also serve it to our customers fast. Chipotle is better today because we built upon this foundation by always challenging ourselves to do better. We will continue to challenge ourselves to improve the quality of our raw ingredients, provide increasingly attractive opportunities for our employees, and make investments in equipment, technology and design to enhance our customers’ experience in our restaurants. By doing these things, we believe we will achieve our goal of changing the way Americans think about and eat fast food.
I believe the best is yet to come. Our enhanced restaurant culture will allow us to tap into the entrepreneurial spirit and talents of our employees, and we will have only the highest performing managers running Chipotle restaurants.
Sincerely,
Steve EllsFounder, Chairman & CEO


UNITED STATESSECURITIES AND EXCHANGE COMMISSION
WASHINGTON, D.C. 20549
FORM 10-KÈ ANNUAL REPORT PURSUANT TO SECTION 13 OR 15(d) OF THE SECURITIES
EXCHANGE ACT OF 1934For the fiscal year ended December 31, 2006
or‘ TRANSITION REPORT PURSUANT TO SECTION 13 OR 15(d) OF THE SECURITIES
EXCHANGE ACT OF 1934For the transition period from to
Commission File Number: 1-32731
CHIPOTLE MEXICAN GRILL, INC.(Exact name of registrant as specified in its charter)
Delaware 84-1219301(State or other jurisdiction
of incorporation or organization)(IRS Employer
Identification No.)
1543 Wazee Street, Suite 200 Denver, CO 80202(Address of Principal Executive Offices) (Zip Code)
Registrant’s telephone number, including area code: (303) 595-4000Securities registered pursuant to Section 12(b) of the Act:
Title of each class Name of each exchange on which registered
Class A common stock, par value $0.01 per share New York Stock ExchangeClass B common stock, par value $0.01 per share New York Stock Exchange
Securities Registered pursuant to Section 12(g) of the Act: None
Indicate by check mark whether the registrant is a well-known seasoned issuer, as defined in Rule 405 of the SecuritiesAct. Yes ‘ No È
Indicate by check mark if the registrant is not required to file reports pursuant to Section 13 or Section 15(d) of theAct. Yes ‘ No È
Indicate by check mark whether the registrant: (1) has filed all reports required to be filed by Section 13 of 15(d) of the SecuritiesExchange Act of 1934 during the preceding 12 months (or for such shorter period that the registrant was required to file such reports), and(2) has been subject to such filing requirements for the past 90 days. Yes È No ‘
Indicate by check mark if disclosure of delinquent filers pursuant to Item 405 of Regulation S-K is not contained herein, and will notbe contained, to the best of registrant’s knowledge, in definitive proxy or information statements incorporated by reference in Part III ofthis Form 10-K or any amendment to this Form 10-K. È
Indicate by check mark whether the registrant is a large accelerated filer, an accelerated filer or a non-accelerated filer (as defined inRule 12b-2 of the Act).
‘ Large accelerated filer ‘ Accelerated filer È Non-accelerated filer
Indicate by check mark whether the registrant is a shell company (as defined in Rule 12b-2 of the Act). Yes ‘ No È
As of June 30, 2006, the aggregate market value of the registrant’s outstanding common equity held by nonaffiliates was $770.8million, based on the closing price of the registrant’s class A common stock on that date. For purposes of this calculation, shares of class Acommon stock held by each executive officer and director and by holders of more than 5% of the class A common stock have beenexcluded since those persons may under certain circumstances be deemed to be affiliates. This determination of affiliate status is notnecessarily a conclusive determination for other purposes. This calculation also excludes all shares of the registrant’s class B commonstock because the class B common stock was not publicly traded as of June 30, 2006.
As of February 16, 2007 there were 14,221,675 shares of the registrant’s class A common stock, par value of $0.01 per share, and18,424,690 shares of the registrant’s class B common stock, par value of $0.01 per share, outstanding.
DOCUMENTS INCORPORATED BY REFERENCEPart III incorporates certain information by reference from the registrant’s definitive proxy statement for the 2007 annual meeting of
shareholders, which will be filed no later than 120 days after the close of the registrant’s fiscal year ended December 31, 2006.

TABLE OF CONTENTS
PART I
Item 1. Business . . . . . . . . . . . . . . . . . . . . . . . . . . . . . . . . . . . . . . . . . . . . . . . . . . . . . . . . . . . . . . . . . . . . . . 1Item 1A. Risk Factors . . . . . . . . . . . . . . . . . . . . . . . . . . . . . . . . . . . . . . . . . . . . . . . . . . . . . . . . . . . . . . . . . . . . 6Item 1B. Unresolved Staff Comments . . . . . . . . . . . . . . . . . . . . . . . . . . . . . . . . . . . . . . . . . . . . . . . . . . . . . . . 15Item 2. Properties . . . . . . . . . . . . . . . . . . . . . . . . . . . . . . . . . . . . . . . . . . . . . . . . . . . . . . . . . . . . . . . . . . . . . 16Item 3. Legal Proceedings . . . . . . . . . . . . . . . . . . . . . . . . . . . . . . . . . . . . . . . . . . . . . . . . . . . . . . . . . . . . . . . 16Item 4. Submission of Matters to a Vote of Security Holders . . . . . . . . . . . . . . . . . . . . . . . . . . . . . . . . . . . 17
PART II
Item 5. Market for Registrant’s Common Equity, Related Stockholder Matters and Issuer Purchases ofEquity Securities . . . . . . . . . . . . . . . . . . . . . . . . . . . . . . . . . . . . . . . . . . . . . . . . . . . . . . . . . . . . . . 18
Item 6. Selected Consolidated Financial Data . . . . . . . . . . . . . . . . . . . . . . . . . . . . . . . . . . . . . . . . . . . . . . . 20Item 7. Management’s Discussion and Analysis of Financial Condition and Results of Operations . . . . . . 22Item 7A. Quantitative and Qualitative Disclosures About Market Risk . . . . . . . . . . . . . . . . . . . . . . . . . . . . . 32Item 8. Financial Statements and Supplementary Data . . . . . . . . . . . . . . . . . . . . . . . . . . . . . . . . . . . . . . . . . 34Item 9. Changes in and Disagreements With Accountants on Accounting and Financial Disclosure . . . . . 56Item 9A. Controls and Procedures . . . . . . . . . . . . . . . . . . . . . . . . . . . . . . . . . . . . . . . . . . . . . . . . . . . . . . . . . . 56Item 9B. Other Information . . . . . . . . . . . . . . . . . . . . . . . . . . . . . . . . . . . . . . . . . . . . . . . . . . . . . . . . . . . . . . . 56
PART III
Item 10. Directors, Executive Officers and Corporate Governance . . . . . . . . . . . . . . . . . . . . . . . . . . . . . . . . 57Item 11. Executive Compensation . . . . . . . . . . . . . . . . . . . . . . . . . . . . . . . . . . . . . . . . . . . . . . . . . . . . . . . . . . 57Item 12. Security Ownership of Certain Beneficial Owners and Management and Related Stockholder
Matters . . . . . . . . . . . . . . . . . . . . . . . . . . . . . . . . . . . . . . . . . . . . . . . . . . . . . . . . . . . . . . . . . . . . . 57Item 13. Certain Relationships and Related Transactions and Director Independence . . . . . . . . . . . . . . . . . 57Item 14. Principal Accountant Fees and Services . . . . . . . . . . . . . . . . . . . . . . . . . . . . . . . . . . . . . . . . . . . . . . 57
PART IV
Item 15. Exhibits and Financial Statement Schedules . . . . . . . . . . . . . . . . . . . . . . . . . . . . . . . . . . . . . . . . . . 57Signatures . . . . . . . . . . . . . . . . . . . . . . . . . . . . . . . . . . . . . . . . . . . . . . . . . . . . . . . . . . . . . . . . . . . . . . . . . . . . . . 58

PART I
ITEM 1. BUSINESS
General
Chipotle Mexican Grill, Inc. (“Chipotle” or the “Company”) operates more than 570 restaurants in 26 statesand the District of Columbia, with an additional eight franchise restaurants as of December 31, 2006. Ourrestaurants serve a simple menu of tacos, burritos, salads and burrito bowls (a burrito without the tortilla), madeusing fresh ingredients. People outside our company tend to categorize us as a “fast casual” concept—restaurantsthat are a step up from traditional fast food, but not casual, sit-down places. We’ve never worried much aboutwhat category we’re in. Instead, we remain focused on trying to find the best ingredients we can get to make thebest tasting food we can; on recruiting and retaining really great people to ensure that the restaurant experiencewe provide is unique and genuine; and on building restaurants that are complementary to the food we serve,while also operationally efficient and with increasing awareness and respect for the environment.
Chipotle began with a simple philosophy: Demonstrate that food served fast doesn’t have to be a traditional“fast-food” experience. Over the years, that vision has evolved. Today, we’re working to change the way peoplethink about and eat fast food. We do this by looking to fine-dining restaurants for inspiration. We use high-quality raw ingredients, classic cooking methods and a distinctive interior design, and have friendly people totake care of each customer—features that are more frequently found in the world of fine dining. We also arepursuing our vision of “Food With Integrity”—which to us means finding the best raw ingredients from the bestsources, including naturally raised meats, where the animals are fed a vegetarian diet and not given antibiotics orhormones.
We manage our restaurants based on three regions that all report into a single segment. Financialinformation about our operations, including our revenues and net income for the years ended December 31, 2006,2005, and 2004 and our total assets as of December 31, 2006 and 2005, is included in our consolidated financialstatements and accompanying notes in Item 8, “Financial Statements and Supplementary Data”.
Our predecessor corporation, World Foods, Inc., was founded in Colorado in 1993. McDonald’sCorporation made an equity investment in us in February 1998, becoming our majority shareholder, andsimultaneous with McDonald’s initial investment in us, World Foods, Inc. merged with Chipotle Mexican Grill,Inc., a newly-formed Delaware corporation. We completed our initial public offering of class A common stock inJanuary 2006. McDonald’s sold a portion of its interest in us in the initial public offering, sold an additionalportion of its interest in us in a secondary offering of class A common stock in May 2006, and disposed of itsremaining interest in us in an exchange offer to its shareholders that was completed in October 2006. As a resultof the completion of the McDonald’s exchange offer, we now have two publicly-traded classes of common stock,class A and class B, and McDonald’s no longer owns any interest in us.
Our Menu and Food Preparation
A Few Things, Thousands of Ways. We serve only a few things: burritos, burrito bowls, tacos and salads.But because customers can choose from four different meats, two types of beans and a variety of extras such assalsas, guacamole, cheese and lettuce, there’s enough variety to extend our menu to provide more than 65,000choices. We plan to keep a simple menu, but we’ll consider additions that we think make sense. For example, in2005 we rolled out a salad that uses the same ingredients as our burritos and tacos, with the addition ofchipotle-honey vinaigrette that we make in the restaurant daily. And if you can’t find something on the menuthat’s quite what you’re after, let us know. If we can make it from the ingredients we have, we’ll do it.
In preparing our food, we use gas stoves and grills, pots and pans, cutting knives, wire whisks and otherkitchen utensils, walk-in refrigerators stocked with a variety of fresh ingredients, herbs and spices and dry goodssuch as rice. Ingredients we use include marinated chicken, carnitas (seasoned and braised pork), barbacoa (spicyshredded beef), marinated steak and pinto and vegetarian black beans. We add our rice, which is tossed with real
1
lime juice and freshly chopped cilantro, as well as freshly shredded cheese, sour cream, lettuce, tomatoes,peppers and onions, depending on each customer’s request. We use various herbs, spices and seasonings toprepare our meats and vegetables. We also provide a variety of extras such as guacamole and salsas. To roundout our main menu items, we also serve tortilla chips seasoned with fresh lime and kosher salt. In addition tosodas and fruit drinks, most of our restaurants also offer a selection of beer and margaritas. And a majority of ourfood is prepared from scratch in our restaurants, not simply reheated and slapped together to order.
Food Served Fast…So That Customers Can Enjoy It Slowly. Our employees spend hours preparing our foodon-site, but each customer order can be ready in seconds. Customers select exactly what they want and how theywant it by speaking directly to the employees assembling the food our employees have prepared. While we thinkthat our customers return because of the great-tasting food, we also think that they like getting food served fastwithout having a “fast-food” experience, even when they’re not in a hurry. And while our restaurants often havelines, we try to serve customers as quickly as possible; we’ve even been able to serve more than 300 customersan hour at some locations. The natural flow of our restaurant layout, including the floor plan and the design ofour serving line, are designed to make the food ordering process intuitive and, we believe, more efficient. Andwe’re focused on further improving the speed of service in all of our restaurants, so that we can accommodatemore customers and larger orders without disrupting restaurant traffic. For instance, our restaurants accept ordersby fax or over the internet in order to allow customers in a hurry to avoid standing in line to wait for their food.By emphasizing speed of service without compromising the genuine interactions between our customers and ourcrews, and by continually making improvements to our restaurants to keep pace at even our highest-volumerestaurants, we believe that we can provide the Chipotle experience to more and more customers.
“Food With Integrity.” More than anything, food is what motivates us. And we’re always looking to makethe food we serve better. As part of our vision for “Food With Integrity,” we believe that using fresh ingredientsis not enough, so we spend time on farms and in the field to understand where our ingredients come from andhow the animals are raised. Because our menu is so focused, we can concentrate on where we obtain eachingredient, and this has become a cornerstone of our continuous effort to improve our food. All of our pork, forexample, is naturally raised, coming from animals that are fed a pure vegetarian diet, never given antibiotics orhormones, and raised in open pastures or deeply bedded barns. We also serve naturally raised chicken in about55% of our restaurants and naturally raised beef in about 44% of our restaurants. We’re also enthusiasticallyinvestigating the use of more sustainably grown produce, meaning produce grown by suppliers who we believerespect the environment and their employees, while still charging reasonable prices for our food. Today, about25% of all of the beans we buy are organically grown- that is, they meet U.S. Food and Drug Administrationstandards for “organic.” At each restaurant, we mix those organically grown beans with other ingredients that arenot organic. And now, all of the sour cream we buy is made from milk that comes from cows that are not givenrBGH, or recombinant bovine growth hormone, to stimulate milk production. We even work with experts in theareas of animal ethics to try to support more humane farming practices, and we visit the farms and ranches thatraise the animals and grow the produce that we use.
We do, however, face challenges in pursuing this approach, including the length of time it takes to identifyand secure relationships with suppliers, and the costs and risks associated with purchasing naturally raised orsustainably grown ingredients. Naturally raised meat and sustainably grown vegetables are more costly and thegrowth process is longer. Herd losses can also be greater when animals aren’t treated with antibiotics andhormones. Given the costs associated with natural and sustainable farming practices, many large suppliers havenot found it economical to pursue business in this area. We believe that consumers’ increasing concern aboutwhere and how food is raised, and in the environmental management, animal husbandry and labor practices offood suppliers, will foster demand for these foods. We believe that increased demand for naturally raised meatand produce will in turn attract the interest and capital investment of larger farms and suppliers. That said, weunderstand that we’ll continue to be at the forefront of this trend and must balance our interest in advancing“Food With Integrity” with our desire to provide great food at reasonable prices. If our focus resonates withconsumers, it should improve our sourcing flexibility, although we would expect that these ingredients and otherraw materials will remain more expensive than commodity-priced equivalents for some time to come.
2
Quality Assurance and Food Safety. Chipotle is committed to serving safe, high quality food to ourcustomers. Quality and food safety is integrated throughout our supply chain and everything we do; from thefarms that supply our food all the way through to our front line. We have established close relationships withsome of the top suppliers in the industry, and we actively maintain a limited list of approved suppliers fromwhom our distributors must purchase. Our quality assurance department establishes and monitors our quality andfood safety programs, including farm, supplier and distributor audits. Our training department develops andimplements operating standards for food quality, preparation and safety in the restaurants. Our food safetyprograms are also designed to ensure that we comply with applicable state and local food safety regulations.
Restaurant Management And Operations
People With Passion. We value the individuality of our company, our employees and our customers, whichwe believe results in a management, operations and training philosophy distinct from that of our competitors. Wemake an effort to hire employees who share a passion for food, and who will operate our restaurants in a way thatis consistent with our high standards but that allows each of their unique personalities and strengths to contributeto our success. We also produce training materials that are thought provoking and which engage our employees,rather than providing rigid, step-by-step scripts or lengthy policy manuals. Through our culture, diversity andlanguage programs that we provide in all of our markets, we teach English to Spanish-speaking workers andSpanish to English-speakers, which helps staff to better serve customers and makes for tighter crews. Thisprogram helps encourage our staff members to develop skills that will enhance their work experience and enrichtheir personal lives.
Importance of Methods and Culture. Although we have many restaurants, we believe that our departurefrom the automated cooking techniques used by many traditional fast-food and fast-casual restaurants helps to setus apart. Our crews use classic cooking methods: they marinate and grill meats, hand-chop produce and herbs,make fresh salsa and guacamole, and steam rice in small batches throughout the day. They work in kitchens thatbetter resemble those of high-end restaurants than they do a typical fast-food place. Despite our morelabor-intensive method of food preparation, we believe that we produce great-tasting food with an efficiency thatenables us to compete effectively.
The Front Line is Key. Our restaurant and kitchen designs intentionally place crew members up front withcustomers to reinforce our focus on service. All of our restaurant employees are encouraged to have genuineinteractions with customers no matter their specific job, whether preparing food or serving customers during ourbusiest period. We focus on attracting and keeping people who can deliver that experience for each customer“one burrito at a time.” We provide each customer with individual attention and make every effort to respond tocustomer suggestions and concerns in a personal and hospitable way. We believe our focus on creating a positiveand interactive experience helps build loyalty and enthusiasm for our brand among restaurant managers, crewmembers and customers alike.
The Basics. Each restaurant typically has a restaurant manager (a position we’ve characterized as the mostimportant in the company), an assistant manager, one or two hourly line managers, one or two hourly kitchenmanagers and an average of approximately 22 to 24 full and part-time crew members. We generally have twoshifts at our restaurants, which simplifies scheduling and provides stability for our employees. We tend to havemore employees in our busier restaurants. We cross-train our people, so that each can work a variety of stations,allowing us to work efficiently during our busiest times, while giving our people greater variety and theopportunity to develop a wider variety of skills. Consistent with our emphasis on customer contact, we encourageour restaurant managers and crew members to welcome and interact with customers throughout the day. Andalthough they may increase our labor costs, we believe that the benefits we provide to our employees, whichinclude language training and our company car program for longer-term restaurant managers, help us to attractand keep good restaurant managers and crew members.
In addition to the employees serving our customers at each restaurant, we also have area managers(responsible on average for about seven restaurants each) and operations directors (responsible on average for
3

about 60 restaurants each). Our three regional directors (who report to our President and Chief Operating Officer)each supervise between two to five operations directors.
Provisions and Supplies
Close Relationships With Vendors. Maintaining the high quality levels we expect in our restaurants dependsin part on our ability to acquire fresh ingredients and other necessary supplies that meet our specifications fromreliable suppliers. We use various suppliers, carefully selected based on quality and their understanding of ourbrand, and we seek to develop mutually beneficial long-term relationships with them. We work closely with oursuppliers and use a mix of forward, fixed and formula pricing protocols, although we do not have long-termsupply contracts or guaranteed purchase amounts. We’ve tried to increase, where necessary, the number ofsuppliers for our ingredients, which we believe can help mitigate pricing volatility, and we follow industry news,trade issues, weather, crises and other world events that may affect supply prices.
We do not purchase raw materials directly from farmers or other suppliers. Instead, we train distributioncenters to purchase ingredients and other supplies for us based upon our specifications and to negotiate the termsof purchase with raw materials suppliers on our behalf.
Distribution Arrangements. We deliver ingredients and other supplies to our restaurants from 16independently owned and operated regional distribution centers. As we continue to expand geographically, wewill add additional regional distribution centers.
Marketing
We believe the best and most recognizable brands aren’t built through advertising or promotional campaignsalone, but rather through deeply held beliefs that are clear in how the company is run. All of the ways that weproject ourselves—beginning with each customer’s experience in our restaurants, the look and feel of ourrestaurants, our advertising and promotional programs, and the design items that carry our name or logo—influence how people think about us. By adhering to this principle, we believe that Chipotle is well on its way tobecoming a highly recognized brand.
When we open a new restaurant, we plan a range of activities to introduce Chipotle to the local communityto help create interest in the restaurant from the start. Our advertising primarily includes print, outdoor, transitand radio ads, and most recently a student ad contest where students from more than 70 colleges and universitiesproduced Chipotle “TV” ads that appeared on the popular YouTube website. In addition, we continue to generateconsiderable media coverage, with scores of publications writing favorably about our food, restaurant conceptand business, and our food and restaurants have been featured in a number of television news programs.
Although our marketing program has many components, we believe the single greatest contributor to oursuccess has been word-of-mouth, with our customers learning about us and telling others. Some of our customershave gone so far as to develop websites about Chipotle, providing a way for Chipotle customers to share theirstories. This kind of support helps promote our business without requiring additional advertising expenditures.
Competition
The fast-casual segment of the restaurant industry is highly competitive and fragmented. In addition, fast-casual restaurants compete against other segments of the restaurant industry, including quick-service restaurantsand casual dining restaurants. The number, size and strength of competitors vary by region. All of theserestaurants compete based on a number of factors, including taste, speed of service, value, name recognition,restaurant location and customer service. Competition within the fast-casual restaurant segment, however,focuses primarily on taste, quality and the freshness of the menu items and the ambience and condition of eachrestaurant.
4

We compete with national and regional fast-casual, quick-service and casual dining restaurants. Ourcompetition also includes a variety of locally owned restaurants and the deli sections and in-restaurant cafés ofseveral major grocery store chains. Many of our competitors have greater financial and other resources, havebeen in business longer, and have greater name recognition than we have, and are better established than we arein the markets where our restaurants are located or are planned to be located.
We believe we’re well-positioned to continue to grow our market position in existing and new marketsgiven current favorable consumer trends, including the increasing impact of Hispanic culture on food and flavors,the growth of the Mexican food segment and increasing awareness and concern among consumers about whatthey eat and how it is prepared. Some of our competitors have formats similar to ours. We believe, however, thatChipotle is rapidly becoming one of the most recognized fast-casual restaurants and is known for its focus onusing a variety of fresh ingredients and commitment to “Food With Integrity,” which we think represents asignificant competitive advantage in the segment in which we operate.
Seasonality
Seasonal factors cause our profitability to fluctuate from quarter to quarter. Historically, our average dailyrestaurant sales are lower in the first and fourth quarters due, in part, to the holiday season and because fewerpeople eat out during periods of inclement weather (the winter months) than during periods of mild or warmweather (the spring, summer and fall months). Other factors also have a seasonal effect on our results. Forexample, restaurants located near colleges and universities generally do more business during the academic year.
Our Intellectual Property and Trademarks
“Chipotle,” “Chipotle Mexican Grill,” “Chipotle Mexican Grill (in stylized font),” “Unburritable,” “FoodWith Integrity,” “Fresh Is Not Enough, Anymore,” “The Gourmet Restaurant Where You Eat With Your Hands,”the Chili Pepper Logo design, the Foil Burrito design and the Chipotle Medallion design are U.S. registeredtrademarks of Chipotle. We have filed trademark applications for a number of other marks in the U.S. In additionto our U.S. registrations, we own the trademarks for “Chipotle Mexican Grill” in Australia, Brazil and Mexicoand for “Chipotle” in Australia and the European Union, among other countries. We have filed trademarkapplications for “Chipotle”, the Chili Pepper Logo design and the Foil Burrito design in Canada and have appliedto register some of our marks in a number of additional countries.
We also believe that the design of our restaurants is our proprietary trade dress. From time to time we havetaken action against other restaurants that we believe are misappropriating our trademarks, restaurant designs oradvertising. Although our policy is to protect and defend vigorously our rights to our intellectual property, wemay not be able to adequately protect our intellectual property, which could harm the value of our brands andadversely affect our business.
Information Systems
Chipotle uses an integrated information system to manage the flow of information within each restaurantand between the restaurants and the corporate office. This system includes a point-of-sales local area networkthat helps facilitate the operations of the restaurant by recording sales transactions and printing orders in theappropriate locations within the restaurant. Additionally, the point-of-sales system is used to authorize, batch andtransmit credit card transactions, to record employee time clock information, and to produce a variety ofmanagement reports. Select information that is captured from this system is transmitted to the corporate office ona daily basis, which enables management to continually monitor operating results. We believe that our currentpoint-of-sales systems will be an adequate platform to support our continued expansion.
Employees
As of December 31, 2006, we had about 15,000 employees, including 1,500 salaried employees and13,500 hourly employees. None of our employees are unionized or covered by a collective bargaining agreement.
5

Available Information
We maintain a website at www.chipotle.com. The information on or available through our website is not,and should not be considered, a part of this report. You may access our annual reports on Form 10-K, quarterlyreports on Form 10-Q, current reports on Form 8-K and amendments to those reports, as well as other reportsrelating to us that are filed with or furnished to the SEC free of charge at our website as soon as reasonablypracticable after such material is electronically filed with, or furnished to, the SEC.
ITEM 1A. RISK FACTORS
Cautionary Note Regarding Forward-Looking Statements
This report includes statements of our expectations, intentions plans and beliefs that constitute “forward-looking statements” within the meaning of Section 27A of the Securities Act of 1933 and Section 21E of theSecurities Exchange Act of 1934 and are intended to come within the safe harbor protection provided by thosesections. These statements, which involve risks and uncertainties, relate to the discussion of our businessstrategies and our expectations concerning future operations, margins, profitability, liquidity and capitalresources and to analyses and other information that are based on forecasts of future results and estimates ofamounts not yet determinable. Forward-looking statements include our estimates of the amount of certainexpected expenses for 2007, as well as the number of restaurants that we expect to open in 2007 and potentialchanges in our comparable restaurant sales during 2007. We have used words such as “may,” “will,” “should,”“expects,” “intends,” “plans,” “anticipates,” “believes,” “thinks,” “estimates,” “seeks,” “expects,” “predicts,”“could,” “projects,” “potential” and other similar terms and phrases, including references to assumptions, in thisreport to identify forward-looking statements. These forward-looking statements are made based on expectationsand beliefs concerning future events affecting us and are subject to uncertainties, risks and factors relating to ouroperations and business environments, all of which are difficult to predict and many of which are beyond ourcontrol, that could cause our actual results to differ materially from those matters expressed or implied by theseforward-looking statements. These risks and other factors include those listed in this Item 1A. “Risk Factors,”and elsewhere in this report.
When considering these forward-looking statements, you should keep in mind the cautionary statements inthis report and the documents incorporated by reference. New risks and uncertainties arise from time to time, andwe cannot predict those events or how they may affect us. We assume no obligation to update any forward-looking statements after the date of this report as a result of new information, future events or developments,except as required by the federal securities laws.
Increasing our sales and profitability depends substantially on our ability to open new restaurants and issubject to many unpredictable factors.
There were 581 Chipotle restaurants as of December 31, 2006. We plan to open a significant number of newrestaurants over the next three years. We may not be able to open new restaurants as quickly as planned. We haveexperienced delays in opening some restaurants and that could happen again. Delays or failures in opening newrestaurants could materially and adversely affect our growth strategy and our expected results. As we operatemore restaurants, our rate of expansion relative to the size of our restaurant base will decline. In addition, one ofour biggest challenges is locating and securing an adequate supply of suitable new restaurant sites. Competitionfor those sites in our target markets is intense, and lease costs are increasing (particularly for urban locations).Our ability to open new restaurants also depends on other factors, including:
• obtaining and negotiating leases with acceptable terms;
• hiring and training qualified operating personnel in the local market;
• managing construction and development costs of new restaurants at affordable levels, particularly incompetitive markets;
6

• the availability of construction materials and labor;
• the availability of, and our ability to obtain, adequate supplies of ingredients that meet our qualitystandards;
• securing required governmental approvals (including construction, parking and other permits) in atimely manner; and
• the impact of inclement weather, natural disasters and other calamities, such as hurricanes Katrina andRita in 2005.
Although we plan to open a total of between 95 and 105 restaurants in 2007, we may not be able to do so forthe reasons described in this risk factor. In addition, our progress in opening new restaurants from quarter toquarter may occur at an uneven rate, which may result in quarterly sales and profit growth falling short of marketexpectations in some periods. In addition, this growth strategy and the substantial investment associated with thedevelopment of each new restaurant (as well as the impact of our new restaurants on the sales of our existingrestaurants) may cause our operating results to fluctuate and be unpredictable or adversely affect our profits.
Our sales and profit growth could be adversely affected if comparable restaurant sales are less than weexpect.
While future sales growth will depend substantially on our plans for new restaurant openings, the level ofcomparable restaurant sales (which include company-owned restaurants only and represent the change in period-over-period sales for restaurants beginning in their 13th full month of operations) will also affect our salesgrowth and will continue to be a critical factor affecting profit growth. This is because the profit margin oncomparable restaurant sales is generally higher than the profit margin on new restaurant sales, as comparablerestaurant sales increases enable fixed costs to be spread over a higher sales base. While we do not expectcomparable restaurant sales growth to continue at historical levels and expect comparable restaurant salesincreases in 2007 in the low to mid single digits due to difficult comparisons, our plans do incorporate increasesin comparable restaurant sales. Our ability to increase comparable restaurant sales depends in part on our abilityto successfully implement our initiatives to increase the speed at which our crew serves each customer, andexpanded use of fax service lines and online ordering, either of which may not happen. Adverse weatherconditions, impact from competition (including competition from new restaurants we open), and customerresistance to price increases could also adversely impact our comparable restaurant sales. It is possible that wewill not achieve our targeted comparable restaurant sales growth or that the change in comparable restaurantsales could be negative. If this were to happen, sales and profit growth would be adversely affected.
Our failure to manage our growth effectively could harm our business and operating results.
Our plans call for a significant number of new restaurants. Our existing restaurant management systems,financial and management controls and information systems may be inadequate to support our expansion.Managing our growth effectively will require us to continue to enhance these systems, procedures and controlsand to hire, train and retain restaurant managers and crew. We may not respond quickly enough to the changingdemands that our expansion will impose on management, crew and existing infrastructure. We also place a lot ofimportance on our culture, which we believe has been an important contributor to our success. As we grow,however, we may have difficulty maintaining our culture or adapting it sufficiently to meet the needs of ouroperations. Our failure to manage our growth effectively could harm our business and operating results.
New restaurants, once opened, may not be profitable, and the increases in average restaurant sales andcomparable restaurant sales that we have experienced in the past may not be indicative of future results.
Historically, many of our new restaurants have opened with an initial ramp-up period typically lasting24 months or more, during which they generated sales and income below the levels at which we expect them tonormalize. This is in part due to the time it takes to build a customer base in a new market, higher fixed costsrelating to increased construction and occupancy costs and other start-up inefficiencies that are typical of newrestaurants. New restaurants may neither be profitable nor have similar results as our existing restaurants. Inaddition, our average restaurant sales and comparable restaurant sales likely will not continue to increase at the
7

rates achieved over the past several years. Our ability to operate new restaurants profitably and increase averagerestaurant sales and comparable restaurant sales will depend on many factors, some of which are beyond ourcontrol, including:
• executing our vision effectively;
• initial sales performance of new restaurants;
• competition, either from our competitors in the restaurant industry or our own restaurants;
• changes in consumer preferences and discretionary spending;
• consumer understanding and acceptance of the Chipotle experience;
• road construction and other factors limiting access to new restaurants;
• general economic conditions, which can affect restaurant traffic, local labor costs and prices we pay forthe ingredients and other supplies it uses; and
• changes in government regulation.
If we fail to open restaurants as quickly as planned or if new restaurants do not perform as planned, ourbusiness and future prospects could be harmed. In addition, changes in our average restaurant sales orcomparable restaurant sales could cause our operating results to vary adversely from expectations, which couldcause the price of our common stock to fluctuate substantially.
Our expansion into new markets may present increased risks due to our unfamiliarity with those areas.
Some of our new restaurants are planned for markets where we have little or no operating experience. Thosemarkets may have different competitive conditions, consumer tastes and discretionary spending patterns than ourexisting markets. As a result, those new restaurants may be less successful than restaurants in our existingmarkets. Consumers in a new market may not be familiar with the Chipotle brand, and we may need to buildbrand awareness in that market through greater investments in advertising and promotional activity than weoriginally planned. We may find it more difficult in new markets to hire, motivate and keep qualified employeeswho can project our vision, passion and culture. Restaurants opened in new markets may also have lower averagerestaurant sales than restaurants opened in existing markets, and may have higher construction, occupancy oroperating costs than restaurants in existing markets. We may also have difficulty finding reliable suppliers ordistributors or ones that can provide us, either initially or over time, with adequate supplies of ingredientsmeeting our quality standards. Sales at restaurants opened in new markets may take longer to ramp up and reachexpected sales and profit levels, and may never do so, thereby affecting our overall profitability.
Changes in food and supply costs could adversely affect our results of operations.
Our profitability depends in part on our ability to anticipate and react to changes in food and supply costs.Any increase in the prices of the ingredients most critical to our menu, such as beef, chicken, cheese, avocados,beans, tomatoes and pork, could adversely affect our operating results. Although we have risk managementstrategies in place to mitigate the impact that these fluctuations have on our operating results, we, as all restaurantcompanies, remain susceptible to increases in food costs as a result of factors beyond our control, such as generaleconomic conditions, seasonal fluctuations, weather conditions, demand, food safety concerns, generalizedinfectious diseases, product recalls and government regulations. We are still assessing the impact of the recentwinter freeze in California and the southwestern U.S., but expect that we will see some resulting pressure on ourfood costs. Additionally, due to increased demand for ethanol the cost of corn has increased substantially, whichmay lead to inflationary pressures on corn-sourced ingredients including chicken and beef and could adverselyaffect our food costs.
8

Additional instances of e. coli, avian flu, “mad cow” disease or other food-borne illnesses could adverselyaffect the price and availability of the meat or produce we use to prepare our food, cause the temporaryclosure of some restaurants and result in negative publicity, thereby resulting in a decline in our sales.
In 2006, outbreaks of e. coli relating to certain food items caused consumers to avoid certain products andrestaurant chains. Asian and European countries have also experienced outbreaks of avian flu, and incidents of“mad cow” disease have occurred in Canadian and U.S. cattle herds. These problems, other food-borne illnesses(such as hepatitis A, trichinosis or salmonella) and injuries caused by food tampering have in the past, and couldin the future, adversely affect the price and availability of affected ingredients and cause customers to shift theirpreferences, particularly if we choose to pass any higher ingredient costs along to consumers. As a result, oursales may decline.
Instances of food-borne illnesses, real or perceived, whether at our restaurants or those of our competitors,could also result in negative publicity about us or the restaurant industry, which could adversely affect sales. Ifwe react to negative publicity by changing our menu or other key aspects of the Chipotle experience, we maylose customers who do not accept those changes, and may not be able to attract enough new customers toproduce the revenue needed to make our restaurants profitable. In addition, we may have different or additionalcompetitors for our intended customers as a result of making these changes and may not be able to competesuccessfully against those competitors. If our customers become ill from food-borne illnesses, we could be forcedto temporarily close some restaurants. A decrease in customer traffic as a result of these health concerns ornegative publicity, or as a result of a change in our menu or dining experience or a temporary closure of any ofour restaurants, could materially harm our business.
We may face difficulties transitioning services McDonald’s provided to us and entering into new ormodified arrangements with existing or new suppliers or service providers.
We historically benefited from our relationship with McDonald’s. For example, McDonald’s provided us,directly or through McDonald’s own vendor relationships, with accounting services, insurance policy coverage,banking services, health and other insurance benefits for our employees, and employee benefit plans, as well aswith its expertise in certain areas of our operations such as real estate. We also benefited from our relationshipwith McDonald’s when we bought supplies or distribution or other services. For example, McDonald’srelationship with Coca-Cola helped us obtain beneficial beverage pricing, and we have relied on some of thesame third-party distribution networks as McDonald’s.
As a result of our separation from McDonald’s effective October 12, 2006, we are now responsible forsecuring all of our own management, financial, tax, accounting, legal and other resources. In light of ourseparation from McDonald’s and the resulting termination of services and benefits we received from them, wehave implemented or obtained accounting functions, information technology systems, employee benefits plans,insurance policies and administrative services to replace services or benefits previously provided by McDonald’s.We have limited experience providing or administering these services on our own and we may encounterdifficulties with some or all of these arrangements. We estimate the incremental costs of employee benefits,insurance, information technology services and beverages due to our separation from McDonald’s to be between$1.0 million and $2.0 million in 2007. However, we cannot quantify with certainty the total impact the separationwill have on our expenses. In addition, as a result of our separation from McDonald’s we may not receive thevolume pricing benefits or favorable service levels we received from suppliers, vendors and distribution centersas a McDonald’s affiliate. We may also need to replace additional suppliers, vendors and distribution centers as aresult of our separation from McDonald’s, which could adversely affect our business.
Our insurance coverage and self-insurance reserves may not cover future claims.
We maintain various insurance policies for employee health, workers’ compensation, general liability andproperty damage. In conjunction with our separation from McDonald’s, we entered into certain new insurance
9

policies with modified coverage. Prior to entering into the new policies, we were covered by fixed cost policiesfor health insurance and workman’s compensation. We are now self-insured for our health plans, and havepurchased a fully-insured stop loss policy to help offset our liability for both individual and aggregate claimcosts. We are also responsible for losses up to a certain limit for workers’ compensation, general liability andproperty damage insurance.
For policies under which we are responsible for losses, we record a liability that represents our estimatedcost of claims incurred and unpaid as of the balance sheet date. Our estimated liability is not discounted and isbased on a number of assumptions and factors, including historical trends, actuarial assumptions and economicconditions, and is closely monitored and adjusted when warranted by changing circumstances. Our history ofclaims experience is short and our significant growth rate could affect the accuracy of estimates based onhistorical experience. Should a greater amount of claims occur compared to what was estimated or medical costsincrease beyond what was expected, our accrued liabilities might not be sufficient and we may be required torecord additional expense. Unanticipated changes may produce materially different amounts of expense than thatreported under these programs, which could adversely impact our results of operations.
We may not persuade customers of the benefits of paying our prices for higher-quality food.
Our success depends in large part on our ability to persuade customers that food made with higher-qualityingredients is worth the prices they will pay at our restaurants relative to prices offered by some of ourcompetitors, particularly those in the quick-service segment. We may not successfully educate customers aboutthe quality of our food, and customers may not care even if they do understand our approach. That could requireus to change our pricing, advertising or promotional strategies, which could materially and adversely affect ourresults or the brand identity that we have tried to create.
Changes in customer tastes and preferences, spending patterns and demographic trends could cause salesto decline.
Changes in customer preferences, general economic conditions, discretionary spending priorities,demographic trends, traffic patterns and the type, number and location of competing restaurants affect therestaurant industry. Our success depends to a significant extent on consumer confidence, which is influenced bygeneral economic conditions and discretionary income levels. Our sales may decline during economic downturns,which can be caused by various economic factors such as high gasoline prices, or during periods of uncertainty,such as those that followed the terrorist attacks on the United States in 2001. Any material decline in consumerconfidence or a decline in family “food away from home” spending could cause our sales, operating results,profits, business or financial condition to decline. If we fail to adapt to changes in customer preferences andtrends, we may lose customers and our sales may deteriorate.
Competition from other restaurant companies could adversely affect us.
The fast-casual, quick-service and casual dining segments of the restaurant industry are highly competitivewith respect to, among other things, taste, price, food quality and presentation, service, location and the ambienceand condition of each restaurant. Our competition includes a variety of restaurants in each of these segments,including locally owned restaurants and national and regional chains. Our competitors offer dine-in, carry-outand delivery services. Many of our competitors have existed longer and often have a more established marketpresence with substantially greater financial, marketing, personnel and other resources than we have. Among ourmain competitors are a number of multi-unit, multi-market Mexican food or burrito restaurant concepts, some ofwhich are expanding nationally. As we expand further in existing markets, our existing restaurants may facecompetition from our new restaurants that begin operating in those markets.
Several of our competitors compete by offering menu items that are specifically identified as low incarbohydrates, better for customers or otherwise targeted at particular consumer preferences. Many of our
10

competitors in the fast-casual and quick-service segments of the restaurant industry also emphasize lower-cost,“value meal” menu options, a strategy we do not pursue. Our sales may be adversely affected by these productsand price competition.
Moreover, new companies may enter our markets and target our customers. For example, additionalcompetitive pressures have come more recently from the deli sections and in-store cafés of several major grocerystore chains, including those targeted at customers who want higher-quality food, as well as from conveniencestores and casual dining outlets. These competitors may have, among other things, lower operating costs, betterlocations, better facilities, better management, more effective marketing and more efficient operations than wehave.
All of these competitive factors may adversely affect us and reduce our sales and profits.
We may have experienced a security breach with respect to certain customer credit and debit card data,and we have incurred and may continue to incur substantial costs as a result of this matter. We may also incurcosts resulting from other security risks we may face in connection with our electronic processing andtransmission of confidential customer information.
In August 2004, the merchant bank that processes our credit and debit card transactions, which we refer toas the acquiring bank, informed us that we may have been the victim of a possible theft of credit and debit carddata. Together with two forensic auditing firms, we investigated the alleged theft and reviewed our informationsystems and information security procedures. We also reported the problem to federal law enforcementauthorities and cooperated in their investigation. While to date we have not discovered conclusive evidence that atheft occurred, we identified some restaurant practices that may have made information systems at our restaurantsvulnerable during periods before August 2004. Notably, without our knowledge, the card processing software weused inadvertently retained credit and debit card “Track 2” data, consisting of, among other items, the customer’sname, card number, card expiration date and card verification number. In addition, the internet gateways on ourcomputers in some restaurants may not have been fully secure at all times. As a result, outside parties may havegained access to stored information. It is possible that all of the cards we processed since we began acceptingthem in 1999 may have been vulnerable. In the three months prior to being notified of the problem, we processedbetween 1.3 million and 1.5 million credit and debit card charges each month.
We may in the future become subject to additional claims for purportedly fraudulent transactions arising outof this matter. As long as a credit or debit card is active, fraudulent charges may be made using that card until thecard’s expiration date. We may also be subject to lawsuits or other proceedings by various interested parties,including banks and credit unions that issue cards, cardholders (either individually or as part of a class actionlawsuit) and federal and state regulators. The statutes of limitation for pursuing some of these potential claimsmay extend for six years or more in some cases, depending on the circumstances. Moreover, the application ofthe law and the rules and procedures of the major card associations in these circumstances is generally untested.Any lawsuit or other proceeding will likely be complex, costly and protracted, which could in turn divertfinancial and management resources from execution of our business plan. We have no way to predict the level ofclaims or the number or nature of proceedings that may be asserted against us, nor can we quantify the costs thatwe may incur in connection with investigating, responding to and defending any of them. If we litigate thesematters, we may not be able to defend against penalties successfully. The ultimate outcome of this matter coulddiffer materially from the amounts we have recorded in our reserve and could have a material adverse effect onour financial results and condition. Consumer perception of our brand could also be negatively affected by theseevents, which could further adversely affect our results and prospects.
Despite the changes we have made to our information systems as a result of this matter, we still need toperiodically upgrade our software. We rely on commercially available software and other technologies to providesecurity for processing and transmission of customer credit card data. During 2006 and 2005, approximately halfof our sales were attributable to credit card transactions, and we expect credit card usage to increase. Our systems
11
could be compromised in the future, which could result in the misappropriation of customer information or thedisruption of our systems. Either of those consequences could have a material adverse effect on our reputationand business or subject us to additional liabilities.
Failure to receive frequent deliveries of higher-quality food ingredients and other supplies could harmour operations.
Our ability to maintain our menu depends in part on our ability to acquire ingredients that meet ourspecifications from reliable suppliers. Shortages or interruptions in the supply of ingredients caused byunanticipated demand, problems in production or distribution, food contamination, inclement weather or otherconditions could adversely affect the availability, quality and cost of our ingredients, which could harm ouroperations. If any of our distributors or suppliers performs inadequately, or our distribution or supplyrelationships are disrupted for any reason, our business, financial condition, results of operations or cash flowscould be adversely affected. We currently depend on multiple suppliers for our pork, chicken and beef supplies.It could be more difficult to replace our pork suppliers if we were no longer able to rely on them due to theunique nature of the products we receive from them. We do not have long-term contracts with any of oursuppliers. In addition, we have relied on the same distribution network as McDonald’s. We may have to seek newsuppliers and service providers with pricing or other terms less favorable than those we currently enjoy. If wecannot replace or engage distributors or suppliers who meet our specifications in a short period of time, thatcould increase our expenses and cause shortages of food and other items at our restaurants, which could cause arestaurant to remove items from its menu. If that were to happen, affected restaurants could experiencesignificant reductions in sales during the shortage or thereafter, if our customers change their dining habits as aresult. Our focus on a limited menu would make the consequences of a shortage of a key ingredient more severe.
In addition, our approach to competing in the restaurant industry depends in large part on our continuedability to adhere to the principle of “Food With Integrity.” We use a substantial amount of naturally raised andsustainably grown ingredients, and try to make our food as fresh as we can, in light of pricing considerations. Aswe increase our use of these ingredients, the ability of our suppliers to expand output or otherwise increase theirsupplies to meet our needs may be constrained. Our inability to obtain a sufficient and consistent supply of theseingredients on a cost-effective basis, or at all, could cause us difficulties in aligning our brand with the principleof “Food With Integrity.” That could make us less popular among our customers and cause sales to decline.
Our business could be adversely affected by increased labor costs or difficulties in finding the rightemployees for our restaurants.
Labor is a primary component of our operating costs, and we believe good managers and crew are a key partof our success. We devote significant resources to recruiting and training our restaurant managers and crew.Increased labor costs due to factors like competition, increased minimum wage requirements, employee benefitsand changes due to our new restaurant staffing structure would adversely impact our operating costs. Our successalso depends in part on the energy and skills of our employees and our ability to hire, motivate and keep qualifiedemployees, including especially restaurant managers and crew members. Our failure to find and keep enoughemployees who are a good fit with our culture could delay planned restaurant openings, result in higher employeeturnover or require us to change our culture, any of which could have a material adverse effect on our businessand results of operations. Restaurant operators have traditionally experienced relatively high employee turnoverrates. Any increase in our turnover rates for managers or crew could be costly.
Governmental regulation may adversely affect our ability to open new restaurants or otherwise adverselyaffect our existing and future operations and results.
We are subject to various federal, state and local regulations. Each of our restaurants is subject to state andlocal licensing and regulation by health, alcoholic beverage, sanitation, food and workplace safety and otheragencies. We may experience material difficulties or failures in obtaining the necessary licenses or approvals for
12

new restaurants, which could delay planned restaurant openings. In addition, stringent and varied requirements oflocal regulators with respect to zoning, land use and environmental factors could delay or prevent developmentof new restaurants in particular locations.
We are subject to the U.S. Americans with Disabilities Act and similar state laws that give civil rightsprotections to individuals with disabilities in the context of employment, public accommodations and other areas.We may in the future have to modify restaurants, for example by adding access ramps or redesigning certainarchitectural fixtures, to provide service to or make reasonable accommodations for disabled persons. Theexpenses associated with these modifications could be material.
Our operations are also subject to the U.S. Fair Labor Standards Act, which governs such matters asminimum wages, overtime and other working conditions, along with the U.S. Americans with Disabilities Act,family leave mandates and a variety of similar laws enacted by the states that govern these and other employmentlaw matters. Several states in which we operate have recently enacted minimum wage increases, and theseincreases, as well as proposed federal minimum wage increases, could increase our labor costs.
In recent years, there has been an increased legislative, regulatory and consumer focus at the federal, stateand municipal levels on the food industry including nutrition and advertising practices. Restaurants operating inthe quick-service and fast-casual segments have been a particular focus. For example, the New York City Boardof Health has adopted a regulation requiring that restaurants that make calorie information publicly availablemust include that information on their menus and menu boards. We may in the future become subject to otherinitiatives in the area of nutrition disclosure or advertising, such as requirements to provide information about thenutritional content of our food, which could increase our expenses.
We are subject to federal, state and local environmental laws and regulations concerning the discharge, storage,handling, release and disposal of hazardous or toxic substances, as well as local ordinances restricting the types ofpackaging we can use in our restaurants. Many environmental laws applicable to us provide for significant fines,penalties and liabilities, sometimes without regard to whether we knew of, or were responsible for, the release orpresence of hazardous or toxic substances. Third parties may also make claims against owners or operators ofproperties for personal injuries and property damage associated with releases of, or actual or alleged exposure to,such substances. We cannot predict what environmental laws will be enacted in the future, how existing or futureenvironmental laws will be administered or interpreted, or the amount of future expenditures that we may need tomake to comply with, or to satisfy claims relating to, environmental laws. We have not conducted a comprehensiveenvironmental review of our properties or operations. We have, however, conducted investigations of some of ourproperties and identified contamination caused by third-party operations. We believe any such contamination hasbeen or should be addressed by the third party. If the relevant third party does not address or has not addressed theidentified contamination properly or completely, then under certain environmental laws, we could be held liable asan owner and operator to address any remaining contamination. Any such liability could be material. Further, wemay not have identified all of the potential environmental liabilities at our properties, and any such liabilities couldhave a material adverse effect on our operations or results of operations.
We may not be able to adequately protect our intellectual property, which could harm the value of ourbrands and adversely affect our business.
Our intellectual property is material to the conduct of our business. Our ability to implement our businessplan successfully depends in part on our ability to further build brand recognition using our trademarks, servicemarks, trade dress and other proprietary intellectual property, including our name and logos and the uniqueambience of our restaurants. If our efforts to protect our intellectual property are inadequate, or if any third partymisappropriates or infringes on our intellectual property, either in print or on the internet, the value of our brandsmay be harmed, which could have a material adverse effect on our business and might prevent our brands fromachieving or maintaining market acceptance. We may also encounter claims from prior users of similarintellectual property in areas where we operate or intend to conduct operations. This could harm our image, brandor competitive position and cause us to incur significant penalties and costs.
13

Our quarterly operating results may fluctuate significantly and could fall below the expectations ofsecurities analysts and investors due to various factors.
Our quarterly operating results may fluctuate significantly because of various factors, including:
• the impact of inclement weather, natural disasters and other calamities, such as the snow storms in2006 and 2007 and hurricanes Katrina and Rita in 2005;
• the timing of new restaurant openings and related revenues and expenses;
• operating costs at newly opened restaurants, which are often materially greater during the first severalmonths of operation;
• labor availability and wages of restaurant management and crew;
• profitability of our restaurants, especially in new markets;
• changes in comparable restaurant sales and customer visits, including as a result of the introduction ofnew menu items;
• variations in general economic conditions, including those relating to changes in gasoline prices;
• negative publicity about the ingredients we use or the occurrence of food-borne illnesses or otherproblems at our restaurants;
• changes in consumer preferences and discretionary spending;
• increases in infrastructure costs; and
• fluctuations in supply prices.
Seasonal factors also cause our operating results to fluctuate from quarter to quarter. Our restaurant sales aretypically lower during the winter months and the holiday season and during periods of inclement weather(because fewer people are eating out) and higher during the spring, summer and fall months (for the oppositereason). Our revenue will also vary as a result of the number of trading days, that is, the number of days in aquarter when a restaurant is open.
As a result of these factors, results for any one quarter are not necessarily indicative of results to be expectedfor any other quarter or for any year. Average restaurant sales or comparable restaurant sales in any particularfuture period may decrease. In the future, operating results may fall below the expectations of securities analystsand investors, which could cause our stock prices to fall. We believe the market prices of our class A and class Bcommon stock reflect high market expectations for our future operating results, and as a result, if we fail to meetmarket expectations for our operating results in the future, any resulting decline in the price of our common stockcould be significant.
Restrictions and indemnities in connection with the tax treatment of McDonald’s exchange offer couldadversely affect us.
We understand that the exchange offer McDonald’s completed in October 2006 to dispose of its interest inus should generally be tax-free to McDonald’s and its shareholders. Current U.S. tax law generally creates apresumption that a tax-free exchange of the type used by McDonald’s would be taxable to McDonald’s, but notto its shareholders, if we or our shareholders were to engage in a transaction that would result in a 50% or greaterchange by vote or by value in our stock ownership during the four-year period beginning two years before thedate of the exchange, unless it is established that the exchange and the transaction are not part of a plan or seriesof related transactions to effect such a change in ownership. As a consequence of the foregoing, in the separationagreement we entered into with McDonald’s in connection with the separation, we have:
• undertaken to maintain our current business as an active business for a period of two years followingthe separation;
14

• undertaken not to take any action affecting the relative voting rights of any separate classes of ourstock on or before the second anniversary of the separation, and for a period thereafter to only takesuch action under certain conditions;
• generally agreed to be restricted, for a period of two years following the separation, from (i) consentingto certain acquisitions of significant amounts of our stock; (ii) transferring significant amounts of ourassets; (iii) merging or consolidating with any other person; (iv) liquidating or partially liquidating;(v) reacquiring our stock; or (vi) taking any other action that would be reasonably likely to jeopardizethe tax-free status of the exchange, except in specified circumstances; and
• agreed to indemnify McDonald’s for taxes and related losses it incurs as a result of the exchangefailing to qualify as a tax-free transaction, if the taxes and related losses are attributable to (i) direct orindirect acquisitions of our stock or assets (regardless of whether we consent to such acquisitions);(ii) negotiations, understandings, agreements or arrangements in respect of such acquisitions; or(iii) our failure to comply with applicable representations and undertakings from us and the restrictionsplaced on our actions under the separation agreement.
The indemnity described above covers corporate level taxes and related losses suffered by McDonald’s in theevent of a 50% or greater change in our stock ownership, as well as taxes and related losses suffered byMcDonald’s if, due to any of our representations or undertakings being incorrect or violated, the exchange isdetermined to be taxable for other reasons. We currently estimate that the indemnification obligation toMcDonald’s for taxes due in the event of a 50% or greater change in our stock ownership could exceed $450million. This estimate, which does not take into account related losses, depends upon several factors that arebeyond our control. As a consequence, the indemnity to McDonald’s could vary substantially from the estimate.Furthermore, the estimate does not address the potential indemnification obligation to McDonald’s in the eventthat, due to any of our representations or undertakings being incorrect or violated, the exchange is determined tobe taxable for other reasons. In that event, the total indemnification would likely be much greater.
Our anti-takeover provisions may delay or prevent a change in control of us, which could adversely affectthe price of our common stock.
Certain provisions in our corporate documents and Delaware law may delay or prevent a change in controlof us, which could adversely affect the price of our class A or class B common stock. Our restated certificate ofincorporation and restated bylaws contain some provisions that may make the acquisition of control of us withoutthe approval of our board of directors more difficult, including provisions relating to the nomination, election andremoval of directors, the structure of the board of directors and limitations on actions by our shareholders. Inaddition, Delaware law also imposes some restrictions on mergers and other business combinations between usand any holder of 15% or more of our outstanding class A or class B common stock. Any of these provisions, aswell as the provisions of our separation agreement with McDonald’s described above under “Restrictions andindemnities in connection with the tax treatment of McDonald’s exchange offer could adversely affect us,” maydiscourage a potential acquirer from proposing or completing a transaction that may have otherwise presented apremium to our shareholders.
ITEM 1B. UNRESOLVED STAFF COMMENTS
None.
15

ITEM 2. PROPERTIES
As of December 31, 2006, we and our franchisees operated 581 restaurants. The table below sets forth thelocations (by state) of Chipotle restaurants in operation.
Arizona . . . . . . . . . . . . . . . . . . . . . . . . . . . . . . . . . . . . . . . . . . . . . . . . . . . . . . . . . . . . . . 24California . . . . . . . . . . . . . . . . . . . . . . . . . . . . . . . . . . . . . . . . . . . . . . . . . . . . . . . . . . . . . 79Colorado . . . . . . . . . . . . . . . . . . . . . . . . . . . . . . . . . . . . . . . . . . . . . . . . . . . . . . . . . . . . . 61District of Columbia . . . . . . . . . . . . . . . . . . . . . . . . . . . . . . . . . . . . . . . . . . . . . . . . . . . . 6Florida . . . . . . . . . . . . . . . . . . . . . . . . . . . . . . . . . . . . . . . . . . . . . . . . . . . . . . . . . . . . . . . 23Georgia . . . . . . . . . . . . . . . . . . . . . . . . . . . . . . . . . . . . . . . . . . . . . . . . . . . . . . . . . . . . . . 11Illinois(1) . . . . . . . . . . . . . . . . . . . . . . . . . . . . . . . . . . . . . . . . . . . . . . . . . . . . . . . . . . . . . . 49Indiana . . . . . . . . . . . . . . . . . . . . . . . . . . . . . . . . . . . . . . . . . . . . . . . . . . . . . . . . . . . . . . . 10Kansas . . . . . . . . . . . . . . . . . . . . . . . . . . . . . . . . . . . . . . . . . . . . . . . . . . . . . . . . . . . . . . . 15Kentucky . . . . . . . . . . . . . . . . . . . . . . . . . . . . . . . . . . . . . . . . . . . . . . . . . . . . . . . . . . . . . 5Maryland . . . . . . . . . . . . . . . . . . . . . . . . . . . . . . . . . . . . . . . . . . . . . . . . . . . . . . . . . . . . . 23Massachusetts . . . . . . . . . . . . . . . . . . . . . . . . . . . . . . . . . . . . . . . . . . . . . . . . . . . . . . . . . 1Michigan . . . . . . . . . . . . . . . . . . . . . . . . . . . . . . . . . . . . . . . . . . . . . . . . . . . . . . . . . . . . . 6Minnesota . . . . . . . . . . . . . . . . . . . . . . . . . . . . . . . . . . . . . . . . . . . . . . . . . . . . . . . . . . . . 39Missouri(1) . . . . . . . . . . . . . . . . . . . . . . . . . . . . . . . . . . . . . . . . . . . . . . . . . . . . . . . . . . . . 11Nebraska . . . . . . . . . . . . . . . . . . . . . . . . . . . . . . . . . . . . . . . . . . . . . . . . . . . . . . . . . . . . . 7Nevada . . . . . . . . . . . . . . . . . . . . . . . . . . . . . . . . . . . . . . . . . . . . . . . . . . . . . . . . . . . . . . . 5New Jersey . . . . . . . . . . . . . . . . . . . . . . . . . . . . . . . . . . . . . . . . . . . . . . . . . . . . . . . . . . . 2New York . . . . . . . . . . . . . . . . . . . . . . . . . . . . . . . . . . . . . . . . . . . . . . . . . . . . . . . . . . . . 17North Carolina . . . . . . . . . . . . . . . . . . . . . . . . . . . . . . . . . . . . . . . . . . . . . . . . . . . . . . . . . 2Ohio(1) . . . . . . . . . . . . . . . . . . . . . . . . . . . . . . . . . . . . . . . . . . . . . . . . . . . . . . . . . . . . . . . 71Oregon . . . . . . . . . . . . . . . . . . . . . . . . . . . . . . . . . . . . . . . . . . . . . . . . . . . . . . . . . . . . . . . 6Pennsylvania . . . . . . . . . . . . . . . . . . . . . . . . . . . . . . . . . . . . . . . . . . . . . . . . . . . . . . . . . . 1Texas . . . . . . . . . . . . . . . . . . . . . . . . . . . . . . . . . . . . . . . . . . . . . . . . . . . . . . . . . . . . . . . . 65Virginia . . . . . . . . . . . . . . . . . . . . . . . . . . . . . . . . . . . . . . . . . . . . . . . . . . . . . . . . . . . . . . 25Washington . . . . . . . . . . . . . . . . . . . . . . . . . . . . . . . . . . . . . . . . . . . . . . . . . . . . . . . . . . . 8Wisconsin . . . . . . . . . . . . . . . . . . . . . . . . . . . . . . . . . . . . . . . . . . . . . . . . . . . . . . . . . . . . 9
Total . . . . . . . . . . . . . . . . . . . . . . . . . . . . . . . . . . . . . . . . . . . . . . . . . . . . . . . . . . . . 581
(1) Includes two franchised restaurants in Illinois, two in Missouri and four in Ohio.
Of our restaurants in operation as of December 31, 2006, we had 134 free-standing units, 335 end-caplocations, 103 in-line locations and nine in malls. The average free-standing restaurant seats about 67 customerswhile the average in-line or end-cap restaurant seats about 63 customers. Our average restaurant size is about2,700 square feet. Most of our restaurants also feature outdoor patio space.
Our main office is located at 1543 Wazee Street, Suite 200, Denver, Colorado, and our telephone number is(303) 595-4000. We lease our main office and substantially all of the properties on which we operate restaurants.For additional information regarding the lease terms and provisions, see Item 7. “Management’s Discussion andAnalysis of Financial Condition and Results of Operations—Contractual Obligations.”
We own nine properties and operate restaurants on all of them.
ITEM 3. LEGAL PROCEEDINGS
We’re involved in various claims and legal actions that arise in the ordinary course of business. We do notbelieve that the ultimate resolution of these actions will have a material adverse effect on our financial position,
16
results of operations, liquidity or capital resources. However, a significant increase in the number of these claimsor an increase in amounts owing under successful claims could materially and adversely affect our business,financial condition, results of operation and cash flows.
In addition, we’re involved in claims relating to the possible theft of our customers’ credit and debit carddata. Through the end of December 2006, we have received claims through the acquiring bank with respect tofewer than 2,000 purportedly fraudulent credit and debit card charges allegedly arising out of this matter in anaggregate amount of about $1.4 million. We’ve also incurred $1.3 million of expense in connection with finesimposed by the Visa and MasterCard card associations on the acquiring bank. In 2004, we recorded charges of$4.0 million to establish a reserve for claims seeking reimbursement for purportedly fraudulent credit and debitcard charges, the cost of replacing cards, monitoring expenses and fees, and fines imposed by Visa andMasterCard. All of the reimbursement claims are being disputed, although we’ve not formally protested all of thecharges. As of December 31, 2006, after charging these expenses against the reserve, the remaining reserve was$1.2 million. In addition to the reserve, we’ve also incurred about $1.5 million of additional expenses in thismatter, including $1.4 million for legal fees, bringing our total expense relating to this matter to $5.5 million. Wehave not reserved any additional amounts to date in 2007.
We may in the future become subject to additional claims for purportedly fraudulent transactions arising outof this matter. We have no way to predict the level of claims or the number or nature of proceedings that may beasserted against us, nor can we quantify the costs that we may incur in connection with investigating, respondingto and defending any of them. If we litigate these matters, we may not be able to defend against penaltiessuccessfully. The ultimate outcome of this matter could differ materially from the amounts we’ve recorded in ourreserve and could have a material adverse effect on our financial results and condition. See Item 1A. “RiskFactors—We may have experienced a security breach with respect to certain customer credit and debit card data,and we’ve incurred and may continue to incur substantial costs as a result of this matter. We may also incur costsresulting from other security risks we may face in connection with our electronic processing and transmission ofconfidential customer information.”
ITEM 4. SUBMISSION OF MATTERS TO A VOTE OF SECURITY HOLDERS
There were no matters submitted to a vote of our security holders through solicitation of proxies orotherwise, during the fourth quarter of our fiscal year ended December 31, 2006.
17

PART II
ITEM 5. MARKET FOR REGISTRANT’S COMMON EQUITY, RELATED STOCKHOLDERMATTERS AND ISSUER PURCHASES OF EQUITY SECURITIES
The following table describes the per share range of high and low sales prices for shares of each class of ourcommon stock for the quarterly periods indicated, as reported by the New York Stock Exchange (“NYSE”). Ourclass A common stock, which trades under the symbol “CMG,” began trading on the NYSE on January 26, 2006,and our class B common stock, which trades under the symbol “CMG.B,” began trading on the NYSE onOctober 5, 2006.
Chipotle Class ACommon Stock
Chipotle Class BCommon Stock
High Low High Low
2006First Quarter . . . . . . . . . . . . . . . . . . . . . . . . . . . . . . . . . . . . . . . . . . . . . . $56.75 $39.99 n/a n/aSecond Quarter . . . . . . . . . . . . . . . . . . . . . . . . . . . . . . . . . . . . . . . . . . . . $67.76 $48.30 n/a n/aThird Quarter . . . . . . . . . . . . . . . . . . . . . . . . . . . . . . . . . . . . . . . . . . . . . . $60.77 $45.86 n/a n/aFourth Quarter . . . . . . . . . . . . . . . . . . . . . . . . . . . . . . . . . . . . . . . . . . . . . $62.36 $48.30 $59.07 $48.50
As of February 5, 2007, there were approximately 319 holders of our class A common stock andapproximately 1,173 holders of our class B common stock, in each case as determined by counting our recordholders and the number of participants reflected in a security position listing provided to us by the DepositoryTrust Company. We estimate that there are approximately 28,000 beneficial owners of our class A common stockand approximately 9,500 beneficial owners of our class B common stock.
Dividend Policy
We are not required to pay any dividends and have not declared or paid any cash dividends on either class ofour common stock. We intend to continue to retain earnings for use in the operation and expansion of ourbusiness and therefore do not anticipate paying any cash dividends on our common stock in the foreseeablefuture.
Securities Authorized for Issuance Under Equity Compensation Plans
The following table presents information regarding options and rights outstanding under our equitycompensation plans as of December 31, 2006. All options reflected are options to purchase class A commonstock.
(a)Number of Securities to
be Issued UponExercise of Outstanding
Options and Rights
(b)Weighted-AverageExercise Price of
Outstanding Options andRights
(c)Number of Securities
Remaining Available forFuture Issuance Under
Equity Compensation Plans(excluding securities
reflected in column (a))
Equity Compensation PlansApproved by Security Holders:
Chipotle 2006 Incentive Plan . . . . . 807,879 $22.05 1,334,589Chipotle Executive Stock Option
Plan . . . . . . . . . . . . . . . . . . . . . . 132,412 $16.45 —Equity Compensation Plans Not
Approved by Security Holders:None.
18

COMPARISON OF CUMULATIVE TOTAL RETURN
The following graph compares the cumulative annual stockholders return on our classes of common stockfrom the dates trading began on the NYSE (January 26, 2006 for class A and October 12, 2006 for class B)through December 31, 2006 to that of the total return index for the Russell 2000 and the S&P SmallCap 600Restaurants Index assuming an investment of $100 on the date each class of stock began trading publicly. Incalculating total annual stockholder return, reinvestment of dividends, if any, is assumed. The indices areincluded for comparative purpose only. They do not necessarily reflect management’s opinion that such indicesare an appropriate measure of the relative performance of the class A or class B common stock. This graph is not“soliciting material,” is not deemed filed with the Securities and Exchange Commission and is not to beincorporated by reference in any of our filings under the Securities Act of 1933, as amended, or the SecuritiesExchange Act of 1934, as amended, whether made before or after the date hereof and irrespective of any generalincorporation language in any such filing.
COMPARISON OF 11 MONTH CUMULATIVE TOTAL RETURN*Among Chipotle Mexican Grill, Inc., The Russell 2000 Index
And The S & P SmallCap 600 Restaurants
$701/06 1/06 2/06 3/06 4/06 5/06 6/06 7/06 8/06 9/06 10/12/06 10/06 11/06 12/06
$80
$90
$100
$110
$120
$130
$140
$150
Chipotle Mexican Grill, Inc Class A Chipotle Mexican Grill, Inc Class B
Russell 2000 S & P SmallCap 600 Restaurants
* $100 invested at the closing price of class A common stock on 1/26/06 and at the closing price of class B common stock on 10/12/06.
Use of Proceeds from Sale of Registered Securities
On January 30, 2006, we completed the initial public offering of our class A common stock, $0.01 parvalue, pursuant to our Registration Statement on Form S-1, as amended (Reg. No. 333-129221) that was declaredeffective on January 25, 2006. We sold 6,060,606 shares in the offering at a price to the public of $22.00. Themanaging underwriters in the offering were Morgan Stanley and SG Cowen & Co.
The net proceeds received by us in the offering were $120.9 million, determined as follows (in millions):
Aggregate offering proceeds to the Company . . . . . . . . . . . . . . . . . . . . . . . . . . . . . . $133.3Underwriting discounts and commissions . . . . . . . . . . . . . . . . . . . . . . . . . . . . . . . . . 9.3Finders fee . . . . . . . . . . . . . . . . . . . . . . . . . . . . . . . . . . . . . . . . . . . . . . . . . . . . . . . . . —Other fees and expenses . . . . . . . . . . . . . . . . . . . . . . . . . . . . . . . . . . . . . . . . . . . . . . . 3.1
Total expenses . . . . . . . . . . . . . . . . . . . . . . . . . . . . . . . . . . . . . . . . . . . . . . . . . . . . . . 12.4
Net proceeds to the Company . . . . . . . . . . . . . . . . . . . . . . . . . . . . . . . . . . . . . . . . . . $120.9
19

None of the underwriting discounts and commissions or offering expenses were paid, directly or indirectly,to our directors or officers or their associates or to persons owning 10 percent or more of our common stock or toany affiliates of ours. We are using, or expect to use, the net proceeds of the offering to provide additional long-term capital to support the growth of our business (primarily through opening new restaurants), for maintenanceof our existing restaurants and for general corporate purposes.
ITEM 6. SELECTED CONSOLIDATED FINANCIAL DATA
Our selected consolidated financial data shown below should be read together with our Item 7.“Management’s Discussion and Analysis of Financial Condition and Results of Operations” and our consolidatedfinancial statements and respective notes included in Item 8. “Financial Statements and Supplementary Data”.The selected consolidated statements of income data for the years ended December 31, 2006, 2005 and 2004 andthe consolidated balance sheet data as of December 31, 2006 and 2005 have been derived from our auditedconsolidated financial statements included in Item 8. “Financial Statements and Supplementary Data”. Ourconsolidated financial statements for the years ended December 31, 2006, 2005 and 2004 have been audited andreported upon by Ernst & Young LLP, an independent registered public accounting firm. The selectedconsolidated statements of income data for the year ended December 31, 2003 and 2002 and the consolidatedbalance sheet data as of December 31, 2004, 2003 and 2002 have been derived from audited financial statementsnot included in this report. The data shown below are not necessarily indicative of results to be expected for anyfuture period (in thousands, except per share data).
For the years ended December 31,
2006 2005 2004 2003 2002
Statements of Income:Revenue
Restaurant sales . . . . . . . . . . . . . . . . . . . . . . . . . . $819,787 $625,077 $468,579 $314,027 $203,892Franchise royalties and fees . . . . . . . . . . . . . . . . . 3,143 2,618 2,142 1,493 753
Total revenue . . . . . . . . . . . . . . . . . . . . . . . . . . . . . . . . 822,930 627,695 470,721 315,520 204,645
Food, beverage and packaging costs . . . . . . . . . . . . . . 257,998 202,288 154,148 104,921 67,681Labor costs . . . . . . . . . . . . . . . . . . . . . . . . . . . . . . . . . . 231,134 178,721 139,494 94,023 66,515Occupancy costs . . . . . . . . . . . . . . . . . . . . . . . . . . . . . . 58,804 47,636 36,190 25,570 18,716Other operating costs . . . . . . . . . . . . . . . . . . . . . . . . . . 102,745 82,976 64,274 43,527 29,791General and administrative expenses . . . . . . . . . . . . . . 65,284 51,964 44,837 34,189 25,803Depreciation and amortization . . . . . . . . . . . . . . . . . . . 34,253 28,026 21,802 15,090 11,260Pre-opening costs . . . . . . . . . . . . . . . . . . . . . . . . . . . . . 6,778 1,971 2,192 1,631 1,022Loss on disposal of assets . . . . . . . . . . . . . . . . . . . . . . . 3,982 3,119 1,678 4,504 1,489
Total costs and expenses . . . . . . . . . . . . . . . . . . . . . . . 760,978 596,701 464,615 323,455 222,277
Income (loss) from operations . . . . . . . . . . . . . . . . . . . 61,952 30,994 6,106 (7,935) (17,632)Interest income . . . . . . . . . . . . . . . . . . . . . . . . . . . . . . . 6,574 36 211 249 444Interest expense . . . . . . . . . . . . . . . . . . . . . . . . . . . . . . (271) (790) (191) (28) (101)
Income (loss) before income taxes . . . . . . . . . . . . . . . . 68,255 30,240 6,126 (7,714) (17,289)(Provision) benefit for income taxes(1) . . . . . . . . . . . . . (26,832) 7,456 — — —
Net income (loss) . . . . . . . . . . . . . . . . . . . . . . . . . . . . . $ 41,423 $ 37,696 $ 6,126 $ (7,714) $ (17,289)
Earnings (loss) per share(2)
Basic . . . . . . . . . . . . . . . . . . . . . . . . . . . . . . . . . . . $ 1.29 $ 1.43 $ 0.24 $ (0.34) $ (0.87)Diluted . . . . . . . . . . . . . . . . . . . . . . . . . . . . . . . . . $ 1.28 $ 1.43 $ 0.24 $ (0.34) $ (0.87)
Shares used in computing earnings (loss) per share(2)
Basic . . . . . . . . . . . . . . . . . . . . . . . . . . . . . . . . . . . 32,051 26,281 25,454 22,384 19,931Diluted . . . . . . . . . . . . . . . . . . . . . . . . . . . . . . . . . 32,465 26,374 25,520 22,384 19,931
20

As of December 31,
2006 2005 2004 2003 2002
Balance Sheet Data:Total current assets . . . . . . . . . . . . . . . . . . . . . . . . . . . . $178,837 $ 17,824 $ 10,332 $ 7,833 $ 20,221Total assets . . . . . . . . . . . . . . . . . . . . . . . . . . . . . . . . . . $604,208 $392,495 $329,653 $249,014 $194,172Total current liabilities . . . . . . . . . . . . . . . . . . . . . . . . . $ 61,201 $ 41,982 $ 38,663 $ 38,266 $ 20,806Total liabilities . . . . . . . . . . . . . . . . . . . . . . . . . . . . . . . $130,251 $ 83,141 $ 67,087 $ 57,506 $ 32,918Total shareholders’ equity . . . . . . . . . . . . . . . . . . . . . . $473,957 $309,354 $262,566 $191,508 $161,254
(1) During the year ended December 31, 2005, we determined that it was more likely than not that we wouldrealize our deferred tax assets and we reversed our valuation allowance of $20.3 million, resulting in anon-recurring tax benefit.
(2) Earnings (loss) per share and shares used in computing earnings (loss) per share reflect the effect of thereclassification of all outstanding shares of preferred stock and common stock into one-third share of class Bcommon stock as discussed more thoroughly in Note 1 to the consolidated financial statements included inItem 8. “Financial Statements and Supplementary Data.”
21

ITEM 7. MANAGEMENT’S DISCUSSION AND ANALYSIS OF FINANCIAL CONDITION ANDRESULTS OF OPERATIONS
You should read the following discussion together with Item 6. “Selected Consolidated Financial Data” andour consolidated financial statements and related notes included in Item 8. “Financial Statements andSupplementary Data”. The discussion contains forward-looking statements involving risks, uncertainties andassumptions that could cause our results to differ materially from expectations. Factors that might cause suchdifferences include those described in Item 1A. “Risk Factors” under the heading—Cautionary Note RegardingForward-Looking Statements, and elsewhere in this report.
Overview
Chipotle operates fast casual, fresh Mexican food restaurants serving burritos, tacos, bowls and salads. Webegan with a simple philosophy: demonstrate that food served fast doesn’t have to be a traditional “fast-food”experience. Over the years, that vision has evolved. Today, we’re working to change the way people think aboutand eat fast food. We do this by avoiding a formulaic approach when creating our restaurant experience, lookingto fine-dining restaurants for inspiration. We use high-quality raw ingredients, classic cooking methods and adistinctive interior design, and have friendly people to take care of each customer—features that are morefrequently found in the world of fine dining. Our approach is also guided by our belief in an idea we call “FoodWith Integrity”—which to us means finding the best raw ingredients from the best sources to include in the foodwe serve. Quite simply, we combine these ideas in a way that continues making Chipotle better all the time.
As of December 31, 2006, we had 581 restaurants in 26 states throughout the United States and in theDistrict of Columbia, including eight restaurants operated by franchisees. New restaurants have contributedsubstantially to our restaurant sales growth in the last three years. We opened 94 company-operated restaurantsduring 2006, including 14 restaurants in six new markets. We expect to open between 95 and 105 restaurants in2007 with approximately 10% to 15% of those openings located in new markets. We define a new market as onein which no restaurant was open as of the end of the prior year.
In addition to growing our number of restaurants, we have experienced increases in our average restaurantsales of 11.9% in 2006 and 5.8% in 2005, driven primarily by strong comparable restaurant sales increases. Wedefine average restaurant sales as the average trailing 12-month sales for company-owned restaurants inoperation for at least 13 months. Comparable restaurant sales include company-owned restaurants only andrepresent the change in period-over-period sales for restaurants beginning in their 13th full month of operation.
We expect our average restaurant sales to continue to increase in 2007, driven by comparable restaurantsales increases in the low to mid single digits. Comparable restaurant sales reflect positive period-to-periodgrowth due to an increase in the number of transactions as well as menu price increases. However, as a result ofseveral years of double-digit comparable restaurant sales increases, we believe that comparable restaurant saleswill not continue to increase at the rates we have achieved over the past several years.
Highlights
Initial Public Offering. On January 25, 2006, we completed our initial public offering of our class Acommon stock with net proceeds of $120.9 million. In conjunction with the offering, we issued a one-time broadbased grant of 774,150 stock options. The options vest on the third anniversary of the grant date. Compensationexpense is generally recognized equally over the three year vesting period.
McDonald’s Disposition. In October 2006, McDonald’s completed its disposition of its interest in us.Historically our relationship with McDonald’s allowed us to obtain pricing benefits for some products andservices. As a result of our separation from McDonald’s, we have implemented new employee benefit plans, aswell as new insurance, accounting, information technology, payroll and internal audit arrangements. We estimatethe incremental costs of these new plans and arrangements, combined with additional supply costs as a result ofour separation from McDonald’s, to be between $1.0 million and $2.0 million in this first year of separation.
22

Promoting from Within. During 2006, we focused on ensuring our employee practices are as exceptional asour food. In an effort to achieve this, we initiated the Restaurateur program which is designed to encourage therestaurant manager position as a career opportunity for our top performing restaurant managers. In addition toexcelling in providing quality food and customer service, restaurant managers are expected to contributesubstantially to the development of their crew. Restaurateurs’ compensation is partially dependent on achievingthese expectations. As a result, we expect this program will help us retain top performing restaurant managers.We currently have exceptional managers in the program, and we expect to promote more managers toRestaurateurs during 2007.
We have seen that restaurant managers who were previously crew members operate better restaurants andare less likely to leave the company. Therefore, in addition to the Restaurateur program, we have created a newrestaurant staffing structure to facilitate the development of crew members into restaurant managers. Oneprimary goal of the new structure is to increase the number of restaurant managers hired from within ourcompany and lower restaurant manager turnover. We implemented the new staffing structure in over 50% of ourrestaurants during 2006 and the remaining restaurants are expected to be converted in 2007.
While we are still early in the programs, we have seen some positive results. Over half of the restaurantmanager positions we filled in 2006 were staffed with internal promotions, up from 31% in 2005. Our turnoveramong restaurant management has decreased approximately 12% in 2006. We have not seen the full impact ofthe initiatives in our financial results in 2006, as implementing the Restaurateur program and the new staffingstructure have resulted in incremental staff training and development costs. In 2007 and future years, we expectthese initiatives to result in a majority of restaurant managers being hired through internal promotions.
Throughput. We deliver our best customer service and hottest food when the line moves efficiently. During2006, we continued to emphasize increasing the number of customers we serve during our busiest hours. Weincreased the number of fax and internet production lines in our restaurants which moved big orders off the frontline, made improvements in the line and equipment configurations, and emphasized optimal utilization of oursecond cash register. We have seen success in this initiative through increased transactions during peak lunch anddinner hours and shorter wait time. We plan to continue this focus into 2007, including installing changemachines in most of our restaurants as well as evaluating other equipment configurations and technologicalprocess improvements.
Food With Integrity. During 2006, in addition to continuing to serve naturally raised pork in all of ourrestaurants, we made progress with our Food With Integrity initiative by increasing the amount of naturallyraised beef and chicken we serve in our restaurants. In addition, now all of the sour cream we buy is made frommilk that comes from cows that are not given growth hormones to stimulate milk production. We also continue toinvestigate the use of more sustainably grown produce and produce that is locally grown.
23

Restaurant Openings, Relocations and Closures
The following table details restaurant unit data for our company-owned and franchised locations for theyears indicated.
For the year ended December 31,
2006 2005 2004
Company-ownedBeginning of year . . . . . . . . . . . . . . . . . . . . . . . . . . . . . . . . . . . . . 481 401 298Openings . . . . . . . . . . . . . . . . . . . . . . . . . . . . . . . . . . . . . . . . . . . . 94 80 104Relocations . . . . . . . . . . . . . . . . . . . . . . . . . . . . . . . . . . . . . . . . . . (1) — —Closures . . . . . . . . . . . . . . . . . . . . . . . . . . . . . . . . . . . . . . . . . . . . . (1) — —Franchise sale . . . . . . . . . . . . . . . . . . . . . . . . . . . . . . . . . . . . . . . . — — (1)
End of year . . . . . . . . . . . . . . . . . . . . . . . . . . . . . . . . . . . . . . . . . . 573 481 401
FranchisesBeginning of year . . . . . . . . . . . . . . . . . . . . . . . . . . . . . . . . . . . . . 8 8 7Franchise purchase . . . . . . . . . . . . . . . . . . . . . . . . . . . . . . . . . . . . — — 1
End of year . . . . . . . . . . . . . . . . . . . . . . . . . . . . . . . . . . . . . . . . . . 8 8 8
Total restaurants at end of year . . . . . . . . . . . . . . . . . . . . . . . . . . . . . 581 489 409
Results of Operations
Our results of operations as a percentage of revenue and period-over-period variances are discussed in thefollowing section. As our business grows, as we open more restaurants and hire more employees, our restaurantoperating costs increase.
Restaurant Sales
For the years endedDecember 31,
%increase
2006 over2005
%increase
2005 over20042006 2005 2004
(dollars in millions)
Restaurant sales . . . . . . . . . . . . . . . . . . . . . . . . . . . . . . . . . $819.8 $625.1 $468.6 31.1% 33.4%Average restaurant sales . . . . . . . . . . . . . . . . . . . . . . . . . . $1.611 $1.440 $1.361Comparable restaurant sales increase . . . . . . . . . . . . . . . . 13.7% 10.2% 13.3%Number of company-operated restaurants as of the end of
the year . . . . . . . . . . . . . . . . . . . . . . . . . . . . . . . . . . . . . . 573 481 401Number of company-operated restaurants opened in the
year, net of closures and relocations . . . . . . . . . . . . . . . 92 80 103
The significant factors contributing to our increase in sales in 2006 were new restaurant openings and strongcomparable restaurant sales performance. Restaurant sales from restaurants not yet in the comparable basecontributed to $110.8 million of the increase in sales in 2006, of which $46.5 million was attributable torestaurants opened during the year. In 2005, restaurant sales from restaurants not yet in the comparable restaurantbase contributed to $109.1 million of the increase in sales, of which $47.3 million was attributable to restaurantsopened in 2005.
Comparable restaurant sales increases contributed to $84.1 million and $47.4 million of the increase in restaurantsales in 2006 and 2005, respectively. Comparable restaurant sales increases were driven primarily by an increasingawareness of our brand and our focus on improving service time. The substantial majority of our comparable restaurantsales growth was due to an increase in the number of transactions, and the remainder was driven primarily by menuprice increases in markets in conjunction with the introduction of naturally-raised beef or chicken.
24
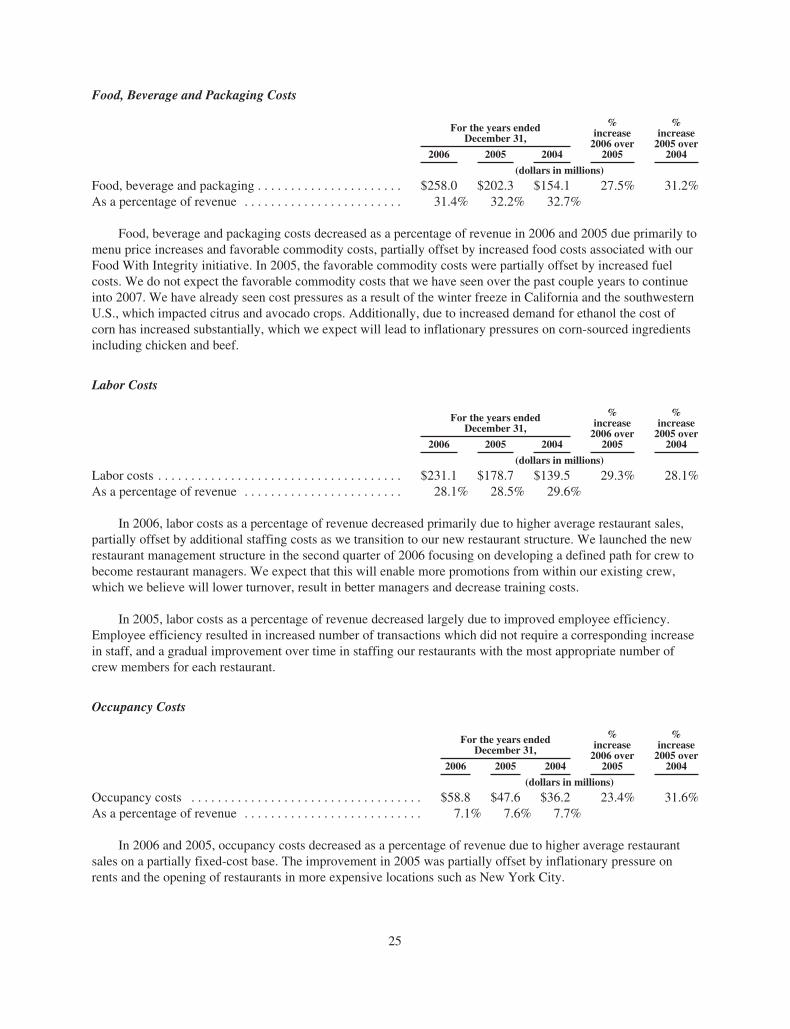
Food, Beverage and Packaging Costs
For the years endedDecember 31,
%increase
2006 over2005
%increase
2005 over20042006 2005 2004
(dollars in millions)
Food, beverage and packaging . . . . . . . . . . . . . . . . . . . . . . $258.0 $202.3 $154.1 27.5% 31.2%As a percentage of revenue . . . . . . . . . . . . . . . . . . . . . . . . 31.4% 32.2% 32.7%
Food, beverage and packaging costs decreased as a percentage of revenue in 2006 and 2005 due primarily tomenu price increases and favorable commodity costs, partially offset by increased food costs associated with ourFood With Integrity initiative. In 2005, the favorable commodity costs were partially offset by increased fuelcosts. We do not expect the favorable commodity costs that we have seen over the past couple years to continueinto 2007. We have already seen cost pressures as a result of the winter freeze in California and the southwesternU.S., which impacted citrus and avocado crops. Additionally, due to increased demand for ethanol the cost ofcorn has increased substantially, which we expect will lead to inflationary pressures on corn-sourced ingredientsincluding chicken and beef.
Labor Costs
For the years endedDecember 31,
%increase
2006 over2005
%increase
2005 over20042006 2005 2004
(dollars in millions)
Labor costs . . . . . . . . . . . . . . . . . . . . . . . . . . . . . . . . . . . . . $231.1 $178.7 $139.5 29.3% 28.1%As a percentage of revenue . . . . . . . . . . . . . . . . . . . . . . . . 28.1% 28.5% 29.6%
In 2006, labor costs as a percentage of revenue decreased primarily due to higher average restaurant sales,partially offset by additional staffing costs as we transition to our new restaurant structure. We launched the newrestaurant management structure in the second quarter of 2006 focusing on developing a defined path for crew tobecome restaurant managers. We expect that this will enable more promotions from within our existing crew,which we believe will lower turnover, result in better managers and decrease training costs.
In 2005, labor costs as a percentage of revenue decreased largely due to improved employee efficiency.Employee efficiency resulted in increased number of transactions which did not require a corresponding increasein staff, and a gradual improvement over time in staffing our restaurants with the most appropriate number ofcrew members for each restaurant.
Occupancy Costs
For the years endedDecember 31,
%increase
2006 over2005
%increase
2005 over20042006 2005 2004
(dollars in millions)
Occupancy costs . . . . . . . . . . . . . . . . . . . . . . . . . . . . . . . . . . . $58.8 $47.6 $36.2 23.4% 31.6%As a percentage of revenue . . . . . . . . . . . . . . . . . . . . . . . . . . . 7.1% 7.6% 7.7%
In 2006 and 2005, occupancy costs decreased as a percentage of revenue due to higher average restaurantsales on a partially fixed-cost base. The improvement in 2005 was partially offset by inflationary pressure onrents and the opening of restaurants in more expensive locations such as New York City.
25

Other Operating Costs
For the years endedDecember 31,
%increase
2006 over2005
%increase
2005 over20042006 2005 2004
(dollars in millions)
Other operating costs . . . . . . . . . . . . . . . . . . . . . . . . . . . . . . . $102.7 $83.0 $64.3 23.8% 29.1%As a percentage of revenue . . . . . . . . . . . . . . . . . . . . . . . . . . 12.5% 13.2% 13.7%
Other operating costs as a percentage of revenue declined primarily due to the effect of higher averagerestaurant sales on a partially fixed-cost base and operating efficiencies that are realized as we both grow in sizeand become more experienced. We also realized a benefit in 2006 related to our promote from within strategywhich reduced the dollars we spent on training external hires.
General and Administrative Expenses
For the years endedDecember 31,
%increase
2006 over2005
%increase
2005 over20042006 2005 2004
(dollars in millions)
General and administrative expense . . . . . . . . . . . . . . . . . . . . $65.3 $52.0 $44.8 25.6% 15.9%As a percentage of revenue . . . . . . . . . . . . . . . . . . . . . . . . . . . 7.9% 8.3% 9.5%
The increase in general and administrative expenses in 2006 primarily resulted from increased employeerelated expenses driven by hiring more employees over the past two years, increase in stock based compensationexpense resulting from the one-time broad based option grant in conjunction with our initial public offering,incremental legal and audit costs due to growth and becoming a public company, costs incurred in conjunctionwith the secondary and exchange offers related to McDonald’s disposition of its interest in us, and increases inseverance expense. The increase in general and administrative expenses in 2005 primarily resulted from hiringmore employees as we grew and an increase in stock based compensation expense resulting from the adoption ofFASB Statement No. 123(R), Stock-based Compensation (“FAS 123R”). The increase in expense in 2005 wasoffset by the $4.0 million charge in 2004 to establish a reserve related to potential credit card liabilities. As apercentage of total revenue, general and administrative expenses decreased in 2006 and 2005 due primarily to theeffect of higher restaurant sales on a partially fixed-cost base.
Depreciation and amortization
For the years endedDecember 31,
%increase
2006 over2005
%increase
2005 over20042006 2005 2004
(dollars in millions)
Depreciation and amortization . . . . . . . . . . . . . . . . . . . . . . . . . $34.3 $28.0 $21.8 22.2% 28.5%As a percentage of revenue . . . . . . . . . . . . . . . . . . . . . . . . . . . 4.2% 4.5% 4.6%
Depreciation and amortization increased in 2006 and 2005 primarily due to the 278 total restaurantsopenings from January 1, 2004 to December 31, 2006. In addition, in 2006 we accelerated depreciation on certainrestaurant and office locations as a result of relocations or closures which have occurred or will occur. As apercentage of total revenue, depreciation and amortization has decreased as a result of higher average restaurantsales on a partially fixed-cost base.
26
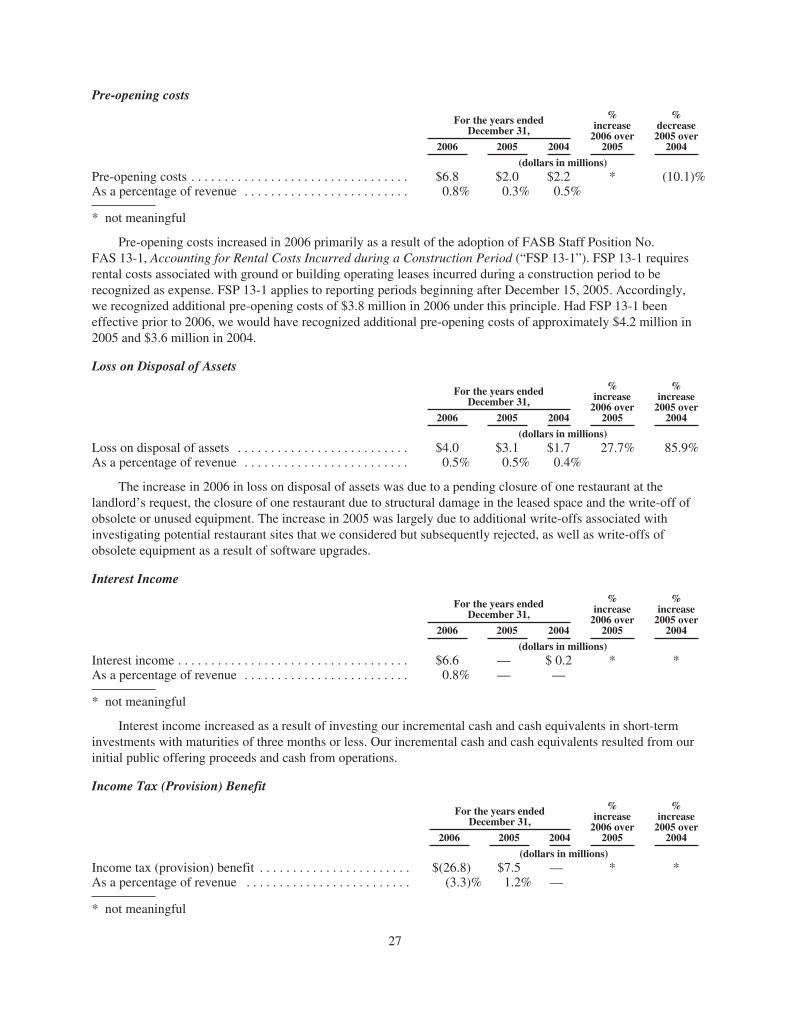
Pre-opening costs
For the years endedDecember 31,
%increase
2006 over2005
%decrease2005 over
20042006 2005 2004
(dollars in millions)Pre-opening costs . . . . . . . . . . . . . . . . . . . . . . . . . . . . . . . . . $6.8 $2.0 $2.2 * (10.1)%As a percentage of revenue . . . . . . . . . . . . . . . . . . . . . . . . . 0.8% 0.3% 0.5%
* not meaningful
Pre-opening costs increased in 2006 primarily as a result of the adoption of FASB Staff Position No.FAS 13-1, Accounting for Rental Costs Incurred during a Construction Period (“FSP 13-1”). FSP 13-1 requiresrental costs associated with ground or building operating leases incurred during a construction period to berecognized as expense. FSP 13-1 applies to reporting periods beginning after December 15, 2005. Accordingly,we recognized additional pre-opening costs of $3.8 million in 2006 under this principle. Had FSP 13-1 beeneffective prior to 2006, we would have recognized additional pre-opening costs of approximately $4.2 million in2005 and $3.6 million in 2004.
Loss on Disposal of Assets
For the years endedDecember 31,
%increase
2006 over2005
%increase
2005 over20042006 2005 2004
(dollars in millions)Loss on disposal of assets . . . . . . . . . . . . . . . . . . . . . . . . . . $4.0 $3.1 $1.7 27.7% 85.9%As a percentage of revenue . . . . . . . . . . . . . . . . . . . . . . . . . 0.5% 0.5% 0.4%
The increase in 2006 in loss on disposal of assets was due to a pending closure of one restaurant at thelandlord’s request, the closure of one restaurant due to structural damage in the leased space and the write-off ofobsolete or unused equipment. The increase in 2005 was largely due to additional write-offs associated withinvestigating potential restaurant sites that we considered but subsequently rejected, as well as write-offs ofobsolete equipment as a result of software upgrades.
Interest Income
For the years endedDecember 31,
%increase
2006 over2005
%increase
2005 over20042006 2005 2004
(dollars in millions)Interest income . . . . . . . . . . . . . . . . . . . . . . . . . . . . . . . . . . . $6.6 — $ 0.2 * *As a percentage of revenue . . . . . . . . . . . . . . . . . . . . . . . . . 0.8% — —
* not meaningful
Interest income increased as a result of investing our incremental cash and cash equivalents in short-terminvestments with maturities of three months or less. Our incremental cash and cash equivalents resulted from ourinitial public offering proceeds and cash from operations.
Income Tax (Provision) Benefit
For the years endedDecember 31,
%increase
2006 over2005
%increase
2005 over20042006 2005 2004
(dollars in millions)Income tax (provision) benefit . . . . . . . . . . . . . . . . . . . . . . . $(26.8) $7.5 — * *As a percentage of revenue . . . . . . . . . . . . . . . . . . . . . . . . . (3.3)% 1.2% —
* not meaningful
27
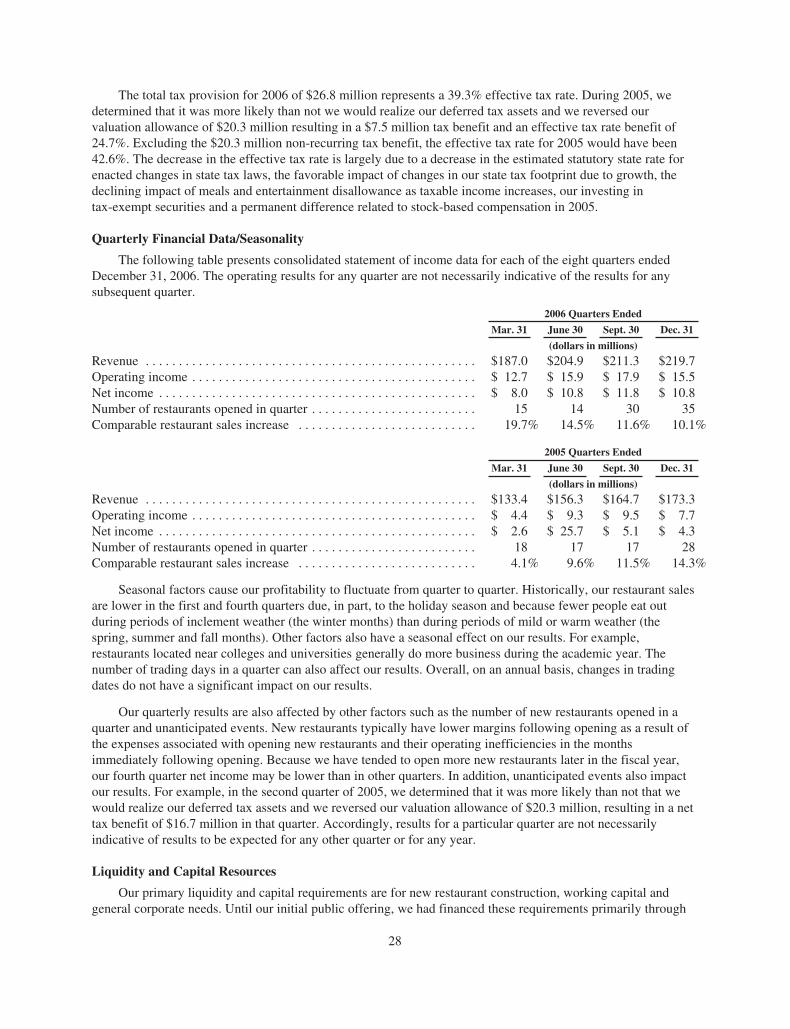
The total tax provision for 2006 of $26.8 million represents a 39.3% effective tax rate. During 2005, wedetermined that it was more likely than not we would realize our deferred tax assets and we reversed ourvaluation allowance of $20.3 million resulting in a $7.5 million tax benefit and an effective tax rate benefit of24.7%. Excluding the $20.3 million non-recurring tax benefit, the effective tax rate for 2005 would have been42.6%. The decrease in the effective tax rate is largely due to a decrease in the estimated statutory state rate forenacted changes in state tax laws, the favorable impact of changes in our state tax footprint due to growth, thedeclining impact of meals and entertainment disallowance as taxable income increases, our investing intax-exempt securities and a permanent difference related to stock-based compensation in 2005.
Quarterly Financial Data/Seasonality
The following table presents consolidated statement of income data for each of the eight quarters endedDecember 31, 2006. The operating results for any quarter are not necessarily indicative of the results for anysubsequent quarter.
2006 Quarters Ended
Mar. 31 June 30 Sept. 30 Dec. 31
(dollars in millions)
Revenue . . . . . . . . . . . . . . . . . . . . . . . . . . . . . . . . . . . . . . . . . . . . . . . . . . $187.0 $204.9 $211.3 $219.7Operating income . . . . . . . . . . . . . . . . . . . . . . . . . . . . . . . . . . . . . . . . . . . $ 12.7 $ 15.9 $ 17.9 $ 15.5Net income . . . . . . . . . . . . . . . . . . . . . . . . . . . . . . . . . . . . . . . . . . . . . . . . $ 8.0 $ 10.8 $ 11.8 $ 10.8Number of restaurants opened in quarter . . . . . . . . . . . . . . . . . . . . . . . . . 15 14 30 35Comparable restaurant sales increase . . . . . . . . . . . . . . . . . . . . . . . . . . . 19.7% 14.5% 11.6% 10.1%
2005 Quarters Ended
Mar. 31 June 30 Sept. 30 Dec. 31
(dollars in millions)
Revenue . . . . . . . . . . . . . . . . . . . . . . . . . . . . . . . . . . . . . . . . . . . . . . . . . . $133.4 $156.3 $164.7 $173.3Operating income . . . . . . . . . . . . . . . . . . . . . . . . . . . . . . . . . . . . . . . . . . . $ 4.4 $ 9.3 $ 9.5 $ 7.7Net income . . . . . . . . . . . . . . . . . . . . . . . . . . . . . . . . . . . . . . . . . . . . . . . . $ 2.6 $ 25.7 $ 5.1 $ 4.3Number of restaurants opened in quarter . . . . . . . . . . . . . . . . . . . . . . . . . 18 17 17 28Comparable restaurant sales increase . . . . . . . . . . . . . . . . . . . . . . . . . . . 4.1% 9.6% 11.5% 14.3%
Seasonal factors cause our profitability to fluctuate from quarter to quarter. Historically, our restaurant salesare lower in the first and fourth quarters due, in part, to the holiday season and because fewer people eat outduring periods of inclement weather (the winter months) than during periods of mild or warm weather (thespring, summer and fall months). Other factors also have a seasonal effect on our results. For example,restaurants located near colleges and universities generally do more business during the academic year. Thenumber of trading days in a quarter can also affect our results. Overall, on an annual basis, changes in tradingdates do not have a significant impact on our results.
Our quarterly results are also affected by other factors such as the number of new restaurants opened in aquarter and unanticipated events. New restaurants typically have lower margins following opening as a result ofthe expenses associated with opening new restaurants and their operating inefficiencies in the monthsimmediately following opening. Because we have tended to open more new restaurants later in the fiscal year,our fourth quarter net income may be lower than in other quarters. In addition, unanticipated events also impactour results. For example, in the second quarter of 2005, we determined that it was more likely than not that wewould realize our deferred tax assets and we reversed our valuation allowance of $20.3 million, resulting in a nettax benefit of $16.7 million in that quarter. Accordingly, results for a particular quarter are not necessarilyindicative of results to be expected for any other quarter or for any year.
Liquidity and Capital Resources
Our primary liquidity and capital requirements are for new restaurant construction, working capital andgeneral corporate needs. Until our initial public offering, we had financed these requirements primarily through
28

equity sales to McDonald’s and others as well as through cash flows from operations. In January 2006 wecompleted our initial public offering of class A common stock, receiving net proceeds of approximately$120.9 million. We expect to use the net proceeds from the offering, together with cash flow from operations, toprovide additional long-term capital to support the growth of our business (primarily through openingrestaurants), to continue to maintain our existing restaurants and for general corporate purposes.
In October 2006, we entered into a revolving line of credit with a principal amount of $10 million whichexpires in August 2007. The line of credit is for support of letters of credit we issue in the normal course ofbusiness and bears interest at our option at the Prime rate, a fixed rate determined by the bank or an adjustedLIBOR rate.
We haven’t required significant working capital because customers pay using cash or credit cards andbecause our operations do not require significant receivables, nor do they require significant inventories due, inpart, to our use of various fresh ingredients. In addition, we generally have the right to pay for the purchase offood, beverage and supplies some time after the receipt of those items, generally within ten days, therebyreducing the need for incremental working capital to support growth.
Operating Activities. Net cash provided by operating activities was $103.6 million for 2006 compared to$77.4 million for 2005. The $26.2 million increase was primarily attributable to a $24.1 million improvement innet income, excluding the $20.3 million one-time non-cash tax benefit from the reversal of the valuationallowance. The increase in net income was driven by higher average restaurant sales, higher restaurant marginsand significantly more restaurants in operation. Net cash provided by operating activities was $77.4 million for2005 compared to $39.7 million for 2004. The $37.8 million increase was primarily attributable to a $31.6million improvement in net income driven by higher average restaurant sales, higher restaurant margins andsignificantly more restaurants in operation.
Investing Activities. Net cash used in investing activities was $97.3 million for 2006 compared to$83.0 million for 2005. The $14.3 million increase related to higher capital expenditures in 2006 as we opened 94restaurants in 2006, compared with 80 restaurants in 2005. Net cash used in investing activities was $83.0 millionfor 2005 compared to $95.6 million in 2004. The $12.6 million decrease related to lower capital expenditures in2005 as we opened 80 restaurants in 2005, compared with 104 restaurants in 2004.
We categorize our restaurants as either end-caps (at the end of a line of restaurants), in-lines (in a line ofrestaurants), free-standing or urban. As we expand into central urban areas, our average costs to open newrestaurants will increase due to more significant reconstruction work that often needs to be done on those sites. Ourtotal capital expenditures for 2006 were $97.3 million, and we expect to incur capital expenditures of about$115 million in 2007, relating primarily to our construction of new restaurants in both periods. In 2006, we spent onaverage about $860,000 in development and construction costs per restaurant, with end-caps costing about$680,000, in-lines costing about $795,000, free-standing costing about $1.3 million and urban costing about$2.2 million (in each case, reduced for landlord reimbursements). The average development and construction costsper restaurant decreased from $910,000 in 2005 due to a decline in the number of free-standing restaurants, addingsmaller stores to the mix and a focus on cost control. In 2007, we expect average development and constructioncosts to be approximately $900,000 per restaurant as a result of developing in higher cost markets such as Bostonand Philadelphia, a slight increase in free-standing restaurants as well as inflation in construction costs.
Financing Activities. Net cash provided by financing activities was $147.3 million in 2006 compared to$5.7 million in 2005. The $141.6 million increase was attributable to $120.9 million net proceeds from our initialpublic offering and the $19.5 million tax sharing payment received from McDonalds. Net cash provided byfinancing activities was $5.7 million in 2005 compared to $55.9 million in 2004. The $50.3 million decrease wasattributable to decreased financing requirements as a result of improvements in net cash provided by operatingactivities and fewer restaurant openings in 2005 as compared to 2004.
29

Liquidity and Capital Expenditures. We expect to use the proceeds from the initial public offering toprovide additional long-term capital to support the growth of our business (primarily through openingrestaurants) and to continue to maintain our existing restaurants and for general corporate purposes. Inaccordance with a tax allocation agreement we have with McDonald’s, McDonald’s agreed to compensate us forNOLs and tax credits it used that were attributable to our operations. We expect to receive payment for thefederal and some state NOLs that we have not utilized on a stand-alone basis as we make estimated taxpayments, but no later than the first quarter of 2008. As of December 31, 2006, the amount owed by McDonald’stotaled $8.8 million.
We believe that cash from operations, together with the net proceeds from the initial public offering will beenough to meet ongoing capital expenditures, working capital requirements and other cash needs over at least thenext 24 months.
Contractual Obligations
Our contractual obligations as of December 31, 2006 were as follows:
Payments Due by Period
Total 1 year 2-3 years 4-5 yearsAfter
5 years
(in thousands)
Operating leases . . . . . . . . . . . . . . . . . . . . . . . . . . . . . $1,086,224 $61,641 $124,490 $123,616 $776,477Deemed landlord financing . . . . . . . . . . . . . . . . . . . . . 7,756 371 742 775 5,868Other contractual obligations(1) . . . . . . . . . . . . . . . . . . 13,361 13,266 95 — —
Total contractual cash obligations . . . . . . . . . . . . . . . . $1,107,341 $75,278 $125,327 $124,391 $782,345
(1) We enter into various purchase obligations in the ordinary course of business. Those that are bindingprimarily relate to amounts owed under contractor and subcontractor agreements and orders submitted forequipment for restaurants under construction.
We’re obligated under non-cancelable leases for our restaurants and administrative offices. Our leasesgenerally have initial terms of either five to ten years with two or more five-year extensions, for end-cap andin-line restaurants, or 15 to 20 years with several five-year extensions, for free-standing restaurants. Our leasesgenerally require us to pay a proportionate share of real estate taxes, insurance, common charges and otheroperating costs. Some restaurant leases provide for contingent rental payments based on sales thresholds,although we generally do not expect to pay significant contingent rent on these properties based on the thresholdsin those leases.
Off-Balance Sheet Arrangements
As of December 31, 2006 and 2005, we had no off-balance sheet arrangements or obligations.
Inflation
The primary areas of our operations affected by inflation are food, fuel, labor, insurance, and utility costsand materials used in the construction of our restaurants. Although almost all of our crew members make morethan the minimum wage, increases in the applicable federal or state minimum wage will have an impact on ourlabor costs. Additionally, many of our leases require us to pay taxes, maintenance, utilities and insurance, all ofwhich are generally subject to inflationary increases.
Critical Accounting Estimates
We describe our significant accounting policies in Note 1 of our consolidated financial statements. Criticalaccounting estimates are those that we believe are both significant and that require us to make difficult,
30
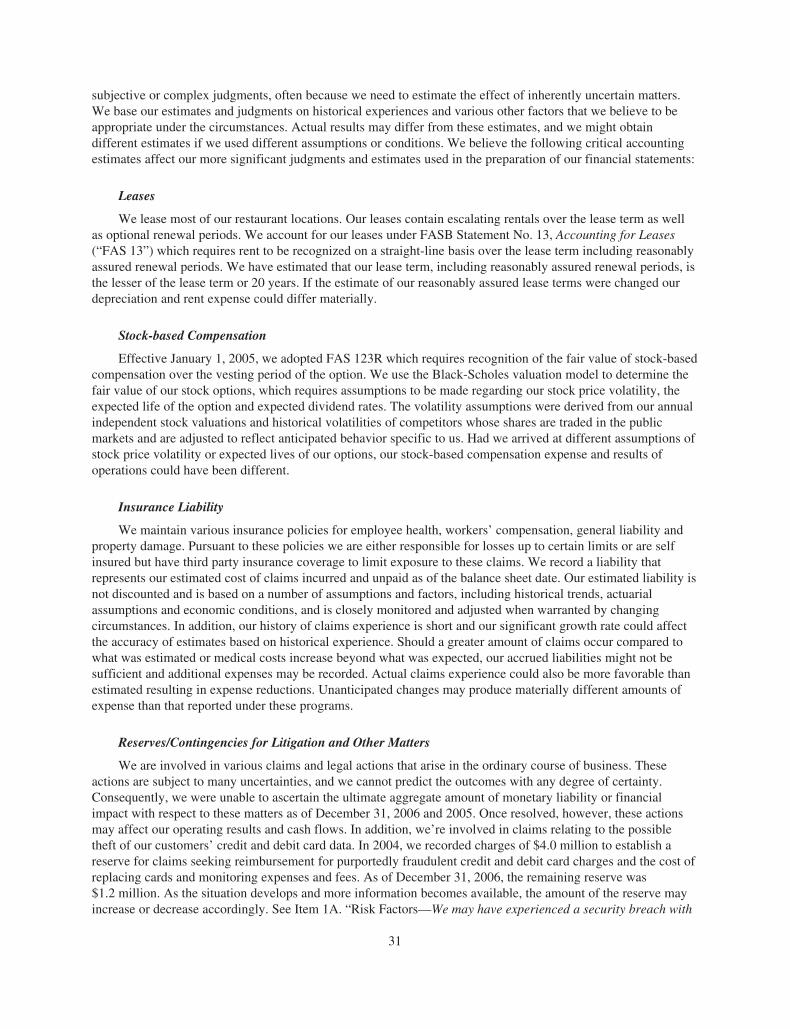
subjective or complex judgments, often because we need to estimate the effect of inherently uncertain matters.We base our estimates and judgments on historical experiences and various other factors that we believe to beappropriate under the circumstances. Actual results may differ from these estimates, and we might obtaindifferent estimates if we used different assumptions or conditions. We believe the following critical accountingestimates affect our more significant judgments and estimates used in the preparation of our financial statements:
Leases
We lease most of our restaurant locations. Our leases contain escalating rentals over the lease term as wellas optional renewal periods. We account for our leases under FASB Statement No. 13, Accounting for Leases(“FAS 13”) which requires rent to be recognized on a straight-line basis over the lease term including reasonablyassured renewal periods. We have estimated that our lease term, including reasonably assured renewal periods, isthe lesser of the lease term or 20 years. If the estimate of our reasonably assured lease terms were changed ourdepreciation and rent expense could differ materially.
Stock-based Compensation
Effective January 1, 2005, we adopted FAS 123R which requires recognition of the fair value of stock-basedcompensation over the vesting period of the option. We use the Black-Scholes valuation model to determine thefair value of our stock options, which requires assumptions to be made regarding our stock price volatility, theexpected life of the option and expected dividend rates. The volatility assumptions were derived from our annualindependent stock valuations and historical volatilities of competitors whose shares are traded in the publicmarkets and are adjusted to reflect anticipated behavior specific to us. Had we arrived at different assumptions ofstock price volatility or expected lives of our options, our stock-based compensation expense and results ofoperations could have been different.
Insurance Liability
We maintain various insurance policies for employee health, workers’ compensation, general liability andproperty damage. Pursuant to these policies we are either responsible for losses up to certain limits or are selfinsured but have third party insurance coverage to limit exposure to these claims. We record a liability thatrepresents our estimated cost of claims incurred and unpaid as of the balance sheet date. Our estimated liability isnot discounted and is based on a number of assumptions and factors, including historical trends, actuarialassumptions and economic conditions, and is closely monitored and adjusted when warranted by changingcircumstances. In addition, our history of claims experience is short and our significant growth rate could affectthe accuracy of estimates based on historical experience. Should a greater amount of claims occur compared towhat was estimated or medical costs increase beyond what was expected, our accrued liabilities might not besufficient and additional expenses may be recorded. Actual claims experience could also be more favorable thanestimated resulting in expense reductions. Unanticipated changes may produce materially different amounts ofexpense than that reported under these programs.
Reserves/Contingencies for Litigation and Other Matters
We are involved in various claims and legal actions that arise in the ordinary course of business. Theseactions are subject to many uncertainties, and we cannot predict the outcomes with any degree of certainty.Consequently, we were unable to ascertain the ultimate aggregate amount of monetary liability or financialimpact with respect to these matters as of December 31, 2006 and 2005. Once resolved, however, these actionsmay affect our operating results and cash flows. In addition, we’re involved in claims relating to the possibletheft of our customers’ credit and debit card data. In 2004, we recorded charges of $4.0 million to establish areserve for claims seeking reimbursement for purportedly fraudulent credit and debit card charges and the cost ofreplacing cards and monitoring expenses and fees. As of December 31, 2006, the remaining reserve was$1.2 million. As the situation develops and more information becomes available, the amount of the reserve mayincrease or decrease accordingly. See Item 1A. “Risk Factors—We may have experienced a security breach with
31
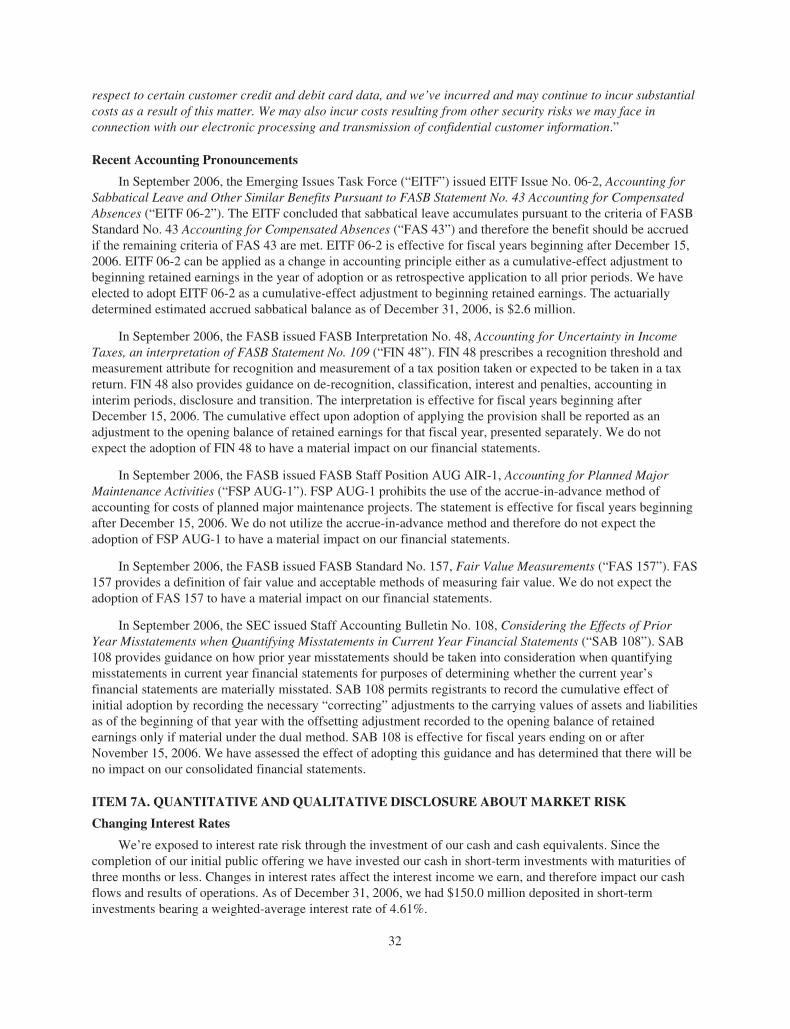
respect to certain customer credit and debit card data, and we’ve incurred and may continue to incur substantialcosts as a result of this matter. We may also incur costs resulting from other security risks we may face inconnection with our electronic processing and transmission of confidential customer information.”
Recent Accounting Pronouncements
In September 2006, the Emerging Issues Task Force (“EITF”) issued EITF Issue No. 06-2, Accounting forSabbatical Leave and Other Similar Benefits Pursuant to FASB Statement No. 43 Accounting for CompensatedAbsences (“EITF 06-2”). The EITF concluded that sabbatical leave accumulates pursuant to the criteria of FASBStandard No. 43 Accounting for Compensated Absences (“FAS 43”) and therefore the benefit should be accruedif the remaining criteria of FAS 43 are met. EITF 06-2 is effective for fiscal years beginning after December 15,2006. EITF 06-2 can be applied as a change in accounting principle either as a cumulative-effect adjustment tobeginning retained earnings in the year of adoption or as retrospective application to all prior periods. We haveelected to adopt EITF 06-2 as a cumulative-effect adjustment to beginning retained earnings. The actuariallydetermined estimated accrued sabbatical balance as of December 31, 2006, is $2.6 million.
In September 2006, the FASB issued FASB Interpretation No. 48, Accounting for Uncertainty in IncomeTaxes, an interpretation of FASB Statement No. 109 (“FIN 48”). FIN 48 prescribes a recognition threshold andmeasurement attribute for recognition and measurement of a tax position taken or expected to be taken in a taxreturn. FIN 48 also provides guidance on de-recognition, classification, interest and penalties, accounting ininterim periods, disclosure and transition. The interpretation is effective for fiscal years beginning afterDecember 15, 2006. The cumulative effect upon adoption of applying the provision shall be reported as anadjustment to the opening balance of retained earnings for that fiscal year, presented separately. We do notexpect the adoption of FIN 48 to have a material impact on our financial statements.
In September 2006, the FASB issued FASB Staff Position AUG AIR-1, Accounting for Planned MajorMaintenance Activities (“FSP AUG-1”). FSP AUG-1 prohibits the use of the accrue-in-advance method ofaccounting for costs of planned major maintenance projects. The statement is effective for fiscal years beginningafter December 15, 2006. We do not utilize the accrue-in-advance method and therefore do not expect theadoption of FSP AUG-1 to have a material impact on our financial statements.
In September 2006, the FASB issued FASB Standard No. 157, Fair Value Measurements (“FAS 157”). FAS157 provides a definition of fair value and acceptable methods of measuring fair value. We do not expect theadoption of FAS 157 to have a material impact on our financial statements.
In September 2006, the SEC issued Staff Accounting Bulletin No. 108, Considering the Effects of PriorYear Misstatements when Quantifying Misstatements in Current Year Financial Statements (“SAB 108”). SAB108 provides guidance on how prior year misstatements should be taken into consideration when quantifyingmisstatements in current year financial statements for purposes of determining whether the current year’sfinancial statements are materially misstated. SAB 108 permits registrants to record the cumulative effect ofinitial adoption by recording the necessary “correcting” adjustments to the carrying values of assets and liabilitiesas of the beginning of that year with the offsetting adjustment recorded to the opening balance of retainedearnings only if material under the dual method. SAB 108 is effective for fiscal years ending on or afterNovember 15, 2006. We have assessed the effect of adopting this guidance and has determined that there will beno impact on our consolidated financial statements.
ITEM 7A. QUANTITATIVE AND QUALITATIVE DISCLOSURE ABOUT MARKET RISK
Changing Interest Rates
We’re exposed to interest rate risk through the investment of our cash and cash equivalents. Since thecompletion of our initial public offering we have invested our cash in short-term investments with maturities ofthree months or less. Changes in interest rates affect the interest income we earn, and therefore impact our cashflows and results of operations. As of December 31, 2006, we had $150.0 million deposited in short-terminvestments bearing a weighted-average interest rate of 4.61%.
32

Commodity Price Risks
We’re also exposed to commodity price risks. Many of the ingredients we use to prepare our food, as well asour packaging materials, are commodities that are affected by weather, seasonality, production, availability andother factors outside our control. We work closely with our suppliers and use a mix of forward pricing protocolsunder which we agree with our supplier on fixed prices for deliveries at sometime in the future, fixed pricingprotocols under which we agree on a fixed price with our supplier for the duration of that protocol, and formulapricing protocols under which the prices we pay are based on specified formula related to the prices of the goods,such as spot prices. Though we do not have long-term supply contracts or guaranteed purchase amounts, ourpricing protocols with suppliers can remain in effect for periods ranging from one month to a year, depending onthe outlook for prices of the particular ingredient. We also sometimes buy supplies at current market or spotprices. We’ve tried to increase, where necessary, the number of suppliers for our ingredients, which we believecan help mitigate pricing volatility, and we follow industry news, trade issues, weather, crises and other worldevents that may affect supply prices. Long-term increases in ingredient prices could adversely affect our futureresults if we could not increase menu prices at the same pace for competitive or other reasons. Similarly, if webelieve the ingredient price increase to be short in duration we may choose not to pass on the cost increases,which could adversely affect our short-term financial results.
33
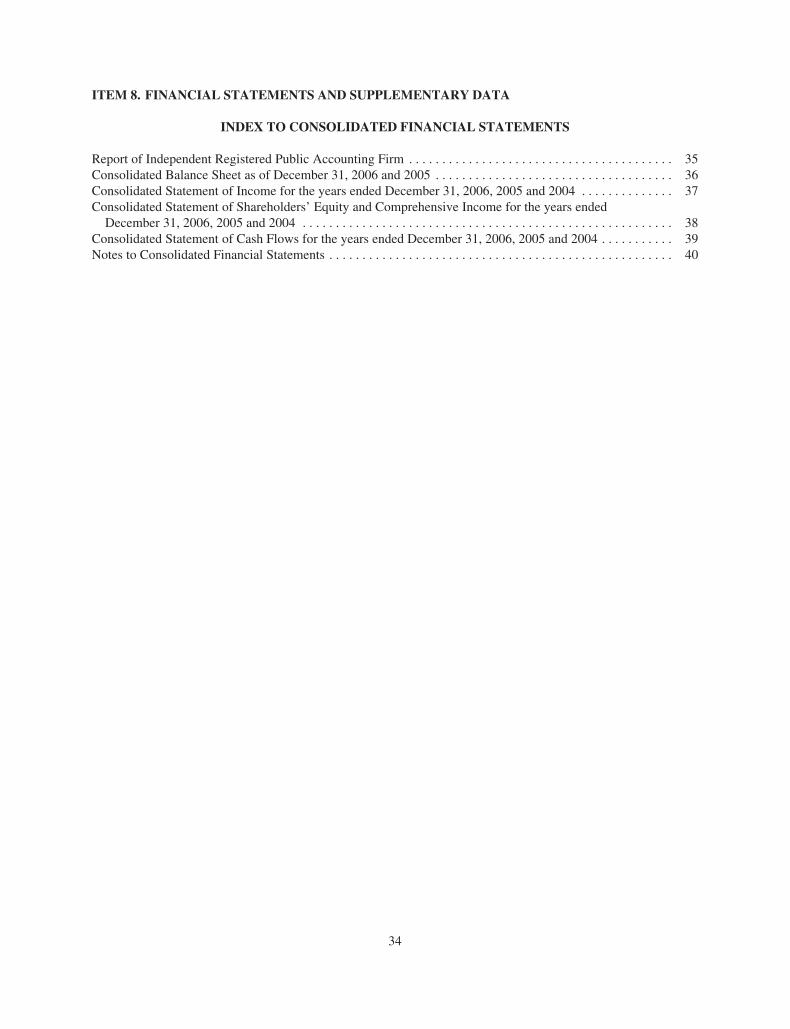
ITEM 8. FINANCIAL STATEMENTS AND SUPPLEMENTARY DATA
INDEX TO CONSOLIDATED FINANCIAL STATEMENTS
Report of Independent Registered Public Accounting Firm . . . . . . . . . . . . . . . . . . . . . . . . . . . . . . . . . . . . . . . . 35Consolidated Balance Sheet as of December 31, 2006 and 2005 . . . . . . . . . . . . . . . . . . . . . . . . . . . . . . . . . . . . 36Consolidated Statement of Income for the years ended December 31, 2006, 2005 and 2004 . . . . . . . . . . . . . . 37Consolidated Statement of Shareholders’ Equity and Comprehensive Income for the years ended
December 31, 2006, 2005 and 2004 . . . . . . . . . . . . . . . . . . . . . . . . . . . . . . . . . . . . . . . . . . . . . . . . . . . . . . . . 38Consolidated Statement of Cash Flows for the years ended December 31, 2006, 2005 and 2004 . . . . . . . . . . . 39Notes to Consolidated Financial Statements . . . . . . . . . . . . . . . . . . . . . . . . . . . . . . . . . . . . . . . . . . . . . . . . . . . . 40
34

Report of Independent Registered Public Accounting Firm
The Board of Directors and Shareholders ofChipotle Mexican Grill, Inc.
We have audited the accompanying consolidated balance sheets of Chipotle Mexican Grill, Inc. as ofDecember 31, 2006 and 2005, and the related consolidated statements of income, shareholders’ equity andcomprehensive income, and cash flows for each of the three years in the period ended December 31, 2006. Thesefinancial statements are the responsibility of the Company’s management. Our responsibility is to express anopinion on these financial statements based on our audits.
We conducted our audits in accordance with the standards of the Public Company Accounting OversightBoard (United States). Those standards require that we plan and perform the audit to obtain reasonable assuranceabout whether the financial statements are free of material misstatement. We were not engaged to perform anaudit of the Company’s internal control over financial reporting. Our audits included consideration of internalcontrol over financial reporting as a basis for designing audit procedures that are appropriate in thecircumstances, but not for the purpose of expressing an opinion on the effectiveness of the Company’s internalcontrol over financial reporting. Accordingly, we express no such opinion. An audit also includes examining, ona test basis, evidence supporting the amounts and disclosures in the financial statements, assessing the accountingprinciples used and significant estimates made by management, and evaluating the overall financial statementpresentation. We believe that our audits provide a reasonable basis for our opinion.
In our opinion, the financial statements referred to above present fairly, in all material respects, theconsolidated financial position of Chipotle Mexican Grill, Inc. as of December 31, 2006 and 2005, and theconsolidated results of its operations and its cash flows for each of the three years in the period endedDecember 31, 2006, in conformity with U.S. generally accepted accounting principles.
As discussed in the Notes to the consolidated financial statements, effective January 1, 2005, the Companychanged its method for accounting for share-based compensation to conform with FASB Standard No. 123(R),Share-Based Payments, and effective January 1, 2006, the Company changed its method for accounting forpre-opening rental costs to conform with FASB Staff Position No. FAS 13-1, Accounting for Rental CostsIncurred during a Construction Period.
/s/ Ernst & Young LLP
Denver, ColoradoFebruary 22, 2007
35
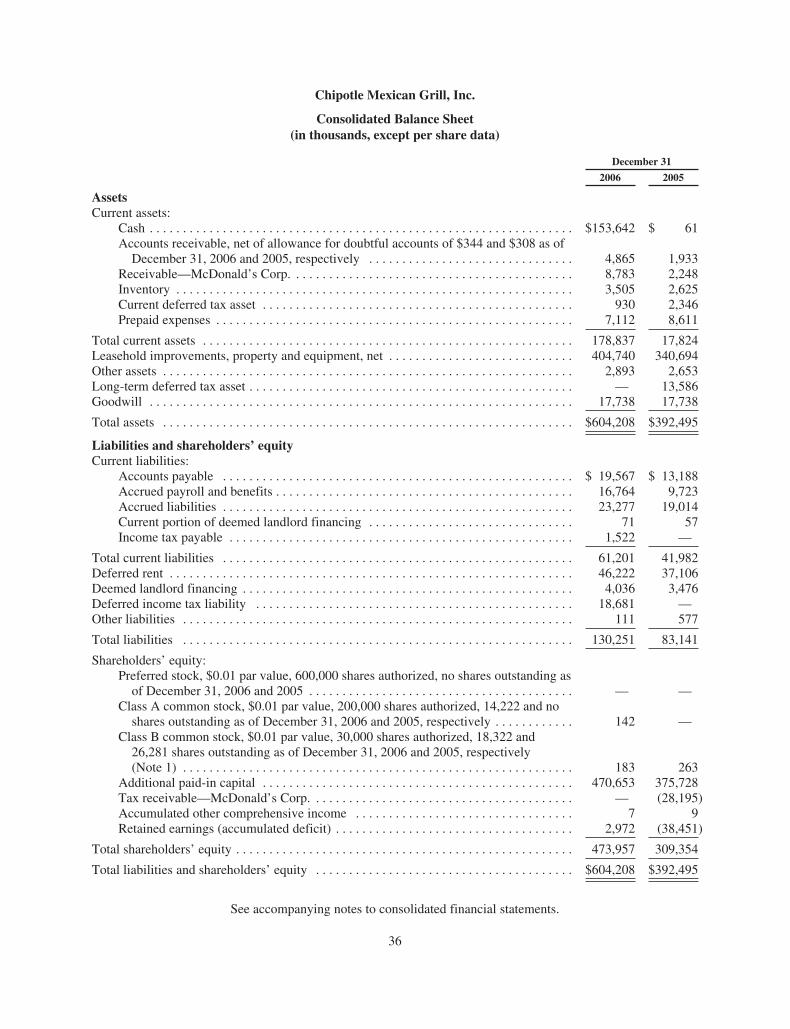
Chipotle Mexican Grill, Inc.
Consolidated Balance Sheet(in thousands, except per share data)
December 31
2006 2005
AssetsCurrent assets:
Cash . . . . . . . . . . . . . . . . . . . . . . . . . . . . . . . . . . . . . . . . . . . . . . . . . . . . . . . . . . . . . . . . $153,642 $ 61Accounts receivable, net of allowance for doubtful accounts of $344 and $308 as of
December 31, 2006 and 2005, respectively . . . . . . . . . . . . . . . . . . . . . . . . . . . . . . . 4,865 1,933Receivable—McDonald’s Corp. . . . . . . . . . . . . . . . . . . . . . . . . . . . . . . . . . . . . . . . . . . 8,783 2,248Inventory . . . . . . . . . . . . . . . . . . . . . . . . . . . . . . . . . . . . . . . . . . . . . . . . . . . . . . . . . . . . 3,505 2,625Current deferred tax asset . . . . . . . . . . . . . . . . . . . . . . . . . . . . . . . . . . . . . . . . . . . . . . . 930 2,346Prepaid expenses . . . . . . . . . . . . . . . . . . . . . . . . . . . . . . . . . . . . . . . . . . . . . . . . . . . . . . 7,112 8,611
Total current assets . . . . . . . . . . . . . . . . . . . . . . . . . . . . . . . . . . . . . . . . . . . . . . . . . . . . . . . . 178,837 17,824Leasehold improvements, property and equipment, net . . . . . . . . . . . . . . . . . . . . . . . . . . . . 404,740 340,694Other assets . . . . . . . . . . . . . . . . . . . . . . . . . . . . . . . . . . . . . . . . . . . . . . . . . . . . . . . . . . . . . . 2,893 2,653Long-term deferred tax asset . . . . . . . . . . . . . . . . . . . . . . . . . . . . . . . . . . . . . . . . . . . . . . . . . — 13,586Goodwill . . . . . . . . . . . . . . . . . . . . . . . . . . . . . . . . . . . . . . . . . . . . . . . . . . . . . . . . . . . . . . . . 17,738 17,738
Total assets . . . . . . . . . . . . . . . . . . . . . . . . . . . . . . . . . . . . . . . . . . . . . . . . . . . . . . . . . . . . . . $604,208 $392,495
Liabilities and shareholders’ equityCurrent liabilities:
Accounts payable . . . . . . . . . . . . . . . . . . . . . . . . . . . . . . . . . . . . . . . . . . . . . . . . . . . . . $ 19,567 $ 13,188Accrued payroll and benefits . . . . . . . . . . . . . . . . . . . . . . . . . . . . . . . . . . . . . . . . . . . . . 16,764 9,723Accrued liabilities . . . . . . . . . . . . . . . . . . . . . . . . . . . . . . . . . . . . . . . . . . . . . . . . . . . . . 23,277 19,014Current portion of deemed landlord financing . . . . . . . . . . . . . . . . . . . . . . . . . . . . . . . 71 57Income tax payable . . . . . . . . . . . . . . . . . . . . . . . . . . . . . . . . . . . . . . . . . . . . . . . . . . . . 1,522 —
Total current liabilities . . . . . . . . . . . . . . . . . . . . . . . . . . . . . . . . . . . . . . . . . . . . . . . . . . . . . 61,201 41,982Deferred rent . . . . . . . . . . . . . . . . . . . . . . . . . . . . . . . . . . . . . . . . . . . . . . . . . . . . . . . . . . . . . 46,222 37,106Deemed landlord financing . . . . . . . . . . . . . . . . . . . . . . . . . . . . . . . . . . . . . . . . . . . . . . . . . . 4,036 3,476Deferred income tax liability . . . . . . . . . . . . . . . . . . . . . . . . . . . . . . . . . . . . . . . . . . . . . . . . 18,681 —Other liabilities . . . . . . . . . . . . . . . . . . . . . . . . . . . . . . . . . . . . . . . . . . . . . . . . . . . . . . . . . . . 111 577
Total liabilities . . . . . . . . . . . . . . . . . . . . . . . . . . . . . . . . . . . . . . . . . . . . . . . . . . . . . . . . . . . 130,251 83,141
Shareholders’ equity:Preferred stock, $0.01 par value, 600,000 shares authorized, no shares outstanding as
of December 31, 2006 and 2005 . . . . . . . . . . . . . . . . . . . . . . . . . . . . . . . . . . . . . . . . — —Class A common stock, $0.01 par value, 200,000 shares authorized, 14,222 and no
shares outstanding as of December 31, 2006 and 2005, respectively . . . . . . . . . . . . 142 —Class B common stock, $0.01 par value, 30,000 shares authorized, 18,322 and
26,281 shares outstanding as of December 31, 2006 and 2005, respectively(Note 1) . . . . . . . . . . . . . . . . . . . . . . . . . . . . . . . . . . . . . . . . . . . . . . . . . . . . . . . . . . . 183 263
Additional paid-in capital . . . . . . . . . . . . . . . . . . . . . . . . . . . . . . . . . . . . . . . . . . . . . . . 470,653 375,728Tax receivable—McDonald’s Corp. . . . . . . . . . . . . . . . . . . . . . . . . . . . . . . . . . . . . . . . — (28,195)Accumulated other comprehensive income . . . . . . . . . . . . . . . . . . . . . . . . . . . . . . . . . 7 9Retained earnings (accumulated deficit) . . . . . . . . . . . . . . . . . . . . . . . . . . . . . . . . . . . . 2,972 (38,451)
Total shareholders’ equity . . . . . . . . . . . . . . . . . . . . . . . . . . . . . . . . . . . . . . . . . . . . . . . . . . . 473,957 309,354
Total liabilities and shareholders’ equity . . . . . . . . . . . . . . . . . . . . . . . . . . . . . . . . . . . . . . . $604,208 $392,495
See accompanying notes to consolidated financial statements.
36

Chipotle Mexican Grill, Inc.
Consolidated Statement of Income(in thousands, except per share data)
Years ended December 31
2006 2005 2004
Revenue:Restaurant sales . . . . . . . . . . . . . . . . . . . . . . . . . . . . . . . . . . . . . . . . . . . . . . . . . $819,787 $625,077 $468,579Franchise royalties and fees . . . . . . . . . . . . . . . . . . . . . . . . . . . . . . . . . . . . . . . . 3,143 2,618 2,142
Total revenue . . . . . . . . . . . . . . . . . . . . . . . . . . . . . . . . . . . . . . . . . . . . . . . . . . . 822,930 627,695 470,721
Restaurant operating costs (exclusive of depreciation and amortization shownseparately below):
Food, beverage and packaging . . . . . . . . . . . . . . . . . . . . . . . . . . . . . . . . . . 257,998 202,288 154,148Labor . . . . . . . . . . . . . . . . . . . . . . . . . . . . . . . . . . . . . . . . . . . . . . . . . . . . . 231,134 178,721 139,494Occupancy . . . . . . . . . . . . . . . . . . . . . . . . . . . . . . . . . . . . . . . . . . . . . . . . . 58,804 47,636 36,190Other operating costs . . . . . . . . . . . . . . . . . . . . . . . . . . . . . . . . . . . . . . . . . 102,745 82,976 64,274
General and administrative expenses . . . . . . . . . . . . . . . . . . . . . . . . . . . . . . . . . 65,284 51,964 44,837Depreciation and amortization . . . . . . . . . . . . . . . . . . . . . . . . . . . . . . . . . . . . . . 34,253 28,026 21,802Pre-opening costs . . . . . . . . . . . . . . . . . . . . . . . . . . . . . . . . . . . . . . . . . . . . . . . . 6,778 1,971 2,192Loss on disposal of assets . . . . . . . . . . . . . . . . . . . . . . . . . . . . . . . . . . . . . . . . . . 3,982 3,119 1,678
760,978 596,701 464,615
Income from operations . . . . . . . . . . . . . . . . . . . . . . . . . . . . . . . . . . . . . . . . . . . 61,952 30,994 6,106Interest income . . . . . . . . . . . . . . . . . . . . . . . . . . . . . . . . . . . . . . . . . . . . . . . . . . 6,574 36 211Interest expense . . . . . . . . . . . . . . . . . . . . . . . . . . . . . . . . . . . . . . . . . . . . . . . . . (271) (790) (191)
Income before income taxes . . . . . . . . . . . . . . . . . . . . . . . . . . . . . . . . . . . . . . . . 68,255 30,240 6,126(Provision) benefit for income taxes . . . . . . . . . . . . . . . . . . . . . . . . . . . . . . . . . (26,832) 7,456 —
Net income . . . . . . . . . . . . . . . . . . . . . . . . . . . . . . . . . . . . . . . . . . . . . . . . . . . . . $ 41,423 $ 37,696 $ 6,126
Earnings per shareBasic . . . . . . . . . . . . . . . . . . . . . . . . . . . . . . . . . . . . . . . . . . . . . . . . . . . . . . $ 1.29 $ 1.43 $ 0.24
Diluted . . . . . . . . . . . . . . . . . . . . . . . . . . . . . . . . . . . . . . . . . . . . . . . . . . . . $ 1.28 $ 1.43 $ 0.24
Weighted average common shares outstandingBasic . . . . . . . . . . . . . . . . . . . . . . . . . . . . . . . . . . . . . . . . . . . . . . . . . . . . . . 32,051 26,281 25,454
Diluted . . . . . . . . . . . . . . . . . . . . . . . . . . . . . . . . . . . . . . . . . . . . . . . . . . . . 32,465 26,374 25,520
See accompanying notes to consolidated financial statements.
37

Chipotle Mexican Grill, Inc.
Consolidated Statement of Shareholders’ Equity and Comprehensive Income(in thousands)
Class A Common Stock Class B Common Stock (Note 1) Additional Paidin Capital
Tax ReceivableMcDonald’s
Corp
RetainedEarnings
(AccumulatedDeficit)
AccumulatedOther
ComprehensiveIncome TotalShares Amount Shares Amount
Balance, December 31, 2003 . . . . . . — $— 23,373 $234 $310,659 $(37,112) $(82,273) $— $191,508Issuance of common stock . . . . . . . 2,908 29 64,894 64,923Tax sharing arrangement . . . . . . . . . 8,873 (8,873) —Comprehensive income:
Net income . . . . . . . . . . . . . . . 6,126 6,126Foreign currency translation
adjustment . . . . . . . . . . . . . . 9 9
Total comprehensiveincome . . . . . . . . . . . . . . . . . 6,135
Balance, December 31, 2004 . . . . . . — — 26,281 263 384,426 (45,985) (76,147) 9 262,566Tax sharing arrangement . . . . . . . . . (10,417) 17,790 7,373Stock-based compensation . . . . . . . 1,719 1,719
Net income . . . . . . . . . . . . . . . 37,696 37,696
Balance, December 31, 2005 . . . . . . — — 26,281 263 375,728 (28,195) (38,451) 9 309,354Issuance of common stock . . . . . . . 6,061 61 133,272 133,333Costs to issue common stock . . . . . (12,436) (12,436)Grant of common stock . . . . . . . . . . 1 — 100 100Conversion of common stock . . . . . 8,010 80 (8,010) (80) —Stock-based compensation . . . . . . . 51 — 5,870 5,870Stock option exercises . . . . . . . . . . . 150 1 2,751 2,752Excess tax benefit on option
exercises, net of utilization of$423 . . . . . . . . . . . . . . . . . . . . . . . 934 934
Tax sharing arrangement . . . . . . . . . (35,566) 19,412 (16,154)Separation from McDonald’s . . . . . 8,783 8,783Comprehensive income:
Net income . . . . . . . . . . . . . . . 41,423 41,423Foreign currency translation
adjustment . . . . . . . . . . . . . . (2) (2)
Total comprehensiveincome . . . . . . . . . . . . . . . . . 41,421
Balance, December 31, 2006 . . . . . . 14,222 $142 18,322 $183 $470,653 $ — $ 2,972 $ 7 $473,957
See accompanying notes to consolidated financial statements.
38

Chipotle Mexican Grill, Inc.
Consolidated Statement of Cash Flows(in thousands)
Years ended December 31
2006 2005 2004
Operating activitiesNet income . . . . . . . . . . . . . . . . . . . . . . . . . . . . . . . . . . . . . . . . . . . . . . . . . . . . . . . . . . . . . . . $ 41,423 $ 37,696 $ 6,126Adjustments to reconcile net income to net cash provided by operating activities:
Depreciation and amortization . . . . . . . . . . . . . . . . . . . . . . . . . . . . . . . . . . . . . . . . . . . . 34,253 28,026 21,802Current income tax (benefit) provision . . . . . . . . . . . . . . . . . . . . . . . . . . . . . . . . . . . . . (782) 15,541 (8,873)Deferred income tax (benefit) provision . . . . . . . . . . . . . . . . . . . . . . . . . . . . . . . . . . . . (1,857) (2,654) 11,485Change in valuation allowance . . . . . . . . . . . . . . . . . . . . . . . . . . . . . . . . . . . . . . . . . . . . — (20,343) (2,612)Loss on disposal of assets . . . . . . . . . . . . . . . . . . . . . . . . . . . . . . . . . . . . . . . . . . . . . . . . 3,982 3,119 1,678Bad debt allowance . . . . . . . . . . . . . . . . . . . . . . . . . . . . . . . . . . . . . . . . . . . . . . . . . . . . . (59) (359) 804Stock-based compensation . . . . . . . . . . . . . . . . . . . . . . . . . . . . . . . . . . . . . . . . . . . . . . . 5,193 2,103 193Other . . . . . . . . . . . . . . . . . . . . . . . . . . . . . . . . . . . . . . . . . . . . . . . . . . . . . . . . . . . . . . . . (323) (678) —Changes in operating assets and liabilities:
Accounts receivable . . . . . . . . . . . . . . . . . . . . . . . . . . . . . . . . . . . . . . . . . . . . . . . . (2,873) 916 (689)Inventory . . . . . . . . . . . . . . . . . . . . . . . . . . . . . . . . . . . . . . . . . . . . . . . . . . . . . . . . . (880) (369) (790)Prepaid expenses . . . . . . . . . . . . . . . . . . . . . . . . . . . . . . . . . . . . . . . . . . . . . . . . . . . 1,499 (3,757) (1,092)Other assets . . . . . . . . . . . . . . . . . . . . . . . . . . . . . . . . . . . . . . . . . . . . . . . . . . . . . . . (242) (477) (145)Accounts payable . . . . . . . . . . . . . . . . . . . . . . . . . . . . . . . . . . . . . . . . . . . . . . . . . . 912 5,553 (2,345)Accrued liabilities . . . . . . . . . . . . . . . . . . . . . . . . . . . . . . . . . . . . . . . . . . . . . . . . . . 11,304 6,485 6,717Income tax payable . . . . . . . . . . . . . . . . . . . . . . . . . . . . . . . . . . . . . . . . . . . . . . . . . 2,222 — —Due (from) to McDonald’s Corp. . . . . . . . . . . . . . . . . . . . . . . . . . . . . . . . . . . . . . . — (177) 155Deferred rent . . . . . . . . . . . . . . . . . . . . . . . . . . . . . . . . . . . . . . . . . . . . . . . . . . . . . . 9,714 6,806 7,258Other long-term liabilities . . . . . . . . . . . . . . . . . . . . . . . . . . . . . . . . . . . . . . . . . . . 111 — —
Net cash provided by operating activities . . . . . . . . . . . . . . . . . . . . . . . . . . . . . . . . . . . . . . . . 103,597 77,431 39,672
Investing activitiesPurchases of leasehold improvements, property and equipment, net . . . . . . . . . . . . . . . . . . . (97,312) (83,036) (95,615)
Net cash used in investing activities . . . . . . . . . . . . . . . . . . . . . . . . . . . . . . . . . . . . . . . . . . . . (97,312) (83,036) (95,615)
Financing activitiesNet proceeds from sale of common stock . . . . . . . . . . . . . . . . . . . . . . . . . . . . . . . . . . . . . . . 133,333 — 64,923Costs of issuing common stock . . . . . . . . . . . . . . . . . . . . . . . . . . . . . . . . . . . . . . . . . . . . . . . (12,436) — —Proceeds from McDonalds—tax sharing agreement . . . . . . . . . . . . . . . . . . . . . . . . . . . . . . . 19,468 7,402 —Proceeds from option exercises . . . . . . . . . . . . . . . . . . . . . . . . . . . . . . . . . . . . . . . . . . . . . . . 2,752 — —Excess tax benefit on stock-based compensation . . . . . . . . . . . . . . . . . . . . . . . . . . . . . . . . . . 1,357 — —Proceeds from McDonald’s—intercompany notes . . . . . . . . . . . . . . . . . . . . . . . . . . . . . . . . . 2,248 37,905 55,139Payments to McDonald’s—intercompany notes . . . . . . . . . . . . . . . . . . . . . . . . . . . . . . . . . . — (38,743) (66,000)Changes in cash overdrafts . . . . . . . . . . . . . . . . . . . . . . . . . . . . . . . . . . . . . . . . . . . . . . . . . . . — (4,431) 1,881Proceeds from deemed landlord financing . . . . . . . . . . . . . . . . . . . . . . . . . . . . . . . . . . . . . . . 635 3,549 —Payments on deemed landlord financing . . . . . . . . . . . . . . . . . . . . . . . . . . . . . . . . . . . . . . . . (61) (16) —
Net cash provided by financing activities . . . . . . . . . . . . . . . . . . . . . . . . . . . . . . . . . . . . . . . . 147,296 5,666 55,943
Net change in cash and cash equivalents . . . . . . . . . . . . . . . . . . . . . . . . . . . . . . . . . . . . . . . . 153,581 61 —Cash and cash equivalents at beginning of year . . . . . . . . . . . . . . . . . . . . . . . . . . . . . . . . . . . 61 — —
Cash and cash equivalents at end of year . . . . . . . . . . . . . . . . . . . . . . . . . . . . . . . . . . . . . . . . $153,642 $ 61 $ —
Supplemental disclosures of cash flow informationTaxes paid . . . . . . . . . . . . . . . . . . . . . . . . . . . . . . . . . . . . . . . . . . . . . . . . . . . . . . . . . . . . . . . . $ 26,316 $ — $ —
Non-cash pre-opening rent capitalized to leasehold improvements . . . . . . . . . . . . . . . . . . . . $ — $ 2,667 $ 2,317
Net purchases of leasehold improvements, property and equipment accrued in accountspayable . . . . . . . . . . . . . . . . . . . . . . . . . . . . . . . . . . . . . . . . . . . . . . . . . . . . . . . . . . . . . . . . $ (5,467) $ (4,168) $ 4,127
See accompanying notes to consolidated financial statements.
39
Chipotle Mexican Grill, Inc.
Notes to Consolidated Financial Statements(dollar and share amounts in thousands, unless otherwise specified)
1. Description of Business and Summary of Significant Accounting Policies
Chipotle Mexican Grill, Inc. (the “Company”), a Delaware corporation, develops and operates fast-casual,fresh Mexican food restaurants in 26 states throughout the United States and in the District of Columbia. As ofDecember 31, 2006 and 2005, the Company operated 573 and 481 restaurants, respectively, and had eightrestaurants operated by franchisees as of the end of each year. The Company manages its operations based onthree regions and has aggregated its operations to one reportable segment and one reporting unit.
Initial Public Offering
In January 2006, the Company completed its offering of 6,061 shares of class A common stock, $0.01 parvalue, in its initial public offering at a per share price of $22.00 receiving net proceeds of approximately$120.9 million (the “initial public offering”). McDonald’s Corporation (“McDonald’s”) sold an additional 3,000shares, including the underwriters’ over-allotment shares, in the initial public offering. In connection with theinitial public offering, the Company filed a restated certificate of incorporation effecting the reclassification of alloutstanding shares of Series B convertible preferred stock and Series C and Series D junior convertible preferredstock and all outstanding shares of common stock into one-third share of class B common stock (the“Reclassification”). The accompanying consolidated financial statements and related notes reflect the effect ofthe Reclassification retroactively.
McDonald’s Disposition
Historically McDonald’s has been the majority shareholder of the Company’s voting and economic interest.During 2006, through the initial public offering in January 2006, a secondary offering in May 2006 and a tax-freeexchange offer in October 2006 (the “Disposition”), McDonald’s disposed of it interest in the Company and nolonger holds any voting or economic interest in the Company.
Principles of Consolidation
The consolidated financial statements include the accounts of the Company and its subsidiaries. All inter-company balances and transactions have been eliminated.
Management Estimates
The preparation of financial statements in conformity with U.S. generally accepted accounting principlesrequires management to make estimates and assumptions that affect the reported amounts of assets and liabilitiesand disclosure of contingent assets and liabilities as of the date of the financial statements and the reportedamounts of revenue and expenses during the reporting period. Actual results could differ from those estimatesunder different assumptions or conditions.
Revenue Recognition
Revenue from restaurant sales is recognized when food and beverage products are sold. A deferred liabilityis recognized for gift cards that have been sold but not yet redeemed at their anticipated redemption value. TheCompany recognizes revenue and reduces the related deferred liability when the gift cards are redeemed. Feesfrom franchised restaurants include continuing rent and service fees, initial fees and royalties. Continuing feesand royalties are recognized in the period earned. Initial fees are recognized upon opening a restaurant, which iswhen the Company has performed substantially all initial services required by the franchise arrangement.
40
Chipotle Mexican Grill, Inc.
Notes to Consolidated Financial Statements—(Continued)(dollar and share amounts in thousands, unless otherwise specified)
Cash and Cash Equivalents
The Company considers all highly liquid investment instruments purchased with an initial maturity of threemonths or less to be cash equivalents.
Accounts Receivable
Accounts receivable consists of tenant improvement receivables, credit card receivables, and miscellaneousreceivables. The allowance for doubtful accounts is the Company’s best estimate of the amount of probablecredit losses in the Company’s existing accounts receivable based on a specific review of account balances.Account balances are charged off against the allowance after all means of collection have been exhausted and thepotential for recoverability is considered remote.
Inventory
Inventory, consisting principally of food, beverages, and supplies, is valued at the lower of first-in, first-outcost or market. The Company has no minimum purchase commitments with its vendors. The Company purchasescertain key ingredients (steak, chicken, pork and tortillas) from a small number of suppliers.
Leasehold Improvements, Property and Equipment
Leasehold improvements, property and equipment are stated at cost. Internal costs directly associated withthe acquisition, development and construction of a restaurant are capitalized. Expenditures for major renewalsand improvements are capitalized while expenditures for minor replacements, maintenance and repairs areexpensed as incurred. Depreciation is calculated using the straight-line method over the estimated useful lives ofthe assets. Leasehold improvements are amortized over the shorter of the lease term, which generally includesreasonably assured option periods, or the estimated useful lives of the assets. Upon retirement or disposal ofassets, the accounts are relieved of cost and accumulated depreciation and the related gain or loss is reflected inearnings.
The estimated useful lives are:
Leasehold improvements and buildings . . . . . . . . . . . . . . . . . . . . . . . . . . . . . . . . 3-20 yearsFurniture and fixtures . . . . . . . . . . . . . . . . . . . . . . . . . . . . . . . . . . . . . . . . . . . . . . 3-10 yearsEquipment . . . . . . . . . . . . . . . . . . . . . . . . . . . . . . . . . . . . . . . . . . . . . . . . . . . . . . . 3-7 years
Goodwill
Goodwill represents the excess of cost over fair value of net assets of the business acquired. Goodwillresulted from McDonald’s purchases of the Company. Goodwill determined to have an indefinite life is notsubject to amortization, but instead is tested for impairment at least annually in accordance with the provision ofFASB Standard No. 142, Goodwill and Other Intangible Assets (“FAS 142”). In accordance with FAS 142, theCompany is required to make any necessary impairment adjustments. Impairment is measured as the excess ofthe carrying value over the fair value of the goodwill. Based on the Company’s analysis, no impairment chargeswere recognized for the years ended December 31, 2006, 2005 and 2004.
Other Assets
Other assets consist primarily of transferable liquor licenses which are carried at the lower of fair value or cost.
41

Chipotle Mexican Grill, Inc.
Notes to Consolidated Financial Statements—(Continued)(dollar and share amounts in thousands, unless otherwise specified)
Impairment of Long-Lived Assets
In accordance with FASB Standard No. 144, Accounting for the Impairment or Disposal of Long-LivedAsset (“FAS 144”), long-lived assets are reviewed for impairment whenever events or changes in circumstancesindicate that the carrying amount of an asset may not be recoverable. Recoverability of assets to be held and usedis measured by a comparison of the carrying amount of an asset to the estimated undiscounted future cash flowsexpected to be generated by the asset. If the carrying amount of an asset exceeds its estimated future cash flows,an impairment charge is recognized as the amount by which the carrying amount of the asset exceeds the fairvalue of the asset. During the year ended December 31, 2006, an aggregate impairment charge of $693 wasrecognized in loss on disposition of assets in the consolidated statement of income for the closure of onerestaurant due to structural damage to the leased site and due to an upcoming closure of another restaurant due tothe landlord’s decision to redevelop the location. Fair value of each restaurant was determined using the expectedcash flows method of anticipated cash flows through the estimated date of closure. No impairment charges wererecognized in the years ended December 31, 2005 and 2004.
Fair Value of Financial Instruments
The carrying value of the Company’s financial assets and liabilities, because of their short-term nature,approximates fair value.
Income Taxes
Prior to the completion of the Company’s initial public offering, its results of operations were included inthe consolidated federal and state income tax returns of McDonald’s. Upon the completion of the Company’sinitial public offering in January 2006, it exited the consolidated tax group for federal and certain state incometax purposes. Upon completion of the Disposition in October 2006, the Company exited the McDonald’sconsolidated tax group for the remaining state returns. During the period the Company was included inMcDonald’s consolidated tax returns, the provision for income taxes was calculated on a separate income taxreturn basis. The Company recognizes deferred tax assets and liabilities at enacted income tax rates for thetemporary differences between the financial reporting bases and the tax bases of its assets and liabilities. Anyeffects of changes in income tax rates or tax laws are included in the provision for income taxes in the period ofenactment. When it is more likely than not that a portion or all of a deferred tax asset will not be realized in thefuture, the Company provides a corresponding valuation allowance against the deferred tax asset.
Equity-Based Compensation Plans
Prior to January 1, 2005, the Company accounted for its equity-based compensation plan using theintrinsic-value method prescribed by Accounting Principles Board (“APB”) Opinion No. 25, Accounting forStock Issued to Employees, and related Interpretations, as permitted by FASB Standard No. 123, Accounting forStock-Based Compensation (“FAS 123”). Prior to January 1, 2005, no compensation expense was recognized onstock option grants as the exercise price equaled the fair value at the date of grant. Accordingly, share-basedcompensation was included as a pro forma disclosure in the financial statement footnotes.
Effective January 1, 2005, the Company early adopted the fair value recognition provisions of FASBStandard No. 123(R), Share-Based Payment (“FAS 123R”), using the modified-prospective transition method.Under this transition method, compensation cost in 2005 includes the portion vesting in the period for (1) allshare-based payments granted prior to, but not vested as of January 1, 2005, based on the grant date fair valueestimated in accordance with the original provisions of FAS 123 and (2) all share-based payments granted
42

Chipotle Mexican Grill, Inc.
Notes to Consolidated Financial Statements—(Continued)(dollar and share amounts in thousands, unless otherwise specified)
subsequent to January 1, 2005, based on the grant date fair value estimated in accordance with the provisions ofFAS 123R. Compensation expense is generally recognized over the vesting period. The following table illustratesthe effect on net income as if the fair value based method had been applied to all outstanding and unvestedawards for the year ended December 31, 2004.
Net income, as reported . . . . . . . . . . . . . . . . . . . . . . . . . . . . . . . . . . . . . . . . . . . . . . . $6,126Stock-based employee compensation expense . . . . . . . . . . . . . . . . . . . . . . . . . . . . . . (527)
Pro forma net income . . . . . . . . . . . . . . . . . . . . . . . . . . . . . . . . . . . . . . . . . . . . . . . . . $5,599
Earnings per share:Basic, as reported . . . . . . . . . . . . . . . . . . . . . . . . . . . . . . . . . . . . . . . . . . . . . . . . . . . . $ 0.24
Diluted, as reported . . . . . . . . . . . . . . . . . . . . . . . . . . . . . . . . . . . . . . . . . . . . . . . . . . $ 0.24
Basic, pro forma . . . . . . . . . . . . . . . . . . . . . . . . . . . . . . . . . . . . . . . . . . . . . . . . . . . . . $ 0.22
Diluted, pro forma . . . . . . . . . . . . . . . . . . . . . . . . . . . . . . . . . . . . . . . . . . . . . . . . . . . $ 0.22
Restaurant Pre-Opening Costs
Pre-opening costs, including wages, benefits and travel for the training and opening teams, food and otherrestaurant operating costs, are expensed as incurred prior to a restaurant opening for business. These costsinclude rent since the adoption of FASB Staff Position No. FAS 13-1 Accounting for Rental Costs IncurredDuring a Construction Period, (“FSP 13-1”) in January 2006.
Insurance Liability
The Company maintains various insurance policies for workers’ compensation, employee health, generalliability and property damage. Pursuant to these policies, the Company is responsible for losses up to certainlimits and is required to estimate a liability that represents the ultimate exposure for aggregate losses below thoselimits. This liability is based on management’s estimates of the ultimate costs to be incurred to settle knownclaims and claims not reported as of the balance sheet date. The estimated liability is not discounted and is basedon a number of assumptions and factors, including historical trends, actuarial assumptions, and economicconditions. If actual trends differ from the estimates, the financial results could be impacted.
Advertising Costs
Advertising is expensed as incurred and aggregated $13,918, $10,748 and $8,715 for the years endedDecember 31, 2006, 2005 and 2004, respectively.
Rent
Rent expense for the Company’s leases, which generally have escalating rentals over the term of the lease, isrecorded on a straight-line basis over the lease term. The lease term begins when the Company has the right tocontrol the use of the property, which is typically before rent payments are due under the lease. The differencebetween the rent expense and rent paid is recorded as deferred rent in the consolidated balance sheet. Prior toJanuary 1, 2006, rent expense for the period prior to restaurant opening was capitalized and included in leaseholdimprovements in the consolidated balance sheet. Rent capitalized during the pre-opening period was $4,229 and$3,626 for the years ended December 31, 2005 and 2004, respectively. Effective January 1, 2006 with theadoption of FSP 13-1 pre-opening rent is included in pre-opening costs in the income statement. For the year
43

Chipotle Mexican Grill, Inc.
Notes to Consolidated Financial Statements—(Continued)(dollar and share amounts in thousands, unless otherwise specified)
ended December 31, 2006, $3,793 of pre-opening rent was included in pre-opening costs. Tenant incentives usedto fund leasehold improvements are recorded in deferred rent and amortized as reductions of rent expense overthe term of the lease.
Additionally, certain of the Company’s operating leases contain clauses that provide additional contingentrent based on a percentage of sales greater than certain specified target amounts. The Company recognizescontingent rent expense prior to the achievement of the specified target that triggers contingent rent, provided theachievement of that target is considered probable.
Foreign Currency Translation
Currently, the Company has no operations outside the United States, but has created an internationalsubsidiary to hold international trademarks. The Company’s international entity uses its local currency as thefunctional currency. Assets and liabilities are translated at exchange rates in effect as of the balance sheet date.Income and expense accounts are translated at the average monthly exchange rates during the year. Resultingtranslation adjustments are recorded as a separate component of accumulated other comprehensive income inshareholders’ equity.
Reclassifications and Comparability
Certain prior period amounts have been reclassified to conform to the 2006 presentation. In conjunctionwith the Disposition, McDonald’s is no longer a related-party. As such, amounts due to McDonald’s are includedin accrued liabilities in the consolidated balance sheet. The tax receivable from McDonald’s has been reclassifiedas notes receivable—McDonald’s Corporation as of the Disposition while the prior period balance of the taxreceivable remains in shareholders’ equity.
Concentrations of Credit Risk
Financial instruments that potentially subject the Company to concentrations of credit risk consist primarilyof cash and cash equivalents and account receivables. The Company invests its cash and cash equivalents withfinancial institutions consistent with its investment policy. The Company’s cash balances may exceed federallyinsured limits. As of December 31, 2006, $135 million of the Company’s cash equivalents were investedprimarily with two major financial institutions. Concentration of credit risk related to accounts receivables arelimited, as the Company’s receivables are primarily with its landlords for the reimbursements of tenantimprovements.
2. Recently Issued Accounting Standards
In September 2006, the Emerging Issues Task Force (“EITF”) issued EITF Issue No. 06-2, Accounting forSabbatical Leave and Other Similar Benefits Pursuant to FASB Statement No. 43 Accounting for CompensatedAbsences (“EITF 06-2”). The EITF concluded that sabbatical leave accumulates pursuant to the criteria ofStatement of Accounting Standard No. 43 Accounting for Compensated Absences (“FAS 43”) and therefore thebenefit should be accrued if the remaining criteria of FAS 43 are met. EITF 06-2 is effective for fiscal yearsbeginning after December 15, 2006. EITF 06-2 can be applied as a change in accounting principle either as acumulative-effect adjustment to beginning retained earnings in the year of adoption or as retrospective applicationto all prior periods. The Company offers sabbatical leave to employees who have provided ten years of services.The actuarially determined estimated accrued sabbatical balance as of December 31, 2006, is $2.6 million which theCompany will recognize as a cumulative-effect adjustment to beginning retained earnings in 2007.
44

Chipotle Mexican Grill, Inc.
Notes to Consolidated Financial Statements—(Continued)(dollar and share amounts in thousands, unless otherwise specified)
In September 2006, the FASB issued FASB Interpretation No. 48, Accounting for Uncertainty in IncomeTaxes, an interpretation of FASB Statement No. 109 (“FIN 48”). FIN 48 prescribes a recognition threshold andmeasurement attribute for recognition and measurement of a tax position taken or expected to be taken in a taxreturn. FIN 48 also provides guidance on de-recognition, classification, interest and penalties, accounting ininterim periods, disclosure and transition. The interpretation is effective for fiscal years beginning afterDecember 15, 2006. The cumulative effect upon adoption of applying the provision shall be reported as anadjustment to the opening balance of retained earnings for that fiscal year, presented separately. The Companydoes not expect the adoption of FIN 48 to have a material impact on its consolidated financial statements.
In September 2006, the FASB issued FASB Staff Position AUG AIR-1, Accounting for Planned MajorMaintenance Activities (“FSP AUG-1”). FSP AUG-1 prohibits the use of the accrue-in-advance method ofaccounting for costs of planned major maintenance projects. The statement is effective for fiscal years beginningafter December 15, 2006. The Company does not utilize the accrue-in-advance method and therefore does notexpect the adoption of FSP AUG-1 to have a material impact on its consolidated financial statements.
In September 2006, the FASB issued FASB Standard No. 157, Fair Value Measurements (“FAS 157”). FAS157 provides a definition of fair value, establishes acceptable methods of measuring fair value and expandsdisclosures for fair value measurements. The principles apply under accounting pronouncements which requiremeasurement of fair value. The Company does not expect the adoption of FAS 157 to have a material impact onits consolidated financial statements.
In September 2006, the SEC issued Staff Accounting Bulletin No. 108, Considering the Effects of PriorYear Misstatements when Quantifying Misstatements in Current Year Financial Statements (“SAB 108”). SAB108 provides guidance on how prior year misstatements should be taken into consideration when quantifyingmisstatements in current year financial statements for purposes of determining whether the current year’sfinancial statements are materially misstated. SAB 108 permits registrants to record the cumulative effect ofinitial adoption by recording the necessary “correcting” adjustments to the carrying values of assets and liabilitiesas of the beginning of that year with the offsetting adjustment recorded to the opening balance of retainedearnings only if material under the dual method. SAB 108 is effective for fiscal years ending on or afterNovember 15, 2006. The Company has assessed the effect of adopting this guidance and has determined thatthere will be no impact on the Company’s consolidated financial statements.
3. Leasehold Improvements, Property and Equipment
Leasehold improvements, property and equipment were as follows:
December 31
2006 2005
Land . . . . . . . . . . . . . . . . . . . . . . . . . . . . . . . . . . . . . . . . . . . . . . . . . $ 8,215 $ 6,557Leasehold improvements and buildings . . . . . . . . . . . . . . . . . . . . . 393,980 320,941Furniture and fixtures . . . . . . . . . . . . . . . . . . . . . . . . . . . . . . . . . . . 42,770 36,266Equipment . . . . . . . . . . . . . . . . . . . . . . . . . . . . . . . . . . . . . . . . . . . . 77,409 63,356
522,374 427,120Accumulated depreciation . . . . . . . . . . . . . . . . . . . . . . . . . . . . . . . . (117,634) (86,426)
$ 404,740 $340,694
45

Chipotle Mexican Grill, Inc.
Notes to Consolidated Financial Statements—(Continued)(dollar and share amounts in thousands, unless otherwise specified)
4. Accrued Liabilities
Accrued liabilities consisted were as follows:
December 31
2006 2005
Gift card liability . . . . . . . . . . . . . . . . . . . . . . . . . . . . . . . . . . . . . . . $ 6,984 $ 3,733Sales tax payable . . . . . . . . . . . . . . . . . . . . . . . . . . . . . . . . . . . . . . . 4,381 3,666Accrued loss contingency . . . . . . . . . . . . . . . . . . . . . . . . . . . . . . . . 1,212 1,817Due to McDonald’s . . . . . . . . . . . . . . . . . . . . . . . . . . . . . . . . . . . . . 589 1,514Other accrued expenses . . . . . . . . . . . . . . . . . . . . . . . . . . . . . . . . . . 10,111 8,284
$23,277 $19,014
5. Borrowings Under Line of Credit
In October 2006, the Company entered into a revolving line of credit available to support letters of creditissued in the normal course of business. The line of credit has a principal amount of $10,000 and expires inAugust 2007. Borrowings against the line of credit bear interest at the Company’s option at the Prime rate, afixed rate determined by the bank or an adjusted LIBOR rate. As of December 31, 2006, there were noborrowings outstanding however, there were two letters of credit issued for an aggregate amount of $3,312 andexpire in November 2007.
6. Income Taxes
Prior to the initial public offering, the Company’s results of operations were included in the consolidatedfederal income tax return and combined or consolidated state income tax returns, where permitted, ofMcDonald’s and its affiliates. The Company continued to be included in some state tax returns of McDonald’suntil McDonald’s ownership percentage decreased below 50% at the time of the Disposition. At all times, theprovision for income taxes is calculated as if the Company filed a separate corporate income tax return on a standalone basis.
The components of the benefit (provision) for income taxes are as follows:
Years ended December 31
2006 2005 2004
Current tax benefit (provision):Federal . . . . . . . . . . . . . . . . . . . . . . . . . . . . . . . . . . $(24,590) $(13,426) $ 7,487State . . . . . . . . . . . . . . . . . . . . . . . . . . . . . . . . . . . . (4,099) (2,115) 1,386
(28,689) (15,541) 8,873
Deferred tax benefit (provision):Federal . . . . . . . . . . . . . . . . . . . . . . . . . . . . . . . . . . 2,263 3,429 (9,647)State . . . . . . . . . . . . . . . . . . . . . . . . . . . . . . . . . . . . (406) (775) (1,838)
1,857 2,654 (11,485)
Valuation allowance . . . . . . . . . . . . . . . . . . . . . . . . . . . . — 20,343 2,612
Total benefit (provision) for income taxes . . . . . . . . . . . $(26,832) $ 7,456 $ —
46

Chipotle Mexican Grill, Inc.
Notes to Consolidated Financial Statements—(Continued)(dollar and share amounts in thousands, unless otherwise specified)
The effective tax rate differs from the statutory tax rates as follows:
Years ended December 31
2006 2005 2004
Statutory U.S. federal income tax rate . . . . . . . . . . . . . . . . . . . . . . . . . . . . . . . . 35.0% 35.0% 35.0%State income tax, net of related federal income tax benefit . . . . . . . . . . . . . . . 4.3 4.8 4.8Meals and entertainment . . . . . . . . . . . . . . . . . . . . . . . . . . . . . . . . . . . . . . . . . . 0.2 0.6 2.1Tax exempt interest income . . . . . . . . . . . . . . . . . . . . . . . . . . . . . . . . . . . . . . . . (0.2) — —Other . . . . . . . . . . . . . . . . . . . . . . . . . . . . . . . . . . . . . . . . . . . . . . . . . . . . . . . . . — 2.2 0.7Valuation allowance . . . . . . . . . . . . . . . . . . . . . . . . . . . . . . . . . . . . . . . . . . . . . — (67.3) (42.6)
Effective income tax rates . . . . . . . . . . . . . . . . . . . . . . . . . . . . . . . . . . . . . . . . . 39.3% (24.7)% 0.0%
Deferred income tax liabilities are taxes the Company expects to pay in future periods. Similarly, deferredincome tax assets are recorded for expected reductions in taxes payable in future periods. Deferred income taxesarise because of the differences in the book and tax bases of certain assets and liabilities. Deferred income taxliabilities and assets consist of the following:
December 31,
2006 2005
Long-term deferred income tax liability:Leasehold improvements, property and equipment . . . . . . . . . . . . . . . . . . . . . . . $ 29,015 $28,627
Total long-term deferred income tax liability . . . . . . . . . . . . . . . . . . . . . . . . . . . 29,015 28,627
Long-term deferred income tax asset:Post-acquisition net operating loss carryforwards . . . . . . . . . . . . . . . . . . . . . . . . — 34,743Deferred rent . . . . . . . . . . . . . . . . . . . . . . . . . . . . . . . . . . . . . . . . . . . . . . . . . . . . 7,986 6,162Separate state net operating loss carryforwards . . . . . . . . . . . . . . . . . . . . . . . . . . 111 471Stock compensation and other employee benefits . . . . . . . . . . . . . . . . . . . . . . . . 2,237 837
Total long-term deferred income tax asset . . . . . . . . . . . . . . . . . . . . . . . . . . . . . 10,334 42,213
Net long-term deferred income tax asset (liability) . . . . . . . . . . . . . . . . . . . . . . . (18,681) 13,586
Current deferred income tax liability:Prepaid assets and other . . . . . . . . . . . . . . . . . . . . . . . . . . . . . . . . . . . . . . . . . . . . 748 296
Total current deferred income tax liability . . . . . . . . . . . . . . . . . . . . . . . . . . . . . 748 296
Current deferred income tax asset:Allowances, reserves and other . . . . . . . . . . . . . . . . . . . . . . . . . . . . . . . . . . . . . . 1,673 975Stock compensation and other employee benefits . . . . . . . . . . . . . . . . . . . . . . . . 5 844AMT tax credit . . . . . . . . . . . . . . . . . . . . . . . . . . . . . . . . . . . . . . . . . . . . . . . . . . . — 823
Total current deferred income tax asset . . . . . . . . . . . . . . . . . . . . . . . . . . . . . . . . 1,678 2,642
Net current deferred tax asset . . . . . . . . . . . . . . . . . . . . . . . . . . . . . . . . . . . . . . . 930 2,346
Total deferred tax asset (liability) . . . . . . . . . . . . . . . . . . . . . . . . . . . . . . . . . . . . $(17,751) $15,932
At the consummation of the Company’s initial public offering, the Company exited McDonald’sconsolidated tax group for federal and some state tax purposes. At the consummation of the Disposition, theCompany exited McDonald’s consolidated tax group for the remaining states. Due to the exit from McDonald’s
47

Chipotle Mexican Grill, Inc.
Notes to Consolidated Financial Statements—(Continued)(dollar and share amounts in thousands, unless otherwise specified)
consolidated federal tax group, the Company eliminated the deferred tax asset related to the post-acquisition netoperating loss carry-forwards (“NOLs”) of $32,859 and alternative minimum tax (“AMT”) credits of $918through equity. As a result, the Company converted to a net long-term deferred tax liability position. There wereno other significant changes to the Company’s deferred tax balances as a result of the tax deconsolidation.
Through December 31, 2004, a valuation allowance had been recorded to offset the deferred tax assets,including those related to the NOLs, net of deferred tax liabilities. During the year ended December 31, 2005, theCompany determined that it was more likely than not that it would realize its deferred tax assets and a valuationallowance was no longer required. When a valuation allowance related to net deferred tax assets resulting froman acquisition is reversed, the related tax benefit reduces goodwill. During the year ended December 31, 2005,the Company released $28,848 of valuation allowance of which $8,505 was attributable to the net deferred taxassets of the Company at the date of McDonald’s majority acquisition of the Company. The related release ofvaluation allowance has been recorded as a reduction of goodwill.
In accordance with the tax allocation agreement between McDonald’s and the Company, which is effectiveany time the Company is included in a consolidated return with McDonald’s, the Company’s tax liability iscomputed on a separate return basis. The Company would pay McDonald’s for its allocated tax liability or if itbenefited from net losses or tax credits of other members of the consolidated tax return. Likewise, McDonald’swould compensate the Company if it had a net operating loss or tax credit during the tax year that is used byother members of McDonald’s consolidated return. To the extent the Company generated taxable income itwould first be allocated to the separate return limitation year (“SRLY”) losses. Once the SRLY losses had eitherbeen fully utilized or expired, the taxable income would be offset against the tax attributes/deferred tax assetspreviously used by McDonald’s.
McDonald’s has used $118,041 of the Company’s losses as a reduction of taxable income in its consolidatedfederal return. McDonald’s use of the Company’s NOLs was recorded as a capital contribution. As ofDecember 31, 2006 the Company recorded the receivable from McDonald’s in other current assets in theconsolidated balance sheet of $8,783 for these unreimbursed tax attributes. The December 31, 2005 balance of$28,195 was reflected in shareholders’ equity in the consolidated balance sheet.
7. Shareholders’ Equity
Common Stock
The consolidated financial statements and related notes reflect retroactive application of the Reclassification(as discussed in Note 1) including the conversion of each of the outstanding shares of preferred stock andcommon stock into one-third share of class B common stock. The restated certification of incorporationauthorizes the issuance of an aggregate 230,000 shares of common stock consisting of 30,000 shares of class Bcommon stock with a $0.01 par value and 200,000 shares of class A common stock with a $0.01 par value. Priorto Disposition, each share of class B common stock was convertible at the option of the shareholder into oneshare of class A common stock, and each share of class B common stock generally also converted into one shareof class A common stock if a transfer of ownership occurred. Shares of class B common stock are no longerconvertible beginning October 12, 2006. Shares of class B common stock participate equally in dividends withshares of class A common stock. Shares of class B and class A common stock generally vote as a single class ofcommon stock. Class B common stock shares have ten votes per share whereas class A common stock shareshave one vote per share, except that for purposes of approving a merger or consolidation, a sale of substantiallyall property or dissolution, each share of both class A and class B will have only one vote.
48

Chipotle Mexican Grill, Inc.
Notes to Consolidated Financial Statements—(Continued)(dollar and share amounts in thousands, unless otherwise specified)
8. Stock Based Compensation
Effective with the Company’s initial public offering the Company adopted the Chipotle Mexican Grill, Inc.2006 Stock Incentive Plan (the “Plan”). Under the Plan, 2,200 shares of class A common stock have beenauthorized and reserved for issuances to eligible employees, of which 1,335 represents shares that wereauthorized for issuance, but not issued under the Plan at December 31, 2006. The Plan is administered by theCompensation Committee of the Board of Directors, which has the authority to select the individuals to whomawards will be granted and to determine when the awards are to be granted, the number of shares to be coveredby each award, the vesting schedule and all other terms and conditions of the awards. The exercise price foroptions granted under the Plan cannot be less than fair market value at the date of grant.
In conjunction with the initial public offering, the Company granted a one-time grant of 774 options topurchase shares of class A common stock to all of its salaried employees. The exercise price of the options wasset at the grant date fair value, the initial public offering price, of $22.00 per share. The options granted vest threeyears from the date of grant and expire after seven years. Compensation expense is generally recognized equallyover the three year vesting period. Compensation expense related to employees eligible to retire and retain fullrights to the awards is recognized over six months which coincides with the notice period. During the year endedDecember 31, 2006, the vesting on 49 options were accelerated upon the termination of two employees whichresulted in additional stock-based compensation expense of $1,115 recognized in the year.
In 2005, the Company granted 153 shares of non-vested class B common stock with a grant-date fair valueof $19.50 per share (a related party contemporaneous valuation) which vest in three equal installments on eachanniversary of the grant date. During the year ended December 31, 2006, 51 shares vested and no shares wereforfeited. Compensation expense is recognized over the vesting period.
The Company granted stock appreciation rights (“SARs”) on 167 shares of common stock of which 18 wereforfeited during 2005. Effective with the Company’s initial public offering, all SARs outstanding as ofJanuary 25, 2006 were converted into options to purchase 149 shares of class A common stock. The options,which have terms consistent with the original SARs, have an exercise price of $22.35 per share, vest three yearsfrom the date of grant (vesting in full in July 2007) and expire five years and six months after the original grantdate. Upon conversion, the options were remeasured to the then fair value. The portion of the incrementalcompensation costs related to service periods that were completed as of the conversion date, of $149, wasrecognized immediately. Until converted, the SARs were accounted for as a liability, and compensation expensewas revalued each reporting period and recognized over the remaining vesting period. The liability was includedin other liabilities in the consolidated balance sheet as of December 31, 2005.
Stock-based compensation, including options, restricted shares and SARs, was $5,293 ($3,218 net of tax) in2006, $2,103 ($1,266 net of tax) in 2005, and $193 ($193 net of tax) in 2004. For the year ended December 31,2006, $100 of stock-based compensation was recognized as capitalized development and is included in property,plant and equipment in the consolidated balance sheet. Unearned compensation as of December 31, 2006 was$3,473 for options and $540 for non-vested stock. The remaining vesting period as of December 31, 2006 forunvested options was between 0.5 and 2.1 years and for non-vested stock was 1.2 years.
49
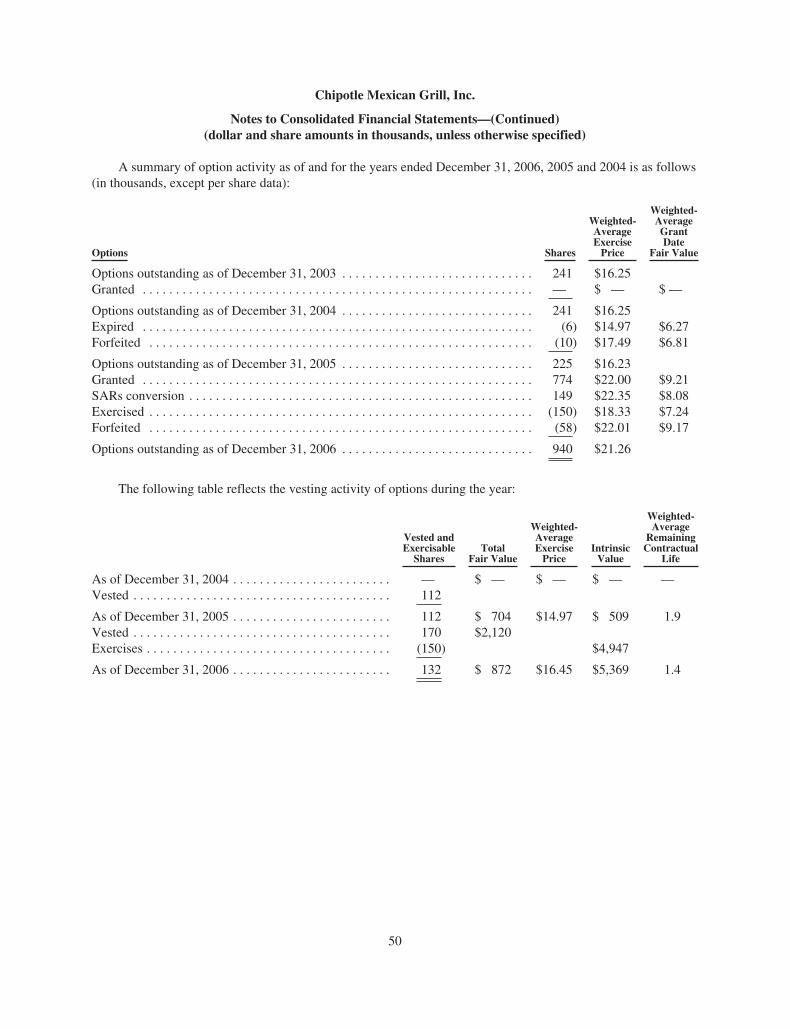
Chipotle Mexican Grill, Inc.
Notes to Consolidated Financial Statements—(Continued)(dollar and share amounts in thousands, unless otherwise specified)
A summary of option activity as of and for the years ended December 31, 2006, 2005 and 2004 is as follows(in thousands, except per share data):
Options Shares
Weighted-AverageExercise
Price
Weighted-AverageGrantDate
Fair Value
Options outstanding as of December 31, 2003 . . . . . . . . . . . . . . . . . . . . . . . . . . . . . 241 $16.25Granted . . . . . . . . . . . . . . . . . . . . . . . . . . . . . . . . . . . . . . . . . . . . . . . . . . . . . . . . . . . — $ — $ —
Options outstanding as of December 31, 2004 . . . . . . . . . . . . . . . . . . . . . . . . . . . . . 241 $16.25Expired . . . . . . . . . . . . . . . . . . . . . . . . . . . . . . . . . . . . . . . . . . . . . . . . . . . . . . . . . . . (6) $14.97 $6.27Forfeited . . . . . . . . . . . . . . . . . . . . . . . . . . . . . . . . . . . . . . . . . . . . . . . . . . . . . . . . . . (10) $17.49 $6.81
Options outstanding as of December 31, 2005 . . . . . . . . . . . . . . . . . . . . . . . . . . . . . 225 $16.23Granted . . . . . . . . . . . . . . . . . . . . . . . . . . . . . . . . . . . . . . . . . . . . . . . . . . . . . . . . . . . 774 $22.00 $9.21SARs conversion . . . . . . . . . . . . . . . . . . . . . . . . . . . . . . . . . . . . . . . . . . . . . . . . . . . . 149 $22.35 $8.08Exercised . . . . . . . . . . . . . . . . . . . . . . . . . . . . . . . . . . . . . . . . . . . . . . . . . . . . . . . . . . (150) $18.33 $7.24Forfeited . . . . . . . . . . . . . . . . . . . . . . . . . . . . . . . . . . . . . . . . . . . . . . . . . . . . . . . . . . (58) $22.01 $9.17
Options outstanding as of December 31, 2006 . . . . . . . . . . . . . . . . . . . . . . . . . . . . . 940 $21.26
The following table reflects the vesting activity of options during the year:
Vested andExercisable
SharesTotal
Fair Value
Weighted-AverageExercise
PriceIntrinsic
Value
Weighted-Average
RemainingContractual
Life
As of December 31, 2004 . . . . . . . . . . . . . . . . . . . . . . . . — $ — $ — $ — —Vested . . . . . . . . . . . . . . . . . . . . . . . . . . . . . . . . . . . . . . . 112
As of December 31, 2005 . . . . . . . . . . . . . . . . . . . . . . . . 112 $ 704 $14.97 $ 509 1.9Vested . . . . . . . . . . . . . . . . . . . . . . . . . . . . . . . . . . . . . . . 170 $2,120Exercises . . . . . . . . . . . . . . . . . . . . . . . . . . . . . . . . . . . . . (150) $4,947
As of December 31, 2006 . . . . . . . . . . . . . . . . . . . . . . . . 132 $ 872 $16.45 $5,369 1.4
50

Chipotle Mexican Grill, Inc.
Notes to Consolidated Financial Statements—(Continued)(dollar and share amounts in thousands, unless otherwise specified)
The following table reflects the assumptions utilized to value the 2006 stock option awards granted, optionmodifications in 2006, the SARs conversion upon the initial public offering and to value the SARs as ofDecember 31, 2005 under FAS 123R using the Black-Scholes valuation model. In accordance with FAS 123(R),upon conversion to options in conjunction with the initial public offering, the SARs were revalued using theassumptions as of that date. In addition, the SARs were revalued as of December 31, 2005 using the assumptionseffective as of that date. The risk-free interest rate is based upon U.S. Treasury Rates for instruments with similarterms. The full term of the SARs was used for the expected life because the SARs were granted to seniormanagement, where turnover is expected to be low, and because the Company expects the SARs to be held thefull term to obtain the maximum benefit. The expected life of the 2006 granted options was derived utilizing theshort-cut method allowed for a vanilla option grant under Staff Accounting Bulletin No. 107, in which theexpected life is assumed to be the average of the vesting period and the contractual life of the option. TheCompany has not paid dividends to date and does not plan to pay dividends in the near future. The volatilityassumptions were derived from the Company’s annual independent stock valuation and historical volatilities ofcompetitors whose shares are traded in the public markets and are adjusted to reflect anticipated behavior specificto the Company.
2006 2005
Risk-free interest rate . . . . . . . . . . . . . . . . . . . . . . . . . . . . . . . . . . . . . . . . . . . 4.4% to 5.3% 3.9%Expected life (years) . . . . . . . . . . . . . . . . . . . . . . . . . . . . . . . . . . . . . . . . . . . . 0.1 to 5.0 5.0Expected dividend yield . . . . . . . . . . . . . . . . . . . . . . . . . . . . . . . . . . . . . . . . . 0.0% 0.0%Volatility . . . . . . . . . . . . . . . . . . . . . . . . . . . . . . . . . . . . . . . . . . . . . . . . . . . . . 40.0% 37.0%
On February 2, 2001, stock option grants were issued to certain employees of the Company under theMcDonald’s Stock Ownership Incentive Plan (the “McDonald’s Plan”). The options became exercisable equallyover four years and have an exercise price of $29.43 per share of McDonald’s stock. At the Disposition, theexpiration of the options was decreased from 10 years from the date of grant to between 30 days and three years,based upon the option holder’s age and years of service with McDonald’s and the Company. The Companyagreed to pay McDonald’s $2,356, which was expensed equally over the four-year vesting period, for its cost ofparticipating in the McDonald’s Plan. As of December 31, 2006 and 2005, $589 and $1,178, respectively of theamount was payable to McDonald’s. The final payment is due in 2008, and is included in the accrued liabilitieson the balance sheet.
9. Employee Benefit Plans
In October 2006, effective upon consummation of the Disposition, the Company adopted the ChipotleMexican Grill 401(k) plan (the “401(k) plan”). Prior to October 2006, eligible Chipotle employees wereparticipants of a 401(k) plan sponsored by McDonald’s. The Company matches 100% of the first 3% of paycontributed by each eligible employee and 50% on the next 2% of pay contributed. Employees become eligible toreceive matching contributions after one year of service with the Company. For the years ended December 31,2006, 2005 and 2004, Company matching contributions totaled approximately $1,070, $828 and $747,respectively.
As a result of the Disposition, the Company adopted the Chipotle Mexican Grill, Inc. SupplementalDeferred Investment Plan (the “Deferred Plan”) which covers eligible employees of the Company. The DeferredPlan is a non-qualified, unfunded plan that allows participants to make tax-deferred contributions that cannot bemade under the 401(k) plan because of Internal Revenue Service limitations. Participant’s earnings oncontributions made to the Deferred Plan fluctuate with the actual earnings and losses of a variety of availableinvestment choices selected by the participant. Total liabilities under the Deferred Plan as of December 31, 2006
51

Chipotle Mexican Grill, Inc.
Notes to Consolidated Financial Statements—(Continued)(dollar and share amounts in thousands, unless otherwise specified)
were $111 and are included in other long-term liabilities in the consolidated balance sheet. The Companymatches 100% of the first 3% of pay contributed by each eligible employee and 50% on the next 2% of paycontributed once the 401K contribution limits are reached. For the year ended December 31, 2006 the Companymade deferred compensation matches of $25 to the Deferred Plan. Prior to October 2006, eligible Chipotleemployees were participants of a deferred compensation plan sponsored by McDonald’s.
10. Related-Party Transactions
Prior to the Disposition, the Company was a majority-owned subsidiary of McDonald’s. Transactionsthrough the date of separation are considered related-party transactions and are discussed below.
The Company previously entered into short-term agreements with McDonald’s to provide the Companywith temporary capital. The Company had a line of credit with McDonald’s, which was for $30,000, due ondemand and expired June 30, 2006. The line of credit bore interest at the prime rate plus 100 basis points (8.25%as of December 31, 2005). The weighted-average interest rate was 6.72% and 5.00% for the years endedDecember 31, 2005 and 2004, respectively. Interest was added to the outstanding principal monthly. For theyears ended December 31, 2005 and 2004, interest expense was $691 and $191, respectively.
The Company previously invested its excess cash under short-term agreements with McDonald’s. Theagreement in place provided for interest at the 30-day Commercial Paper rate plus 50 basis points, was due ondemand and expired April 14, 2005. The Company did not have an agreement in place after April 15, 2005, buthad been operating under the terms of the previous agreement until the Company’s initial public offering inJanuary 2006. Interest was added to the principal monthly. For the years ended December 31, 2005 and 2004,interest income related to this investment was $12 and $205, respectively. As of December 31, 2005, theCompany had $2,248 deposited under this arrangement.
The consolidated statement of income reflects charges from McDonald’s of $8,667, $8,790 and $7,711 forthe years ended December 31, 2006, 2005 and 2004, respectively. These charges primarily related toreimbursements of payroll and related expenses for certain McDonald’s employees that performed services forthe Company, insurance coverage, software maintenance agreements and non-income based taxes. The chargeswere specifically identifiable to the Company. The Company cannot estimate with any reasonable certainty whatthese charges would have been on a stand-alone basis. However, the Company feels that these charges areindicative of what it could have incurred on a stand-alone basis.
The Company leases office and restaurant space from McDonald’s and its affiliates. Rent expense was $276,$404 and $306 for such leases for the years ended December 31, 2006, 2005 and 2004, respectively.
11. Leases
The Company generally operates its restaurants in leased premises. Lease terms for traditional shoppingcenter or building leases generally include combined initial and option terms of 20-25 years. Ground leasesgenerally include combined initial and option terms of 30-50 years. The option terms in each of these leases aretypically in five-year increments. Typically, the lease includes rent escalation terms every five years includingfixed rent escalations, escalations based on inflation indexes, and fair market value adjustments. Certain leasescontain contingent rental provisions based upon the sales of the underlying restaurants. The leases generallyprovide for the payment of common area maintenance, property taxes, insurance and various other use andoccupancy costs by the Company. In addition, the Company is the lessee under non-cancelable leases coveringcertain offices and vehicles.
52

Chipotle Mexican Grill, Inc.
Notes to Consolidated Financial Statements—(Continued)(dollar and share amounts in thousands, unless otherwise specified)
Future minimum lease payments required under existing operating leases as of December 31, 2006 are asfollows:
2007 . . . . . . . . . . . . . . . . . . . . . . . . . . . . . . . . . . . . . . . . . . . . . . . . . . . . . . . . . . . . . . . . . . . $ 61,6412008 . . . . . . . . . . . . . . . . . . . . . . . . . . . . . . . . . . . . . . . . . . . . . . . . . . . . . . . . . . . . . . . . . . . 61,9992009 . . . . . . . . . . . . . . . . . . . . . . . . . . . . . . . . . . . . . . . . . . . . . . . . . . . . . . . . . . . . . . . . . . . 62,4912010 . . . . . . . . . . . . . . . . . . . . . . . . . . . . . . . . . . . . . . . . . . . . . . . . . . . . . . . . . . . . . . . . . . . 62,0012011 . . . . . . . . . . . . . . . . . . . . . . . . . . . . . . . . . . . . . . . . . . . . . . . . . . . . . . . . . . . . . . . . . . . 61,615Thereafter . . . . . . . . . . . . . . . . . . . . . . . . . . . . . . . . . . . . . . . . . . . . . . . . . . . . . . . . . . . . . . 776,477
Total minimum lease payments . . . . . . . . . . . . . . . . . . . . . . . . . . . . . . . . . . . . . . . . . . . . . $1,086,224
Minimum lease payments have not been reduced by minimum sublease rentals of $4,116 due in the futureunder non-cancelable subleases.
Rental expense consists of the following:
For the years endedDecember 31,
2006 2005 2004
Minimum rentals . . . . . . . . . . . . . . . . . . . . . . . . . . . . . . . . . . . . . . . . $50,880 $42,506 $33,201Contingent rentals . . . . . . . . . . . . . . . . . . . . . . . . . . . . . . . . . . . . . . . $ 955 $ 431 $ 284Sublease rental income . . . . . . . . . . . . . . . . . . . . . . . . . . . . . . . . . . . . $ (3,365) $ (2,070) $ (1,632)
During the years ended December 31, 2006 and 2005, the Company entered into one and five sales andleaseback transactions, respectively. These transactions do not qualify for sales leaseback accounting because ofthe Company’s deemed continuing involvement with the buyer-lessor due to fixed price renewal options, whichresults in the transaction being recorded under the financing method. Under the financing method, the assetsremain on the consolidated balance sheet and the proceeds from the transactions are recorded as a financingliability. A portion of lease payments are applied as payments of deemed principal and imputed interest. Thedeemed landlord financing liability was $4,107 as of December 31, 2006. The future minimum lease paymentsfor each of the next five years and thereafter for deemed landlord financing obligations are as follows
2007 . . . . . . . . . . . . . . . . . . . . . . . . . . . . . . . . . . . . . . . . . . . . . . . . . . . . . . . . . . . . . . . . . . . . . . $ 3712008 . . . . . . . . . . . . . . . . . . . . . . . . . . . . . . . . . . . . . . . . . . . . . . . . . . . . . . . . . . . . . . . . . . . . . . 3712009 . . . . . . . . . . . . . . . . . . . . . . . . . . . . . . . . . . . . . . . . . . . . . . . . . . . . . . . . . . . . . . . . . . . . . . 3712010 . . . . . . . . . . . . . . . . . . . . . . . . . . . . . . . . . . . . . . . . . . . . . . . . . . . . . . . . . . . . . . . . . . . . . . 3792011 . . . . . . . . . . . . . . . . . . . . . . . . . . . . . . . . . . . . . . . . . . . . . . . . . . . . . . . . . . . . . . . . . . . . . . 396Thereafter . . . . . . . . . . . . . . . . . . . . . . . . . . . . . . . . . . . . . . . . . . . . . . . . . . . . . . . . . . . . . . . . . 5,868
Total minimum lease payments . . . . . . . . . . . . . . . . . . . . . . . . . . . . . . . . . . . . . . . . . . . . . . . . 7,756Less: Interest implicit in lease . . . . . . . . . . . . . . . . . . . . . . . . . . . . . . . . . . . . . . . . . . . . . . . . . (3,649)
Total deemed landlord financing . . . . . . . . . . . . . . . . . . . . . . . . . . . . . . . . . . . . . . . . . . . . . . . $ 4,107
12. Earnings Per Share
Basic earnings per share is calculated by dividing income available to common shareholders by theweighted-average number of shares of common stock outstanding during each period. Diluted earnings per share(“Diluted EPS”) is calculated using income available to common shareholders divided by diluted weighted-average
53
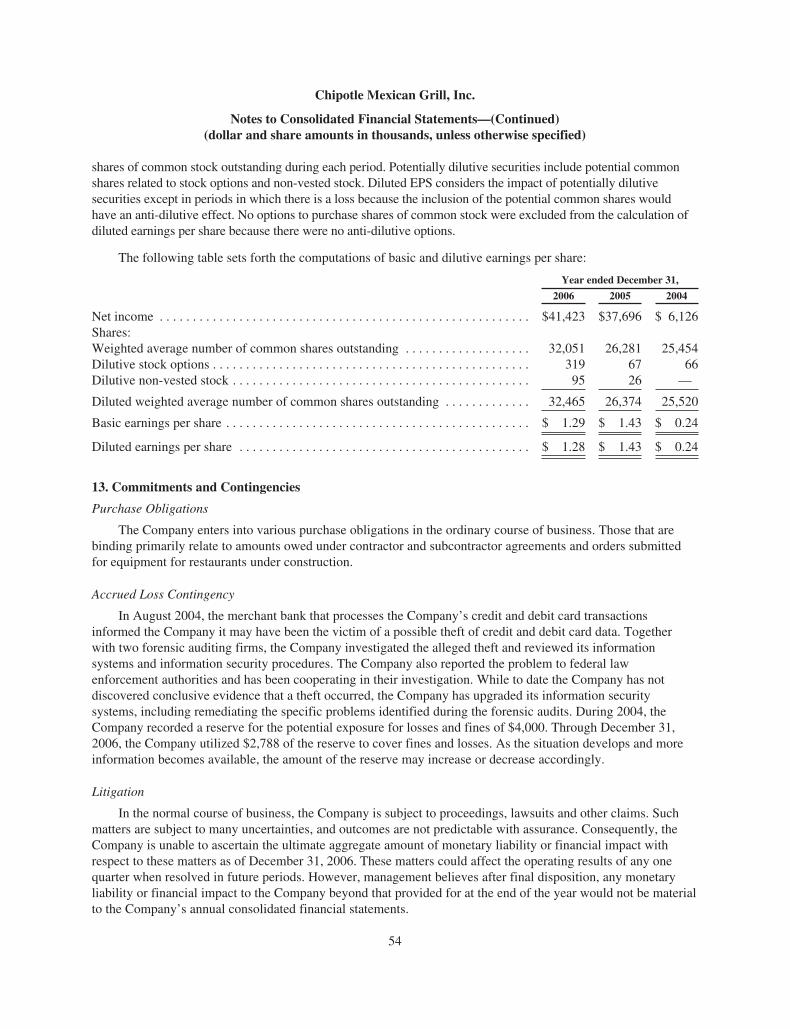
Chipotle Mexican Grill, Inc.
Notes to Consolidated Financial Statements—(Continued)(dollar and share amounts in thousands, unless otherwise specified)
shares of common stock outstanding during each period. Potentially dilutive securities include potential commonshares related to stock options and non-vested stock. Diluted EPS considers the impact of potentially dilutivesecurities except in periods in which there is a loss because the inclusion of the potential common shares wouldhave an anti-dilutive effect. No options to purchase shares of common stock were excluded from the calculation ofdiluted earnings per share because there were no anti-dilutive options.
The following table sets forth the computations of basic and dilutive earnings per share:
Year ended December 31,
2006 2005 2004
Net income . . . . . . . . . . . . . . . . . . . . . . . . . . . . . . . . . . . . . . . . . . . . . . . . . . . . . . . . $41,423 $37,696 $ 6,126Shares:Weighted average number of common shares outstanding . . . . . . . . . . . . . . . . . . . 32,051 26,281 25,454Dilutive stock options . . . . . . . . . . . . . . . . . . . . . . . . . . . . . . . . . . . . . . . . . . . . . . . . 319 67 66Dilutive non-vested stock . . . . . . . . . . . . . . . . . . . . . . . . . . . . . . . . . . . . . . . . . . . . . 95 26 —
Diluted weighted average number of common shares outstanding . . . . . . . . . . . . . 32,465 26,374 25,520
Basic earnings per share . . . . . . . . . . . . . . . . . . . . . . . . . . . . . . . . . . . . . . . . . . . . . . $ 1.29 $ 1.43 $ 0.24
Diluted earnings per share . . . . . . . . . . . . . . . . . . . . . . . . . . . . . . . . . . . . . . . . . . . . $ 1.28 $ 1.43 $ 0.24
13. Commitments and Contingencies
Purchase Obligations
The Company enters into various purchase obligations in the ordinary course of business. Those that arebinding primarily relate to amounts owed under contractor and subcontractor agreements and orders submittedfor equipment for restaurants under construction.
Accrued Loss Contingency
In August 2004, the merchant bank that processes the Company’s credit and debit card transactionsinformed the Company it may have been the victim of a possible theft of credit and debit card data. Togetherwith two forensic auditing firms, the Company investigated the alleged theft and reviewed its informationsystems and information security procedures. The Company also reported the problem to federal lawenforcement authorities and has been cooperating in their investigation. While to date the Company has notdiscovered conclusive evidence that a theft occurred, the Company has upgraded its information securitysystems, including remediating the specific problems identified during the forensic audits. During 2004, theCompany recorded a reserve for the potential exposure for losses and fines of $4,000. Through December 31,2006, the Company utilized $2,788 of the reserve to cover fines and losses. As the situation develops and moreinformation becomes available, the amount of the reserve may increase or decrease accordingly.
Litigation
In the normal course of business, the Company is subject to proceedings, lawsuits and other claims. Suchmatters are subject to many uncertainties, and outcomes are not predictable with assurance. Consequently, theCompany is unable to ascertain the ultimate aggregate amount of monetary liability or financial impact withrespect to these matters as of December 31, 2006. These matters could affect the operating results of any onequarter when resolved in future periods. However, management believes after final disposition, any monetaryliability or financial impact to the Company beyond that provided for at the end of the year would not be materialto the Company’s annual consolidated financial statements.
54
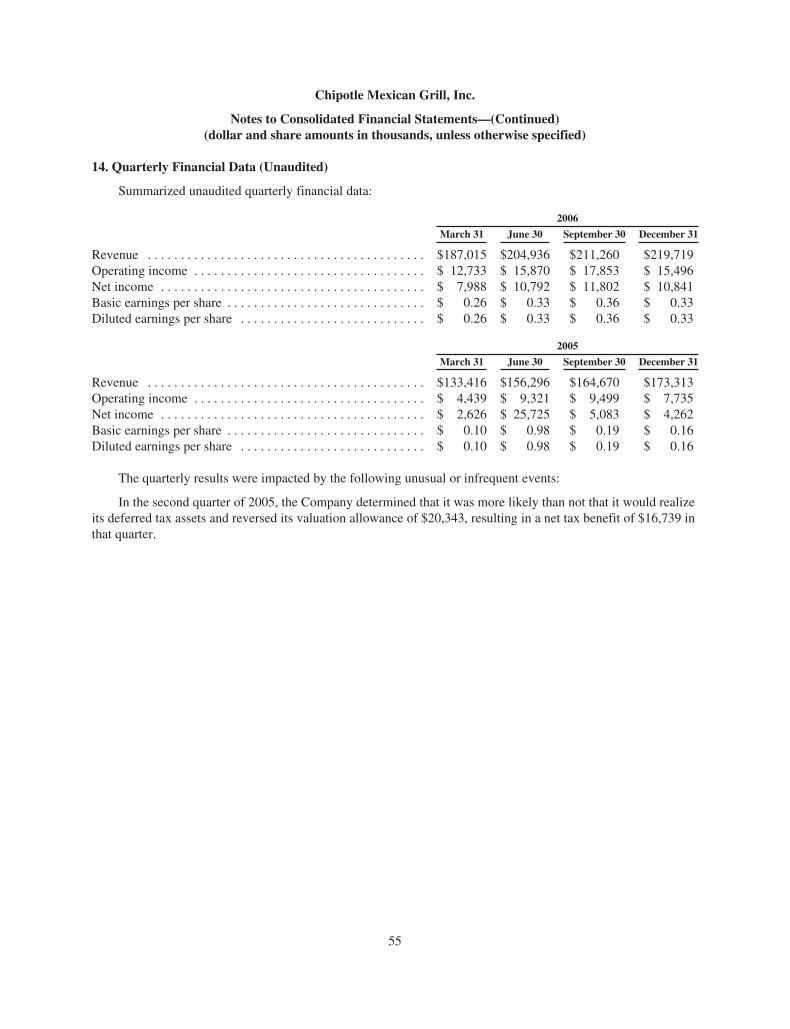
Chipotle Mexican Grill, Inc.
Notes to Consolidated Financial Statements—(Continued)(dollar and share amounts in thousands, unless otherwise specified)
14. Quarterly Financial Data (Unaudited)
Summarized unaudited quarterly financial data:
2006
March 31 June 30 September 30 December 31
Revenue . . . . . . . . . . . . . . . . . . . . . . . . . . . . . . . . . . . . . . . . . . $187,015 $204,936 $211,260 $219,719Operating income . . . . . . . . . . . . . . . . . . . . . . . . . . . . . . . . . . . $ 12,733 $ 15,870 $ 17,853 $ 15,496Net income . . . . . . . . . . . . . . . . . . . . . . . . . . . . . . . . . . . . . . . . $ 7,988 $ 10,792 $ 11,802 $ 10,841Basic earnings per share . . . . . . . . . . . . . . . . . . . . . . . . . . . . . . $ 0.26 $ 0.33 $ 0.36 $ 0.33Diluted earnings per share . . . . . . . . . . . . . . . . . . . . . . . . . . . . $ 0.26 $ 0.33 $ 0.36 $ 0.33
2005
March 31 June 30 September 30 December 31
Revenue . . . . . . . . . . . . . . . . . . . . . . . . . . . . . . . . . . . . . . . . . . $133,416 $156,296 $164,670 $173,313Operating income . . . . . . . . . . . . . . . . . . . . . . . . . . . . . . . . . . . $ 4,439 $ 9,321 $ 9,499 $ 7,735Net income . . . . . . . . . . . . . . . . . . . . . . . . . . . . . . . . . . . . . . . . $ 2,626 $ 25,725 $ 5,083 $ 4,262Basic earnings per share . . . . . . . . . . . . . . . . . . . . . . . . . . . . . . $ 0.10 $ 0.98 $ 0.19 $ 0.16Diluted earnings per share . . . . . . . . . . . . . . . . . . . . . . . . . . . . $ 0.10 $ 0.98 $ 0.19 $ 0.16
The quarterly results were impacted by the following unusual or infrequent events:
In the second quarter of 2005, the Company determined that it was more likely than not that it would realizeits deferred tax assets and reversed its valuation allowance of $20,343, resulting in a net tax benefit of $16,739 inthat quarter.
55

ITEM 9. CHANGES IN AND DISAGREEMENTS WITH ACCOUNTANTS ON ACCOUNTING ANDFINANCIAL DISCLOSURE
None.
ITEM 9A. CONTROLS AND PROCEDURES
We maintain disclosure controls and procedures (as defined in Rule 13a-15(e) promulgated under theSecurities Exchange Act of 1934, as amended (the “Exchange Act”)) that are designed to ensure that informationrequired to be disclosed in Exchange Act reports is recorded, processed, summarized and reported within thetime periods specified in the Securities and Exchange Commission’s rules and forms, and that such informationis accumulated and communicated to our management, including our Chief Executive Officer, President andChief Operating Officer and Chief Finance and Development Officer, as appropriate, to allow timely decisionsregarding required disclosure.
As of December 31, 2006, we carried out an evaluation, under the supervision and with the participation ofour management, including our Chief Executive Officer, President and Chief Operating Officer and ChiefFinance and Development Officer, of the effectiveness of the design and operation of our disclosure controls andprocedures. Based on the foregoing, our Chief Executive Officer, President and Chief Operating Officer andChief Finance and Development Officer concluded that our disclosure controls and procedures were effective asof the end of the period covered by this annual report.
There were no changes during the year ended December 31, 2006 in our internal control over financialreporting (as defined in Rule 13a-15(f) under the Exchange Act) that have materially affected or are reasonablylikely to materially affect our internal control over financial reporting.
ITEM 9B. OTHER INFORMATION
On February 20, 2007, the Compensation Committee of our Board of Directors approved grants to ourexecutive officers of options to purchase shares of our class A common stock, as well as special grants ofrestricted shares of class A common stock, under our 2006 Stock Incentive Plan. The Compensation Committeegranted 80,000 options and 55,000 shares of restricted stock to Mr. Ells, 40,000 options and 30,000 shares ofrestricted stock to Mr. Moran, 25,000 options and 20,000 shares of restricted stock to Mr. Hartung, and 20,000options and 15,000 shares of restricted stock to Mr. Wilner.
The stock options have an exercise price of $63.89 per share, the closing market price of our class Acommon stock on the grant date, and include a three-year vesting period and seven-year term. No options vestprior to the third anniversary of the grant, subject to possible acceleration of vesting in certain circumstances.The restricted stock grants were made as a special incentive award to reward our executive officers forextraordinary performance during 2006, including execution of our successful initial public offering andcompletion of our separation from McDonald’s, while still delivering outstanding financial and operating resultTerms of the grants include vesting in two equal installments on the second and third anniversary of the date ofgrant. No shares of restricted stock vest prior to the second anniversary of the grant, subject to possibleacceleration of vesting in certain circumstances. The full terms of these grants are set forth in the forms of StockOption Agreement and Restricted Stock Agreement, and in the 2006 Stock Incentive Plan, as amended, all ofwhich are filed as exhibits to this Annual Report on Form 10-K.
The Compensation Committee has also approved the payment of performance-based bonuses to ourexecutive officers under our 2006 Cash Incentive Plan, based on our achievement in 2006 against performancetargets established by the Compensation Committee in early 2006. The Compensation Committee also approvednew base salaries to be paid to the executive officers beginning in March 2007. The committee approved a 2006bonus payment to Mr. Ells of $741,000, and set Mr. Ells’s 2007 base salary at $600,000; approved a 2006 bonuspayment to Mr. Moran of $507,000, and set Mr. Moran’s 2007 base salary at $450,000; approved a 2006 bonuspayment to Mr. Hartung of $320,731, and set Mr. Hartung’s 2007 base salary at $350,000; and approved a 2006bonus payment to Mr. Wilner of $251,889, and set Mr. Wilner’s 2007 base salary at $285,000.
56
Also on February 20, 2007, Steve Ells, our Chairman and Chief Executive Officer, adopted a sales plandesigned to comply with Rule 10b5-1 under the Exchange Act. The sales plan, which Mr. Ells adopted incompliance with restrictions imposed by our Insider Trading Policy, is intended to facilitate the diversification ofMr. Ells’s personal assets. The plan provides for sales from time to time of shares of class B common stockowned by Mr. Ells, with the timing of and number of shares to be sold in each transaction dependent upon themarket price of our class B common stock on specified days. Total sales on Mr. Ells’s behalf under the sales planare limited to an aggregate of 150,000 shares. In the event all of the shares subject to the sales plan are sold,Mr. Ells would continue to beneficially own 755,050 shares of our class B common stock and 99,933 shares ofour class A common stock, including the unvested shares of restricted stock granted to Mr. Ells as describedabove.
PART III
ITEM 10. DIRECTORS AND EXECUTIVE OFFICERS OF THE REGISTRANT
Incorporated by reference from the definitive proxy statement for our 2007 annual meeting of shareholders,which will be filed no later than 120 days after December 31, 2006.
ITEM 11. EXECUTIVE COMPENSATION
Incorporated by reference from the definitive proxy statement for our 2007 annual meeting of shareholders,which will be filed no later than 120 days after December 31, 2006.
ITEM 12. SECURITY OWNERSHIP OF CERTAIN BENEFICIAL OWNERS AND MANAGEMENTAND RELATED STOCKHOLDER MATTERS
Incorporated by reference from the definitive proxy statement for our 2007 annual meeting of shareholders,which will be filed no later than 120 days after December 31, 2006.
ITEM 13. CERTAIN RELATIONSHIPS AND RELATED PARTY TRANSACTIONS
Incorporated by reference from the definitive proxy statement for our 2007 annual meeting of shareholders,which will be filed no later than 120 days after December 31, 2006.
ITEM 14. PRINCIPAL ACCOUNTANT FEES AND SERVICES
Incorporated by reference from the definitive proxy statement for our 2007 annual meeting of shareholders,which will be filed no later than 120 days after December 31, 2006.
PART IV
ITEM 15. EXHIBITS AND FINANCIAL STATEMENT SCHEDULES
1. All Financial statements
Consolidated financial statements filed as part of this report are listed under Item 8. “Financial Statementsand Supplementary Data.”
2. Financial statement schedules
No schedules are required because either the required information is not present or is not present in amountssufficient to require submission of the schedule, or because the information required is included in theconsolidated financial statements or the notes thereto.
3. Exhibits
The exhibits listed on the accompanying Exhibit Index are filed or incorporated by reference as part of thisreport.
57

SIGNATURES
Pursuant to the requirements of Section 13 or 15(d) of the Securities Exchange Act of 1934, the registranthas duly caused this report to be signed on its behalf by the undersigned, thereunto duly authorized.
CHIPOTLE MEXICAN GRILL, INC.
By: /s/ JOHN R. HARTUNG
Name: John R. HartungTitle: Chief Finance and Development Officer
Date: February 22, 2007
KNOW ALL PERSONS BY THESE PRESENTS, that each person whose signature appears belowconstitutes and appoints Steve Ells, Montgomery Moran and John Hartung, and each of them, his or her true andlawful attorneys-in-fact, each with full power of substitution, for him or her in any and all capacities, to sign anyamendments to this report on Form 10-K and to file the same, with exhibits thereto and other documents inconnection therewith, with the Securities and Exchange Commission, hereby ratifying and confirming all thateach of said attorneys-in-fact or their substitute or substitutes may do or cause to be done by virtue hereof.Pursuant to the requirements of the Securities Exchange Act of 1934, this report has been signed below by thefollowing persons on behalf of the registrant and in the capacities and on the dates indicated.
Signature Date Title
/s/ STEVE ELLS
Steve Ells
February 22, 2007 Chief Executive Officer and Chairmanof the Board of Directors (principalexecutive officer)
/s/ MONTGOMERY F. MORAN
Montgomery F. Moran
February 22, 2007 President, Chief Operating Officer andDirector (principal executive officer)
/s/ JOHN R. HARTUNG
John R. Hartung
February 22, 2007 Chief Finance and DevelopmentOfficer (principal financial officer)
/s/ ROBIN S. ANDERSON
Robin S. Anderson
February 22, 2007 Executive Director and Controller(principal accounting officer)
/s/ ALBERT S. BALDOCCHI
Albert S. Baldocchi
February 22, 2007 Director
/s/ JOHN S. CHARLESWORTH
John S. Charlesworth
February 19, 2007 Director
/s/ PATRICK J. FLYNN
Patrick J. Flynn
February 21, 2007 Director
/s/ DARLENE J. FRIEDMAN
Darlene J. Friedman
February 21, 2007 Director
58

Exhibit Index
ExhibitNumber Description of Exhibit
3.1 Amended and Restated Certificate of Incorporation. (1)
3.2 Restated Bylaws. (1)
4.1 Form of Stock Certificate for Class A Common and Class B Common Shares. (2)
10.1 † Chipotle Executive Stock Option Plan. (3)
10.2 † Chipotle Stock Appreciation Rights Plan. (3)
10.3 † Chipotle 2006 Cash Incentive Plan. (4)
10.4 † Chipotle 2006 Stock Incentive Plan, including the form of 2006 Option Agreement and form ofOption Agreement for converted SARs. (4)
10.4.1 † Amendment No. 1 to Chipotle 2006 Stock Incentive Plan.
10.4.2 † Form of Stock Option Agreement.
10.4.3 † Form of Restricted Stock Agreement.
10.5 † Restricted Stock Award Agreement between Chipotle Mexican Grill, Inc. and MontgomeryF. Moran. (4)
10.6 Services Agreement dated January 31, 2006 between Chipotle Mexican Grill, Inc. and McDonald’sCorporation, including Addendum to Services Agreement dated June 30, 2006 and notice oftermination of certain services dated June 30, 2006. (5)
10.7 Amended and Restated Registration Rights Agreement dated January 31, 2006 among ChipotleMexican Grill, Inc., McDonald’s Corporation and certain shareholders. (1)
10.8 Underwriting Agreement dated May 18, 2006 among Chipotle Mexican Grill, Inc., Morgan Stanley& Co. Incorporated, Cowen and Company, LLC, McDonald’s Ventures, LLC, McDonald’sCorporation and certain other selling shareholders. (6)
10.9 Separation Agreement dated September 7, 2006 between Chipotle Mexican Grill, Inc. andMcDonald’s Corporation. (7)
10.10 † Summary of Director Compensation. (1)
10.11 † Chipotle Mexican Grill, Inc. Supplemental Deferred Investment Plan
21.1 Subsidiaries of Chipotle Mexican Grill, Inc. (3)
23.1 Consent of Ernst & Young LLP (as the independent registered public accounting firm of Chipotle).
24.1 Power of Attorney (included on signature page of this Registration Statement).
31.1 Certification of Chief Executive Officer of Chipotle Mexican Grill, Inc. pursuant to Section 302 ofthe Sarbanes-Oxley Act of 2002.
31.2 Certification of President and Chief Operating Officer of Chipotle Mexican Grill, Inc. pursuant toSection 302 of the Sarbanes-Oxley Act of 2002.
31.3 Certification of Chief Finance and Development Officer of Chipotle Mexican Grill, Inc. pursuant toSection 302 of the Sarbanes-Oxley Act of 2002.
32.1 Certification of Chief Executive Officer, President and Chief Operating Officer and Chief Financeand Development Officer of Chipotle Mexican Grill, Inc. pursuant to Section 906 of the Sarbanes-Oxley Act of 2002.
59

†— denotes management contract or compensatory plan or arrangement.(1) Incorporated by reference to Chipotle Mexican Grill, Inc.’s Annual Report on Form 10-K for the year ended
December 31, 2005, filed with the Securities and Exchange Commission on March 17, 2006 (FileNo. 001-32731).
(2) Incorporated by reference to Chipotle Mexican Grill, Inc.’s Quarterly Report on Form 10-Q for the quarterended September 30, 2006, filed with the Securities and Exchange Commission on November 1, 2006 (FileNo. 001-32731).
(3) Incorporated by reference to Chipotle Mexican Grill, Inc.’s Registration Statement on Form S-1 (FileNo. 333-129221) filed with the Securities Exchange Commission on October 25, 2005.
(4) Incorporated by reference to Amendment No. 3 to Chipotle Mexican Grill, Inc.’s Registration Statement onForm S-1 (File No. 333-129221) filed with the Securities and Exchange Commission on January 10, 2006.
(5) Incorporated by reference to Chipotle Mexican Grill, Inc.’s Quarterly Report on Form 10-Q for the quarterended June 30, 2006, filed with the Securities and Exchange Commission on August 8, 2006 (FileNo. 001-32731).
(6) Incorporated by reference to Chipotle Mexican Grill, Inc.’s Current Report on Form 8-K (FileNo. 001-32731) filed with the Securities Exchange Commission on May 23, 2006.
(7) Incorporated by reference to Chipotle Mexican Grill, Inc.’s Registration Statement on Form S-4 (FileNo. 333-137177) filed with the Securities Exchange Commission on September 8, 2006.
60

MANAGEMENT TEAM
Steve Ells Founder, Chairman & Chief Executive Officer
Monty Moran President & Chief Operating Officer
Jack Hartung Chief Finance and Development Officer
Bob Wilner Chief Administrative Officer
BOARD OF DIRECTORS
Steve Ells Chairman of the Board
Montgomery F. Moran Director
President and Chief Operating Officer of Chipotle Mexican Grill, Inc.
Albert S. Baldocchi Director
Independent Financial Consultant and Strategic Advisor
John S. Charlesworth Director
President, Midwest Division, McDonald’s Corp. (retired)
Neil W. Flanzraich Director
Former Vice Chairman and President, IVAX Corporation; Private Investor
Patrick J. Flynn Director
Executive Vice President, Strategic Planning and Acquisitions, McDonald’s Corp. (retired)
Darlene J. Friedman Director
Senior Vice President, Human Resources, Syntex Corp. (retired)
STOCK EXCHANGE LISTING
New York Stock Exchange Class A Symbol: CMG
Class B Symbol: CMG.B
AUDITORS
Ernst & Young LLP Denver, Colorado
STOCK TRANSFER AGENT
By mail: Computershare Investor Services, LLC.
2 North LaSalle Street Chicago, IL 60602
By phone: 1-312-360-5496
Online:www.computershare.com
SEC Form 10-KStockholders may obtain copies of Chipotle’s annual report on Form 10-K for the year ended December 31, 2006 (exclusive of exhibits), including our audited financial statements,
at no cost by writing to the Corporate Secretary, Chipotle Mexican Grill, Inc., 1543 Wazee Street, Suite 200, Denver, CO 80202.
Certifications
and Chief Finance and Development Officer regarding our financial statements, disclosure controls and procedures and other matters.Chipotle has filed as exhibits to its Annual Report on Form 10-K with the SEC certifications of our Chief Executive Officer, President and Chief Operating Officer,
Our Chief Executive Officer has also submitted to the NYSE a certification that he is not aware of any violations by Chipotle of the NYSE corporate governance listing standards.


