2005 RME - Executive Marketing1 Executive Marketing: Developing a Marketing Plan Scott A. Mickey.
27
2005 RME - Executive Mark eting 1 Executive Marketing: Developing a Marketing Plan Scott A. Mickey
-
Upload
aldous-pierce -
Category
Documents
-
view
268 -
download
13
Transcript of 2005 RME - Executive Marketing1 Executive Marketing: Developing a Marketing Plan Scott A. Mickey.
2005 RME - Executive Marketing
1
Executive Marketing:Developing a Marketing
Plan
Scott A. Mickey
2005 RME - Executive Marketing
2
Seminar Purpose
Develop a written marketing plan based on producer’s financial needs Operating costs Cash flow requirements Planting intentions

2005 RME - Executive Marketing
3
Seminar Topics & Tools
How Healthy is your Business Fundamental Analysis Comparing Crop Insurance Products Marketing Simulation Game Target Price Analysis Putting the Plan on Paper Quarterly Updates
2005 RME - Executive Marketing
4
How Healthy is Your Business
Assess the financial condition of the business
Recent Balance Sheet
2005 RME - Executive Marketing
5
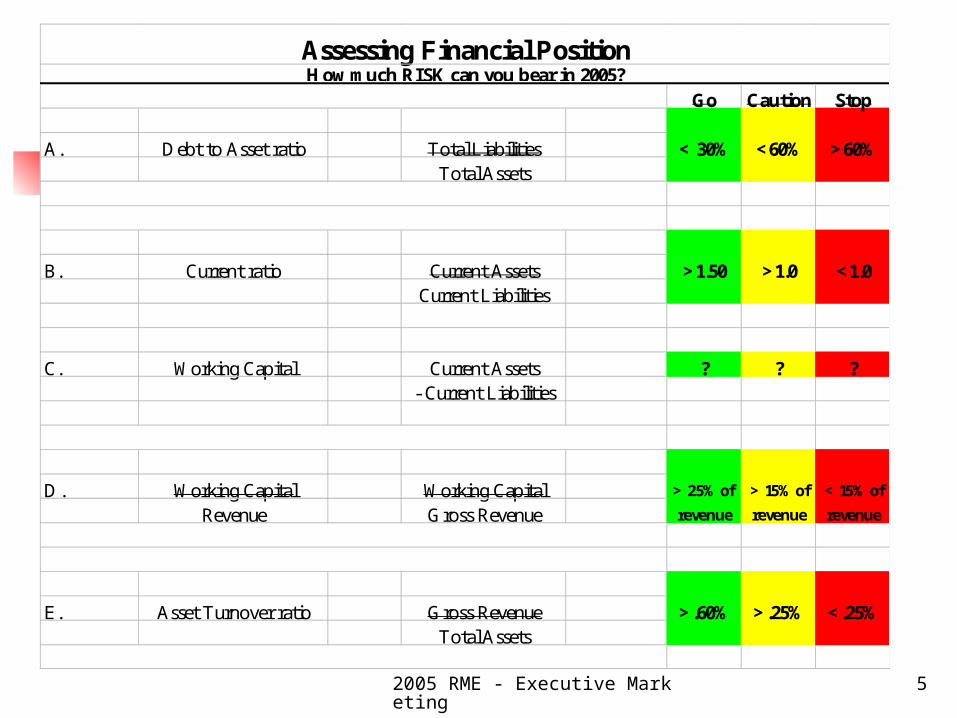
Assessing Financial Position
Go Caution Stop
A. Debt to Asset ratio Total Liabilities < 30% <60% >60%Total Assets
B. Current ratio Current Assets >1.50 >1.0 <1.0Current Liabilities
C. Working Capital Current Assets ? ? ?- Current Liabilities
D. Working Capital Working Capital > 25% of > 15% of < 15% of
Revenue Gross Revenue revenue revenue revenue
E. Asset Turnover ratio Gross Revenue >.60% >.25% <.25%Total Assets
How much RISK can you bear in 2005?
2005 RME - Executive Marketing
6
Assessing Financial Position
1. What is the ratio telling us?2. How has it changed from last
year?3. Will it impact marketing
decisions?
2005 RME - Executive Marketing
7
Fundamental Analysis
Where prices may go When
2005 RME - Executive Marketing
8
Fundamental Analysis
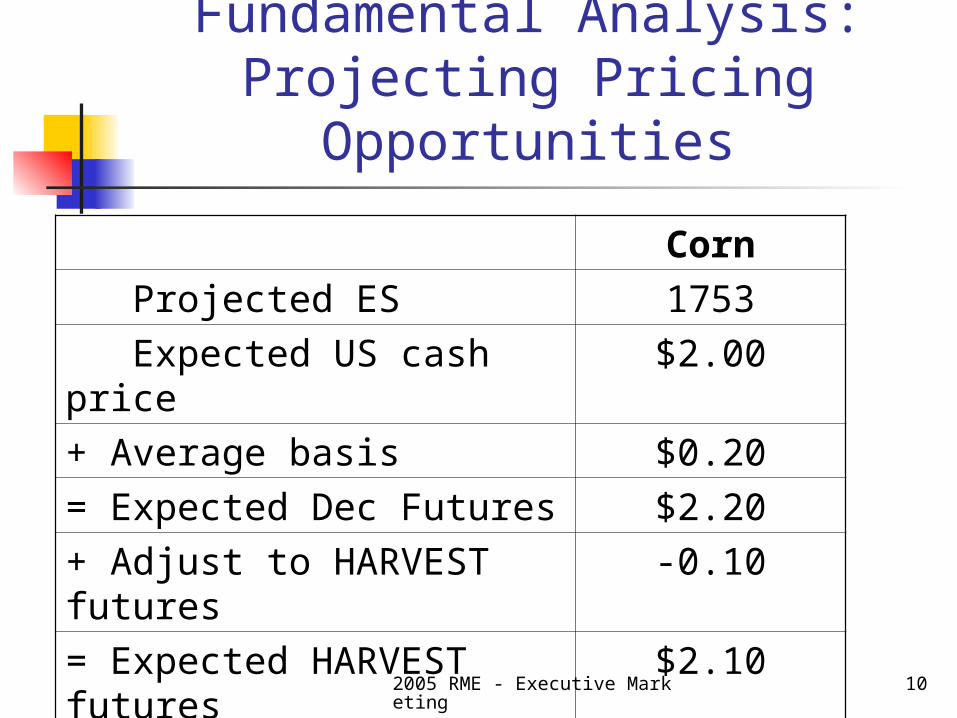
1. Project Ending Stocks2. Estimate US average cash price3. Add average US basis to cash price4. Determines expected Futures price5. Adjust to HARVEST futures price6. Evaluate years with similar ending
stocks
2005 RME - Executive Marketing
9
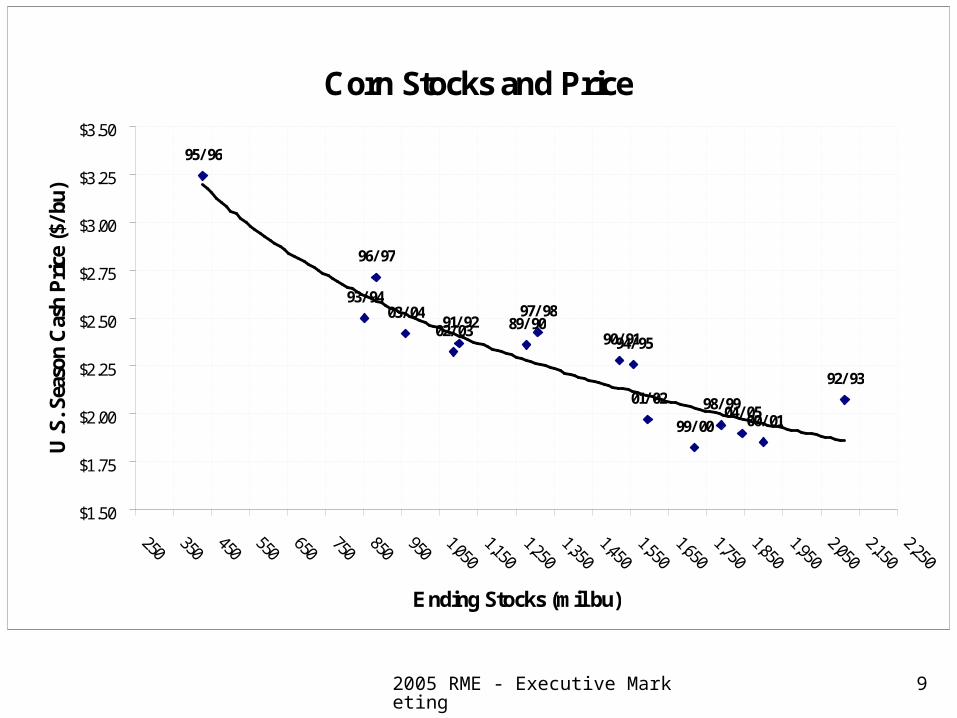
Corn Stocks and Price
89/ 9090/ 91
91/ 92
92/ 93
93/ 94
94/ 95
95/ 96
96/ 97
97/ 98
98/ 9999/ 00 00/ 01
01/ 02
02/ 0303/ 04
04/ 05
$1.50
$1.75
$2.00
$2.25
$2.50
$2.75
$3.00
$3.25
$3.50
250 350
450 550
650 750
850 950
1,050
1,150
1,250
1,350
1,450
1,550
1,650
1,750
1,850
1,950
2,050
2,150
2,250
Ending Stocks (mil bu)
U.S
. Sea
son
Cas
h Price
($/
bu)
2005 RME - Executive Marketing
10
Fundamental Analysis:Projecting Pricing
Opportunities
Corn
Projected ES 1753
Expected US cash price $2.00
+ Average basis $0.20
= Expected Dec Futures $2.20
+ Adjust to HARVEST futures
-0.10
= Expected HARVEST futures
$2.10
2005 RME - Executive Marketing
11
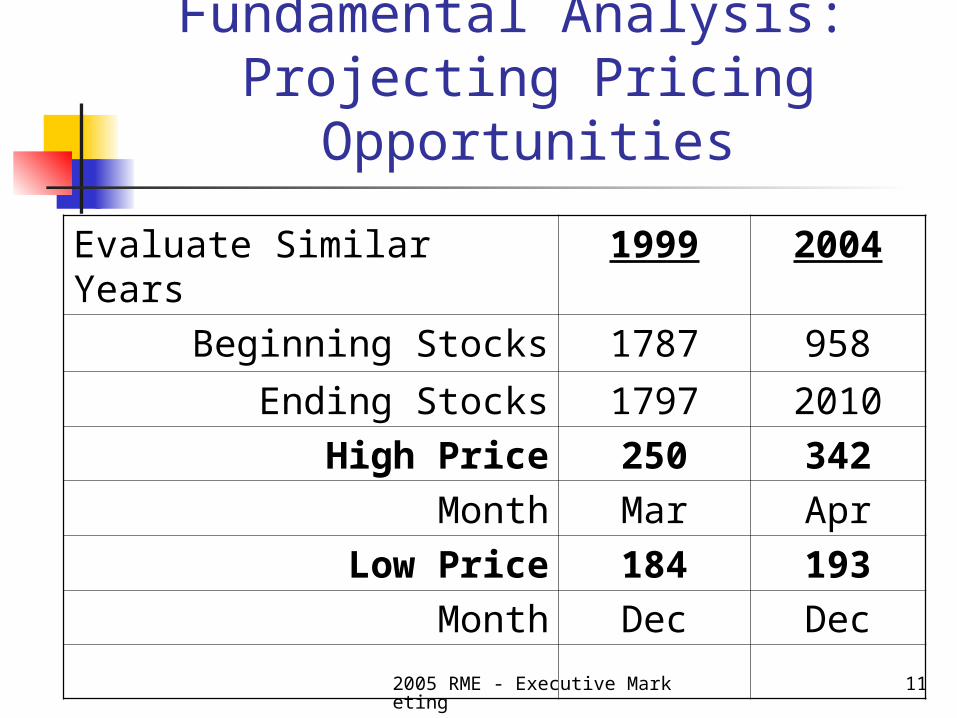
Fundamental Analysis: Projecting Pricing
Opportunities
Evaluate Similar Years 1999 2004
Beginning Stocks 1787 958
Ending Stocks 1797 2010
High Price 250 342
Month Mar Apr
Low Price 184 193
Month Dec Dec
2005 RME - Executive Marketing
12
Crop Insurance
Understand available products Production guarantees Revenue guarantees
Use CRC for Market Trades
2005 RME - Executive Marketing
13
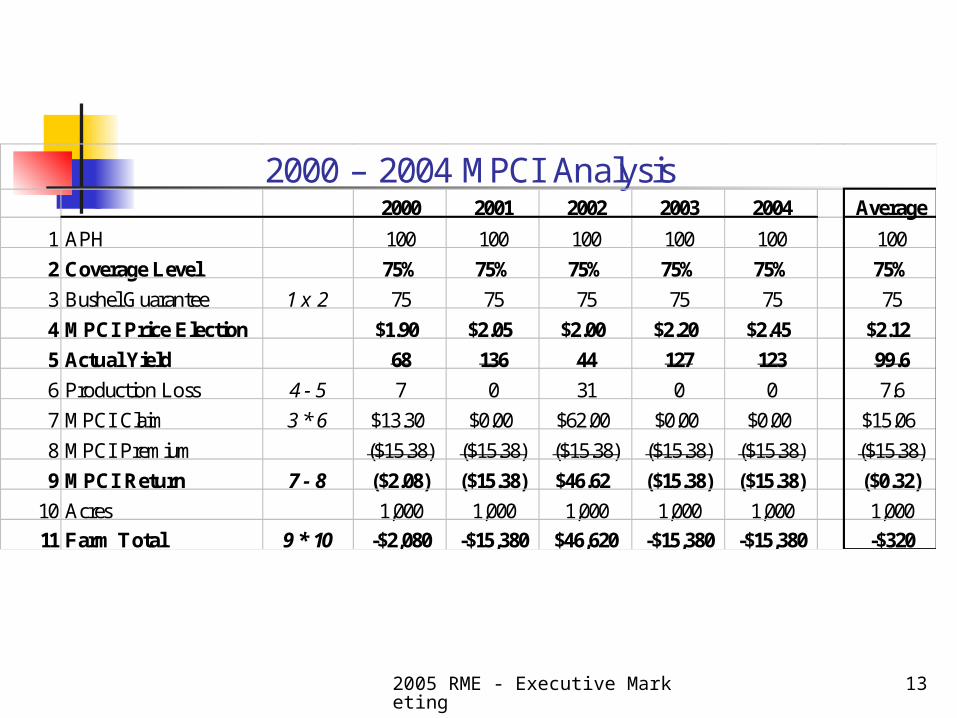
2000 – 2004 MPCI Analysis2000 2001 2002 2003 2004 Average
1 APH 100 100 100 100 100 100
2Coverage Level 75% 75% 75% 75% 75% 75%3 Bushel Guarantee 1 x 2 75 75 75 75 75 75
4MPCI Price Election $1.90 $2.05 $2.00 $2.20 $2.45 $2.12
5Actual Yield 68 136 44 127 123 99.66 Production Loss 4 - 5 7 0 31 0 0 7.6
7 MPCI Claim 3 * 6 $13.30 $0.00 $62.00 $0.00 $0.00 $15.06
8 MPCI Premium ($15.38) ($15.38) ($15.38) ($15.38) ($15.38) ($15.38)
9MPCI Return 7 - 8 ($2.08) ($15.38) $46.62 ($15.38) ($15.38) ($0.32)10 Acres 1,000 1,000 1,000 1,000 1,000 1,00011Farm Total 9 * 10 -$2,080 -$15,380 $46,620 -$15,380 -$15,380 -$320
2005 RME - Executive Marketing
14
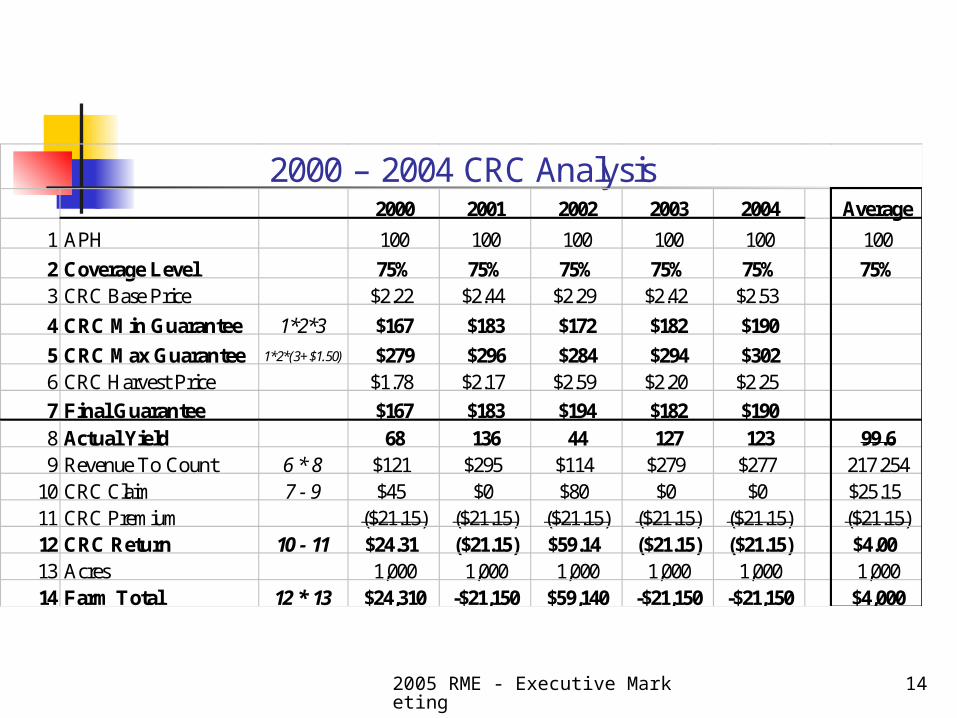
2000 – 2004 CRC Analysis2000 2001 2002 2003 2004 Average
1 APH 100 100 100 100 100 100
2Coverage Level 75% 75% 75% 75% 75% 75%3 CRC Base Price $2.22 $2.44 $2.29 $2.42 $2.53
4CRC Min Guarantee 1*2*3 $167 $183 $172 $182 $190
5CRC Max Guarantee 1*2*(3+$1.50) $279 $296 $284 $294 $3026 CRC Harvest Price $1.78 $2.17 $2.59 $2.20 $2.257Final Guarantee $167 $183 $194 $182 $1908 Actual Yield 68 136 44 127 123 99.69 Revenue To Count 6 * 8 $121 $295 $114 $279 $277 217.254
10 CRC Claim 7 - 9 $45 $0 $80 $0 $0 $25.1511 CRC Premium ($21.15) ($21.15) ($21.15) ($21.15) ($21.15) ($21.15)12CRC Return 10 - 11 $24.31 ($21.15) $59.14 ($21.15) ($21.15) $4.0013 Acres 1,000 1,000 1,000 1,000 1,000 1,00014Farm Total 12 * 13 $24,310 -$21,150 $59,140 -$21,150 -$21,150 $4,000
2005 RME - Executive Marketing
15
Crop Insurance -
Comments Is CRC a better way to go? What about the price in between
the base period and harvest period?
2005 RME - Executive Marketing
16
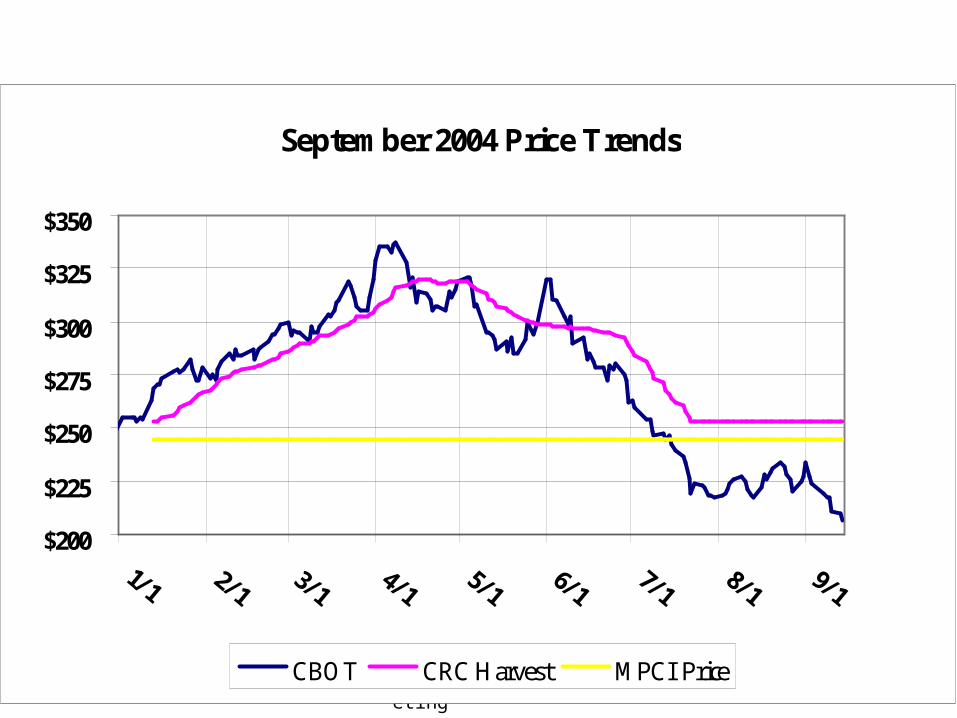
CouldaSeptember 2004 Price Trends
$200
$225
$250
$275
$300
$325
$350
1/1 2/13/1
4/15/1
6/17/1
8/19/1
CBOT CRC Harvest MPCI Price
2005 RME - Executive Marketing
17
Marketing Simulation Game
Dr. Art Barnaby’s corn trading game S/D reports Futures / Options / Cash Crop Insurance
Review of price enhancement strategies
2005 RME - Executive Marketing
18
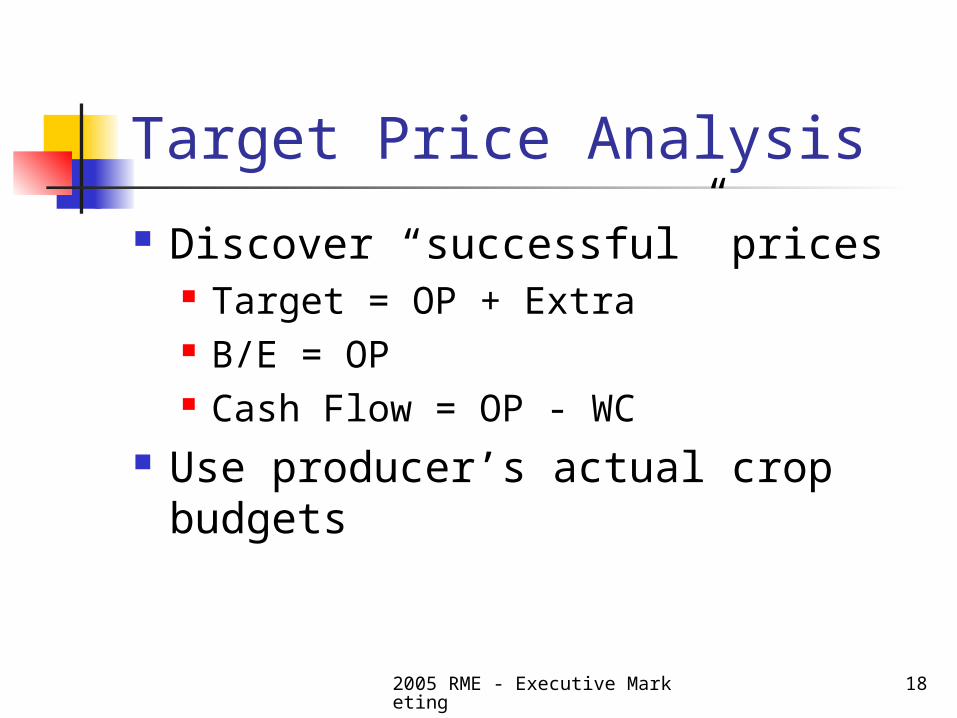
Target Price Analysis
Discover “successful” prices Target = OP + Extra B/E = OP Cash Flow = OP - WC
Use producer’s actual crop budgets
2005 RME - Executive Marketing
19
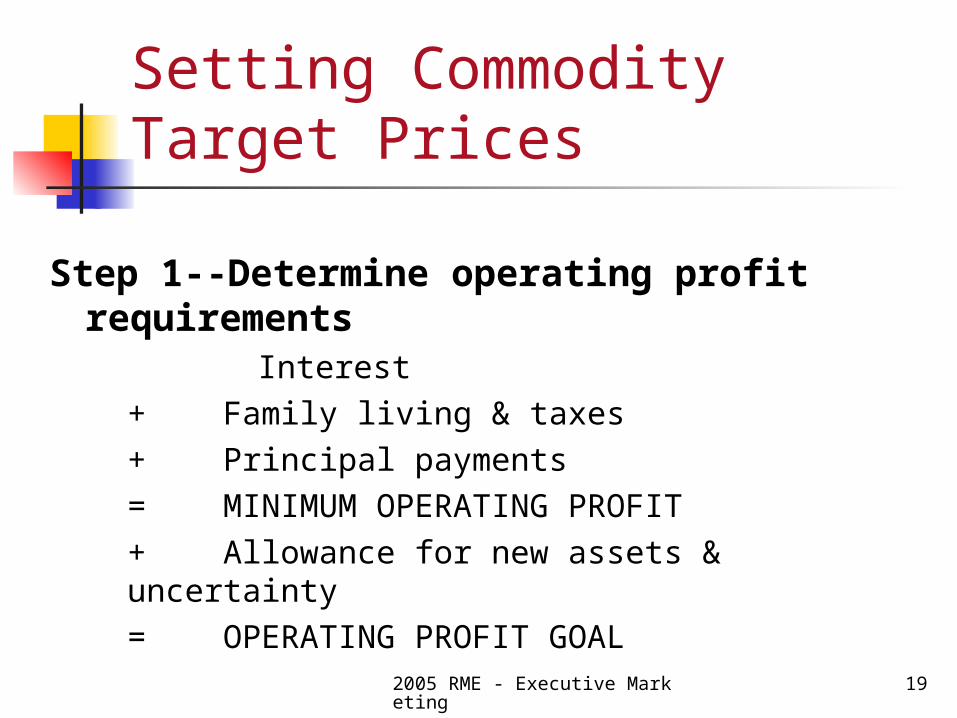
Setting Commodity Target Prices
Step 1--Determine operating profit requirements Interest
+ Family living & taxes
+ Principal payments
= MINIMUM OPERATING PROFIT
+ Allowance for new assets & uncertainty
= OPERATING PROFIT GOAL
2005 RME - Executive Marketing
20
FLOIDFamily Living &
taxes
Operating expenses
Interest
Debt (principal)
2005 RME - Executive Marketing
21
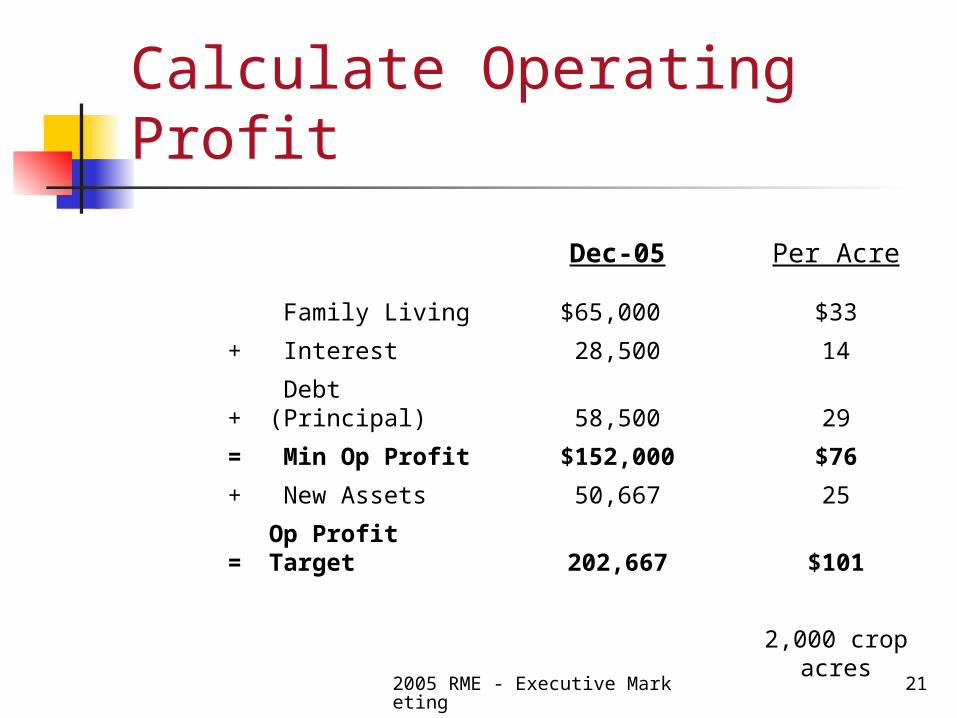
Calculate Operating Profit
Dec-05 Per Acre
Family Living $65,000 $33
+ Interest 28,500 14
+ Debt (Principal) 58,500 29
= Min Op Profit $152,000 $76
+ New Assets 50,667 25
= Op Profit Target 202,667 $101
2,000 crop acres
2005 RME - Executive Marketing
22
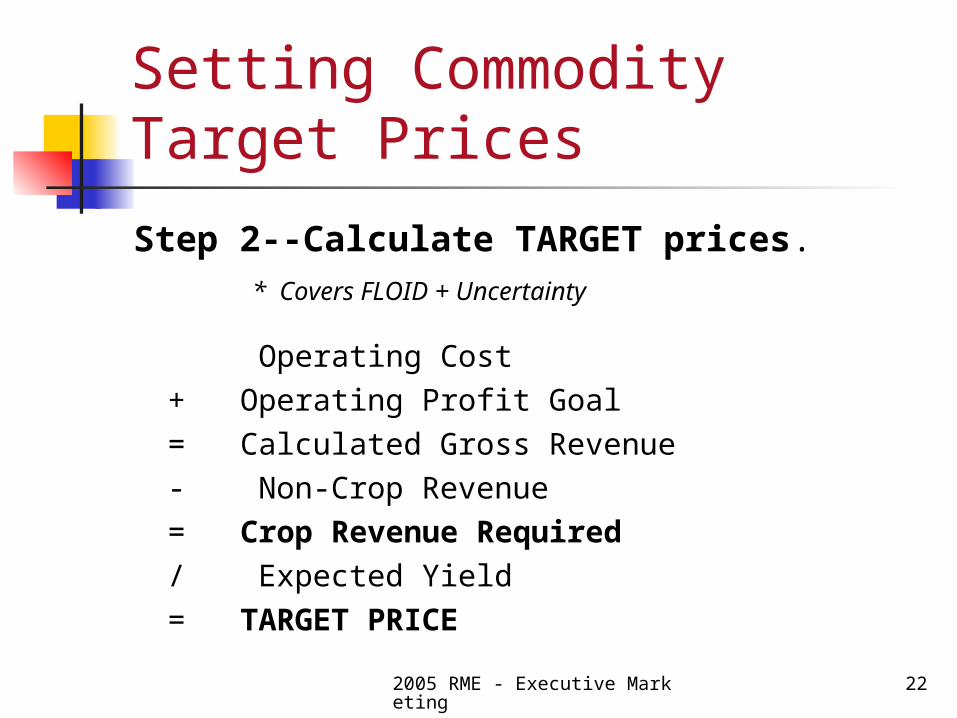
Setting Commodity Target Prices
Step 2--Calculate TARGET prices. * Covers FLOID + Uncertainty
Operating Cost+ Operating Profit Goal= Calculated Gross Revenue- Non-Crop Revenue= Crop Revenue Required/ Expected Yield= TARGET PRICE
2005 RME - Executive Marketing
23
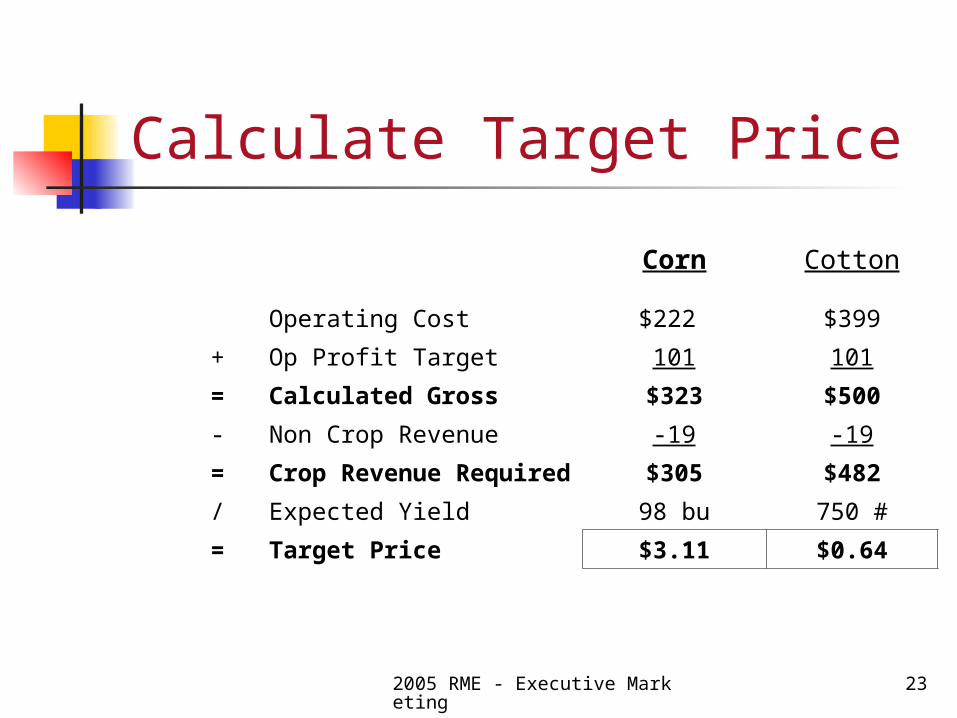
Calculate Target Price
Corn Cotton
Operating Cost $222 $399
+ Op Profit Target 101 101
= Calculated Gross $323 $500
- Non Crop Revenue -19 -19
=Crop Revenue Required $305 $482
/ Expected Yield 98 bu 750 #
= Target Price $3.11 $0.64

2005 RME - Executive Marketing
24
Putting the Plan on Paper
When How What
Quarterly Updates
2005 RME - Executive Marketing
25
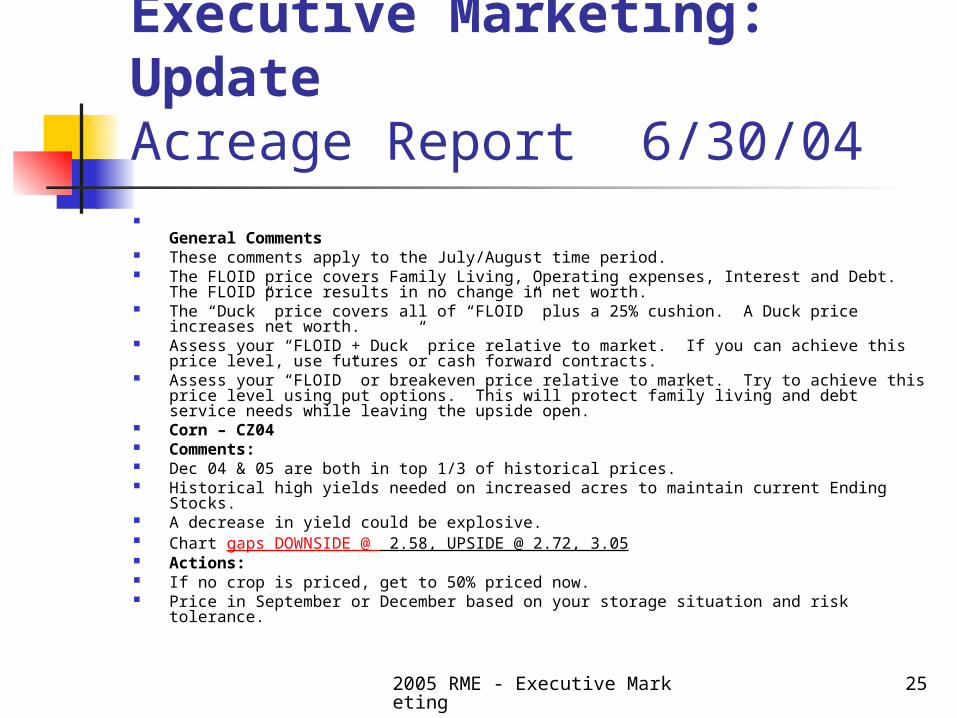
Executive Marketing: UpdateAcreage Report 6/30/04
General Comments These comments apply to the July/August time period. The FLOID price covers Family Living, Operating expenses, Interest and Debt. The FLOID
price results in no change in net worth. The “Duck” price covers all of “FLOID” plus a 25% cushion. A Duck price increases net worth. Assess your “FLOID + Duck” price relative to market. If you can achieve this price level, use
futures or cash forward contracts. Assess your “FLOID” or breakeven price relative to market. Try to achieve this price level
using put options. This will protect family living and debt service needs while leaving the upside open.
Corn – CZ04 Comments: Dec 04 & 05 are both in top 1/3 of historical prices. Historical high yields needed on increased acres to maintain current Ending Stocks. A decrease in yield could be explosive. Chart gaps DOWNSIDE @ 2.58, UPSIDE @ 2.72, 3.05 Actions: If no crop is priced, get to 50% priced now. Price in September or December based on your storage situation and risk tolerance.

Hope is much more than a mood. It involves a commitment to action…What we hope for should be what we are prepared to work for and so bring about, as far as the power lies in us.
John Polkinghorne, physicist, Anglican priest and author of The God of Hope and the End of the World
2005 RME - Executive Marketing
27
Thank You!
Scott [email protected]
PO Box 237Sumter, SC 29151
803 775-4580800 881-7518 fax