2004 Training Seminars DSC 3 Interpreting DSC Data Glass Transition & Melting.
57
2004 Training Seminars DSC 3 Interpreting DSC Data Glass Transition & Melting
-
Upload
sybil-davis -
Category
Documents
-
view
219 -
download
1
Transcript of 2004 Training Seminars DSC 3 Interpreting DSC Data Glass Transition & Melting.

2004 Training SeminarsDSC
3
Interpreting DSC Data
Glass Transition & Melting

Glass Transitions
• The glass transition is a step change in molecular mobility (in the amorphous phase of a sample) that results in a step change in heat capacity
• The material is rigid below the glass transition temperature and rubbery above it. Amorphous materials flow, they do not melt (no DSC melt peak)

Glass Transitions
• The change in heat capacity at the glass transition is a measure of the amount of amorphous phase in the sample
• Enthalpic recovery at the glass transition is a measure of order in the amorphous phase. Annealing or storage at temperatures just below Tg permit development of order as the sample moves towards equilibrium

Heat Flow & Heat Capacity at the Glass Transition
Heat Flow
Heat Capacity
Temperature Below Tg - lower Cp - lower Volume - lower CTE - higher stiffness - higher viscosity - more brittle - lower enthalpy
Glass Transition is Detectable by DSCBecause of a Step-Change in Heat Capacity
-1.0
-0.9
-0.8
-0.7
-0.6
-0.5
-0.4
-0.3
[ –
––
––
· ]
He
at
Flo
w (
mW
)
0.5
1.0
1.5
2.0
He
at
Ca
pa
city (
J/g
/°C
)
70 90 110
Temperature (°C)
Sample: PolystyreneSize: 14.0200 mgMethod: Anneal80Comment: MDSC.3/40@2; After Anneal @ 80øC various times
DSCFile: C:\TA\Data\Len\FictiveTg\PSanneal80.002
Exo Up Universal V3.8A TA Instruments
Polystyrene

Measuring/Reporting Glass Transitions
• The glass transition is always a temperature range• The molecular motion associated with the glass
transition is time dependent. Therefore, Tg increases when heating rate increases or test frequency (MDSC®, DMA, DEA, etc.) increases.
• When reporting Tg, it is necessary to state the test method (DSC, DMA, etc.), experimental conditions (heating rate, sample size, etc.) and how Tg was determined – Midpoint based on ½ Cp or inflection (peak in derivative)

Glass Transition Analysis
Polystyrene 9.67mg 10°C/min

Glass Transition Analysis
Polystyrene 9.67mg 10°C/min

Step Change in Cp at the Glass Transition
% Amorphous = 0.145/0.353= 41%
PET 9.43mg

Aged Epoxy Sample

Effect of Annealing Time on Shape of Tg

Importance of Enthalpic RelaxationIs enthalpic recovery at the glass transition important?
…Sometimes• Glass transition temperature, shape and size provide useful
information about the structure of the amorphous component of the sample.
• This structure, and how it changes with time, is often important to the processing, storage and end-use of a material.
• Enthalpic recovery data can be used to measure and predict changes in structure and other physical properties with time.

Effect of Aging on Amorphous Materials
Temperature
Max TgStorage
timeHMS
Equilibrium Liquid
Equilibrium Glass
KauzmannTemp; Lowest Tg (Entropy of Crystal)
Where H = High relative cooling rateM = Medium relative cooling rateS = Slow relative cooling rate
DecreasesEntropy
DecreasesEnthalpy
DecreasesHeat Capacity
DecreasesCoefficient of Expansion
IncreasesModulus
DecreasesSpecific Volume
Response on S
Physical Property
Entropy
Enthalpy
Coefficient of
Modulus
Specific Volume
Response on Storage Below Tg
Physical Property
H
V

Suggestions for Finding Weak Glass Transitions
• Know your empty-pan baseline• Get as much material in the amorphous state• Cool slowly through the glass transition
region• Heat rapidly through glass transition region• Use MDSC®• Or use Quasi-Isothermal MDSC

Glass Transition Summary
• The glass transition is due to Amorphous material
• The glass transition is the reversible change from a glassy to rubbery state & vice-versa
• DSC detects glass transitions by a step change in Cp

Melting Definitions
• Melting – the process of converting crystalline structure to a liquid amorphous structure
• Thermodynamic Melting Temperature – the temperature where a crystal would melt if it had a perfect structure (large crystal with no defects)
• Metastable Crystals – Crystals that melt at lower temperature due to small size (high surface area) and poor quality (large number of defects)

Definitions (cont.)• Crystal Perfection – the process of small, less perfect
crystals (metastable) melting at a temperature below their thermodynamic melting point and then (re) crystallizing into larger, more perfect crystals that will melt again at a higher temperature
• True Heat Capacity Baseline – – often called the thermodynamic baseline, it is the measured baseline (usually in heat flow rate units of mW) with all crystallization and melting removed…. assumes no interference from other latent heat such as polymerization, cure, evaporation etc. over the crystallization/melting range

Melting of Indium
157.01°C
156.60°C28.50J/g
Indium5.7mg10°C/min
-25
-20
-15
-10
-5
0
He
at
Flo
w (
mW
)
150 155 160 165
Temperature (°C)
Exo Up Universal V4.0B TA Instruments
Peak Temperature
Extrapolated Onset
Temperature
Heat of Fusion
For pure, low molecular weight
materials (mw<500 g/mol) use
Extrapolated Onset as Melting Temperature

Melting of PET
249.70°C
236.15°C52.19J/g
PET6.79mg10°C/min
-7
-6
-5
-4
-3
-2
-1
He
at
Flo
w (
mW
)
200 210 220 230 240 250 260 270
Temperature (°C)
Exo Up Universal V4.0B TA Instruments
Extrapolated Onset
Temperature
Peak Temperature
Heat of Fusion
For polymers, use Peak as Melting Temperature

Comparison of Melting
249.70°C
236.15°C52.19J/g
157.01°C
156.60°C28.50J/g
Indium5.7mg10°C/min
PET6.79mg10°C/min
-25
-20
-15
-10
-5
0
He
at
Flo
w (
mW
)
140 160 180 200 220 240 260 280
Temperature (°C)Exo Up Universal V4.0B TA Instruments

Analyzing/Interpreting Results
• It is often difficult to select limits for integrating melting peaks– Integration should occur between two points on
the heat capacity baseline– Heat capacity baselines for difficult samples can
usually be determined by MDSC® or by comparing experiments performed at different heating rates
– Sharp melting peaks that have a large shift in the heat capacity baseline can be integrated with a sigmoidal baseline

Baseline Due to Cp

Baseline Type

DSC of Polymer Blend
Where is the Cp baseline?
More on this sample in the MDSC® section

Is it a melt?YES!
Onset shifts by only 0.3°C

Is it a Melt?NO!
Onset shifts by almost 30°C

Effect of Heating Rate on Melting
10°C/min
50°C/min
100°C/min
150°C/min
0
2
4
6
8
10
Heat
Capaci
ty (
J/g/°
C)
-40 0 40 80 120 160 200 240 280Temperature (°C)
Melt
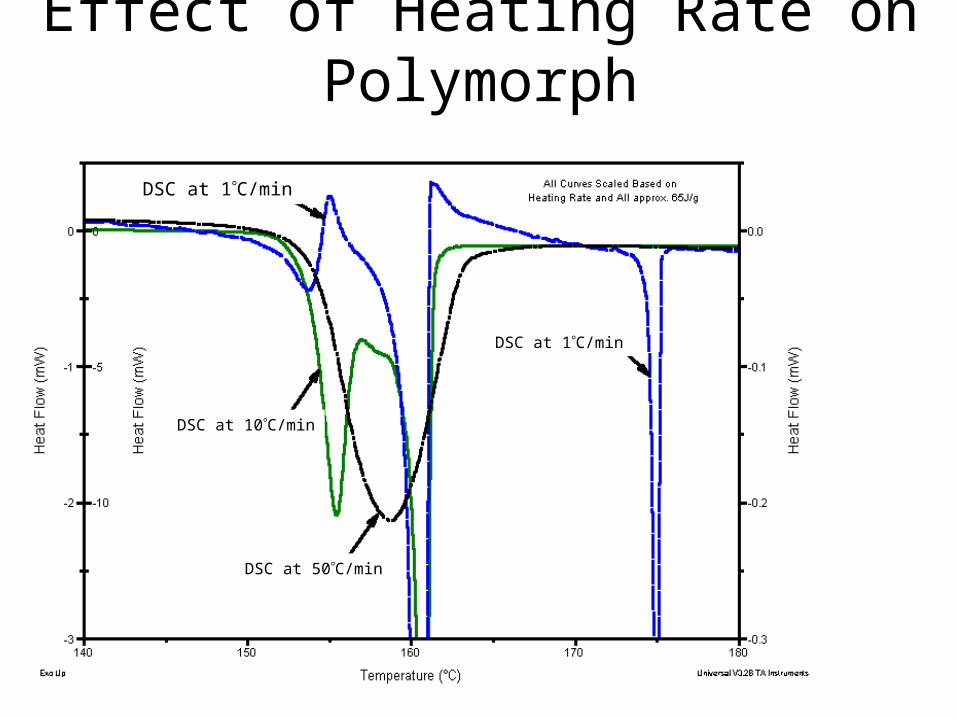
Effect of Heating Rate on Polymorph
DSC at 1C/min
DSC at 10C/min
DSC at 50C/min
DSC at 1C/min

Effect of Impurities on MeltingEffect of p-Aminobenzoic Acid Impurity Concentration
on the Melting Shape/Temperature of Phenacetin
Approx. 1mg Crimped Al Pans 2°C/min
NBS 1514 Thermal Analysis Purity Set
Melting of Eutectic Mixture
100% Pure
95.0% Pure
99.3% Pure
96.0% Pure

Van't Hoff Purity Calculation
133.0
133.5
134.0
134.5
135.0
Te
mp
era
ture
(°C
)
-2 0 2 4 6 8 10
Total Area / Partial Area
125.20°C137.75°C
Purity: 99.53mol %Melting Point: 134.92°C (determined)Depression: 0.25°CDelta H: 26.55kJ/mol (corrected)Correction: 9.381%Molecular Weight: 179.2g/molCell Constant: 0.9770Onset Slope: -10.14mW/°CRMS Deviation: 0.01°C
-2.2
-2.0
-1.8
-1.6
-1.4
-1.2
-1.0
-0.8
He
at
Flo
w (
W/g
)
122 124 126 128 130 132 134 136 138
Temperature (°C)Exo Up

2004 Training SeminarsDSC
4
Interpreting DSC Data
Crystallization, Heat Capacity,
and Crosslinking

CrystallinityDefinitions• Crystallization – the process of converting either
solid amorphous structure (cold crystallization on heating) or liquid amorphous structure (cooling) to a more organized solid crystalline structure
• Crystal Perfection – the process of small, less perfect crystals (metastable) melting at a temperature below their thermodynamic melting point and then (re) crystallizing into larger, more perfect crystals that will melt again at a higher temperature
•

Change in Crystallinity While Heating
105.00°C275.00°C
134.63°C
127.68°C0.6877J/g 230.06°C
230.06°C71.96J/g
0
20
40
60
Inte
gra
l (J/
g)
-1.5
-1.0
-0.5
0.0
0.5
1.0
He
at
Flo
w (
W/g
)
-50 0 50 100 150 200 250 300 350
Temperature (°C)
Exo Up Universal V4.0B TA Instruments
Quenched PET 9.56mg 10°C/min

Crystallization
• Crystallization is a kinetic process which can be studied either while cooling or isothermally
• Differences in crystallization temperature or time (at a specific temperature) between samples can affect end-use properties as well as processing conditions
• Isothermal crystallization is the most sensitive way to identify differences in crystallization rates

Crystallization• Crystallization is a two step process:
NucleationGrowth
• The onset temperature is the nucleation (Tn)
• The peak maximum is the crystallization temperature (Tc)

0.0
0.5
1.0
1.5
2.0
He
at F
low
(W
/g)
40 50 60 70 80 90 100 110 120 130 140 150 160
Temperature (°C)Exo Up
POLYPROPYLENEWITH NUCLEATING AGENTS
POLYPROPYLENEWITHOUT NUCLEATING AGENTS
-1.5
-1.0
-0.5
0.0
He
at F
low
(W
/g)
60 80 100 120 140 160 180 200
Temperature (°C)Exo Up
crystallization
melting
Effect of Nucleating Agents

What is Isothermal Crystallization?
• A Time-To-Event Experiment
Annealing Temperature
Melt Temperature
Isothermal Crystallization Temperature
Tem
pera
ture
Time
Zero Time

Isothermal Crystallization
117.4 oC
117.8 oC
118.3 oC
118.8 oC
119.3 oC
119.8 oC120.3 oC
0
1
2
3
4
5
He
at
Flo
w (
mW
)
-1 1 3 5 7 9Time (min)
Polypropylene

Specific Heat Capacity (Cp)• Heat capacity is the amount of heat required to
raise the temperature of a material by 1°C from T1 to T2
• True Heat Capacity (no transition) is completely reversible; the material releases the same amount of heat as temperature is lowered from T2 to T1
• Specific Heat Capacity refers to a specific mass and temperature change for a material (J/g/°C)
Why is Heat Capacity Important?
• Absolute thermodynamic property (vs. heat flow) used by engineers in the design of processing equipment
• Measure of molecular mobility – Cp increases as molecular mobility increases.
– Amorphous structure is more mobile than crystalline structure
• Provides useful information about the physical properties of a material as a function of temperature

Does DSC Measure Heat Capacity?• DSC or MDSC® do not measure heat
capacity directly. They measure heat flow rate which can be used to calculate heat capacity which is more appropriately called apparent heat capacity– DSC calculated Cp signals include all transitions because
the heat flow signal is simply divided by heating rate (an experimental constant) to convert it to heat capacity units
– A true value of Cp can only be obtained in temperature regions where there are no transitions

Calculating Heat Capacity (Cp)• Depending on the DSC that you have there
are three different ways to calculate Cp1) Three Run Method – ASTM E1269
Applicable to all DSC’s
2) Direct Cp – Single Run Method Applicable to Q1000 only
3) MDSC® - Single Run Method Any TA Instruments DSC w/ MDSC option Most accurate determination

Cp by Standard DSC
• Generally, three experiments are run in a DSC over a specific temperature range
– Empty pan run
– Sapphire run
– Sample run

Calculating Cp by Standard DSC
• Three experiments are run over a specific temperature range– Allow 5 minute isothermal at start– Use 20°C/min heating rate
1. Empty pan run– Match pan/lid weights to ± 0.05 mg– Used to establish a reference baseline

Calculating Cp by Standard DSC
2. Sapphire run– Used to determine calibration constant– Use same weight of pan/lid as for baseline ±
0.05 mg– Typical weight is 20 – 25 mg
3. Sample run– Typical weight is 10 – 15 mg– Use same weight of pan/lid as before ± 0.05 mg

Cp by Traditional DSC – 3 Runs
-100
0
100
200
300
400
Te
mp
era
ture
(°C
)
-30
-25
-20
-15
-10
-5
0
5
He
at F
low
(m
W)
0 10 20 30 40
Time (min)
Heat Flow
Baseline Run
Sample Run
Calibration Run

Cp by Traditional DSC – 3 Runs
0
100
200
300
400
500
Tot
al H
eat (
J/g)
0
2
4
6
Hea
t Cap
acity
(J/g
/°C
)
0 50 100 150 200 250 300
Temperature (°C)
50.00 °C1.161 J/g/°C
150.00 °C1.609 J/g/°C
280.00 °C1.924 J/g/°C
280.00 °C454.6 J/g
150.00 °C174.6 J/g
50.00 °C34.94 J/g
Cp & Total Heat for PET

Specific Heat Capacity • MDSC® & Tzero™ DSC have the ability
to calculate a heat capacity signal directly from a single run.
• Benefits of using a heat capacity (instead of
heat flow) signal include:– The ability to overlay signals from samples run
at different heating rates – The ability to overlay signals from heating and
cooling experiments

Direct Cp from a Q1000
275.00°C530.8J/g
135.54°C0.7311J/g
Running Integral
Heat Capacity (Single Run)
0
200
400
600
[ ––––– · ] Inte
gra
l (J
/g)
-2
0
2
4
6
Heat C
apacity (
J/g
/°C
)
0 50 100 150 200 250 300
Temperature (°C)
Sample: PET; QuenchedSize: 16.0000 mgMethod: Heat@20Comment: Heat@20
DSCFile: C:...\Crystallinity\RIqPETcycle20.001
Universal V3.8A TA Instruments
Latent Heat of Melting is Not Heat
Capacity
Latent Heat of Crystallization is Not
Heat Capacity
Absolute integral calculates total heat

Heat Flow w/ Different Heating Rates
Heat Flow Signals Increase in Size with Increasing Heating Rate

Benefit of Plotting Heat Capacity
Remember, DSC and MDSC Cp signals are really
Apparent Cp signals; crystallization and melting are latent heats, not Cp
Heat Capacity Signals Are Normalized for Heating Rate and
Permit Comparison of Experiments Done at Different Heating Rates

Heat Flow & Cp Signals
PolypropyleneSize: 9.21 mgDSC Cycle @ 10degC/min
Heat Capacity on Heating
Heat Capacity on Cooling
Heat Flow on Heating
Heat Flow on Cooling

Weak Tg Visible in Cp Signal
Sample: PolypropyleneSize: 9.21 mgDSC Cycle @ 10 C/min
Heat Capacity on Heating
Heat Capacity on Cooling

Thermoset Curing & Residual Cure
• A “thermoset” is a cross-linked polymer formed by an irreversible exothermic chemical reaction– A common example would be a 2 part epoxy
adhesive
• With a DSC we can look at the curing of these materials, and the Tg of full or partially cured samples

Curing of a Thermoset
135.26°C
98.35°C258.3J/g
Method Log:1: Ramp 10.00 °C/min to 190 °C
4
6
8
10
12
Heat F
low
(m
W)
40 60 80 100 120 140 160 180 200
Temperature (°C)
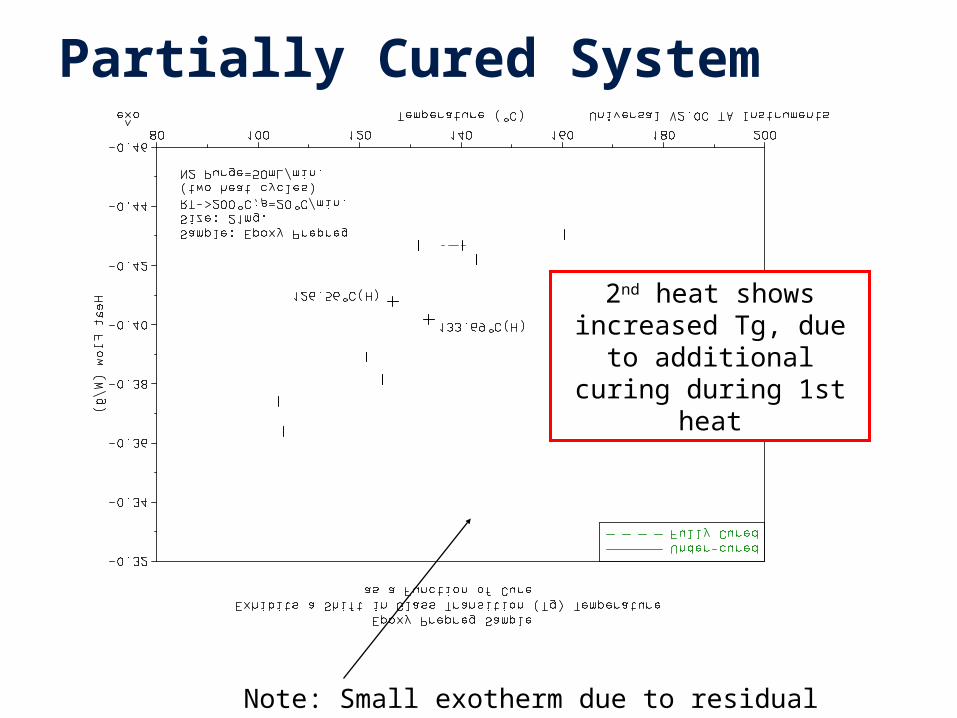
Partially Cured System
2nd heat shows increased Tg, due to additional
curing during 1st heat
Note: Small exotherm due to residual cure

Photopolymer Cure by PCA
1.08min
1.01min209.1J/g
Method Log:1: Equilibrate at 35.00 °C2: Isothermal for 1.00 min3: Light: on @ 20mW/cm24: Isothermal for 5.00 min5: Light: off6: Isothermal for 2.00 min7: End of method
Cure of a Photopolymer by PCA
0
50
100
150
200
250
He
at
Flo
w (
mW
)
0 2 4 6 8
Time (min)

Use PDSC to Study Phenolic CuringWith ambient pressure, curing is not visible due to volatization of water. Water
comes from the condensation reaction during the curing of the phenolic
Decomposition