2004 MPS Group Annual Report
60
2004 Annual Report
-
Upload
mark-stevens -
Category
Documents
-
view
53 -
download
1
Transcript of 2004 MPS Group Annual Report

2004 Annual Report

Our Business
MPS Group, Inc. is a leading provider of staffing,
consulting, and solutions in the disciplines of
information technology, accounting and finance, law,
engineering, and health care. MPS Group delivers its
services to government entities and businesses in
virtually every industry throughout the United States,
Canada, the United Kingdom, and Europe.
MPS Group is a Fortune 1000 company traded on
the New York Stock Exchange (NYSE:MPS).
Table of Contents
Financial Highlights 1
Letter to Shareholders 2
Breakdown of Revenue 7
Professional Services Division 8
Information Technology Services Division 10
Board of Directors and Corporate Officers 12
Discussion of the Company 13
Selected Financial Data 20
Management’s Discussion and Analysis ofFinancial Condition and Results of Operations 21
Quantitative and Qualitative DisclosuresAbout Market Risk 30
Report of Independent Registered CertifiedPublic Accounting Firm 31
Management’s Report on Internal Controlover Financial Reporting 33
Financial Statements 34
Notes to Consolidated Financial Statements 39
Reconciliation of Non-GAAP FinancialMeasure to GAAP Financial Measure 55
Common Stock Data and Other Information 56

1MPS Group
2004 Financial Highlights(dollar amounts in thousands except per share amounts)
Year 2004 2003
Revenue $ 1,426,842 $ 1,096,030Cost of revenue 1,066,055 808,890Gross profit 360,787 287,140Operating expenses 308,654 251,339Operating income $ 52,133 $ 35,801Income from continuing operations $ 35,420 $ 21,835Diluted income per common share from continuing operations (EPS) $ 0.33 $ 0.21
Revenue(in billions)
EPSEBITDA(in millions)
EBITDA is a non-GAAP financial measure representing earnings before interest, taxes, depreciation, and amortization. See page 55 for aschedule reconciling EBITDA used above and in the letter to shareholders to the most comparable GAAP financial measure.

To Our Shareholders:
In last year’s letter to shareholders, I wrote of the stepswe had taken to strengthen and diversify our business,and of the progress we were making. I also wrote aboutour expectations for an improved economy and a betteremployment environment in 2004. I am pleased to reportthat these two factors, and the efforts of our exceptionalconsultants, employees, and divisional leadership,combined to make 2004 an extremely successful yearfor MPS Group.
The following is a discussion of our accomplishmentsin 2004 and our plans and goals for the years ahead.
2004 Year In Review
As 2004 began, we saw immediate improvements inclient demand for our services as well as indications thatthe economy was improving. In order to take advantageof this upturn, we made investments in people and inour business units that were designed to help us maxi-mize our performance during this economic recovery.
Due in part to these investments, 2004 was a strongyear for top-line growth as we added new clientrelationships and increased market share within ourexisting client base. Overall, our revenue grew 30%versus 2003, to $1.427 billion. Revenue for ourProfessional Services Division, which provides staffingand recruiting services in the disciplines of accountingand finance, law, engineering, and health care,increased 40% from 2003. We also were encouraged bythe performance of our Information Technology (IT)Division, which increased revenue 22% versus 2003, agood indication that corporate technology spending isimproving after several years of soft demand. In bothour professional and technology businesses, we werepleased to see revenue grow sequentially for each quarterof 2004, confirming our belief that a general economicrecovery and an improvement in hiring were underway.
We also were pleased with our growth in earnings in2004. Diluted net income per common share fromcontinuing operations rose 57% in 2004, to $0.33from $0.21 in 2003. EBITDA grew from $53 millionin 2003, to $67 million in 2004, an increase of 27%.We believe our earnings might have increased even
2 MPS Group
Timothy D. Payne, President and Chief Executive Officer
The steps we have taken to
strengthen and diversify our
business, plus an improved
economy, combined to make
2004 an extremely successful
year for MPS Group.

3MPS Group
more in 2004 had it not been for the investments wemade in our business. However, we also believe thatthese investments have better positioned us to competeeffectively and maximize our performance for 2005and beyond.
Along with this growth in revenue and earnings in 2004,we also saw continuing improvement in the Company’soverall financial position. For the year, we generatedmore than $50 million in cash flow from operations.As we noted in last year’s letter to shareholders, weexpected to use our cash reserves to buy back Companystock, as appropriate, and complete strategic acquisitionsin the accounting, legal, and health care staffingmarkets. During 2004, we invested $50 million instrategic acquisitions and $31 million to buy back theCompany’s stock. After considering these investments,we closed the year with $106 million in cash reservesand no outstanding borrowings on our $150 millioncredit facility. We believe the Company is financiallystrong and well positioned to execute our strategy andcontinue our growth.
Finally, like all public companies, in 2004 we werefaced with new reporting and disclosure requirementsdriven by Section 404 of the Sarbanes-Oxley Act.Complying with this new regulation was costly and
required us to commit the time and energy of many ofour talented people. We are pleased to note that ourauditor’s report was favorable and that we identifiedno material weaknesses. Now that we have completedour first year under the new regulations, the burden ofcompliance will decrease, and we have strengthenedour internal audit function to make sure we meet ourfuture obligations.
Overall, we were pleased with our performance in 2004and with the progress we continue to make as a company.
Business Unit Performance
Beginning with the fourth quarter of 2004, wemodified our financial reporting segments in order tobetter align our reporting segments with the mannerin which we manage the Company. In doing so, wecreated two divisions: the Professional ServicesDivision and the Information Technology Division.Within these divisions, we further broke out ourbusiness into a North American segment and aEuropean (primarily United Kingdom) segment.
MPS Group provides highly specialized staffing andrecruitment services, and this is reflected in both ourbrand strategy and operating model. Each business unit
MPS Group’s 2004 Highlights
• Grew revenue by 30% to $1.427 billion and net income from continuing operations by 62% to $35.4 million
• Generated more than $50 million in cash flow from operations
• Invested in organic growth initiatives in all our business units
• Purchased seven leading professional staffing companies bringing us closer to our goal of growing Professional Services to 60% of our revenue
• Spent $31 million to buy back the Company’s stock
• Ended 2004 with over $106 million in cash and no borrowing on our $150 million credit facility
• Named best performing stock price in the staffing industry by Staffing Industry Report, January 14, 2005

goes to market under a brand name that is specific toits specialty and designed to attract both clients andpotential candidates. Likewise, each business unit’smanagement team is composed of individuals with a highdegree of experience and expertise in their specializeddiscipline. For example, our legal staffing business unitis Special Counsel, and its offices are generally led byindividuals who are attorneys or paralegals.
What follows is a breakout of the 2004 performancesof our key business units in both our ProfessionalServices and IT divisions:
Professional Services Division
In last year’s letter to shareholders, I wrote of our goalto create greater diversity in our business by increasingthe percentage of our revenuederived from our ProfessionalServices Division. The primaryreasons for doing this are tolessen the Company’s suscep-tibility to cyclical changes incorporate technology spending,to take advantage of therelatively greater shortagesof skilled professionals indisciplines such as accountingand health care, and tocapitalize on the greaterdemand for permanentemployee recruiting fees that exists in the professionaldisciplines. While we anticipate growth in both our ITand Professional divisions, we expect a faster growthrate from our Professional Services Division.
I am pleased to report real progress toward achievingour goal of creating greater diversity in our business.In 2000, 36% of our revenue was generated by ourProfessional Services Division and the remainder wasproduced by our IT Division. For the fourth quarterof 2004, revenue from our Professional ServicesDivision had grown to 51% of total revenue. By theend of 2006, we expect Professional Services revenueto rise to more than 60% of total Company revenue.
Special Counsel is North America’s largest providerof legal staffing and recruitment solutions, with morethan $100 million in 2004 revenue. This businessunit’s revenue grew 34% in 2004 versus 2003. In 2004,Special Counsel continued to broaden its array ofsolutions by adding new services such as depositiondigesting, law firm merger and partner placement,medical document review, and court reporting. Overalldemand for Special Counsel’s services is expected tocontinue to grow as leading law firms and corporatelegal departments increasingly embrace the concept ofutilizing contingent legal professionals. Special Counselshould benefit from anticipated increases in corporatemerger and acquisition activity.
Badenoch & Clark is quickly emerging as a leadingprovider of finance and accounting and professional
staffing services in the UnitedKingdom. Badenoch & Clark’srevenue rose 46% in 2004, to£157 million (US $289 million).During the year, this businessunit made substantial invest-ments by increasing itsgeographic footprint to 18offices, hiring a substantialnumber of revenue-generatingemployees, and adding a rangeof new service offerings. Theseinvestments are expected topay off in 2005 in the form
of continued growth and improved profitability.Badenoch & Clark was also recently honored for thesecond straight year by The Sunday Times as number 11on its list of “100 Best Companies To Work For” inthe United Kingdom — up from number 17 last year.
Entegee has produced consistently strong performancefor over ten years in the highly competitive engineeringstaffing market. In 2004, Entegee’s revenue grew 19%to over $200 million, driven by good execution andstronger demand from the defense and aerospaceindustries. Demand from the manufacturing sectorimproved slightly in 2004, and further strengtheningis anticipated in 2005.
4 MPS Group
“We believe the Company is financially strong andwell positioned to executeour strategy and continueour growth…we believe
our people are up tothe challenge.”

Accounting Principals made great strides during 2004,with strong organic growth as well as activity on theacquisition front. It has long been our strategic objectiveto boost our presence in the North American accountingand finance staffing market in order to take advantageof strong demand and a relatively short supply ofaccounting professionals. Accounting Principals greworganically by 26% in 2004. Combining this growthwith acquisitions, including the recent acquisition ofAccounting Solutions, a leading privately held financialstaffing company, Accounting Principals grew 88% in2004 and is now expected to generate over $100 millionin revenue in 2005. Accounting Principals enters 2005with the size and geographic footprint to be a fiercecompetitor able to gain market share from theindustry leader.
Soliant Health is our relatively new business unit thatspecializes in recruiting and placing health care pro-fessionals such as therapists, nurses, and techniciansthroughout the United States. Most of Soliant’shealth care professionals work on 13-week travelassignments. Due to a shortage of health care workersand an aging population, the overall health care staffingmarket is expected to grow for many years to come.For 2005, Soliant is projected to generate revenue ofover $70 million.
Information Technology Division
MPS Group’s IT Division offers IT staffing andrecruitment services, IT solutions, and workforceoptimization solutions. To the surprise of manyindustry analysts, our IT Division grew by over 20%in 2004. We attribute this to good execution by ourIT business units and an improved demand for ITservices. It is anticipated that demand for IT serviceswill continue to improve in 2005.
Modis is the largest business unit of MPS Group andone of the largest IT staffing companies in NorthAmerica, providing staffing and recruitment of bothcontingent and permanent IT professionals. Modisdelivers its services to Fortune 1000 companies,middle-market clients, and government entities. In 2004,Modis revenue grew 17%. We believe this growth is
the result of the quality of services provided by Modisas well as a fundamental change in client buyingpatterns over the past several years. In years past,buyers of IT services were willing to do business withmany small providers, making the market quitefragmented. Today, buyers want to do business withfewer providers and demand that those providers havethe size, scale, and financial stability to service theirIT needs across multiple physical locations. With$388 million in annual revenue in 2004 and 43 officesin North America, Modis has a high win rate whenbuyers select their providers.
Modis International is a leading provider of IT staffingacross the United Kingdom and continental Europe.The IT staffing marketplace in the United Kingdomdiffers from the market in North America in severalkey respects. From a financial standpoint, the resultsof these differences are lower gross margins and loweroperating margins across the entire United KingdomIT staffing industry. In this challenging environment,Modis International has a consistent track record ofprofitability with gross margins that are among thehighest in its peer group. In 2004, Modis Internationalrevenue grew 38%, rising to over £135 million (US$249 million) for the year. For 2005, we anticipatethat Modis International should grow at a slower rateversus 2004, but that we should see improvement ingross margin and operating margin trends.
Idea Integration provides IT solutions to clientsthroughout the United States. The IT solutions modeldiffers from the IT staffing model in two key respects.First, services typically are delivered to clients via salaried“bench” consultants. Second, IT solutions providerstypically tackle entire projects and accept responsibilityfor each project’s outcome. IT solutions providers his-torically have thrived during times of rapid technologicalchanges, such as the advent of ERP systems and theInternet boom. Because no such rapid technologicalchange is under way at present, Idea Integration has notreacted to the economic recovery as quickly as the restof our business units. The business unit did grow by 2%in 2004 and turned a slight profit for the year. As theeconomic recovery becomes more robust, we anticipategreater growth and improved profitability from Idea.
5MPS Group

Beeline is perhaps the most unique of our businessunits in that it does not provide staffing, recruitment,or consulting services. Beeline is an application serviceprovider (ASP) that designs and develops software forclients to use to optimize the deployment of theirworkforce. While the Beeline software attends to abroad range of client needs, at its heart is a powerfulapplication that automates the procurement andmanagement of contingent labor. Beeline customersuse this tool to streamline their processes and savemillions of dollars per year in contingent labor costs.Beeline’s revenue grew rapidly in 2004, and weanticipate further rapid growth in 2005, as well assolid profitability.
Our Goals
The overarching long-term goal that drives ourcompany is our desire to be the leading operatingcompany in our industry. To achieve this, we must finda way to consistently outperform our peers in clientservice, growth, and financial performance. The meansto achieving this goal will be to continually attract andretain the industry’s best people by providing a greathome and the opportunity for a great career with us.
With this said, we have a number of shorter-termgoals that drive our company as well. For 2005, ourgoal is to leverage the investments we have made inrecent years and achieve another strong year ofincreased revenue and profits. The path to meeting thisgoal is to grow our business without adding significantnew costs and to derive more of our revenue fromhighly profitable permanent placement fees. From2003 to 2004, revenue from permanent placement feesrose 60%, to approximately 3.3% of total revenue; wehope to see similar growth in 2005.
For 2006, we are focused on several goals as well. Wewould like to more than double the revenue contributionfrom our permanent placement fees. Achieving thiswould have a significant positive impact on our operatingmargins. A second goal for 2006 is to generate at least$2 billion in revenue. Our third goal, as previouslymentioned, is to continue to diversify our business andderive over 60% of our business from our professionalservices business units by 2006. All of these goals willbe tough to accomplish, but we believe our people areup to the challenge.
And perhaps most importantly, our goal is to drivevalue for our shareholders. The clear route to creatingshareholder value, in our view, is our determinationto consistently achieve operational excellence.
Thank you, our shareholders, for the trust and supportyou have placed in us by investing in MPS Group.
Sincerely,
Timothy D. Payne
President and Chief Executive Officer
April 15, 2005
6 MPS Group


8 MPS Group
Professional Services Division
North America
Accounting Principals is a leader in therecruitment and placement of accountingand finance professionals and offers acomplete range of workforce solutionsto the finance, accounting, and bankingindustries.
• In 2004, Accounting Principals acquiredAccounting Solutions, one of thenation’s largest privately held financeand accounting staffing companies.
• Accounting Principals expanded itsexecutive search and permanentplacement services to Atlanta, Dallas,Houston, Ft. Worth, Philadelphia,Nashville, Chicago, San Francisco,Tampa, and Washington, D.C.
• With this rapid growth, AccountingPrincipals is expected to drive morethan $100 million in revenue in 2005.
Special Counsel is the recognized leaderin providing customized legal workforcesolutions to corporate legal departmentsand law firms nationwide. SpecialCounsel provides contract, contract-to-hire, direct hire, and litigation supportservices, such as medical documentreview, deposition digesting, and courtreporting.
• Special Counsel is the largest U.S.-based provider of legal staffingservices, with anticipated 2005revenue of more than $120 million.
• The market for legal staffing servicesis growing as the concept of usingcontingent legal professionals isembraced by law firms and in-houselegal departments.
• Over 90% of the 100 largest lawfirms in the United States are clientsof Special Counsel.
Entegee provides technical and engineer-ing staffing services to manufacturers,defense contractors, and governmententities. Entegee also provides engineeringand drafting design services throughcompany-owned centers that utilizestate-of-the-art computer technology.
• Entegee generated superior resultsin 2004 due to good execution andstrong demand from the defense andaerospace industries.
• Entegee grew revenue by over 19%in 2004 while adding new offices inkey markets.
• Entegee consistently delivered highprofits driven by its efficient nationalservice center model.
Jeffrey B. Jackovich, PresidentJohn L. Marshall III, PresidentRobert L. Cecchini, President

9MPS Group
Soliant Health is a leading provider ofspecialized health care staffing servicesto hospitals and health care providers.By supplying traveling nurses andallied health care professionals on bothtemporary and direct hire assignments,Soliant Health delivers comprehensivehealth care staffing services to leadingmedical facilities across the United States.
• There is a shortage of licensed healthcare professionals in North America,creating strong demand for SoliantHealth’s services.
• Through a combination of organicgrowth and a targeted acquisitionstrategy, Soliant Health grew revenueby over 157% in 2004.
• Soliant launched several new serviceofferings in 2004, including a physiciansearch practice.
Badenoch & Clark specializes in profes-sional services recruitment on a directhire, temporary, and contract basis in theUnited Kingdom. Badenoch & Clark hasdelivered these services to the accounting,financial services, banking, insurance,legal, human resources, and technologymarkets for 22 years.
• Badenoch & Clark ranked 11th on theprestigious 2004 The Sunday Timeslist of “100 Best Companies To WorkFor” in the United Kingdom, up from17th last year.
• Badenoch & Clark opened offices inChelmsford, Essex and Cardiff, Walesin 2004.
• Badenoch & Clark made strategicinvestments to expand its workforcein 2004, resulting in 46% revenuegrowth for the year.
David K. Alexander, President Neil L. Wilson, President & Managing Director
Europe

Information Technology Services Division
North America
10 MPS Group
Modis, Inc. is one of the world’slargest and most respected providersof Information Technology ResourceManagement (ITRM) services andsolutions. Modis delivers world-classITRM solutions to more than 1,000clients in virtually every industryaround the world.
• In 2004, Modis was awarded contractsto provide IT staffing services tohundreds of companies and govern-ment entities, including the U.S.Department of Defense MilitaryHealth System, Emerson Direct, thestate of Ohio, University of TexasMedical Branch, Gwinnett County,Georgia, and the state of Delaware.
• Modis grew revenue by over 17% in2004, indicating improving demandfor IT services among corporate andgovernment clients.
Idea Integration is a technology solu-tions and systems integrator servingFortune 1000 companies, government,and middle-market clients. Idea spe-cializes in Web design and development,information management solutions,wireless workflow applications, andportal solutions.
• Idea Integration was named to the2004 VARBusiness 500, the industry’sdefinitive ranking by revenue of thetop 500 solution providers, IT con-sultants, integrators, and serviceorganizations in North America.
• Idea Integration received the 2004Galaxy Award by The InternationalAcademy of Communications Arts andSciences (IACAS) for its excellence inproduct and service marketing forSony Electronics.
John P. Cullen, President James D. Albert, President

Europe
11MPS Group
Beeline automates and streamlines theprocurement and management of bothcontingent and full-time workforces.This leading technology drives efficien-cies in human capital management,providing discipline and reductions inworkforce costs.
• Beeline grew rapidly in 2004 bywinning new contracts with Fortune1000 companies and by expandingexisting customer relationships.
• Recently, Beeline expanded itstechnology and service offerings byintroducing several new modules aswell as a solution targeted to thehealth care market.
Modis International is one of Europe’slargest and most respected providersof IT staffing services and solutions.Based in the United Kingdom, ModisInternational also does businessthroughout continental Europe.
• Modis International recently openedtwo offices in Europe to meet clientdemands for IT staffing services inStuttgart, Germany and Amsterdam,Holland.
• Modis International was recognizedby the Association of TechnologyStaffing Companies (ATSCo) fordemonstrating professional values inits delivery of IT staffing services.
• Based in the U.K., Modis Internationaldoes business with FTSE 1000 andgovernment entities throughout theU.K. and continental Europe.
Richard L. White, President Paul F. Chapman, President & Managing Director

12 MPS Group
Board of Directors
Derek E. DewanChairman of the Board — MPS Group, Inc.
Michael D. AbneyRetired Chief Financial Officer and
Senior Vice President — MPS Group, Inc.
T. Wayne Davis 1, 2, 3
President and Chairman —Tine W. Davis Family — WD Charities, Inc.
William M. Isaac 1, 2
Chairman — The Secura Group and Secura BurnettFormer Chairman — FDIC
John R. Kennedy 1, 2, 3
Retired President and Chief Executive Officer —Federal Paper Board Company, Inc.
Arthur B. Laffer 2Chairman — Laffer Associates
Darla D. Moore 3Partner and Executive Vice President — Rainwater, Inc.
Timothy D. PaynePresident and Chief Executive Officer —
MPS Group, Inc.
Peter J. Tanous 1, 2
President — Lynx Investment Advisory, Inc.
1 Member of the Corporate Governance and Nominating Committee2 Member of the Audit Committee3 Member of the Compensation Committee
MPS Group Corporate Officers
Timothy D. PaynePresident and Chief Executive Officer
Robert P. CrouchSenior Vice President and Chief Financial Officer
Richard L. WhiteSenior Vice President and Chief Information Officer
Gregory D. HollandSenior Vice President, Chief Legal Officer, and Secretary
Tyra H. TutorSenior Vice President, Corporate Development
Thomas M. BurkeVice President, Human Resources
Thomas M. Burke Tyra H. Tutor Robert P. Crouch Timothy D. Payne Richard L. White Gregory D. Holland

13MPS Group 13
Forward-Looking Statements
This Annual Report to Shareholders contains forward-looking statements that are subject to certain risks,uncertainties or assumptions and may be affected bycertain factors, including but not limited to the specificfactors discussed below, under “Risk Factors,” “Marketfor Registrant’s Common Equity, Related StockholderMatters and Issuer Purchases of Equity Securities,” and“Management’s Discussion and Analysis of FinancialCondition and Results of Operations—Liquidity andCapital Resources.” In some cases, you can identifyforward-looking statements by terminology such as“will,” “may,” “should,” “could,” “expects,” “plans,”“indicates,” “projects,” “anticipates,” “believes,” “estimates,”“appears,” “predicts,” “potential,” “continues,” “can,”“hopes,” “perhaps,” “would,” or “become,” or the negativeof these terms or other comparable terminology. Exceptfor historical facts, all information provided below, under“Quantitative and Qualitative Disclosures About MarketRisk” should also be considered forward-lookingstatements. In addition, statements in the letter toshareholders and discussions of our divisions appearing
earlier in this Annual Report to Shareholders containforward-looking statements, including statementsregarding future financial, business mix, and operationalobjectives for the Company and its business units.Should one or more of these risks, uncertainties or otherfactors materialize, or should underlying assumptionsprove incorrect, actual results, performance or achieve-ments of the Company may vary materially from anyfuture results, performance or achievements expressedor implied by such forward-looking statements.
Forward-looking statements are based on beliefs andassumptions of the Company’s management and oninformation currently available to such management.Forward-looking statements speak only as of the datethey are made, and the Company undertakes noobligation to publicly update any of them in light of newinformation or future events. Undue reliance shouldnot be placed on such forward-looking statements,which are based on current expectations. Forward-looking statements are not guarantees of performance.
Introduction
MPS Group, Inc. (MPS or the Company) is a leadingprovider of business services with over 185 officesthroughout the United States, Canada, the UnitedKingdom, and continental Europe. We deliver specialtystaffing, consulting and business solutions to virtuallyall industries in the following disciplines, through thefollowing primary brands:
Brand(s) DisciplineModis® Information Technology (IT)
ServicesBadenoch & Clark®, Accounting and FinanceAccounting Principals®Entegee® EngineeringSpecial Counsel® LegalIdea Integration® IT SolutionsSoliant Health® Health CareBeeline® Human Capital Automation
Our strategy is to focus on increasing revenue andprofits, through a combination of internal growth andacquisitions, primarily within our core disciplines and,to a lesser extent, expansion into new specialties.Specifically, we aim to maintain a leadership positionin our IT-related disciplines, while growing ourprofessional-related disciplines both organically andthrough acquisitions, which should result in theProfessional Services Division providing a largeroverall percentage contribution to our total revenues.
The key elements to our internal growth strategyinclude:
• increasing penetration of existing markets andcustomer segments,
• expanding current specialties into new andcontiguous geographic markets,
• concentrating on skill areas that value high levelsof service, and
• identifying and adding new practice areas.
While we look to strengthen relationships with ourclients, we are not dependent upon a single customeror a limited number of customers.
Pursuant to our acquisition strategy, we acquired tenbusinesses from 2002 to 2004: four legal staffingbusinesses acquired in February of 2003, August of2003, August of 2004, and October of 2004; threehealth care staffing businesses acquired in June of2002, February of 2004, and March of 2004; and threeaccounting staffing businesses acquired in February of2004, July of 2004, and October 2004. The businessesacquired in 2004, 2003, and 2002, had a combinedrevenue of $95 million, $22 million, and $18 millionat acquisition date, respectively.
In addition, we look to focus our efforts intensely onour core businesses. Toward this end, we have divestedcertain businesses we deemed not central to our
strategy, including the 2003 sale of our outplacementunit and the 2004 sale of our retained executive searchunit. We feel we are able to execute and profit from ourinternal growth and acquisition strategies due to ourstrong management team, our integrated and scalableback office support services, and to the continueddevelopment of our strategic management systems.
In all of our markets and disciplines, we encounteraggressive and capable competition, with a number offirms offering services similar to ours on a national,regional or local basis. Our ability to competesuccessfully depends on our reputation, pricing andquality of service provided, our understanding ofclients’ specific job requirements, and our ability toprovide qualified personnel in a timely manner.
The Company was incorporated under the laws of theState of Florida in 1992 under the name AccustaffIncorporated, and changed its name to MPS Group, Inc.in 2002. Our principal executive offices are located inJacksonville, Florida. Strategically, our operations arecoordinated primarily from facilities in Jacksonville,Florida, and London, United Kingdom, and to alesser extent, Burlington, Massachusetts. Both of ourJacksonville and London facilities provide support andcentralized services to our offices in the administrative,marketing, public relations, accounting, training andlegal areas. Regional and local office managers are
responsible for most activities of their offices, includingsales, local and regional marketing and recruitment.
Segments
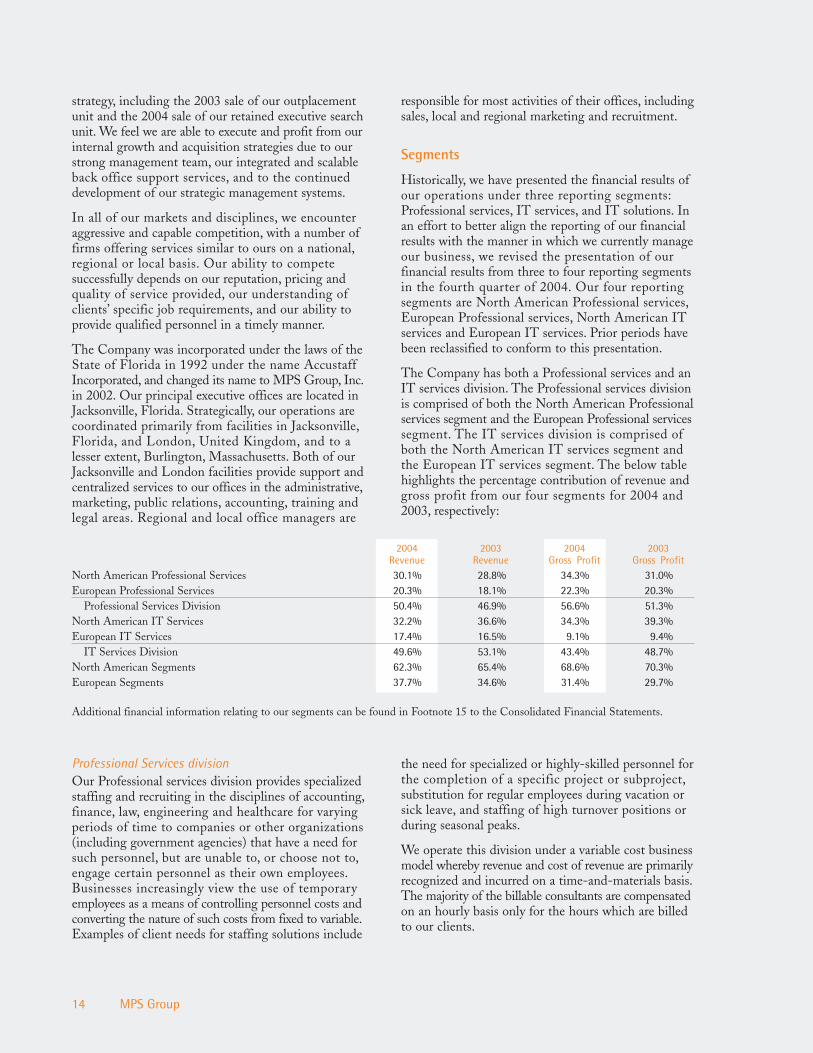
Historically, we have presented the financial results ofour operations under three reporting segments:Professional services, IT services, and IT solutions. Inan effort to better align the reporting of our financialresults with the manner in which we currently manageour business, we revised the presentation of ourfinancial results from three to four reporting segmentsin the fourth quarter of 2004. Our four reportingsegments are North American Professional services,European Professional services, North American ITservices and European IT services. Prior periods havebeen reclassified to conform to this presentation.
The Company has both a Professional services and anIT services division. The Professional services divisionis comprised of both the North American Professionalservices segment and the European Professional servicessegment. The IT services division is comprised ofboth the North American IT services segment andthe European IT services segment. The below tablehighlights the percentage contribution of revenue andgross profit from our four segments for 2004 and2003, respectively:
14 MPS Group
Professional Services division Our Professional services division provides specializedstaffing and recruiting in the disciplines of accounting,finance, law, engineering and healthcare for varyingperiods of time to companies or other organizations(including government agencies) that have a need forsuch personnel, but are unable to, or choose not to,engage certain personnel as their own employees.Businesses increasingly view the use of temporaryemployees as a means of controlling personnel costs andconverting the nature of such costs from fixed to variable.Examples of client needs for staffing solutions include
the need for specialized or highly-skilled personnel forthe completion of a specific project or subproject,substitution for regular employees during vacation orsick leave, and staffing of high turnover positions orduring seasonal peaks.
We operate this division under a variable cost businessmodel whereby revenue and cost of revenue are primarilyrecognized and incurred on a time-and-materials basis.The majority of the billable consultants are compensatedon an hourly basis only for the hours which are billedto our clients.
2004 2003 2004 2003Revenue Revenue Gross Profit Gross Profit
North American Professional Services 30.1% 28.8% 34.3% 31.0%European Professional Services 20.3% 18.1% 22.3% 20.3%
Professional Services Division 50.4% 46.9% 56.6% 51.3%North American IT Services 32.2% 36.6% 34.3% 39.3%European IT Services 17.4% 16.5% 9.1% 9.4%
IT Services Division 49.6% 53.1% 43.4% 48.7%North American Segments 62.3% 65.4% 68.6% 70.3%European Segments 37.7% 34.6% 31.4% 29.7%
Additional financial information relating to our segments can be found in Footnote 15 to the Consolidated Financial Statements.

Clients also hire our skilled consultants on a permanentbasis, whether it is from a conversion of a temporaryassignment to, or a direct placement of, a full-timeposition. We earn a one-time fee for these services.These fees represent approximately 6% of thisdivision’s revenue.
The principal national and international competitors ofour Professional services division include Robert HalfInternational Inc., Resources Connection, Inc.,Spherion Corporation, Wallace Law Registry, AjilonConsulting (a wholly owned subsidiary of Adecco SA),Michael Page International, Robert Walters PLC,Hays PLC, Cross Country Healthcare, Inc., and CDICorporation.
North American Professional Services segment Our North American Professional Services segmentgoes to market under the primary brands and operatingunits Entegee, Special Counsel, Accounting Principals,and Soliant Health. The demands of our clients (theneed for confidentiality, accuracy and reliability, cost-effectiveness, and frequent peak workload periods) aresimilar among the brands/operating units within thissegment.
Entegee Our Entegee brand/operating unit providesstrategic workforce solutions for technical andengineering needs. From on-site managementconsulting and in-house project services to temporaryand direct placement, Entegee combines industryknowledge and experience to fill highly skilledtechnical and engineering positions. These positionsinclude, but are not limited to, engineers, designers,drafters, inspectors and assemblers. Entegee operatesthrough a domestic network of national practicebranches with offices in 10 markets, and employsapproximately 2,400 billable consultants. Entegeealso provides engineering and drafting design servicesthrough company-owned centers, in Iowa andMinnesota, that utilize state-of-the-art computertechnology. Certain of its client base includesgovernment and defense contractors, manufacturingand engineering companies.
Special Counsel Our Special Counsel brand/operating unit specializes in placing temporary andfull-time employees in attorney, paralegal, legaladministrative and legal secretarial positions forworkload management, litigation support, businesstransaction support, pre-litigation and documentmanagement support, as well as medical documentreview, deposition digesting, and other trial-relatedservices. Special Counsel has a network of 34 officeslocated across the United States, and employsapproximately 1,400 billable consultants. Its clientsinclude Fortune 1000 companies and law firms.
In 2004, we expanded Special Counsel’s geographicfootprint with the acquisition of Legal Networks inAugust and expanded its service offering with theacquisition of Alderson Court Reporting, a premierprovider of court reporting, legal videography andlitigation support services, in October. In addition,Alderson is the official court reporter of the UnitedStates Supreme Court.
Accounting Principals Our Accounting Principalsbrand/operating unit specializes in placing temporaryand full-time employees in accounting, finance, andbanking positions. Accounting Principals has anetwork of 47 offices located across the United States,and employs approximately 1,900 billable consultants.
In 2004, we expanded Accounting Principals’geographic footprint with the acquisitions ofAccounting Alternatives in July and AccountingSolutions in October. The Accounting Solutionsacquisition added 17 net new markets across theUnited States. We also expanded AccountingPrincipals’ service offering in 2004 with the acquisitionof Lillian Kloock, a provider of medical billing andmedical collection professionals to leading facilitiesprimarily in the Southeastern United States.
Soliant Health Our Soliant Health brand/operatingunit specializes primarily in placing traveling healthcareprofessionals, in the areas of nursing, physical andoccupational therapy, along with imaging technicians.Soliant Health employs approximately 500 consultants,and its clients include hospitals and healthcareproviders across the United States.
In 2004, we expanded Soliant Health’s geographicfootprint with the acquisitions of Sunbelt StaffingSolutions and Management Search in February andMarch. During the year, we also expanded its serviceoffering to include school therapists and thepermanent placement of physicians.
Dispositions In 2003, we sold certain operating assets and transferredcertain operating liabilities of our then outplacementunit. The decision to sell our outplacement unit was inkeeping with our long-term strategy of focusing onour core businesses. As a result of the sale of ouroutplacement unit and in accordance with GenerallyAccepted Accounting Principles (GAAP), ourConsolidated Financial Statements and Management’sDiscussion and Analysis of Financial Condition andResults of Operations report the results of operationsof this unit as Discontinued Operations for all periodspresented. In June 2004, we sold certain assets andtransferred certain liabilities of our retained executivesearch brand.
15MPS Group

European Professional Services segment Our European Professional services segment is comprisedof our Badenoch & Clark brand/operating unit. Since1980, Badenoch & Clark has been specializing inplacing temporary, full-time, contract and interimrecruitment employees in positions such as accountingand finance, financial services, legal, human resources,marketing, not-for-profit and public-sector. Withthe 2004 opening of offices in Essex and Wales,Badenoch & Clark has 18 offices located across theUnited Kingdom. It also has 1 office in Luxembourg.Badenoch & Clark employs approximately 4,000billable consultants.
IT Services division Our IT services division provides specialty staffing,consulting and business solutions under the brands/operating units Modis, Modis International, IdeaIntegration and Beeline. We utilize the brand Modisin both our North American and European segments;however, the overall business culture distinguishes theoperation of these two segments.
We operate this division primarily under a variable costbusiness model whereby revenue and cost of revenueare primarily recognized and incurred on a time-and-materials basis. The majority of the billable consultantsare compensated on an hourly basis only for the hourswhich are billed to our clients. Less than 1% of thisdivision’s revenue is generated from fees for clientsdirectly hiring our consultants.
The principal national and international competitors ofour IT services division include Keane, Inc., ComputerHorizons Corp., Comsys IT Partners, Inc., CIBER, Inc.,Computer People (a division of Ajilon Group), HaysPLC, Elan, Lorien PLC, and Sapient Corporation.In addition, we may compete against the internalmanagement information services and IT departmentsof clients and potential clients.
North American IT Services segment Modis Our Modis brand/operating unit specializesin the placement of IT contract consultants for ITproject support and staffing, recruitment of full-timepositions, project-based solutions, supplier managementsolutions, and on-site recruiting support in the areasof application development, systems integration, andenterprise application integration. Modis has a networkof 45 offices located across the United States, andemploys approximately 3,700 billable consultants.
Idea Integration Our Idea Integration brand/operating unit formerly comprised the IT Solutionssegment. Idea specializes in Web design anddevelopment, information management solutions,wireless workflow applications, portal solutions, andenterprise resource management. Idea utilizes bothsalaried and hourly consultants to deliver solutionsprimarily under time-and-materials contracts and toa lesser extent under fixed-fee contracts. It operatesin certain markets across the United States and itsclients include Fortune 1000 companies, governmentand middle-market companies.
Beeline Our Beeline brand/operating unit provides asoftware-based human capital management servicessolution that automates the acquisition and manage-ment of both full-time and contingent workers.Beeline operates primarily in the United States andits’ clients are principally Fortune 1000 companies.
Beeline maintains a full-time staff to support itsoperations and seeks to collect a service chargebased upon the usage of this service. Subsequent tothe initial start up costs and time, minimal cost andresources are required for the usage of Beeline’s services.
European IT Services segment Our European IT services segment is comprised ofModis International. Modis International, headquarteredin the United Kingdom, specializes in providing ITcontract consultants throughout the United Kingdomand certain continental European markets. ModisInternational has been in operation for over 30 years.It has 10 offices located across the United Kingdom,and an office each in Belgium, Germany, Poland, andthe Netherlands. It employs approximately 1,900billable consultants.
Employees
MPS employs approximately 16,400 consultants andapproximately 2,500 full-time staff employees.Approximately 250 of the employees work atcorporate headquarters.
As described below, in most jurisdictions, we, as theemployer of the consultants or as otherwise requiredby applicable law, are responsible for employmentadministration. This administration includes collectionof withholding taxes, employer contributions for socialsecurity or its equivalent outside the United States,unemployment tax, maintaining workers’ compensationand fidelity and liability insurance, and other govern-mental requirements imposed on employers. Full-timeemployees are covered by life and disability insuranceand receive health insurance and other benefits.
16 MPS Group

Government Regulations
Outside of the United States and Canada, the staffingservices industry is closely regulated. These regulationsdiffer among countries but generally may regulate: (i) therelationship between us and our temporary employees;(ii) registration, licensing, record keeping, and reportingrequirements; and (iii) types of operations permitted.Regulation within the United States and Canada hasnot materially impacted our operations.
In many countries, including the United States and theUnited Kingdom, staffing services firms are consideredthe legal employers of the temporary consultants whilethe consultant is on assignment with a company client.Therefore, laws regulating the employer/employeerelationship, such as tax withholding or reporting,social security or retirement, anti-discrimination, andworkers’ compensation, govern us. In other countries,staffing services firms, while not the direct legalemployer of the consultant, are still responsible forcollecting taxes and social security deductions andtransmitting such amounts to the taxing authorities.
Intellectual Property
We seek to protect our intellectual property throughcopyright, trade secret and trademark law and throughcontractual non-disclosure restrictions. Our servicesoften involve the development of work and materialsfor specific client engagements, the ownership of whichis frequently assigned to the client. We do at times, andwhen appropriate, negotiate to retain the ownership orcontinued use of development tools or know howcreated or generated by us for a client in the deliveryof our services, which we may then license or use inthe delivery of our services to other clients.
Seasonality
Our quarterly operating results are affected by thenumber of billing days in the quarter and the seasonalityof our customers’ businesses. Demand for our serviceshas historically been lower during the calendar year-end, as a result of holidays, through February of thefollowing year, as our customers approve annualbudgets. Extreme weather conditions may also affectdemand in the early part of the year as certain of ourclients’ facilities are located in geographic areas subjectto closure or reduced hours due to inclement weather.In addition, we experience an increase in our cost ofsales and a corresponding decrease in gross profit andgross margin in the first fiscal quarter of each year, as aresult of certain state and federal employment tax resets.
Access to Company Information
Our common stock is listed on the New York StockExchange (‘NYSE’) under the ticker symbol ‘MPS’.Our Internet address is www.mpsgroup.com. We makeavailable through our Internet website our annual reportson Form 10-K, quarterly reports on Form 10-Q, andcurrent reports on Form 8-K, as soon as reasonablypracticable after filing such material with, or furnishingit to, the Securities and Exchange Commission. Theinformation contained on our website, or on otherwebsites linked to our website, is not part of thisdocument.
Risk Factors
We are subject to various risks and uncertainties thataffect our business. The most important of these risksand uncertainties are as follows:
Demand for our services is affected by the economicclimate in the industries and markets we serve. Thedemand for our services, in particular our staffingservices, is highly dependent upon the state of economyand upon the staffing needs of our clients. Anyvariation in the economic condition or unemploymentlevels of the United States or of any of the foreigncountries in which our brands/operating units dobusiness, or in the economic condition of any regionof any of the foregoing, or in any specific industry,may severely reduce the demand for our services andthereby significantly decrease our revenues and profits.
Our market is highly competitive with low barriersto entry. Our industry is intensely competitive andhighly fragmented, and because it is a service business,the barriers to entry are quite low. There are manycompetitors, and new ones are entering the marketconstantly. In addition, some of these competitorshave greater resources than us. Competition ariseslocally, regionally, nationally, internationally and incertain cases from remote locations, particularly fromoffshore locations such as India.
Certain of our contracts are awarded on the basis ofcompetitive proposals, which can be periodically re-bidby the client. There can be no assurance that existingcontracts will be renewed on satisfactory terms or thatadditional or replacement contracts will be awarded tous. In addition, long-term contracts form a negligibleportion of our revenue. Therefore, there can be noassurance that we will be able to retain clients or marketshare in the future. Nor can there be any assurancethat we will, in light of competitive pressures, be ableto remain profitable or, if profitable, maintain ourcurrent profit margins.
17MPS Group

Our business requires a qualified candidate pool, whichwe may not be able to recruit or maintain. Our staffingservices consist of the placement of individuals seekingemployment in specialized IT and professional positions.Some of these sectors are characterized by a shortageof qualified candidates. There can be no assurance thatsuitable candidates for employment will continue to beavailable or will continue to seek employment throughus. Candidates generally seek temporary or regularpositions through multiple sources, including us andour competitors. Any shortage of qualified candidatescould materially adversely affect us.
Our business depends on key personnel, includingexecutive officers, local managers and field personnel.We are engaged in the services business. As such, oursuccess or failure is highly dependent upon theperformance of our management personnel andemployees, rather than upon technology or upontangible assets (of which we have few). There can beno assurance that we will be able to attract and retainthe personnel that are essential to our success.
We have to comply with existing governmentregulation and are exposed to increased regulation ofthe workplace. Our business is subject to regulation orlicensing in many states and in certain foreigncountries. While we have had no material difficultycomplying with regulations in the past, there can beno assurance that we will be able to continue to obtainall necessary licenses or approvals or that the cost ofcompliance will not prove to be material. Any inabilityto comply with government regulation or licensingrequirements could materially adversely affect us.Additionally, our staffing services entails employingindividuals on a temporary basis and placing suchindividuals in clients’ workplaces. Increased governmentregulation of the workplace or of the employer-employeerelationship could materially adversely affect us.
We are exposed to employment-related claims andcosts and other litigation. Our staffing services entailsemploying individuals on a temporary basis andplacing such individuals in clients’ workplaces. Ourability to control the workplace environment is limited.As the employer of record of our temporary employees,we incur a risk of liability to our temporary employeesfor various workplace events, including claims of physicalinjury, discrimination, harassment, or retroactiveentitlement to employee benefits. We also incur a riskof liability to our clients resulting from allegations oferrors, omissions, misappropriation, or theft of propertyor information by our temporary employees. Wemaintain insurance with respect to many of such claims.While such claims have not historically had a materialadverse effect on us, there can be no assurance that wewill continue to be able to obtain insurance at a cost
that does not have a material adverse effect upon us orthat such claims (whether by reason of us not havinginsurance or by reason of such claims being outsidethe scope of our insurance) will not have a materialadverse effect upon us.
We depend on our reputation to sell our services. Thesuccess of our brands is highly dependent upon theirreputations. The reputations of our staffing businessesin turn depend upon the perceived quality of theprofessionals we employ and staff with our customers—consequently, if our customers are dissatisfied with ouremployees, our brands will be harmed. Any event thatadversely impacts the reputation of a brand couldmaterially affect our results of operations.
The price of our common stock may fluctuatesignificantly. The market price for our common stockcan fluctuate as a result of a variety of factors, includingfactors listed in these “Risk Factors,” many of whichare beyond our control. These factors include actual oranticipated variations in quarterly operating results;announcements of new services by our competitors orus; announcements relating to strategic relationshipsor acquisitions; changes in financial estimates or otherstatements by securities analysts; and other changes ingeneral economic conditions. Because of this, we mayfail to meet or exceed the expectations of our shareholdersor of our securities analysts, and the market price forour common stock could fluctuate as a result.
Properties
Our corporate headquarters, located in Jacksonville,Florida, is on lease through 2012. Our business servicesare conducted through more than 185 offices locatedin the United States, Canada, the United Kingdom,and continental Europe. Almost all of our offices areon lease, with the terms of an average office leasebeing from three to six years.
We believe that our facilities are generally adequatefor our needs and do not anticipate difficulty replacingsuch facilities or locating additional facilities, ifneeded. Additional information on lease commitmentscan be found in Footnote 6 to the ConsolidatedFinancial Statements.
Legal Proceedings
We are a party to a number of lawsuits and claimsarising out of the ordinary conduct of our business. Inthe opinion of management, based on the advice ofin-house and external legal counsel, the lawsuits andclaims pending are not likely to have a material adverseeffect on us, our financial position, our results ofoperations, or our cash flows.
18 MPS Group

Submission of Matters to a Vote of Security Holders
No matters were submitted to a vote of security holders during the fourth quarter of 2004.
Market for Registrant’s Common Equity, Related Stockholder Matters and Issuer Purchases of EquitySecurities
Market Price and Related Matters The following table sets forth the high and low sale prices of our Common Stock, as reported by the NYSE, duringthe two years ended December 31, 2004:
See the factors set forth above in ‘Risk Factors,’ for factors that may impact the price of our Common Stock.As of March 1, 2005, there were approximately 889 holders of record of our Common Stock.
We have not paid to-date a cash dividend or other cash distribution with respect to our Common Stock. Wecurrently intend to retain any earnings to provide for the operation and expansion of our business and do notanticipate paying any cash dividends in the foreseeable future.
Issuer Repurchases of Equity Securities In 1999, our Board of Directors authorized the repurchase of up to $65 million of our Common Stock.Beginning in the third quarter of 2002 through the year-end of 2004, approximately 5.1 million shares at a cost of$39.9 million have been repurchased under this authorization. The following table sets forth information aboutour Common Stock repurchases for the three months ended December 31, 2004. There is no expiration date forthis authorization.
19MPS Group
Maximum Number (orTotal Number of Approximate DollarShares Purchased Value) of Shares That
Total Number Part of Publicly May Yet be Purchasedof Shares Average Price Announced Under the
Period (1) Repurchased Paid per Share Plans or Programs Plans or Programs
October 1, 2004 to October 31, 2004 462,682 $8.67 462,682 $25,058,171November 1, 2004 to November 30, 2004 — — — 25,058,171December 1, 2004 to December 31, 2004 — — — 25,058,171Total 462,682 $8.67 462,682 $25,058,171
(1) Based on trade date, not settlement date.
Year 2004 High LowFirst quarter $ 11.21 $ 9.35
Second quarter 12.12 9.96
Third quarter 11.62 7.87
Fourth quarter 12.38 8.92
Year 2003 High LowFirst quarter $ 6.24 $ 4.75
Second quarter 7.58 5.20
Third quarter 10.10 6.83
Fourth quarter 10.65 8.55

Selected Financial Data(in thousands, except per share amounts)
Years Ended 12-31-2004 12-31-2003 12-31-2002 12-31-2001 12-31-2000
Consolidated Statements of Operations data:Revenue $ 1,426,842 $ 1,096,030 $ 1,119,156 $ 1,500,615 $ 1,777,540Cost of revenue 1,066,055 808,890 834,318 1,105,781 1,269,760Gross profit 360,787 287,140 284,838 394,834 507,780Operating expenses 309,551 251,623 255,929 342,918 388,338Amortization of goodwill (1) — — — 37,312 35,937
Impairment of investment — — 16,165 — ( 694 )Exit costs (recapture) ( 897 ) ( 284 ) 8,967 — —Asset write-down related to sale of
discontinued operations — — — — 13,122Operating income 52,133 35,801 3,777 14,604 71,077Other income (expense), net 1,437 553 ( 3,947 ) ( 9,199 ) ( 21,621 )Income (loss) from continuing operations
before income taxes and cumulative effectof accounting change 53,570 36,354 ( 170 ) 5,405 49,456
Provision (benefit) for income taxes 18,150 14,519 13,832 3,102 ( 65,834 )Income (loss) from continuing
operations before cumulativeeffect of accounting change 35,420 21,835 ( 14,002 ) 2,303 115,290
Discontinued operations: (2)
Income (loss) from discontinued operations, net of tax — ( 2,395 ) 1,410 6,040 4,463
Gain (loss) on sale of discontinued operations, net of tax — ( 20,675 ) — — —
Income (loss) before cumulative effect of accounting change 35,420 ( 1,235 ) ( 12,592 ) 8,343 119,753
Cumulative effect of accounting change,net of tax (1) — — ( 553,712 ) — —
Net income (loss) $ 35,420 $ ( 1,235 ) $ ( 566,304 ) $ 8,343 $ 119,753
Basic income (loss) per common share:From continuing operations $ 0.34 $ 0.21 $ ( 0.14 ) $ 0.02 $ 1.19From discontinued operations $ — $ ( 0.02 ) $ 0.01 $ 0.06 $ 0.05From sale of discontinued operations $ — $ ( 0.20 ) $ — $ — $ —From accounting change $ — $ — $ ( 5.49 ) $ — $ —
Basic income (loss) per common share $ 0.34 $ ( 0.01 ) $ ( 5.62 ) $ 0.09 $ 1.24Diluted income (loss) per common share:
From continuing operations $ 0.33 $ 0.21 $ ( 0.14 ) $ 0.02 $ 1.18From discontinued operations $ — $ ( 0.02 ) $ 0.01 $ 0.06 $ 0.05From sale of discontinued operations $ — $ ( 0.20 ) $ — $ — $ —From accounting change $ — $ — $ ( 5.49 ) $ — $ —
Diluted income (loss) per common share $ 0.33 $ ( 0.01 ) $ ( 5.62 ) $ 0.08 $ 1.23Basic average common shares outstanding 102,804 101,680 100,833 97,868 96,675Diluted average common shares outstanding 106,842 104,518 100,833 98,178 97,539
20 MPS Group

December 31, 2004 2003 2002 2001 2000(in thousands)
Consolidated Balance Sheet data:Working capital $ 232,133 $ 216,879 $ 171,154 $ 200,887 $ 242,872Total assets 954,604 893,151 892,974 1,533,863 1,645,414Long term debt — — — 101,000 194,000Stockholders’ equity(1) 835,663 793,462 781,559 1,310,811 1,303,218
(1) The Company recognized an impairment loss associated with its adoption of Statement of Financial Accounting Standards (SFAS)No. 142 “Goodwill and Other Intangible Assets,” effective January 1, 2002. This loss was recorded as a Cumulative Effect of AccountingChange, and Reduced Stockholders’ Equity. In addition, SFAS No. 142 discontinued the periodic amortization of goodwill.
(2) The income (loss) from discontinued operations for the periods presented above and the 2003 loss on sale related to the discontinuedoutplacement unit, sold in December 2003.
21MPS Group
Management’s Discussion and Analysis ofFinancial Condition and Results of Operations
MPS Group, Inc. (the Company) is a leading providerof business services with over 185 offices throughoutthe United States, Canada, the United Kingdom, andcontinental Europe. We deliver specialty staffing,consulting and business solutions to virtually allindustries in the following disciplines, through thefollowing primary brands:
Brand(s) DisciplineModis® Information Technology (IT)
ServicesBadenoch & Clark®, Accounting and FinanceAccounting Principals®Entegee® EngineeringSpecial Counsel® LegalIdea Integration® IT SolutionsSoliant Health® Health CareBeeline® Human Capital Automation
Historically, we have presented the financial results ofour operations under three reporting segments:Professional services, IT services, and IT solutions. Inan effort to better align the reporting of our financialresults with the manner in which we currently manageour business, we revised the presentation of ourfinancial results from three to four reporting segmentsin the fourth quarter of 2004. Our four reportingsegments are North American Professional services,European Professional services, North American ITservices and European IT services. Prior periods havebeen reclassified to conform to this presentation.
Non-GAAP Financial Measures From time to time we may measure certain financialinformation on a ‘constant currency’ basis. Such constantcurrency financial data is not a U.S. generally acceptedaccounting principles (GAAP) financial measure.
Constant currency removes from financial data theimpact of changes in exchange rates between the U.S.dollar and the functional currencies of our foreignsubsidiaries, by translating the current period financialdata into U.S. dollars using the same foreign currencyexchange rates that were used to translate the financialdata for the previous period. We believe presentingcertain results on a constant currency basis is useful toinvestors because it allows a more meaningful comparisonof the performance of our foreign operations from periodto period. Additionally, certain internal reporting andcompensation targets are based on constant currencyfinancial data for our various foreign subsidiaries.However, constant currency measures should not beconsidered in isolation or as an alternative to financialmeasures that reflect current period exchange rates, orto other financial measures calculated and presentedin accordance with GAAP.
From 2002 to 2004, we acquired ten businesses for ourNorth American professional services segment (together,the “Acquisitions”): four legal staffing businessesacquired in February of 2003, August of 2003, Augustof 2004, and October of 2004; three health carestaffing businesses acquired in June of 2002, Februaryof 2004, and March of 2004; and three accountingstaffing businesses acquired in February of 2004, Julyof 2004, and October 2004. From time to time wemay measure certain financial information excludingthe effect of acquisitions. Such financial data thatexcludes the effect of businesses we acquire is not aGAAP financial measure. We believe presenting someresults excluding the effects of businesses we acquire ishelpful to investors because it permits a comparison ofthe performance of our core internal operations fromperiod to period. Additionally, certain internal reportingand compensation targets are based on the performanceof core internal operations. The effect of a business weacquire is excluded for the first 12 months followingthe acquisition date. Subsequent to this, a business is

considered to be integrated for reporting purposes.Again however, such measures should be consideredonly in conjunction with the correlative measures thatinclude the results from acquisitions, as calculated andpresented in accordance with GAAP.
Additionally, from time to time we may use EBITDAto measure results of operations. EBITDA is a non-GAAP financial measure that is defined as earningsbefore interest, taxes, depreciation and amortization.We believe EBITDA is a meaningful measure ofoperating performance as it gives management aconsistent measurement tool for evaluating the operatingactivities of the business as a whole, as well as, thevarious operating units, before the effect of investingactivities, interest and taxes. In addition, we believeEBITDA provides useful information to investors,analysts, lenders, and other interested parties becauseit excludes transactions that management considersunrelated to core business operations, thereby helpinginterested parties to more meaningfully evaluate, trendand analyze the operating performance of our business.We also use EBITDA for certain internal reportingpurposes, and certain compensation targets may bebased on EBITDA. Finally, certain covenants in ourdebt facility are based on EBITDA performancemeasures. EBITDA, as with all non-GAAP financialmeasures, should be considered only in conjunction withthe comparable measures, as calculated and presentedin accordance with GAAP, including net income.
Discontinued Operations In December 2003, we sold certain operating assets andtransferred certain operating liabilities of our outplace-ment unit. As a result of the sale of this unit and inaccordance with GAAP, the Consolidated FinancialStatements and Management’s Discussion and Analysisof Financial Condition and Results of Operationsreport the results of operations of our outplacementunit as Discontinued Operations for all periodspresented. Revenue generated by this unit was $21.0million and $35.8 million, in 2003 and 2002, respectively.Income (loss) before taxes was $(3.7) million and $2.2million, for 2003 and 2002, respectively. We recordedcontract termination costs of $732,000 in 2002, and,as a result of the sale, an additional $705,000 in 2003.Additional information on contract termination costscan be found in Exit Costs below. Additional informationon Discontinued Operations can be found in Footnote17 to the Consolidated Financial Statements.
Critical Accounting Policies We prepare our financial statements in conformitywith accounting principles generally accepted in theUnited States of America. Associated with this, webelieve the following are our most critical accountingpolicies in that they are the most important to the
portrayal of our financial condition and results andrequire management’s most difficult, subjective orcomplex judgments.
Revenue Recognition We recognize substantially all revenue at the timeservices are provided, and on a time and materials basis.In most cases, the consultant is our employee and allcosts of employing the worker are our responsibility andare included in cost of revenue. Revenues is generatedwhen we permanently place an individual with a clientare recorded at the time of start.
In addition and to a lesser extent, we are involved infixed price or lump-sum engagements. The services werender under the relevant contracts generally requireperformance spanning more than one accountingperiod. We recognize revenue for these engagementsunder the proportional performance accounting model.
Allowance for Doubtful Accounts We regularly monitor and assess our risk of notcollecting amounts we are owed by our customers.This evaluation is based upon a variety of factorsincluding: an analysis of amounts current and past duealong with relevant history and facts particular to thecustomer. Based upon the results of this analysis, werecord an allowance for uncollectible accounts for thisrisk. This analysis requires us to make significantestimates, and changes in facts and circumstancescould result in material changes in the allowance fordoubtful accounts.
Income Taxes The provision for income taxes is based on incomebefore taxes as reported in the ConsolidatedStatements of Operations. Deferred tax assets andliabilities are recognized for the expected future taxconsequences of events that have been included in thefinancial statements or tax returns. Under this method,deferred tax assets and liabilities are determined basedon the differences between the financial statementcarrying amounts and the tax basis of assets andliabilities using enacted tax rates in effect for the yearin which the differences are expected to reverse. Anassessment is made as to whether or not a valuationallowance is required to offset deferred tax assets. Thisassessment includes anticipating future income.
Significant management judgment is required indetermining the provision for income taxes, deferredtax assets and liabilities and any valuation allowancerecorded against our deferred tax assets. Managementevaluates all available evidence to determine whetherit is more likely than not that some portion or all ofthe deferred income tax assets will not be realized.The establishment and amount of a valuation allowance
22 MPS Group

requires significant estimates and judgment and canmaterially affect our results of operations. Our effectivetax rate may vary from period to period based, forexample, on changes in estimated taxable income orloss, changes to the valuation allowance, changes tofederal, state or foreign tax laws, completion of federal,state or foreign audits, deductibility of certain costs andexpenses by jurisdiction, and as a result of acquisitions.
We have a net deferred tax asset as of December 31,2004 and 2003, primarily due to the impairment lossrecorded as a change in accounting principle associatedwith our adoption of Statement of Financial AccountingStandards (SFAS) No. 142 in 2002. This impairmentreduced the financial statement-carrying amount ofgoodwill, which resulted in the tax basis of tax-deductiblegoodwill being greater than the financial statement-carrying amount. Our tax basis in tax-deductiblegoodwill will be deducted in our income tax returns,generating $370.4 million of future tax deductionsover the next 15 years.
We are subject to periodic review by federal, state,foreign and local taxing authorities in the ordinarycourse of business. In 2002, we recorded an $8.7million charge for an agreed upon adjustment relatedto an audit of our prior years’ tax returns. Additionalinformation on Income Taxes can be found inFootnote 7 to the Consolidated Financial Statements.
Stock Option Plans We have historically issued stock options to employeesand directors as an integral part of our compensationprograms. U.S. GAAP allows alternative methods ofaccounting for these plans. We have chosen to accountfor our stock option plans under Accounting PrinciplesBoard Opinion No. 25, Accounting for Stock Issued toEmployees (“APB 25”). Under APB 25, the intrinsicvalue of the options is used to record compensationexpense and, as a result, no compensation expenserelated to stock options is included in determining netincome and net income per share in the ConsolidatedFinancial Statements. Restricted stock grants areaccounted for in accordance with APB 25, whichmandates that restricted stock grants with performanceconditions be calculated using the intrinsic value. Asrequired by SFAS No. 148, Accounting for Stock-BasedCompensation—Transition and Disclosure (“SFAS148”), calculations of pro forma net income (loss) andnet income (loss) per share, computed in accordancewith the method prescribed by SFAS No. 123,Accounting for Stock-Based Compensation (“SFAS 123”),are set forth in Footnote 2 to the ConsolidatedFinancial Statements.
We expect to adopt the provisions of SFAS No. 123(revised 2004), Share-Based Payments (“SFAS 123R”),which replaces SFAS No. 123 and supercedes APBOpinion No. 25. SFAS 123R requires all share-basedpayments to employees, including grants of employeestock options, to be recognized in the financialstatements based on their fair values, beginning withthe first interim or annual period after June 15, 2005.The pro forma disclosures previously permitted underSFAS 123 no longer will be an alternative to financialstatement recognition. Under SFAS 123R, we mustdetermine the appropriate fair value model to be usedfor valuing share-based payments, the amortizationmethod for compensation cost and the transition methodto be used at the date of adoption. The transitionmethods include prospective and retroactive adoptionalternatives. Under the retroactive alternatives, priorperiods may be restated either as of the beginning ofthe year of adoption or for all periods presented. Theprospective method requires that compensation expensebe recorded for all unvested stock options and restrictedstock at the beginning of the first quarter of adoptionof SFAS 123R, while the retroactive methods wouldrecord compensation expense for all unvested stockoptions and restricted stock beginning with the firstperiod restated. We are evaluating the requirements ofSFAS 123R and have not yet determined the methodof adoption or the effect of adopting SFAS 123R, norhave we determined whether the adoption will resultin amounts that are similar to the current pro formadisclosures under SFAS 123.
Impairment of Tangible and Intangible Assets For acquisitions, we allocate the excess of cost overthe fair market value of the net tangible assets first toidentifiable intangible assets, if any, and then togoodwill. In connection with SFAS No. 142, Goodwilland Other Intangible Assets, we are required to perform, atleast annually, goodwill impairment reviews utilizing afair-value approach. Additionally, SFAS No. 142required a transitional goodwill impairment reviewupon adoption.
We adopted SFAS No. 142 as of January 1, 2002.After performing the required transitional goodwillimpairment tests, we recognized a loss of $553.7million, net of an income tax benefit of $113.0 million,and recorded the loss (net of the related tax benefit) asa cumulative effect of an accounting change in theConsolidated Statement of Operations for 2002. Weperformed additional valuation testing during thefourth quarter of 2002, 2003 and 2004 (our designatedtiming of the annual impairment test under SFAS No.142) and did not incur any further impairment. Weplan to perform our next annual impairment reviewduring the fourth quarter of 2005. An impairment
23MPS Group

review prior to our next scheduled annual review maybe required if certain events occur, including lowerthan forecasted earnings levels for various reportingunits. In addition, changes to other assumptions couldsignificantly impact our estimate of the fair value of ourreporting units. Such a change may result in a goodwillimpairment charge, which could have a significantimpact on the reportable segments that include therelated reporting units and the Consolidated FinancialStatements.
As part of our goodwill impairment reviews, fair valuewas calculated using an equally blended value of adiscounted cash flow analysis and market comparables.In contrast to SFAS 142, the prior accounting standard(SFAS No. 121) required the use of undiscountedcash flow estimates over the remaining useful life ofthe goodwill and other long-lived assets as a step 1test for possible impairment. Under SFAS No. 121,the concept of recoverability of the goodwill over theuseful life of the asset was the underlying test forimpairment as opposed to fair value under SFAS No.142. This fundamental difference in the underlyingmethodologies of testing for impairment of goodwillin SFAS No. 121 and SFAS No. 142 caused us toattribute the resulting impairment from the initialvaluation completed on January 1, 2002 to a change inaccounting principle upon the adoption of SFAS No.142. Projected cash flows, used for both SFAS No. 121and No. 142 testing, considered the effects from thethen downturn in our business.
As mentioned above, we used an equally blendedvalue of a discounted cash flow analysis and marketcomparables to arrive at fair value for SFAS No. 142.For the discounted cash flow analysis, significantassumptions included expected future revenue growthrates, reporting unit profit margins, working capitallevels and a discount rate. The revenue growth ratesand reporting unit profit margins are based, in part, onour expectation of an improving economic environment.Market comparables included a comparison of themarket ratios and performance fundamentals fromcomparable companies. The use of these measurementcriteria is consistent with the underlying concepts usedin determining the fair value of a company or reportableunit under the market approach. The market ratioswe used refer to the multiples of revenue and earningsof comparable companies and the performancefundamentals refer to the consideration of the effectsof the differences in the operating metrics, i.e. growthrates, operating margins, gross margins, etc. on ourvalue versus the comparable companies. Additionalinformation on Goodwill can be found in Footnote 5to the Consolidated Financial Statements.
We amortize the cost of identifiable intangible assets(either through acquisition or as part of intellectualproperty) over their estimated useful lives unless suchlives are deemed indefinite. We review our long-livedassets and identifiable intangibles for impairmentwhenever events or changes in circumstances indicatethat the carrying amount of the asset may not berecoverable. In performing the review for recoverability,we estimate the future cash flows expected to resultfrom the use of the asset and its eventual disposition.If the sum of the expected future cash flows(undiscounted and without interest charges) is lessthan the carrying amount of the asset, an impairmentloss is recognized. Otherwise, an impairment loss isnot recognized. Measurement of an impairment lossfor long-lived assets and identifiable intangibles wouldbe based on the fair value of the asset.
Exit Costs In 2001 and 2002, we experienced a material decreasein demand for our domestic operations. To reflect thisdecreased demand, we made attempts to realign our realestate capacity needs and thus vacate and reorganizecertain office space.
In 2002, management determined that we would notbe able to utilize this vacated office space. Thisdetermination eliminated the economic benefitassociated with the vacated office space. As a result,we recorded $9.0 million of contract termination costsin 2002, mainly due to costs that will continue to beincurred under the lease contract for its remaining termwithout economic benefit to us. These terminationcosts were recorded in accordance with SFAS No. 146,Accounting for Costs Associated with Exit or DisposalActivities, which requires that a liability for a costassociated with an exit or disposal activity be recognized,at fair value, when the liability is incurred rather than atthe time an entity commits to a plan. In 2003 and 2004,we recaptured $284,000 and $897,000, respectively, ofthese costs relating to the settlement of the abandonedspace. We continually look for ways to either settle orsublease our remaining abandoned real estate andreview, as necessary, our assumptions associated withour abandoned real estate. The average remaininglease term for the lease obligations included herein isapproximately 5 years. Additional information onExit Costs can be found in Footnote 16 to theConsolidated Financial Statements.
24 MPS Group

Executive Summary
We believe that economic conditions strengthened in2004, both in the United States and abroad, whichfavorably impacts both MPS and our industry. For 2004,we were able to grow revenue in all of our operatingunits. In addition to the improved macroeconomicconditions, we believe this growth resulted from ourinvestments in staff, the ability to execute our acquisitionstrategy, new service offerings, and new office openings.We expect our revenue to continue to be impacted bygeneral macroeconomic conditions in 2005.
Our revenue increased 30.2% from 2003, while ouroperating income increased 45.6% from 2003. However,our gross margin decreased 90 basis points due to lowergross margins in our IT services division and EuropeanProfessional services segment, and a higher concentrationof our revenue being generated from our lowest grossmargin segment, the European IT services segment.For 2005, we will continue to look for opportunities toincrease gross margin along with increasing operatingleverage within each segment. In addition, we have afoundation for growth with more than $100 millionof cash on hand at year-end, a $150 million creditfacility with no outstanding borrowings, no long-termdebt, and working capital of $232.1 million.
The following detailed analysis of operations shouldbe read in conjunction with the 2004 ConsolidatedFinancial Statements and related footnotes includedelsewhere in this Form 10-K.
Results of Operations for the Three Years EndedDecember 31, 2004 Consolidated revenue was $1,426.8 million, $1,096.0million, and $1,119.2 million in 2004, 2003 and 2002,respectively, increasing by 30.2% in 2004 anddecreasing by 2.1% in 2003.
Consolidated gross profit was $360.8 million, $287.1million, and $284.8 million in 2004, 2003 and 2002,respectively, increasing by 25.6% and by 0.8% in 2004and 2003, respectively. The consolidated gross marginwas 25.3%, 26.2% and 25.5% in 2004, 2003 and 2002,respectively.
Consolidated operating expenses were $308.7 million,$251.3 million, and $281.1 million, in 2004, 2003 and2002, respectively, increasing by 22.8% in 2004 anddecreasing by 10.6% in 2003. General and adminis-trative (G&A) expenses, which are included in operatingexpenses, were $293.8 million, $234.6 million, and$235.7 million, in 2004, 2003 and 2002, respectively,increasing by 25.2% in 2004 and decreasing by 0.5%in 2003.
Consolidated operating income was $52.1 million,$35.8 million, and $3.8 million in 2004, 2003 and 2002,respectively, increasing by 45.5% in 2004. Operatingincome as a percentage of revenue was 3.7%, 3.3% and0.3% in 2004, 2003 and 2002, respectively.
Segments
Professional Services division North American Professional Services segment Revenue in our North American Professional servicessegment was $429.6 million, $315.8 million, and$281.6 million, for 2004, 2003 and 2002, respectively,increasing by 36.0% and by 12.1% in 2004 and 2003,respectively. Acquisitions contributed $60.6 million,$19.6 million, and $9.1 million in revenue in 2004,2003 and 2002, respectively. The following contributedto the increase in revenue for both 2004 and 2003:we executed on our acquisition strategy; we madeconsiderable investments in staff; and we introducedadditional service offerings. We completed 10 acquisi-tions from 2002 to 2004, and between these acquisitionsand internal staff investments, we increased our staffheadcount by 51% in 2004 compared to 9% in 2003.The internal staff investments were in anticipation ofincreased demand and were coupled with the addedservice offerings to our Special Counsel, AccountingPrincipals, and Soliant Health brands/operating unitsin 2004.
Revenue contribution in the North AmericanProfessional services operating units for 2004, 2003and 2002 was as follows:
2004 2003 2002Entegee 49.6% 56.9% 61.3%Special Counsel 24.5 24.8 20.8Accounting Principals 13.3 9.6 11.8Soliant Health 11.7 6.2 3.2Other 0.9 2.5 2.9
Gross profit in our North American Professionalservices segment was $123.8 million, $89.1 million, and$79.7 million, for 2004, 2003 and 2002, respectively,increasing by 38.9% and by 11.8% in 2004 and 2003,respectively. Acquisitions contributed $19.7 million,$6.1 million, and $2.7 million in gross profit in 2004,2003 and 2002, respectively. Gross margin in ourNorth American Professional services segment was28.8%, 28.2% and 28.3% in 2004, 2003 and 2002,respectively. The increase in gross margin in 2004 wasdue primarily to an increase in direct hire fees. Directhire fees, which generate higher margin, increased to4.5% of the segment’s revenue, from 3.6% in 2003.
25MPS Group

G&A expenses in our North American Professionalservices segment were $88.4 million, $69.3 million, and$60.3 million, in 2004, 2003 and 2002, respectively,increasing by 27.5% and by 14.9% in 2004 and 2003,respectively. As a percentage of revenue, G&A expenseswere 20.6%, 21.9%, and 21.4%, for 2004, 2003 and2002, respectively. The increase in G&A expenses forboth 2004 and 2003 was due primarily to the increasein compensation expense related to the increases inthe segment’s revenue, our investment in additionalsales and recruiting personnel, and additional G&Afrom Acquisitions.
Operating income was $30.9 million, $16.0 million, and$15.1 million in 2004, 2003 and 2002, respectively,increasing by 93.1% and by 6.0% in 2004 and 2003,respectively. Operating income as a percentage ofrevenue was 7.2%, 5.1% and 5.4% in 2004, 2003 and2002, respectively.
European Professional Services segment Revenue in our European Professional services segmentwas $289.1 million, $198.3 million, and $177.7 million,for 2004, 2003 and 2002, respectively, increasing by45.8% and by 11.6% in 2004 and 2003, respectively.Changes in foreign currency exchange rates contributed$31.2 million in revenue from 2003 to 2004, and$16.0 million in revenue from 2002 to 2003. Theincrease in revenue in 2004 was due primarily to anoverall improvement of the economic environment,coupled with our substantial investment in sales andrecruiting personnel across our service lines. Weincreased our staff headcount by 31% in 2004 inanticipation of increased demand. The increase inrevenue in 2003 was due primarily to diversifying ourclient base including moving into sectors, such aspublic sector and not-for-profit organizations that wehistorically have not relied upon. Traditionally, thissegment has focused on servicing financial services,accounting and finance, and human resources clients.
Gross profit in our European Professional servicessegment was $80.4 million, $58.2 million, and $54.4million, in 2004, 2003 and 2002, respectively,increasing by 38.1% and by 7.0% in 2004 and 2003,respectively. Changes in foreign currency exchangerates contributed $8.7 million in gross profit from 2003to 2004, and $4.7 million from 2002 to 2003. Grossmargin in our European Professional services segmentwas 27.8%, 29.4%, and 30.6% in 2004, 2003 and 2002,respectively. The decrease in gross margin in 2004 wasdue to a shift in the mix of services provided by thissegment along with the increased competition forcandidates. We have been able to increase our billrates in 2004 from our 2003 and 2002 levels.However, the increased competition for candidates has
led to a greater increase in pay rates, and therefore adecrease in the bill and pay rate spread. The decrease ingross margin in 2003 was due primarily to a decreasein direct hire fees. Direct hire fees decreased to 6.8%of the segment’s revenue in 2003, from 8.0% in 2002.
G&A expenses in our European Professional servicessegment were $65.6 million, $44.6 million, and $36.7million, in 2004, 2003 and 2002, respectively, increasingby 47.3% and by 21.5% in 2004 and 2003, respectively.As a percentage of revenue, G&A expenses were22.7%, 22.5%, and 20.6%, for 2004, 2003 and 2002,respectively. The increase in G&A expenses was dueto the following: the increase in compensation expenserelated to the increases in the segment’s revenue in2004 and 2003; our investment in additional sales andrecruiting personnel in 2004; the effect of exchangerates in 2004 and 2003; and additional infrastructureexpenses and costs to retain personnel in 2003.
Operating income was $13.2 million, $12.5 million, and$16.2 million in 2004, 2003 and 2002, respectively,increasing by 4.8% in 2004 and decreasing by 22.8%in 2003. Operating income as a percentage of revenuewas 4.6%, 6.3% and 9.1% in 2004, 2003 and 2002,respectively.
IT Services division North American IT Services segment Revenue in our North American IT services segmentwas $459.5 million, $401.2 million, and $484.6 million,for 2004, 2003 and 2002, respectively, increasing by14.5% in 2004 and decreasing by 17.2% in 2003. Theincrease in revenue in 2004 was due to a combinationof increased spending on IT initiatives by our clientsand our investment in staff. In order to capitalize onthe improving macroeconomic trends, we increased ourstaff headcount by 15% during 2004. Revenue fromthis segment in 2003 was adversely impacted by thediminished demand for IT-related services. Specifically,our customers in 2003 continued to experience aconstrained ability to spend on IT initiatives due touncertainties relating to the economy.
Revenue within the North American IT servicessegment is generated primarily from Modis, as itgenerated 82.8%, 81.5% and 82.5% of the segment’srevenue for 2004, 2003 and 2002, respectively. IdeaIntegration and Beeline are responsible for theremainder of this segment’s revenue.
Gross profit in our North American IT services segmentwas $123.8 million, $112.8 million, and $122.8 million,in 2004, 2003 and 2002, respectively, increasing by9.8% in 2004 and decreasing by 8.1% in 2003. Grossmargin in our North American IT services segmentwas 26.9%, 28.1%, and 25.4% in 2004, 2003 and 2002,
26 MPS Group

27MPS Group
respectively. The decrease in gross margin in 2004 wasdue primarily to lower utilization of Idea Integration’ssalaried consultants and to Modis’ increased presenceon national vendor lists. Revenue from clients on anational vendor list tends to generate a lower grossmargin due to these clients’ buying power. Modis wasable to stabilize gross margin in the second half of 2004by increasing its proportion of revenue from middlemarket clients, which tend to generate a higher grossmargin. In conjunction with the uncertaintiessurrounding the economy in 2002 and 2003, ourclients reduced the number of approved vendors. Welooked for Modis to remain on these vendor lists so thatwe would be poised for growth when macroeconomicconditions were more favorable. The increase in grossmargin in 2003 was due primarily to higher utilizationof Idea Integration’s salaried consultants and Modismore effectively managing the bill and pay rates spread.
G&A expenses in our North American IT servicessegment were $87.2 million, $78.7 million, and $94.1million, in 2004, 2003 and 2002, respectively, increasingby 10.8% and decreasing by 16.4% in 2004 and 2003,respectively. As a percentage of revenue, G&A expenseswere 19.0%, 19.6%, and 19.4%, for 2004, 2003 and2002, respectively. G&A expenses were affected by thefollowing: the increase and decrease in compensationexpense related to this segment’s increased 2004revenue and decreased 2003 revenue, respectively; andour investment in additional sales and recruitingpersonnel in 2004.
Operating income was $28.0 million, $23.2 million, and$15.6 million in 2004, 2003 and 2002, respectively,increasing by 20.7% in 2004 and by 48.7% in 2003.Operating income as a percentage of revenue was 6.1%,5.8% and 3.2% in 2004, 2003 and 2002, respectively.
European IT Services segment Revenue in our European IT services segment was$248.8 million, $180.7 million, and $175.2 million,for 2004, 2003 and 2002, respectively, increasing by37.7% and by 3.1% in 2004 and 2003, respectively.Changes in foreign currency exchange rates contributed$26.9 million in revenue from 2003 to 2004, and$14.6 million in revenue from 2002 to 2003. Theincrease in revenue in 2004 was due to increasedspending on IT initiatives by our UK market clients.
Gross profit in our European IT services segment was$32.8 million, $27.0 million, $27.9 million, in 2004,2003 and 2002, respectively, increasing by 21.5% in2004 and decreasing by 3.2% in 2003. Changes inforeign currency exchange rates contributed $3.5million in gross profit from 2003 to 2004, and $2.2million in gross profit from 2002 to 2003. Gross margin
in our European IT services segment was 13.2%, 14.9%,and 15.9% in 2004, 2003 and 2002, respectively. Thedecrease in gross margin was due primarily to a higherproportion of the segment’s growth being in the UKmarket, compared to the continental European market,and to a lesser extent, a shift in the mix of servicesprovided by the segment. Our gross margins fromrevenue generated in the UK market are generallylower than those in the continental European market.
G&A expenses in our European IT services segmentwere $29.2 million, $22.9 million, and $22.3 million,in 2004, 2003 and 2002, respectively, increasing by27.6% and by 2.7% in 2004 and 2003, respectively. Asa percentage of revenue, G&A expenses were 11.7%,12.6%, and 12.7%, for 2004, 2003 and 2002,respectively. The increase in G&A expenses was dueto the increase in compensation expense related to theincreases in the segment’s revenue in 2004, and theeffect of exchange rates in 2004 and 2003.
Operating income was $2.4 million, $2.9 million, and$4.7 million in 2004, 2003 and 2002, respectively,decreasing by 17.2% and by 38.3% in 2004 and 2003,respectively. Operating income as a percentage ofrevenue was 1.0%, 1.6% and 2.7% in 2004, 2003 and2002, respectively.
Corporate expenses and charges (recaptures) Included in consolidated operating expenses for 2002was a $25.1 million charge for an investmentimpairment and exit costs. Included in consolidatedoperating expenses for 2003 and 2004, respectively,was a $284,000 and an $897,000 recapture for theseexit costs.
The 2002 charge of $25.1 million was comprised ofthe following: (i) We elected not to participate in arecapitalization of a minority investment originally madein 1996. This election resulted in our investment beingimpaired. As a result, we wrote off the investment inits entirety resulting in a $16.2 million charge; (ii) Werecorded a $9.0 million charge for exit costs associatedwith the abandonment of excess real estate obligationsfor certain vacant office space.
In 2003 and 2004, we recaptured $284,000 and$897,000, respectively, of the costs relating to thesettlement of the abandoned office space. Changes tothe local real estate economy where we have thisabandoned real estate, and other factors originallyunforeseen to us, allowed us the opportunity to eithersettle or find acceptable subleasing opportunities earlierthan or for more than what we originally anticipated.

28 MPS Group
Unallocated corporate expenses pertain to certainfunctions, such as executive management, accounting,administration, tax, and treasury, that are not attribut-able to our operating units. Unallocated corporateexpense was $23.3 million, $19.1 million and $22.8million, in 2004, 2003 and 2002, respectively,increasing 22.0% in 2004 and decreasing 16.2% in2003. The increase in unallocated corporate expensein 2004 was due primarily to expenses related to theadoption of and compliance with the new internalcontrol requirements mandated by Section 404 of theSarbanes-Oxley Act of 2002 and the standards of thePublic Company Accounting Oversight Board, and toa lesser extent, higher incentive executive compensationbased on the Company’s improved financial perform-ance. The decrease in unallocated corporate expense in2003 was due primarily to the elimination of duplicativecorporate infrastructure, and to a lesser extent, lowerprovisions for incentive executive compensation based onthe Company’s financial performance. As a percentageof revenue, unallocated corporate expense was 1.6%,1.7% and 2.0%, for 2004, 2003 and 2002, respectively.
Consolidated other income (expense), net, was $1.4million, $0.6 million, and $3.9 million in 2004, 2003and 2002, respectively. Other income (expense), net,primarily includes interest income related to ourinvestments and cash on hand, net of interest expenserelated to notes issued in connection with acquisitionsand fees and interest on our credit facility. In 2002 wehad outstanding borrowings and incurred interestexpense in connection therewith.
The consolidated income tax provision was $18.2million, $14.5 million, and $13.8 million in 2004, 2003and 2002, respectively. Included in the 2004 incometax provision was a $1.3 million tax benefit associatedwith the settlement of a state income tax audit in thesecond quarter of 2004. Included in the provision for2002 was an $8.7 million charge for an agreed uponadjustment related to an audit by the Internal RevenueService of prior years’ tax returns. This charge, net of thetax benefit on the previously mentioned investmentimpairment and exit costs in 2002, increased the 2002income tax provision by $3.5 million. Pre-tax incomeincreased in 2004 compared to 2003, and in 2003compared to 2002. This increase resulted in a lowereffective income tax rate each year.
Consolidated income (loss) from continuing operationsbefore cumulative effect of accounting change was$35.4 million, $21.8 million and a $14.0 million loss, in2004, 2003, and 2002, respectively. The charge for theabove investment impairment and exit costs in 2002and the subsequent exit costs recaptures in 2003 and2004, had a 2.3%, 0.1%, and 0.1% impact, respectively,on operating income as a percentage of revenue.
Liquidity and Capital Resources
Changes to our liquidity during 2004, 2003 and2002 are due primarily to the net effect of (i) fundsgenerated by operations and stock option exercises,and (ii) funds used for acquisitions, repurchases ofcommon stock and capital expenditures. We expectthis to be consistent for 2005.
In 2004, cash of $71.3 million used in both investingand financing activities exceeded the $53.0 million ofcash provided from operating activities, the effect ofexchange rates and discontinued operations. Our net useof cash in 2004 was due to the following: our increasedacquisition activity; the use of our Board-approvedstock repurchase program; and a lower level of cashprovided by operations. In 2003, cash of $80.6 millionprovided from operating activities, financing activities,the effect of exchange rates and discontinuedoperations, exceeded the $22.7 million of cash usedfor investing activities. In 2002, cash of $117.0 millionprovided from operating activities, the effect of exchangerates and discontinued operations, exceeded the $99.2million of cash used for investing and financingactivities. The below table highlights working capitaland cash and cash equivalents as of December 31, 2004,2003 and 2002, respectively:(dollar amounts in millions)
December 31, 2004 2003 2002
Working capital $ 232.1 $ 216.9 $ 171.2Cash and cash equivalents 106.5 124.8 66.9
For 2004, 2003, and 2002, we generated $50.2 million,$70.3 million, and $111.5 million of cash flow fromoperations, respectively. The decrease in cash flow fromoperations in 2004, was due primarily to the use ofworking capital to support our revenue growth. Thisgrowth increased the cash needed to fund accountsreceivable, as we collect receivables within an averageof 50 days, while primarily paying our employees on aweekly basis. The decrease in cash flow from operationsin 2003, from 2002, was due primarily to thenormalizing of receivables collection. In 2001 and 2002,the main elements of our back office integration andconsolidation efforts were being completed. Theseefforts led to substantial improvements in receivablescollection for 2002.
For 2004, we used $57.3 million of cash for investingactivities, of which $50.2 million, net of cash acquired,was used for Acquisitions, and $9.6 million was usedfor capital expenditures. These uses were partially offsetby $2.4 million of proceeds from the sale of certainassets of our executive search brand.

29MPS Group
For 2003, we used $22.7 million of cash for investingactivities, of which $15.9 million, net of cash acquired,was used for Acquisitions, and $6.8 million was used forcapital expenditures. For 2002, we used $12.7 millionof cash for investing activities, of which $6.7 million,net of cash acquired, was used for Acquisitions, and$6.0 million was used for capital expenditures.
For 2004, we used $14.0 million of cash for financingactivities, primarily for $30.9 million of stockrepurchases, net of $18.3 million generated from stockoption exercises.
For 2003, we generated $2.7 million of cash fromfinancing activities, primarily from $10.9 million ofstock option exercises, net of $7.6 million used forstock repurchases.
For 2002, we used $86.5 million of cash for financingactivities, primarily for $101.4 million of repayments onour previous credit facility, net of $16.9 million generatedfrom stock option exercises. In addition, we used $1.4million for stock repurchases. These repayments weremainly funded from cash flows from operations.
Our Board of Directors authorized the repurchase of upto $65 million of our Common stock. We repurchased3.5 million shares at a cost of $30.9 million in 2004,which brought the total amount repurchased under thisplan to 5.1 million shares at a cost of $39.9 million atDecember 31, 2004. We anticipate that we will continueto purchase shares under this authorization in the future.We have not repurchased any shares to date in 2005.
We anticipate that capital expenditures for furniture andequipment, including improvements to our managementinformation and operating systems, during the nexttwelve months, will be approximately $10 million.
While there can be no assurance in this regard, webelieve that funds provided by operations, availableborrowings under the credit facility, and currentamounts of cash will be sufficient to meet ourpresently anticipated needs for working capital, capitalexpenditures, repurchases of common stock andacquisitions for at least the next 12 months.
Indebtedness, Contractual Obligations, and Commercial Commitments of the Company The following are contractual cash obligations and other commercial commitments at December 31, 2004:(in thousands)
Payments Due by PeriodTotal Less than 1 Year 1–3 Years 4–5 Years After 5 Years
Contractual cash obligations
Operating leases $ 53,367 $ 14,605 $ 26,740 $ 9,836 $ 2,186Other 2,553 2,553 — — —Total contractual cash obligations $ 55,920 $ 17,158 $ 26,740 $ 9,836 $ 2,186
Amount of Commitment Expiration per PeriodTotal Less than 1 Year 1–3 Years 4–5 Years After 5 Years
Commercial Commitments
Standby letters of credit $ 4,443 $ 4,443 $ — $ — $ —Total commercial commitments $ 4,443 $ 4,443 $ — $ — $ —
In 2003, we closed on a $150 million revolving creditfacility syndicated by a group of leading financialinstitutions. The credit facility contains certain financialand non-financial covenants relating to our operations,including maintaining certain financial ratios.Repayment, if applicable, of funds borrowed under thecredit facility is guaranteed by substantially all of oursubsidiaries. The facility matures in November 2006.At December 31, 2004 and March 1, 2005, there wereno borrowings outstanding under this facility, otherthan $4.4 million of standby letters of credit for certainoperational matters.
New Accounting Pronouncements In December 2004, the Financial Accounting StandardsBoard (“FASB”) issued Staff Position (“FSP”) No.109-2, Accounting and Disclosure Guidance for theForeign Earnings Repatriation Provision within theAmerican Jobs Creation Act of 2004 (“FSP 109-2”).FSP 109-2 provides guidance under FASB StatementNo. 109, Accounting for Income Taxes, with respectto recording the potential impact of the repatriationprovisions of the American Jobs Creation Act of 2004(the “Jobs Act”) on enterprises’ income tax expense and

30 MPS Group
deferred tax liability. FSP 109-2 states that an enterpriseis allowed time beyond the financial reporting periodof enactment to evaluate the effect of the Jobs Act on itsplan for reinvestment or repatriation of foreign earningsfor purposes of applying FASB Statement No. 109.Based upon our preliminary evaluation of the effectsof the repatriation provision, we do not expect to applythis provision.
Quantitative and Qualitative Disclosures AboutMarket Risk
The following assessment of our market risks does notinclude uncertainties that are either nonfinancial ornonquantifiable, such as political, economic, tax andcredit risks.
Our exposure to market risk for changes in interest ratesrelates primarily to debt obligations under the creditfacility and to our investments. We have an investmentportfolio consisting of cash and cash equivalentsincluding deposits in banks, money market funds, andshort-term investments with maturities of 90 days orless. We are adverse to principal loss and seek to preserveour invested funds by placing these funds with highcredit quality issuers. We evaluate our invested fundsto respond appropriately to a reduction in the creditrating of any investment issuer or guarantor.
We are exposed to the impact of foreign currencyfluctuations. Changes in foreign currency exchangerates impact translations of foreign denominated assetsand liabilities into U.S. dollars and future earnings andcash flows from transactions denominated in differentcurrencies. Our international operations generatedapproximately 38% of 2004 consolidated revenue,approximately 97% of which was from the UnitedKingdom.
Our international operations transact business in theirfunctional currency. As a result, fluctuations in thevalue of foreign currencies against the U.S. dollar havean impact on reported results. Revenues and expensesdenominated in foreign currencies are translated intoU.S dollars at monthly average exchange rates prevailingduring the period. Consequently, as the value of theU.S. dollar changes relative to the currencies of ournon-U.S. markets, our reported results vary.
Fluctuations in exchange rates impact the U.S. dollaramount of Stockholders’ Equity. The assets andliabilities of our non-U.S. subsidiaries are translatedinto U.S. dollars at the exchange rate in effect at theend of a reporting period. The resulting translationadjustments are recorded in Stockholders’ Equity, as acomponent of Accumulated Other ComprehensiveIncome, in our Consolidated Balance Sheets.
We prepared a sensitivity analysis to determine theadverse impact of hypothetical changes in the Britishpound sterling, relative to the U.S. Dollar, on ourresults of operations and cash flows. However, theanalysis did not include the potential impact on saleslevels resulting from a change in the British poundsterling. An additional 10% adverse movement in theexchange rate would have had an immaterial impact onour cash flows and financial position at December 31,2004. While fluctuations in the British pound sterlinghave not historically had a material impact on ourconsolidated results of operations, the higher level ofearnings resulting from an increase in demand for theservices provided by our international operations haveincreased the impact of exchange rate fluctuations. Asof December 31, 2004, we have not entered into anyforeign currency derivative instruments.
We are exposed to minimal price fluctuations on equitymutual funds that are contained with our company-owned life insurance. The cash surrender value of thecompany-owned life insurance was $7.7 million atDecember 31, 2004, and is included in “Other assets,net” in the consolidated Balance Sheets. Changes to thecash surrender value are recognized in “Other income(expense), net” on our Consolidated Statements ofOperations. This company-owned life insurance isintended to be used to settle our obligations of deferredcompensation. Therefore, a corresponding employeeliability is included in “Other” in the Liabilities sectionof the Consolidated Balance Sheets.

31MPS Group
Report of Independent Registered Certified Public Accounting Firm
To the Board of Directors and Stockholders of MPS Group, Inc.:
We have completed an integrated audit of MPS Group, Inc.’s 2004 consolidated financial statements and of its internalcontrol over financial reporting as of December 31, 2004 and audits of its 2003 and 2002 consolidated financialstatements in accordance with the standards of the Public Company Accounting Oversight Board (United States).Our opinions, based on our audits, are presented below.
Consolidated financial statements and financial statement schedule In our opinion, the consolidated financial statements listed in the accompanying index, present fairly, in all materialrespects, the financial position of MPS Group, Inc. and its subsidiaries at December 31, 2004 and 2003, and theresults of their operations and their cash flows for each of the three years in the period ended December 31, 2004in conformity with accounting principles generally accepted in the United States of America. In addition, in ouropinion, the financial statement schedule listed in the accompanying index presents fairly, in all material respects, theinformation set forth therein when read in conjunction with the related consolidated financial statements. Thesefinancial statements and financial statement schedule are the responsibility of the Company’s management. Ourresponsibility is to express an opinion on these financial statements and financial statement schedule based on ouraudits. We conducted our audits of these statements in accordance with the standards of the Public CompanyAccounting Oversight Board (United States). Those standards require that we plan and perform the audit to obtainreasonable assurance about whether the financial statements are free of material misstatement. An audit of financialstatements includes examining, on a test basis, evidence supporting the amounts and disclosures in the financialstatements, assessing the accounting principles used and significant estimates made by management, and evaluatingthe overall financial statement presentation. We believe that our audits provide a reasonable basis for our opinion.
As discussed in Note 5 to the consolidated financial statements, the Company changed its method of accounting forgoodwill upon the adoption of the accounting guidance of Statement of Financial Accounting Standards No. 142,“Goodwill and Other Intangible Assets”, effective January 1, 2002.
Internal control over financial reporting Also, in our opinion, management’s assessment, included in the accompanying Management’s Report on InternalControl over Financial Reporting, that the Company maintained effective internal control over financial reporting asof December 31, 2004 based on criteria established in Internal Control-Integrated Framework issued by theCommittee of Sponsoring Organizations of the Treadway Commission (COSO), is fairly stated, in all materialrespects, based on those criteria. Furthermore, in our opinion, the Company maintained, in all material respects,effective internal control over financial reporting as of December 31, 2004, based on criteria established in InternalControl-Integrated Framework issued by the COSO. The Company’s management is responsible for maintainingeffective internal control over financial reporting and for its assessment of the effectiveness of internal control overfinancial reporting. Our responsibility is to express opinions on management’s assessment and on the effectivenessof the Company’s internal control over financial reporting based on our audit. We conducted our audit of internalcontrol over financial reporting in accordance with the standards of the Public Company Accounting OversightBoard (United States). Those standards require that we plan and perform the audit to obtain reasonable assuranceabout whether effective internal control over financial reporting was maintained in all material respects. An audit ofinternal control over financial reporting includes obtaining an understanding of internal control over financialreporting, evaluating management’s assessment, testing and evaluating the design and operating effectiveness ofinternal control, and performing such other procedures as we consider necessary in the circumstances. We believethat our audit provides a reasonable basis for our opinions.

32 MPS Group
A company’s internal control over financial reporting is a process designed to provide reasonable assurance regardingthe reliability of financial reporting and the preparation of financial statements for external purposes in accordancewith generally accepted accounting principles. A company’s internal control over financial reporting includes thosepolicies and procedures that (i) pertain to the maintenance of records that, in reasonable detail, accurately and fairlyreflect the transactions and dispositions of the assets of the company; (ii) provide reasonable assurance thattransactions are recorded as necessary to permit preparation of financial statements in accordance with generallyaccepted accounting principles, and that receipts and expenditures of the company are being made only in accordancewith authorizations of management and directors of the company; and (iii) provide reasonable assurance regardingprevention or timely detection of unauthorized acquisition, use, or disposition of the company’s assets that couldhave a material effect on the financial statements.
Because of its inherent limitations, internal control over financial reporting may not prevent or detectmisstatements. Also, projections of any evaluation of effectiveness to future periods are subject to the risk thatcontrols may become inadequate because of changes in conditions, or that the degree of compliance with thepolicies or procedures may deteriorate.
PricewaterhouseCoopers LLP
Jacksonville, Florida
March 14, 2005

33MPS Group
Management’s Report on Internal Control over Financial Reporting
Management of MPS Group, Inc. is responsible for establishing and maintaining adequate internal control over financialreporting, as such term is defined in Rules 13a-15(f ) and 15d-15(f ) under the Securities Exchange Act of 1934.
Because of its inherent limitations, internal control over financial reporting may not prevent or detect misstatements.Also, projections of any evaluation of effectiveness to future periods are subject to the risk that controls maybecome inadequate because of changes in conditions, or that the degree of compliance with the policies orprocedures may deteriorate.
Management assessed the effectiveness of the Company’s internal control over financial reporting as of December 31,2004. In making this assessment, management used the criteria set forth in Internal Control–Integrated Frameworkissued by the Committee of Sponsoring Organizations of the Treadway Commission.
Based on that assessment, management concluded that the Company’s internal control over financial reporting waseffective as of December 31, 2004.
Management’s assessment of the effectiveness of the Company’s internal control over financial reporting has beenaudited by PricewaterhouseCoopers LLP, an independent registered certified public accounting firm, as stated intheir report which is included herein.

34 MPS Group
MPS Group, Inc. and Subsidiaries
Consolidated Balance Sheets(dollar amounts in thousands)
As of 12-31-2004 12-31-2003
AssetsCurrent assets:
Cash and cash equivalents $ 106,497 $ 124,830Accounts receivable, net of allowance of $9,836 and $12,899 209,512 159,359Prepaid expenses 6,405 6,417Deferred income taxes 836 2,200Other 15,532 10,662
Total current assets 338,782 303,468Furniture, equipment, and leasehold improvements, net 26,878 29,488Goodwill, net 529,292 486,630Deferred income taxes 48,518 62,464Other assets, net 11,134 11,101
Total assets $ 954,604 $ 893,151
Liabilities and Stockholders’ EquityCurrent liabilities:
Accounts payable and accrued expenses 51,944 32,601Accrued payroll and related taxes 45,353 37,848Income taxes payable 9,352 16,140
Total current liabilities 106,649 86,589Other 12,292 13,100
Total liabilities 118,941 99,689Commitments and contingencies (Note 6)Stockholders’ equity:
Preferred stock, $.01 par value; 10,000,000 shares authorized; no shares issued — —Common stock, $.01 par value; 400,000,000 shares authorized;
108,434,541 and 104,576,204 shares issued, respectively 1,085 1,046Additional contributed capital 664,440 634,492Retained earnings 197,966 162,546Accumulated other comprehensive income 18,497 6,933Deferred stock compensation (6,383 ) (2,495 )Treasury stock, at cost (5,078,514 and 1,613,400 shares at December 31, 2004 and 2003) (39,942 ) (9,060 )
Total stockholders’ equity 835,663 793,462Total liabilities and stockholders’ equity $ 954,604 $ 893,151
See accompanying notes to consolidated financial statements.

MPS Group, Inc. and Subsidiaries
Consolidated Statements of Operations(dollar amounts in thousands except per share amounts)
Years Ended 12-31-2004 12-31-2003 12-31-2002
Revenue $ 1,426,842 $ 1,096,030 $ 1,119,156Cost of revenue 1,066,055 808,890 834,318
Gross profit 360,787 287,140 284,838Operating expenses:
General and administrative 293,776 234,614 235,673Depreciation and intangibles amortization 15,775 17,009 20,256Exit costs (recapture) ( 897 ) ( 284 ) 8,967Impairment of investment — — 16,165
Total operating expenses 308,654 251,339 281,061Operating income 52,133 35,801 3,777Other income (expense), net 1,437 553 ( 3,947 )Income (loss) from continuing operations before income taxes and
cumulative effect of accounting change 53,570 36,354 ( 170 )Provision for income taxes 18,150 14,519 13,832Income (loss) from continuing operations before
cumulative effect of accounting change 35,420 21,835 ( 14,002 )Discontinued operations (Note 17):
Income (loss) from discontinued operations (net of income taxesof $(1,289) and $759, respectively) — ( 2,395 ) 1,410
Loss on disposition of discontinued operations (net of a $11,133 income tax benefit) — ( 20,675 ) —
Income (loss) from operations before cumulative effect ofaccounting change 35,420 ( 1,235 ) ( 12,592 )
Cumulative effect of accounting change (net of $112,953income tax benefit) — — ( 553,712 )
Net income (loss) $ 35,420 $ ( 1,235 ) $ ( 566,304 )Basic net income (loss) per common share:
Income (loss) from continuing operations before cumulativeeffect of accounting change $ 0.34 $ 0.21 $ ( 0.14 )
Income (loss) from discontinued operations, net of tax — ( 0.02 ) 0.01Loss on disposition of discontinued operations, net of tax — ( 0.20 ) —Cumulative effect of accounting change, net of tax — — ( 5.49 )
Basic net income (loss) per common share $ 0.34 $ ( 0.01 ) $ ( 5.62 )Average common shares outstanding, basic 102,804 101,680 100,833Diluted net income (loss) per common share:
Income (loss) from continuing operations before cumulativeeffect of accounting change $ 0.33 $ 0.21 $ ( 0.14 )
Income (loss) from discontinued operations, net of tax — ( 0.02 ) 0.01Loss on disposition of discontinued operations, net of tax — ( 0.20 ) —Cumulative effect of accounting change, net of tax — — ( 5.49 )
Diluted net income (loss) per common share $ 0.33 $ ( 0.01 ) $ ( 5.62 )Average common shares outstanding, diluted 106,842 104,518 100,833
See accompanying notes to consolidated financial statements.
35MPS Group

36 MPS Group
MPS Group, Inc. and Subsidiaries
Consolidated Statements of Stockholders’ Equity(dollar amounts in thousands except share amounts)
AccumulatedOther
Additional Comprehensive DeferredCommon Stock Contributed Retained Income Stock Treasury
Shares Amount Capital Earnings (Loss) Compensation Stock Total
Balance, December 31, 2001 98,306,783 $ 983 $594,061 $730,085 $ ( 9,400 ) $ ( 4,918 ) $ — $ 1,310,811Comprehensive loss:
Net loss — — — ( 566,304 ) — — —Foreign currency translation — — — — 7,958 — —Derivative instruments,
net of related tax benefit — — — — 1,508 — —Total comprehensive loss — — — — — — — ( 556,838 )Issuance of common stock
related to businesscombinations 1,149,679 11 8,714 — — — — 8,725
Exercise of stock options andrelated tax benefit 2,871,696 29 18,023 — — — — 18,052
Purchase of treasury stock — — — — — — ( 1,434 ) ( 1,434 )Issuance of restricted stock 203,333 2 1,281 — — ( 1,283 ) — —Vesting of restricted stock — — — — — 2,243 — 2,243Balance, December 31, 2002 102,531,491 1,025 622,079 163,781 66 (3,958 ) ( 1,434 ) 781,559Comprehensive loss:
Net loss — — — ( 1,235 ) — — —Foreign currency translation — — — — 6,867 — —
Total comprehensive loss — — — — — — — 5,632Exercise of stock options and
related tax benefit 2,044,713 21 12,413 — — — — 12,434Purchase of treasury stock — — — — — — ( 7,626 ) ( 7,626 )Vesting of restricted stock — — — — — 1,463 — 1,463Balance, December 31, 2003 104,576,204 1,046 634,492 162,546 6,933 ( 2,495 ) ( 9,060 ) 793,462Comprehensive Income:
Net income — — — 35,420 — — —Foreign currency translation — — — — 11,564 — —
Total comprehensive income — — — — — — — 46,984Exercise of stock options and
related tax benefit 3,283,337 33 23,454 — — — — 23,487Purchase of treasury stock — — — — — — ( 30,882 ) ( 30,882 )Issuance of restricted stock 575,000 6 6,494 — — (6,500 ) — —Vesting of restricted stock — — — — — 2,612 — 2,612Balance, December 31, 2004 108,434,541 $1,085 $664,440 $197,966 $ 18,497 $ (6,383 ) $(39,942) $ 835,663
See accompanying notes to consolidated financial statements.

37MPS Group
MPS Group, Inc. and Subsidiaries
Consolidated Statements of Cash Flows(dollar amounts in thousands)
Years Ended 12-31-2004 12-31-2003 12-31-2002
Cash flows from operating activities of continuing operations:Income (loss) from continuing operations before cumulative
effect of accounting change $ 35,420 $ 21,835 $ ( 14,002 )Adjustments to income (loss) from continuing operations before cumulative
effect of accounting change to net cash provided by operating activitiesof continuing operations:
Exit costs (recapture) ( 897 ) ( 284 ) 8,967Impairment of investment — — 16,165Deferred income taxes 19,256 6,284 29,172Deferred compensation 2,612 1,465 2,243Depreciation and identified intangibles amortization 15,755 17,009 20,256Changes in assets and liabilities, net of acquisitions:
Accounts receivable ( 43,757 ) 31,235 49,868Prepaid expenses and other assets 480 ( 1,712 ) ( 1,969 )Accounts payable and accrued expenses 20,461 ( 4,841 ) 5,876Accrued payroll and related taxes 5,148 2,204 ( 4,690)Other, net ( 4,253 ) ( 2,857 ) ( 373)
Net cash provided by operating activities of continuing operations 50,225 70,338 111,513Cash flows from investing activities of continuing operations:
Proceeds from sale of assets 2,442 — —Purchase of furniture, equipment, and leasehold improvements,
net of disposals ( 9,565 ) ( 6,880 ) ( 6,016 )Purchase of businesses, net of cash acquired ( 50,223 ) ( 15,864 ) ( 6,739 )
Net cash used in investing activities of continuing operations ( 57,346 ) ( 22,744 ) ( 12,755 )Cash flows from financing activities:
Repurchases of common stock ( 30,882 ) ( 7,626 ) ( 1,434 )Discount realized on employee stock purchase plan ( 433 ) ( 389 ) ( 494 )Proceeds from stock options exercised 18,251 10,867 16,881Repayments on indebtedness ( 893 ) ( 163 ) ( 101,423 )
Net cash provided by (used in) financing activities ( 13,957 ) 2,689 ( 86,470 )Effect of exchange rate changes on cash and cash equivalents 2,308 4,714 1,541Net increase (decrease) in cash and cash equivalents ( 18,770 ) 54,997 13,829Net cash provided by discontinued operations 437 2,899 3,897Cash and cash equivalents, beginning of year 124,830 66,934 49,208Cash and cash equivalents, end of year $ 106,497 $ 124,830 $ 66,934
See accompanying notes to consolidated financial statements.

MPS Group, Inc. and Subsidiaries
(dollar amounts in thousands)
Years Ended 12-31-2004 12-31-2003 12-31-2002
Supplemental Cash Flow InformationInterest paid $ 598 $ 1,234 $ 4,534Income taxes (refunded) paid 5,106 (3,838 ) 6,214
Components of Cash Provided by Discontinued OperationsCash provided by (used in) operating activities $ 437 $ ( 4,987 ) $ 4,368Cash provided by (used in) investing activities — 7,886 ( 471 )
Net cash provided by discontinued operations $ 437 $ 2,899 $ 3,897
Non-Cash Investing and Financing ActivitiesThe Company completed seven acquisitions in 2004, two acquisitions in 2003and one acquisition in 2002. In connection with the acquisitions, liabilitieswere assumed as follows:
Fair value of assets acquired $ 59,816 $ 18,839 $ 7,367Cash paid ( 48,201 ) ( 16,322 ) ( 7,000 )Liabilities assumed $ 11,615 $ 2,517 $ 367
38 MPS Group

39MPS Group
Notes to Consolidated Financial Statements
1. Description of Business
MPS Group, Inc. (MPS or the Company) (New York Stock Exchange symbol: MPS) is a leading provider of businessservices with over 185 offices throughout the United States, Canada, the United Kingdom, and continental Europe.The Company delivers specialty staffing, consulting and business solutions to virtually all industries in the followingdisciplines and through the following primary brands:
Brand(s) DisciplineModis® Information Technology (IT) ServicesBadenoch & Clark®, Accounting Principals® Accounting and FinanceEntegee® EngineeringSpecial Counsel® LegalIdea Integration® IT SolutionsSoliant Health® Health CareBeeline® Human Capital Automation
Historically, the Company has presented the financial results of the above brands under three reporting segments:Professional services, IT services, and IT solutions. In an effort to better align the reporting of the Company’sfinancial results with the manner in which the Company currently manages its business, the Company revised itspresentation of its financial results from three to four reporting segments in the fourth quarter of 2004. The Company’sfour reporting segments are North American Professional services, European Professional services, North AmericanIT services and European IT services. Prior periods have been restated to conform to this presentation.
2. Summary of Significant Accounting Policies
Basis of Presentation and Consolidation The consolidated financial statements include the accounts of the Company and its wholly owned subsidiaries. Allmaterial intercompany transactions have been eliminated in the accompanying consolidated financial statements.
Cash and Cash Equivalents Cash and cash equivalents include deposits in banks, money market funds, and short-term investments withmaturities of 90 days or less.
Furniture, Equipment, and Leasehold Improvements Furniture, equipment, and leasehold improvements are recorded at cost less accumulated depreciation andamortization. Depreciation of furniture and equipment is computed using the straight-line method over the estimateduseful lives of the related assets. The Company has developed a proprietary software package which allows theCompany to implement imaging, time capture, and data-warehouse reporting. The costs associated with thedevelopment of this proprietary software package have been capitalized, and are being amortized over a five-yearperiod. See Footnote 13 to the Consolidated Financial Statements.
The Company adopted Statements of Financial Accounting Standards (‘SFAS’) No. 144, Accounting for theImpairment or Disposal of Long-Lived Assets, as of January 1, 2002. The Company evaluates the recoverability of itscarrying value of property and equipment whenever events or changes in circumstances indicate that the carryingamount may not be recoverable. Carrying value write-downs and gains and losses on disposition of property andequipment are reflected in Operating income on the Consolidated Statements of Operations.
Goodwill and Other Identifiable Intangible Assets For acquisitions, the Company allocates the excess of cost over the fair market value of the net tangible assets first toidentifiable intangible assets, if any, and then to goodwill. In connection with SFAS No. 142, Goodwill and OtherIntangible Assets, the Company is required to perform goodwill impairment reviews, at least annually, utilizing afair-value approach. Additionally, SFAS No. 142 required a transitional goodwill impairment review upon adoption.

40 MPS Group
The Company adopted SFAS No. 142 as of January 1, 2002. After performing the required transitional goodwillimpairment tests, the Company recognized a loss of $553.7 million, net of an income tax benefit of $113.0 million,and recorded the loss (net of the related tax benefit) as a cumulative effect of an accounting change in theConsolidated Statement of Operations for 2002. The Company performed additional valuation testing during thefourth quarter of 2002, 2003 and 2004 (its designated timing of the annual impairment test under SFAS No. 142)and did not incur any further impairment. The Company plans to perform our next annual impairment reviewduring the fourth quarter of 2005. An impairment review prior to its next scheduled annual review may be requiredif certain events occur, including lower than forecasted earnings levels for various reporting units. In addition, changesto other assumptions could significantly impact the Company’s estimate of the fair value of its reporting units.Such a change may result in a goodwill impairment charge, which could have a significant impact on the reportablesegments that include the related reporting units and the Consolidated Financial Statements.
As part of the Company’s goodwill impairment reviews, fair value was calculated using an equally blended value ofa discounted cash flow analysis and market comparables. In contrast to SFAS 142, the prior accounting standard(SFAS No. 121) required the use of undiscounted cash flow estimates over the remaining useful life of the goodwilland other long-lived assets as a step 1 test for possible impairment. Under SFAS No. 121, the concept ofrecoverability of the goodwill over the useful life of the asset was the underlying test for impairment as opposed tofair value under SFAS No. 142. This fundamental difference in the underlying methodologies of testing forimpairment of goodwill in SFAS No. 121 and SFAS No. 142 caused the Company to attribute the resultingimpairment from the initial valuation completed on January 1, 2002 to a change in accounting principle upon theadoption of SFAS No. 142. Projected cash flows, used for both SFAS No. 121 and No. 142 testing, considered theeffects from the then downturn in its business.
As mentioned above, the Company used an equally blended value of a discounted cash flow analysis and marketcomparables to arrive at fair value for SFAS No. 142. For the discounted cash flow analysis, significant assumptionsincluded expected future revenue growth rates, reporting unit profit margins, working capital levels and a discount rate.The revenue growth rates and reporting unit profit margins are based, in part, on its expectation of an improvingeconomic environment. Market comparables included a comparison of the market ratios and performancefundamentals from comparable companies. The use of these measurement criteria is consistent with the underlyingconcepts used in determining the fair value of a company or reportable unit under the market approach. Themarket ratios the Company used refer to the multiples of revenue and earnings of comparable companies and theperformance fundamentals refer to the consideration of the effects of the differences in the operating metrics, ie.growth rates, operating margins, gross margins, etc. on its value versus the comparable companies.
From 2002 to 2004, the Company acquired ten businesses: four legal staffing businesses acquired in February of 2003,August of 2003, August of 2004, and October of 2004; three health care staffing businesses acquired in June of 2002,February of 2004, and March of 2004; and three accounting staffing businesses acquired in February of 2004, Julyof 2004, and October 2004. These acquisitions were recorded in accordance with the provisions of SFAS No. 141Business Combinations. See Footnote 3 (Business Combinations) and Footnote 5 (Goodwill And Other IdentifiableIntangible Assets) to the Consolidated Financial Statements.
Revenue Recognition The Company recognizes substantially all revenue at the time services are provided and is recorded on a time andmaterials basis. In most cases, the consultant is the Company’s employee and all costs of employing the worker arethe responsibility of the Company and are included in cost of revenue. Revenues generated when the Companypermanently places an individual with a client are recorded at the time of start.
In addition and to a lesser extent, the Company is involved in fixed price or lump-sum engagements. The servicesrendered by the Company under the relevant contracts generally require performance spanning more than oneaccounting period. The Company recognizes revenue for these engagements under the proportional performanceaccounting model.
Foreign Operations The financial position and operating results of foreign operations are consolidated using the local currency as thefunctional currency. These operating results are considered to be permanently invested in foreign operations. Localcurrency assets and liabilities are translated at the rate of exchange to the U.S. dollar on the balance sheet date, andthe local currency revenues and expenses are translated at average rates of exchange to the U.S. dollar during the period.

41MPS Group
Stock-Based Compensation During December 2002, the FASB, issued SFAS No. 148, Accounting for Stock-Based Compensation—Transitionand Disclosure, which provides for alternative methods of transition for a voluntary change to the fair-value-basedmethod of accounting for stock-based compensation. In addition, SFAS No. 148 amends the disclosure requirementsof SFAS No. 123, Accounting for Stock-Based Compensation, to require more prominent disclosure in both annual andinterim financial statements about the method of accounting for stock-based employee compensation and the effectof the method used on reported results.
The Company accounts for its employee and director stock option plans in accordance with APB Opinion No. 25,Accounting for Stock Issued to Employees, and related Interpretations. The Company measures compensation expensefor employee and director stock options as the aggregate difference between the market value of its common stockand exercise prices of the options on the date that both the number of shares the grantee is entitled to receive andthe exercise prices are known. Compensation expense associated with restricted stock grants is equal to the marketvalue of the shares on the date of grant and is recorded pro rata over the required holding period. If the Companyhad elected to recognize compensation cost for all outstanding options granted by the Company, by applying thefair value recognition provisions of SFAS No. 148 to stock-based employee compensation, net (loss) income and(loss) earnings per share would have been reduced to the pro forma amounts indicated below.(dollar amounts in thousands except per share amounts)
Years 2004 2003 2002
Net income (loss)As reported $ 35,420 $ (1,235 ) $ ( 566,304 )Total stock-based employee compensation expense determined under fair
value based method for all awards, net of related tax effects (2,705 ) (4,796 ) (4,451 )Pro forma $ 32,715 $ (6,031 ) $ (570,755 )
Basic net income (loss) per common shareAs reported $ 0.34 $ (0.01 ) $ (5.62 )Pro forma $ 0.32 $ (0.06 ) $ (5.66 )
Diluted net income (loss) per common shareAs reported $ 0.33 $ (0.01 ) $ (5.62 )Pro forma $ 0.31 $ (0.06 ) $ (5.66 )
The weighted average fair values of options granted during 2004, 2003, and 2002 were $7.48, $5.44, and $3.99 pershare, respectively. The fair value of each option grant is estimated on the date of grant using the Black Scholesoption-pricing model with the following assumptions:
Years 2004 2003 2002
Expected dividend yield — — —Expected stock price volatility .70 .70 .77Risk-free interest rate 3.78 3.78 3.78Expected life of options (years) 5.00 5.00 5.00
The Company expects to adopt the provisions of SFAS No. 123 (revised 2004), Share-Based Payments- (SFAS 123R),which replaces SFAS No. 123 and supercedes APB Opinion No. 25. SFAS 123R requires all share-based paymentsto employees, including grants of employee stock options, to be recognized in the financial statements based ontheir fair values, beginning with the first interim or annual period after June 15, 2005. The pro forma disclosurespreviously permitted under SFAS 123 no longer will be an alternative to financial statement recognition. UnderSFAS 123R, the Company must determine the appropriate fair value model to be used for valuing share-basedpayments, the amortization method for compensation cost and the transition method to be used at the date ofadoption. The transition methods include prospective and retroactive adoption alternatives. Under the retroactivealternatives, prior periods may be restated either as of the beginning of the year of adoption or for all periodspresented. The prospective method requires that compensation expense be recorded for all unvested stock options

42 MPS Group
and restricted stock at the beginning of the first quarter of adoption of SFAS 123R, while the retroactive methodswould record compensation expense for all unvested stock options and restricted stock beginning with the firstperiod restated. The Company is evaluating the requirements of SFAS 123R and has not yet determined the methodof adoption or the effect of adopting SFAS 123R, nor has Company determined whether the adoption will result inamounts that are similar to the current pro forma disclosures under SFAS 123.
Income Taxes The provision for income taxes is based on income before taxes as reported in the accompanying ConsolidatedStatements of Operations. Deferred tax assets and liabilities are recognized for the expected future tax consequencesof events that have been included in the financial statements or tax returns. Under this method, deferred tax assetsand liabilities are determined based on the differences between the financial statement carrying amounts and thetax basis of assets and liabilities using enacted tax rates in effect for the year in which the differences are expected toreverse. An assessment is made as to whether or not a valuation allowance is required to offset deferred tax assets.This assessment includes anticipating future taxable income.
The Company is subject to periodic review by federal, foreign, state and local taxing authorities in the ordinarycourse of business. As a result, tax contingencies have been recorded for such items, including amounts related tocurrent audits. These contingencies are adjusted as items are settled for amounts that differ from what was recorded.During 2001, the Company was notified by the Internal Revenue Service that certain prior year income tax returnswould be examined. As part of this examination, the company recorded a tax provision of $8.7 million in 2002 foran agreed upon adjustment with the Internal Revenue Service. In 2004, this Internal Revenue Service examinationwas finalized after it was reviewed and approved by the Joint Committee on Taxation. See Footnote 7 to theConsolidated Financial Statements.
Net Income (Loss) per Common ShareThe consolidated financial statements include “basic” and “diluted” per share information. Basic net income percommon share information is calculated by dividing net income by the weighted average number of common sharesoutstanding. Diluted net income per common share information is calculated by also considering the impact ofpotential common stock equivalents on both net income and the weighted average number of common sharesoutstanding. The weighted average number of common shares used in the basic earnings per share computationswere 102.8 million, 101.7 million, and 100.8 million in 2004, 2003 and 2002, respectively. The only difference inthe computation of basic and diluted earnings per common share is the inclusion of 4.0 million and of 2.8 millionpotential common shares in 2004 and 2003, respectively. As the Company was in loss position for 2002 fromcontinuing operations, before the cumulative effect of an accounting change, the potential common shares for 2002were excluded from the calculation of diluted earnings per share, as the shares would have had an anti-dilutiveeffect. See Footnote 10 to the Consolidated Financial Statements.
Excess Real Estate Obligations The Company recorded a $9.0 million charge in 2002, of which $284,000 and $897,000 was recaptured in 2003and 2004, respectively, relating to its abandonment of excess real estate obligations for certain vacant office space.
For the Company’s discontinued outplacement unit operations, the Company recorded $732,000 of contracttermination costs in 2002. As a result of the sale of its outplacement unit, the Company recorded an additional$705,000 of contract termination costs in 2003, which is included in “Loss on Disposition, net of tax” on theCompany’s Consolidated Statement of Operations.
These charges (recapture) were recorded in accordance with SFAS No. 146, “Accounting for Costs Associated withExit or Disposal Activities,” which requires that a liability for a cost associated with an exit or disposal activity berecognized, at fair value, when the liability is incurred rather than at the time an entity commits to a plan. SeeFootnote 16 (Excess Real Estate Obligations) and Footnote 17 (Discontinued Operations) to the ConsolidatedFinancial Statements.
Discontinued Operations In December 2003, the Company sold certain operating assets and transferred certain operating liabilities of itsoutplacement unit for $8.0 million in cash while retaining the working capital of the business of approximately $2.0million. The initial after-tax loss on the sale was $20.7 million. The Company recorded the disposition in accordancewith SFAS No. 144, Accounting for the Impairment or Disposal of Long-Lived Assets. See Footnote 17 (DiscontinuedOperations) to the Consolidated Financial Statements.

43MPS Group
Impairment of Investment The Company had a minority investment in a privately held company that was recorded as a non-current asset. Theasset was carried at its original cost plus accrued interest. The investment was originally made in 1996 and was set tomature in 2004. In 2002, this privately held company recapitalized at terms, which diluted the value of the Company’sinvestment. The Company elected not to participate in the recapitalization, which resulted in the investment beingimpaired. As a result, the Company wrote off the investment in its entirety recognizing a $16.2 million charge in 2002.
The process of assessing whether a particular equity investment’s net realizable value is less than its carrying costrequires a significant amount of judgment. The Company periodically monitors an investment for impairment byconsidering, among other things, the investee’s cash position, projected cash flows, financing needs, liquidationpreference, most recent valuation data (including the duration and extent to which the fair value is less than cost),the current investing environment, competition and the Company’s intent and ability to hold the investment.
Pervasiveness of Estimates The preparation of financial statements in conformity with generally accepted accounting principles requiresmanagement to make estimates and assumptions that affect the reported amount of assets and liabilities anddisclosure of contingent assets and liabilities at the date of the financial statements and the reported amounts ofrevenue and expenses during the reporting period. Although management believes these estimates and assumptionsare adequate, actual results may differ from the estimates and assumptions used.
New Accounting Pronouncements In December 2004, the Financial Accounting Standards Board (FASB) issued Staff Position (FSP) No. 109-2,Accounting and Disclosure Guidance for the Foreign Earnings Repatriation Provision within the American JobsCreation Act of 2004 (FSP 109-2). FSP 109-2 provides guidance under FASB Statement No. 109, Accounting forIncome Taxes, with respect to recording the potential impact of the repatriation provisions of the American JobsCreation Act of 2004 (the Jobs Act) on enterprises’ income tax expense and deferred tax liability. FSP 109-2 statesthat an enterprise is allowed time beyond the financial reporting period of enactment to evaluate the effect of theJobs Act on its plan for reinvestment or repatriation of foreign earnings for purposes of applying FASB StatementNo. 109. Based upon the Company’s preliminary evaluation of the effects of the repatriation provision, theCompany does not expect to apply this provision.
Reclassifications Certain amounts have been reclassified in 2002 and 2003 to conform to the 2004 presentation.
3. Business Combinations
In February and March of 2004, the Company acquired the health care staffing businesses Management Searchand Sunbelt Staffing Solutions, respectively. In February, July, and October of 2004, the Company acquired theaccounting and finance staffing businesses Lillian Kloock, Accounting Alternatives, and Accounting Solutions,respectively. In September and October of 2004, the Company acquired Legal Networks and Alderson CourtReporting, respectively. Purchase consideration totaled $49.2 million in cash, of which $46.8 million was paid atclosing. In February and August of 2003, the Company acquired the legal staffing businesses of LawPros andLawCorps, respectively. Purchase consideration totaled $16.0 million in cash, of which $15.3 million was paid atclosing. In July 2002, the Company acquired a health care staffing business, Elite Medical (subsequently re-brandedas Soliant Health). Purchase consideration totaled $15.9 million, $7.2 million in cash, and 1.1 million shares ofMPS Common Stock valued at $8.7 million.

44 MPS Group
4. Indebtedness
Indebtedness at December 31, 2004, 2003 and 2002 consisted of the following:(dollar amounts in thousands)
As of 12-31-2004 12-31-2003 12-31-2002
Notes payable to former stockholders of acquired companies(interest ranging from 1.2% to 7.0%) $ 2,553 $ 891 $ 334
2,553 891 334Current portion of notes payable 2,553 891 334Long-term portion of notes payable $ — $ — $ —
The notes payable are included in the line item “Accounts payable and accrued expenses” on the ConsolidatedBalance Sheets.
In 2003, the Company closed on a $150 million revolving credit facility syndicated to a group of leading financialinstitutions. The credit facility contains certain financial and non-financial covenants relating to the Company’soperations, including maintaining certain financial ratios. Repayment, if applicable, of the credit facility is guaranteedby substantially all of the subsidiaries of the Company. The facility expires in November 2006. The Company incurredcertain costs directly related to obtaining the credit facility in the amount of approximately $1.0 million. Thesecosts have been capitalized and are being amortized over the life of the credit facility, and are included in the lineitem “Other assets, net” on the Consolidated Balance Sheet. As of December 31, 2004, there were no borrowingsoutstanding under this facility.
5. Goodwill and Other Identifiable Intangible Assets
The Company adopted SFAS No. 142 effective January 1, 2002. The changes in the carrying amount of goodwillfor 2004, 2003 and 2002, are as follows:(dollar amounts in thousands)
Professional Services It ServicesNorth America Europe North America Europe Total
Balance as of December 31, 2002 $ 135,310 $ 102,173 $ 244,758 $ 29,555 $ 511,7962003 acquisitions 12,146 — — — 12,146Reduction of goodwill as a result of the
disposition of the outplacement unit ( 37,312 ) — — — (37,312 )Balance as of December 31, 2003 $ 110,144 $ 102,173 $ 244,758 $ 29,555 $ 486,630
2004 acquisitions 42,662 — — — 42,662Balance as of December 31, 2004 $ 152,806 $ 102,173 $ 244,758 $ 29,555 $ 529,292
The Company allocated the purchase price of acquisitions in accordance with SFAS No. 141 Business Combinations.At December 31, 2004, 2003 and 2002, there was $3.6 million, $1.6 million and $466,000, respectively, ofidentifiable intangible assets on the Company’s Consolidated Balance Sheets relating to the Company’s acquisitionsin 2002, 2003 and 2004. Identifiable intangible assets relate to the value of the acquired business’ customerrelationships at the date of the acquisition and trade names, if applicable.
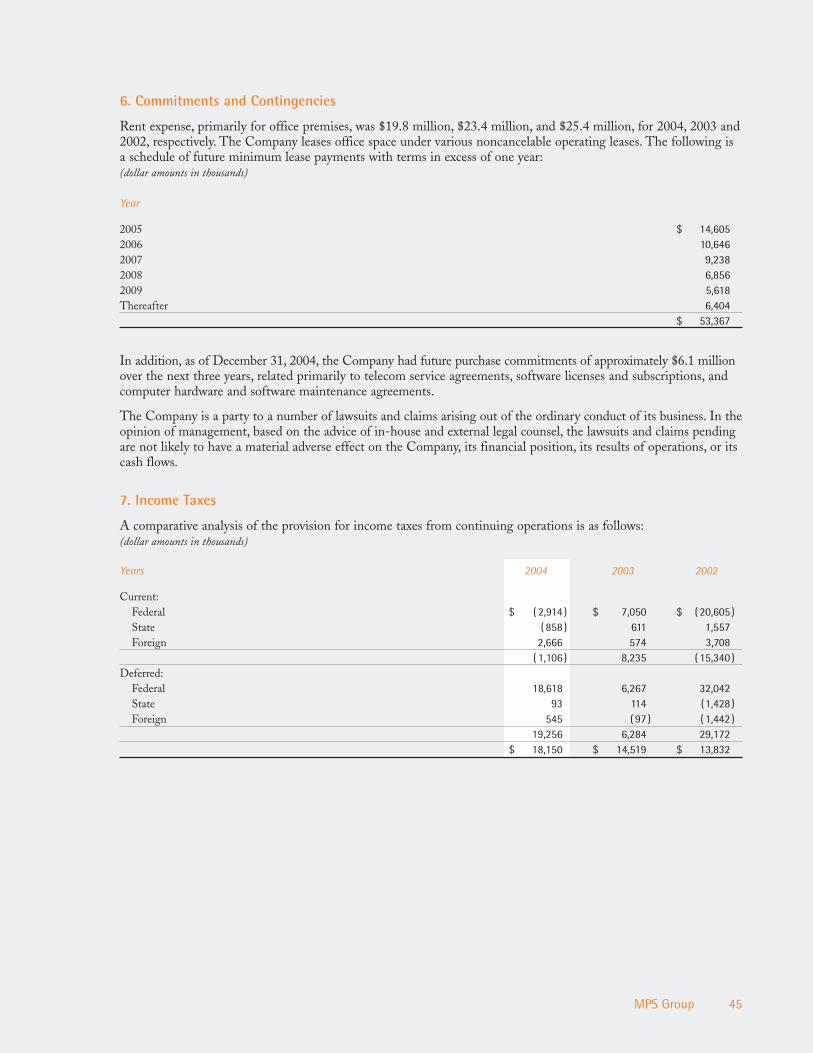
6. Commitments and Contingencies
Rent expense, primarily for office premises, was $19.8 million, $23.4 million, and $25.4 million, for 2004, 2003 and2002, respectively. The Company leases office space under various noncancelable operating leases. The following isa schedule of future minimum lease payments with terms in excess of one year:(dollar amounts in thousands)
Year
2005 $ 14,6052006 10,6462007 9,2382008 6,8562009 5,618Thereafter 6,404
$ 53,367
In addition, as of December 31, 2004, the Company had future purchase commitments of approximately $6.1 millionover the next three years, related primarily to telecom service agreements, software licenses and subscriptions, andcomputer hardware and software maintenance agreements.
The Company is a party to a number of lawsuits and claims arising out of the ordinary conduct of its business. In theopinion of management, based on the advice of in-house and external legal counsel, the lawsuits and claims pendingare not likely to have a material adverse effect on the Company, its financial position, its results of operations, or itscash flows.
7. Income Taxes
A comparative analysis of the provision for income taxes from continuing operations is as follows:(dollar amounts in thousands)
Years 2004 2003 2002
Current:Federal $ ( 2,914 ) $ 7,050 $ ( 20,605 )State ( 858 ) 611 1,557Foreign 2,666 574 3,708
( 1,106 ) 8,235 ( 15,340 )Deferred:
Federal 18,618 6,267 32,042State 93 114 (1,428 )Foreign 545 ( 97 ) ( 1,442 )
19,256 6,284 29,172$ 18,150 $ 14,519 $ 13,832
45MPS Group

The difference between the actual income tax provision and the tax provision computed by applying the statutoryfederal income tax rate to income from continuing operations before provision for income taxes is attributable tothe following:(dollar amounts in thousands)
Years 2004 2003 2002Amount Percentage Amount Percentage Amount Percentage
Tax computed using the federal statutory rate $ 18,750 35.0 % $ 12,724 35.0 % $ ( 60 ) ( 35.0 )%State income taxes, net of federal income tax effect ( 765 ) (1.4 )% 725 2.0 % 129 76.0 %Non-deductible meals 1,865 3.5 % 1,246 3.4 % 1,142 671.8 %Foreign tax credit carryforward — — — — ( 49 ) (29.0 )%Investment in subsidiary — — — — 8,660 5,094.0 %Capital loss carryforward — — — — 3,661 2,153.5 %Other permanent differences (1,700 ) (3.2 )% (176 ) (0.5 )% 349 205.2 %
$ 18,150 33.9 % $ 14,519 39.9 % $ 13,832 8,136.5 %
The components of the deferred tax assets and liabilities recorded in the accompanying consolidated balance sheetsare as follows:(dollar amounts in thousands)
Years 2004 2003
Gross deferred tax assets:Self-insurance reserves $ 1,111 $ 1,394Allowance for doubtful accounts receivable 1,578 2,704Foreign tax credit carryforward 19,954 19,507Net operating loss carryforward 27,943 24,905Capital loss carryforward 3,661 3,661Leases 656 1,630Amortization of goodwill 22,151 41,321Other 6,145 5,002
Total gross deferred tax assets 83,199 100,124Valuation allowance ( 30,887 ) ( 27,171 )
Total gross deferred tax assets, net of valuation allowance 52,312 72,953Gross deferred tax liabilities:
Other ( 2,958 ) ( 8,289 )Total gross deferred tax liabilities ( 2,958 ) ( 8,289 )Net deferred tax asset $ 49,354 $ 64,664
Recognition of deferred tax assets is based on management’s belief that it is more likely than not that the tax benefitassociated with temporary differences, operating loss carryforwards and tax credits will be utilized. A valuationallowance is recorded for those deferred tax assets for which it is more likely than not that realization will not occur.
The Company’s valuation allowance at December 31, 2004, consisted of $15.0 million in foreign tax creditcarryforwards, $12.2 million in state net operating loss carryforwards, and $3.7 million for a capital loss carryforward.The valuation allowance at December 31, 2003, consisted of $14.7 million in foreign tax credit carryforwards, $8.8million in state net operating loss carryforwards, and $3.7 million for a capital loss carryforward.
The Company generated a Federal net operating loss carryforward in 2003 resulting in a deferred tax asset of $16.1million. A portion of the Federal net operating loss was utilized in 2004 reducing this deferred tax asset to $15.7million. The remaining Federal net operating loss carryforward will expire in 2024.
In addition to deferred tax expense, the Company’s deferred tax asset changed in 2004 for the net tax benefit ofstock options and foreign currency recorded in equity in the amount of $5.1 million as well as for the deferred Taxliability related to the Company’s acquisitions in the amount of $1.2 million.
46 MPS Group

The Company is subject to periodic review by federal, foreign, state and local taxing authorities in the ordinarycourse of business. As a result, tax contingencies have been recorded for such items, including amounts related tocurrent audits. These contingencies are adjusted as items are settled for amounts that differ from what was recorded.During 2001, the Company was notified by the Internal Revenue Service that certain prior year income tax returnswould be examined. As part of this examination, the company recorded a tax provision of $8.7 million in 2002 foran agreed upon adjustment with the Internal Revenue Service. In 2004, this Internal Revenue Service examinationwas finalized after it was reviewed and approved by the Joint Committee on Taxation.
Federal income taxes were not provided for on income from foreign subsidiaries (except for Canada), since they areconsidered to be permanently invested. The total unremitted earnings of these subsidiaries is $21.8 million. If theseearnings were remitted, foreign tax credits would substantially offset any resulting federal income tax.
On December 21, 2004, the FASB issued FSP No. 109-2 that provides accounting and disclosure guidance for theforeign earnings repatriation provision within the Jobs Act. See Footnote 2 of the Consolidated Financial Statements.
8. Employee Benefits
Profit Sharing Plans The Company has a qualified contributory 401(k) profit sharing plan which covers all full-time employees over agetwenty-one with over 90 days of employment and 375 hours of service. The Company made matching contributionsof approximately $0.5 million and $2.1 million, net of forfeitures, to the profit sharing plan for 2004 and 2003,respectively. During 2002, the Company did not match employee deferrals. When the Company reinstated thematch for the 2003 plan year, it redefined the terms to match at least 25% of employee contributions up to the first5% of total eligible compensation, as defined in the various profit sharing plans. For 2004, the Company matched45% of employee contributions.
The Company has assumed many 401(k) plans of acquired subsidiaries. From time to time, the Company mergesthese plans into the Company’s plan. Company contributions relating to these merged plans are included in theaforementioned total.
Deferred Compensation Plan The Company also has a non-qualified deferred compensation plan for its highly compensated employees. While thedeferred compensation plan provides for matching contributions, the Company did not match employee deferralsfor 2004, 2003 and 2002. The Company looks to invest the assets of the deferred compensation plan based oninvestment allocations of the employees. The liability to the employees for amounts deferred is included in ‘Other’in the Liabilities section of the Consolidated Balance Sheet.
In the beginning of 2002, the Company purchased insurance on the lives of its highly compensated employees. Thiscompany-owned life insurance is intended to be used to settle the Company’s obligations of deferred compensation.The cash surrender value of the company-owned life insurance is included in ‘Other assets, net’ in the ConsolidatedBalance Sheets.
9. Stockholders’ Equity
Stock Repurchase Plan The Company’s Board of Directors had authorized the repurchase of up to $65 million of the Company’s CommonStock. Beginning in the third quarter of 2002 through the end of 2004, 5.1 million shares at a cost of $39.9 millionhave been repurchased under this authorization.
Incentive Employee Stock Plan In 2004, the Company replaced the 1995 Stock Option Plan with the 2004 Equity Plan (Employee Plan). Under theCompany’s Employee Plan, participants may be granted stock options (incentive and nonqualified), stock appreciationrights, restricted stock, restricted stock units, and performance shares. The total number of shares available for awardunder the Employee Plan is 5.7 million, comprised of 4.5 million newly authorized shares and 1.2 million unusedshares allocated from the 1995 Plan, plus lapsed or cancelled awards or options from grants outstanding at the timeof shareholder approval under the 1995 Plan. The Employee Plan, among other things, requires the exercise price
47MPS Group

of nonqualified stock options to not be less than 100% of the fair market value of the stock on the date the optionis granted, and defines a director to comply with Rule 16b-3 of the Securities Exchange Act of 1934, as amendedand with Section 162(m) of the Internal Revenue Code of 1986, as amended, and prohibits the Company fromreducing the exercise price of outstanding options (repricing) without first receiving shareholder approval. In 2004,the Company did not issue any shares under the Employee Plan.
Additionally, the Company assumed the stock option plans of some of its subsidiaries upon acquisition in accordancewith terms of the respective merger agreements. As of December 31, 2004, 2003 and 2002, the assumed plans hadan immaterial number of options outstanding.
Non-Employee Director Stock Plan In 2004, the Company adopted the 2004 Non-Employee Directory Equity Incentive Plan (Director Plan). It replacedthe Amended and Restated Non-Employee Director Stock Option Plan (Prior Director Plan) that expired inDecember 2003. Under the Director Plan, non-employee directors may be granted stock options, stock appreciationrights, restricted stock, and restricted stock units. The total number of shares that may be awarded under the DirectorPlan is 570,000, plus lapsed or cancelled awards or options from grants outstanding at the time of shareholderapproval under the prior Director Plan. The Director Plan allows each non-employee director to purchase 60,000shares at an exercise price equal to the fair market value at the date of the grant upon election to the Board, whichbecomes exercisable ratably over a five-year period. In addition, the Director Plan provides for an annual issuance ofnon-qualified options to purchase 20,000 shares to each director, upon reelection, at an exercise price equal to the fairmarket value at the date of grant, which become exercisable ratably over a three-year period. Both sets of optionsexpire ten years from the date of the grant. The Board of Directors are also able to grant additional options to non-employee directors from time to time as the Board determines in its discretion as well as replace one option withone-half of a share of restricted stock. In 2004, the Company did not issue any options under this plan.
Under the Prior Director Plan, in 2003 and 2002, the Company granted 260,000 and 180,000 options, respectively,at an average exercise price of $7.82, and $6.31, respectively.
The following table summarizes the Company’s Stock Option Plans:Weighted
Range of AverageShares Exercise Prices Exercise Price
Balance, December 31, 2001 15,189,222 $ 1.25 – $33.38 $ 6.50Granted 3,011,170 $ 5.24 – $ 8.45 $ 5.44Exercised ( 2,871,696 ) $ 2.85 – $ 9.65 $ 8.19Canceled ( 955,513 ) $ 3.63 – $17.38 $ 7.99
Balance, December 31, 2002 14,373,183 $ 1.25 – $33.38 $ 6.12Granted 429,000 $ 5.29 – $ 9.14 $ 7.00Exercised ( 2,044,713 ) $ 1.25 – $ 9.88 $ 5.23Canceled ( 957,412 ) $ 3.63 – $33.38 $ 9.73
Balance, December 31, 2003 11,800,058 $ 3.56 – $22.88 $ 6.10Granted 165,000 $11.72 – $11.72 $11.73Exercised ( 3,283,337 ) $ 3.56 – $11.13 $ 5.73Canceled ( 767,560 ) $ 3.63 – $17.38 $ 6.16
Balance, December 31, 2004 7,914,161 $ 3.56 – $22.88 $ 6.26
48 MPS Group

49MPS Group
The following table summarizes information about stock options outstanding at December 31, 2004:
Outstanding ExercisableAverage Average
Average Exercise ExerciseRange of Exercise Prices Shares Life (1) Price Shares Price
$ 3.56 – $ 3.85 1,399,822 6.71 $ 3.84 1,389,822 $ 3.85$ 3.94 – $ 5.24 2,036,336 7.33 5.16 1,293,285 5.12$ 5.29 – $ 6.96 3,318,394 6.75 6.03 2,943,421 6.01$ 7.13 – $ 10.00 439,075 6.48 8.71 295,882 8.73$ 10.62 – $ 13.63 516,325 5.91 11.97 508,125 11.95$ 13.67 – $ 22.88 204,209 3.25 17.91 201,509 17.92Total 7,914,161 6.73 $ 6.26 6,632,044 $ 6.33
(1) Average contractual life remaining in years.
At year-end 2003, options with an average exercise price of $6.35 were exercisable on 8.1 million shares; at year-end2002, options with an average exercise price of $6.74 were exercisable on 8.5 million shares.
During 2004 and 2002, the Company’s Board of Directors issued restricted stock grants of 150,000 and 100,000shares, respectively, to the Company’s President and Chief Executive Officer, and grants of 425,000 shares and103,333 shares to other members of management in 2004 and 2002, respectively. The Company recorded $6.5million and $1.3 million in Stockholders’ equity for deferred compensation in 2004 and 2002, respectively. TheCompany recorded $2.6 million, $1.5 million and $2.2 million of compensation expense in 2004, 2003 and 2002,respectively, for the vesting of these grants. The deferred compensation is amortized on a straight line basis over thevesting period of the grants. There were no restricted stock grants in 2003.
The Company has an employee stock purchase plan (ESPP), which provides that eligible employees may contributeup to 10% of their base earnings toward the quarterly purchase of the Company’s Common Stock. The employee’spurchase price is 85% of the lesser of the fair market value of the stock on the first business day or the last businessday of the quarterly offering period. No compensation expense is recorded in connection with the ESPP. The totalnumber of shares issuable under the ESPP is 1.0 million. During 2004, 2003 and 2002, the Company issued thefollowing stock under the ESPP:
Purchase PriceYear # of Shares High Low
2004 189,667 $ 11.14 $ 8.342003 201,008 $ 9.49 $ 5.202002 247,880 $ 8.82 $ 5.00
Since inception of the ESPP, 747,000 shares have been purchased, leaving 253,000 shares available for futureissuances.

10. Net Income Per Common Share
The calculation of basic net income (loss) per common share and diluted net income (loss) per common share ispresented below:(dollar amounts in thousands except per share amounts)
Years 2004 2003 2002
Income (loss) per common share computation:Income (loss) from continuing operations before cumulative
effect of accounting change $ 35,420 $ 21,835 $ ( 14,002 )Income (loss) from discontinued operations, net of tax — ( 2,395 ) 1,410Loss on disposition of discontinued operations, net of tax — ( 20,675 ) —Cumulative effect of accounting change, net of tax — — ( 553,712 )
Net income (loss) $ 35,420 $ ( 1,235 ) $( 566,304 )Basic average common shares outstanding 102,804 101,680 100,833
Incremental shares from assumed exercise of stock options 4,038 2,838 —Diluted average common shares outstanding 106,842 104,518 100,833Basic income (loss) per common share:
Income (loss) from continuing operations before cumulativeeffect of accounting change $ 0.34 $ 0.21 $ (0.14 )
Income (loss) from discontinued operations, net of tax — ( 0.02 ) 0.01Loss on disposition of discontinued operations, net of tax — ( 0.20 ) —Cumulative effect of accounting change, net of tax — — ( 5.49 )
Basic net income (loss) per common share $ 0.34 $ ( 0.01 ) $ ( 5.62 )Diluted income (loss) per common share:
Income (loss) from continuing operations before cumulativeeffect of accounting change $ 0.33 $ 0.21 $ ( 0.14 )
Income (loss) from discontinued operations, net of tax — ( 0.02 ) 0.01Loss on disposition of discontinued operations, net of tax — ( 0.20 ) —Cumulative effect of accounting change, net of tax — — ( 5.49 )
Diluted net income (loss) per common share $ 0.33 $ ( 0.01 ) $ ( 5.62 )
Options to purchase approximately 700,000, 1.6 million, and 2.3 million shares of common stock that wereoutstanding during 2004, 2003, and 2002 respectively, were not included in the computation of diluted earnings pershare as the exercise prices of these options were greater than the average market price of the common shares.
11. Concentration of Credit Risk
The Company’s financial instruments that are exposed to concentrations of credit risk consist primarily of cash andaccounts receivable. The Company places its cash and cash equivalents with what management believes to be highcredit quality institutions. At times such investments may be in excess of the FDIC insurance limit. The Companyroutinely assesses the financial strength of its customers and, as a consequence, believes that its accounts receivablecredit risk exposure is limited.
12. Fair Value of Financial Instruments
The carrying amounts of cash and cash equivalents, accounts receivable, other assets, accounts payable and accruedexpenses, and notes payable approximate fair value due to the short-term maturities of these assets and liabilities.Borrowings under the revolving credit facility have variable rates that reflect currently available terms and conditionsfor similar debt. The carrying amount of this debt is considered by management to be a reasonable estimate of itsfair value.
50 MPS Group

13. Furniture, Equipment, and Leasehold Improvements
A summary of furniture, equipment, and leasehold improvements at December 31, 2004 and 2003 is as follows(dollar amounts in thousands)
EstimatedUseful Life
in Years 2004 2003
Furniture, equipment, and leasehold improvements 5—15/lease term $ 95,930 $ 87,476Software 3 8,566 8,437Software development 5 24,378 22,698
128,874 118,611Accumulated depreciation and amortization 101,996 89,123
Total furniture, equipment, and leasehold improvements, net $ 26,878 $ 29,488
Total depreciation and amortization expense on furniture, equipment, and leasehold improvements was $13.6million, $16.1 million, and $19.8 million for 2004, 2003, and 2002, respectively.
14. Quarterly Financial Data (Unaudited)
For the Three Months EndedFor the Year
Ended3-31-2004 6-30-2004 9-30-2004 12-31-2004 12-31-2004
Revenue $ 310,481 $ 333,245 $ 362,332 $ 420,784 $ 1,426,842Gross profit 78,235 85,156 91,673 105,723 360,787Net income 5,322 9,344 9,446 11,308 35,420Basic net income per common share 0.05 0.09 0.09 0.11 0.34Diluted net income per common share 0.05 0.09 0.09 0.11 0.33
For the Three Months EndedFor the Year
Ended3-31-2003 6-30-2003 9-30-2003 12-31-2003 12-31-2003
Revenue $ 264,263 $ 273,167 $ 274,669 $ 283,931 $ 1,096,030Gross profit 67,005 73,581 73,697 72,857 287,140Income from continuing operations 2,933 6,463 7,166 5,273 21,835Income (loss) from discontinued
operations, net of tax 5 ( 644 ) ( 1,177 ) ( 579 ) ( 2,395 )Loss on disposition of discontinued
operations, net of tax — — — ( 20,675 ) ( 20,675 )Net income (loss) 2,938 5,819 5,989 ( 15,981 ) ( 1,235 )
Basic income per common share fromcontinuing operations 0.03 0.06 0.07 0.05 0.21
Basic income (loss) per common sharefrom discontinued operations, net of tax 0.00 ( 0.01 ) ( 0.01 ) ( 0.01 ) ( 0.02 )
Basic loss per common share fromdisposition, net of tax — — — ( 0.20 ) ( 0.20 )
Basic net income (loss) per common share 0.03 0.05 0.06 ( 0.15 ) ( 0.01 )Diluted income per common share from
continuing operations 0.03 0.06 0.07 0.05 0.21Diluted income (loss) per common share
from discontinued operations, net of tax 0.00 ( 0.01 ) ( 0.01 ) ( 0.01 ) ( 0.02 )Diluted loss per common share from
disposition, net of tax — — — ( 0.19 ) ( 0.20 )Diluted net income (loss) per common share 0.03 0.05 0.06 ( 0.15 ) ( 0.01 )
51MPS Group
(dollar amounts in thousandsexcept per share amounts)

15. Segment Reporting
The Company discloses segment information in accordance with SFAS No. 131, Disclosure About Segments of anEnterprise and Related Information, which requires companies to report selected segment information on a quarterlybasis and to report certain entity-wide disclosures about products and services, major customers, and the materialcountries in which the entity holds assets and reports revenues.
The Company has four reportable segments: North American Professional services, European Professional services,North American IT services, and European IT services. The Company’s reportable segments offer different services,have different client bases, experience differing economic characteristics, and are managed separately as each requiresdifferent resources and marketing strategies. The North American Professional services segment provides specializedstaffing and recruiting in the disciplines of accounting, finance, law, engineering and healthcare. The EuropeanProfessional services segment provides specialized staffing and recruiting for accounting, financial services, legal,human resources, not-for-profit and public-sector positions. The North American IT services segment offers value-added solutions such as IT project support and staffing, recruitment of full-time positions, project-based solutions,supplier management solutions, on-site recruiting support, IT strategy consulting, design and branding, applicationdevelopment, and integration. The European IT services segment provides value-added solutions such as IT projectsupport and staffing, and recruitment of full-time positions specialized staffing and solutions.
The North American Professional services division’s results for 2004 include the results from the acquisitions of threehealth care staffing businesses, which were acquired by the Company in July 2002, and February and March of 2004,the four legal staffing businesses, which were acquired in February and August of 2003 and September and Octoberof 2004, and the three accounting and finance businesses, which were acquired in February, July and October of 2004.For the Company’s European Professional services segment and its European IT services segment, revenue isprimarily generated from the United Kingdom.
The Company evaluates segment performance based on revenues, gross profit, and income before provision forincome taxes. The Company does not allocate income taxes, interest or unusual items to the segments. In addition,the Company does not report total assets by segment.
The accounting policies of the segments are consistent with those described in the summary of significant accountingpolicies in Note 2 and all intersegment sales and transfers are eliminated.
No one customer represents more than 5% of the Company’s overall revenue. Therefore, the Company does notbelieve it has a material reliance on any one customer as the Company is able to provide services to numerousFortune 1000 and other leading businesses.
52 MPS Group

The following tables summarize performance, identifiable assets, and long-lived assets by segment and revenue bygeographic location:(dollar amounts in thousands)
Years 2004 2003 2002
RevenueNorth American Professional services $ 429,560 $ 315,754 $ 281,637European Professional services 289,058 198,346 177,706North American IT services 459,470 401,193 484,566European IT services 248,754 180,737 175,247
Total revenue $ 1,426,842 $ 1,096,030 $ 1,119,156Gross profit
North American Professional services $ 123,783 $ 89,127 $ 79,721European Professional services 80,402 58,238 54,392North American IT services 123,757 112,780 122,840European IT services 32,845 26,995 27,885
Total gross profit $ 360,787 $ 287,140 $ 284,838Income (loss) from continuing operations before provision for income taxes
North American Professional services $ 30,937 $ 16,012 $ 15,100European Professional services 13,192 12,450 16,245North American IT services 28,022 23,214 15,604European IT services 2,401 2,944 4,748
74,552 54,620 51,697Corporate expenses (1) (23,316 ) ( 19,103 ) ( 22,788 )Recapture (charges) (2) 897 284 ( 25,132 )Other income (expense), net 1,437 553 ( 3,947 )Total income (loss) from continuing operations before provision
for income taxes $ 53,570 $ 36,354 $ ( 170 )Geographic Areas
RevenueNorth America $ 889,030 $ 716,947 $ 766,203Europe 537,812 379,083 352,953
Total revenue $ 1,426,842 $ 1,096,030 $ 1,119,156
As of 12-31-2004 12-31-2003
Accounts receivable, netNorth American Professional services $ 60,623 $ 38,900European Professional services 32,433 21,268North American IT services 78,367 59,682European IT services 38,089 39,509
Total accounts receivable, net $ 209,512 $ 159,359Long-lived assets
North American Professional services $ 154,412 $ 112,336European Professional services 105,542 105,057North American IT services 253,378 255,714European IT services 35,904 34,346
Total long-lived assets $ 549,236 $ 507,453
(1) Corporate expenses include unallocated expenses not directly related to the segments’ operations.
(2) Charges for 2002 include (1) $16.2 million impairment of minority investment, and (2) $9.0 million exit costs. 2004 and 2003include a $897,000 and $284,000 recapture, respectively, relating to the settlement of abandoned real estate associated with the 2002exit costs.
53MPS Group

54 MPS Group
16. Excess Real Estate Obligations
In 2001 and 2002, the Company experienced a material decrease in demand for its domestic operations. To reflectthis decreased demand, the Company made attempts to realign its real estate capacity needs by vacating andreorganizing certain office space.
In 2002, management determined that the Company would not be able to utilize this vacated office space and,therefore, notified the respective lessors of their intentions. This determination eliminated the economic benefitassociated with the vacated office space. As a result, the Company recorded a charge for contract termination costs,mainly due to costs that will continue to be incurred under the lease contract for its remaining term without economicbenefit to the Company. While the Company looks to settle excess lease obligations, the current economicenvironment has made it difficult for the Company to either settle or find acceptable subleasing opportunities. Theaverage remaining lease term for the lease obligations included herein is approximately 5 years.
The following table summarizes the activity of the charge for contract termination costs from origination throughDecember 31, 2004 by reportable segment:(dollar amounts in thousands)
Professional Services It ServicesNorth America Europe North America Europe Total
Balance as of December 31, 2002 $ 431 $ — $ 8,536 $ — $ 8,967Costs paid or otherwise settled during 2003 ( 223 ) — ( 4,051 ) — ( 4,274 )Amounts recaptured during 2003 ( 39 ) — ( 245 ) — ( 284 )Balance as of December 31, 2003 $ 169 — 4,240 — 4,409Costs paid or otherwise settled during 2004 ( 169 ) — ( 1,870 ) — ( 2,039 )Amounts recaptured during 2004 — — ( 897 ) — ( 897 )Balance as of December 31, 2004 $ — $ — $ 1,473 $ — $ 1,473
17. Discontinued Operations
In December 2003, the Company sold certain operating assets and transferred certain operating liabilities of itsoutplacement unit. Revenue generated from this unit was $21.0 million, and $35.8 million, in 2003 and 2002,respectively. Income before taxes was a $3.7 million loss and $2.2 million of income, for 2003, and 2002, respectively.
The remaining net liabilities of $328,000 at December 31, 2004, which were primarily comprised of $347,000 ofcontract termination costs, were included in the line item ‘Other’ in the Liabilities section of the Company’sConsolidated Balance Sheet.
The remaining net assets of $109,000 at December 31, 2003, were included in the line item ‘Other’ in the CurrentAssets section of the Company’s Consolidated Balance Sheet. They were comprised of $3.4 million of accountsreceivable and other assets, net of $3.3 million of related liabilities. Of the related liabilities, $1.1 million were forcontract termination costs.
Schedule II—Valuation and Qualifying Accounts (dollar amounts in thousands)
Balance atBeginning of Charged to Translation Balance at
Period Expenses Deductions Adjustments End of Period
Year Ended December 31, 2002Allowance for doubtful accounts receivable $ 19,533 3,093 (6,575 ) 868 $ 16,919Deferred tax valuation allowance $ 16,303 8,747 — — $ 25,050
Year Ended December 31, 2003Allowance for doubtful accounts receivable $ 16,919 1,505 (6,104 ) 579 $ 12,899Deferred tax valuation allowance $ 25,050 2,121 — — $ 27,171
Year Ended December 31, 2004Allowance for doubtful accounts receivable $ 12,899 3,271 (6,715 ) 381 $ 9,836Deferred tax valuation allowance $ 27,171 3,716 — — $ 30,887

55MPS Group
Reconciliation of Non-GAAP Financial Measure to GAAP Financial Measure(dollar amounts in thousands)
Years 2004 2003
EBITDA $ 67,011 $ 52,526Exit recapture (see Note 16) 897 284Depreciation and intangibles amortization ( 15,775 ) ( 17,009 )Operating income 52,133 35,801Other income, net 1,437 553Provision for income taxes ( 18,150 ) ( 14,519 )Income from continuing operations 35,420 21,835Discontinued operations (see Note 17):
Loss from discontinued operations, net of income taxes — ( 2,395 )Loss on disposition of discontinued operations, net of income tax benefit — ( 20,675 )
Net income (loss) $ 35,420 $ ( 1,235 )

Request for Information
Upon written request, we will furnish shareholders,without charge, copies of quarterly information,additional copies of this Annual Report, and copies ofour Form 10-K (without exhibits) as filed with theSecurities and Exchange Commission for fiscal yearended December 31, 2004. Requests should bedirected to:
MPS Group, Inc.Investor Relations Department1 Independent DriveJacksonville, Florida [email protected]
The certifications of our Chief Executive and ChiefFinancial Officers required by Section 302 of theSarbanes-Oxley Act of 2002, which address, amongother things, the content of our Annual Report onForm 10-K, appear as exhibits to the Form 10-K.
Pursuant to the requirements of the New York StockExchange, in 2004 our Chief Executive Officercertified to the NYSE that he was not aware of anyviolation by MPS Group, Inc. of the NYSE’scorporate governance listing standards.
Corporate Headquarters
1 Independent DriveJacksonville, Florida 32202-5060(904) 360-2000
Common Stock Data
MPS Group, Inc.’s common stock is traded on theNew York Stock Exchange under the symbol MPS.As of March 31, 2005, MPS Group, Inc. had approxi-mately 22,878 shareholders. Of that total, 978 werestockholders of record and approximately 21,900 heldtheir stock in nominee name.
The Company currently intends to retain any earningsfor the operation and expansion of its business anddoes not anticipate paying any cash dividends in thefuture. See “Market for Registrant’s Common Equity,Related Stockholder Matters and Issuer Purchases ofEquity Securities” on page 19 for more informationon our common stock.
Transfer Agent and Registrar
SunTrust Bank, AtlantaP.O. Box 4625Atlanta, Georgia 30302(404) 588-7815
Legal Counsel
Kilpatrick Stockton LLPAtlanta, Georgia
Independent Auditors
PricewaterhouseCoopers LLPJacksonville, Florida
56 MPS Group
This Annual Report to shareholders contains forward-looking statements that are subject to certain risks,uncertainties, or assumptions and may be affected by certain other factors including but not limited to the factorsdescribed on page 17 of this Annual Report.Other products or company names mentioned herein may be trademarks, service marks, or trade names of theirrespective companies.
© 2005, MPS Group, Inc.® All rights reserved.

susa
nmic
hal.c
om
MPS Group headquarters and Modis were prominently featured throughout the 2005 Super Bowl XXXIX celebration in Jacksonville, Florida.

1 Independent Drive • Jacksonville, Florida 32202Phone 904-360-2000 • Fax 904-360-2521
www.mpsgroup.com