2004 Annual Report...Board includes other asset classes such as bonds, real estate, and resource...
178
2004 Annual Report Minnesota State Board of Investment
Transcript of 2004 Annual Report...Board includes other asset classes such as bonds, real estate, and resource...
2004Annual Report
Minnesota StateBoard of Investment

2004 Annual Report
Table of Contents
Introduction ............................................................................................. 1
Funds Under Management ....................................................................... 2
Combined Funds ...................................................................................... 5
Basic Retirement Funds ........................................................................... 9
Post Retirement Fund ............................................................................ 12
Investment Pools .................................................................................... 15
Supplemental Investment Fund .............................................................. 25
State Deferred Compensation Plan ........................................................ 34
Assigned Risk Plan ................................................................................ 37
Permanent School Fund ......................................................................... 39
Environmental Trust Fund ..................................................................... 41
Closed Landfill Investment Fund........................................................... 43
CashManagement and Related Programs ............................................. 44
Other Deferred Compensation Programs ............................................... 46
Major Policy Initiatives ......................................................................... 47
Investment Manager Summaries ............................................................ 54
StatisticalData ....................................................................................... 71
Section II ............................................................................................. 113
Auditor’s Report .................................................................................. 114
Financial Statements ............................................................................ 116
Footnotes to Financial Statements ....................................................... 119
Supplemental Financial Statements ..................................................... 123
Supplemental Investment FundCombining Statements ................. 124
Pooled Investment Account Schedules ........................................... 142
Footnotes to Supplemental Financial Statements ........................... 150
Manager Fees ....................................................................................... 151
SummarizedAsset Listings .................................................................. 153
This annual report can be accessed on our website at www.sbi.state.mn.us

MINNESOTASTATEBOARD OFINVESTMENT
Board MembersGovernorTim Pawlenty
State AuditorPatricia Anderson
Secretary of StateMary Kiffmeyer
Attorney GeneralMike Hatch
Executive Director
Howard J. Bicker
60 Empire DriveSuite 355
St. Paul, MN 55103(651) 296-3328
FAX (651) 296-9572E-mail:
An Equal OpportunityEmployer
December, 2004
The Minnesota State Board of Investment (SBI) is pleased to present its report forthe fiscal year ending June 30, 2004.
Investment EnvironmentAfter three years of lackluster performance, the U.S. and international stock markets providedstrong returns during Fiscal Year 2004. The U.S. stock market increased 20.5%, as measured bythe Russell 3000. The market improvement was a result of the U.S. economic recovery, strongconsumer confidence and improving unemployment data. This strong performance was somewhatmuted by concerns about terrorism, the war in Iraq, the presidential election, record high oil prices,and a 25 basis point increase in the federal funds rate.
International stock markets were very strong during the year. The Morgan Stanley CapitalInternational (MSCI) All Country World Index excluding the United States (ACWI Ex U.S.),which represents the developed and emerging international markets outside the U.S., returned32.1% for the fiscal year.
The U.S. bond market, as measured by the Lehman Brothers Aggregate Bond Index, returned0.3% for the fiscal year. The economic recovery and higher commodity pricing raised fears ofinflation which resulted in higher inflation rates. Mortgage securities and corporate bonds outpacedU.S. Treasury securities to allow the overall market to end in positive territory.
SBI ResultsWithin this investment environment, the retirement assets under the Board’s control improved asfollows:
• The Basic Retirement Funds increased 16.6% during fiscal year 2004. Over the latest ten year period, the Funds have experienced an annualized return of 9.8%. (See page 9.)
• The Post Retirement Fund was up 16.3% for the year. Overall, the Fund provided a ten year annualized return of 9.4%. (See page 12.)
• The lifetime Post Retirement benefit increase for Fiscal Year 2004 will be 2.5%. The increasewill be payable to eligible retirees effective January 1, 2005.
On June 30, 2004, assets under management totaled $47.1 billion. This total is the aggregateof several separate pension funds, trust funds and cash accounts, each with different investmentobjectives. In establishing a comprehensive management program, the Board develops an investmentstrategy for each fund which reflects its unique requirements. The primary purpose of thisannual report is to communicate the investment goals, policies and performance of eachfund managed by the Board. Through the investment programs presented in this report, theMinnesota State Board of Investment seeks to enhance the management and performance of thefunds under its control.
Sincerely,
Howard BickerExecutive Director
The Legislature has established aseventeen member InvestmentAdvisory Council to advise theBoard and its staff on investment-related matters.
The Board appoints ten membersexperienced in finance andinvestment. These memberstraditionally have come from theMinneapolis and St. Paul corporateinvestment community.
The Commissioner of Finance andthe Executive Directors of the threestatewide retirement systems arepermanent members of the Council.
Two active employee representativesand one retiree representative areappointed to the Council by theGovernor.
The Council has formed threecommittees organized around broadinvestment subjects relevant to theBoard’s decision-making process:Asset Allocation, Stock and BondManagers and AlternativeInvestments.
All proposed investment policies arereviewed by the appropriateCommittee and the full Councilbefore they are presented to theBoard for action.
Governor Tim Pawlenty, ChairState Auditor Patricia AndersonSecretary of State Mary KiffmeyerState Attorney General Mike Hatch
Investment Advisory Council
State Board of Investment
Members of the Council
Michael L. Troutman, ChairStrategic Planning & DevelopmentBoard of Pensions EvangelicalLutheran Church in America
Malcolm W. McDonald, RetiredVice ChairDirector & Corporate SecretarySpace Center, Inc.
Frank Ahrens, IIGovernor’s AppointeeActive Employee Representative
Gary AustinExecutive DirectorTeachers Retirement Association
David BergstromExecutive DirectorMn. State Retirement System
John E. Bohan, RetiredV.P., Pension InvestmentsGrand Metropolitan- Pillsbury
Kerry BrickPension Investment OfficerCargill, Inc.
Douglas GorenceChief Investment OfficerU of M Foundation InvestmentAdvisors
Kenneth F. GudorfChief Executive OfficerAgio Capital Partners
Peggy IngisonCommissionerMn. Dept. of Finance
Heather JohnstonGovernor’s AppointeeActive Employee Representative
P. Jay Kiedrowski, RetiredExecutive Vice PresidentWells Fargo & Company
Hon. Kenneth MaasGovernor’s AppointeeRetiree Representative
Judith W. MaresFinancial ConsultantMares Financial Consulting, Inc.
Gary R. Norstrem, RetiredTreasurerCity of St. Paul
Daralyn PeiferChief Investment OfficerGeneral Mills, Inc.
Mary VanekExecutive DirectorPublic Employees Retirement Assoc.
As of December 2004

Staff, Consultants & Custodians
���������������������������
�������������� ������������������������
Investment Staff
Public Equities+��,����������� ������,����� ������#6������
+�����+��� ������,�$��������#6������
Fixed Income andInternal Investments��������#���������� �,����� �������������
������!������ �������,�"�����������
Alternative Assets# ���*�����-�� )�� �,���� �����������������
�����)�����������������,���� �����������������
Cash Management+�� ���%�������� �,� �� ���� ����������
Public Programs#�����$�(�����-��"�� �,�!�����! �� ��
��- ��������-�� )�����,� � ����� � � �����
Administrative Staff
Finance and Accounting���������+�������������� �����$� ����
��������*�� ������������ ��� ���� ,� ����
�� ���*�) ��������������0����� ,����� ������
*������� �������������0����� ,����� ������
%��������.�����������0����� ,����� ������
# ���! �� ���������������0�����
Support Services���������/�� ��������� ��������������������#���������$� ����
��� ��*��� �0�������������� ����� �������,���� ������
+ �������"���������� � � ������ �������
Consultants
&��� ������������������0�������������������,�������
�����! �(�������������'���� ��� �������"��������� ����������,����� ��
Custodian Banks
.��� ���������� ����"����+�����+������!����0�������� ������,������������
�������������������������" �0�� �,��� ���!�,���������
������$������ �3445

1
Introduction
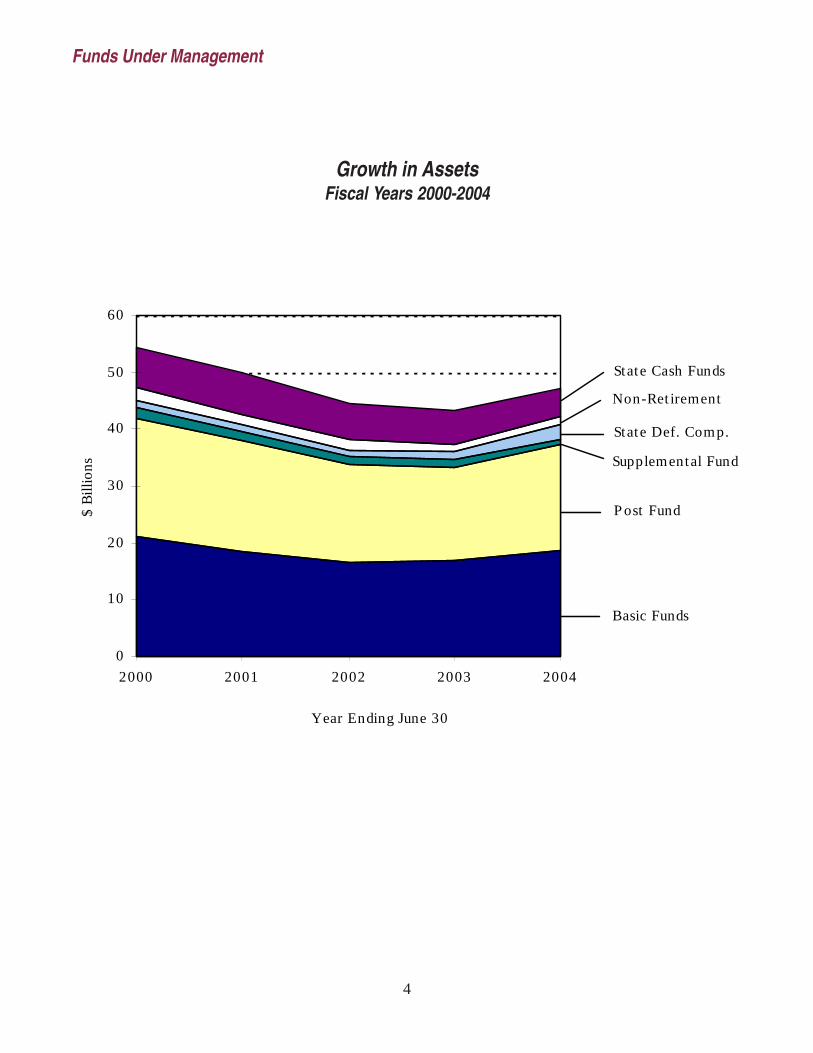
The Minnesota State Board of Investment is responsible for theinvestment management of various retirement funds, trust funds andcash accounts. On June 30, 2004, the market value of all assets was$47.1 billion.
Constitutional and StatutoryAuthorityThe Minnesota State Board ofInvestment (SBI) is established byArticle XI of the MinnesotaConstitution to invest all state funds.Its membership as specified in theConstitution is comprised of theGovernor (who is designated as chairof the Board), State Auditor,Secretary of State and State AttorneyGeneral.
All investments undertaken by theSBI are governed by the prudentperson rule and other standardscodified in Minnesota Statutes,Chapter 11A and Chapter 356A.
Prudent Person RuleThe prudent person rule, as codifiedin Minnesota Statutes Section11A.09, requires all members of theBoard, Investment Advisory Council,and SBI staff to “...act in good faithand ...exercise that degree ofjudgment and care, undercircumstances then prevailing,which persons of prudence,discretion and intelligence exercisein the management of their ownaffairs, not for speculation, but forinvestment, considering the probablesafety of their capital as well as theprobable income to be derivedtherefrom.” Minnesota StatutesSection 356A.04 contains similarcodification of the prudent personrule applicable to the investment ofpension fund assets.
Authorized InvestmentsIn addition to the prudent personrule, Minnesota Statutes Section
11A.24 contains a specific list ofasset classes available forinvestment, including commonstocks, bonds, short term securities,real estate, private equity, andresource funds. The statutesprescribe the maximum percentageof fund assets that may be investedin various asset classes and containspecific restrictions to ensure thequality of the investments.
Investment PoliciesWithin the requirements defined bystate law, the State Board ofInvestment, in conjunction with SBIstaff and the Investment AdvisoryCouncil, establishes investmentpolicies for all funds under itsmanagement. These investmentpolicies are tailored to the particularneeds of each fund and specifyinvestment objectives, risk tolerance,asset allocation, investmentmanagement structure and specificperformance standards.
The Board has adopted guidelinesconcerning investments in stockmarkets outside the U.S. Theguidelines do not prohibit investmentin any market, but do require thatadditional notification and/orpresentation be provided to SBI staffor the SBI Administrative Committeein certain cases (refer to page 52 formore information on theseguidelines).
The Board, its staff, and theInvestment Advisory Council haveconducted detailed analyses of eachof the funds under the SBI’s controlthat address investment objectives,
asset allocation policy andmanagement structure. These studiesguide the on-going management ofthese funds and are updatedperiodically.
Important NotesReader should note that the SBI’sreturns in this report are shown aftertransactions costs and fees arededucted. Performance is computedand reported after all applicablecharges to assure that the Board’sfocus is on true net returns.
Due to the large number ofindividual securities owned by thefunds managed by the SBI, thisreport contains only summarizedasset listings. A complete list ofsecurities is available upon requestfrom the State Board ofInvestment.

2
Market ValueJune 30, 2004
Basic Retirement Funds $18.8 billionThe Basic Retirement Funds contain the pension assets of thecurrently working participants in eight statewide retirement plans:
Teachers Retirement Fund $6.883 billionPublic Employees Retirement Fund 4.912 billionState Employees Retirement Fund 4.163 billionPublic Employees Police and Fire Fund 2.294 billionHighway Patrol Retirement Fund 218 millionCorrectional Employees Fund 247 millionPublic Employees Correctional Fund 73 millionJudges Retirement Fund 35 million
Post Retirement Fund $18.4 billionThe Post Retirement Investment Fund is composed of the reserves forretirement benefits to be paid to retired employees. Lifetime retirementbenefit increases are permitted based on both inflation and investmentperformance.
Supplemental Investment Fund (SIF) $1.0 billionThe Supplemental Investment Fund includes assets of the unclassifiedstate employees retirement plan, other defined contribution retirementplans, and various retirement programs for local police andfirefighters. Participants may choose among seven separate accountswith different investment objectives designed to meet a wide range ofparticipant needs and objectives.
Income Share Account stocks and bonds $467 millionCommon Stock Index Account passively managed stocks 192 millionGrowth Share Account actively managed stocks 136 millionBond Market Account actively managed bonds 93 millionInternational Share Account non-U.S. stocks 59 millionFixed Interest Account stable value investments 52 millionMoney Market Account short-term debt securities 44 million
Non-Retirement Funds $1.6 billionAssigned Risk Plan $263 millionThe Minnesota Workers Compensation Assigned Risk Planprovides worker compensation insurance for companies unableto obtain coverage through private carriers.
Permanent School Fund $578 millionThe Permanent School Fund is a trust established for the benefitof Minnesota public schools.
Environmental Trust Fund $342 millionThe Environmental Trust Fund is a trust established for theprotection and enhancement of Minnesota’s environment. It isfunded with a portion of the proceeds from the state’s lottery.
Funds Under Management
3
Market ValueJune 30, 2004
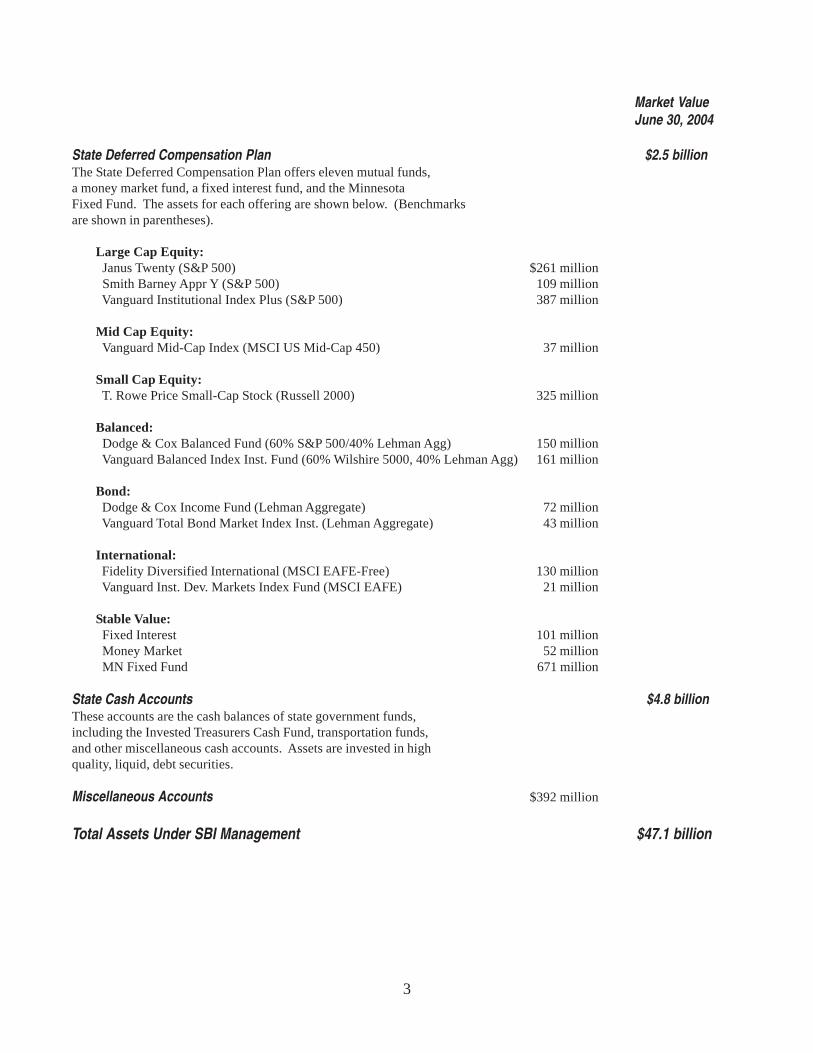
State Deferred Compensation Plan $2.5 billionThe State Deferred Compensation Plan offers eleven mutual funds,a money market fund, a fixed interest fund, and the MinnesotaFixed Fund. The assets for each offering are shown below. (Benchmarksare shown in parentheses).
Large Cap Equity: Janus Twenty (S&P 500) $261 million Smith Barney Appr Y (S&P 500) 109 million Vanguard Institutional Index Plus (S&P 500) 387 million
Mid Cap Equity: Vanguard Mid-Cap Index (MSCI US Mid-Cap 450) 37 million
Small Cap Equity: T. Rowe Price Small-Cap Stock (Russell 2000) 325 million
Balanced: Dodge & Cox Balanced Fund (60% S&P 500/40% Lehman Agg) 150 million Vanguard Balanced Index Inst. Fund (60% Wilshire 5000, 40% Lehman Agg) 161 million
Bond: Dodge & Cox Income Fund (Lehman Aggregate) 72 million Vanguard Total Bond Market Index Inst. (Lehman Aggregate) 43 million
International: Fidelity Diversified International (MSCI EAFE-Free) 130 million Vanguard Inst. Dev. Markets Index Fund (MSCI EAFE) 21 million
Stable Value: Fixed Interest 101 million Money Market 52 million MN Fixed Fund 671 million
State Cash Accounts $4.8 billionThese accounts are the cash balances of state government funds,including the Invested Treasurers Cash Fund, transportation funds,and other miscellaneous cash accounts. Assets are invested in highquality, liquid, debt securities.
Miscellaneous Accounts $392 million
Total Assets Under SBI Management $47.1 billion
4
Funds Under Management
Growth in AssetsFiscal Years 2000-2004
0
10
20
30
40
50
60
2000 2001 2002 2003 2004
$ B
illio
ns
Basic Funds
P ost Fund
Supplemental Fund
State Cash Funds
Non-Ret irement
State Def. Comp.
Year Ending June 30

5
The Combined Funds are so namedbecause they represent the combinedassets of both the Basic RetirementFunds (the funds for activeemployees) and Post RetirementFund (the fund for retiredemployees). Unlike most other publicand corporate pension plans, theassets of active and retiredemployees are separated understatute and therefore managed andaccounted for separately. Moreinformation on the structure andperformance of the Basic and PostFunds is contained in the followingchapters.
While the Combined Funds do notexist under statute, the Board finds itinstructive to review asset mix andperformance of all defined benefit
The “Combined Funds” represent the assets of both active andretired public employees who participate in the defined benefit plansof three state-wide retirement systems: Teachers RetirementAssociation (TRA), Public Employees Retirement Association (PERA)and the Minnesota State Retirement System (MSRS). OnJune 30, 2004, the Combined Funds had a market value of $37.2billion.
pension assets under its control. Thismore closely parallels the structure ofother public and corporate pensionplan assets and therefore allows formore meaningful comparison withother pension fund investors. Thecomparison universe used by the SBIis the Master Trust portion of theTrust Universe Comparison Service(TUCS). This universe containsinformation on public and corporatepension and trust funds with abalanced asset mix and over$1 billion in size.
It is important to note that thehistorical data on the CombinedFunds presented in this reportreflect only the Basic RetirementFunds through fiscal year 1993.Both the Basic and Post Funds areincluded thereafter.
This distinction is necessary due tothe very different asset allocationstrategies employed by the two fundsin the past. The Basic Funds havealways been managed to maximizetotal rates of return over the long-term and, therefore, its assetallocation has historically included asubstantial stock segment. Incontrast, until the post retirementbenefit increase formula was changedin 1993, the Post Retirement Fundwas managed to maximize currentincome which necessitated a largecommitment to bonds. As a result,the investment goals of the two fundswere incompatible for analyticalpurposes until fiscal year 1994.
Combined Funds
Cumulative Returns
0
100
200
300
400
500
Jun-
94
Dec
-94
Jun-
95
Dec
-95
Jun-
96
Dec
-96
Jun-
97
Dec
-97
Jun-
98
Dec
-98
Jun-
99
Dec
-99
Jun-
00
Dec
-00
Jun-
01
Dec
-01
Jun-
02
Dec
-02
Jun-
03
Dec
-03
Jun-
04
Percent
U.S. Stocks Cash Equivalents Consumer Price Index U.S. Bonds Int'l. Stocks
Figure 1. Performance of Capital Markets -FY 1995-2004

6
MedianCombined Allocation Funds in TUCS*
Domestic Equity 49.7% 47.5%International Equity 15.3 12.6Bonds 22.8 26.2Alternatives** 8.6 5.8Cash 3.6 4.7
* Represents the median allocation by asset class, and does not add to 100%. ** TUCS may include assets other than alternatives.
Combined Funds
Asset Allocation
As illustrated in Figure 1 on the priorpage, historical evidence stronglyindicates that U.S. common stockswill provide the greatest opportunityto maximize investment returns overthe long-term. As a result, the Boardhas chosen to incorporate a largecommitment to common stocks in itsasset allocation policy for theretirement funds. In order to limit theshort run volatility of returnsexhibited by common stocks, theBoard includes other asset classessuch as bonds, real estate, andresource investments in the totalportfolio. These assets diversify theFunds and reduce wide fluctuationsin investment returns on a year toyear basis. This diversificationshould not impair the Funds’ abilityto meet or exceed their actuarialreturn targets over the long-term.
Asset Mix Compared toOther Pension FundsComparisons of the CombinedFunds’ actual asset mix to themedian allocation to stocks, bondsand other assets of the funds inTUCS on June 30, 2004 aredisplayed in Figure 2.
It shows that the Combined Fundswere overweighted in domesticequities, international equities, andalternative investments relative to themedian allocation in TUCS andunderweighted in their allocation tobonds. Historical data on theCombined Funds’ asset mix is shownin Figure 3.
Return Objectives
The Combined Funds are evaluatedrelative to the following total rate ofreturn objectives:
—Provide Real Returns. Over atwenty year period, the CombinedFunds are expected to producereturns that exceed inflation by3-5 percentage points on anannualized basis.
010
20304050
607080
901 00
Ju n -0 0 Jun - 0 1 Ju n -0 2 Ju n -0 3 Jun - 0 4
Per
cent
A lt. A s s e ts
Ca s h
B o n d s
In t'l. S to c ks
Do m. S toc ks
Fig u re 3 . Co mb in e d Fu n d s His to r ic a l A s s e t Mix FY 2 0 0 0 -2 0 0 4
0
10
20
30
40
50
60
Dom. Eq . Int 'l Eq. Bonds Alternatives Cash
Per
cent
Combined Funds
TUCS Median
Figure 2. Combined Funds A s s et Mix Compar is on as of June 30, 2004

�
��� ��+��$�,�� &�,�� -�,�� $.�,��
���������9�����6���������5��$�����1��G &<�� ?<�� <&�� (*��
�G����������������������������������"����������;%�������#�"�����������
Combined Funds
H������������������������������I�������������������#�����������9����������.��������������.������������������$����������!��"��������"����������.��������������9�����
Investment Results
Comparison to InflationI�����������!���������#�����������9������.�����������������<�%��������"������#��������!��������.�����������������0����������������>�������������������������������������!����9�"����,�
Comparison to Other Funds/��������� ��������������!���!������������������������������������#������������������������������������!��"��������������������!���������������!������������������!�������������J������44���"��K��$������������:
�H��������� ���������������������������������������������������������������$�����"��������������1��������������"�������-)4*)E#�������!�������"�����������"����������������������#�������������������������������������������������������"�����������������1���������������������������������"�������
H����������� ����� �����=����������������������������������������!�������������������$���������������������������������������������������.���������������.�!������"���������������������������#���������������$��"��������������������������������!�!������������������������"������"4���������������
��� ��+��$�,�� &�,�� -�,�� $.�,�� /.�,��
���������" ���* %(�'0 &�%0 -�-0 *�(0 $$�/0��������� &�& -�% -�? -�' &�%
����������� �����9������������"��(2&)2*&#� ���������6������9��������������
0.0
2.0
4.0
6.0
8.0
10.0
12.0
14.0
16.0
18.0
1 Y r. 3 Y r. 5 Y r. 10 Y r. 20 Y r.
Per
cent
CombinedFunds*
Inf lation
F ig u r e 4 . Co m b in e d Fu n d s Pe r f o r m a n c e v s . In f la t io n
0
25
50
75
100
Median
CombinedFunds Rank*
1 Yr. 3 Yr. 5 Yr. 10 Yr.
Figu r e 5 . Co mb ine d Funds Pe r f o rmanc e Compared to O the r Pens ion Fun ds

������������1�����'��������������2 ���&.3�/..4
��5� ������������������ �����1 ������1�6��*
�7��������$� 5�������&))) ')�)E
���3�����$� �������/��9�����.��1��� %'�)
�7������ ��� A�������""��"�� -,�'
�������������������� ������������������� <�'
�1������������� &������4 ���� -�)
���� %))�)E
���G�/��"������������������������������������������������������������������������������������������� ���������6��9�����
��� ��+��$�,�� &�,�� -�,�� $.�,��
��������" ���* $7�-0 &�$0 /�/0 %�70�����������. %(�) &�- -�% *�,
Combined Funds
/���������������������������#��������������������������9������������������������������������������������!������;%�����������������������������������������1������������������9�"����'����������������"������!����������������9������������$������!�����������������������������������
Comparison to Market Returns������������9����3�������������������������������������������������$����������!�������!��"������������������������������������������������������������9������6��������������������������$�!�����������������.�������!����9�"����(��������������9�����.���������������������.����)�-�������"����������������������������#��������#������������������������"��������9�����.���������������������.�������������������������)�%��������"����#��������)�'��������"�����������������������������������������������������"���������������������������������������������"�����������������������.������������������$����������������
0.0
2.0
4.0
6.0
8.0
10.0
12.0
14.0
16.0
18.0
1 Yr. 3 Yr. 5 Yr. 10 Yr.
Per
cent
CombinedFunds*
CompositeIndex
Figu re 6 . Comb ined Fun ds Pe r f o rmanc e v s . Comp os ite Inde x
9
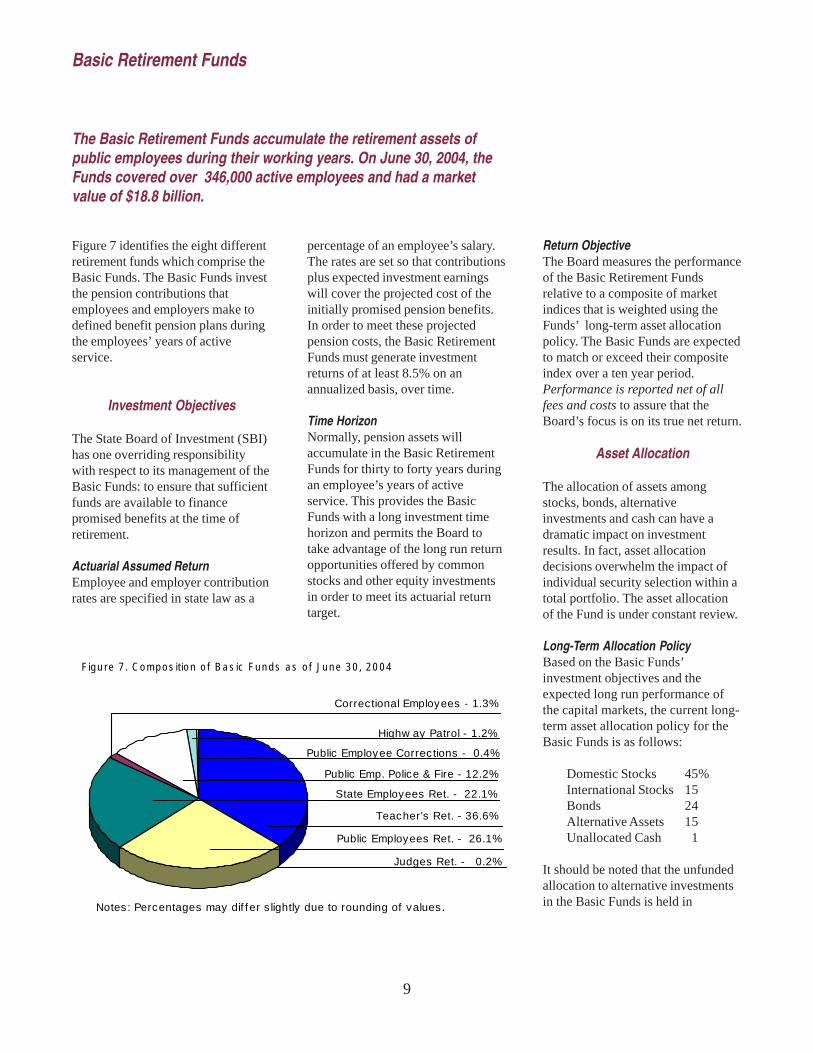
Figure 7 identifies the eight differentretirement funds which comprise theBasic Funds. The Basic Funds investthe pension contributions thatemployees and employers make todefined benefit pension plans duringthe employees’ years of activeservice.
Investment Objectives
The State Board of Investment (SBI)has one overriding responsibilitywith respect to its management of theBasic Funds: to ensure that sufficientfunds are available to financepromised benefits at the time ofretirement.
Actuarial Assumed ReturnEmployee and employer contributionrates are specified in state law as a
The Basic Retirement Funds accumulate the retirement assets ofpublic employees during their working years. On June 30, 2004, theFunds covered over 346,000 active employees and had a marketvalue of $18.8 billion.
percentage of an employee’s salary.The rates are set so that contributionsplus expected investment earningswill cover the projected cost of theinitially promised pension benefits.In order to meet these projectedpension costs, the Basic RetirementFunds must generate investmentreturns of at least 8.5% on anannualized basis, over time.
Time HorizonNormally, pension assets willaccumulate in the Basic RetirementFunds for thirty to forty years duringan employee’s years of activeservice. This provides the BasicFunds with a long investment timehorizon and permits the Board totake advantage of the long run returnopportunities offered by commonstocks and other equity investmentsin order to meet its actuarial returntarget.
Return ObjectiveThe Board measures the performanceof the Basic Retirement Fundsrelative to a composite of marketindices that is weighted using theFunds’ long-term asset allocationpolicy. The Basic Funds are expectedto match or exceed their compositeindex over a ten year period.Performance is reported net of allfees and costs to assure that theBoard’s focus is on its true net return.
Asset Allocation
The allocation of assets amongstocks, bonds, alternativeinvestments and cash can have adramatic impact on investmentresults. In fact, asset allocationdecisions overwhelm the impact ofindividual security selection within atotal portfolio. The asset allocationof the Fund is under constant review.
Long-Term Allocation PolicyBased on the Basic Funds’investment objectives and theexpected long run performance ofthe capital markets, the current long-term asset allocation policy for theBasic Funds is as follows:
Domestic Stocks 45%International Stocks 15Bonds 24Alternative Assets 15Unallocated Cash 1
It should be noted that the unfundedallocation to alternative investmentsin the Basic Funds is held in
Basic Retirement Funds
F ig u r e 7 . C o m p o s it io n o f B a s ic Fu n d s a s o f Ju n e 3 0 , 2 0 0 4
Correctional Employees - 1.3%
Highw ay Patrol - 1.2%
Teacher's Ret. - 36.6%
Public Emp. Police & Fire - 12.2%
State Employees Ret. - 22.1%
Public Employees Ret. - 26.1%
Judges Ret. - 0.2%
Public Employee Corrections - 0.4%
Notes: Percentages may dif f er s lightly due to rounding of values.
10
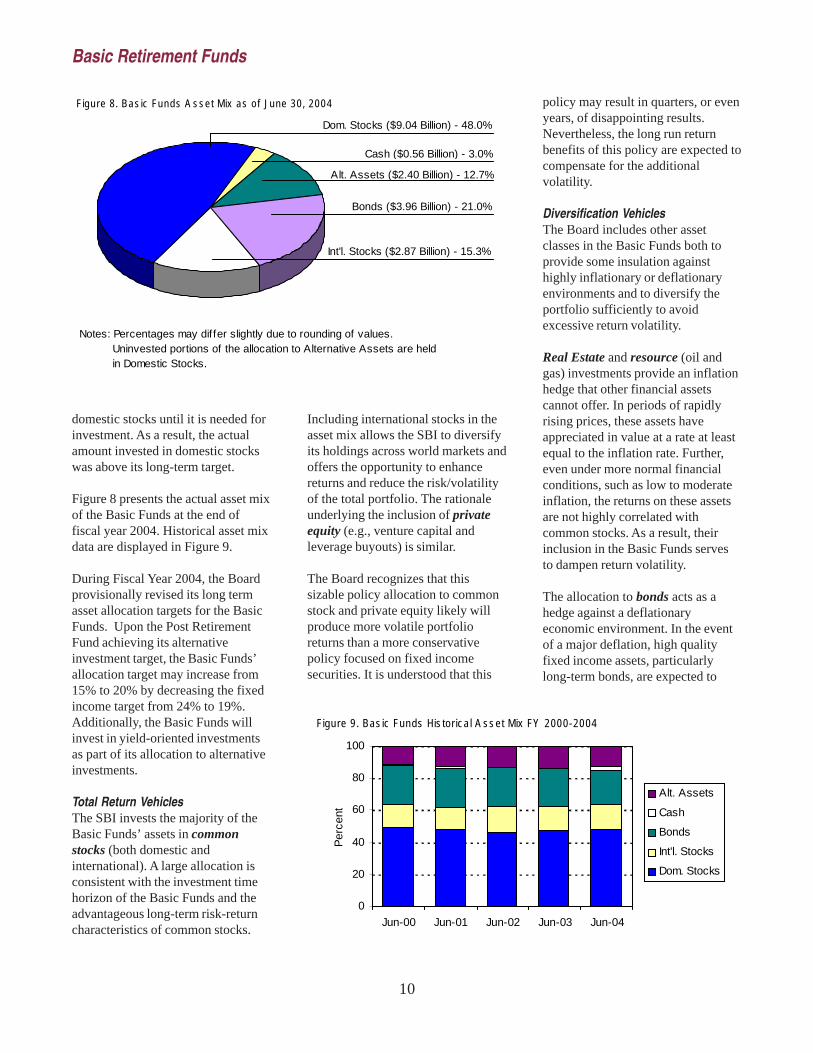
domestic stocks until it is needed forinvestment. As a result, the actualamount invested in domestic stockswas above its long-term target.
Figure 8 presents the actual asset mixof the Basic Funds at the end offiscal year 2004. Historical asset mixdata are displayed in Figure 9.
During Fiscal Year 2004, the Boardprovisionally revised its long termasset allocation targets for the BasicFunds. Upon the Post RetirementFund achieving its alternativeinvestment target, the Basic Funds’allocation target may increase from15% to 20% by decreasing the fixedincome target from 24% to 19%.Additionally, the Basic Funds willinvest in yield-oriented investmentsas part of its allocation to alternativeinvestments.
Total Return VehiclesThe SBI invests the majority of theBasic Funds’ assets in commonstocks (both domestic andinternational). A large allocation isconsistent with the investment timehorizon of the Basic Funds and theadvantageous long-term risk-returncharacteristics of common stocks.
Including international stocks in theasset mix allows the SBI to diversifyits holdings across world markets andoffers the opportunity to enhancereturns and reduce the risk/volatilityof the total portfolio. The rationaleunderlying the inclusion of privateequity (e.g., venture capital andleverage buyouts) is similar.
The Board recognizes that thissizable policy allocation to commonstock and private equity likely willproduce more volatile portfolioreturns than a more conservativepolicy focused on fixed incomesecurities. It is understood that this
policy may result in quarters, or evenyears, of disappointing results.Nevertheless, the long run returnbenefits of this policy are expected tocompensate for the additionalvolatility.
Diversification VehiclesThe Board includes other assetclasses in the Basic Funds both toprovide some insulation againsthighly inflationary or deflationaryenvironments and to diversify theportfolio sufficiently to avoidexcessive return volatility.
Real Estate and resource (oil andgas) investments provide an inflationhedge that other financial assetscannot offer. In periods of rapidlyrising prices, these assets haveappreciated in value at a rate at leastequal to the inflation rate. Further,even under more normal financialconditions, such as low to moderateinflation, the returns on these assetsare not highly correlated withcommon stocks. As a result, theirinclusion in the Basic Funds servesto dampen return volatility.
The allocation to bonds acts as ahedge against a deflationaryeconomic environment. In the eventof a major deflation, high qualityfixed income assets, particularlylong-term bonds, are expected to
Basic Retirement Funds
0
20
40
60
80
100
Jun-00 Jun-01 Jun-02 Jun-03 Jun-04
Per
cent
Alt. Assets
Cash
Bonds
Int'l. Stocks
Dom. Stocks
Figure 9 . Bas ic Funds His tor ic a l A s s et Mix FY 2000-2004
Figure 8. Bas ic Funds A s s et Mix as o f June 30 , 2004
Notes: Percentages may differ slightly due to rounding of values. Uninvested portions of the allocation to Alternative Assets are held in Domestic Stocks.
Dom. Stocks ($9.04 Billion) - 48.0%
Cash ($0.56 Billion) - 3.0%
Alt. Assets ($2.40 Billion) - 12.7%
Int'l. Stocks ($2.87 Billion) - 15.3%
Bonds ($3.96 Billion) - 21.0%

11
protect principal and generatesignificant capital gains. Bonds, likereal estate and resource funds, undernormal financial conditions, help todiversify the Basic Funds, therebycontrolling return volatility.
Yield oriented alternativeinvestments provide the opportunityfor higher long term returns thanthose typically available from bondsyet still generate sufficient currentincome. Typically, these investments(e.g., subordinated debt, mezzanineor resource income investments suchas producing properties) arestructured more like fixed incomesecurities with the opportunity toparticipate in the appreciation of theunderlying assets. While theseinvestments may have an equitycomponent, they display a returnpattern more like a bond. As such,they will help reduce the volatility ofthe total portfolio, but should alsogenerate higher returns relative tomore traditional bond investments.
Investment Management
All assets in the Basic RetirementFunds are managed externally byoutside money management firmsretained by contract. In order to gaingreater operating efficiency, theBasic Funds share the same domesticstock, international stock, fixedincome, and alternative investmentmanagers with the Post Fund.
More information on the structure,management and performance ofthese pools of managers is includedin the Investment Pool section ofthis report.
Investment Performance
As stated earlier, the Basic Funds areexpected to match or exceed thereturn of a composite of marketindices over a ten year period.Performance relative to this standardwill measure two effects:
Annualized2000 2001 2002 2003 2004 3 Yr. 5 Yr. 10 Yr.
Basic Funds 10.5% -7.4% -8.2% 1.9% 16.6% 3.0% 2.3% 9.8% Composite Index 10.6 -8.4 -8.1 2.4 16.3 3.0 2.1 9.6
Basic Retirement Funds
— The ability of the managersselected by the SBI, in aggregate,to add value to the returnsavailable from the broad capitalmarkets.
— The impact of the SBI’s re-balancing activity. The SBIrebalances the total fund whenmarket movements take the stock(domestic and international),bond, or cash segments above orbelow long term asset allocationtargets. This policy imposes alow risk discipline of “buy low-sell high” between asset classeson a total fund basis.
For the ten year period endingJune 30, 2004, the Basic Fundsoutperformed the composite index by0.2 percentage point annualized. TheFund exceeded the composite indexby 0.2 percentage point over the lastfive years, and by 0.3 percentagepoint over the most recent fiscal year.Actual returns relative to the totalfund composite index for each of thelast five years are shown inFigure 10.
-10
-5
0
5
10
15
20
2000 2001 2002 2003 2004 3 Yr. 5 Yr. 10 Yr.
Per
cent
Basic Funds
Composite
Figure 10 . Bas ic Funds ' Per f ormanc e v s . Compos ite Index FY 2000-2004

12
The Post Retirement Fund includesthe assets of retired public employeescovered by nine statewide retirementplans; the eight plans whichparticipate in the Basic RetirementFunds as well as the Legislative andSurvivors Retirement Fund.
Benefit Increase Formula
The retirement benefit increaseformula of the Post Retirement Fundis based on a combination of twocomponents:
— Inflation Component. Each year,retirees receive an inflation-basedadjustment equal to 100% ofinflation, up to a maximumspecified in statute. The inflationcomponent is granted regardlessof investment performance. Thecap is necessary to maintain theactuarial soundness of the entireplan. It is the difference betweenthe return assumption for theBasic Funds, and the returnassumption for the Post Fund.
The return assumption in theBasic Funds is 8.5%. The returnassumption for the Post Fund was5.0% through fiscal year 1997. Infiscal year 1998, the returnassumption for the Post Fund waschanged to 6.0%. This means thecap on the inflation adjustmentwas 3.5% for fiscal years 1993-1997. Since fiscal year 1998, theinflation cap has been 2.5%.
The assets of the Post Retirement Fund are used to finance monthlyannuities to retired public employees. These annuities may beadjusted upwards over the life of a retiree based on a formula thatreflects both inflation and investment performance. On June 30, 2004,the Post Fund had a market value of $18.4 billion and more than121,000 retiree participants.
Retirees were given a one timepermanent adjustment in theirpension to compensate them forthe reduction in the inflationadjustment cap.
— Investment Component. Eachyear, retirees can also receive aninvestment-based adjustment,provided net investment gains areabove the amount needed tofinance the Post Fund’s actuarialassumption and the inflationadjustment. Investment gains andlosses are spread over five yearsto smooth out the volatility ofreturns. In addition, allaccumulated investment losses
must be recovered before aninvestment-based adjustment isgranted.
Investment Objective
Time HorizonThe time horizon of the Post Fund is15 to 20 years and corresponds to thelength of time a typical retiree can beexpected to draw benefits. While thisis shorter than the time horizon of theBasic Funds, it is still sufficientlylong to allow the Board to takeadvantage of the long run returnopportunities offered by commonstocks in order to meet its actuarialreturn target as well as to financeretirement benefit increases.
Post Retirement Fund
Figure 11. Pos t Fund A s s et Mix as o f June 30 , 2004
Notes: Percentages may dif fer slightly due to rounding of values. Uninvested portions of the Alternative Assets allocation are held in Bonds.
Alt. Assets ($0.79 Billion) - 4.3%
Bonds ($4.53 Billion) - 24.6%
Dom. Stocks ($9.48 Billion) - 51.4%
Int'l. Stocks ($2.85 Billion) - 15.5%
Cash ($0.78 Billion) - 4.2%

13
Return ObjectiveThe Board measures the performanceof the Post Retirement Fund relativeto a composite of market indicesusing its long-term asset allocationpolicy. The Post Fund is expected tomatch or exceed its composite indexover a ten year period. Performanceis reported net of all fees and costs toassure that the Board’s focus is ontrue net return.
Asset Allocation
The current long-term assetallocation for the Post Fund is asfollows:
Domestic Stocks 45%Int’l. Stocks 15Bonds 25Alternative Assets 12Unallocated Cash 3
The Post Fund’s year-end asset mixis presented in Figure 11 on theprevious page. Historical asset mixdata are shown in Figure 12.
The SBI invests the majority of thePost Fund’s assets in common stocks(both domestic and international). Alarge allocation is consistent with themoderately long time horizon of thePost Fund and the advantageous longterm risk-return characteristics ofcommon stocks. Includinginternational stocks in the asset mixallows the SBI to diversify itsholdings across world markets andoffers the opportunity to enhancereturns and reduce the risk/volatilityof the total portfolio.
As with the Basic Funds, the Boardrecognizes that this sizable allocationwill be likely to produce morevolatile portfolio returns than a moreconservative policy focused on fixedincome securities. It is understoodthat this policy may result inquarters, or even years, ofdisappointing results. Nevertheless,the long run return benefits of thispolicy are expected to compensatefor the additional volatility. The assetallocation is under constant review.During Fiscal Year 2004, the SBIrevised its long term asset allocationtargets for the Post Fund. The
allocation target for alternativeinvestments was increased from 5%to 12%, while decreasing domesticequity from 50% to 45% anddecreasing fixed income from 27%to 25%. Additionally, the Post Fundwill invest in private equity, realestate, and resource investments aswell as yield-oriented investments aspart of its allocation to alternativeinvestments.
Diversified VehiclesThe Board includes other assetclasses in the Post Fund both toprovide some insulation againsthighly deflationary environments andto diversify the portfolio sufficientlyto avoid excessive return volatility.Including private equity in the PostFund is intended to enhance returnsand reduce the risk of the totalportfolio.
Real Estate and resource (oil andgas) investments provide an inflationhedge that other financial assetscannot offer. In periods of rapidlyrising prices, these assets haveappreciated in value at a rate at leastequal to the inflation rate. Further,even under more normal financialconditions, such as low to moderateinflation, the returns on these assetsare not highly correlated withcommon stocks. As a result, theirinclusion in the Post Fund also servesto dampen return volatility.
The bonds in the Post Fund act as ahedge against a deflationaryeconomic environment. In the eventof a major deflation, high qualityfixed income assets, particularly longterm bonds, are expected to protectprincipal and generate significantgains. And, under more normalfinancial conditions, bonds diversifythe Post Fund, thereby controllingreturn volatility on a year-to-yearbasis.
Yield oriented alternativeinvestments provide the opportunity
Post Retirement Fund
0
10
20
30
40
50
60
70
80
90
100
Jun-00 Jun-01 Jun-02 Jun-03 Jun-04
Per
cent
A lt. Assets
Cash
Bonds
Int'l. Stocks
Dom. Stocks
Fig u r e 1 2 . Po s t Fu n d His to r ic a l A s s e t M ix FY 2 0 0 0 - 2 0 0 4
14
for higher long term returns thanthose typically available from bonds,yet still generate sufficient currentincome to be compatible with theobjectives of the Post Fund.Typically, these investments(e.g., subordinated debt, mezzanineor resource income investments suchas producing properties) arestructured more like fixed incomesecurities with the opportunity toparticipate in the appreciation of theunderlying assets. While theseinvestments may have an equitycomponent, they display a returnpattern more like a bond. As such,they will help reduce the volatility ofthe total portfolio but should alsogenerate higher returns relative tomore traditional bond investments.
Investment Management
In order to gain greater operatingefficiency, the Basic and Post Fundsshare the same domestic stock, fixedincome, international stock, andalternative investment managers.More information on the structure,
management and performance ofthese pools of managers is includedin the Investment Pool section ofthis report.
Investment Performance
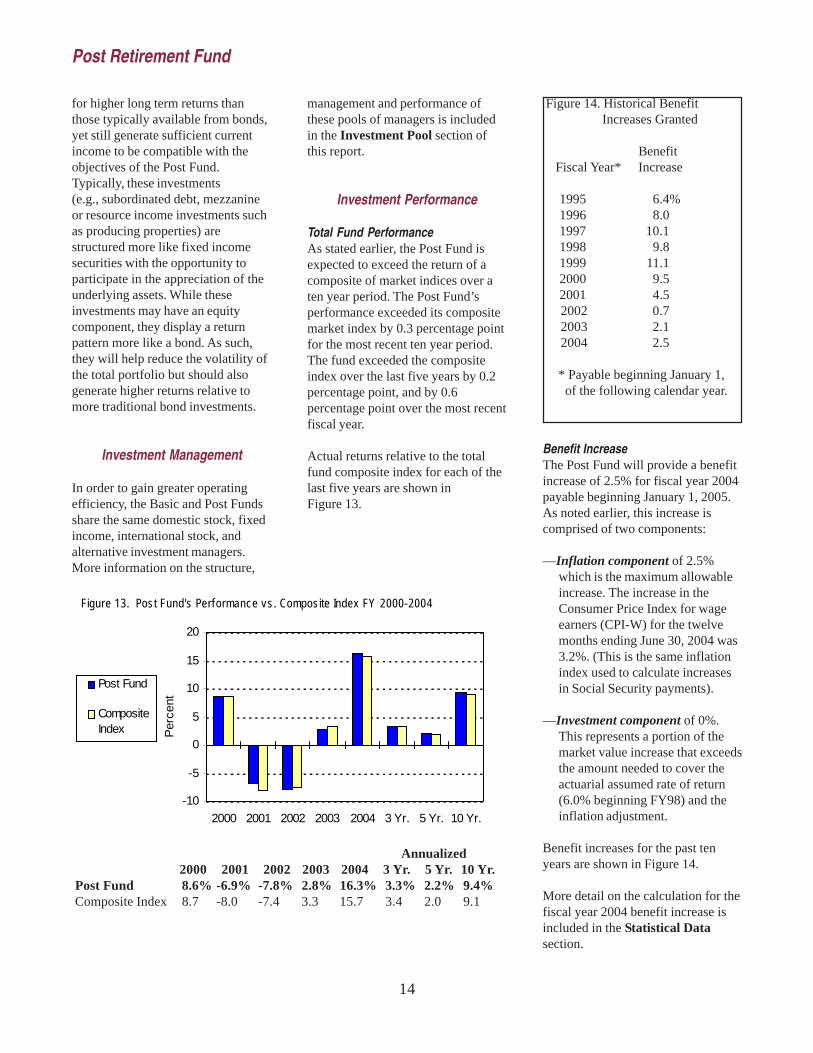
Total Fund PerformanceAs stated earlier, the Post Fund isexpected to exceed the return of acomposite of market indices over aten year period. The Post Fund’sperformance exceeded its compositemarket index by 0.3 percentage pointfor the most recent ten year period.The fund exceeded the compositeindex over the last five years by 0.2percentage point, and by 0.6percentage point over the most recentfiscal year.
Actual returns relative to the totalfund composite index for each of thelast five years are shown inFigure 13.
Benefit IncreaseThe Post Fund will provide a benefitincrease of 2.5% for fiscal year 2004payable beginning January 1, 2005.As noted earlier, this increase iscomprised of two components:
—Inflation component of 2.5%which is the maximum allowableincrease. The increase in theConsumer Price Index for wageearners (CPI-W) for the twelvemonths ending June 30, 2004 was3.2%. (This is the same inflationindex used to calculate increasesin Social Security payments).
—Investment component of 0%.This represents a portion of themarket value increase that exceedsthe amount needed to cover theactuarial assumed rate of return(6.0% beginning FY98) and theinflation adjustment.
Benefit increases for the past tenyears are shown in Figure 14.
More detail on the calculation for thefiscal year 2004 benefit increase isincluded in the Statistical Datasection.
Figure 14. Historical Benefit Increases Granted
Benefit Fiscal Year* Increase
1995 6.4% 1996 8.0 1997 10.1 1998 9.8 1999 11.1 2000 9.5 2001 4.5
2002 0.72003 2.12004 2.5
* Payable beginning January 1, of the following calendar year.
Annualized2000 2001 2002 2003 2004 3 Yr. 5 Yr. 10 Yr.
Post Fund 8.6% -6.9% -7.8% 2.8% 16.3% 3.3% 2.2% 9.4% Composite Index 8.7 -8.0 -7.4 3.3 15.7 3.4 2.0 9.1
Post Retirement Fund
-10
-5
0
5
10
15
20
2000 2001 2002 2003 2004 3 Yr. 5 Yr. 10 Yr.
Per
cent
Post Fund
CompositeIndex
Figure 13. Post Fund's Perf ormance vs. Composite Index FY 2000-2004
15
The Basic Retirement Funds, PostRetirement Fund and SupplementalInvestment Fund share many of thesame stock and bond managers. Thisis accomplished by groupingmanagers together, by asset class,into several Investment Pools. Theindividual funds participate in theInvestment Pools by purchasing“units” which function much likeshares of a mutual fund.
This investment managementstructure allows the State Board ofInvestment (SBI) to gain greateroperating efficiency within assetclasses and to keep managementcosts as low as possible for allparticipants.
DomesticStock Pool
The Basic Retirement Funds haveparticipated in the Domestic StockPool since its inception in January1984. The Post Retirement Fund hasparticipated in the Pool since July1993. In addition, the Growth ShareAccount, Common Stock IndexAccount, and the stock portion of theIncome Share Account in theSupplemental Investment Fund haveutilized a portion of the Pool.
As of June 30, 2004, the dollar valueof each fund’s participation in thePool was:
Basic Funds $9.0 billion(active, passive and semi-passive)
To gain greater operating efficiency, external managers are groupedinto several “Investment Pools” which are segregated by asset class.The various retirement funds participate in one or more of the poolscorresponding to their individual asset allocation strategies.
Post Fund $9.5 billion(active, passive and semi-passive)
Growth ShareAccount $134 million(active and semi-passive)
Common StockIndex Account $192 million(passive)
Stock portion ofthe Income ShareAccount $289 million(passive)
Management StructureThe SBI uses a three-part approachto the management of the DomesticStock Pool:
— Active Management. At the endof fiscal year 2004, approximately33% of the Domestic Stock Poolwas actively managed by a groupof external money managers. Theassets allocated to each of themanagers ranged from $30 to$900 million. The activelymanaged segment of the Poolincludes managers in the SBI’sEmerging Manager Program.Generally, firms designated asEmerging Managers by the SBIare smaller organizations ormanaging newer products than thelarger active domestic equitymanagers in the Domestic StockPool.
— Semi-Passive Management. Atthe end of fiscal year 2004,approximately 33% of theDomestic Stock Pool was
managed by a group of threesemi-passive external moneymanagers with portfolios rangingfrom $1.8 to $2.5 billion.
— Passive Management. At the endof fiscal year 2004, approximately34% of the Stock Pool wasmanaged passively by a singlemanager with a portfolio of$6.5 billion.
The goal of the Domestic Stock Poolis to add value to the asset classtarget which is the Russell 3000Index since October 1, 2003. TheRussell 3000 Index can besegmented into sub-indexes orRussell style indexes. Each activemanager is expected to addincremental value over the long runrelative to a Russell style indexwhich reflects its investmentapproach or style.
Assets are allocated to managerswithin each Russell style index in thesame proportion as the Russell 3000Index. This is done to minimize themisfit or style bias that the DomesticStock Pool may experience.
Prior to October 1, 2003, theperformance of active managers inthe Domestic Stock Pool wasmeasured against customizedbenchmarks which reflected themanager’s unique investmentapproach or style. This type ofactive manager structure could resultin misfit or style bias. “Misfit” isdefined as the difference between theaggregate benchmarks of the activemanagers and the asset class targets.
Investment Pools

16
The SBI attempted to compensate foractive manager misfit through the useof a completeness fund. A“completeness fund” is so namedbecause it is intended to fill in, orcomplete, any areas of marketexposure that are not being coveredby the aggregate benchmarks of theactive managers. The completenessfund has not been used sinceDecember 31, 2003. Since that time,the SBI has attempted to controlmisfit by allocating assets on thebasis of managers’ investment styleindexes.
The SBI’s completeness fund waspassively managed when it was firstintroduced in October 1990 untilDecember 1994. During fiscal year1995, the completeness fund movedfrom being entirely passivelymanaged to a structure that was halfpassive/half semi-passive. At the startof fiscal year 1996, the completenessfund was allocated entirely to semi-passive management. Semi-passiveapproaches provide the potential tooutperform the completeness fundbenchmark, but also incorporateprocedures that constrain the level ofrisk/volatility relative to thebenchmark.
During fiscal year 1997, severalcurrent active managers modifiedtheir investment processes in order toincrease the probability of producingvalue added in their portfolios.Three managers (Alliance CapitalMgmt., Franklin Portfolio Assoc.,and Oppenheimer Capital) wereasked to increase the level of activerisk in their portfolio resulting in areduction in the number of issuesheld at any one time. During fiscalyear 2000, Brinson (now UBSGlobal Asset Mgmt.) was asked toeliminate investments in small post-venture companies (about 7% oftheir portfolio) and to increase theactive risk in their portfolio as well.In effect, these managers now hold
more concentrated portfolios andmake larger bets on their “best”stock ideas.
A description of each domestic stockmanager’s investment approach isincluded in the InvestmentManager Summaries section.
FY 2004 ChangesDuring fiscal year 2004, there wereseveral changes made to theDomestic Stock Pool. The Boardretained nine new active managers: • Barrow, Hanley, Mewhinney &
Strauss, Inc. • Lord Abbett & Co. LLC • LSV Asset Management; • Systematic Financial Mgmt., L.P. • McKinley Capital Management • Turner Investment Partners • Goldman Sachs Asset Mgmt. • Hotchkis & Wiley Capital Mgmt. • Martingale Asset Management;
and two emerging managers: • Kenwood Capital Management/
American Express Asset Mgmt. • U.S. Bancorp Asset Management.
The Board also terminatedinvestment management relationshipswith three active managers: • FLA Asset Management, LLC • GeoCapital Corporation • Lincoln Equity Mgmt., LLC;
and three emerging managers: • Artemis Investment Mmgt. LLC • Valenzuela Capital Partners, LLC • U.S. Bancorp Asset Management.
Investment PerformanceA comprehensive monitoring systemhas been established to ensure thatthe many elements of the DomesticStock Pool conform to the SBI’sinvestment policies. Publishedperformance benchmarks are usedfor each active, emerging and semi-passive stock manager. Thesebenchmarks enable the SBI toevaluate the managers’ results, bothindividually and in aggregate, withrespect to risk incurred and returnsachieved.
Investment Pools
Annualized2000 2001 2002 2003 2004 3 Yr. 5 Yr. 10 Yr.
Stock Pool 8.2% -15.2% -18.0% 0.4% 20.3% -0.3% -1.9% 10.9% Domestic 8.6 -15.8 -17.3 0.8 20.6 0.2 -1.7 11.2 Equity Asset Class Target
* Reflects Wilshire 5000 as reported prior to FY 2000, the Wilshire 5000 Investable from 7/1/2000 thru 9/30/03; and the Russell 3000 since 10/1/2003.
-20
-15
-10
-5
0
5
10
15
20
25
2000 2001 2002 2003 2004 3 Yr. 5 Yr. 10 Yr.
Per
cent
Stock Pool
Asset ClassTarget
Figure 15 . Domes tic Stoc k Poo l Per f ormanc e FY 2000-2004

17
Two primary long run risk objectiveshave been established for thedomestic stock managers:
— Investment Approach. Eachmanager (active, emerging, semi-passive, or passive) is expected tohold a portfolio that is consistent,in terms of risk characteristics,with the manager’s statedinvestment approach. In the shortrun, the active stock managersmay depart from their risk targetsas part of their specific investmentstrategies.
— Diversification. The passive andsemi-passive managers areexpected to hold highlydiversified portfolios, while eachactive domestic stock manager isexpected to hold a less diversifiedportfolio.
The domestic stock managerssuccessfully fulfilled their long-termrisk objectives during fiscal year2004. In general, the managersconstructed portfolios consistent withtheir stated investment approachesand maintained levels ofdiversification that were appropriateto their respective active, semi-passive and passive approaches.
The Board’s return objectives for itsactive and semi-passive stockmanagers are measured against theperformance of published Russellstyle indices that represent amanager’s specific investmentapproach. This index is commonlyreferred to as a “benchmarkportfolio.” A benchmark portfoliotakes into account the equity marketforces that at times favorably orunfavorably impact certaininvestment styles. Thus, a Russellstyle index or benchmark is a moreappropriate return target againstwhich to judge a manager’sperformance than a broad marketindex.
Figure 16. Domestic Stock Manager Performance FY 2004
Actual BenchmarkReturn Return
Active Managers Large Cap Core (Russell 1000) Franklin Portfolio Associates 21.1% 20.6% New Amsterdam Partners 24.5 23.0 UBS Global Asset Management 19.2 19.6 Voyageur-Chicago Equity (Emerging) 18.3 19.5
Large Cap Growth (Russell 1000 Growth) Alliance Capital Management 11.9 17.3 Cohen Klingenstein & Marks 15.1 19.1 Holt-Smith & Yates (Emerging) 14.3 19.6 Zevenbergen Capital (Emerging) 26.7 19.0
Large Cap Value (Russell 1000 Value) Barrow, Hanley* 2.7 0.9 Bay Isle Financial (Emerging) 18.0 22.1 Earnest Partners (Emerging) 23.9 25.1 Lord Abbett & Co.* 1.7 0.9 LSV Asset Mgmt.* 2.0 0.9 Oppenheimer Capital 21.0 20.8 Systematic Financial Mgmt.* 1.2 0.9
Small Cap Growth (Russell 2000 Growth) McKinley Capital** 4.0 5.7 Next Century Growth (Emerging) 29.0 30.5 Turner Investment Partners** 4.6 5.7 Winslow-Small Cap (Emerging) 23.2 31.5
Small Cap Value (Russell 2000 Value) AEAM/Kenwood (Emerging)** 10.6 7.8 Goldman Sachs** 5.2 7.8 Hotchkis & Wiley** 11.0 7.8 Martingale Asset Mgmt.** 12.3 7.8 Peregrine Capital Mgmt. (Emerging)** 35.2 35.6
Semi-Passive Managers (Russell 1000) Barclays Global Investors 20.2 19.5 Franklin Portfolio Associates 19.1 19.5 J.P. Morgan Investment Mgmt. 19.5 19.5
Passive Manager (Russell 3000) Barclays Global Investors 20.5 20.6
Historical Aggregate 20.3 20.5
SBI Domestic Equity Asset Class Target 20.6
* Manager was retained April 1, 2004. ** Manager was retained January 1, 2004.
Investment Pools

18
Individual active managers areexpected to exceed their benchmarkby 0.50-1.00 percentage pointannualized, over time. The semi-passive managers are expected toexceed their benchmark by 0.15-0.30percentage point, over time, and thepassive manager is expected to trackits index within 0.10 percentagepoint annualized, over time.
In aggregate, the Domestic StockPool underperformed the Russell3000 Index by 0.3 percentage pointfor the fiscal year. The active andpassive component underperformedtheir respective benchmarks, whilethe semi-passive componentoutperformed. Relative to theiraggregate benchmarks, the activemanager group’s underperformancewas due to a small cash holding,negative security selection, and aslight overweight in technologystocks, which performed poorly. Thesemi-passive managers outperformeddue to good security selection. Thepassive segment tracked the indexduring the year. Figure 15 providesmore detail on the historicalperformance of the entire pool.Individual manager performancerelative to their respectivebenchmarks was disappointing.Eleven active managersoutperformed their benchmarks whilethirteen underperformed. One semi-passive manager outperformed, onematched, and one underperformedthe benchmark. The passive managertrailed its target, the Russell 3000index. Individual managerperformance for fiscal year 2004 isshown in Figure 16.
Historical information on individualmanager performance and portfoliocharacteristics is included in theStatistical Data section. Section IIof the Annual Report providesSummarized Asset Listings for eachmanager and the Pool in aggregate.
Bond Pool
The Basic Retirement Funds haveparticipated in the Bond Pool sinceits inception in July 1984. The PostRetirement Fund has participated inthe Pool since July 1993. In addition,the Bond Market Account in theSupplemental Investment Fund hasutilized portions of the Pool sinceJuly 1986.
As of June 30, 2004, the dollar valueof each fund’s participation in thePool was:
Basic Funds $4.0 billion(active and semi-passive)
Post Fund $4.5 billion(active and semi-passive)
Bond Market $93 millionAccount(active and semi-passive)
Investment ManagementThe SBI uses a two-part approach forthe management of the Bond Pool:
— Active Management. No morethan one-half of the Bond Poolwill be actively managed. At theend of fiscal year 2004,approximately 50% of the BondPool was actively managed by agroup of five external moneymanagers with portfolios of$635 million to $1.3 billion each.
— Semi-Passive Management. Atleast one-half of the assetsallocated to the Bond Pool will bemanaged by semi-passivemanagers. At the end of fiscalyear 2004, approximately 50% ofthe bond segment was invested bythree managers with portfolios ofapproximately $1.4 billion each.
The group of active bond managersis retained for its blend of investmentstyles. Each active manager has thegoal of adding incremental value tothe Lehman Aggregate Bond Indexby focusing on high quality fixedincome securities across all sectorsof the market. The managers vary,however, in the emphasis they place
Annualized2000 2001 2002 2003 2004 3 Yr. 5 Yr. 10 Yr.
Bond Pool 4.7% 11.8% 8.2% 10.7% 1.5% 6.7% 7.3% 7.7% Asset Class Target* 4.6 11.2 8.6 10.4 0.3 6.4 6.9 7.4
* Lehman Brothers Aggregate Bond Index.
Investment Pools
0
3
6
9
12
15
2000 2001 2002 2003 2004 3 Yr. 5 Yr. 10 Yr.
Per
cent
Bond Pool
AssetClassTarget
Figure 17. Bond Pool Per f ormanc e FY 2000-2004

19
on interest rate anticipation and inthe manner in which they approachissue selection and sector weightingdecisions. In keeping with theobjective of utilizing the Bond Poolas a deflation hedge, the activemanagers are restricted regarding theduration of their portfolios. Thisrequirement is designed to preventthe total pool from assuming anexcessively short-lived position andthus, severely diluting its deflationhedge capacity. In addition, theduration restriction helps to avoidextreme variability in total returns.The SBI constrains the durationrange of the active managers’portfolios to a band of plus or minustwo years around the duration of theLehman Aggregate. The active bondmanagers focus on high quality(BBB or better) rated bonds. Somemanagers have been grantedauthority to invest a limited portionof their portfolios in BB and B rateddollar denominated debt or in non-dollar denominated issues. The
managers use this additionalauthority on a tactical basis.The goal of the semi-passivemanagers is to add incremental valueto the Lehman Brothers AggregateBond Index through superior bondselection and sector allocation. Semi-passive managers’ portfolios areconstrained to plus or minus 0.2years around the duration of theLehman Aggregate. Semi-passivemanagers seek to add value byexploiting perceived mispricingsamong individual securities or bymaking alterations in the sectorweightings within the portfolio.Although the managers seek toexceed the performance of the index,the possibility exists that the semi-passive approach may slightly under-perform the target index during someperiods.
A description of each bondmanager’s investment approach isincluded in the InvestmentManager Summaries section.
Investment PerformanceThe SBI constrains the risk of theactive bond managers’ portfolios toensure that they fulfill their deflationhedge and total fund diversificationroles. As noted earlier, the managersare restricted in terms of the durationof their portfolios and the quality oftheir fixed income investments. Theactive and semi-passive bondmanagers successfully fulfilled theirlong-term risk objectives duringfiscal year 2004. The managersconstructed portfolios consistent withtheir stated investment approachesand maintained appropriate levels ofquality and duration.
The returns of each of the Board’sbond managers are compared to theLehman Aggregate. Due to the broaddiversification of each manager,customized benchmarks are notdeemed necessary for the bondmanagers at this time. Individualactive managers are expected toexceed the target by 0.25 percentagepoint annualized, over time, and eachsemi-passive manager is expected toexceed the target by 0.10 percentagepoint annualized, over time.In total, the Pool outperformed theLehman Aggregate index by 1.2percentage points for the recent fiscalyear. Relative to the benchmark, thepool benefited from several of theportfolios short duration positioning.The pool also benefited fromoverweighting corporates andsecurity selection across severalsectors.
Performance over longer periods hasbeen positive, exceeding thebenchmark by 0.3 percentage pointover the ten year period endingJune 30, 2004. In general, themanager’s decision to hold portfolioswith a modestly longer duration thanthe index, along with exposure andsecurity selection in the spreadsectors (corporate and mortgage
Figure 18. Bond Manager Performance FY 2004
Actual BenchmarkReturn Return
Active Managers American Express Asset Mgmt. 0.5% 0.3% Deutsche Asset Mgmt. 1.0 0.3 Dodge & Cox Investment Mgmt. 2.0 0.3 Morgan Stanley Investment Mgmt. 2.6 0.3 Western Asset Mgmt. 3.8 0.3
Semi-Passive Managers BlackRock Financial Mgmt. 0.5 0.3 Goldman Sachs Asset Mgmt. 1.5 0.3 Lincoln Capital Mgmt. 0.6 0.3
Aggregate Bond Pool 1.5 0.3
Asset Class Target Lehman Aggregate 0.3
Investment Pools
20
securities) accounted for the relativeperformance over the longer term.The relative performance ofindividual active managers retainedby the Board over the fiscal year wasgood; all five managers exceeded thebenchmark’s performance. Amongthe semi-passive managers, all threemanagers outperformed the indexover the fiscal year.
Figure 17 shows historicalperformance for the entire Pool.Individual manager performance forfiscal year 2004 is shown inFigure 18.
Historical information on individualmanager performance and portfoliocharacteristics is included in theStatistical Data section. Section IIof this report provides SummarizedAsset Listings for each manager andthe Pool in aggregate.
InternationalStock Pool
The SBI began its international stockprogram in October 1992. The BasicRetirement Funds have participatedin the International Stock Pool sinceits inception. The Post RetirementFund began utilizing the Pool inOctober 1993. The InternationalShare Account in the SupplementalInvestment Fund has participated inthe Pool since September 1994.
On June 30, 2004, the dollar value ofeach fund’s participation in theInternational Stock Pool was:
Basic Funds $2.9 billion(active and passive)
Post Fund $2.8 billion(active and passive)
InternationalShare Account $59 million(active and passive)
Management StructureCurrently, the SBI uses a two partapproach to the managementstructure of the International StockPool:
— Active Management. The target isto have at least one-third of theInternational Stock Pool managedactively. At the end of fiscal year2004, approximately 60% of thePool was actively managed by agroup of 9 external managers withportfolios ranging from $100 toover $500 million each. Six ofthese managers manage portfoliosin the developed markets andthree manage portfolios in theemerging markets.
— Passive Management. The targetis to have at least one-third of theInternational Stock Pool managedpassively. At the end of fiscal year2004, approximately 40% of theInternational Stock Pool was
passively managed by a singlemanager.
As discussed in the next sectionentitled FY 2004 Changes, the Boardapproved a change in themanagement structure of theInternational Stock Pool to allow theuse of semi-passive management inthe Pool, which will impact theweightings of the differentmanagement approaches in the Pool.
As of July 1, 1999, the SBI beganusing the combined marketcapitalization weights of the MorganStanley Capital International (MSCI)developed and emerging marketsindices as target weights for thedeveloped versus emerging marketswithin the International StockPortfolio. Six of the active managersinvest entirely in developed markets,and use a variety of investmentapproaches in an effort to maximizevalue added to the MSCI World ex
Annualized2000 2001 2002 2003 2004 3 Yr. 5 Yr. 10 Yr.
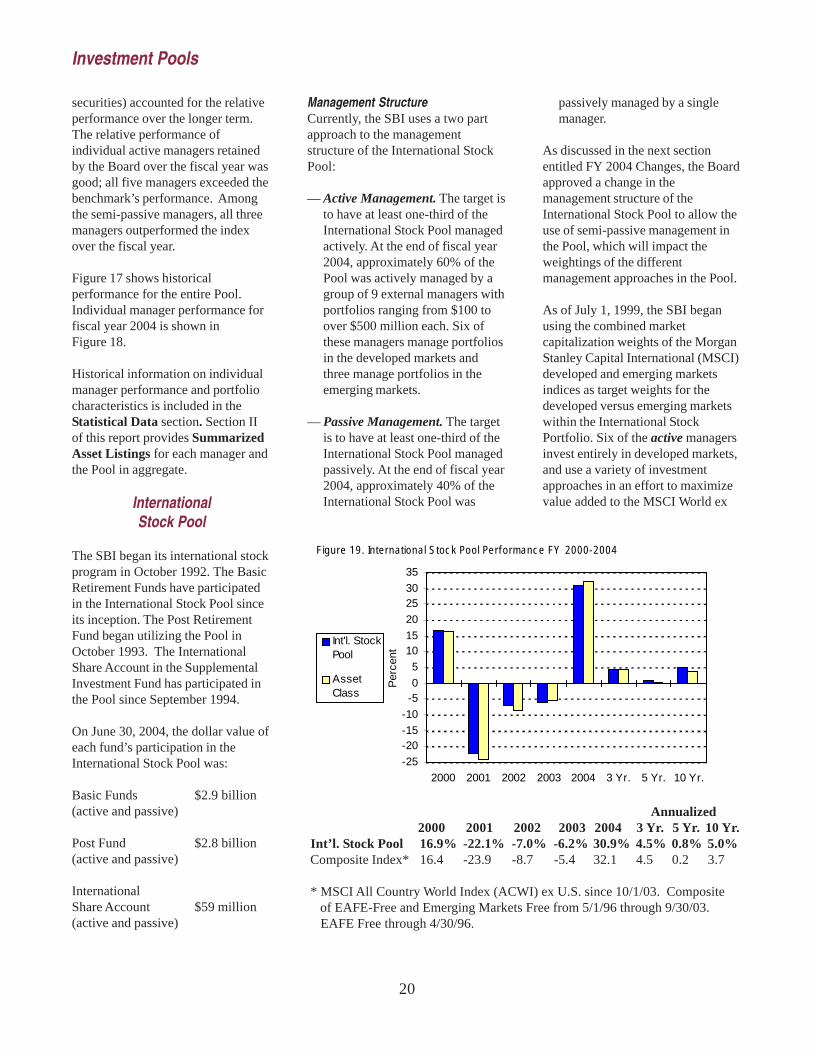
Int’l. Stock Pool 16.9% -22.1% -7.0% -6.2% 30.9% 4.5% 0.8% 5.0% Composite Index* 16.4 -23.9 -8.7 -5.4 32.1 4.5 0.2 3.7
* MSCI All Country World Index (ACWI) ex U.S. since 10/1/03. Composite of EAFE-Free and Emerging Markets Free from 5/1/96 through 9/30/03. EAFE Free through 4/30/96.
Investment Pools
-25
-20-15
-10
-50
5
1015
20
2530
35
2000 2001 2002 2003 2004 3 Yr. 5 Yr. 10 Yr.
Per
cent
Int'l. StockPool
AssetClass
Figure 19. In ternational Stoc k Pool Per f ormanc e FY 2000-2004

21
U.S. index, over time. Thesemanagers address currencymanagement as part of theirinvestment process. Their views oncurrency may be factored into theircountry and security selection, orthey may explicitly hedge currencyexposure on an opportunistic basis.
Three of the nine active managersinvest entirely in emerging markets.They are expected to add incrementalvalue, over time, relative to theMCSI Emerging Markets Free indexof markets in developing countriesthroughout the world.
The passive manager in theInternational Stock Pool designs itsportfolio to consistently andinexpensively track the MSCI Worldex U.S. index. Previously, a portionof the currency exposure of the indexfund was managed in a dynamichedging program designed to avoidcurrency losses during periods ofU.S. dollar strength. The currencyoverlay program was terminated asof December 1999. All contracts thatwere in place matured by December2000.
A description of each internationalstock manager’s investment approach
is included in the InvestmentManager Summaries section.
FY 2004 ChangesDuring the fiscal year 2004, theBoard terminated one activeemerging markets equity manager,Schroders Investment Management.
Following a review of theInternational Equity Programstructure, the Board approved achange to add Canada to thedeveloped markets benchmark and tothe asset class target. As of October 1, 2003 the developedmarkets managers’ benchmarkchanged from the MSCI EAFE Free(net) index to the MSCI World exU.S. (net) index. Marathon AssetManagement, a developed marketsmanager who previously wasmeasured against a custom index, isalso being benchmarked to the MSCIWorld ex U.S. index as of October 1,2003. As of the same date, theProgram’s asset class target changedfrom the MSCI EAFE Free + EMF(net) index to the MSCI All CountryWorld Index (ACWI) ex U.S. (net).In addition, the Board approved upto a 10% allocation to semi-passivemanagement, which has not yet beenfunded. Going forward, at least 25%of the Program will remain passivelymanaged. In aggregate, at least 33%of the program will be passively andsemi-passively managed and at least33% of the program will be activelymanaged. The program has been atleast 33% actively managed and atleast 33% passively managed.
Investment PerformanceSimilar to the Domestic Stock Pool,two long term risk objectives havebeen established for the internationalstock managers:
— Investment Approach. Eachmanager (active or passive) isexpected to hold a portfolio that isconsistent with the manager’sstated investment approach.
Figure 20. International Manager Performance FY 2004
ActualReturn Benchmark
Active Managers: Developed Markets American Express Asset Mgmt. 24.8% 32.0% Britannic Capital Mgmt. 30.3 32.0 Invesco Global Asset Mgmt. 31.2 32.0 Marathon Asset Mgmt.* 41.2 35.3 T. Rowe Price International, Inc. 21.6 32.0 UBS Global Asset Mgmt. 28.7 32.0
Active Managers: Emerging Markets Alliance Capital Mgmt. 34.0 33.1 Capital International 28.7 33.1 Morgan Stanley Investment Mgmt. 33.4 33.1
Passive EAFE Manager State Street Global Advisors 32.1 32.0
Aggregate International Pool 30.9
Asset Class Target** 32.1
* Marathon’s performance was measured against a custom benchmark through 9/30/03 and against the MSCI World ex U.S. index (net) beginning 10/1/03.
** The asset class target was comprised of the EAFE Free and Emerging Markets Free (EMF) index through 9/30/03 and the MSCI All Country World Index (ACWI) ex U.S. beginning 10/1/03. The weighting of each index fluctuates with changes in market capitalization.
Investment Pools

22
— Diversification. While the indexmanager is expected to hold awell diversified portfolio whichclosely tracks its target index,each active manager is expectedto hold a more concentratedportfolio.
The international stock managerssuccessfully fulfilled their long-termrisk objectives during fiscal year2004. In general, the managersconstructed portfolios consistent withtheir stated investment approachesand maintained appropriate levels ofdiversification.
The Board’s return objectives for theinternational stock program arestated relative to the Morgan StanleyCapital International (MSCI) indices.The indices are capitalizationweighted and measured in U.S. dollarterms, with currencies unhedged.
Individual active managers areexpected to exceed their index by atleast 1.00 percentage pointannualized, over time, and the indexmanager is expected to track itsindex by ±0.50 percentage point,annually.
Performance results for theInternational Stock Pool are shown inFigure 19, (on page 20). Inaggregate, performance over the lastfive and ten year periods exceededthe benchmark by 0.6 and 1.3percentage points annualized,respectively. The Poolunderperformed the target for theyear by 1.2 percentage points.
Individual manager performanceduring fiscal year 2004 is shown inFigure 20, (on page 21). Overall,the fiscal year proved to be a periodof strong market performance, whichwas helped by U.S. dollar weakness.The markets were influenced bysigns of structural change and
economic recovery in Japan, stronggrowth across Asian economies ledby China, and the integration ofCentral European countries into theEuropean Union. The relativeperformance of the active managerswas mixed. Five of the sixdeveloped markets managersunderperformed their respectivebenchmarks for the year. Howeverthree of the four emerging marketsmanagers outperformed the MSCIEmerging Markets Free index, whichreturned 33.1% for the year. In thedeveloped markets, the market’s biasto small cap lesser quality stocks,which perform well in periods ofeconomic recovery, hurt the activemanagers who tend to focus onlarger, well established companieswith high quality earnings. Thepassively managed portion of theprogram had positive tracking errorof 0.1% for the year relative to theMSCI World ex U.S. index.
More information on theperformance and portfoliocomposition of individual managersis included in the Statistical Datasection. Section II of this reportprovides Summarized AssetListings for each manager and thePool in aggregate.
AlternativeInvestment Pools
Like the stock and bond segments,alternative assets (private equity, realestate, resource fund and yield-oriented investments) are alsomanaged on a pooled basis. In July2003, separate pools that had beenestablished for the Basic and PostRetirement Funds were combined tocreate one alternative investmentpool.
Statutory ConstraintsThe statutory constraints regardingthe SBI’s investments to alternative
assets are the same in both the Basicand Post Funds:
Generally, each investment mustinvolve at least four other investorsand the SBI’s participation in aninvestment may not exceed 20% ofthe total investment.
Management Structure
The Basic and Post RetirementFunds have participated in theAlternative Investment Pool since itsinception in July 2003. TheAlternative Investment Pool wascreated in July 2003 from separatepools that had been previouslyestablished for the Basic and PostRetirement Funds.
Given their long investment timehorizon, the Basic and Post Fundsare especially well suited toalternative investments. As of June30, 2004, up to 15% of the marketvalue of the Basic Retirement Fundsare targeted for alternativeinvestments compared to an actualinvested percentage of 12.7%.Market value plus unfundedcommitments can be 1.5 times themarket value allocation.
For the Post Fund, as of June 30,2004, the Board has allocated up to12% of the market value of the Fundto alternative investments comparedto an actual invested percentage of4.3%. Market value plus unfundedcommitments can be 1.5 times themarket value allocation.
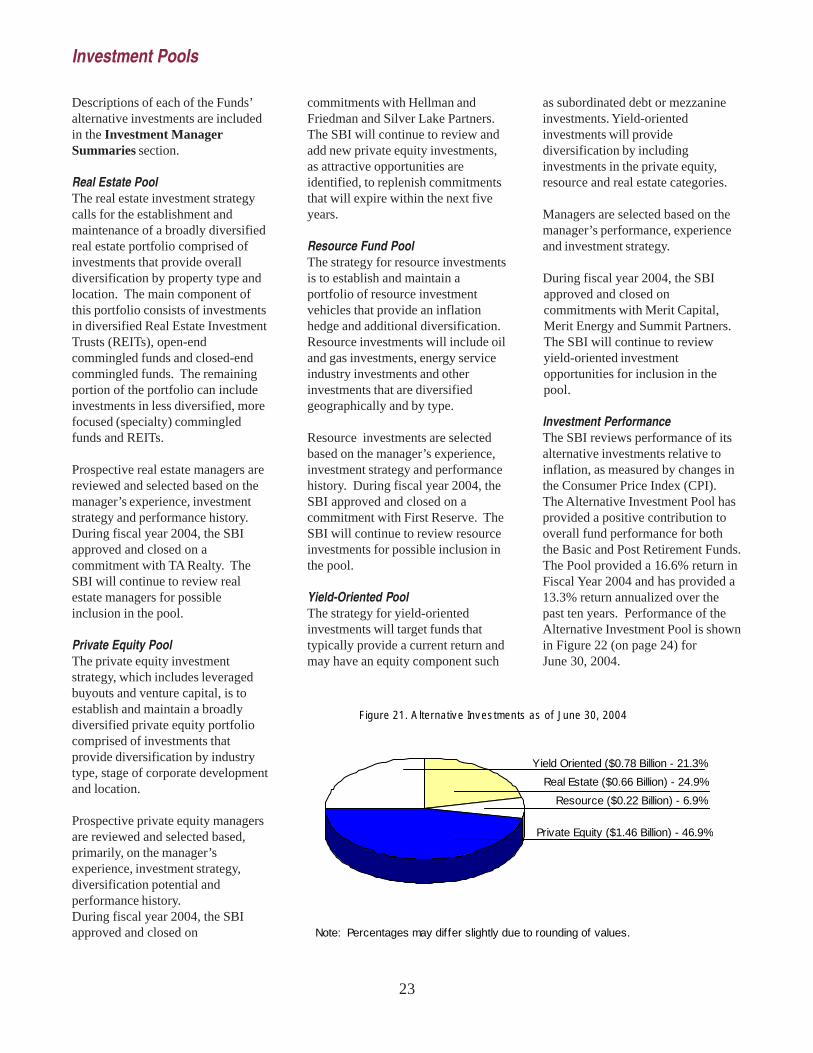
A breakdown of the combined Postand Basic Funds segment is shown inFigure 21 (on page 23). As of June30, 2004, the market value of currentalternative investments was $3.2billion, or 8.6% of the CombinedFunds.
Investment Pools
23
Descriptions of each of the Funds’alternative investments are includedin the Investment ManagerSummaries section.
Real Estate PoolThe real estate investment strategycalls for the establishment andmaintenance of a broadly diversifiedreal estate portfolio comprised ofinvestments that provide overalldiversification by property type andlocation. The main component ofthis portfolio consists of investmentsin diversified Real Estate InvestmentTrusts (REITs), open-endcommingled funds and closed-endcommingled funds. The remainingportion of the portfolio can includeinvestments in less diversified, morefocused (specialty) commingledfunds and REITs.
Prospective real estate managers arereviewed and selected based on themanager’s experience, investmentstrategy and performance history.During fiscal year 2004, the SBIapproved and closed on acommitment with TA Realty. TheSBI will continue to review realestate managers for possibleinclusion in the pool.
Private Equity PoolThe private equity investmentstrategy, which includes leveragedbuyouts and venture capital, is toestablish and maintain a broadlydiversified private equity portfoliocomprised of investments thatprovide diversification by industrytype, stage of corporate developmentand location.
Prospective private equity managersare reviewed and selected based,primarily, on the manager’sexperience, investment strategy,diversification potential andperformance history.During fiscal year 2004, the SBIapproved and closed on
commitments with Hellman andFriedman and Silver Lake Partners.The SBI will continue to review andadd new private equity investments,as attractive opportunities areidentified, to replenish commitmentsthat will expire within the next fiveyears.
Resource Fund PoolThe strategy for resource investmentsis to establish and maintain aportfolio of resource investmentvehicles that provide an inflationhedge and additional diversification.Resource investments will include oiland gas investments, energy serviceindustry investments and otherinvestments that are diversifiedgeographically and by type.
Resource investments are selectedbased on the manager’s experience,investment strategy and performancehistory. During fiscal year 2004, theSBI approved and closed on acommitment with First Reserve. TheSBI will continue to review resourceinvestments for possible inclusion inthe pool.
Yield-Oriented PoolThe strategy for yield-orientedinvestments will target funds thattypically provide a current return andmay have an equity component such
as subordinated debt or mezzanineinvestments. Yield-orientedinvestments will providediversification by includinginvestments in the private equity,resource and real estate categories.
Managers are selected based on themanager’s performance, experienceand investment strategy.
During fiscal year 2004, the SBIapproved and closed oncommitments with Merit Capital,Merit Energy and Summit Partners.The SBI will continue to reviewyield-oriented investmentopportunities for inclusion in thepool.
Investment PerformanceThe SBI reviews performance of itsalternative investments relative toinflation, as measured by changes inthe Consumer Price Index (CPI).The Alternative Investment Pool hasprovided a positive contribution tooverall fund performance for boththe Basic and Post Retirement Funds.The Pool provided a 16.6% return inFiscal Year 2004 and has provided a13.3% return annualized over thepast ten years. Performance of theAlternative Investment Pool is shownin Figure 22 (on page 24) forJune 30, 2004.
Investment Pools
Figure 21. A lternativ e Inv es tments as of June 30, 2004
Real Estate ($0.66 Billion) - 24.9%
Private Equity ($1.46 Billion) - 46.9%
Resource ($0.22 Billion) - 6.9%
Note: Percentages may differ slightly due to rounding of values.
Yield Oriented ($0.78 Billion - 21.3%

24
At this time, benchmarks have notbeen established for the alternativeinvestment fund managers. The long-term nature of these investments andthe lack of comprehensive data onthe returns provided by thealternative investment marketspreclude comprehensive performanceevaluation. In the future, as marketsfor these asset classes become moreinstitutionalized, the SBI hopes tointegrate appropriate performancestandards for these assets into itsperformance analysis.
A listing of individual investmentfunds can be found in the StatisticalData Section.
-5.0
0.0
5.0
10.0
15.0
20.0
25.0
30.0
2000 2001 2002 2003 2004 3 Yr. 5 Yr. 10 Yr.
Per
centAlternatives
Inflation
Figure 22 . A lte rna tiv e Inv es tments FY 2000-2004
Annualized2000 2001 2002 2003 2004 3 Yr. 5 Yr. 10 Yr.
Alt. Investments 26.4% 5.6% -2.0% 1.6% 16.6% 5.1% 9.2% 13.3% Inflation 3.7 3.2 1.1 2.1 3.3 2.1 2.7 2.5
Investment Pools

25
The different participating groupsuse the Supplemental InvestmentFund (SIF) for a variety of purposes:
— It functions as the sole investmentmanager for all assets of theUnclassified EmployeesRetirement Plan, PublicEmployees Defined ContributionPlan, Hennepin CountySupplemental Retirement Plan,and the Post Retirement HealthCare Savings Plan.
— It is one of the investmentvehicles offered to publicemployees as part of theIndividual Retirement AccountPlan and College SupplementalRetirement Plan offered byMinnesota State Colleges andUniversities (MnSCU).
Fund Structure
A wide diversity of investment goalsexists among the SIF’s participants.In order to meet those needs, theSupplemental Investment Fund hasbeen structured much like a “familyof mutual funds.” Participants mayallocate their investments among oneor more accounts that are appropriatefor their needs, within statutoryrequirements and rules established bythe participating organizations.Participation in the SIF isaccomplished through the purchaseor sale of shares in each account.
The Supplemental Investment Fund is a multi-purpose investmentprogram that offers a range of investment options to state and localpublic employees. The Fund serves approximately 33,000 individualswho participate in defined contribution or supplemental retirementsavings plans. On June 30, 2004, the market value of the entire Fundwas $1.0 billion.
Fund Management
The Supplemental Investment Fundoffers seven different investmentoptions (See Figure 23). Theobjectives, asset allocation,management and performance ofeach account in the Fund areexplained in the following sections.
Share ValuesEach account in the SIF establishes ashare value and participants may buyor sell shares monthly, based on themost recent share value.
In the Income Share Account, theGrowth Share Account, the CommonStock Index Account, theInternational Share Account and the
Bond Market Account, shares arepriced monthly based on the marketvalue of each account. Individualsmeasure the performance of theseaccounts by changes in share values,which in turn are a function of theincome and capital appreciation (ordepreciation) generated by thesecurities in the accounts.
In the Money Market Account andthe Fixed Interest Account, sharevalues remain constant and theaccrued interest income is credited tothe accounts through the purchase ofadditional shares. Interest income isdistributed to participants of theFixed Interest and Money MarketAccounts.
Income Share a balanced portfolio of U.S. common stocks, fixedincome, and cash.
Growth Share an actively managed portfolio of U.S. common stocks.
Common Stock Index a passively managed portfolio of U.S. common stocks.
International Share a portfolio of both actively and passively managednon-U.S. stocks.
Bond Market a portfolio of both actively and semi-passivelymanaged fixed income securities.
Money Market a portfolio of short-term, liquid debt securities.
Fixed Interest a portfolio of stable value instruments such asinsurance company investment contracts, bankinvestment contracts, and security backed contracts.
Supplemental Investment Fund
Figure 23. Accounts in the Supplemental Investment Fund

26
The investment returns shown in thisreport are calculated using a time-weighted rate of return formula.These returns are net of investmentmanagement fees and transactioncosts. They do not, however, reflectany administrative expensesdeducted by the retirement systems todefray their own administrativecosts.
The distribution of assets in theSupplemental Investment Fund as ofJune 30, 2004 are shown by Accountin Figure 24 and by Plan inFigure 25.
Supplemental Investment Fund
Figu re 24 . Compos ition by A c c ount as o f June 30 , 2004
Income Share - 44.9%
Fixed Interest - 5.0%
Bond Market - 9.0%
Grow th Share - 12.8%
Int'l. Share - 5.7%
Common Stock - 18.4%
Money Market - 4.2%
MnSCU - 26.5%
PERA Defined Contribution - 2.0%
Unclassif ied Retirement Plan - 24.7%
Hennepin Co. Sup. - 11.2%
Local Police and Fire - 30.8%
Figu re 25 . Par tic ipa tion by Plan as o f June 30 , 2004
Healthcare Savings Plan - 4.8%
Note: Percentages may dif fer slightly due to rounding of values.
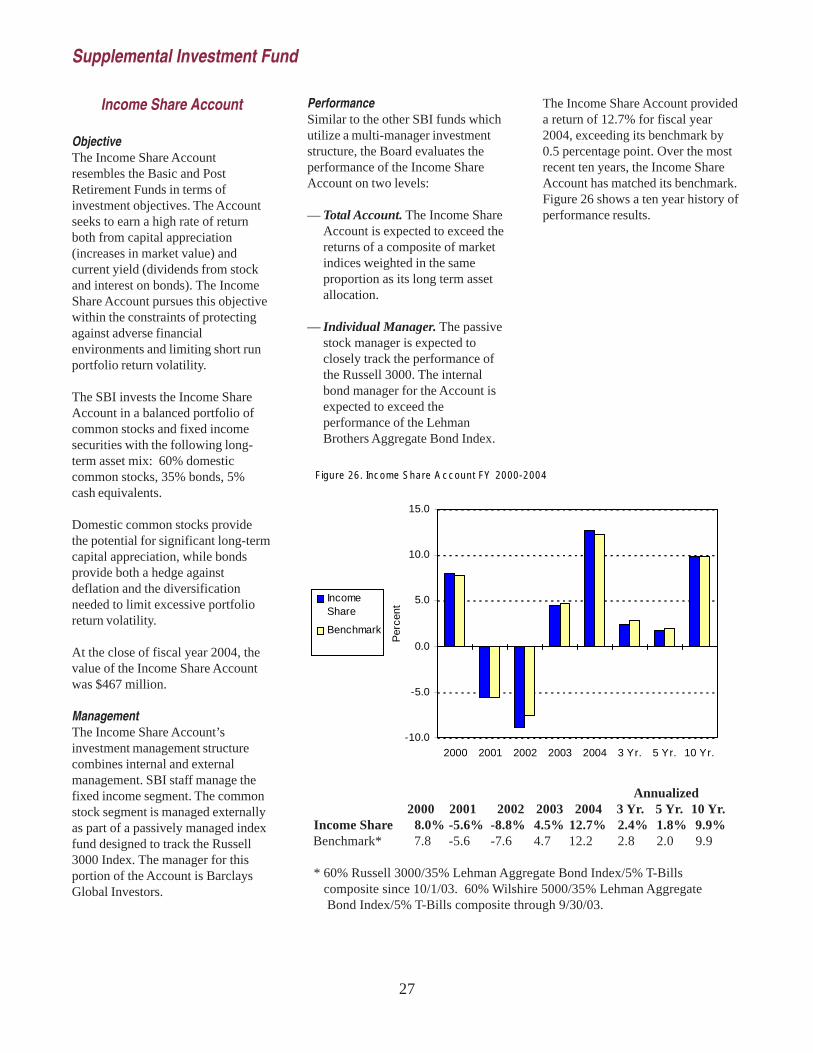
27
Income Share Account
ObjectiveThe Income Share Accountresembles the Basic and PostRetirement Funds in terms ofinvestment objectives. The Accountseeks to earn a high rate of returnboth from capital appreciation(increases in market value) andcurrent yield (dividends from stockand interest on bonds). The IncomeShare Account pursues this objectivewithin the constraints of protectingagainst adverse financialenvironments and limiting short runportfolio return volatility.
The SBI invests the Income ShareAccount in a balanced portfolio ofcommon stocks and fixed incomesecurities with the following long-term asset mix: 60% domesticcommon stocks, 35% bonds, 5%cash equivalents.
Domestic common stocks providethe potential for significant long-termcapital appreciation, while bondsprovide both a hedge againstdeflation and the diversificationneeded to limit excessive portfolioreturn volatility.
At the close of fiscal year 2004, thevalue of the Income Share Accountwas $467 million.
ManagementThe Income Share Account’sinvestment management structurecombines internal and externalmanagement. SBI staff manage thefixed income segment. The commonstock segment is managed externallyas part of a passively managed indexfund designed to track the Russell3000 Index. The manager for thisportion of the Account is BarclaysGlobal Investors.
PerformanceSimilar to the other SBI funds whichutilize a multi-manager investmentstructure, the Board evaluates theperformance of the Income ShareAccount on two levels:
— Total Account. The Income ShareAccount is expected to exceed thereturns of a composite of marketindices weighted in the sameproportion as its long term assetallocation.
— Individual Manager. The passivestock manager is expected toclosely track the performance ofthe Russell 3000. The internalbond manager for the Account isexpected to exceed theperformance of the LehmanBrothers Aggregate Bond Index.
The Income Share Account provideda return of 12.7% for fiscal year2004, exceeding its benchmark by0.5 percentage point. Over the mostrecent ten years, the Income ShareAccount has matched its benchmark.Figure 26 shows a ten year history ofperformance results.
Annualized2000 2001 2002 2003 2004 3 Yr. 5 Yr. 10 Yr.
Income Share 8.0% -5.6% -8.8% 4.5% 12.7% 2.4% 1.8% 9.9% Benchmark* 7.8 -5.6 -7.6 4.7 12.2 2.8 2.0 9.9
* 60% Russell 3000/35% Lehman Aggregate Bond Index/5% T-Bills composite since 10/1/03. 60% Wilshire 5000/35% Lehman Aggregate Bond Index/5% T-Bills composite through 9/30/03.
Supplemental Investment Fund
-10.0
-5.0
0.0
5.0
10.0
15.0
2000 2001 2002 2003 2004 3 Yr. 5 Yr. 10 Yr.
Per
cent
IncomeShare
Benchmark
Figu re 26 . Inc ome Share A c c ount FY 2000-2004

28
Growth Share Account
ObjectiveThe investment objective of theGrowth Share Account is to generatehigh returns from capitalappreciation. To achieve thisobjective, the Account is investedprimarily in U.S common stock.
At the close of fiscal year 2004, thevalue of the Growth Share Accountwas $134 million.
ManagementThe assets of the Growth ShareAccount are invested by the externalactive and semi-passive domesticequity managers. This allocationreflects a more aggressive investmentthan is available through passivemanagement. Since July 1997, theseassets have been managed by thesame active and semi-passivemanagers utilized by the Basic andPost Retirement Funds in theDomestic Stock Pool. (Prior to July1997, the Account used only activemanagers.) The Account may hold asmall amount of cash that representsnew contributions received prior totheir investment in the market andcash that may be held by theindividual managers in the Account.
PerformanceLike the Income Share Account, theBoard evaluates the performance ofthe Growth Share Account on twolevels:
— Total Account. The Growth ShareAccount is expected to exceed thereturns of the Russell 3000 Index.
— Individual Manager.Performance objectives for theindividual managers are describedin the Investment Pools sectionof this report.
The Growth Share Account provideda return of 20.2% for the fiscal year,underperforming its benchmark by0.4 percentage point. Individualmanager performance relative totheir benchmarks was mixed. See thediscussion starting on page 15concerning the Domestic Stock Pool.Over the last ten year period, theAccount has trailed its benchmark by0.4 percentage point. A ten yearhistory of performance results isshown in Figure 27.
Annualized2000 2001 2002 2003 2004 3 Yr. 5 Yr. 10 Yr.
Growth Share 7.4% -15.3% -18.3% 0.1% 20.2% -0.6% -2.2% 10.6% Benchmark* 8.6 -15.8 -17.3 0.8 20.6 0.2 -1.7 11.0
* Russell 3000 since 10/1/03. 100% Wilshire 5000 investable from July 1999 to September 2003. 100% Wilshire 5000 from November 1996 to June 1999. 95% Wilshire 5000/5% T-Bills composite through October 1996.
Supplemental Investment Fund
-20
-15
-10
-5
0
5
10
15
20
25
2000 2001 2002 2003 2004 3 Yr. 5 Yr. 10 Yr.
Per
cent
Grow thShare
Benchmark
Figure 27. Grow th Share A c c ount FY 2000-2004
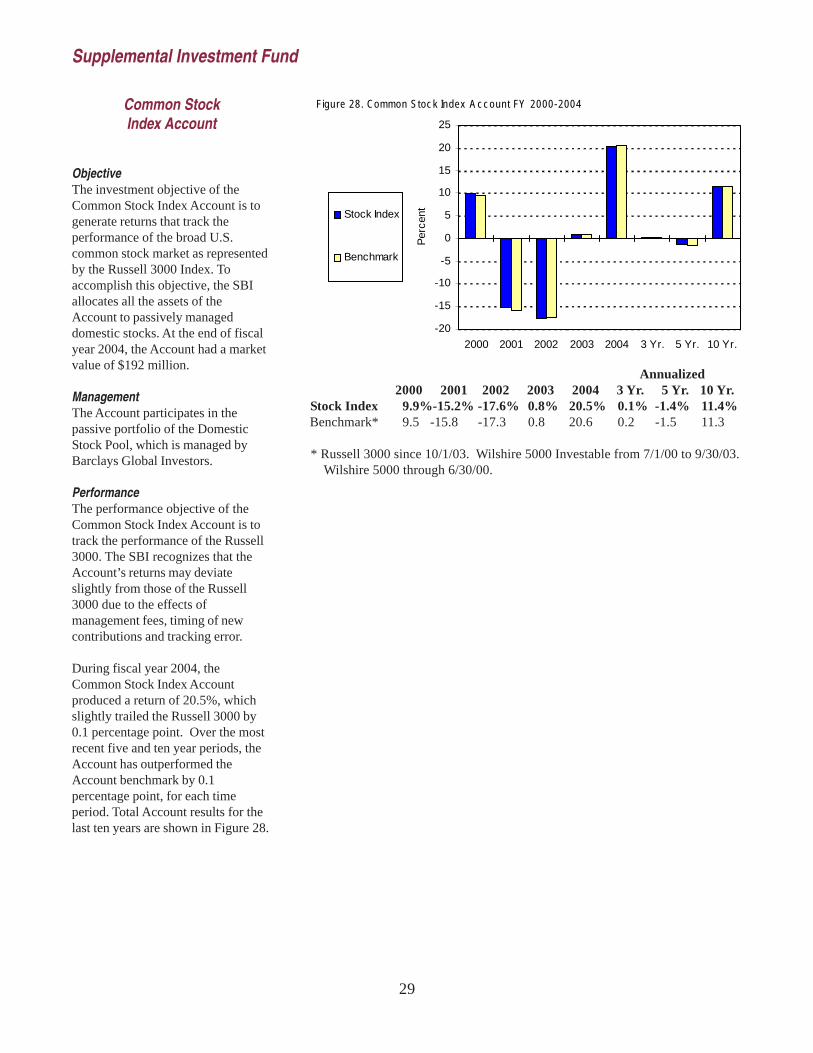
29
Common StockIndex Account
ObjectiveThe investment objective of theCommon Stock Index Account is togenerate returns that track theperformance of the broad U.S.common stock market as representedby the Russell 3000 Index. Toaccomplish this objective, the SBIallocates all the assets of theAccount to passively manageddomestic stocks. At the end of fiscalyear 2004, the Account had a marketvalue of $192 million.
ManagementThe Account participates in thepassive portfolio of the DomesticStock Pool, which is managed byBarclays Global Investors.
PerformanceThe performance objective of theCommon Stock Index Account is totrack the performance of the Russell3000. The SBI recognizes that theAccount’s returns may deviateslightly from those of the Russell3000 due to the effects ofmanagement fees, timing of newcontributions and tracking error.
During fiscal year 2004, theCommon Stock Index Accountproduced a return of 20.5%, whichslightly trailed the Russell 3000 by0.1 percentage point. Over the mostrecent five and ten year periods, theAccount has outperformed theAccount benchmark by 0.1percentage point, for each timeperiod. Total Account results for thelast ten years are shown in Figure 28.
Annualized2000 2001 2002 2003 2004 3 Yr. 5 Yr. 10 Yr.
Stock Index 9.9%-15.2% -17.6% 0.8% 20.5% 0.1% -1.4% 11.4% Benchmark* 9.5 -15.8 -17.3 0.8 20.6 0.2 -1.5 11.3
* Russell 3000 since 10/1/03. Wilshire 5000 Investable from 7/1/00 to 9/30/03. Wilshire 5000 through 6/30/00.
Supplemental Investment Fund
-20
-15
-10
-5
0
5
10
15
20
25
2000 2001 2002 2003 2004 3 Yr. 5 Yr. 10 Yr.
Per
centStock Index
Benchmark
Figure 28 . Common Stoc k Index A c c ount FY 2000-2004
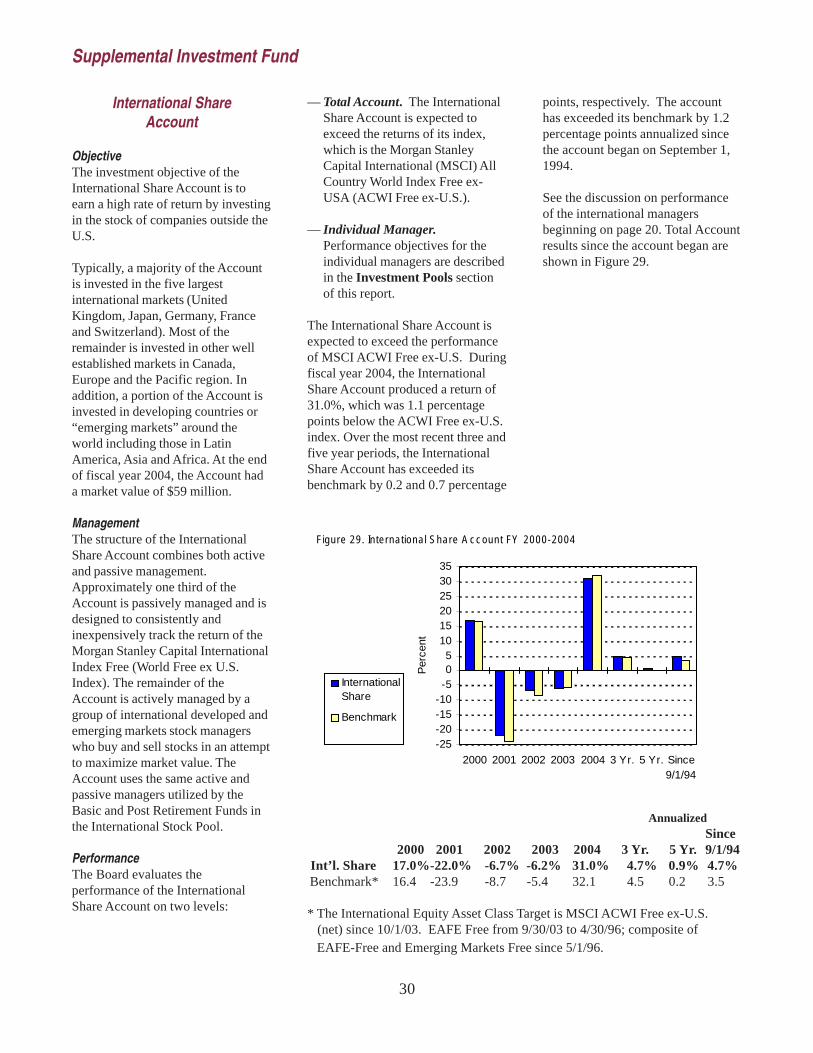
30
International ShareAccount
ObjectiveThe investment objective of theInternational Share Account is toearn a high rate of return by investingin the stock of companies outside theU.S.
Typically, a majority of the Accountis invested in the five largestinternational markets (UnitedKingdom, Japan, Germany, Franceand Switzerland). Most of theremainder is invested in other wellestablished markets in Canada,Europe and the Pacific region. Inaddition, a portion of the Account isinvested in developing countries or“emerging markets” around theworld including those in LatinAmerica, Asia and Africa. At the endof fiscal year 2004, the Account hada market value of $59 million.
ManagementThe structure of the InternationalShare Account combines both activeand passive management.Approximately one third of theAccount is passively managed and isdesigned to consistently andinexpensively track the return of theMorgan Stanley Capital InternationalIndex Free (World Free ex U.S.Index). The remainder of theAccount is actively managed by agroup of international developed andemerging markets stock managerswho buy and sell stocks in an attemptto maximize market value. TheAccount uses the same active andpassive managers utilized by theBasic and Post Retirement Funds inthe International Stock Pool.
PerformanceThe Board evaluates theperformance of the InternationalShare Account on two levels:
— Total Account. The InternationalShare Account is expected toexceed the returns of its index,which is the Morgan StanleyCapital International (MSCI) AllCountry World Index Free ex-USA (ACWI Free ex-U.S.).
— Individual Manager.Performance objectives for theindividual managers are describedin the Investment Pools sectionof this report.
The International Share Account isexpected to exceed the performanceof MSCI ACWI Free ex-U.S. Duringfiscal year 2004, the InternationalShare Account produced a return of31.0%, which was 1.1 percentagepoints below the ACWI Free ex-U.S.index. Over the most recent three andfive year periods, the InternationalShare Account has exceeded itsbenchmark by 0.2 and 0.7 percentage
points, respectively. The accounthas exceeded its benchmark by 1.2percentage points annualized sincethe account began on September 1,1994.
See the discussion on performanceof the international managersbeginning on page 20. Total Accountresults since the account began areshown in Figure 29.
AnnualizedSince
2000 2001 2002 2003 2004 3 Yr. 5 Yr. 9/1/94 Int’l. Share 17.0%-22.0% -6.7% -6.2% 31.0% 4.7% 0.9% 4.7% Benchmark* 16.4 -23.9 -8.7 -5.4 32.1 4.5 0.2 3.5
* The International Equity Asset Class Target is MSCI ACWI Free ex-U.S. (net) since 10/1/03. EAFE Free from 9/30/03 to 4/30/96; composite of EAFE-Free and Emerging Markets Free since 5/1/96.
Supplemental Investment Fund
-25-20-15-10-505
101520253035
2000 2001 2002 2003 2004 3 Yr. 5 Yr. Since9/1/94
Per
cent
InternationalShare
Benchmark
Figure 29 . In te rna tiona l Share A c c ount FY 2000-2004

31
Bond MarketAccount
ObjectiveThe objective of the Bond MarketAccount is to earn above marketreturns from fixed income securities.The Account is invested primarily ininvestment-grade government bonds,corporate bonds and mortgagesecurities with intermediate to longmaturities. As such, it is a moreconservative investment alternativethan the accounts described in theprevious sections. At the end of fiscalyear 2004, the market value of theAccount was $93 million.
The Account earns investmentreturns through interest income andcapital appreciation. Because bondprices move inversely with interestrates, the Account entails some riskfor investors. However, historically,it represents a lower risk alternativethan the investment options thatinclude common stocks.
ManagementThe Bond Market Account invests inthe Bond Pool utilized by the Basicand Post Funds. Since July 1997,the structure of the accounts hasincluded active and semi-passivemanagers. (Prior to July 1997, theBond Market Account used onlyactive managers).
PerformanceThe Board evaluates the performanceof the Bond Market Account on twolevels:
— Total Account. The Account isexpected to exceed the returns ofthe Lehman Aggregate.
— Individual Manager.Performance objectives for theindividual managers are describedin the Investment Pools sectionof this report.
The Bond Market Account isexpected to exceed the performanceof the bond market, as represented bythe Lehman Brothers AggregateBond Index. For fiscal year 2004, theAccount outperformed by 1.2percentage point. For the most recentfive and ten year periods, theAccount has outperformed by 0.5and 0.4 percentage point annualized,respectively. See the discussionregarding bond manager performanceon page 18. Total Account results forthe last ten years are shown inFigure 30.
Annualized2000 2001 2002 2003 2004 3 Yr. 5 Yr. 10 Yr.
Bond Market 4.7% 11.9% 8.3% 10.7% 1.5% 6.8% 7.4% 7.8% Benchmark 4.6 11.2 8.6 10.4 0.3 6.4 6.9 7.4
Supplemental Investment Fund
0
5
10
15
2000 2001 2002 2003 2004 3 Yr. 5 Yr. 10 Yr.
Per
centBond Market
Benchmark
Figure 30. Bond Market A cc ount FY 2000-2004
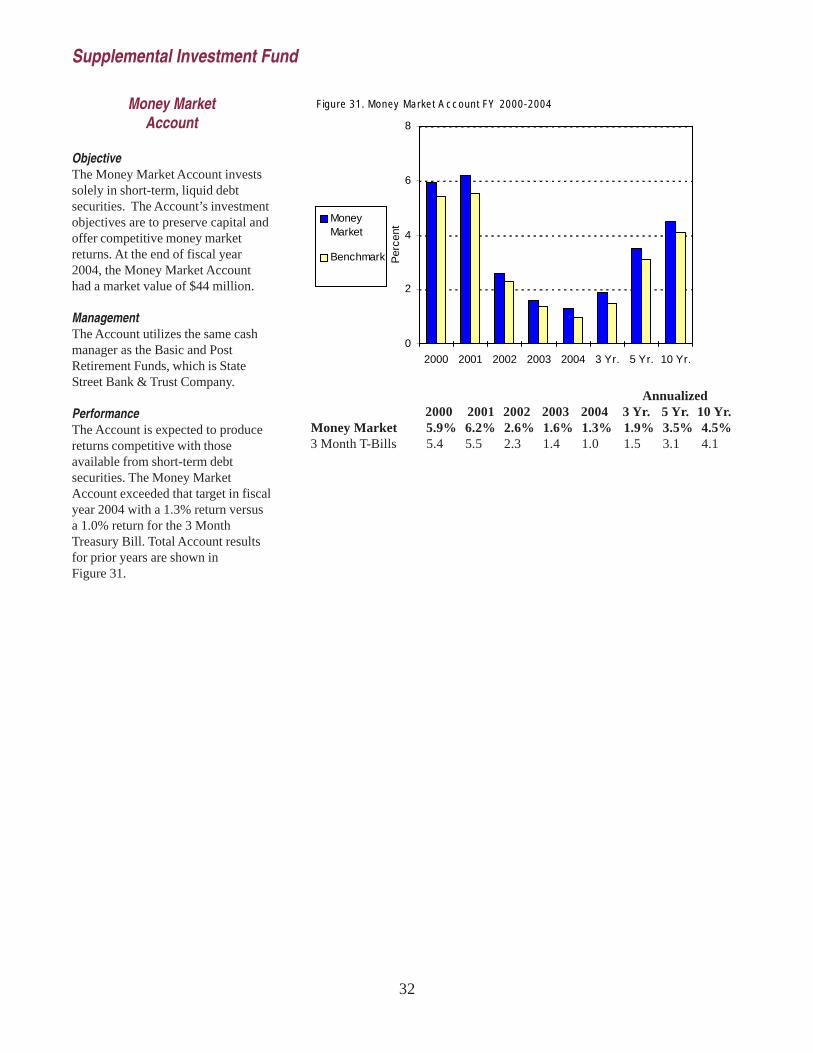
32
Money MarketAccount
ObjectiveThe Money Market Account investssolely in short-term, liquid debtsecurities. The Account’s investmentobjectives are to preserve capital andoffer competitive money marketreturns. At the end of fiscal year2004, the Money Market Accounthad a market value of $44 million.
ManagementThe Account utilizes the same cashmanager as the Basic and PostRetirement Funds, which is StateStreet Bank & Trust Company.
PerformanceThe Account is expected to producereturns competitive with thoseavailable from short-term debtsecurities. The Money MarketAccount exceeded that target in fiscalyear 2004 with a 1.3% return versusa 1.0% return for the 3 MonthTreasury Bill. Total Account resultsfor prior years are shown inFigure 31.
Annualized2000 2001 2002 2003 2004 3 Yr. 5 Yr. 10 Yr.
Money Market 5.9% 6.2% 2.6% 1.6% 1.3% 1.9% 3.5% 4.5% 3 Month T-Bills 5.4 5.5 2.3 1.4 1.0 1.5 3.1 4.1
Supplemental Investment Fund
0
2
4
6
8
2000 2001 2002 2003 2004 3 Yr. 5 Yr. 10 Yr.
Per
cent
MoneyMarket
Benchmark
Figure 31 . Money Marke t A c c ount FY 2000-2004

33
Fixed InterestAccount
ObjectiveThe investment objectives of theFixed Interest Account are to protectinvestors from loss of their originalinvestment and to providecompetitive interest rates usingsomewhat longer term investmentsthan typically found in a moneymarket account. At the end of fiscalyear 2004, the Account totaled$52 million.
ManagementThe assets in the Account areinvested primarily in stable valueinstruments such as insurancecompany investment contracts, bankinvestment contracts, and securitybacked contracts with varyingmaturities, typically 3 to 5 years. Theassets also may be invested incomparable investments offered bynon-U.S. financial institutions. Theinterest rate credited changesmonthly and reflects the blendedinterest rate available from allinvestments in the pool along withany cash held for liquidity purposes.
The manager for the Account isGalliard Capital Management, a unitof Wells Fargo Bank. Galliard hasmanaged the Account sinceNovember 1994.
Performance results for the FixedInterest Account are shown inFigure 32.
PerformanceThe Fixed Interest Account isexpected to exceed the returns of itscustom benchmark, the 3-yearConstant Maturity Treasury plus 45basis points. During fiscal year 2004,the Fixed Interest Account provideda return of 4.4%, which was 1.5percentage points above its
benchmark. Over the most recentthree and five year periods, the FixedInterest Account has exceeded itsbenchmark by 1.2 and 1.5 percentagepoints, respectively for each period.The Account has exceeded itsbenchmark by 1.0 percentage pointsannually since the account began onNovember 1, 1994.
AnnualizedSince
2000 2001 2002 2003 2004 3 Yr. 5 Yr. 11/1/94 Fixed Interest 6.2% 6.3% 6.2% 5.2% 4.4% 5.3% 5.7% 6.1% Benchmark* 6.5 5.4 3.9 2.5 2.9 3.1 4.2 5.1
* 3 Year Constant Maturity Treasury plus 45 basis points.
Supplemental Investment Fund
0
2
4
6
8
2000 2001 2002 2003 2004 3 Yr. 5 Yr. Since11/1/94
Per
cent
FixedInterest
Benchmark*
Figu re 32 . Fix ed In te re s t A c c oun t FY 2000 - 2004
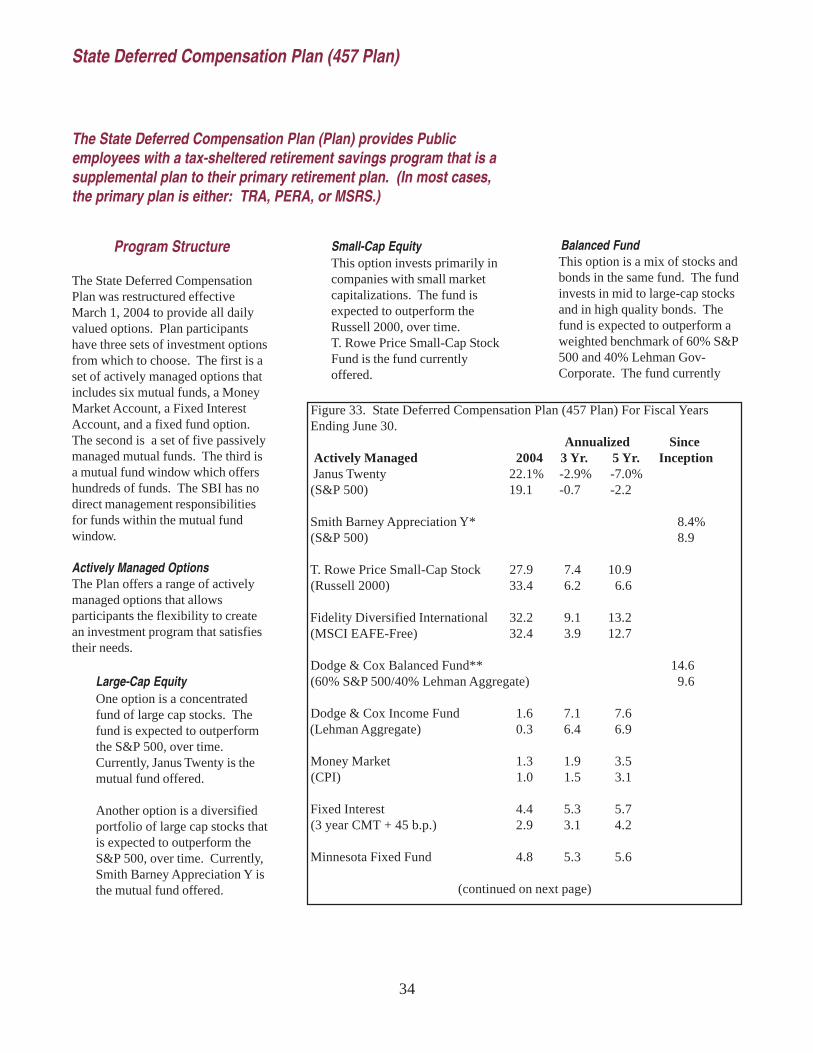
34
Program Structure
The State Deferred CompensationPlan was restructured effectiveMarch 1, 2004 to provide all dailyvalued options. Plan participantshave three sets of investment optionsfrom which to choose. The first is aset of actively managed options thatincludes six mutual funds, a MoneyMarket Account, a Fixed InterestAccount, and a fixed fund option.The second is a set of five passivelymanaged mutual funds. The third isa mutual fund window which offershundreds of funds. The SBI has nodirect management responsibilitiesfor funds within the mutual fundwindow.
Actively Managed OptionsThe Plan offers a range of activelymanaged options that allowsparticipants the flexibility to createan investment program that satisfiestheir needs.
Large-Cap EquityOne option is a concentratedfund of large cap stocks. Thefund is expected to outperformthe S&P 500, over time.Currently, Janus Twenty is themutual fund offered.
Another option is a diversifiedportfolio of large cap stocks thatis expected to outperform theS&P 500, over time. Currently,Smith Barney Appreciation Y isthe mutual fund offered.
The State Deferred Compensation Plan (Plan) provides Publicemployees with a tax-sheltered retirement savings program that is asupplemental plan to their primary retirement plan. (In most cases,the primary plan is either: TRA, PERA, or MSRS.)
Balanced FundThis option is a mix of stocks andbonds in the same fund. The fundinvests in mid to large-cap stocksand in high quality bonds. Thefund is expected to outperform aweighted benchmark of 60% S&P500 and 40% Lehman Gov-Corporate. The fund currently
Figure 33. State Deferred Compensation Plan (457 Plan) For Fiscal Years Ending June 30.
Annualized Since Actively Managed 2004 3 Yr. 5 Yr. Inception Janus Twenty 22.1% -2.9% -7.0% (S&P 500) 19.1 -0.7 -2.2
Smith Barney Appreciation Y* 8.4% (S&P 500) 8.9
T. Rowe Price Small-Cap Stock 27.9 7.4 10.9 (Russell 2000) 33.4 6.2 6.6
Fidelity Diversified International 32.2 9.1 13.2 (MSCI EAFE-Free) 32.4 3.9 12.7
Dodge & Cox Balanced Fund** 14.6 (60% S&P 500/40% Lehman Aggregate) 9.6
Dodge & Cox Income Fund 1.6 7.1 7.6 (Lehman Aggregate) 0.3 6.4 6.9
Money Market 1.3 1.9 3.5 (CPI) 1.0 1.5 3.1
Fixed Interest 4.4 5.3 5.7 (3 year CMT + 45 b.p.) 2.9 3.1 4.2
Minnesota Fixed Fund 4.8 5.3 5.6
(continued on next page)
State Deferred Compensation Plan (457 Plan)
Small-Cap EquityThis option invests primarily incompanies with small marketcapitalizations. The fund isexpected to outperform theRussell 2000, over time.T. Rowe Price Small-Cap StockFund is the fund currentlyoffered.
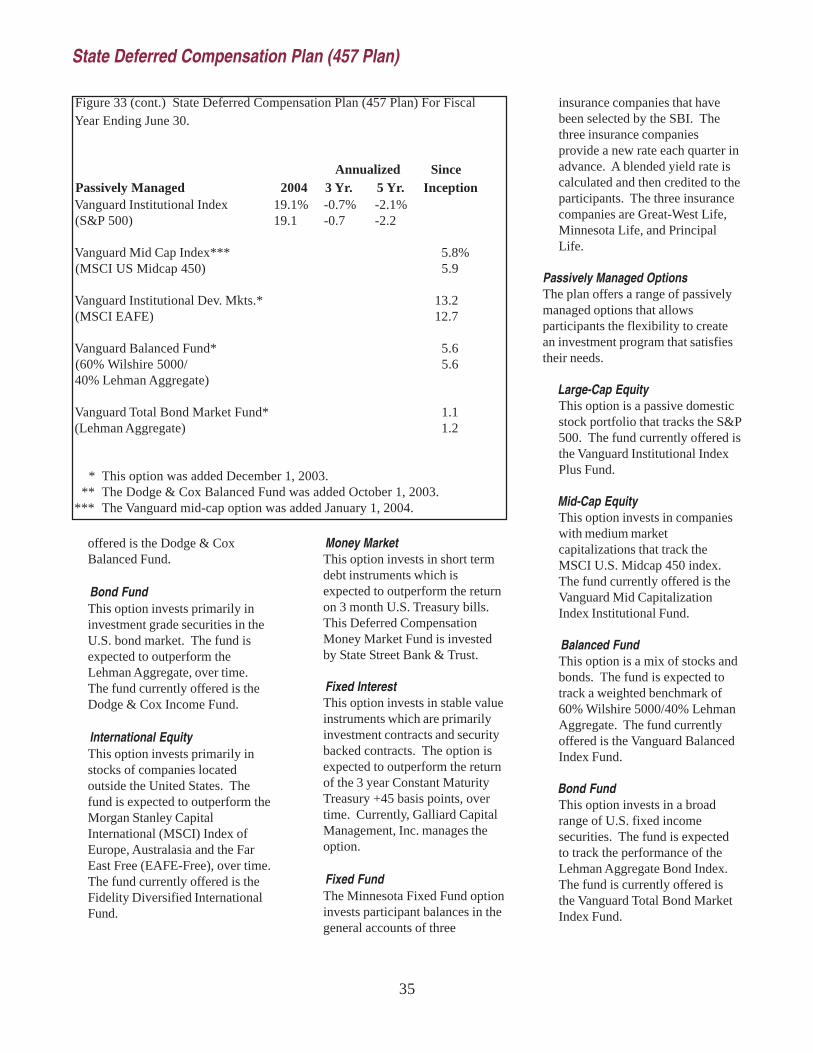
35
offered is the Dodge & CoxBalanced Fund.
Bond FundThis option invests primarily ininvestment grade securities in theU.S. bond market. The fund isexpected to outperform theLehman Aggregate, over time.The fund currently offered is theDodge & Cox Income Fund.
International EquityThis option invests primarily instocks of companies locatedoutside the United States. Thefund is expected to outperform theMorgan Stanley CapitalInternational (MSCI) Index ofEurope, Australasia and the FarEast Free (EAFE-Free), over time.The fund currently offered is theFidelity Diversified InternationalFund.
Money MarketThis option invests in short termdebt instruments which isexpected to outperform the returnon 3 month U.S. Treasury bills.This Deferred CompensationMoney Market Fund is investedby State Street Bank & Trust.
Fixed InterestThis option invests in stable valueinstruments which are primarilyinvestment contracts and securitybacked contracts. The option isexpected to outperform the returnof the 3 year Constant MaturityTreasury +45 basis points, overtime. Currently, Galliard CapitalManagement, Inc. manages theoption.
Fixed FundThe Minnesota Fixed Fund optioninvests participant balances in thegeneral accounts of three
State Deferred Compensation Plan (457 Plan)
insurance companies that havebeen selected by the SBI. Thethree insurance companiesprovide a new rate each quarter inadvance. A blended yield rate iscalculated and then credited to theparticipants. The three insurancecompanies are Great-West Life,Minnesota Life, and PrincipalLife.
Passively Managed OptionsThe plan offers a range of passivelymanaged options that allowsparticipants the flexibility to createan investment program that satisfiestheir needs.
Large-Cap EquityThis option is a passive domesticstock portfolio that tracks the S&P500. The fund currently offered isthe Vanguard Institutional IndexPlus Fund.
Mid-Cap EquityThis option invests in companieswith medium marketcapitalizations that track theMSCI U.S. Midcap 450 index.The fund currently offered is theVanguard Mid CapitalizationIndex Institutional Fund.
Balanced FundThis option is a mix of stocks andbonds. The fund is expected totrack a weighted benchmark of60% Wilshire 5000/40% LehmanAggregate. The fund currentlyoffered is the Vanguard BalancedIndex Fund.
Bond FundThis option invests in a broadrange of U.S. fixed incomesecurities. The fund is expectedto track the performance of theLehman Aggregate Bond Index.The fund is currently offered isthe Vanguard Total Bond MarketIndex Fund.
Figure 33 (cont.) State Deferred Compensation Plan (457 Plan) For Fiscal Year Ending June 30.
Annualized Since Passively Managed 2004 3 Yr. 5 Yr. Inception Vanguard Institutional Index 19.1% -0.7% -2.1% (S&P 500) 19.1 -0.7 -2.2
Vanguard Mid Cap Index*** 5.8% (MSCI US Midcap 450) 5.9
Vanguard Institutional Dev. Mkts.* 13.2 (MSCI EAFE) 12.7
Vanguard Balanced Fund* 5.6 (60% Wilshire 5000/ 5.6 40% Lehman Aggregate)
Vanguard Total Bond Market Fund* 1.1 (Lehman Aggregate) 1.2
* This option was added December 1, 2003. ** The Dodge & Cox Balanced Fund was added October 1, 2003. *** The Vanguard mid-cap option was added January 1, 2004.

36
International EquityThis option invests ininternational equities and isexpected to track the MSCI indexof Europe, Australasia and the FarEast (EAFE). The fund currentlyoffered is the VanguardInstitutional Developed MarketFund.
Performance results for the mutualfund investment options for FY 2004are shown in Figure 33 on pages 34and 35.
State Deferred Compensation Plan (457 Plan)
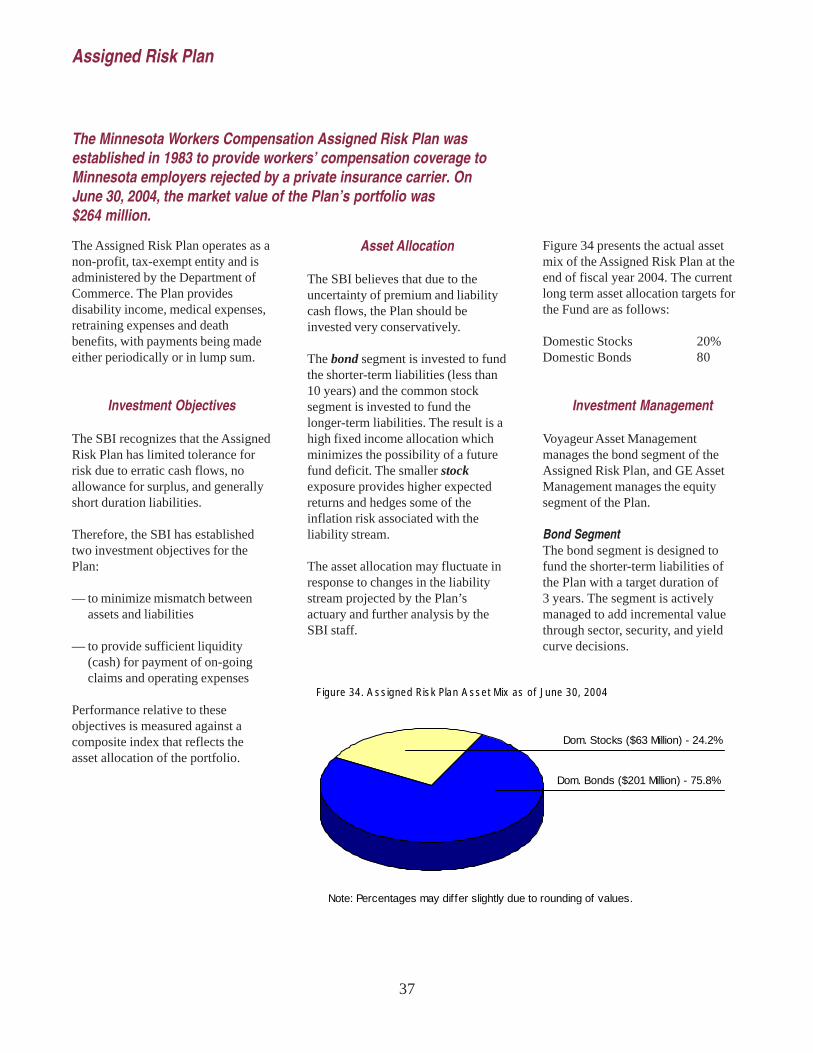
37
The Assigned Risk Plan operates as anon-profit, tax-exempt entity and isadministered by the Department ofCommerce. The Plan providesdisability income, medical expenses,retraining expenses and deathbenefits, with payments being madeeither periodically or in lump sum.
Investment Objectives
The SBI recognizes that the AssignedRisk Plan has limited tolerance forrisk due to erratic cash flows, noallowance for surplus, and generallyshort duration liabilities.
Therefore, the SBI has establishedtwo investment objectives for thePlan:
— to minimize mismatch betweenassets and liabilities
— to provide sufficient liquidity(cash) for payment of on-goingclaims and operating expenses
Performance relative to theseobjectives is measured against acomposite index that reflects theasset allocation of the portfolio.
Asset Allocation
The SBI believes that due to theuncertainty of premium and liabilitycash flows, the Plan should beinvested very conservatively.
The bond segment is invested to fundthe shorter-term liabilities (less than10 years) and the common stocksegment is invested to fund thelonger-term liabilities. The result is ahigh fixed income allocation whichminimizes the possibility of a futurefund deficit. The smaller stockexposure provides higher expectedreturns and hedges some of theinflation risk associated with theliability stream.
The asset allocation may fluctuate inresponse to changes in the liabilitystream projected by the Plan’sactuary and further analysis by theSBI staff.
Figure 34 presents the actual assetmix of the Assigned Risk Plan at theend of fiscal year 2004. The currentlong term asset allocation targets forthe Fund are as follows:
Domestic Stocks 20%Domestic Bonds 80
Investment Management
Voyageur Asset Managementmanages the bond segment of theAssigned Risk Plan, and GE AssetManagement manages the equitysegment of the Plan.
Bond SegmentThe bond segment is designed tofund the shorter-term liabilities ofthe Plan with a target duration of3 years. The segment is activelymanaged to add incremental valuethrough sector, security, and yieldcurve decisions.
Assigned Risk Plan
The Minnesota Workers Compensation Assigned Risk Plan wasestablished in 1983 to provide workers’ compensation coverage toMinnesota employers rejected by a private insurance carrier. OnJune 30, 2004, the market value of the Plan’s portfolio was$264 million.
Figure 34. A s s igned Ris k Plan A s s et Mix as of June 30, 2004
Dom. Stocks ($63 Million) - 24.2%
Dom. Bonds ($201 Million) - 75.8%
Note: Percentages may differ slightly due to rounding of values.

38
Stock SegmentThe stock segment is structured tofund the longer-term liabilities of thePlan. Currently, the equity segmentis managed with a broadlydiversified portfolio of high quality,large capitalization companies.
Investment Performance
Due to the focus on liabilitymatching, the composition of theAssigned Risk Plan’s investmentportfolio is conservativelystructured. While active managementis utilized, return enhancement playsa secondary role.
The Assigned Risk Plan is measuredagainst a composite index which isweighted to reflect the assetallocation of the Plan:
— the target for the fixed incomecomponent is a custom benchmarkwhich reflects the duration targetestablished for the bond segment(approximately 3 years).
— the target for the equitycomponent is the S&P 500.
During fiscal year 2004, the bondsegment outperformed its benchmarkby 0.3 percentage point. The stocksegment underperformed itsbenchmark by 4.5 percentage points.
Overall, the Assigned Risk Planprovided a return of 3.8% for fiscalyear 2004, matching its compositeindex. For the most recent five yearperiod, the Account matched itscomposite index. For the most
Annualized2000 2001 2002 2003 2004 3 Yr. 5 Yr. 10 Yr.
Assigned Risk 5.1% 6.2% 2.1% 7.1% 3.8% 4.3% 4.8% 8.5% Composite Index* 5.5 5.2 2.8 6.8 3.8 4.4 4.8 8.0
Stock Segment 7.0 -5.9 -14.8 -0.8 14.6 -1.1 -0.5 12.7 S&P 500 7.2 -14.8 -18.0 0.3 19.1 -0.7 2.2 11.8
Bond Segment 4.2 9.5 6.5 7.4 0.5 4.8 5.6 6.4 Benchmark 4.8 10.5 8.2 7.9 0.2 5.4 6.3 6.7
* Weighted 20% stocks, 80% bonds..
Assigned Risk Plan
recent ten year period, the Accounthas outperformed its compositeindex by 0.5 percentage point,annualized.
Historical performance results arepresented in Figure 35.
0
2
4
6
8
10
2000 2001 2002 2003 2004 3 Yr. 5 Yr. 10 Yr.
Per
centAssigned
Risk
Composite*
Figure 35. A s s igned Ris k Plan Per f o rmanc e FY 2000-2004
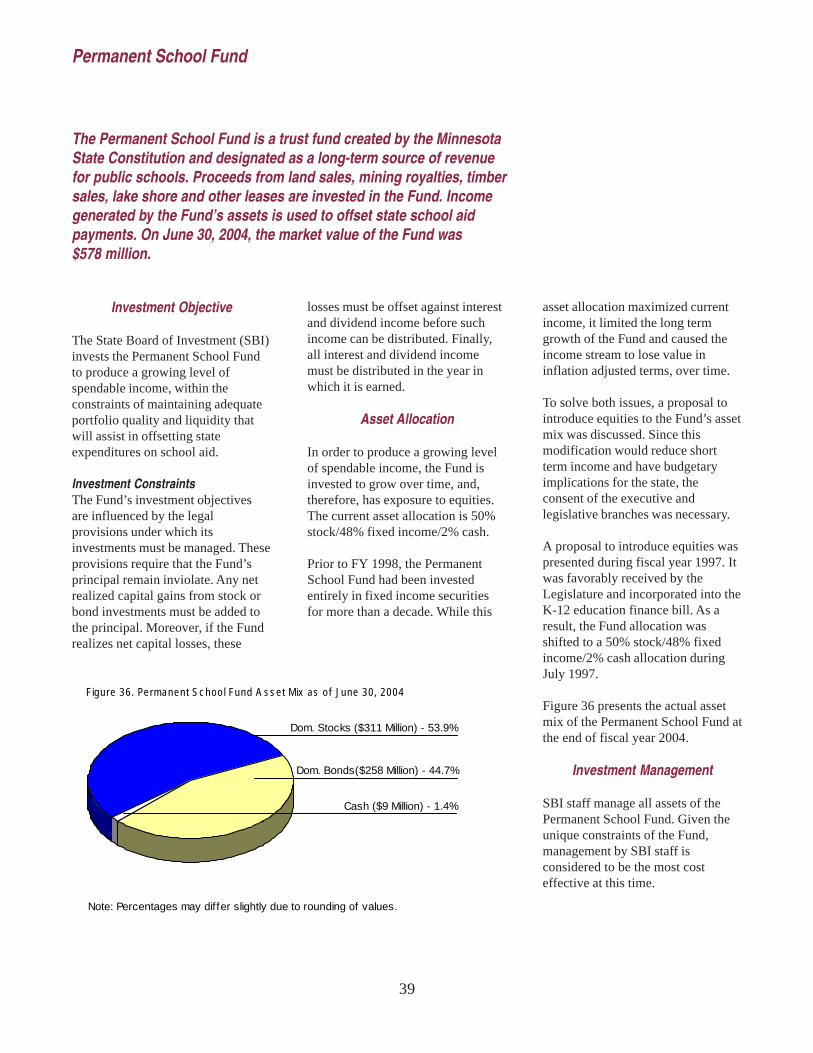
39
Investment Objective
The State Board of Investment (SBI)invests the Permanent School Fundto produce a growing level ofspendable income, within theconstraints of maintaining adequateportfolio quality and liquidity thatwill assist in offsetting stateexpenditures on school aid.
Investment ConstraintsThe Fund’s investment objectivesare influenced by the legalprovisions under which itsinvestments must be managed. Theseprovisions require that the Fund’sprincipal remain inviolate. Any netrealized capital gains from stock orbond investments must be added tothe principal. Moreover, if the Fundrealizes net capital losses, these
losses must be offset against interestand dividend income before suchincome can be distributed. Finally,all interest and dividend incomemust be distributed in the year inwhich it is earned.
Asset Allocation
In order to produce a growing levelof spendable income, the Fund isinvested to grow over time, and,therefore, has exposure to equities.The current asset allocation is 50%stock/48% fixed income/2% cash.
Prior to FY 1998, the PermanentSchool Fund had been investedentirely in fixed income securitiesfor more than a decade. While this
The Permanent School Fund is a trust fund created by the MinnesotaState Constitution and designated as a long-term source of revenuefor public schools. Proceeds from land sales, mining royalties, timbersales, lake shore and other leases are invested in the Fund. Incomegenerated by the Fund’s assets is used to offset state school aidpayments. On June 30, 2004, the market value of the Fund was$578 million.
asset allocation maximized currentincome, it limited the long termgrowth of the Fund and caused theincome stream to lose value ininflation adjusted terms, over time.
To solve both issues, a proposal tointroduce equities to the Fund’s assetmix was discussed. Since thismodification would reduce shortterm income and have budgetaryimplications for the state, theconsent of the executive andlegislative branches was necessary.
A proposal to introduce equities waspresented during fiscal year 1997. Itwas favorably received by theLegislature and incorporated into theK-12 education finance bill. As aresult, the Fund allocation wasshifted to a 50% stock/48% fixedincome/2% cash allocation duringJuly 1997.
Figure 36 presents the actual assetmix of the Permanent School Fund atthe end of fiscal year 2004.
Investment Management
SBI staff manage all assets of thePermanent School Fund. Given theunique constraints of the Fund,management by SBI staff isconsidered to be the most costeffective at this time.
Permanent School Fund
Figure 36 . Permanent Sc hoo l Fund A s s et Mix as o f June 30 , 2004
Dom. Stocks ($311 Million) - 53.9%
Dom. Bonds($258 Million) - 44.7%
Cash ($9 Million) - 1.4%
Note: Percentages may differ slightly due to rounding of values.

40
Stock SegmentThe stock segment of the Fund ispassively managed to track theperformance of the S&P 500.
Bond SegmentThe bond segment is activelymanaged to add incremental valuethrough sector, security and yieldcurve decisions and its performanceis measured against the LehmanBrothers Aggregate Bond Index.
Investment Performance
The stock segment of the PermanentSchool Fund underperformed itsbenchmark, the S&P 500, during thefiscal year by 0.1 percentage point.By investing in all of the stocks inthe benchmark at their indexweighting, the segment attempts totrack the benchmark return on amonthly and annual basis. Theportfolio is periodically rebalancedto maintain an acceptable trackingerror relative to the benchmark.
The bond segment outperformed itsbenchmark by 0.8 percentage pointsduring the current fiscal year.
Overall, the Permanent School Fundprovided a return of 10.2% for fiscalyear 2004, outperforming itscomposite index by 0.7 percentagepoint.
Total account results for the lastthree, five and ten years are shownin Figure 37.
Annualized2000 2001 2002 2003 2004 3 Yr. 5 Yr. 10 Yr.
Total Fund 6.1% -2.6% -6.2% 6.3% 10.2% 3.2% 2.6% 7.1% Composite* 6.2 -2.3 -5.2 5.7 9.5 3.1 2.6 6.8
Stock Segment 7.4 -14.7 -18.2 0.7 19.0 -0.7 -2.1 N/A S&P 500 7.2 -14.8 -18.0 0.3 19.1 -0.7 -2.2 N/A
Bond Segment 4.7 11.2 7.1 11.9 1.1 6.6 7.1 7.9 Lehman Agg 4.6 11.2 8.6 10.4 0.3 6.4 6.9 7.4
* 50% S&P 500/ 48% Lehman Aggregate/ 2% 3 Month T-Bills. Prior to July 1, 1997, the Fund’s benchmark was 100% Lehman Aggregate.
Permanent School Fund
Spendable Income
Spendable income generated by theportfolio over the last five fiscalyears is shown below:
Fiscal Year Millions2000 $212001 $242002 $212003 $192004 $16
-8
-6
-4
-2
0
2
4
6
8
10
12
2000 2001 2002 2003 2004 3 Yr. 5 Yr. 10 Yr.
Per
centTotal Fund
Composite*
Figure 37. Permanent School Performance FY 2000-2004

41
By statute, the State Board ofInvestment (SBI) invests the assets ofthe Environmental Trust Fund. TheLegislature funds environmentalprojects from a portion of the marketvalue of the Fund.
Investment Objective
The Environmental Trust Fund’sinvestment objective is long-termgrowth in order to produce a growinglevel of spending within theconstraints of maintaining adequateportfolio quality and liquidity.
Investment ConstraintsIn November 1998, Minnesota voterspassed a constitutional amendment tocontinue the mandate that 40 percentof the net proceeds from the statelottery be credited to the Fundthrough 2025.
The amendment also provides forspending 5.5 percent of the Fund’smarket value annually, since fiscalyear 2000. The amendmenteliminates the accounting restrictionson capital gains and losses and theprovision that the principal mustremain inviolate.
Asset Allocation
After the constitutional amendmentwas adopted in November 1998, SBIstaff worked with the LegislativeCommission on MinnesotaResources to establish an assetallocation policy that is consistentwith the Commission’s goals forspending and growth of the Fund.
The SBI approved a 70% stock and30% fixed income asset allocationwhich was implementedJuly 1, 1999. The allocation positionsthe Fund for the best long-termgrowth potential while meeting theobjective of the Fund to produce agrowing level of spending.
Figure 38 presents the actual assetmix of the Environmental Trust Fundat the end of fiscal year 2004. Thecurrent long term asset allocationtargets for the Fund are:
Domestic Stocks 70%Domestic Bonds 28Cash 2
The Environmental Trust Fund was established in 1988 by theMinnesota Legislature to provide a long-term, consistent and stablesource of funding for activities that protect and enhance theenvironment. On June 30, 2004, the market value of the Fund was$342 million.
Investment Management
SBI staff manage all assets of theEnvironmental Trust Fund. Given theunique constraints of the Fund,management by SBI staff isconsidered to be the most costeffective at this time.
Stock SegmentThe stock segment of the Fund ispassively managed to track theperformance of the S&P 500.
Bond SegmentThe bond segment is activelymanaged to add incremental value
Environmental Trust Fund
Fig ure 3 8 . En v iro nme n ta l Tru s t Fu nd A s s e t Mix a s o f Jun e 3 0 , 20 0 4
Dom. Stocks ($239 Million) - 69.9%
Dom. Bonds ($101 Million) - 29.5%
Cash ($2 Million) - 0.6%
Note: Percentages may dif fer slightly due to rounding of values.

42
through sector, security and yieldcurve decisions and its performanceis measured against the LehmanBrothers Aggregate Bond Index.
Investment Performance
During the Fiscal Year, the stocksegment exceeded the S&P 500benchmark, returning 0.1 percentagepoint more than the S&P 500. Byinvesting in all of the stocks in thebenchmark at their index weighting,the segment attempts to track thebenchmark return on a monthly andannual basis. The portfolio isperiodically rebalanced to maintainan acceptable tracking error relativeto the benchmark subject to keepingtrading costs at a minimum.
The bond segment outperformed itsbenchmark by 1.2 percentage pointsduring the fiscal year.
Overall, the Environmental TrustFund provided a return of 13.7% forfiscal year 2004, outperforming itscomposite index by 0.4 percentagepoint. For the most recent three-yearperiod, the fund exceeded itscomposite benchmark by 0.2percentage point. The fundexperienced modest outperformanceover the last five and ten years due tothe incremental value added by boththe stock and bond segments.Performance results are presented inFigure 39.
Spendable income generated by theFund follows:
Fiscal Year Millions2000 $132001 $132002 $172003 $172004 $15
Annualized2000 2001 2002 2003 2004 3 Yr. 5 Yr. 10 Yr.
Total Fund 6.6% -7.3% -10.9% 4.2% 13.7% 1.8% 0.8% 9.0% Composite* 6.7 -7.4 -10.5 3.6 13.3 1.6 0.7 8.9
Stock Segment 7.4 -14.6 -18.2 0.7 19.2 -0.6 -2.1 11.9 S&P 500 7.2 -14.8 -18.0 0.3 19.1 -0.7 -2.2 11.8
Bond Segment 4.7 11.2 7.0 11.9 1.5 6.7 7.2 7.8 Lehman Aggregate 4.6 11.2 8.6 10.4 0.3 6.4 6.9 7.4
* Weighted 50% S&P 500/ 48% Lehman Aggregate, and 2% 3 Month T-Bills through June 1999. Weighted 70% S&P 500/ 28% Lehman Aggregate/ and 2% 3 month T-Bill beginning July 1, 1999.
Environmental Trust Fund
-15
-10
-5
0
5
10
15
2000 2001 2002 2003 2004 3 Yr. 5 Yr. 10 Yr.
Per
centTotal Fund
Composite*
Figure 39 . Env ironmental Trus t Fund Per f o rmanc e FY 2000-2004
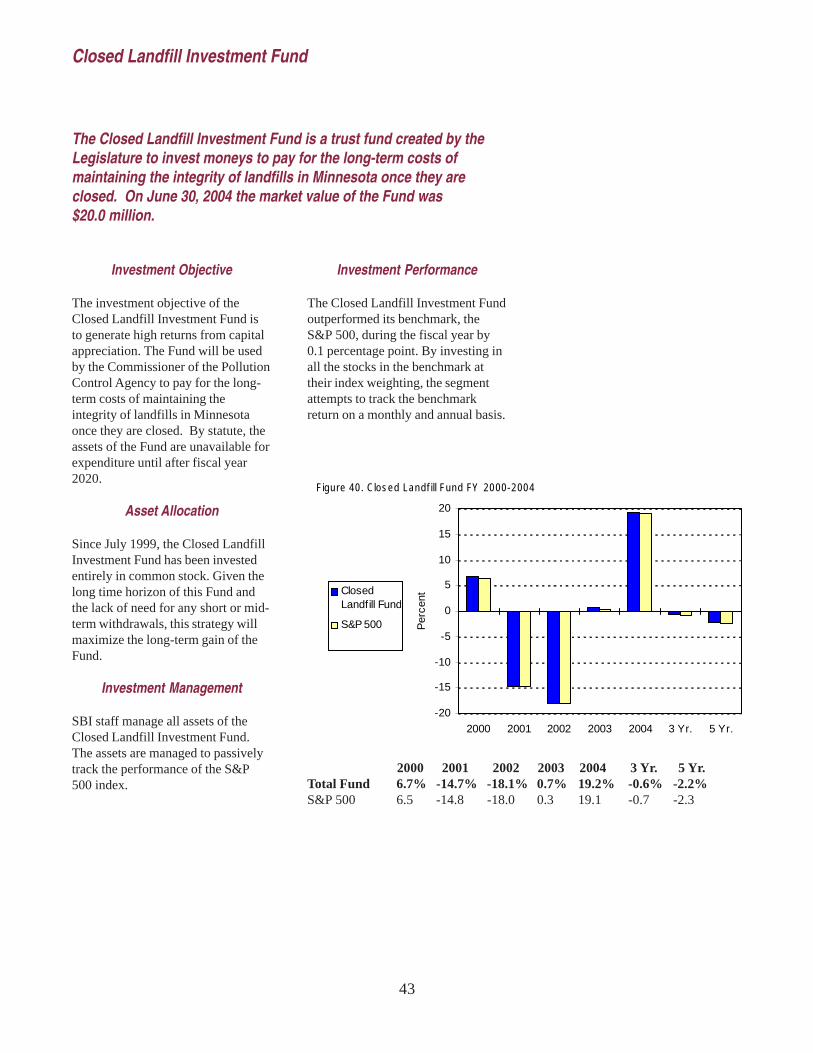
43
Investment Objective
The investment objective of theClosed Landfill Investment Fund isto generate high returns from capitalappreciation. The Fund will be usedby the Commissioner of the PollutionControl Agency to pay for the long-term costs of maintaining theintegrity of landfills in Minnesotaonce they are closed. By statute, theassets of the Fund are unavailable forexpenditure until after fiscal year2020.
Asset Allocation
Since July 1999, the Closed LandfillInvestment Fund has been investedentirely in common stock. Given thelong time horizon of this Fund andthe lack of need for any short or mid-term withdrawals, this strategy willmaximize the long-term gain of theFund.
Investment Management
SBI staff manage all assets of theClosed Landfill Investment Fund.The assets are managed to passivelytrack the performance of the S&P500 index.
Investment Performance
The Closed Landfill Investment Fundoutperformed its benchmark, theS&P 500, during the fiscal year by0.1 percentage point. By investing inall the stocks in the benchmark attheir index weighting, the segmentattempts to track the benchmarkreturn on a monthly and annual basis.
The Closed Landfill Investment Fund is a trust fund created by theLegislature to invest moneys to pay for the long-term costs ofmaintaining the integrity of landfills in Minnesota once they areclosed. On June 30, 2004 the market value of the Fund was$20.0 million.
2000 2001 2002 2003 2004 3 Yr. 5 Yr.Total Fund 6.7% -14.7% -18.1% 0.7% 19.2% -0.6% -2.2%S&P 500 6.5 -14.8 -18.0 0.3 19.1 -0.7 -2.3
Closed Landfill Investment Fund
-20
-15
-10
-5
0
5
10
15
20
2000 2001 2002 2003 2004 3 Yr. 5 Yr.
Per
cent
ClosedLandfill Fund
S&P 500
Figure 40 . Clos ed Landf ill Fund FY 2000-2004
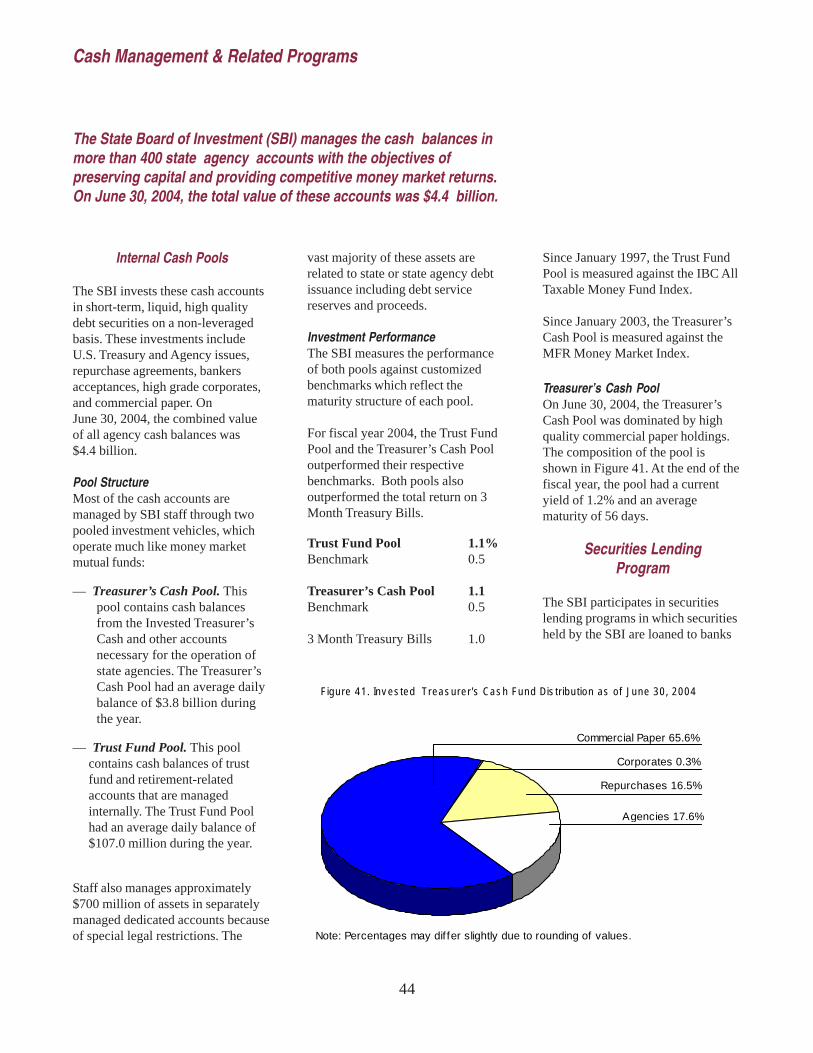
44
Internal Cash Pools
The SBI invests these cash accountsin short-term, liquid, high qualitydebt securities on a non-leveragedbasis. These investments includeU.S. Treasury and Agency issues,repurchase agreements, bankersacceptances, high grade corporates,and commercial paper. OnJune 30, 2004, the combined valueof all agency cash balances was$4.4 billion.
Pool StructureMost of the cash accounts aremanaged by SBI staff through twopooled investment vehicles, whichoperate much like money marketmutual funds:
— Treasurer’s Cash Pool. Thispool contains cash balancesfrom the Invested Treasurer’sCash and other accountsnecessary for the operation ofstate agencies. The Treasurer’sCash Pool had an average dailybalance of $3.8 billion duringthe year.
— Trust Fund Pool. This poolcontains cash balances of trustfund and retirement-relatedaccounts that are managedinternally. The Trust Fund Poolhad an average daily balance of$107.0 million during the year.
Staff also manages approximately$700 million of assets in separatelymanaged dedicated accounts becauseof special legal restrictions. The
vast majority of these assets arerelated to state or state agency debtissuance including debt servicereserves and proceeds.
Investment PerformanceThe SBI measures the performanceof both pools against customizedbenchmarks which reflect thematurity structure of each pool.
For fiscal year 2004, the Trust FundPool and the Treasurer’s Cash Pooloutperformed their respectivebenchmarks. Both pools alsooutperformed the total return on 3Month Treasury Bills.
Trust Fund Pool 1.1%Benchmark 0.5
Treasurer’s Cash Pool 1.1Benchmark 0.5
3 Month Treasury Bills 1.0
Since January 1997, the Trust FundPool is measured against the IBC AllTaxable Money Fund Index.
Since January 2003, the Treasurer’sCash Pool is measured against theMFR Money Market Index.
Treasurer’s Cash PoolOn June 30, 2004, the Treasurer’sCash Pool was dominated by highquality commercial paper holdings.The composition of the pool isshown in Figure 41. At the end of thefiscal year, the pool had a currentyield of 1.2% and an averagematurity of 56 days.
Securities LendingProgram
The SBI participates in securitieslending programs in which securitiesheld by the SBI are loaned to banks
The State Board of Investment (SBI) manages the cash balances inmore than 400 state agency accounts with the objectives ofpreserving capital and providing competitive money market returns.On June 30, 2004, the total value of these accounts was $4.4 billion.
Cash Management & Related Programs
Commercial Paper 65.6%
Repurchases 16.5%
Agencies 17.6%
Corporates 0.3%
Figu re 41 . Inv es ted Treas ure r 's Cas h Fund Dis tr ibu tion as o f June 30 , 2004
Note: Percentages may dif fer slightly due to rounding of values.
��
�����������������������������������������������������������������8�����������#������0���������� �3�����������������"����������������$���������� �3������������������$#���������� ��$������������������� ��$"����������������������������.�������;%-�<�������������"������������-)),�
������������������"���"������"�������"�������������-)))�!���/����9��"����������"����"����������������������������.������;%(-#)))������"�������������-)),�
Certificate ofDeposit Program
����� ������"������������������������7����"�������!�����������������73�������������������������������������� ���������������$�����������������������������#�����"���������"�����������7����$������+���������F�!�C�$�9�������5������� ��$�
����� �3��������������7������"���������������������������������������������������������������#���"������������8�#�������!��������������������������������7����$������� �������"���������"�������������"�������������������������������������������I��������������������������������������������������������"����
7����"�������������-)),#����� ���������������;-*'�����������73������������������������������������������"��������"�������%*<)#���� �������������������;,�,�����������73���������.�������'))����������������������"����������
Cash Management & Related Programs
SecuritiesRepurchase Program
��������������#������������$����"����������������.����������������������������������������������������������������������������������������������������������������$����������������"���������������������"��+��������������� ���������������������5����������6�"������������������������������������$�����"����������
1����������"���#����� ������������������������������������������������ ���������������$����������������������"����������������������������"�����������#�����������������������������������"����$��������J�����������K�����������$���������� ����������������������
��������������������������������8����������"�������8�����;%))#)))��;-��������������������9�������������������#������"��������������������#�������"���������������������������� �3���7��"����
7����"�������������-)),#����� �����������;-<�,����������������������������������������������
��
�����������������!����,'?�����#������� ����������������� �����������������������������������������������������4��������"����:
H������� �����������������������������������������������������"������1����������������1����������������>����������������������5��,)%�����������������������������������
H������� ����������������������"��"���������������������������"�������"��6���#�����������"���������������������������>�"���=����������������I�������>=�I���������������������������������������������FR����"�������"��6�����'-*6�����
���������������������������������������������������"����������!�����9�"����,-�
Other Deferred Compensation Programs
�9�"����,-������������6�����6��������������������������������� �
� ���)�4.$<�=�'�����<��������2 ���$3�/...=��������������������B����������������4�����"��5�������������=+������9���������4�5=9��/�����9��"� ��$��������#�F���
�B�������������4.$<�=�'����<��������2 ���$3�/...=��������������������B����������������4����"��5�������������=+������9���������4�5=9�
� ����������������������'����<-/%�'���=��������������������B����������������4����"��5�������������=+������9���������4�5=9�

47
Legislative Update
Only one item of interest to the StateBoard of Investment was passedduring the 2004 legislative session.
Laws of Minnesota 2004, Chapter175, authorizes the SBI to investcertain assets of the MetropolitanCouncil designated as reserves forretiree healthcare costs. The SBIwill work with the Met Council infiscal year 2005 to determine theappropriate allocation of these assetsin the non-retirement trust poolsmanaged by Staff.
Police and Fire Fund Activity
Mergers with PERA
Under state law, local police andsalaried firefighter plans mayconsolidate with the PublicEmployees Retirement Association(PERA). When a merger is approved,assets are transferred from the localplan to the State Board of Investment(SBI).
By statute, the Executive Director ofthe SBI has authority to accept assetsin-kind or to require that individualholdings be converted to cash priorto the transfer. Since the investmentsmade by local plans are similar tothose made by the SBI, most assetscan be transferred at their statedmarket value.
Since 1987, 44 plans with total assetsof $603 million have merged withPERA. After consolidation, theseassets are managed as part of theBasic and Post Retirement Funds.(Please note that there remain severallocal police salaried firefighter plansthat have not merged with PERA.These plans also have the statutory
Major Policy Initiatives
authority to invest in theSupplemental Investment Fund[SIF]).
Volunteer Fire Plans Investment
Volunteer firefighter retirement plansare not eligible to be consolidatedwith PERA. They may invest theirassets with the SBI through the SIF.There are more than 700 localvolunteer firefighter plans withinvestment authority.
During fiscal year 2004, anadditional 5 volunteer firefighterplans selected the SIF for all or aportion of their retirement assets.
As of the end of fiscal year 2004,there were 227 plans participating inthe SIF.
The SBI expects this growth trend tocontinue as volunteer firefighterplans become more familiar with theSBI and its ability to offer a varietyof investment options at a lowadministrative cost.
Local Plan Performance Reports
The SBI provides the local plans thatparticipate in the SIF reportsdisplaying their annual returns andmarket values from the SIF incompliance with Minnesota Statutes,Chapter 356. The local plans areresponsible for providing theirspecific data to the Office of theState Auditor.

48
Mandate on Northern Ireland
Requirements
The SBI is responsible forimplementing certain statutoryprovisions concerning its investmentsin U.S. companies with operations inNorthern Ireland. The statuterequires the State Board ofInvestment (SBI) to:
— Annually compile a list of U.S.corporations with operations inNorthern Ireland in which the SBIinvests.
— Annually determine whether thosecorporations have takenaffirmative action to eliminatereligious or ethnic discrimination.The statute lists nine goalsmodeled after the MacBridePrinciples.
— Sponsor, co-sponsor and supportresolutions that encourage U.S.companies to pursue affirmativeaction in Northern Ireland, wherefeasible.
The statute does not require the SBIto divest existing holdings in anycompanies and does not restrictfuture investments by the SBI.
Implementation
The SBI uses the services of theInvestor Responsibility ResearchCenter (IRRC), Washington D.C., tomonitor corporate activity inNorthern Ireland. In January 2004,the SBI held stocks or bonds in 58 of64 corporations identified by IRRCas having operations in NorthernIreland.
The SBI filed shareholder resolutionswith four of these corporationsduring the 2004 proxy season. Theresolution asked corporations to signthe MacBride Principles and toimplement affirmative actionprograms.
The voting results on the fourresolutions are shown below:
AffirmativeCompany VoteClaire’s Stores 0.8%Interpublic 11.1%Teletech Holdings 6.1%Yum Brands 13.4%
Major Policy Initiatives

49
Tobacco Issues
At its September 1998 meeting, theBoard adopted a resolution thatrequired each active and semi-passive equity manager to divest bySeptember 2001 shares of anycompany which obtained more than15 percent of its revenues from themanufacture of consumer tobaccoproducts. Staff notified each activeand semi-passive equity manager ofthe policy.
At the close of fiscal year 2001, theSBI had divested from its activeportfolios all shares of companiescovered by its divestment resolution.
Directives to Stock ManagersAt its December 1997 meeting, theBoard adopted a resolution requiringthe SBI’s stock managers to providewritten justification to SBI staff if amanager made new or additionalpurchases of stock in companieswhich obtained more than 50% oftheir revenues from the sale oftobacco.
At its June 1998 meeting, the Boardtook further action regarding SBIinvestment in tobacco-related stocks.
The first resolution required the SBIactive and semi-passive equitymanagers to discontinue purchases ofshares of any company that generatedmore than 15 percent of its revenuefrom the manufacture of consumertobacco products. The secondresolution required the SBI staff toprepare and submit to the Board aplan for divestiture of shares of anycompany that generated more than 15percent of its revenue from themanufacture of consumer tobaccoproducts held in the SBI’s activelyand semi-passively managed equityportfolios.
The policy requiring divestmentfollows directly from the latterresolution.
Shareholder ResolutionsDuring the 2004 proxy season, theSBI co-sponsored one companyresolution. The resolution filed atRJ Reynolds requested a committeeof independent directors todetermine the companys past andpresent involvement directly orindirectly in any cigarette smugglingthroughout the world. Theresolution was withdrawn due to atechnicality.
Major Policy Initiatives

50
Proxy Voting
As a stockholder, the State Board ofInvestment (SBI) is entitled toparticipate in corporate annualmeetings through direct attendanceor casting its votes by proxy.Through proxy voting, the Boarddirects company representatives tovote its shares in a particular way onresolutions under consideration atannual meetings. These resolutionsrange from routine issues, such asthose involving the election ofcorporate directors and ratification ofauditors, to matters such as mergerproposals and corporate socialresponsibility issues. In effect, as ashareholder the SBI can participatein shaping corporate policies andpractices.
Voting Process
The Board recognizes its fiduciaryresponsibility to cast votes on proxyissues. Except for the shares held byactive international managers, theSBI does not delegate the duty to itsexternal investment managers.Rather, the SBI actively votes allshares according to guidelinesestablished by its Proxy Committee.
The Board delegates proxy votingresponsibilities to its ProxyCommittee which is comprised of adesignee of each Board member.The four member Committee meetsonly if it has a quorum and castsvotes on proxy issues based on amajority vote of those present. In theunusual event that it reaches a tievote or a quorum is not present, theCommittee will cast a vote to abstain.
Voting Guidelines
The Committee has formulatedguidelines by which it votes on awide range of corporate governanceand social responsibility issues.Each year the Proxy Committeereviews existing guidelines anddetermines which issues it willreview on a case-by-case basis.
Corporate Governance IssuesThe voting guidelines for majorcorporate governance issues aresummarized below:
Routine Matters. In general, the SBIsupports management on routinematters such as uncontested electionof directors; selection of auditors;and limits on director and officerliability or increases in director andofficer indemnification permittedunder the laws of the state ofincorporation.
Shareholder Rights Issues. Ingeneral, the SBI opposes proposalsthat would restrict shareholder abilityto effect change. Such proposalsinclude instituting super-majorityrequirements to ratify certain actionsor events; creating classified boards;barring shareholders fromparticipating in the determination ofthe rules governing the board’sactions (e.g. quorum requirementsand the duties of directors);prohibiting or limiting shareholderaction by written consent; andgranting certain stockholderssuperior voting rights over otherstockholders.
In general, the SBI supportsproposals that preserve or enhanceshareholder rights to effect change.Such proposals include requiring
shareholder approval of poison pillplans; repealing classified boards;adopting secret ballot of proxy votes;reinstating cumulative voting; andadopting anti-greenmail provisions.
Executive Compensation. In general,the SBI supports efforts to haveboards of directors comprised of amajority of independent directors, tohave compensation committees madeup entirely of independent directors,and to have executive compensationlinked to a company’s long-termperformance.
Buyout Proposals. In general, theSBI supports friendly takeovers andmanagement buyouts.
Special Cases. The Proxy Committeeevaluates hostile takeovers, contestedelection of directors, compensationagreements that are contingent uponcorporate change in control, and re-capitalization plans on a case-by-casebasis. In addition, the Committeemay review corporate governanceissues affecting companiesincorporated or headquartered inMinnesota on a case-by-case basis.
Social Responsibility IssuesThe voting guidelines for majorsocial responsibility issues are shownbelow:
Northern Ireland. The SBI supportsresolutions that call for the adoptionof the MacBride Principles as ameans to encourage equalemployment opportunities inNorthern Ireland. The SBI alsosupports resolutions that requestcompanies to submit reports toshareholders concerning their laborpractices or their sub-contractors’labor practices in Northern Ireland.
Major Policy Initiatives
51
Tobacco and Liquor. In general, theSBI supports a variety of tobaccoand liquor related resolutionsincluding those that call forcorporations to limit their promotionof tobacco and liquor products and toreport on their involvement intobacco issues.
Environmental Protection. In general,the SBI supports resolutions thatrequire a corporation to report ordisclose to shareholders companyefforts in the environmental arena. Inaddition, the SBI supportsresolutions that request a corporationto report on progress towardachieving the objectives of the CeresPrinciples (formerly known as theValdez Principles), an environmentalcode of conduct for corporations.
Other Social Responsibility Issues.In general, the SBI supportsproposals that require a company toreport or disclose to shareholderscompany efforts concerning a varietyof social responsibility issues. In thepast, these reporting resolutions haveincluded issues such as affirmativeaction programs, animal testingprocedures, nuclear plant safetyprocedures and criteria used toevaluate military contract proposals.
Summary of FY 2004Proposals
During fiscal year 2004 the SBIvoted proxies for approximately2,100 U.S. corporations.
As in past years, the issues oncorporate ballots included a broadrange of proposals in the corporategovernance area, as reflected ininformation provided by the Investor
Responsibility Research Center(IRRC), Washington, D.C.:
— Shareholders submitted 50proposals to redeem “poisonpills” (an anti-takeover device) orsubmit them to shareholder vote.This proposal received averagesupport of 61.7%.
— Resolutions to expense options attime of grant were on 33 ballotswith an average support of 53.5%.
— Other proposals included therepeal of classified boards whichwere supported by an average of70.4% of shares voted;shareholder approval of severancepackages to top executives(“golden parachutes”) whichreceived support from an averageof 51.8% of shares voted;cumulative voting which wassupported by an average of 35.1%of shares voted; proposals toincrease board independencereceived support from an averageof 27.3% of shares voted;proposals to require performance-based stock options receivedaverage support of 40.2% ofshares voted; and a variety ofproposals to restrict executivecompensation received averagesupport of 11.1%.
In the social responsibility area, theenvironment, global labor standards,fair employment issues-bothdomestic and international, andtobacco were the major issues, asreflected in information provided bythe IRRC:
— A variety of environmental issuesreceived 34 resolutions andreceived average support rangingfrom 5.6% to 15.1%.
— Political giving issues received 35proposals with an average supportlevel of 9.5%.
— Executive pay and socialperformance issues receivedfourteen resolutions with anaverage support level of 8.3%.
— Equal employment issues receivedsix resolutions with an averagesupport of 33.8%.
— Resolutions on a variety oftobacco-related issues were on tenballots with an average support of5.4%.
— Human rights issues received tenresolutions with an averagesupport level of 8.0%.
— Northern Ireland issues receivedseven proposals this year with anaverage support of 9.9%.
— Global Labor Standards receivedseventeen proposals this year withan average support of 13.0%.
Major Policy Initiatives

52
Guidelines on InternationalInvesting
As noted in prior sections of thisreport, the State Board of Investment(SBI) made its first internationalstock investments in 1992. Thebenefits of international investinginclude: increased investmentopportunity, greater diversificationand potential for higher return.Approximately one-half of theworld’s markets lie outside the U.S.
The United Kingdom, Japan,Germany and France comprise nearlytwo-thirds of the value of theinternational markets. Together witheighteen (18) other countries inEurope, Canada, and the PacificBasin, these countries comprise thedeveloped international stockmarkets. Many of the emergingmarkets in Latin America, EasternEurope, the Middle East, Africa andAsia may require special investmentconsiderations and/or limitations oninvestment.
Guidelines
Based on information compiled fromU.S. State Department reports, theTask Force grouped countries intothree broad categories as indicatedbelow by groups I, II and III. It isimportant to note that the guidelineslisted below do not prohibit an activestock manager from purchasing thestock of any country. Rather, theyrequire additional notification and/orthat a presentation be given by themanager regarding the firm’sinvestment strategy for investmentsto countries in Groups II and III.
Group I. These countries have legalstructures that generally respect therights of workers and human rights.Because these countries have strong
protections for workers and humanrights, there is little concern thateconomic and social disruptions mayoccur which would have an adverseeffect on financial markets. As aresult, active stock managers areauthorized to invest in companiesdomiciled in these countries withoutadditional notification to the SBI.
Group II. These countries havelegal protections for workers andhuman rights, but violations havebeen cited in the State Departmentreports. It is thought that violationsof this type may lead to economicand social disruption in thesecountries, which may have anadverse effect on their financialmarkets. An active stock managermay, however, invest in companiesdomiciled in the countries shownunder “Group II” if the managerbelieves that it would be a breach offiduciary responsibility not to do so.If a manager chooses to invest in oneor more of these markets, themanager must notify the SBI inwriting.
Group III. These countries lackbasic protections for workers andhuman rights and do not appear to bemaking progress in establishing anappropriate legal structure to addressthese issues. The potential foreconomic, political and social unrestis seen to be greater in thesecountries, which may adverselyaffect the stability of these financialmarkets. An active stock managermay, however, invest in companiesdomiciled in countries shown under“Group III” if the manager believesthat it would be a breach of fiduciaryresponsibility not to do so. If amanager chooses to invest in one ormore of these markets, the managermust appear before the SBI topresent its reasons for the decision todo so.
Review Process
The Board established anInternational Investing GuidelinesTask Force to recommend guidelinesthat address these limitations as wellas other concerns related tointernational investing.
When the Task Force made itsoriginal report to the Board inDecember 1992, they expected thatthe country groupings would beupdated periodically to reflectchanges in the world markets. TheBoard has adopted the followingreview process regarding guidelines:
— Staff will review reports from theUS State Department regardingworker and human rights issuesand designate countries “Group I,II or III” using the existing policyguidelines adopted by the Board.
Staff will report on the countriesincluded in the International Programasset class target which will bereviewed by the SBI AdministrativeCommittee.
Major Policy Initiatives

53
Figure 43 displays the country groupings.
Figure 43. Current International Investing Guidelines Country Groupings*
Group I Group I Group II Group III EAFE Countries Non-EAFE Countries Non-EAFE Countries Non-EAFE Countries Australia Argentina Bangladesh Burma Austria Barbados Brazil China Belgium Bermuda Bulgaria Cote d’Ivoire Denmark Bolivia Colombia Croatia Finland Botswana Ghana Dominican Republic France Canada Guatemala Ecuador Germany Chile India Egypt Hong Kong Costa Rica Indonesia Iran Ireland Cyprus Israel Jordan Italy Czech Republic Korea, Republic of Kazakhstan Japan Estonia Kuwait Kenya Netherlands Greece Malaysia Lebanon New Zealand Hungary Mauritania Liberia Norway Jamaica Mongolia Oman Portugal Latvia Morocco Pakistan Singapore Lithuania Namibia Paraguay Spain Luxembourg Nepal Russia Sweden Malawi Nigeria Saudi Arabia Switzerland Mauritius Peru Syria United Kingdom Mexico Philippines Turkmenistan
Panama Romania UkrainePapua New Guinea South Africa United Arab EmiratesPoland Sri Lanka UzbekistanSlovak Republic SwazilandSlovenia ThailandTaiwan TurkeyTrinidad & Tobago VenezuelaTunisia VietnamUruguay Zambia
Zimbabwe
* As of May 2001
Major Policy Initiatives

54
DomesticEquity Program
Managers
Active ManagersLarge Cap Core(Russell 1000)
Franklin Portfolio AssociatesFranklin’s investment decisions arequantitatively driven and controlled.The firm believes that consistentapplication of integrated multiplevaluation models produces superiorinvestment results. The firm’s stockselection model is comprised of 40valuation measures each of whichfalls into one of the followinggroups: relative value, future value,fundamental momentum, long-termgrowth, price action, andmanagement signals.
Franklin utilizes a quantitativeapproach and seeks to add value byfocusing on buying and selling theright stock rather than attempting totime the market or pick the rightsector or industry groups. Franklinwas retained by the SBI as an activemanager in April 1989.
New Amsterdam PartnersNew Amsterdam Partners believesthat investment results are evaluatedby actual return, and therefore,investment opportunities should beevaluated by expected return. Theinvestment process combinesquantitative analysis with afundamental overlay. The firmdescribes its style as growth at areasonable price (GARP). Thestrategy seeks to identify andcapitalize on mispriced securities. Aproprietary quantitative modelgenerates expected returns forstocks. The 100 stocks with thehighest expected returns aresubjected to further examination and
fundamental analysis. NewAmsterdam was retained by the SBIin April 1994.
UBS Global Asset Management(formerly Brinson Partners)UBS focuses on price to value as thecornerstone of their investmentprocess. They discount all futurecash flows of a company to calculatethe intrinsic value from an owner’sperspective, and then compare thatvalue estimate to the current stockprice. The resulting price to valuedifferences, applied over a broadrange of companies, become thebuilding blocks of the securityselection process. Portfolioconstruction focuses on marketsensitivity, common factorexposures, industry weightings, andindividual stock selection. UBS wasretained by the SBI in July 1993.
Voyageur Asset ManagementVoyageur’s strategy is focused onachieving consistent, superiorperformance with near-benchmarkrisk. They seek high qualitycompanies with exceptional financialstrength and proven growthcharacteristics. They believe thatsound fundamental analysis revealsthose companies with superiorearnings achievement and potential.Their screening process identifiescompanies that over the past fiveyears have had higher growth insales, earnings, return on equity,earnings stability and have lowerdebt ratios relative to the marketsales, operating income, earningsgrowth rate consistency greater thanthe market, and lower debt ratiosrelative to the market. Voyageur wasretained by the SBI in July 2000.
Large Cap Growth(Russell 1000 Growth)
Alliance Capital ManagementAlliance searches for companieslikely to experience high rates ofearnings growth at an early stage andat a reasonable price. Allianceinvests in a wide range of medium tolarge growth companies. Industryexposures are a result of individualstock selection. The firm’s decision-making process is based on the beliefthat investment success stems fromthe correct marriage of fundamentalsand price. Alliance adjusts positionsizes to take advantage of short-termprice movements. Alliance is not anactive market timer and rarely raisescash above minimal levels. Theymanage a concentrated stockportfolio of about 40 to 60companies. The firm was retained bythe SBI in March 1983.
Cohen Klingenstein & Marks, Inc.Cohen Klingenstein & Marks seeksto outperform the market by focusingon two variables: economic cyclesand security valuation. Withineconomic cycles, they believe thatstocks exhibit predictable patternsthat reflect changing expectations oncorporate profits and interest rates.Similarly, they believe that stockprices normally reflect earningsexpectations. The firm exploits shortrun inefficiencies through anunbiased process that relates theprice of a stock to consensusearnings expectations. The firm wasretained by the SBI in April 1994.
Holt-Smith & Yates AdvisorsHolt-Smith & Yates invests incompanies demonstrating superiorgrowth in earnings over a longperiod of time. They use bottom-upfundamental analysis, focusing onhistorical and forecasted sales and
Investment Manager Summaries

55
earnings trends, profit margin trends,debt levels and industry conditions.They seek to purchase large-capcompanies that meet their strictvaluation criteria and that havesuperior fundamentals to that of thebenchmark. Companies mustcurrently have a five year projectedgrowth rate of over 20% and a PEG(P/E ratio to growth rate) ratio ofbelow 150%. They holdconcentrated portfolios, with lowturnover. Holt-Smith was retained bythe SBI in July 2000.
Zevenbergen CapitalZevenbergen Capital’s investmentphilosophy is founded on theprinciples that superior fundamentalsdrive stock price appreciation andexceptional management combinedwith balance sheet strength providescapital protection. The firm employsa forward looking, bottom-upinvestment process designed forlong-term results. Portfolios areconstructed with companiespresenting established andprospective revenue, cash flow andearnings growth, whilediversification and risk control areaccomplished through a blend ofcompany size, expected growth rates,and appropriate portfolio weightings.The firm remains fully invested toensure market participation.Zevenbergen was retained by the SBIin April 1994.
Large Cap Value(Russell 1000 Value)
Barrow, Hanley, Mewhinney &Strauss, Inc. (BHMS)BHMS believes that markets areinefficient, and can best be exploitedthrough adherence to a value-oriented investment processdedicated to the selection ofsecurities on a bottom-up basis.
Stocks in their portfolio must reflectall three value characteristics: price/earnings and price/book ratios belowthe market and dividend yields abovethe market. The stocks must also beattractive according to the firm’sdividend discount and relative returnmodels. Analysts providefundamental analysis in the final stepof their investment process. BHMSwas retained by the SBI in March2004.
Bay Isle FinancialBay Isle Financial believes thatcompanies with strong fundamentalsand management will outperform andthat these companies can be found ata discount to fair value. To capitalizeon these ideas, they perform rigorousfundamental analysis on cash flowgrowth and balance sheet strengthand evaluate a company’s business,major competitors and managementstrength. Bay Isle closely monitorsrisk levels relative to the benchmarkand the portfolio is diversified acrossmost industry sectors. Bay Isle wasretained by the SBI in July 2000.
Earnest PartnersEarnest Partners utilizes aproprietary valuation andperformance model and rigorousfundamental review to identify stockswith the most attractive relativereturns. They have identified sixperformance drivers – valuationmeasures, operating trends, markettrends, growth measures, profitabilitymeasures and macroeconomicmeasures – and have done extensiveresearch to determine whichcombination of performance drivers,or return patterns, precede out-performance for stocks in eachsector. They select stocks whosereturn patterns suggest favorableperformance and control risk using astatistical approach designed to
measure and control the prospects ofsubstantially under-performing thebenchmark. The portfolio isdiversified across industry groups.Earnest Partners was retained by theSBI in July 2000.
Lord Abbett & Co.Lord Abbett applies bothquantitative valuation models andfundamental research. A dividenddiscount model is run usingnormalized earnings and long-termgrowth rates to rank stocks. The topranked stocks represent the valueuniverse and become the focus oftheir fundamental bottom-upresearch. The industry analystsidentify companies with thestrongest fundamentals and the mostattractive valuations. They are alsolooking for the catalyst that willcause a stock price to reach a highervaluation target over a 12-18 monthhorizon. Lord Abbett was retainedby the SBI in March 2004.
LSV Asset ManagementLSV’s philosophy is that superiorlong-term results can be achieved bysystematically exploiting thejudgmental biases and behavioralweaknesses that influence thedecisions of many investors. Theyuse quantitative techniques to ranksecurities based on fundamentalmeasures of value, past performance,and indicators of near-termappreciation potential. Their riskcontrol discipline limits theportfolio’s industry and sectorconcentrations. LSV was retainedby the SBI in March 2004.
Oppenheimer CapitalOppenheimer Capital’s strategy is tobuy companies that are selling at aprice below their determination ofthe company’s intrinsic value. Their
Investment Manager Summaries
56
process is bottom-up based onfundamental analysis. Factorsconsidered when evaluatingcompanies include a strong industrialor commercial position, often wherethere are significant barriers to entry.They look for companies that arefinancially sound and have amanagement team that is devoted tothe interest of shareholders. Theybelieve that discretionary cash flow,cash that remains after a companyspends what is needed to sustain itscommercial position, is a primarydeterminant of a firm’s potential tobuild value for shareholders. Thefirm was retained by the SBI in July1993.
Systematic Financial ManagementSystematic’s objective is to invest incompanies with positive earningssurprise to provide the portfolio withconsistent, above-market returns.They do this by seeking well-managed companies that are tradingat compelling valuations, exceedinginvestor expectations, increasingsales and improving margins, andgenerating strong free cash flow.The process begins with aquantitative screen to rankcompanies by sector based on lowforward price/earnings and positiveearnings catalyst using a 16-factormodel. Rigorous fundamentalanalysis follows. Systematic wasretained by the SBI in March 2004.
Small Cap Growth(Russell 2000 Growth)
McKinley Capital ManagementMcKinley uses a quantitativeprocess to systematically search forand identify early signs ofaccelerating growth. The processincludes a linear regression model toidentify common stocks that areinefficiently priced relative to the
market while adjusting each securityfor its stock price volatility. Theearnings model identifies securitieswith strong earnings acceleration,positive earnings surprises, andsubstantive reasons for continuedearnings growth. Qualitative inputsare used in the final portfolioconstruction. These include the useof economic factors, Wall Streetresearch, and industry themes. Themanager ensures that earningsestimates are reasonable andsustainable. McKinley was retainedby the SBI in December 2003.
Next Century Growth InvestorsNext Century Growth’s (NCG) goalis to invest in the highest quality andfastest growing companies inAmerica. They believe that growthopportunities exist regardless of theeconomic cycle. NCG usesfundamental analysis to identifycompanies that will surpassconsensus earnings estimates whichthey believe to be the number onepredictor of future out-performance.Their investment process focuses ongrowth companies that have superiortop line revenue growth (15% orgreater), high profitability, and strongbalance sheets that are well poised tooutperform the market. NCGbelieves in broad industrydiversification; sector exposures arelimited to twice the benchmarkweighting and individual positions tofive percent. Next Century wasretained by the SBI in July 2000.
Turner Investment PartnersTurner manages a small growthportfolio with the philosophy thatearnings expectations drive stockprices. They pursue a bottom-upstrategy that blends quantitative,fundamental, and technical analysis.They screen securities within sectorand market capitalization groups
using factors appropriate for eachspecific group. Companies areranked within sectors based onmultiple earnings growth andvaluation factors. Fundamentalresearch seeks companies that have arate of growth exceeding industrypeers, earnings that meet or exceedmarket consensus estimates, andearnings estimates that are beingrevised upwards. Technical analysisis used to evaluate trends in tradingvolume and price, and to identifyattractive entry and exit points. TheSBI retained Turner in December2003.
Winslow Capital ManagementWinslow Capital is a fundamental,“bottom-up” investment firm with allportfolio managers acting as researchanalysts. They believe investing incompanies with consistent andsustainable growth provides the bestopportunity for achieving superiorportfolio returns over the long term.The objective is to achieve aweighted average annual earningsgrowth rate in excess of 25%, over a2-3 year time horizon. Thesecompanies tend to have consistentlystrong sales and earnings growth,high return on equity, low debt tocapital, strong cash flow, high insideownership, steady or rising margins,a high level of earnings stability, anda sustainable competitive advantage.Hands-on research includes frequent,direct communication with seniormanagement of portfolio holdings.The research process allowsimplementation of their investmentphilosophy in all marketenvironments and delivers superiorreturns with a low relative level ofvolatility. Winslow Capital wasretained by the SBI in April 1994 tomanage a large cap portfolio. Thismandate was changed to a small capfocus in July 2000.
Investment Manager Summaries

57
Small Cap Value(Russell 2000 Value)
American Express Asset ManagementGroup/Kenwood CapitalKenwood’s small cap value productseeks to own a portfolio of stocksthat represents the best opportunitiesin each sector based on valuationand indicators of improving cashflow and earnings. They look forhigher quality stocks that areundervalued based on demonstrablefundamentals, rather than distressedvalue stocks. Their quantitativeappraisal model ranks stocks on theirpotential excess return. Itincorporates a dozen or so sectormodels who’s weightings vary overtime in relation to the stockattributes that are most important indetermining relative performance.American Express/Kenwood wasretained by the SBI in December2003.
Goldman Sachs Asset ManagementGoldman Sachs manages a small capportfolio using a strong valuationdiscipline to purchase well-positioned, cash generatingbusinesses run by shareholder-oriented management teams.Portfolio managers are organized byindustry, and use industry-specificvaluation measures to categorizecompanies within their area. Theydecompose the historic financialreports, meet with management toevaluate their competitive positionwithin the industry, and evaluateeach company’s valuationattractiveness relative to othercomparable companies within thesector. Goldman Sachs was retainedby the SBI in December 2003.
Hotchkis and Wiley CapitalManagementHotchkis and Wiley manages a smallvalue portfolio, where they seek toexploit mis-priced securities in thesmall cap market by investing in“undiscovered” and “out of favor”companies. They invest in stockswhere the present value of thecompany’s future cash flows exceedsthe current market price. Industryanalysts determine a company’snormal earnings power, orsustainable earnings level underequilibrium economic andcompetitive market conditions,which becomes the basis for securityvaluation. Hotchkis and Wiley wasretained by the SBI in December2003.
Martingale Asset ManagementMartingale manages a small valueportfolio with the philosophy thatthey can exploit the long-term linkbetween undervalued companyfundamentals and current marketprices to achieve superior investmentreturns. They use a quantitativeprocess to identify stocks with lowprice/earnings ratios and high cashflow to price versus peers. Itexamines multiple characteristics ofquality, value and momentum. Valuetraps are avoided by favoring stockswith positive relative strength andearnings estimate revisions versuspeers. Each stock is given a score orranking based on their valuationprocess. Martingale builds aportfolio of the highest rankedstocks while controlling industry andsector weights, and ensuring theaverage company size resembles thebenchmark. Martingale was retainedby the SBI in December 2003.
Peregrine Capital Management, Inc.Peregrine’s Small Cap Valueinvestment process begins with their
proprietary valuation analysis, whichis designed to identify the small capvalue stocks most likely tooutperform. The valuation analysisidentifies the most under-pricedsecurities on a sector-by-sector basis.Drawing on thirty years of data, theanalysis looks at differentcombinations of sixty fundamentalfactors most relevant in each sectorto identify stocks that offersignificant value relative to thecompanies’ underlying fundamentals.The focus of the team’s fundamentalresearch is to determine if one ormore of the style’s “Value BuyCriteria” are present – these includeshort-term problems, unrecognizedassets, take-over potential, andcatalysts for change. The portfoliois diversified and sector weights arealigned closely to the benchmark.This allows stock selection to driveperformance. Peregrine was retainedby the SBI in July 2000.
Semi-Passive Managers
Semi-Passive Managers(Russell 1000)
Barclays Global InvestorsBarclays uses a Core Alpha Modelwhich disaggregates individualequity returns for each of the stocksin their universe into three inputs:fundamental, expectational, andtechnical. The fundamental inputslook at measures of underlyingcompany value including earnings,book value, cash flow, and sales.These factors help identify securitiesthat trade at prices below their trueeconomic value. The expectationalinputs incorporate future earningsand growth rate forecasts made byover 2500 security analysts. Thetechnical inputs provide a measure ofrecent changes in companyfundamentals, consensusexpectations, and performance.Estimated alphas are used in a
Investment Manager Summaries

58
portfolio optimization algorithm toidentify the optimal portfolio thatmaximizes the portfolio’s alpha whilemaintaining a risk level specified bythe SBI. The firm was retained by theSBI for semi-passive management inJanuary 1995.
Franklin Portfolio AssociatesFor the semi-passive product,Franklin adds incremental value to abenchmark by buying stocks rankedthe highest and selling stocks rankedthe lowest, while maintaining theportfolio’s systematic risk andindustry weightings at levels similarto the benchmark. Franklin attemptsto allocate 75% or more of the totalrisk level set by the client to specificstock selection and the rest tosystematic and industry risk. Thefirm always remains fully invested.The SBI retained Franklin as a semi-passive manager in January 1995.
J.P. Morgan Fleming AssetManagementJ.P. Morgan manages a semi-passiveportfolio for the SBI and believesthat superior stock selection isnecessary to achieve excellentinvestment results. To accomplishthis objective, they use fundamentalresearch and a systematic valuationmodel. Analysts forecast earningsand dividends for the 650 stockuniverse and enter these into a stockvaluation model that calculates anexpected return for each security.The stocks are ranked according totheir expected return within theireconomic sector. Stocks mostundervalued are placed in the firstquintile. The portfolio includesstocks from the first four quintiles,favoring the highest ranking stockswhenever possible, and sells those inthe fifth quintile. In addition, theportfolio will closely approximatethe sectors and style of the
benchmark. The firm remains fullyinvested at all times. The firm wasretained by the SBI in January 1995.
PassivePassive Manager (R3000)
Barclays Global InvestorsFor the passive account, Barclaysseeks to minimize tracking errorsubject to trading costs, and controlsoverall investment and operationalrisks. Their strategy is to investacross the broad market whileexcluding smaller, illiquid securitiesfrom the investment universe. Anoptimized approach is taken tosecurity selection. Optimizationeffectively trades off expectedtracking error with cost of trading todetermine which trades should beexecuted. Barclays was retained bythe SBI for passive management inJuly 1995.
Portfolio statistics for each of thedomestic equity managers can befound in the Statistical Datasection of this report.____________________________
InternationalProgram Managers
Active Developed
American Express Asset ManagementAmerican Express’s objective is tofocus on key forces of change in themarkets and the companies that willbenefit. They believe that a goodunderstanding of the likely impact ofthese changes at a company level,complemented with an appreciationof the ability of management toexploit these changes, createssignificant opportunities to pickwinners and avoid losers.Companies are analyzed within amacroeconomic and global sector/
thematic framework. “Top down”views on macroeconomics andtrends in global sectors combinewith “bottom-up” company analysisalong regional and global sectorlines. Analysts propose a rating of Athrough to E for approximately 150-200 stocks in each region reflectingthe expected performance on a 12-month view. American Express wasretained by the SBI in February2000. In December 2003, theThreadneedle team replaced theoriginal investment team.
Britannic Asset ManagementInternational (formerly BlairlogieCapital Management)Britannic has developed a model thatranks countries based on a collectionof current and historical data. Themodel has been adapted to usesimilar types of data to separatelyrank sectors. Their quantitativeanalysis is enhanced with significantqualitative assessments to evaluatefactors that a model cannot review.They continuously strive for theoptimum combination of quantitativeinputs and those based on theportfolio managers’ judgment, butbelieve that objective, measurablefacts must always be the startingpoint for making sound investmentdecisions. Britannic’s approachcombines top-down analysis withbottom-up stock selection. Theirprocess is based on an underlyingobjective of producing premiumreturns consistently above theirbenchmark in any marketenvironment, while carefullycontrolling risk and limitingvolatility. Britannic’s portfolio isbroadly diversified in internationalmarkets, in terms of both country andstock selection. Britannic wasretained by the SBI inFebruary 2000.
Investment Manager Summaries
59
INVESCO Global Asset ManagementINVESCO employs a systematicprocess that identifies undervalued-companies, combined with aconsistently applied portfolio designprocess to control the predictabilityand consistency of returns.INVESCO managers believe theycan add value by identifying andinvesting in stocks which areattractively priced relative to thesustainable growth potential of thecompany. Portfolios are constructedon a bottom-up basis. They selectindividual companies rather thancountries, themes, or industry groups.This is the first of four cornerstonesof their investment approach.Secondly, they conduct financialanalysis on a broad universe of non-U.S. companies, with key financialdata adjusted to be comparableacross countries and currencies.Third, INVESCO believes that usingthe firm’s own local investmentprofessionals enhances fundamentalcompany research. Finally, theymanage risk and ensure broaddiversification relative to the clients’benchmark utilizing a statistics-basedportfolio construction approachinstead of utilizing country orindustry constraints. INVESCO wasretained by the SBI inFebruary 2000.
Marathon Asset ManagementMarathon uses a blend of qualitativedisciplines to construct portfolios.The resulting style and emphasis ofthe portfolio may vary over time andby market, depending on Marathon’sperception of what represents thebest value opportunity. Since the firmbelieves that competition determinesprofitability, Marathon is attracted toindustries where the level ofcompetition is declining. They willhold a sector position as long as thelevel of competition does notincrease. At the stock level,
Marathon tracks a company’scompetitive position relative to theattractiveness of their products orservices and determines whether thecompany is following an appropriatereinvestment strategy for theircurrent competitive position.Marathon was retained by the SBI inNovember 1993.
T. Rowe Price InternationalThe T. Rowe Price investmentapproach links a broadmacroeconomic framework with anawareness of the attractiveness ofindividual stock opportunities withineach market and sector. Stocks areselected using fundamental analysisthat emphasizes growth at areasonable price. The aim is toidentify companies whose prospectsare attractive over a two-yearinvestment horizon and whosefundamental earnings growth will beabove average within its industry orgeographic region. Severalquantitative tools are used toevaluate a security’s prospects,however, it is ultimately themanagers’ seasoned judgment thatwill cause a stock to be introduced,held, or excluded from portfolios.Country and industry weightingsresult directly from stock selection.T. Rowe Price was retained by theSBI in November 1993.
UBS Global Asset Management, Inc.(formerly Brinson Partners, Inc.)UBS is a fundamental, long-term,value-oriented investor. The focus ofUBS’ fully active strategy is to pickthe most attractive stocks, industries,countries and currencies. Theirinvestment research processidentifies discrepancies between asecurity’s fundamental value and itsobserved market price - both acrossand within global equity markets.They exploit these discrepancies
using a disciplined fundamentalapproach. Their research teamsevaluate companies in their sectorsaround the world and assign relativeprice/value rankings based on thepresent value of each company’sexpected future cash flows. Theportfolio construction group utilizesthis global network of resources tosystematically develop portfoliostrategy. Currency strategies aredeveloped separately andcoordinated with country allocations.UBS was retained by the SBI in April1993 with an active country/passivestock mandate. In October of 1999,UBS converted the portfolio to afully active mandate.
____________________________
Passive
State Street Global AdvisorsState Street manages an internationalindex portfolio designed to track theMorgan Stanley Capital InternationalIndex of the World ex. United States.State Street uses a full replicationstrategy to construct the index bycountry. Stock index and countryfutures, approvedby the Commodity Futures TradingCommission, are also used tominimize tracking error and allow forcash in flow and out flow. StateStreet was retained by the SBI inOctober 1992.____________________________
Emerging Markets
Alliance Capital ManagementAlliance Capital’s emerging marketsequity process focuses onfundamental research-driven stockselection, which is structured byindustry within the emerging marketsregions. Alliance’s regional portfoliomanagement and research teams,focused on Asia, Eastern Europe/
Investment Manager Summaries

60
Middle East/Africa and LatinAmerica, construct portfolios withintheir respective regions. Theseregional portfolios are aggregated toestablish Alliance’s total emergingmarkets exposure in the portfolio.Alliance believes that investmentsuccess in the emerging marketsstems from investing in thosecompanies in each region withquality managements in growthbusinesses and with superiorfundamentals. Alliance furtherbelieves that these companies canbest be identified through rigorousfundamental research, conducted byinternal, on-the-ground analysts.Although the investment philosophyemphasizes bottom-up stockselection, parameters are establishedat the portfolio level to manage risk.Exposures by region are maintainedclose to the benchmark weights, anddeviations are made when an excessor a lack of opportunities exist withina particular region. Maximumposition constraints are imposed atthe stock and country level, andindustry exposures are generally aby-product of stock selection. TheSBI retained Alliance Capital inJanuary 2001.
Capital International, Inc.Capital International, Inc. has a longhistory of investing in emergingmarkets for its affiliate, CapitalGuardian Trust Company, one of theCapital Group Companies. Capital isdistinguished by its extensivecommitment to fundamentalresearch, with a large team ofexperienced analysts focused ongathering in-depth information first-hand on companies throughout theworld. Their philosophy can best bedescribed as value-oriented withresearch efforts focused on trying toidentify the difference between theunderlying value of a company andthe price of its securities in its homemarket. This basic, fundamental
approach is blended withmacroeconomic and politicaljudgments on the outlook foreconomies, industries, currencies andmarkets. A critical ingredient in thisblending process is the recognitionthat the relative importance of eachfactor will vary from time to time,and none can be treated as being ofparamount importance at all times.The account is divided among sevenportfolio managers and a researchportfolio. The research portfolio ismanaged by a team of researchanalysts who select stocks within thesectors they cover. All portfoliomanagers are free to make their owndecisions (within risk control limits)as to sector, quality emphasis, cashreserves, and issue selection. TheSBI retained Capital International,Inc. in January 2001.
Morgan Stanley InvestmentManagementMorgan Stanley InvestmentManagement is an emerging marketsspecialist. Their belief is that theemerging markets are a distinct assetclass offering a diverse set ofinvestment opportunities. As bothmacroeconomic and stock-specificfactors drive the emerging markets,Morgan Stanley integrates both top-down country allocation and bottom-up stock selection in order toproduce superior performance overthe medium to long term. Effectiveinvestment management requires adedicated manager who utilizes a setof investment tools tailored to thereturn and risk potential of this assetclass. Morgan Stanley’s coreinvestment style combines growthand value as both are potentialdrivers of performance in emergingmarkets investing. They believe thatgrowth-oriented companies tradingat attractive valuations offer the bestreturn prospects in the emergingmarkets. Morgan StanleyInvestment Management was
retained by the SBI for emergingmarket management inJanuary 2001.
Portfolio statistics for each of theinternational managers can befound in the Statistical Datasection of this report.____________________________
Fixed IncomeProgram Managers
Active
American Express Asset ManagementGroupAmerican Express managesportfolios using a bottom-up relativevalue approach in combination with atop-down, macro outlook that guidesthe firm’s relative value decisions.The firm employs in-depthfundamental research and creditanalysis combined with proprietaryvaluation disciplines to identifyindividual relative valueopportunities across market sectors.The duration and maturity structureof the portfolio are managed using arigorous quantitative approachcentered on the firm’s proprietaryinterest rate forecasting models.American Express is committed todiversification of sources of activerisk in the portfolios it manages, andbelieves that proper diversificationcombined with consistent evaluationof risk-reward tradeoffs leads tosuperior risk-adjusted performance.American Express was retained bythe SBI in July 1993.
Deutsche Asset ManagementDeustche believes there aresignificant pricing inefficienciesinherent in bond markets and thatdiligent credit analysis, security
Investment Manager Summaries
61
structure evaluation, and relativevalue assessment can be used toexploit these inefficiencies. The firmavoids interest rate forecasting andsector rotation because they believethese strategies will not deliverconsistent out performance versusthe benchmark over time. The firm’svalue added is derived primarilyfrom individual security selection.Portfolio managers and analystsresearch bonds within their sector ofexpertise and construct portfoliosfrom the bottom up, bond by bond.Sector weightings are a byproduct ofthe bottom-up security selection.Deutsche was retained by the SBI inFebruary 2000.
Dodge & CoxDodge & Cox manages a highquality, diversified portfolio ofsecurities that are selected throughfundamental analysis. The firmbelieves that by combiningfundamental research with a long-term investment horizon it is possibleto uncover inefficiencies in thevaluation of market sectors andindividual securities. When thisfundamental research effort iscombined with a disciplined programof risk analysis, attractive returns arepossible over the long-term. To seeksuperior returns, Dodge & Coxemphasizes sector and securityselection, strives to build portfoliosthat have a higher yield than thebroad bond market, and analyzesportfolio and individual security risk.Dodge & Cox was retained by theSBI in February 2000.
Morgan Stanley InvestmentManagementMorgan Stanley (formerly MillerAnderson & Sherrerd) focuses onfour key decisions in structuringportfolios: interest-rate sensitivity,yield-curve exposure, portfolio credit
quality, and portfolio prepaymentrisk. Through a value philosophyand a team approach, the firm seeksto minimize portfolio exposure toextreme market forecasts embeddedin bond yields based on itsproprietary research. The firminitiates positions when it believesthey are relatively cheap, and holdsthem until value diminishes or untilsuperior values are found elsewhere.It’s interest rate and yield-curvestrategy is driven by a proprietaryterm-structure which assessesTreasury yields in terms of themarket’s inflation, economic growth,and risk premium expectations. Valueis added in the corporate sector byselecting the most attractivecorporate bonds and controllingcredit risk through broaddiversification and strict positionlimits. Mortgage securities are oftenused to replace U.S. Treasuries inportfolios, and the firm hassignificant expertise in managing theprepayment risks of mortgages.Morgan Stanley was retained by theSBI in July 1984.
Western Asset ManagementWestern emphasizes the use ofmultiple strategies and active sectorand issue selection, whileconstraining overall interest rate riskrelative to the benchmark. Multiplestrategies are proportioned so thatresults do not depend on one or twoopportunities, and no single adversemarket event would have anoverwhelming effect. This approachadds consistent value over time andcan reduce volatility. Long termvalue investing is Western Asset’sfundamental approach. In makingtheir sector decision, the firm seeksout the greatest long-term value byanalyzing all fixed income marketsectors and their economicexpectations. Individual issues areidentified based on relative credit
strength, liquidity, issue structure,event risk, covenant protection, andmarket valuation. Western believesthat successful interest rateforecasting is extremely difficult toaccomplish consistently andconsequently keeps portfolioduration within a narrow bandaround the benchmark. Western wasretained by the SBI in July 1984.____________________________
Semi-Passive
BlackRock Financial ManagementBlackRock manages a semi-passiveindex portfolio that closely tracks theLehman Aggregate. BlackRock’sstrategy is a controlled-duration,sector rotation style, which can bedescribed as active management withtighter duration, sector, and qualityconstraints. BlackRock seeks to addvalue through: 1) controllingportfolio duration within a narrowband relative to the benchmark,2) relative value sector/sub-sectorrotation and security selection,3) rigorous quantitative analysis ofthe valuation of each security and ofthe portfolio as a whole, 4) intensecredit analysis and review, and 5) thejudgment of experienced portfoliomanagers. Advanced risk analyticsmeasure the potential impact ofvarious sector and security strategiesto ensure consistent value added andcontrolled volatility. BlackRock wasretained by the SBI in April 1996.
Goldman Sachs Asset ManagementGoldman manages a semi-passiveportfolio that closely tracks theLehman Aggregate. Goldmanmanages the portfolio within a risk-controlled framework. The firmrelies primarily on sector allocationand security selection strategies togenerate incremental return relativeto the benchmark. To a lesser degree,term structure and highly controlled
Investment Manager Summaries
62
interest rate anticipation strategiesare also implemented. Portfolios arediversified among various sectorsand individual securities. Goldmancombines long-term strategicinvestments with short-term tacticaltrading opportunities. Strategicinvestments are based onfundamental and quantitative sectorresearch and seek to optimize thelong-term risk/return profile ofportfolios. Tactical trades betweensectors and securities within sectorsare implemented to take advantage ofshort-term market anomalies.Goldman was retained by the SBI inJuly 1993.
Lincoln Capital ManagementCompanyLincoln manages a semi-passiveportfolio that closely tracks theLehman Aggregate. Lincoln’sprocess relies on a combination ofquantitative tools and activemanagement judgment. Explicitquantification and control of risks areat the heart of their investmentprocess. Lincoln uses proprietary riskexposure analysis to analyze 25interest rate factors, and over 43spread-related factors, includingthose relating to credit quality, sectorclassification and sub-sectorrepresentations. Lincoln analyzesevery bond in the index for allrelevant factors, and capitalizationweights the results to calculate indexlevel risk exposures. For eachinterest rate factor, the portfolio isvery closely matched to the index toensure that the portfolio earns thesame return as the index for anychange in interest rates. For eachspread factor, the portfolio candeviate slightly from the index as ameans of seeking value-added.Setting active risk exposures thatmust fall within pre-establishedlimits controls risk. To control creditrisk, corporate holdings arediversified across a large number of
issues. Lincoln was retained by theSBI in July 1988.
Portfolio statistics for each of thebond managers can be found inthe Statistical Data section of thisreport.____________________________
AlternativeInvestment Managers
Private Equity
Adams Street PartnersFunds: Venture Partnership
Acquisition Fund IVenture Partnership Acquisition Fund II
Adams Street (formerly BrinsonPartners) Venture PartnershipAcquisition Funds I and II wereformed in 1988 and 1990,respectively. The limited partnershipsare currently selling remaining fundinvestments. Fund I and II investexclusively in secondary venturecapital limited partnership interestswhich are sold by investors who, fora variety of reasons, have decided tosell some or all of their venturecapital holdings. Adams StreetPartners is based in Chicago, Illinois.
Blackstone GroupFunds: Blackstone Capital Partners
Fund IIBlackstone Capital Partners Fund IV
Blackstone Capital Partners Funds IIand IV are limited partnershipswhich were formed in 1993 and2002, respectively and have ten yearterms. Based in New York, the fundswill invest in a variety of privateequity transactions. The 1993 Fundis currently liquidating its assets.
Blum CapitalFunds: BLUM Strategic Partners
BLUM Strategic Partners IIBLUM Strategic Partners, L.P., andBLUM Strategic Partners II wereorganized in 1998 and 2001respectively, and have ten year terms.Based in San Francisco, the fundswill focus on value-oriented privateand public equity investmentslocated primarily in the U.S.
ChiCorp Management, Inc.Funds: Banc Fund IV
Banc Fund VBanc Fund IV was formed in 1996and has an eight year term. Fund Vwas formed in 1998 and has a nineyear term. Based in Chicago, Illinois,the funds will invest primarily in sub-regional banks, located primarily inthe Midwest, which havedemonstrated above average growthand are likely acquisition targets.
Contrarian Capital ManagementFund: Contrarian Capital Fund IIContrarian Capital Fund II wasformed in 1997 with a term of 7years. Based in Greenwich, CT thefund focuses on investments indistressed debt securities.
Coral Group Inc.Funds: Coral Partners II
Coral Partners IVCoral Partners V
Coral Partners II, IV and V areMinnesota-based venture capitallimited partnerships managed by theCoral Group. These funds maketechnology and healthcare venturecapital investments. They wereformed in 1991, 1994 and 1998,respectively, and have eleven yearterms. Funds II and IV are currentlyselling remaining assets.
Investment Manager Summaries
63
Crescendo VenturesFunds: Crescendo Venture Fund II
Crescendo Venture Fund IIICrescendo Venture Fund IV
Crescendo Venture Funds II, III andIV were organized in 1997, 1999 and2000 respectively and have ten yearterms. Based in Minneapolis,Minnesota, the funds will pursueopportunistic venture capitalinvestments throughout the U.S. withan emphasis on Minnesota and theMidwest.
CVC ManagementFund: Citigroup Venture
Capital Equity PartnersCitigroup Venture Capital EquityPartners was formed in 2001 to makeprivate equity investments in adiversified, global portfolio ofcompanies. Based in New York, thefund has a term of 13 years.
CSFB Merchant BankingFund: DLJ Merchant Banking
Partners IIIDLJ Merchant Banking Partners IIIwas formed in 2000 with a term often years. Based in New York withoffices worldwide, the Fund’sinvestments will involve a variety oftransactions, including leveraged andunleveraged acquisitions,recapitalizations, restructurings,workouts, expansion financings andother, similar situations.
CSFB Strategic PartnersFunds: DLJ Strategic Partners
CSFB Strategic Partners IIDLJ Strategic Partners and CSFBStrategic Partners II were formed in2001 and 2003 with terms of 10years each for the purpose ofinvesting in secondary private equitylimited partnership interests whichare sold by investors who, for avariety of reasons, have decided to
liquidate all or a portion of theirprivate equity holdings.
DSV Management Ltd.Fund: DSV Partners IVDSV Partners IV limited partnershipwas formed in 1985 and is currentlyin liquidation. DSV Partners IV is thefourth venture fund to be managed byDSV Management Ltd. since thefirm’s inception in 1968. The firmhas offices in Princeton, New Jersey,and California. DSV focuses on start-up and early stage investments.
Fox Paine and CompanyFunds: Fox Paine Capital Fund I Fox Paine Capital Fund IIFox Paine Capital Funds I and IIwere formed in 1998 and 2000 andhave ten year terms. Based in FosterCity, CA, the funds focus on privateequity investments in middle marketoperating businesses in a widevariety of industries.
Golder, Thoma, Cressey and RaunerFunds: Golder, Thoma and Cressey
Fund IIIGolder, Thoma and Cressey
Fund IVGolder, Thoma and Cressey
Fund VBased in Chicago, Golder, Thomaand Cressey Funds III, IV and V areventure capital limited partnershipsand were formed in 1987, 1993 and1996, respectively. Fund III and IV iscurrently in liquidation. The fundsinvest in growing private businesses,find and build companies infragmented industries and invest insmall leveraged buyouts. In addition,each fund is diversifiedgeographically and by industry.
GTCR Golder RaunerFunds: GTCR Golder Rauner
Fund VIGTCR Golder Rauner Fund VII
GTCR Golder Rauner Funds VI andVII, formed in 1998 and 2000, arefunds of a successor firm to theprivate equity firm of Golder,Thoma, Cressey and Rauner. TheSBI has several investments withGolder, Thoma, Cressey and Rauner.The funds have ten year terms. Basedin Chicago, the funds focus primarilyon a wide variety of private equityinvestments in consolidating andfragmented industries.
Goldman Sachs Capital PartnersFund: GS Capital Partners 2000GS Capital Partners 2000 wasformed in 2000 by Goldman SachsAdvisors. Based in New York, thefund will focus on investments in theU.S. and internationally in four areas:merchant banking,telecommunications, broadband, andtechnology. The fund has anexpected term of ten years.
Goldner Hawn Johnson and MorrisonFund: GHJM Marathon Fund IVGHJM Marathon Fund IV wasorganized in 1998 and has a 10 yearterm. Based in Minneapolis, the fundwill pursue primarily middle marketprivate equity investments located inthe midwest and other parts of theU.S.
Hellman and FriedmanFunds: Hellman and Friedman III
Hellman and Friedman IVHellman and Friedman V
Hellman and Friedman III, IV, and Vwere organized in 1994, 2000 and2004 and have ten year terms. Basedin San Francisco, the funds willpursue opportunistic private equity
Investment Manager Summaries

64
investments located in the U.S. andinternationally.
Kohlberg, Kravis, Roberts & Co.(KKR)Funds: KKR 1986 Fund
KKR 1987 FundKKR 1993 FundKKR 1996 FundKKR Millennium Fund (2001)
KKR’s Funds are structured aslimited partnerships. The fundsinvest in large leveraged buyouts butmay include other types ofinvestments as well. Thepartnerships’ portfolio companies areoften mature, low technologycompanies with very diversifiedoperations. Kohlberg, Kravis,Roberts and Co. operates offices inNew York and San Francisco. Thefunds were formed in the years citedabove and have terms of twelveyears. The 1986 and 1987 Fund arebeing liquidated.
Matrix PartnersFund: Matrix Partners IIIMatrix Partners III is a venturecapital limited partnership that wasformed in 1990. The fund isundergoing an orderly liquidation ofholdings. Investment emphasis is onhigh-technology firms in the earlyand expansion stages of corporatedevelopment.
Piper Jaffray VenturesFunds: Piper Jaffray Healthcare
Fund IIPiper Jaffray Healthcare Fund IIIPiper Jaffray Healthcare Fund IV
Piper Jaffray Healthcare Funds II,III, and IV were organized in 1997,1999 and 2003, respectively, with tenyear terms. Based in Minneapolis,Minnesota, the funds will focus on ageographically diverse portfolio of
healthcare venture capitalinvestments.
Silver Lake PartnersFund: Sliver Lake Partners IISilver Lake Partners II was formed in2003, with a term of 12 years. Withoffices in New York and Menlo Park,the fund will focus primarily onlarge-scale private equity investing intechnology companies.
Smith Barney Venture Corp.Fund: First Century IIIFirst Century III was formed in 1984.It is structured as a limitedpartnership and is in the process ofliquidating its holdings. The generalpartner and manager of thepartnership is Smith Barney VentureCorp., a subsidiary of Smith BarneyHarris Upham and Co. Smith BarneyVenture has offices in New York andSan Francisco. This is the third fundformed by the firm since 1972. Thepartnership invests primarily in earlystage, high technology companiesdiversified by location and industrygroup.
Stamps, Woodsum and Co.Funds: Summit Ventures I
Summit Ventures IISummit Ventures V
Summit Ventures I, II and V arelimited partnerships formed in 1986,1988 and 1998. Fund I and II arebeing liquidated. The funds wereformed by Stamps, Woodsum & Co.,the managing general partners of thefund. Stamps and Woodsum focus onprofitable, expansion stage firms thathave not yet received any venturebacking. The majority of thepartnership investments are in hightech firms. Investments arediversified by location and industrytype.
Thoma Cressey Equity PartnersFunds: Thoma Cressey Fund VI
Thoma Cressey Fund VIIThoma Cressey is one of twosuccessor firms to the private equityfirm of Golder, Thoma, Cressey andRauner. The SBI has severalinvestments with Golder, Thoma,Cressey and Rauner. Thoma CresseyFund VI, formed in 1998, and ThomaCressey Fund VII, formed in 2000,have ten year terms. Based inChicago, the funds focus primarilyon a wide variety of private equityinvestments in consolidating andfragmented industries.
Thomas, McNerney & PartnersFund: Thomas, McNerney & PartnersBased in Minneapolis, withadditional offices in New York andSan Francisco, Thomas, McNerney& Partners was formed in 2002 tomake venture capital investments inall stages of development and acrossall sectors of the health care industry.The Fund has an expected term of 10years.
T. Rowe PriceT. Rowe Price, a Baltimore-basedmoney management firm, wasselected to manage stockdistributions from the SBI’s venturecapital limited partnerships. T. RowePrice has extensive researchcapabilities in the smallcapitalization company area. Inaddition, the firm has a large tradingstaff with particular expertise in thetrading of small capitalization andilliquid stocks.
Vestar Capital PartnersFund: Vestar Capital Partners IVVestar Capital Partners IV is alimited partnership that was formedin 1999 and has a ten year term.Based in New York, the fund will
Investment Manager Summaries

65
invest primarily in a number ofprivate middle market companies.
E.M. Warburg Pincus & Co., Inc.Funds: Warburg, Pincus Ventures
Warburg Pincus EquityPartners
Warburg, Pincus PrivateEquity Partners VIII
Warburg Pincus is based in NewYork, New York. These funds willinvest private equity in a wide varietyof businesses located domesticallyand abroad. The SBI committed tothe first fund in 1994, the secondfund in 1998, and the third fund in2002. The funds have 12 year terms.
Welsh, Carson, Anderson and StoweFunds: Welsh, Carson, Anderson
and Stowe Fund VIIIWelsh, Carson, Anderson and Stowe Fund IX
Welsh, Carson, Anderson and StoweFunds VIII and IX were formed in1998 and 2000 and have twelve yearterms. Based in New York, N.Y., thefunds focus on private equityinvestments in the healthcare andinformation services industries.
William Blair Capital PartnersFund: William Blair Capital
Partners VIIFormed in 2001 with a ten-year term,William Blair Capital Partners VII isbased in Chicago and will seekinvestments in a broad spectrum ofprivate companies at various stagesof development.____________________________
Real Estate
Colony AdvisorsFunds: Colony Investors II
Colony Investors IIIColony Investors II and III areclosed-end commingled real estate
funds managed by Colony CapitalInc. of Los Angeles, CA. The funds’strategy is to invest in undervaluedequity and debt real estate-relatedassets. The SBI committed to Fund IIin 1994 and Fund III in 1998. FundII is in the process of liquidating itsholdings and Fund III will terminatein 2008.
Equity Office Properties TrustFund: Equity Office Properties
Trust (EOP)Equity Office Properties Trust(EOP), based in Chicago, is thesuccessor entity to three Zell/ MerrillLynch Real Estate funds in which theSBI had prior investments. In 1997,the Zell/ Merrill Lynch Real Estatefunds were combined into a singlepublicly traded entity and the SBIreceived shares in EOP. Like theoriginal Zell/Merrill Lynch RealEstate funds, EOP focuses primarilyon office property real estateinvestments located throughout theU.S. As a publicly-traded company,EOP has an indefinite life.
Heitman Advisory Corp. (HAC)Funds: HAC Group Trust II
HAC Group Trust VHAC Group Trusts are closed-endcommingled funds managed by theHeitman Advisory Group. Themajority of the trust investments areequity real estate. The real estateportfolios are diversified by the typeand location of the properties.Heitman manages the trusts’ wholly-owned properties. Heitman Advisoryis based in Chicago. The SBIcommitted to the Group Trusts in1985 and 1991. Both funds are in theprocess of liquidating their holdings.
LaSalle AdvisorsFund: LaSalle Income Parking
FundThe Income Parking Fund is aclosed-end commingled fundmanaged by LaSalle Advisors ofChicago, Illinois. The fund’s mainstrategy is to acquire unleveragedparking facilities to maximize currentreturn to the investors. The SBIcommitted to the Fund in 1991. Thefund is expected to terminate in2005.
Morgan Stanley (Lend Lease)Fund: Prime Property FundPrime Property Fund was formed in1973 by the New York-based LendLease Real Estate Group, Inc.Morgan Stanley acquired themanagement rights in 2003. Theaccount is an open-end commingledreal estate fund and the SBI’scommitment was made in 1981. Thefund has no termination date andinvestors retain the option towithdraw all or a portion of theirinvestment. The fund makes equityinvestments in existing real estateand is diversified by location andproperty type. Management of thefund’s properties is contracted tooutside firms or is conducted by jointventure partners.
TA Associates RealtyFund: TA Realty Associates
Fund IIITA Realty Associates Fund IVTA Realty Associates Fund VTA Realty Associates Fund VITA Realty Associates Fund VII
TA Realty Associates Funds III, IV,V, VI and VII are closed-end,commingled real estate fundsmanaged by TA Associates Realty of
Investment Manager Summaries

66
Boston, MA. The funds invest insmall to medium sized propertiesgenerally diversified by location andtype. On-site management ofproperties is contracted to outsidefirms. The SBI committed to thefunds in 1994, 1997, 1999, 2002, and2004 respectively. Each fund has aten year term.
UBS Realty Investors Fund:RESA
Real Estate Separate Account(RESA) is an open-end commingledreal estate fund managed by UBSRealty, acquired from Aetna LifeInsurance Company. The fund wasformed in 1978 and the SBI’scommitment was made in 1982. Thefund has no termination date;investors have the option to withdrawall or a portion of their investments.RESA invests primarily in existingequity real estate. Investments arediversified by location and type ofproperty. On-site management ofproperties is contracted to outsidefirms or conducted by a joint venturepartner.____________________________
Resource Funds
Apache CorporationFund: Apache Acquisition Net
Profits InterestApache Corporation is a Houstonbased oil and gas company. ApacheAcquisition Net Profits Interest is aprivate placement that was formed in1986 to acquire a non-operatinginterest in the net profit generated byoil and gas properties acquired in1986 from Occidental PetroleumCompany. The fund will remain ineffect throughout the producing lifeof the properties.
First Reserve Corp.Funds: AMGO I
AMGO IIFirst Reserve VFirst Reserve VIIFirst Reserve VIIIFirst Reserve IXFirst Reserve X
American Gas and Oil (AMGO)funds were formed in 1981, 1983,1990, 1996, 1998, 2001, and 2003respectively, and are structured aslimited partnerships. Funds I, II andV are currently undergoing anorderly liquidation of holdings. Theother funds have ten year terms, afterwhich they will sell remaining fundinvestments over, typically, a periodof years. The general partner andmanager of the funds is First ReserveCorp. The general partner’s long-term investment strategy is to creatediversified portfolios of oil and gasinvestments.
Simmons & CompanyFunds: OFS Investments, II
OFS Investments, IIIOFS Investments, IV
The Funds serve as vehicles forinvestment in the oil field service(OFS) and equipment industry. TheGeneral Partner is located inHouston, Texas. Fund II was formedin 1992, Fund III was formed in1994 and Fund IV was formed in1998. All funds have a 10 year term.Funds II and III are liquidating theirholdings.
T. Rowe PriceT. Rowe Price, a Baltimore-basedmoney management firm, wasselected to manage stockdistributions from the SBI’s resourcelimited partnerships. T. Rowe Pricehas extensive research capabilities inthe small capitalization companyarea. In addition, the firm has a large
trading staff with particular expertisein the trading of small capitalizationand illiquid stocks.
____________________________
Yield-Oriented
BlackRock Financial ManagementFund: Carbon CapitalCarbon Capital was formed in 2001and has an eight year term. Based inNew York, the fund will focus onmezzanine real estate loans securedby commercial property assets,primarily in the U.S.
Capital Trust, Inc.Fund: CT Mezzanine Partners IICT Mezzanine Partners II wasformed in 2001 with a six-year term.The fund is based in New York andplans to make mezzanine debt andother high yield investments incommercial real estate assets andoperating companies locatedprimarily in the United States.
Churchill Capital, Inc.Fund: Churchill Capital Partners IIChurchill Capital Partners II wasformed in 1992 and has a twelve yearterm. Based in Minneapolis,Minnesota, the fund providessubordinated debt to establishedsmall and medium-sized companies.
Citicorp Capital Investors, Ltd.Funds: Citicorp Mezzanine
Partners IICiticorp Mezzanine Partners III
Citicorp Mezzanine Funds arelimited partnerships formed in 1994and 1999 by Citicorp CapitalInvestors Ltd. of New York, NewYork. The Funds will invest in abroad range of transactions utilizing
Investment Manager Summaries

67
subordinated debt and equitysecurities. The Funds have expectedterms of 10 years.
CSFB Investment PartnersFund: DLJ Investment Partners IIDLJ Investment Partners II is alimited partnership formed in 1999with an expected term of ten years.Based in New York, the Fund willinvest in a variety of securities,including subordinated debt withwarrants, preferred stock withwarrants, common stock or othersecurities, including interests in jointventures.
Equinox Investment PartnersFund: KB Mezzanine Fund IIKB Mezzanine Fund II is a limitedpartnership formed in 1994 byKleinwort Benson Group, a leadingLondon-based merchant bankingfirm. In 1996, the fund managerreorganized and changed its name toEquinox Investment Partners. Fund IIinvests in a broad range oftransactions including utilizingsubordinated debt and equitysecurities. The SBI committed to thefund in 1994. The fund has an 8 yearterm and is currently liquidatinginvestments.
GMAC, L.L.C.Funds: Institutional Commercial
Mortgage Fund IIInstitutional Commercial Mortgage Fund IIIInstitutional Commercial Mortgage Fund IVInstitutional Commercial Mortgage Fund V
Institutional Commercial MortgageFunds II, III, IV and V are fundsformed in 1995, 1996, 1997, and1999 respectively, with ten yearterms. Based in Los Angeles,California, the funds focus on
mortgage investment in real estatelocated throughout the U.S. GMACassumed responsibility for the fundsfrom C.B. Richard Ellis in 2001.
Goldman Sachs Mezzanine PartnersFunds: GS Mezzanine Partners II
GS Mezzanine Partners IIIGS Mezzanine Partners II and III arelimited partnerships formed in 2000and 2003, respectively, with expectedterms of ten years. Based in NewYork, the Funds’ investmentobjectives are to achieve long-termcapital appreciation and currentreturns through investments inmezzanine securities. Thesesecurities will principally includefixed income securities such as debtand preferred stock, often with anequity component, such as warrants,options, a convertible feature, orcommon stock associated with thedebt or preferred stock purchase.
GTCR Golder RaunerFund: GTCR Capital PartnersGTCR Capital Partners is a limitedpartnership formed in 1999 with anexpected term of ten years. Based inChicago, the Fund will makemezzanine investments primarily incompanies in which a GTCR EquityFund invests or has invested. GTCRinvests in consolidating, fragmentedindustries by teaming with topexecutives to build companiesthrough acquisition and internalgrowth.
Merit Capital Partners (William BlairMezzanine Partners)Funds: William Blair Mezzanine
Capital Partners IIIMerit Capital Partners IV
William Blair Mezzanine CapitalPartners III and Merit CapitalPartners IV are limited partnershipsformed in 1999 and 2004 with
expected terms of ten years. Basedin Chicago, the Funds will investprimarily in fixed rate subordinateddebt securities. These securitiesgenerally will be purchased with asignificant equity component in theform of warrants, common stock orcontingent interest.
Merit Energy CompanyFunds: Merit Energy Partners B,
C, D and EMerit Energy Partners B, C, D, and Ewere formed in 1996, 1998, 2000and 2003, respectively, and eachfund has an eight year initial term.Based in Dallas, TX, the funds willfocus on resource investments inproducing oil and gas properties.
Prudential Capital GroupFund: Prudential Capital PartnersPrudential Capital Partners L.P. wasformed in 2001 with a 10-year term.Based in Chicago, the Fund willmake mezzanine investments,typically including convertible debt,preferred stock and warrants, with aspecific focus on middle marketcompanies.
Stamps, Woodsum & Co.Funds: Summit Subordinated Debt
Fund ISummit Subordinated Debt Fund IISummit Subordinated Debt Fund III
Summit Subordinated Debt Funds I,II and III are limited partnershipsformed in 1994, 1996, and 2004respectively, with ten year terms. Thefunds were formed by Stamps,Woodsum & Co., the managinggeneral partners of the fund. Thefund will invest in many of the samecompanies as the Summit Venturefunds. Investments by thispartnership will principally take theform of subordinated debt with
Investment Manager Summaries

68
equity features. These yield-oriented investments will providecurrent income over the life of theinvestment with the potential foradditional returns.
T. Rowe PriceT. Rowe Price, a Baltimore-basedmoney management firm, wasselected to manage stockdistributions from the Board’sventure capital limited partnerships.T. Rowe Price has extensive researchcapabilities in the smallcapitalization company area. Inaddition, the firm has a large tradingstaff with particular expertise in thetrading of small capitalization andilliquid stocks.
TCW/Crescent MezzanineFunds: TCW/Crescent Mezzanine
PartnersTCW/Crescent Mezzanine Partners IITCW/Crescent Mezzanine Partners III
TCW/Crescent Mezzanine Partners,L.P., TCW/Crescent MezzaninePartners II, and TCW/CrescentMezzanine Partners III are LosAngeles based limited partnershipsformed in 1996, 1999, and 2001,respectively. The Funds will makemezzanine investments includingsubordinated debt with equityparticipations primarily in profitable,middle market companies. The Fundsare expected to terminate in 2006,2009, and 2011, respectively.
Windjammer Capital InvestorsFund: Windjammer Mezzanine and
Equity Fund IIWindjammer Mezzanine and EquityFund II is a limited partnershipformed in 2000 with an expectedterm of ten years. The Fund willprovide subordinated debt and/or
preferred stock accompanied bywarrants or other forms of equityparticipation and, in certaininstances, common stock to middlemarket companies. The Fund willseek to generate both current incomeand substantial capital gains whilelimiting its risk.
____________________________
Assigned Risk PlanManagers
GE Asset ManagementGE Asset Management manages thestock portfolio for the Assigned RiskPlan. Their strategy is to neutralizethe style bet and focus onfundamental, bottom-up stockselection to add value. This isaccomplished by combining theexpertise of three portfolio managers,each with different styles rangingfrom value to growth, supported by astaff of thirteen industry analysts.Each analyst is responsible for one ormore industries and together provideanalytical coverage across the fullspectrum of industries. The threeportfolios are combined to create awell-diversified portfolio whilemaintaining a style-neutral positionbetween value and growth. GE AssetManagement was retained by the SBIin January 1995.
Voyageur Asset ManagementVoyageur manages the fixed incomeportfolio for the Assigned Risk Plan.The main objective for the portfoliois to provide cash for the payment ofworkers compensation claims on therequired dates. Because of theuncertainty of premium and liabilitycash flows, the fund is investedconservatively. Voyageur uses a top-down approach to bond selection.They focus on sector analysis andsecurity selection. Yield curve andduration analysis are secondary
considerations. Voyageur hasmanaged the bond portfolio sinceJuly 1991.___________________________
Stable ValueManager
Galliard Capital Management, Inc.Galliard Capital Managementmanages the Fixed Interest Accountin the Supplemental InvestmentFund. The stable value fund ismanaged to protect principal andprovide competitive interest ratesusing instruments somewhat longerthan typically found in moneymarket-type accounts. The managerinvests cash flows to optimize yields.The manager invests in high qualityinstruments diversified amongtraditional insurance and bankinvestment contracts and alternativeinvestment contracts with U.S. andnon-U.S. financial institutions. Tomaintain necessary liquidity, themanager invests a portion of theportfolio in its Stable Return Fundand in cash equivalents. The StableReturn Fund is a large, daily pricedfund consisting of a wide range ofstable value instruments that isavailable to retirement plans of allsizes. The firm was retained by theSBI in November 1994.
___________________________
State Deferred CompensationPlan Non-SIF Mutual Fund
Managers
Janus Twenty FundThe fund is an actively managedlarge cap equity option. Theinvestment objective of this fund islong-term growth of capital fromincreases in the market value of thestocks it owns. The fund willconcentrate its investments inholdings of between twenty to thirty
Investment Manager Summaries
69
common stocks. This non-diversified fund seeks to invest incompanies that the portfolio managerbelieves have strong current financialpositions and offer growth potential.The fund was retained by the SBI inJuly, 1999.
Smith Barney Appreciation Y FundThe fund is an actively managedlarge cap equity option. Themanager seeks to build a portfolioproviding low volatility andconsistent returns by investing in ablend of value and growth stocks.The manager selects dividend-payingblue chip stocks at reasonablevaluations and growth stocks thathave been discounted by the market.The manager will hold significantcash positions if the market is judgedto be too pricey. The fund wasretained by the SBI in December2003.
T. Rowe Price Small Cap Stock FundThe small-cap equity option iscurrently offered through the T.Rowe Price Small Cap Stock Fund.The strategy of this fund is to investprimarily in stocks of small tomedium-sized companies that arebelieved to offer either superiorearnings growth or appearundervalued. The fund normallyinvests at least 80% of assets inequities traded in the U.S. over-the-counter market. The manager doesnot favor making big bets on anyparticular sector or any particularstock. The fund’s combination ofgrowth and value stocks offersinvestors relatively more stableperformance compared to other smallcap stock funds. The fund wasretained by the SBI in July, 1999.
Dodge & Cox Balanced FundThe fund offers a mix of stocks andbonds to investors seekingdiversification in one investmentoption. The manager, Dodge & Cox,typically has a mix of 60 percent to65 percent stocks and 30 percent to35 percent bonds, and changes themix between stocks and bondsslowly. The manager follows adisciplined value approach for theequity portfolio and has a largerexposure to mid-cap stocks thanother balanced mutual funds. Themanager emphasizes mid-qualitycorporate bonds and attractivelypriced mortgage-backed securities inthe bond portfolio. The duration ofthe bond portfolio is kept close tothat of the overall bond market. Thefund was retained by the SBI inOctober 2003.
Dodge & Cox Income FundThe objective of this fund is a highand stable rate of current incomewith capital appreciation being asecondary consideration. Thisportfolio is invested primarily inintermediate term, investment-gradequality corporate and mortgagebonds and, to a lesser extent,government issues. While it investsprimarily in the U. S. bond market,the fund may invest a small portionof assets in dollar-denominatedforeign securities. The duration ofthe portfolio is kept near that of thebond market as a whole. The fundwas retained by the SBI in July,1999.
Fidelity Diversified International FundThe goal of this fund is capitalappreciation by investing insecurities of companies locatedoutside of the United States. Whilethe fund invests primarily in stocks, itmay also invest in bonds. Mostinvestments are made in larger
companies located in developedcountries. The manager uses abottom-up stock selection processbased on the extensive fundamentalresearch available from thecompany’s many security analysts.Sector and country weightings arereviewed for risk control. Themanager also uses a rigorouscomputer-aided quantitative analysissupplemented by relevant economicand regulatory factors. The managerrarely invests in currency to protectthe account from exchangefluctuations. The fund was retainedby the SBI in July, 1999.
Vanguard Institutional Index PlusFundThe passively managed fund tracksthe S&P 500 index. This fundattempts to provide investmentresults, before fund expenses, thatparallel the performance of theStandard & Poor’s 500 Index. Thefund invests in all 500 stocks listed inthe S&P 500 index in approximatelythe same proportions as they arerepresented in the index. Themanagers have tracked the S&P500’s performance with a highdegree of accuracy. The fund mayuse futures and options for temporarypurposes, but generally remains fullyinvested in common stocks. Thefund was retained by the SBI in July,1999.
Vanguard Mid Capitalization IndexInstitutional FundThe fund is passively managed totrack the performance of the MSCIUS Mid Cap 450 index, an index ofstocks of medium-size U.S.companies. The manager holdspositions in all companies in theindex and uses futures and optionsfor handling cash needs. The fundwas retained by the SBI in January2004.
Investment Manager Summaries

70
Vanguard Balanced Index FundInstitutionalThe fund portfolio provides adiversified portfolio of stocks andbonds by investing in a mix of 60percent stocks and 40 percent bonds.The manager does not change theasset mix. The fund is passivelymanaged with the equity portfolioinvested to track the returns of theWilshire 5000 index, a broad marketindex encompassing stocks of allsizes from the vary large to the verysmall, and the bond portfolioinvested to track the returns of theLehman Aggregate Bond index. Thefund was retained by the SBI inDecember 2003.
Vanguard Total Bond Market IndexFund InstitutionalThe fund is passively managed totrack the performance of the LehmanAggregate Bond index. The manageruses an index sampling technique toinvest in investment-grade corporate,U.S. Treasury, mortgage-backed andasset-backed securities of varyingmaturities in order to create aportfolio of intermediate durationlike the Lehman Aggregate. Thefund was retained by the SBI inDecember 2003.
Vanguard Institutional DevelopedMarkets Index FundThe fund is passively managed totrack the returns of the MSCI EAFEindex. The fund is invested in theVanguard European Stock IndexFund and the Vanguard Pacific StockIndex Fund. The fund has minimalexposure to emerging markets. TheEuropean Stock Index Fund tracksthe MSCI Europe Index, acapitalization weighted benchmark ofthe region’s largest stocks andmarkets. The Pacific Stock IndexFund tracks the MSCI Pacific Index,which includes mostly large
Investment Manager Summaries
companies from Japan, Australia,Hong Kong, Singapore and NewZealand. The fund was retained bythe SBI in December 2003.
__________________________
State Deferred CompensationPlan Minnesota Fixed Fund
Managers
Principal LifeThe manager invests in fixed incomesecurities, commercial mortgages,mortgage-backed securities andresidential whole loans, with lesseramounts invested in stock, cashequivalents and direct real estate.The manager relies upon in-houseanalysis and prefers investments thatoffer more call protection. Themanager strongly prefers privateplacements to corporate bonds in thebelief that private placements offerhigher yields and superior protectivecovenants compared to public bonds.A portion of the fixed incomeportfolio is invested in US dollar-denominated foreign corporatebonds. Mortgage-backed bonds areactively managed to prices at orbelow par to reduce prepayment risk.Conservative underwriting standards,small loan sizes and an emphasis onindustrial properties minimizescommercial loan risk.
Minnesota LifeInvestment decisions support anasset/liability match for thecompany’s many product lines. Aconservative investment philosophyuses a number of active and passiveinvestment strategies to managegeneral account assets and cash flow.Assets are primarily invested in awidely diversified portfolio of highquality fixed income investments thatincludes public and private corporatebonds, commercial mortgages,
residential mortgage securities andother structured investment products,providing safety of principal andstable, predictable cash flow to meetliabilities and to invest in andproduce consistent results in allphases of the economic cycle.
Great-West LifeThe Company observes strict asset/liability matching guidelines toensure that the investment portfoliowill meet the cash flow and incomerequirements of its liabilities. Themanager invests in public andprivately placed corporate bonds,government and international bonds,common stocks, mortgage loans, realestate, redeemable preferred stocksand short-term investments. Toreduce portfolio risk, the managerinvests primarily in investment gradefixed maturities rated by third-partyrating agencies or by the manager ifprivate placements. Mortgage loansreflect a broadly diversified portfolioof commercial and industrialmortgages subject to strictunderwriting criteria.

71
The following definitions describe the risk factors that theState Board of Investment (SBI) uses in monitoring itsstock managers. The terms are referred to in the RiskFactor Exposure table that follows this glossary.
SBI analysis of a stock manager’s portfolio, in part, utilizesthe BARRA E3 model. The BARRA model contains anumber of risk factors that the SBI has found to correlatehighly with a manager’s investment style. That is, amanager tends to exhibit consistent exposures to many ofthese risk factors over time. The benchmark constructionprocess includes identifying these persistent exposures andcapturing them in the benchmark portfolio.
Factor exposures are calibrated relative to an estimationuniverse of the top 1,500 stocks ranked by capitalizationplus smaller companies chosen to ensure a reasonablenumber of companies in each industry. An exposure levelof 0 for a particular stock to a particular factor indicatesthat the stock has the same exposure as the capitalization-weighted average of the stocks in the estimation universe.Around that zero exposure, deviations are measured instandard deviation units. Thus, an exposure level of +1indicates that the stock has a greater exposure to the factorthan roughly 68% of the stocks in the estimation universe.
BetaForecasts the sensitivity of a stock’s return to the return onthe market portfolio. The BARRA E3 beta is a forecastedbeta, based on a company’s exposure to a number ofcommon risk factors and industries.
Volatility (Vlty.)Captures relative volatility using measures of both long-term historical volatility and near-term volatility. Otherproxies for volatility, corrections for thin trading andchanges in volatility are also included in this descriptor.
Momentum (Mom.)Indicates common variation in returns related to recentstock price behavior. Stocks that had positive excessreturns in the recent past are grouped separately from thosethat displayed negative excess returns.
SizeMeasures differences in stock returns due to differences inthe market capitalization of companies.
Size Nonlinearity (Size Non.)Describes deviations from linearity in the relationshipbetween returns and a measure of market capitalization.
Trading Activity (Trad. Acvty.)Measures the amount of relative trading in each stock.Stocks that are highly traded are likely to be those withgreater institutional interest. Such stocks may displaydifferent returns behavior compared with those that are notwidely held by institutions.
GrowthUses historical growth and profitability measures to predictfuture earnings growth.
Earnings Yield (E/Y)Combines current and historical earnings-to-price ratioswith a measure of analyst-predicted earnings-to-price.Stocks with similar values of earnings yield behave in asimilar fashion with respect to their returns.
ValueDistinguishes between value stocks and growth stocksusing the ratio of book value of equity to marketcapitalization.
Earnings Variability (Earn. Var.)Measures the variability in earnings and cash flows usingboth historical measures and analyst predictions.
Leverage (Lev.)Indicates the financial leverage of a company using debt-to-total assets and other measures.
Current Sensitivity (Curr. Sens.)Measures the sensitivity of a company’s stock return to thereturn on a basket of foreign currencies.
Dividend Yield (Div. Yld.)Predicts dividend yield using the past history of dividendsand the market price behavior of the stock.
Average Turnover (Avg T/O)Measures the total equity asset sales divided by the averagevalue of the equity assets in the manager’s portfolio. Thereported number represents the median of twelve trailingmonthly calculations.
Equity Allocation (Eqty. Alloc.)Measures the percent of the manager’s total portfolioinvested in common stocks, preferred stocks andconvertible securities.
Stock Manager Risk Factor Exposure Glossary
Statistical Data
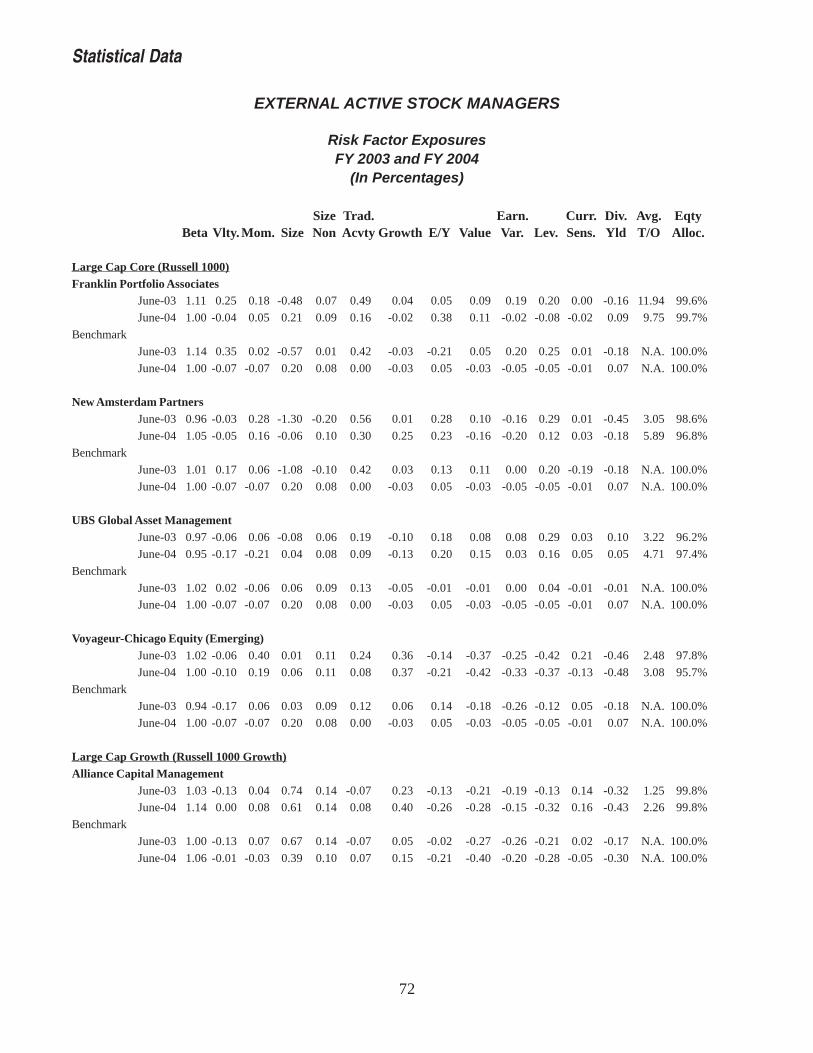
72
Statistical Data
EXTERNAL ACTIVE STOCK MANAGERS
Risk Factor ExposuresFY 2003 and FY 2004
(In Percentages)
Size Trad. Earn. Curr. Div. Avg. EqtyBeta Vlty. Mom. Size Non Acvty Growth E/Y Value Var. Lev. Sens. Yld T/O Alloc.
Large Cap Core (Russell 1000)Franklin Portfolio Associates
June-03 1.11 0.25 0.18 -0.48 0.07 0.49 0.04 0.05 0.09 0.19 0.20 0.00 -0.16 11.94 99.6%
June-04 1.00 -0.04 0.05 0.21 0.09 0.16 -0.02 0.38 0.11 -0.02 -0.08 -0.02 0.09 9.75 99.7%
Benchmark
June-03 1.14 0.35 0.02 -0.57 0.01 0.42 -0.03 -0.21 0.05 0.20 0.25 0.01 -0.18 N.A. 100.0%
June-04 1.00 -0.07 -0.07 0.20 0.08 0.00 -0.03 0.05 -0.03 -0.05 -0.05 -0.01 0.07 N.A. 100.0%
New Amsterdam PartnersJune-03 0.96 -0.03 0.28 -1.30 -0.20 0.56 0.01 0.28 0.10 -0.16 0.29 0.01 -0.45 3.05 98.6%
June-04 1.05 -0.05 0.16 -0.06 0.10 0.30 0.25 0.23 -0.16 -0.20 0.12 0.03 -0.18 5.89 96.8%
Benchmark
June-03 1.01 0.17 0.06 -1.08 -0.10 0.42 0.03 0.13 0.11 0.00 0.20 -0.19 -0.18 N.A. 100.0%
June-04 1.00 -0.07 -0.07 0.20 0.08 0.00 -0.03 0.05 -0.03 -0.05 -0.05 -0.01 0.07 N.A. 100.0%
UBS Global Asset ManagementJune-03 0.97 -0.06 0.06 -0.08 0.06 0.19 -0.10 0.18 0.08 0.08 0.29 0.03 0.10 3.22 96.2%
June-04 0.95 -0.17 -0.21 0.04 0.08 0.09 -0.13 0.20 0.15 0.03 0.16 0.05 0.05 4.71 97.4%
Benchmark
June-03 1.02 0.02 -0.06 0.06 0.09 0.13 -0.05 -0.01 -0.01 0.00 0.04 -0.01 -0.01 N.A. 100.0%
June-04 1.00 -0.07 -0.07 0.20 0.08 0.00 -0.03 0.05 -0.03 -0.05 -0.05 -0.01 0.07 N.A. 100.0%
Voyageur-Chicago Equity (Emerging)June-03 1.02 -0.06 0.40 0.01 0.11 0.24 0.36 -0.14 -0.37 -0.25 -0.42 0.21 -0.46 2.48 97.8%
June-04 1.00 -0.10 0.19 0.06 0.11 0.08 0.37 -0.21 -0.42 -0.33 -0.37 -0.13 -0.48 3.08 95.7%
Benchmark
June-03 0.94 -0.17 0.06 0.03 0.09 0.12 0.06 0.14 -0.18 -0.26 -0.12 0.05 -0.18 N.A. 100.0%
June-04 1.00 -0.07 -0.07 0.20 0.08 0.00 -0.03 0.05 -0.03 -0.05 -0.05 -0.01 0.07 N.A. 100.0%
Large Cap Growth (Russell 1000 Growth)Alliance Capital Management
June-03 1.03 -0.13 0.04 0.74 0.14 -0.07 0.23 -0.13 -0.21 -0.19 -0.13 0.14 -0.32 1.25 99.8%
June-04 1.14 0.00 0.08 0.61 0.14 0.08 0.40 -0.26 -0.28 -0.15 -0.32 0.16 -0.43 2.26 99.8%
Benchmark
June-03 1.00 -0.13 0.07 0.67 0.14 -0.07 0.05 -0.02 -0.27 -0.26 -0.21 0.02 -0.17 N.A. 100.0%
June-04 1.06 -0.01 -0.03 0.39 0.10 0.07 0.15 -0.21 -0.40 -0.20 -0.28 -0.05 -0.30 N.A. 100.0%

73
EXTERNAL ACTIVE STOCK MANAGERS
Risk Factor ExposuresFY 2003 and FY 2004
(In Percentages)
Size Trad. Earn. Curr. Div. Avg. EqtyBeta Vlty. Mom. Size Non Acvty Growth E/Y Value Var. Lev. Sens. Yld T/O Alloc.
Cohen, Klingenstein & MarksJune-03 1.22 0.35 0.13 0.26 0.12 0.28 0.32 -0.22 -0.21 0.04 0.15 0.03 -0.42 0.36 99.5%
June-04 1.15 0.11 0.11 0.27 0.12 0.22 0.35 -0.21 -0.29 -0.16 -0.04 -0.14 -0.48 1.65 89.3%
Benchmark
June-03 1.18 0.31 0.09 -0.12 0.09 0.43 0.10 -0.18 -0.11 0.05 0.07 0.14 -0.35 N.A. 100.0%
June-04 1.06 -0.01 -0.03 0.39 0.10 0.07 0.15 -0.21 -0.40 -0.20 -0.28 -0.05 -0.30 N.A. 100.0%
Holt-Smith & Yates (Emerging)June-03 1.12 0.21 -0.05 -0.21 0.06 0.53 0.27 -0.04 -0.22 -0.28 -0.08 -0.04 -0.63 0.74 96.3%
June-04 1.05 0.00 0.12 -0.05 0.09 0.31 0.21 -0.13 -0.34 -0.38 -0.12 -0.28 -0.55 3.16 98.3%
Benchmark
June-02 1.12 0.18 0.23 -0.58 0.01 0.59 0.28 0.00 -0.13 -0.08 0.03 0.01 -0.55 N.A. 100.0%
June-03 1.06 -0.01 -0.03 0.39 0.10 0.07 0.15 -0.21 -0.40 -0.20 -0.28 -0.05 -0.30 N.A. 100.0%
Zevenbergen Capital (Emerging)June-03 1.28 0.51 0.56 -0.64 -0.08 0.85 0.83 -0.24 -0.18 0.14 0.02 0.13 -0.66 4.83 98.4%
June-04 1.36 0.75 0.86 -0.57 -0.10 0.77 0.90 -0.50 -0.41 0.16 0.05 0.11 -0.71 3.43 97.8%
Benchmark
June-03 1.06 0.08 0.12 0.10 0.02 0.12 0.15 -0.13 -0.25 -0.11 -0.16 0.05 -0.35 N.A. 100.0%
June-04 1.06 -0.01 -0.03 0.39 0.10 0.07 0.15 -0.21 -0.40 -0.20 -0.28 -0.05 -0.30 N.A. 100.0%
Large Capital Value (Russell 1000 Value)Barrow Hanley
June-04 0.81 -0.31 -0.17 -0.07 0.09 -0.04 -0.14 0.42 0.24 -0.04 0.13 -0.11 0.53 6.09 96.4%
Benchmark
June-04 0.93 -0.13 -0.12 0.00 0.06 -0.06 -0.20 0.30 0.34 0.10 0.19 0.02 0.44 N.A. 100.0%
Bay Isle Financial (Emerging)June-03 1.04 0.02 -0.11 0.22 0.11 0.17 0.16 0.14 0.12 0.11 -0.10 -0.05 0.01 7.75 95.9%
June-04 1.07 0.05 -0.03 -0.03 0.10 0.28 0.21 0.18 0.29 0.14 0.13 -0.23 -0.26 5.44 97.5%
Benchmark
June-03 0.97 -0.03 -0.07 -0.23 0.08 0.16 -0.14 0.09 0.08 0.04 0.13 -0.06 0.02 N.A. 100.0%
June-04 0.93 -0.13 -0.12 0.00 0.06 -0.06 -0.20 0.30 0.34 0.10 0.19 0.02 0.44 N.A. 100.0%
Earnest Partners (Emerging)June-03 1.01 -0.02 0.02 -0.37 0.00 0.49 -0.01 0.41 0.18 0.13 1.02 -0.10 -0.13 1.25 98.3%
June-04 1.00 0.00 0.17 -0.24 0.03 0.35 0.06 0.57 0.11 0.14 0.74 -0.19 -0.04 2.09 96.6%
Benchmark
June-03 1.09 0.34 -0.10 -0.91 -0.15 0.38 0.01 -0.09 0.22 0.24 0.35 -0.12 -0.21 N.A. 100.0%
June-04 0.93 -0.13 -0.12 0.00 0.06 -0.06 -0.20 0.30 0.34 0.10 0.19 0.02 0.44 N.A. 100.0%
Statistical Data

74
EXTERNAL ACTIVE STOCK MANAGERS
Risk Factor ExposuresFY 2003 and FY 2004
(In Percentages)
Size Trad. Earn. Curr. Div. Avg. EqtyBeta Vlty. Mom. Size Non Acvty Growth E/Y Value Var. Lev. Sens. Yld T/O Alloc.
Lord Abbett & Co.June-04 0.98 -0.01 -0.19 0.18 0.11 -0.01 -0.29 -0.03 0.13 0.22 -0.02 -0.07 0.16 3.53 97.0%
Benchmark
June-04 0.93 -0.13 -0.12 0.00 0.06 -0.06 -0.20 0.30 0.34 0.10 0.19 0.02 0.44 N.A. 100.0%
LSV Asset Mgmt.June-04 0.95 0.03 0.17 -0.52 -0.04 0.24 -0.26 0.73 0.64 0.27 0.42 0.08 0.43 1.68 99.4%
Benchmark
June-04 0.93 -0.13 -0.12 0.00 0.06 -0.06 -0.20 0.30 0.34 0.10 0.19 0.02 0.44 N.A. 100.0%
Oppenheimer CapitalJune-03 1.01 -0.01 -0.17 0.28 0.12 0.08 0.07 0.28 0.05 -0.01 0.35 0.03 0.17 2.28 88.4%
June-04 0.97 -0.15 -0.28 0.37 0.12 -0.01 -0.05 0.33 0.25 0.02 0.14 0.03 0.20 1.36 94.6%
Benchmark
June-03 1.01 -0.01 -0.21 0.10 0.11 0.17 -0.17 0.11 0.15 0.10 0.31 0.01 0.26 N.A. 100.0%
June-04 0.93 -0.13 -0.12 0.00 0.06 -0.06 -0.20 0.30 0.34 0.10 0.19 0.02 0.44 N.A. 100.0%
Systematic Financial Mgmt.June-04 1.09 0.23 0.22 -0.18 0.04 0.36 -0.05 0.21 0.23 0.34 0.30 0.14 0.06 12.54 95.8%
Benchmark
June-04 0.93 -0.13 -0.12 0.00 0.06 -0.06 -0.20 0.30 0.34 0.10 0.19 0.02 0.44 N.A. 100.0%
Small Cap Growth (Russell 2000 Growth)McKinley Capital
June-04 1.18 1.31 1.91 -2.48 -1.25 0.45 0.48 -0.43 -0.39 0.49 0.55 0.46 -0.80 10.35 93.7%
Benchmark
June-04 1.21 1.24 0.87 -2.59 -1.46 0.18 0.49 -0.60 -0.14 0.61 0.52 -0.04 -0.68 N.A. 100.0%
Next Century Growth (Emerging)June-03 1.21 0.90 1.43 -2.31 -0.96 0.84 1.21 -0.46 -0.32 0.33 0.03 0.09 -0.84 9.49 99.2%
June-04 1.32 1.53 1.68 -2.47 -1.27 0.47 1.00 -0.66 -0.47 0.61 0.18 0.28 -0.87 7.26 99.3%
Benchmark
June-03 1.13 0.74 0.39 -2.18 -0.85 0.31 0.40 -0.32 -0.02 0.42 0.38 -0.13 -0.62 N.A. 100.0%
June-04 1.21 1.24 0.87 -2.59 -1.46 0.18 0.49 -0.60 -0.14 0.61 0.52 -0.04 -0.68 N.A. 100.0%
Turner Investment PartnersJune-04 1.28 1.33 1.63 -2.38 -1.06 0.47 0.59 -0.46 -0.23 0.63 0.45 0.01 -0.83 15.04 97.1%
Benchmark
June-04 1.21 1.24 0.87 -2.59 -1.46 0.18 0.49 -0.60 -0.14 0.61 0.52 -0.04 -0.68 N.A. 100.0%
Statistical Data

75
EXTERNAL ACTIVE STOCK MANAGERS
Risk Factor ExposuresFY 2003 and FY 2004
(In Percentages)
Size Trad. Earn. Curr. Div. Avg. EqtyBeta Vlty. Mom. Size Non Acvty Growth E/Y Value Var. Lev. Sens. Yld T/O Alloc.
Winslow-Small Cap (Emerging)June-03 0.98 0.55 0.72 -2.45 -1.17 0.26 0.83 -0.24 -0.15 0.07 0.17 -0.29 -0.85 4.42 96.5%
June-04 1.11 1.04 1.03 -2.56 -1.42 0.16 1.00 -0.39 -0.39 0.28 0.10 -0.19 -0.89 6.38 61.2%
Benchmark
June-03 1.02 0.78 0.50 -2.66 -1.48 0.23 0.76 -0.21 -0.01 0.27 0.22 -0.11 -0.82 N.A. 100.0%
June-04 1.21 1.24 0.87 -2.59 -1.46 0.18 0.49 -0.60 -0.14 0.61 0.52 -0.04 -0.68 N.A. 100.0%
Small Cap Value (Russell 2000 Value)AEAM/Kenwood (Emerging)
June-04 0.97 0.82 0.95 -2.58 -1.41 -0.08 -0.07 0.24 0.44 0.54 0.90 0.23 -0.47 13.27 98.2%
Benchmark
June-04 0.92 0.70 0.40 -2.64 -1.52 -0.19 -0.30 -0.11 0.78 0.61 0.86 0.04 -0.05 N.A. 100.0%
Goldman SachsJune-04 0.92 0.64 0.52 -2.67 -1.58 -0.10 -0.02 0.09 0.36 0.39 0.78 0.08 -0.21 3.30 97.2%
Benchmark
June-04 0.92 0.70 0.40 -2.64 -1.52 -0.19 -0.30 -0.11 0.78 0.61 0.86 0.04 -0.05 N.A. 100.0%
Hotchkis & WileyJune-04 0.99 0.71 0.38 -2.35 -1.07 0.35 -0.26 0.39 1.10 0.79 1.02 -0.02 -0.34 7.62 96.6%
Benchmark
June-04 0.92 0.70 0.40 -2.64 -1.52 -0.19 -0.30 -0.11 0.78 0.61 0.86 0.04 -0.05 N.A. 100.0%
Martingale Asset Mgmt.June-04 0.91 0.66 0.71 -2.58 -1.38 0.05 -0.25 0.39 0.73 0.51 0.84 0.15 -0.04 9.28 98.9%
Benchmark
June-04 0.92 0.70 0.40 -2.64 -1.52 -0.19 -0.30 -0.11 0.78 0.61 0.86 0.04 -0.05 N.A. 100.0%
Peregrine Capital Mgmt. (Emerging)June-03 0.97 0.62 -0.30 -2.65 -1.44 -0.05 -0.11 0.01 0.78 0.53 0.85 -0.46 -0.28 5.96 97.4%
June-04 0.97 0.72 0.27 -2.56 -1.39 0.02 -0.29 -0.10 0.81 0.72 0.99 -0.12 -0.26 6.61 98.4%
Benchmark
June-03 0.84 0.40 -0.05 -2.61 -1.39 -0.49 -0.23 0.11 0.57 0.46 0.64 -0.17 -0.16 N.A. 100.0%
June-04 0.92 0.70 0.40 -2.64 -1.52 -0.19 -0.30 -0.11 0.78 0.61 0.86 0.04 -0.05 N.A. 100.0%
AGGREGATE (ACTIVE + EMERGING)June-03 1.07 0.13 0.18 -0.23 -0.04 0.26 0.22 -0.03 -0.04 0.04 0.16 0.04 -0.28 5.18 97.2%
June-04 1.04 0.12 0.15 -0.24 -0.12 0.15 0.12 0.08 0.05 0.06 0.11 0.03 -0.14 4.99 96.8%
Benchmark
June-03 1.07 0.18 0.05 -0.30 -0.06 0.24 0.04 -0.06 -0.01 0.05 0.10 0.00 -0.18 N.A. 100.0%
June-04 1.00 0.01 -0.02 -0.02 -0.04 0.00 -0.02 0.02 -0.01 0.00 0.01 -0.01 0.04 N.A. 100.0%
Statistical Data

76
EXTERNAL ACTIVE STOCK MANAGERS
Sector WeightsFY 2003 and FY 2004
(In Percentages)
Cons. Cons. Basic Cap.Cash Non Dur. Dur. Mat. Goods Energy Tech. Trans. Util. Finl. Misc. Total
Large Cap Core (Russell 1000)Franklin Portfolio Associates
June-03 0.36 30.81 3.22 2.70 3.29 5.28 28.68 6.03 16.96 2.65 100.00
June-04 0.33 26.13 7.08 9.05 6.08 8.64 16.67 1.20 1.03 23.79 100.00
Benchmark
June-03 28.40 4.05 5.91 5.21 4.96 26.77 1.82 6.21 15.40 1.27 100.00
June-04 33.87 2.33 4.14 5.94 5.97 17.78 1.21 5.80 21.92 1.04 100.00
New Amsterdam PartnersJune-03 1.39 32.52 6.98 15.20 3.45 2.35 13.21 2.27 6.00 16.61 100.00
June-04 3.15 39.62 2.25 5.09 0.18 5.09 19.88 1.14 2.24 21.37 100.00
Benchmark
June-03 33.18 2.07 6.54 5.80 2.65 16.85 3.09 8.69 20.18 0.95 100.00
June-04 33.87 2.33 4.14 5.94 5.97 17.78 1.21 5.80 21.92 1.04 100.00
UBS Global Asset ManagementJune-03 3.80 28.62 1.26 8.85 7.55 2.09 13.36 3.14 7.72 23.62 100.00
June-04 2.60 37.90 4.58 7.38 1.67 8.06 3.31 6.31 28.18 100.00
Benchmark
June-03 33.18 2.12 3.89 6.08 5.13 18.71 1.82 6.53 21.54 1.00 100.00
June-04 33.87 2.33 4.14 5.94 5.97 17.78 1.21 5.80 21.92 1.04 100.00
Voyageur-Chicago Equity (Emerging)June-03 2.23 44.08 2.24 4.00 5.39 24.01 18.05 100.00
June-04 4.29 42.48 2.67 2.76 4.73 1.46 25.73 15.88 100.00
Benchmark
June-03 42.74 2.01 0.90 6.34 0.09 13.20 2.65 4.00 27.97 1.10 100.00
June-04 33.87 2.33 4.14 5.94 5.97 17.78 1.21 5.80 21.92 1.04 100.00
Large Cap Growth (Russell 1000 Growth)Alliance Capital Management
June-03 0.15 57.86 2.97 18.49 20.53 100.00
June-04 0.19 50.04 3.72 30.42 15.63 100.00
Benchmark
June-03 48.34 0.20 0.93 4.40 2.47 20.02 2.13 4.80 16.60 0.11 100.00
June-04 48.14 1.91 1.81 7.66 1.31 28.13 1.18 0.21 8.44 1.20 100.00
Statistical Data

77
EXTERNAL ACTIVE STOCK MANAGERS
Sector WeightsFY 2003 and FY 2004
(In Percentages)
Cons. Cons. Basic Cap.Cash Non Dur. Dur. Mat. Goods Energy Tech. Trans. Util. Finl. Misc. Total
Cohen Klingenstein & MarksJune-03 0.47 46.47 0.32 1.61 36.07 15.05 100.00
June-04 10.74 40.08 4.56 33.70 10.93 100.00
Benchmark
June-03 41.48 1.41 0.86 2.47 31.39 0.97 0.99 20.10 0.33 100.00
June-04 48.19 1.93 1.75 7.62 1.31 28.08 1.20 0.21 8.51 1.21 100.00
Holt-Smith & Yates (Emerging)June-03 3.67 47.91 4.81 32.63 10.98 100.00
June-04 1.71 50.52 32.57 15.20 100.00
Benchmark
June-03 38.38 1.00 4.32 3.72 32.52 20.07 100.00
June-04 48.14 1.91 1.81 7.66 1.31 28.13 1.18 0.21 8.44 1.20 100.00
Zevenbergen Capital (Emerging)June-03 1.64 48.19 1.32 38.01 10.84 100.00
June-04 2.18 41.92 1.69 42.78 11.42 100.00
Benchmark
June-03 46.77 1.73 2.48 5.13 1.65 28.15 0.88 0.33 11.29 1.60 100.00
June-04 48.14 1.91 1.81 7.66 1.31 28.13 1.18 0.21 8.44 1.20 100.00
Large Capital Value (Russell 1000 Value)Barrow, Hanley
June-03 3.64 27.28 5.10 4.21 14.18 2.15 2.10 9.65 29.00 2.70 100.00
Benchmark
June-04 19.43 2.74 6.49 4.21 10.68 7.30 1.25 11.46 35.56 0.89 100.00
Bay Isle Financial (Emerging)June-03 4.11 30.57 3.94 4.41 2.08 6.59 14.69 2.89 30.73 100.00
Benchmark June-04 2.54 35.98 4.30 2.19 4.35 23.88 26.77 100.00
June-03 32.55 3.77 6.25 4.95 4.94 12.21 2.05 7.80 24.36 1.13 100.00
June-04 19.43 2.74 6.49 4.21 10.68 7.30 1.25 11.46 35.56 0.89 100.00
Earnest Partners (Emerging)June-03 1.73 24.95 1.89 2.20 14.19 7.99 2.90 7.70 36.45 100.00
June-04 3.41 26.39 2.95 1.75 14.21 10.80 1.94 3.85 34.71 100.00
Benchmark
June-03 32.68 5.06 5.41 4.79 4.45 19.57 2.65 7.44 17.32 0.64 100.00
June-04 19.43 2.74 6.49 4.21 10.68 7.30 1.25 11.46 35.56 0.89 100.00
Statistical Data
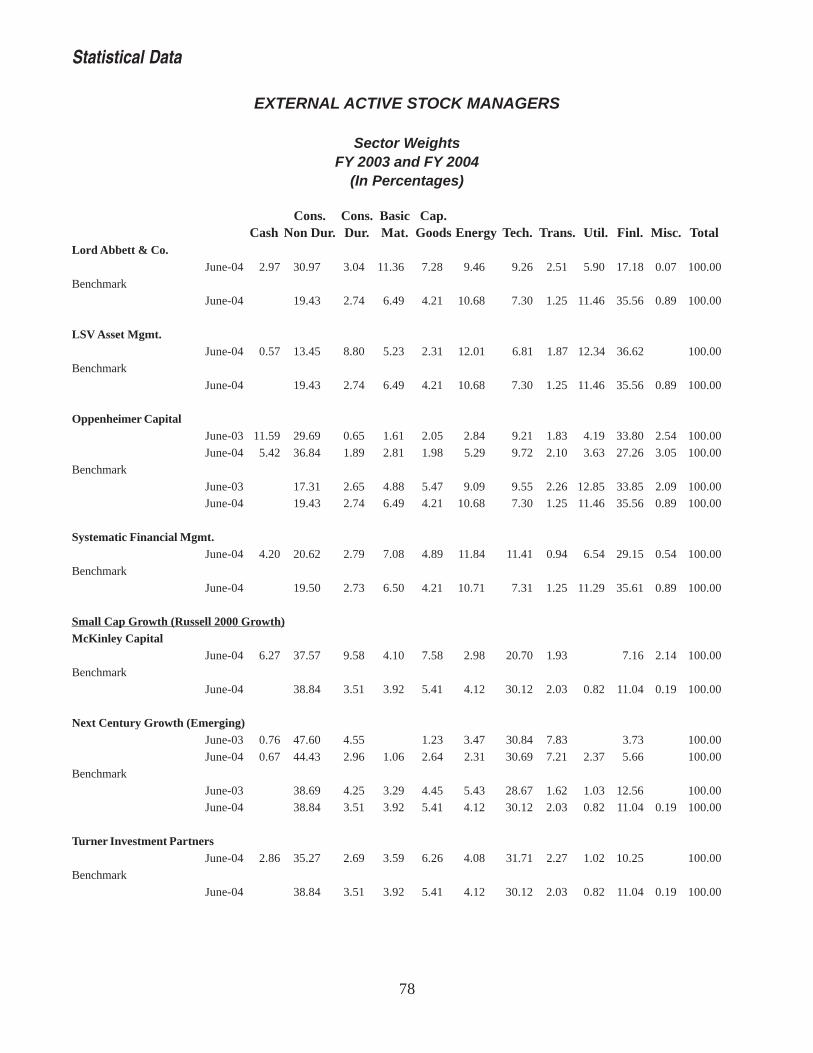
78
EXTERNAL ACTIVE STOCK MANAGERS
Sector WeightsFY 2003 and FY 2004
(In Percentages)
Cons. Cons. Basic Cap.Cash Non Dur. Dur. Mat. Goods Energy Tech. Trans. Util. Finl. Misc. Total
Lord Abbett & Co.June-04 2.97 30.97 3.04 11.36 7.28 9.46 9.26 2.51 5.90 17.18 0.07 100.00
Benchmark
June-04 19.43 2.74 6.49 4.21 10.68 7.30 1.25 11.46 35.56 0.89 100.00
LSV Asset Mgmt.June-04 0.57 13.45 8.80 5.23 2.31 12.01 6.81 1.87 12.34 36.62 100.00
Benchmark
June-04 19.43 2.74 6.49 4.21 10.68 7.30 1.25 11.46 35.56 0.89 100.00
Oppenheimer CapitalJune-03 11.59 29.69 0.65 1.61 2.05 2.84 9.21 1.83 4.19 33.80 2.54 100.00
June-04 5.42 36.84 1.89 2.81 1.98 5.29 9.72 2.10 3.63 27.26 3.05 100.00
Benchmark
June-03 17.31 2.65 4.88 5.47 9.09 9.55 2.26 12.85 33.85 2.09 100.00
June-04 19.43 2.74 6.49 4.21 10.68 7.30 1.25 11.46 35.56 0.89 100.00
Systematic Financial Mgmt.June-04 4.20 20.62 2.79 7.08 4.89 11.84 11.41 0.94 6.54 29.15 0.54 100.00
Benchmark
June-04 19.50 2.73 6.50 4.21 10.71 7.31 1.25 11.29 35.61 0.89 100.00
Small Cap Growth (Russell 2000 Growth)McKinley Capital
June-04 6.27 37.57 9.58 4.10 7.58 2.98 20.70 1.93 7.16 2.14 100.00
Benchmark
June-04 38.84 3.51 3.92 5.41 4.12 30.12 2.03 0.82 11.04 0.19 100.00
Next Century Growth (Emerging)June-03 0.76 47.60 4.55 1.23 3.47 30.84 7.83 3.73 100.00
June-04 0.67 44.43 2.96 1.06 2.64 2.31 30.69 7.21 2.37 5.66 100.00
Benchmark
June-03 38.69 4.25 3.29 4.45 5.43 28.67 1.62 1.03 12.56 100.00
June-04 38.84 3.51 3.92 5.41 4.12 30.12 2.03 0.82 11.04 0.19 100.00
Turner Investment PartnersJune-04 2.86 35.27 2.69 3.59 6.26 4.08 31.71 2.27 1.02 10.25 100.00
Benchmark
June-04 38.84 3.51 3.92 5.41 4.12 30.12 2.03 0.82 11.04 0.19 100.00
Statistical Data

79
EXTERNAL ACTIVE STOCK MANAGERS
Sector WeightsFY 2003 and FY 2004
(In Percentages)
Cons. Cons. Basic Cap.Cash Non Dur. Dur. Mat. Goods Energy Tech. Trans. Util. Finl. Misc. Total
Winslow-Small Cap (Emerging)June-03 3.52 60.50 4.39 4.94 4.99 18.82 0.99 1.83 100.00
June-04 38.83 30.01 8.13 2.31 14.87 1.27 4.59 100.00
Benchmark
June-03 60.89 5.33 3.87 2.43 22.59 1.34 3.55 100.00
June-04 38.84 3.51 3.92 5.41 4.12 30.12 2.03 0.82 11.04 0.19 100.00
Small Cap Value (Russell 2000 Value)AEAM/Kenwood (Emerging)
June-04 1.84 23.35 5.88 11.21 8.34 5.64 10.81 3.22 6.31 22.44 0.96 100.00
Benchmark
June-04 20.12 5.84 11.49 8.65 4.78 9.25 3.04 5.59 30.71 0.53 100.00
Goldman SachsJune-04 2.84 15.50 9.18 11.61 7.28 4.85 11.13 3.18 5.69 28.04 0.70 100.00
Benchmark
June-04 20.12 5.84 11.49 8.65 4.78 9.25 3.04 5.59 30.71 0.53 100.00
Hotchkis & WileyJune-04 3.43 25.80 7.93 14.68 1.07 2.77 14.11 6.86 23.34 100.00
Benchmark
June-04 20.12 5.84 11.49 8.65 4.78 9.25 3.04 5.59 30.71 0.53 100.00
Martingale Asset Mgmt.June-04 1.15 26.16 5.79 9.88 6.90 3.77 6.02 5.16 5.40 28.75 1.02 100.00
Benchmark
June-04 20.12 5.84 11.49 8.65 4.78 9.25 3.04 5.59 30.71 0.53 100.00
Peregrine Capital Mgmt. (Emerging)June-03 2.65 21.92 5.89 10.54 8.12 6.23 14.75 4.04 3.78 22.09 100.00
June-04 1.63 21.77 8.05 15.19 7.79 2.80 10.86 5.33 2.80 23.78 100.00
Benchmark
June-03 21.09 6.11 10.01 7.98 4.61 11.84 2.99 7.16 27.88 0.33 100.00
June-04 20.12 5.84 11.49 8.65 4.78 9.25 3.04 5.59 30.71 0.53 100.00
AGGREGATE (ACTIVE + EMERGING)June-03 2.81 37.87 1.52 3.75 4.56 3.35 21.36 1.39 2.86 19.53 1.00 100.00
June-04 3.17 35.82 3.04 4.83 3.88 4.38 18.14 1.81 3.17 21.19 0.56 100.00
Benchmark
June-03 34.91 2.41 3.69 5.01 4.51 21.94 1.89 5.31 19.47 0.86 100.00
June-04 33.53 2.51 4.41 6.03 5.85 17.92 1.32 5.60 21.84 0.99 100.00
Statistical Data

80
EXTERNAL SEMI-PASSIVE STOCK MANAGERS
Risk Factor ExposuresFY 2003 and FY 2004
(In Percentages)
Size Trad. Earn Curr. Div. Avg EqtyBeta Vty. Mom. Size Non Actvy Growth E/Y Value Var. Lev. Sens. Yld T/O Alloc.
Semi-Passive Managers (Russell 1000)Barclays Global Investors
June-03 0.93 -0.11 -0.02 0.15 -0.03 -0.20 -0.06 0.14 0.02 -0.05 -0.12 -0.01 0.05 3.27 99.3%
Benchmark
June-04 0.99 -0.07 -0.06 0.15 0.06 0.01 -0.04 0.12 -0.02 -0.05 -0.05 -0.02 0.03 6.59 99.2%
Franklin Portfolio AssociatesJune-03 0.93 -0.12 0.01 0.13 0.00 -0.21 -0.04 0.13 0.04 -0.02 -0.10 0.03 0.07 6.20 99.7%
Benchmark
June-04 0.99 -0.08 -0.01 0.21 0.07 0.03 -0.01 0.17 0.04 -0.06 -0.08 -0.01 0.09 6.50 99.7%
J.P. Morgan Investment Mgmt.June-03 0.96 -0.09 -0.03 0.19 0.00 -0.07 0.02 0.08 0.05 -0.04 -0.06 -0.01 0.00 5.40 99.7%
Benchmark
June-04 1.01 -0.08 -0.07 0.25 0.10 0.08 0.00 0.11 0.02 -0.06 -0.02 0.04 0.04 4.11 99.6%
AGGREGATE SEMI-PASSIVE EQUITYJune-03 0.94 -0.11 -0.01 0.16 -0.01 -0.16 -0.03 0.12 0.04 -0.04 -0.09 0.00 0.04 3.74 99.5%
June-04 1.00 -0.08 -0.05 0.20 0.07 0.04 -0.02 0.13 0.01 -0.06 -0.05 0.00 0.05 5.44 99.5%
Benchmark
June-03 0.93 -0.12 -0.05 0.16 -0.04 -0.24 -0.04 0.03 0.02 -0.04 -0.09 -0.01 0.07 N.A. 100.0%
June-04 1.00 -0.07 -0.07 0.20 0.08 0.00 -0.03 0.05 -0.03 -0.05 -0.05 -0.01 0.07 N.A. 100.0%
Statistical Data
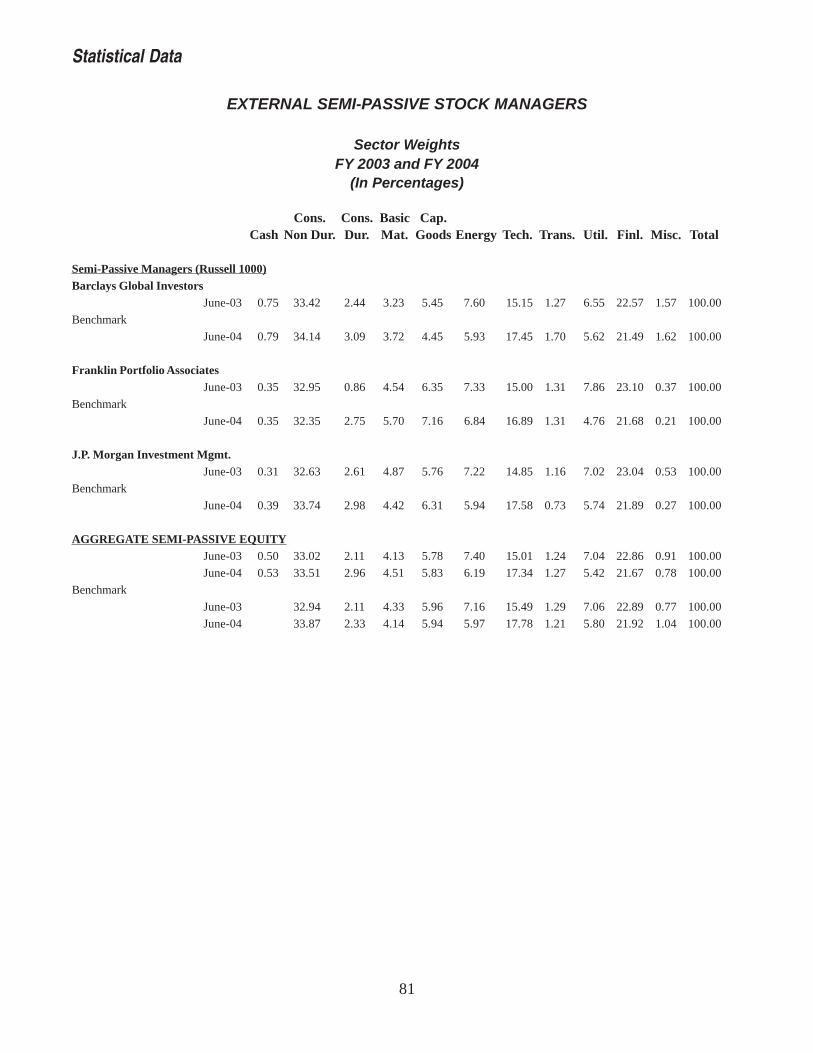
81
EXTERNAL SEMI-PASSIVE STOCK MANAGERS
Sector WeightsFY 2003 and FY 2004
(In Percentages)
Cons. Cons. Basic Cap.Cash Non Dur. Dur. Mat. Goods Energy Tech. Trans. Util. Finl. Misc. Total
Semi-Passive Managers (Russell 1000)Barclays Global Investors
June-03 0.75 33.42 2.44 3.23 5.45 7.60 15.15 1.27 6.55 22.57 1.57 100.00
Benchmark
June-04 0.79 34.14 3.09 3.72 4.45 5.93 17.45 1.70 5.62 21.49 1.62 100.00
Franklin Portfolio AssociatesJune-03 0.35 32.95 0.86 4.54 6.35 7.33 15.00 1.31 7.86 23.10 0.37 100.00
Benchmark
June-04 0.35 32.35 2.75 5.70 7.16 6.84 16.89 1.31 4.76 21.68 0.21 100.00
J.P. Morgan Investment Mgmt.June-03 0.31 32.63 2.61 4.87 5.76 7.22 14.85 1.16 7.02 23.04 0.53 100.00
Benchmark
June-04 0.39 33.74 2.98 4.42 6.31 5.94 17.58 0.73 5.74 21.89 0.27 100.00
AGGREGATE SEMI-PASSIVE EQUITYJune-03 0.50 33.02 2.11 4.13 5.78 7.40 15.01 1.24 7.04 22.86 0.91 100.00
June-04 0.53 33.51 2.96 4.51 5.83 6.19 17.34 1.27 5.42 21.67 0.78 100.00
Benchmark
June-03 32.94 2.11 4.33 5.96 7.16 15.49 1.29 7.06 22.89 0.77 100.00
June-04 33.87 2.33 4.14 5.94 5.97 17.78 1.21 5.80 21.92 1.04 100.00
Statistical Data
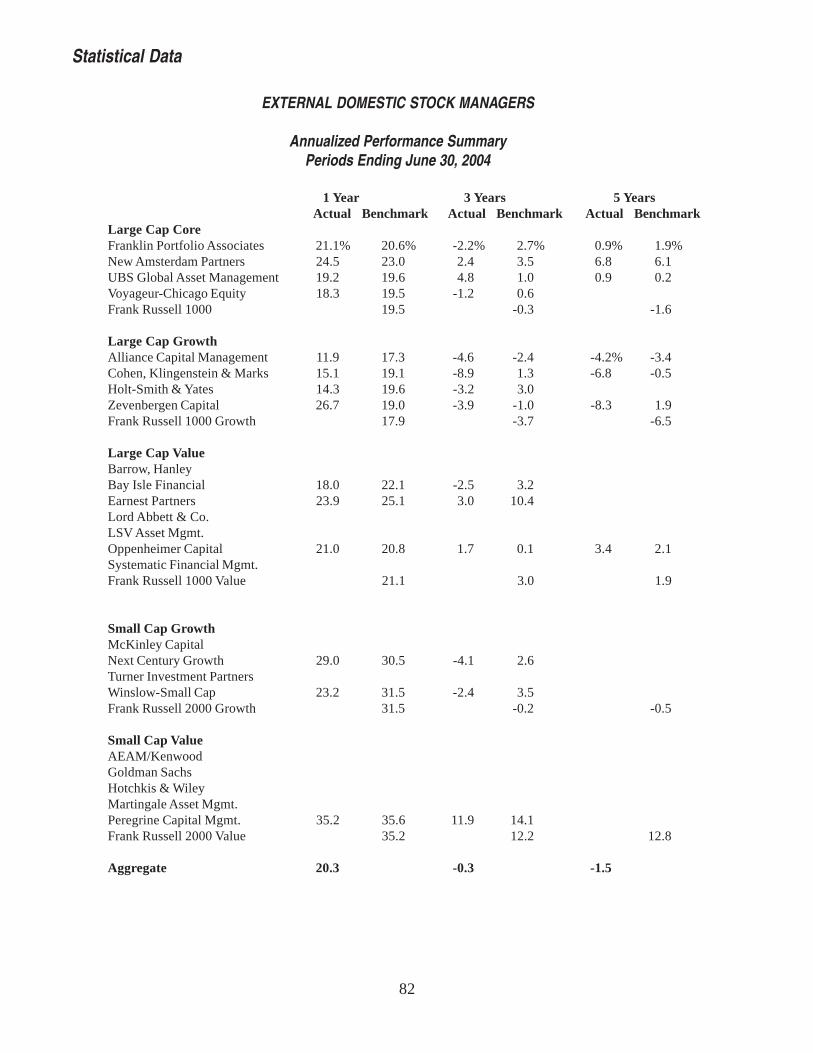
82
EXTERNAL DOMESTIC STOCK MANAGERS
Annualized Performance SummaryPeriods Ending June 30, 2004
1 Year 3 Years 5 YearsActual Benchmark Actual Benchmark Actual Benchmark
Large Cap CoreFranklin Portfolio Associates 21.1% 20.6% -2.2% 2.7% 0.9% 1.9%New Amsterdam Partners 24.5 23.0 2.4 3.5 6.8 6.1UBS Global Asset Management 19.2 19.6 4.8 1.0 0.9 0.2Voyageur-Chicago Equity 18.3 19.5 -1.2 0.6Frank Russell 1000 19.5 -0.3 -1.6
Large Cap GrowthAlliance Capital Management 11.9 17.3 -4.6 -2.4 -4.2% -3.4Cohen, Klingenstein & Marks 15.1 19.1 -8.9 1.3 -6.8 -0.5Holt-Smith & Yates 14.3 19.6 -3.2 3.0Zevenbergen Capital 26.7 19.0 -3.9 -1.0 -8.3 1.9Frank Russell 1000 Growth 17.9 -3.7 -6.5
Large Cap ValueBarrow, HanleyBay Isle Financial 18.0 22.1 -2.5 3.2Earnest Partners 23.9 25.1 3.0 10.4Lord Abbett & Co.LSV Asset Mgmt.Oppenheimer Capital 21.0 20.8 1.7 0.1 3.4 2.1Systematic Financial Mgmt.Frank Russell 1000 Value 21.1 3.0 1.9
Small Cap GrowthMcKinley CapitalNext Century Growth 29.0 30.5 -4.1 2.6Turner Investment PartnersWinslow-Small Cap 23.2 31.5 -2.4 3.5Frank Russell 2000 Growth 31.5 -0.2 -0.5
Small Cap ValueAEAM/KenwoodGoldman SachsHotchkis & WileyMartingale Asset Mgmt.Peregrine Capital Mgmt. 35.2 35.6 11.9 14.1Frank Russell 2000 Value 35.2 12.2 12.8
Aggregate 20.3 -0.3 -1.5
Statistical Data

83
EXTERNAL DOMESTIC STOCK MANAGERS
Annualized Performance SummaryPeriods Ending June 30, 2004
1 Year 3 Years 5 YearsActual Benchmark Actual Benchmark Actual Benchmark
Semi-Passive ManagersBarclays Global Investors 20.2% 19.5% 1.8% 1.1% -1.7% -3.2%Franklin Portfolio Associates 19.1 19.5 0.4 1.1 -3.3 -3.2J.P. Morgan Investment Mgmt. 19.5 19.5 0.0 1.1 -3.3 -3.2Frank Russell 1000 19.5 -0.3 -1.6
Passive ManagerBarclays Global Investors 20.5 20.6 0.0 0.2 -1.4 -1.5Frank Russell 3000 20.5 0.2 -1.1
Aggregate (1)
Capital Markets DataRussell 3000 20.5 0.2 -1.1Wilshire 5000 21.2 0.8 -1.03-Month-Treasury Bills 1.0 1.5 3.1Inflation 3.3 2.1 2.7
(1) Aggregate of all Domestic Stock Managers retained during the time period shown.
Statistical Data

84
The bond manager portfolio statistics glossary is designed todefine terminology the State Board of Investment uses inevaluating a bond manager’s investment philosophy, riskcharacteristics and performance data. The definitions refer tocategories shown in the Portfolio Characteristics table thatfollows this glossary.
Number of Issues (# of Issues)The number of different bond issues held in the manager’sportfolio.
Average Quality Weightings (Avg. Qual.)The average rating given the portfolio’s securities byMoody’s Corp. A security’s rating indicates the financialstrength of its issuer and other factors related to the likelihoodof full and timely payment of interest and principal.
CouponThe annual interest payment received on the manager’s totalportfolio stated as a percent of the portfolio’s face value.
Yield to Maturity (Yield to Mat.)The compounded annualized return that the manager’s totalportfolio would produce if it were held to maturity and allcash flows were reinvested at an interest rate equal to theyield to maturity.
DurationA measure of the average life of the total portfolio. Durationis a weighted average maturity where the time in the futurethat each cash flow is received is weighted by the proportionthat the present value of the cash flow contributes to the totalpresent value (or price) of the total portfolio.
Term to maturity (Term. to Mat.)A measure of the average life of the total portfolio. Term tomaturity is the number of years remaining until the averagebond in the portfolio makes its final cash payment.
Statistical Data
Bond Manager Portfolio Characteristics Glossary
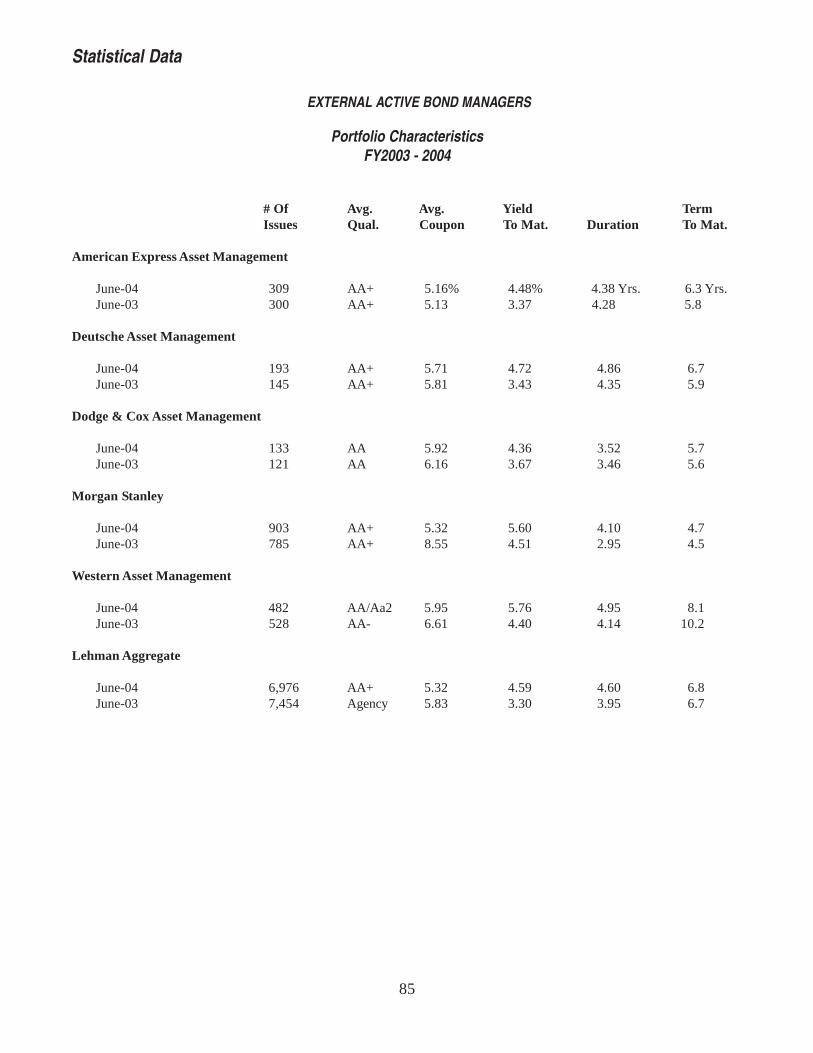
85
EXTERNAL ACTIVE BOND MANAGERS
Portfolio CharacteristicsFY2003 - 2004
# Of Avg. Avg. Yield TermIssues Qual. Coupon To Mat. Duration To Mat.
American Express Asset Management
June-04 309 AA+ 5.16% 4.48% 4.38 Yrs. 6.3 Yrs.June-03 300 AA+ 5.13 3.37 4.28 5.8
Deutsche Asset Management
June-04 193 AA+ 5.71 4.72 4.86 6.7June-03 145 AA+ 5.81 3.43 4.35 5.9
Dodge & Cox Asset Management
June-04 133 AA 5.92 4.36 3.52 5.7June-03 121 AA 6.16 3.67 3.46 5.6
Morgan Stanley
June-04 903 AA+ 5.32 5.60 4.10 4.7June-03 785 AA+ 8.55 4.51 2.95 4.5
Western Asset Management
June-04 482 AA/Aa2 5.95 5.76 4.95 8.1June-03 528 AA- 6.61 4.40 4.14 10.2
Lehman Aggregate
June-04 6,976 AA+ 5.32 4.59 4.60 6.8June-03 7,454 Agency 5.83 3.30 3.95 6.7
Statistical Data

86
EXTERNAL ACTIVE BOND MANAGERS
Sector WeightsFY2003- 2004
(In Percentages)
HighGov’t. Corp. Mtge. ABS Misc. Intl. Yld Cash
American Express Asset ManagementJune 04 31 23 38 1 1 1 0 5June-03 24 22 43 1 0 2 2 6
Deutsche Asset ManagementJune-04 11 30 43 7 7 0 0 2June-03 9 34 31 17 8 0 0 1
Dodge & Cox Asset ManagementJune-04 20 37 41 0 0 0 0 2June-03 13 41 40 0 0 0 0 6
Morgan StanleyJune 04 17 23 35 0 0 0 0 25June-03 13 27 51 0 0 0 0 9
Western Asset ManagementJune 04 32 31 21 4 10 2 0 0June-03 22 36 24 6 10 2 0 0
Lehman AggregateJune-04 35 25 39 1 0 0 0 0June-03 34 27 34 2 3 0 0 0
Abbreviations:Gov’t. Government securities Misc. Miscellaneous or otherCorp. Corporate securities Int’l. Non-dollar securitiesMtge. Mortgage-backed securities High Yld Securities rated below investment gradeABS Asset-backed securities
Statistical Data
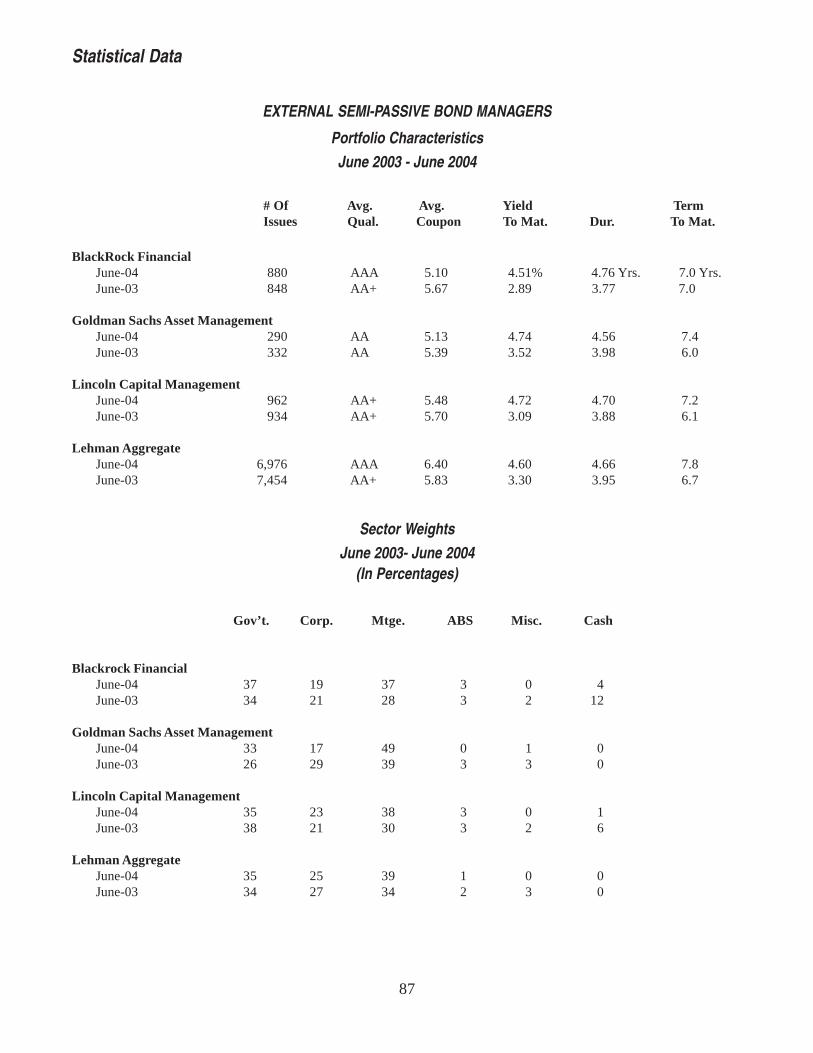
87
Statistical Data
EXTERNAL SEMI-PASSIVE BOND MANAGERS
Portfolio Characteristics
June 2003 - June 2004
# Of Avg. Avg. Yield TermIssues Qual. Coupon To Mat. Dur. To Mat.
BlackRock FinancialJune-04 880 AAA 5.10 4.51% 4.76 Yrs. 7.0 Yrs.June-03 848 AA+ 5.67 2.89 3.77 7.0
Goldman Sachs Asset ManagementJune-04 290 AA 5.13 4.74 4.56 7.4June-03 332 AA 5.39 3.52 3.98 6.0
Lincoln Capital ManagementJune-04 962 AA+ 5.48 4.72 4.70 7.2June-03 934 AA+ 5.70 3.09 3.88 6.1
Lehman AggregateJune-04 6,976 AAA 6.40 4.60 4.66 7.8June-03 7,454 AA+ 5.83 3.30 3.95 6.7
Sector Weights
June 2003- June 2004(In Percentages)
Gov’t. Corp. Mtge. ABS Misc. Cash
Blackrock FinancialJune-04 37 19 37 3 0 4June-03 34 21 28 3 2 12
Goldman Sachs Asset ManagementJune-04 33 17 49 0 1 0June-03 26 29 39 3 3 0
Lincoln Capital ManagementJune-04 35 23 38 3 0 1June-03 38 21 30 3 2 6
Lehman AggregateJune-04 35 25 39 1 0 0June-03 34 27 34 2 3 0

88
EXTERNAL BOND MANAGERS
Annualized Performance SummaryPeriods Ending June 30, 2004
1 Year 3 Years 5 YearsActual Benchmark Actual Benchmark Actual Benchmark
Active ManagersAmerican Express Asset Mgmt. (1) 0.5% 0.3% 5.1% 6.4% 6.2% 6.9%Deutsche 1.0 0.3 7.0 6.4Dodge & Cox 2.0 0.3 7.9 6.4
Morgan Stanley 2.6 0.3 6.5 6.4 7.3 6.9Western Asset Management 3.8 0.3 8.4 6.4 8.7 6.9
Semi-Passive ManagersBlackRock Financial 0.5 0.3 6.6 6.4 7.2 6.9Goldman Sachs Asset Mgmt. 1.5 0.3 6.8 6.4 7.3 6.9Lincoln Capital Management 0.6 0.3 6.6 6.4 7.1 6.9
Aggregate (2) 1.5% 0.3% 6.7% 6.4% 7.3% 6.9%
Capital Markets Data
Lehman Aggregate (3) 0.3% 6.4% 7.3%3 month Treasury Bills 1.0 1.5 3.1Inflation 3.3 2.1 2.7
(1) Prior to 1/1/96, manager had a government/corporate mandate only.
(2) Aggregate of all active and semi-passive managers retained during the time period shown.
(3) Lehman Brothers Aggregate Bond Index was used beginning 7/1/94. Prior to that time, the SalomonBroad Investment Grade Bond Index was used.
Statistical Data

89
INTERNATIONAL EQUITY MANAGERS’ ATTRIBUTIONDEVELOPED MARKETS MANAGERS
Fiscal Year 2004
INVESCOState Street American Britannic UBS Global GlobalGlobal Advisors Express Asset Mgmt. Asset Mgmt. Asset Mgmt.
Local Returns
Country Selection 0.0% -0.7% -0.1% -1.5% -1.6%
Stock Selection 0.2 -5.3 -1.0 -1.7 1.7
Timing 0.2 -0.7 -0.2 -0.8 -0.5
Currency Returns
Currency Effect 0.0 -0.2 0.0 0.0 -0.1
Hedging Activity 0.0 0.0 0.0 -0.3 0.0
Timing -0.2 0.5 0.2 1.5 0.1
Base Return
Total Value Added 0.2% -6.9% -1.2% -3.0% -0.4%
Note: All attribution numbers are based on gross returns, not net returns as found in the ‘front part of the annual report’.
Definitions:Local Returns - The return in local currency for each country in the portfolio relative to the benchmark.
Country Selection - The portion of return that can be attributed to over/underweighting countries relative to the benchmark.Country selection will be positive if the manager has overweighted countries that performed well and underweightedcountries that did not perform well.
Stock Selection - The portion of return that can be attributed to the selection of securities within a country relative to thebenchmark. Stock selection will be positive if a portfolio’s local country return is greater than the benchmark.
Currency Returns - The relative difference between the base currency return and the local currency return.
Currency Effect - The difference between the currency effect of a manager’s unhedged portfolio and the benchmark that iscaused by the timing of purchases and sales of securities and spots to cover them.
Hedging Effect - The difference between the currency return of the manager’s hedged portfolio and the currency return ofthe unhedged portfolio.
Base Return –The return after conversion from local currencies to U.S. dollars.
Total Value Added - The difference between the portfolio’s base return and the benchmark’s base return.
Statistical Data
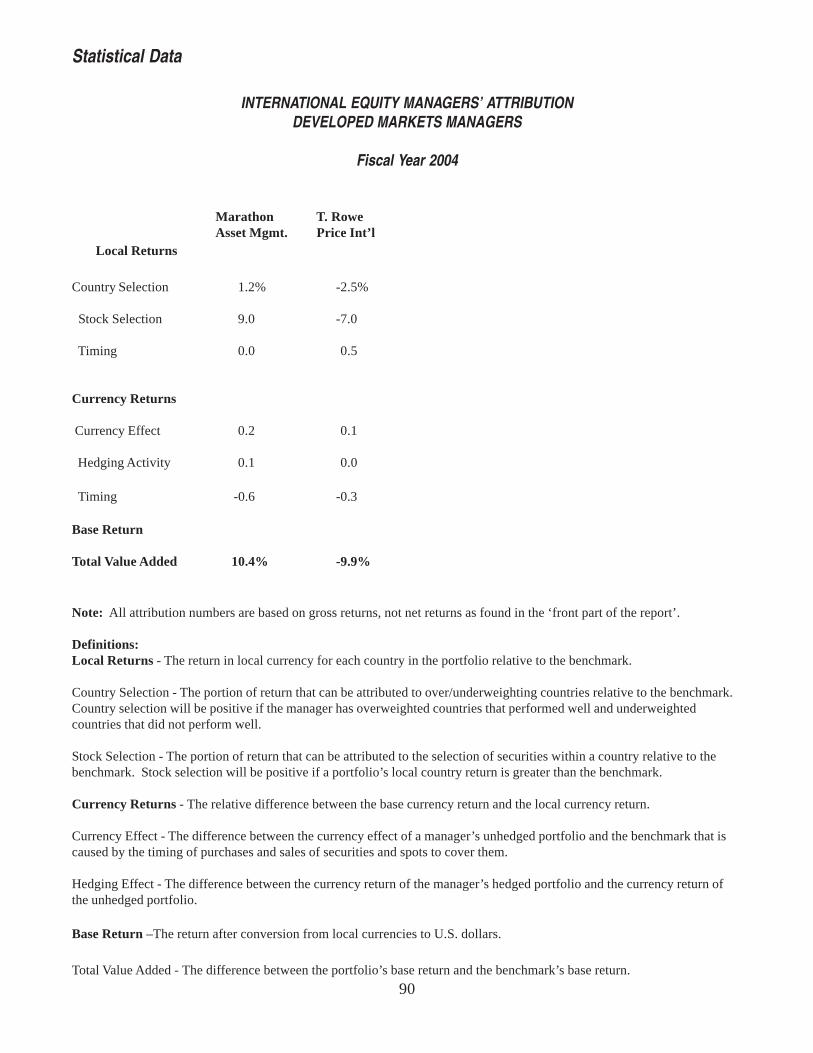
90
INTERNATIONAL EQUITY MANAGERS’ ATTRIBUTIONDEVELOPED MARKETS MANAGERS
Fiscal Year 2004
Marathon T. RoweAsset Mgmt. Price Int’l
Local Returns
Country Selection 1.2% -2.5%
Stock Selection 9.0 -7.0
Timing 0.0 0.5
Currency Returns
Currency Effect 0.2 0.1
Hedging Activity 0.1 0.0
Timing -0.6 -0.3
Base Return
Total Value Added 10.4% -9.9%
Note: All attribution numbers are based on gross returns, not net returns as found in the ‘front part of the report’.
Definitions:Local Returns - The return in local currency for each country in the portfolio relative to the benchmark.
Country Selection - The portion of return that can be attributed to over/underweighting countries relative to the benchmark.Country selection will be positive if the manager has overweighted countries that performed well and underweightedcountries that did not perform well.
Stock Selection - The portion of return that can be attributed to the selection of securities within a country relative to thebenchmark. Stock selection will be positive if a portfolio’s local country return is greater than the benchmark.
Currency Returns - The relative difference between the base currency return and the local currency return.
Currency Effect - The difference between the currency effect of a manager’s unhedged portfolio and the benchmark that iscaused by the timing of purchases and sales of securities and spots to cover them.
Hedging Effect - The difference between the currency return of the manager’s hedged portfolio and the currency return ofthe unhedged portfolio.
Base Return –The return after conversion from local currencies to U.S. dollars.
Total Value Added - The difference between the portfolio’s base return and the benchmark’s base return.
Statistical Data
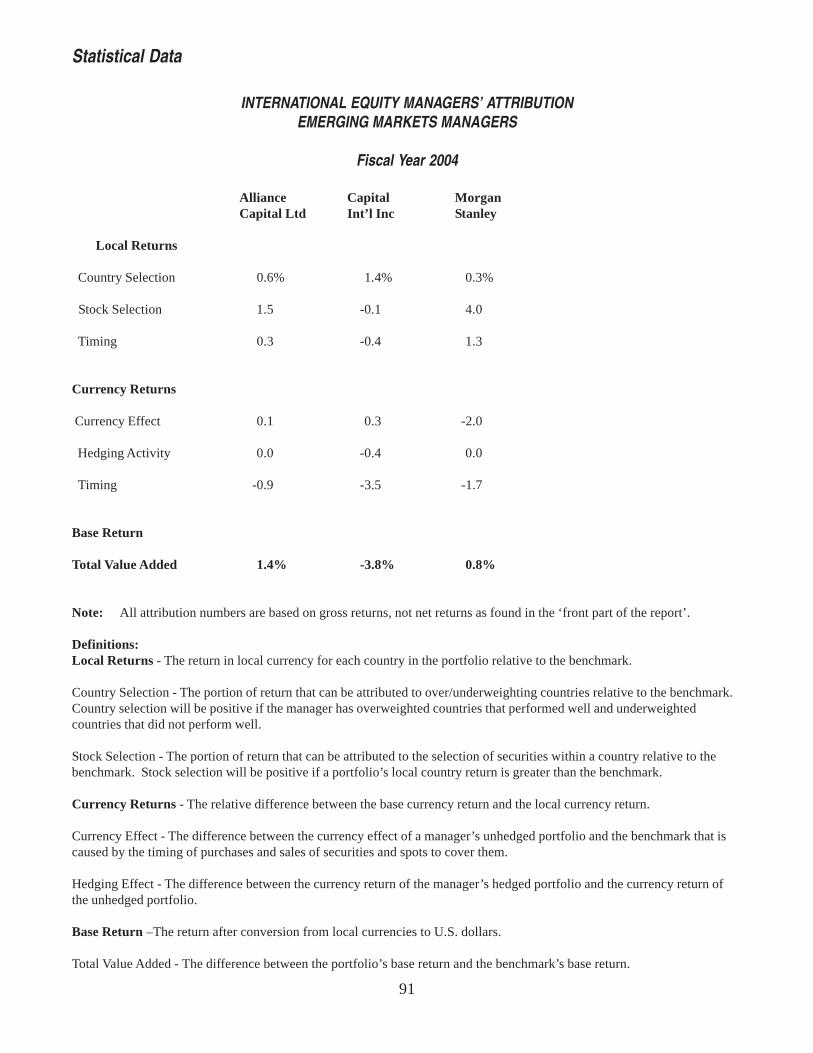
91
INTERNATIONAL EQUITY MANAGERS’ ATTRIBUTIONEMERGING MARKETS MANAGERS
Fiscal Year 2004
Alliance Capital MorganCapital Ltd Int’l Inc Stanley
Local Returns
Country Selection 0.6% 1.4% 0.3%
Stock Selection 1.5 -0.1 4.0
Timing 0.3 -0.4 1.3
Currency Returns
Currency Effect 0.1 0.3 -2.0
Hedging Activity 0.0 -0.4 0.0
Timing -0.9 -3.5 -1.7
Base Return
Total Value Added 1.4% -3.8% 0.8%
Note: All attribution numbers are based on gross returns, not net returns as found in the ‘front part of the report’.
Definitions:Local Returns - The return in local currency for each country in the portfolio relative to the benchmark.
Country Selection - The portion of return that can be attributed to over/underweighting countries relative to the benchmark.Country selection will be positive if the manager has overweighted countries that performed well and underweightedcountries that did not perform well.
Stock Selection - The portion of return that can be attributed to the selection of securities within a country relative to thebenchmark. Stock selection will be positive if a portfolio’s local country return is greater than the benchmark.
Currency Returns - The relative difference between the base currency return and the local currency return.
Currency Effect - The difference between the currency effect of a manager’s unhedged portfolio and the benchmark that iscaused by the timing of purchases and sales of securities and spots to cover them.
Hedging Effect - The difference between the currency return of the manager’s hedged portfolio and the currency return ofthe unhedged portfolio.
Base Return –The return after conversion from local currencies to U.S. dollars.
Total Value Added - The difference between the portfolio’s base return and the benchmark’s base return.
Statistical Data
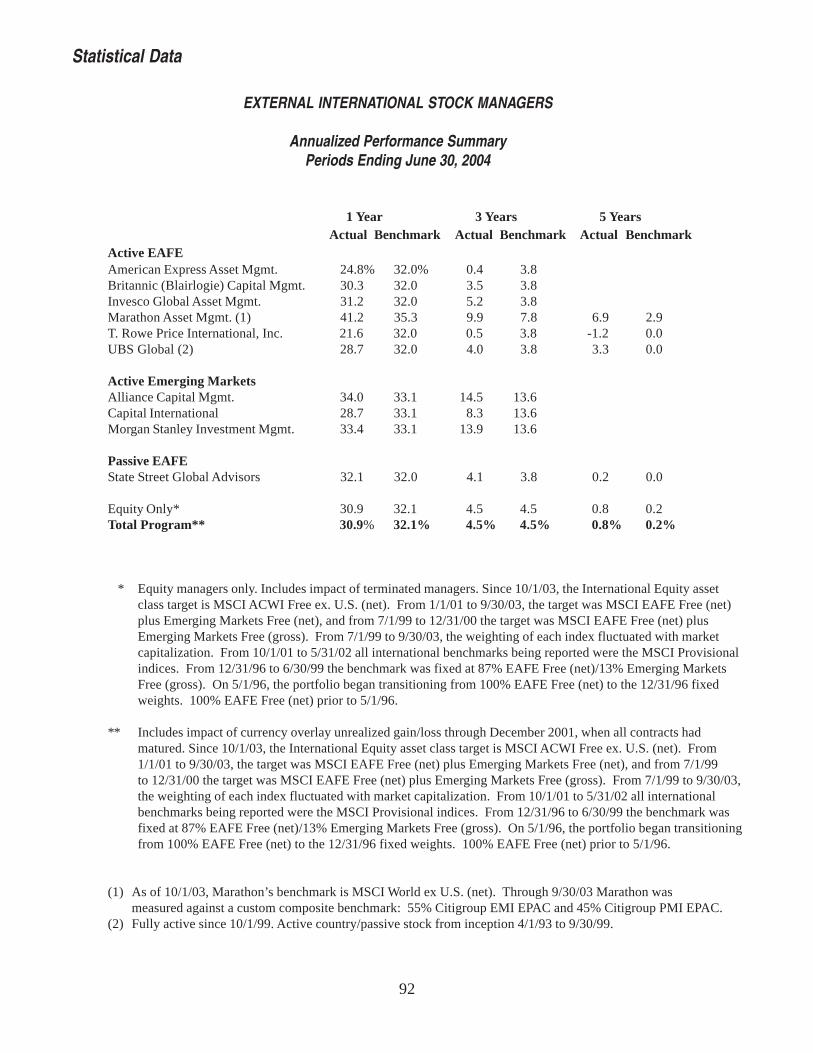
92
EXTERNAL INTERNATIONAL STOCK MANAGERS
Annualized Performance SummaryPeriods Ending June 30, 2004
1 Year 3 Years 5 YearsActual Benchmark Actual Benchmark Actual Benchmark
Active EAFEAmerican Express Asset Mgmt. 24.8% 32.0% 0.4 3.8Britannic (Blairlogie) Capital Mgmt. 30.3 32.0 3.5 3.8Invesco Global Asset Mgmt. 31.2 32.0 5.2 3.8Marathon Asset Mgmt. (1) 41.2 35.3 9.9 7.8 6.9 2.9T. Rowe Price International, Inc. 21.6 32.0 0.5 3.8 -1.2 0.0UBS Global (2) 28.7 32.0 4.0 3.8 3.3 0.0
Active Emerging MarketsAlliance Capital Mgmt. 34.0 33.1 14.5 13.6Capital International 28.7 33.1 8.3 13.6Morgan Stanley Investment Mgmt. 33.4 33.1 13.9 13.6
Passive EAFEState Street Global Advisors 32.1 32.0 4.1 3.8 0.2 0.0
Equity Only* 30.9 32.1 4.5 4.5 0.8 0.2Total Program** 30.9% 32.1% 4.5% 4.5% 0.8% 0.2%
* Equity managers only. Includes impact of terminated managers. Since 10/1/03, the International Equity assetclass target is MSCI ACWI Free ex. U.S. (net). From 1/1/01 to 9/30/03, the target was MSCI EAFE Free (net)plus Emerging Markets Free (net), and from 7/1/99 to 12/31/00 the target was MSCI EAFE Free (net) plusEmerging Markets Free (gross). From 7/1/99 to 9/30/03, the weighting of each index fluctuated with marketcapitalization. From 10/1/01 to 5/31/02 all international benchmarks being reported were the MSCI Provisionalindices. From 12/31/96 to 6/30/99 the benchmark was fixed at 87% EAFE Free (net)/13% Emerging MarketsFree (gross). On 5/1/96, the portfolio began transitioning from 100% EAFE Free (net) to the 12/31/96 fixedweights. 100% EAFE Free (net) prior to 5/1/96.
** Includes impact of currency overlay unrealized gain/loss through December 2001, when all contracts hadmatured. Since 10/1/03, the International Equity asset class target is MSCI ACWI Free ex. U.S. (net). From1/1/01 to 9/30/03, the target was MSCI EAFE Free (net) plus Emerging Markets Free (net), and from 7/1/99to 12/31/00 the target was MSCI EAFE Free (net) plus Emerging Markets Free (gross). From 7/1/99 to 9/30/03,the weighting of each index fluctuated with market capitalization. From 10/1/01 to 5/31/02 all internationalbenchmarks being reported were the MSCI Provisional indices. From 12/31/96 to 6/30/99 the benchmark wasfixed at 87% EAFE Free (net)/13% Emerging Markets Free (gross). On 5/1/96, the portfolio began transitioningfrom 100% EAFE Free (net) to the 12/31/96 fixed weights. 100% EAFE Free (net) prior to 5/1/96.
(1) As of 10/1/03, Marathon’s benchmark is MSCI World ex U.S. (net). Through 9/30/03 Marathon wasmeasured against a custom composite benchmark: 55% Citigroup EMI EPAC and 45% Citigroup PMI EPAC.
(2) Fully active since 10/1/99. Active country/passive stock from inception 4/1/93 to 9/30/99.
Statistical Data

��
Statistical Data
ALTERNATIVE INVESTMENTS June 30, 2004
������ ������������� ��� �������������� ������� ������ ���� �������
���������������
���������������������� ;-#('&#<)< ;%#'%?#(?- *�-����������������������� &*#?,'#<*, ) (�'����� ��D�����'��������(� � %)?#---#-(< ) %-�(���B����
�������>��������������9������ '<#%%? ) %<�(�������>��������������9����D %#%?,#-*) ) %-�(������������������'��5���" �� -#'(-#*,& &''#'** %-�<��� �������������<����������= %(-#('-#,<& ) --�?���(�������������#����
�������5��������������9������� -(#??,#&-( ) %)�%�������5��������������9�����D ,-#?'<#?&( ) ?�,�������5��������������9����D '&#--)#<<( ) '�%�������5��������������9����D� ,&#,<)#?'' ,#)))#))) -�)�������5��������������9����D�� ) ?'#)))#))) )�)���)���#���� %<%#)?-#?<) ) --�-
#���������(��� H77&3&993/:- H:.3:9&3/9$
������ ������������� ��� ���������� ������� ������ ���� �������
������������������� ;<#(((#,&) ;) %?�'����"���#������
�������9����5�������� ?)#%*? ) --�?�������9����5��������� %%-#?<% ) -%�,�������9����5�������D %*&#)%* ) %,�-�������9����5�������D�� %*#%,,#<?' ) <�)�������9����5�������D��� (&#%<&#&*? ) (�-�������9����5���������� ''#?--#??, -'#,'&#?'& &�-�������9����5��������� ) %))#)))#))) )�)����������
��������������4���9�9������ -#*<%#*** -#-*&#&?% %-�*��������������4���9�9������� -)#,<?#(<' %#(%*#((& *�)��������������4���9�9�����D &(#'))#<,) (#,(?#)*& (�&����(��#�?��'��� *#,,?#))) ) F2�
#��� ����(��� H/$73-$.3%%9 H$&-3:&&3:9%

��
Statistical Data
ALTERNATIVE INVESTMENTS June 30, 2004
������ ������������� ��� ����� ������ ���� ������� ������ ���� �������
�������������� ;,(#(?&#%&% ;&#<%'#(*- -�%������(� �++�����'������ %%#&,<#**' (&#%*'#*)& -�<������� ������������'��������� -#%(<#(,- --#((- %%�?����������� �++���������������������88������6������ %)#((&#,&% ) *�'�����������������88������6���������� ',#'<%#-*- &&#%<'#'%? ,�?�����;�2����������'��������� ?#?*-#&,- &&#*--#)?, ,�'�����>�� �++�����'������
�������� ����88������6��������� ((#&?'#(<) *#*,'#,%& ,�&�������� ����88������6���������� (#<&&#&%* (<#',,#*%? %�)�����>(�#�������'������ ,?#?,,#-%& %)#,%)#'?< ,�(�����> ������ ������������
������������������������������"�"��9���� ,#,**#'<& %)-#')) <�*������������������������������"�"��9����� %(#*()#??, --,#*,< ?�(������������������������������"�"��9���D %%#-*)#<)& ) (�'������������������������������"�"��9��D &'#*?<#(-( ) ,�*�����I�� �++�����'�������" ����� ,#%%<#,*- % <�?����� ����������'������
�������������=���"��6������� ,)#-*,#%?, ) <�)�������������=���"��6�������� <&#,((#'<? % '�?�������������=���"��6�������7 <<#,'?#-)( %-#'*,#-*) &�%�������������=���"��6�������= ) %))#)))#))) )�)����� ���������'�������<�5��6���������=
�������/������� �������88������9������� &<#<*(#(*' %)#<*<#,)) ,�'���������������88������9�����D ) ?'#)))#))) )�)�����'� ������������'������ '<#%((#?)& -*#<%%#'', &�-������ ���'������
�������������������7���9����� ?*#&*, -#)))#))) %)�&�������������������7���9������ %*#<<(#-%? ,#?-'#))) (�*�������������������7���9������� ,#-?'#))) ,)#?-'#))) )�,�����(��#�?��'��� %'%#()) ) F2������(�6A�������� �++����
����������/2����������88������6������ %-#-,,#?)) -#<(*#*(% <�-����������/2����������88������6��������� &-#%',#&** %-#'-)#*', '�(����������/2����������88������6���������� ,)#'<-#%,& -'#)(*#-?, &�&�����6��J������ �++��G��� ��" ����� &)#*,&#,%, &%#-)(#((* ,�-
�,���8D������(��� H99737/93--& H-9.39%$3&.%
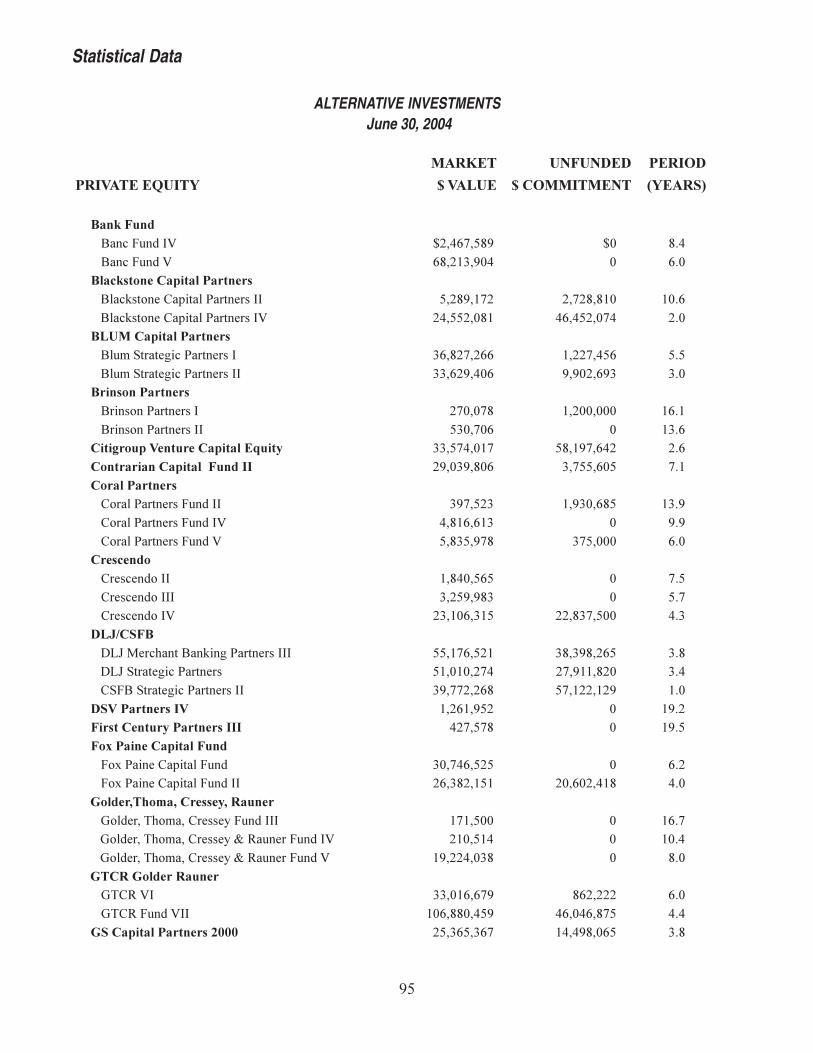
��
Statistical Data
ALTERNATIVE INVESTMENTS June 30, 2004
������ ������������� ��� ��
��� �������� �� ������� ������ ���� �������
�������5�" ��
������� ����9�����D ;-#,(?#'<* ;) <�,������� ����9����D (<#-%&#*), ) (�)��������5�����������'������
������� ���$�����������6��������� '#-<*#%?- -#?-<#<%) %)�(������� ���$�����������6��������D -,#''-#)<% ,(#,'-#)?, -�)������) �������'������
������� ��������"���6�������� &(#<-?#-(( %#--?#,'( '�'������� ��������"���6��������� &&#(-*#,)( *#*)-#(*& &�)�����������'������
������� ������6�������� -?)#)?< %#-))#))) %(�%������� ������6��������� '&)#?)( ) %&�(�������� ��!�� ����������� � &&#'?,#)%? '<#%*?#(,- -�(��������������������" ����� -*#)&*#<)( &#?''#()' ?�%����������'������������������6�������9������ &*?#'-& %#*&)#(<' %&�*������������6�������9�����D ,#<%(#(%& ) *�*������������6�������9����D '#<&'#*?< &?'#))) (�)�������������
������������������ %#<,)#'(' ) ?�'������������������� &#-'*#*<& ) '�?�����������������D -&#%)(#&%' --#<&?#')) ,�&����;�2A��"�
�������7A@��������� ��$��"�6���������� ''#%?(#'-% &<#&*<#-(' &�<�������7A@�����"���6������ '%#)%)#-?, -?#*%%#<-) &�,���������9 �����"���6��������� &*#??-#-(< '?#%--#%-* %�)����;�!�'��������! %#-(%#*'- ) %*�-����"������ ���'���������� ,-?#'?< ) %*�'����"�1�'����������" ��
�������9.�6������������9��� &)#?,(#'-' ) (�-�������9.�6������������9������ -(#&<-#%'% -)#()-#,%< ,�)����>�����3(����3��������3�#� ���
������� ����#�����#���������9������� %?%#')) ) %(�?������� ����#�����#���������B�5������9�����D -%)#'%, ) %)�,������� ����#�����#���������B�5������9����D %*#--,#)&< ) <�)����>(�#�>������#� ���������� ��5�D� &&#)%(#(?* <(-#--- (�)������� ��5�9����D�� %)(#<<)#,'* ,(#),(#<?' ,�,����>��������'�������/... -'#&('#&(? %,#,*<#)(' &�<

��
ALTERNATIVE INVESTMENTS June 30, 2004
������ ������������� ��� ��
��� �������� ���������� ������� ������ ���� �������
���>B2 �� �������" ����! ;*#'?%#'%- ;(#'%*#))) '�-�����B�������G�"��������������>�������B�9���������������6���������� &#*&-#--- ?#<<(#&%( *�<��������>�������B�9���������������6��������D <&#**?#,%& ,'#&*-#-'- ,�'��������>�������B�9���������������6�������D ) %()#)))#))) )�)�����I��������I�����#�����
��������NN5�%*<(�9��� %&#&?%#,', ) %<�-��������NN5�%*<?�9��� -'#*-<#<-( '?(#&,< %(�(��������NN5�%**&�9��� -&#)%&#-', ) %)�'��������NN5�%**(�9��� %%)#<%<#')( ) ?�<��������NN5������������9��� ,(#),&#))) %')#*<&#))) %�(����� ��1�'���������� &%<#,'* ) %<�*�����'����2�������B��������
��������6�����@�������>���������9������ '#?<-#&?< ) ?�&��������6�����@�������>���������9������� *#?,'#*%* ***#**< '�,��������6�����@�������>���������9�����D -#*%*#?-- ,#,,&#,'? )�<�������������5��'��������� ) %))#)))#))) )�)������ ���'������
��������������D�������� %)#<*, ) %*�'��������������D��������� %*-#),< %#'))#))) %(�%��������������D�������D ?#)*?#-'< -#%-'#))) (�-�����(��#�?��'��� ')#,&<#'%% ) F2������(���������������������������������9����D� -)#%('#%&? %#)<'#))) '�*���������������������9����D�� %*#-('#)'( -<#-?)#))) &�<�����(�����3� �C������G�'������ '#&<?#??% -&#,))#))) %�?�����!�����������'��������! -?#%<(#'<* -%#&&,#%%& ,�'�����6��� ���'�� �
��������/�����"#�6������D������ ,*#(?(#('( ) *�'��������/�����"�6������=+����6������ '*#(??#(<? ) (�)��������/�����"�6������6������=+����D��� ')#'<?#),( ,?#)))#))) -�-�����6����3�������3����������G���?���������/����#������#���������B��!��D��� ?(#*)%#-&? %#)))#))) '�*��������/����#������#���������B��!���� (&#'<?#*'< ,(#-')#))) ,�)�����6����������������'������ &&#*''#?&< %-#*))#))) &�&�����K���A�������5 %*?#,&( ) %,�)
�'������� ��(��� H$347&3.773-$9 H$3.$-39$&394&
Statistical Data

97
In measuring the performance of a manager or fund whoseinvestment objective is to maximize the total value of aninvestment portfolio, the proper measuring tool is the time-weighted total rate of return. This performance measureincludes the effect of income earned as well as realizedand unrealized portfolio market value changes. In addition,the time-weighted total rate of return nets out the influenceof contributions made to and distributions taken from themanager or fund. These are variables over which themanager or fund generally has no control.
The calculation of a portfolio’s true time-weighted returnrequires that the portfolio be valued every time that thereis a capital flow in or out. Because most portfolios are notvalued that frequently, it is usually necessary to estimatethe time-weighted total rates of return by approximatingthe required valuations.
In 1968, the Bank Administration Institute (BAI)commissioned a study, conducted by the University ofChicago, which considered desirable methods ofestimating time-weighted returns. The BAI report isconsidered to be the definitive work in the field ofperformance measurement because of the academicreputations and thorough scientific efforts of its authors.
When monthly data are available, the BAI studyrecommends employing a technique called the linkedinternal rate of return (LIRR). State Street Bank, the SBI’sperformance measurement consultant, calculates the LIRRby solving the following equation for R:
nVB * (1 + R) + Ci* (1 + R) ti = VE
i=1
Where:
VB = Value of the fund at the beginning of the month
VE = Value of the fund at the end of the month
Ci = Net cash flow on the ith day of the month
n = Number of cash flows in the month
R = Internal rate of return
ti = Time from cash flow i to the end of the period,expressed as a percentage of the total number ofdays in the month
Time-Weighted Rate of Return
The internal rate of return, R, is a proxy for the true time-weighted return over the month. It approximates theinterim valuations by assuming a uniform growth of theinvested assets throughout the period.
The IRR’s calculated for each month can be linkedtogether to estimate the time-weighted return for a longerperiod. For example, given three consecutive monthlyIRR’s (R1, R2, and R3), the quarterly time-weighted return(TWRQ) is:
TWRQ = (1 + R1)*(1 + R2)*(1 + R3) - 1
State Street’s performance methodology is also incompliance with the mandatory requirements of theAssociation for Investment Management and Research(AIMR).

98
Calculation of January 1, 2005 Benefit Increase
Actuarial value of required reserves at January 1, 2005 $22,201,715,063 Less: Reserves not eligible for increase 805,298,235Actuarially determined eligible reserves at Janaury 1, 2005 21,396,416,828
CPI Inflation rate capped at 2.5% 2.500%Dollar cost of inflationary increase 534,910,421
June 30, 2004 total required reserves 22,549,676,868
June 30, 2004 total required reserves adjusted for inflationary increase 23,084,587,289
Market value of Assets at June 30, 2004 18,403,077,602 Less:Inflation adjusted required reserves 23,084,587,289Current year excess market value -4,681,509,686Negative balance carry forward -4,236,763,260
Excess market value available for investment based benefit increase -444,746,426Divided by 5 year pay out period 5
Current year portion of excess market value -88,949,285Second year portion -$360,557,487Third year portion -$558,850,315Fourth year portion -$593,357,973Fifth year portion $68,733,579Total five year excess market value -$1,532,981,481
Greater of current year excess market value or cost of transition adjustment -1,532,981,481Divided by eligible required reserves at January 1, 2005 21,396,416,828Investment based increase for FY2004 0.0000%
Summary:
Investment Based Benefit Increase 0.0000%Inflation Based Benefit Increase 2.5000%Total Benefit Increase 2.5000%
Total Dollar Value of January 1, 2005 Benefit Increase $534,910,421

99
COMMISSIONS AND TRADING VOLUME
By Broker for Fiscal Year 2004
Stock Stock Bond Bond Short Term
Broker $ Volume $ Commissions $ Volume $ Commissions $ Volume
508 SECURITIES INC. 79,210.74 108.25 0.00 0.00 0.00
A & C BROKERAGE 137,530.33 111.00 0.00 0.00 0.00
ABBEY NATIONAL 0.00 0.00 0.00 0.00 334,890,368.05
ABD SECURITIES 31,346,241.14 43,056.70 0.00 0.00 0.00
ABG SECURITIES 8,308,468.79 16,642.52 0.00 0.00 0.00
ABN AMRO ASIA SECS LTD 8,584,443.66 15,253.83 0.00 0.00 0.00
ABN AMRO EQUITIES AUSTRALIA LT 285,881.02 426.04 0.00 0.00 0.00
ABN AMRO SECURITIES 6,670,970.53 15,173.62 36,967,389.18 0.00 591,339,698.05
ABN AMRO, HOARE, GOVETTE 620,332.91 1,754.42 0.00 0.00 0.00
ABN-AMRO BANK 252,170.41 754.25 0.00 0.00 0.00
ACCESS SECURITIES 186,456,793.49 231,338.52 0.00 0.00 0.00
ADAMS HARKNESS & HILL 28,911,109.49 63,924.50 0.00 0.00 0.00
ADVEST CO. 5,668,434.57 14,549.03 21,776,266.98 0.00 0.00
AISEL & CO 0.00 0.00 0.00 0.00 9,113,969.27
AK CAPITAL 0.00 0.00 607,858.06 0.00 0.00
ALBERT E S 1,637,461.50 1,896.57 0.00 0.00 0.00
ALFA SECURITIES (ISTANBUL) 163,707.99 774.25 0.00 0.00 0.00
ALLEN & COMPANY 5,342,153.94 3,877.00 0.00 0.00 0.00
AMADON CORPORATION 368,124.11 1,840.00 107,439,767.01 0.00 0.00
AMERICAN EXPRESS CREDIT 0.00 0.00 0.00 0.00 328,001,904.17
AMERICAN GENERAL FINANCE 0.00 0.00 0.00 0.00 52,976,370.83
AMERICAN TECHNOLOGY RES. INC. 3,126,346.49 7,456.50 0.00 0.00 0.00
AMES ( A. E. ) & CO 11,414.55 0.00 0.00 0.00 0.00
AMHERST SECURITIES GROUP INC. 0.00 0.00 90,381,177.11 0.00 0.00
ANCORA SECURITIES 21,714,196.62 35,809.00 0.00 0.00 0.00
APAX PARTNERS & CO LONDON 492,356.18 977.87 0.00 0.00 0.00
ARNHOLD 2,151,723.97 2,513.73 0.00 0.00 0.00
ASSENT LLC 5,268,395.66 3,537.00 0.00 0.00 0.00
AUERBACH GRAYSON 956,839.69 7,877.40 0.00 0.00 0.00
AUTRANET 11,402,585.67 25,162.00 0.00 0.00 0.00
AVALON RESEARCH GROUP INC 2,770,616.93 3,186.00 0.00 0.00 0.00
B RILEY AND CO. INC. 4,152,499.80 11,226.50 0.00 0.00 0.00
BA SECURITIES, INC. 1,859,536.39 2,500.00 1,164,125,005.44 0.00 5,726,596,627.12
BAIRD, ROBERT W & CO. 0.00 0.00 577,822.50 0.00 0.00
BANC OF AMSTERDAM 0.00 0.00 11,318,062.50 0.00 0.00
BANC ONE CAPITAL CORP. 0.00 0.00 25,243,385.18 0.00 1,092,038.30
BANCO BILBAO VISCAYA 17,558.46 52.83 0.00 0.00 0.00
BANCO DE INV 666,294.41 2,226.02 0.00 0.00 0.00
BANCO EXTERIOR DE ESPANA 29,309.97 102.23 0.00 0.00 0.00
BANCO PACTUAL S.A. 2,045,778.38 5,260.30 0.00 0.00 0.00
BANCO SANT 862,747.46 2,671.96 0.00 0.00 0.00
BANCO SANTANDER DE NEGOCIOS 4,344,127.43 9,437.92 0.00 0.00 0.00
BANCO WARB 528,193.80 0.00 0.00 0.00 0.00
BANCONE CAPITAL CORP 0.00 0.00 0.00 0.00 427,112,248.98
Statistical Data

100
COMMISSIONS AND TRADING VOLUME
By Broker for Fiscal Year 2004
Stock Stock Bond Bond Short Term
Broker $ Volume $ Commissions $ Volume $ Commissions $ Volume
BANK AMERICA 0.00 0.00 814,014.07 0.00 0.00
BANK AUSTR 238,559.68 1,439.99 0.00 0.00 0.00
BANK OF AMERICA 0.00 0.00 174,206,322.82 0.00 0.00
BANK OF CHINA GROUP SECS 258,928.32 644.96 0.00 0.00 0.00
BANK OF NEW YORK 285,828.20 0.00 0.00 0.00 0.00
BANK OF NY SECURITIES INC 917,990.40 843.83 21,389,341.70 0.00 0.00
BANK OF NY/BARCLAY LONDON 0.00 0.00 2,117,610.00 0.00 0.00
BANK ONE KENTUCKY N.A. 0.00 0.00 2,934,500.00 0.00 0.00
BANK SARASIN 3,285,285.38 8,208.40 0.00 0.00 0.00
BANKERS TRUST 0.00 0.00 2,136,562.50 0.00 0.00
BANKRUPTCY 17,575,964.09 0.00 8,124,970.15 0.00 0.00
BANQUE NATIONALE DE PARIS 22,573,152.72 55,523.17 4,393,719.37 0.00 0.00
BANQUE ROTHSCHILD 74.26 0.00 0.00 0.00 0.00
BARCLAYS BANK 0.00 0.00 143,992,234.02 0.00 0.00
BARCLAYS CAPITAL INC 0.00 0.00 401,610,958.74 0.00 703,316,605.00
BARCLAYS DEZOETE WEDD 0.00 0.00 66,885,062.77 0.00 0.00
BARING SECURITIES 17,532,176.80 27,575.13 15,887,976.65 0.00 0.00
BARNARD JACOBS AND CO (PTY) LTD 11,041,365.43 27,504.10 0.00 0.00 0.00
BARRETT & CO. 0.00 0.00 550,480.00 0.00 0.00
BAUM GEORGE K. & CO. 0.00 0.00 102,431.00 0.00 0.00
BAYERISCHE HYPO- UND VEREINSBA 568,819.03 2,153.56 0.00 0.00 0.00
BB & T CAPITAL MARKETS 0.00 0.00 4,705,722.66 0.00 0.00
BBVA SECURITIES 30,715.68 92.42 0.00 0.00 0.00
BEAL M. R. & CO 801,554.02 627.00 0.00 0.00 0.00
BEAR STEARNS SECURITIES 515,286,455.00 646,012.68 684,478,009.34 0.00 0.00
BEAR, STEARNS & CO. 226,425,147.88 267,384.01 4,507,862,125.98 4,480.00 0.00
BELL SECURITIES 2,899,631.43 8,725.07 0.00 0.00 0.00
BENDER MEN 1,008,741.17 3,662.01 0.00 0.00 0.00
BERKSHIRE EQUITY SALES INC 224,480.23 448.07 0.00 0.00 0.00
BERNSTEIN SANFORD 468,201,592.47 413,742.44 0.00 0.00 0.00
BHC SECURITIES INC. 4,529,219.33 20,168.00 0.00 0.00 0.00
BHF SECURITIES 1,729,808.12 3,539.98 0.00 0.00 0.00
BISYS FUND 2,975,549.18 0.00 0.00 0.00 0.00
BLAIR & COMPANY 108,321,709.61 133,760.10 451,971.30 0.00 0.00
BLAYLOCK & PARTNERS 1,976,072.14 1,682.85 0.00 0.00 0.00
BLOOMBERG 95,892.22 50.34 0.00 0.00 0.00
BMO CREDIT 2,710,202.38 5,409.58 0.00 0.00 0.00
BNP PARIBAS 0.00 0.00 17,518,071.51 0.00 0.00
BNP PARIBAS PEREGRINE SEC., ASIA 246,200.83 2,280.61 0.00 0.00 0.00
BNP PRIME 3,527,589.16 12,092.74 0.00 0.00 0.00
BNY/ITC DEALERS 0.00 0.00 46,942,510.63 0.00 0.00
BOLGER & CO INC 10,373.00 0.00 0.00 0.00 0.00
BRANDT (ROBERT) & CO 29,395,585.25 30,270.97 0.00 0.00 0.00
BRIDGE TRADING CO. 46,557,920.58 67,932.30 0.00 0.00 0.00
Statistical Data

101
COMMISSIONS AND TRADING VOLUME
By Broker for Fiscal Year 2004
Stock Stock Bond Bond Short Term
Broker $ Volume $ Commissions $ Volume $ Commissions $ Volume
BRIDGEWELL 2,041,849.91 4,055.31 0.00 0.00 0.00
BROADCORT CAPITAL 3,803,694.95 1,979.25 0.00 0.00 0.00
BROCKHOUSE & COOPER 43,337.69 107.96 0.00 0.00 0.00
BROWN (ALEX) & SONS INC. 3,247,474,852.23 4,281,357.45 1,413,301,049.22 0.00 13,500,019.49
BROWN BROS. HARRIMAN 1,293,740.78 2,965.00 0.00 0.00 0.00
BTN RESEARCH 1,211,907.63 2,500.00 0.00 0.00 0.00
B-TRADE SERVICES LLC 40,098,020.13 45,846.92 0.00 0.00 0.00
BUCKINGHAM RESEARCH GRP 23,484,004.99 23,115.95 0.00 0.00 0.00
BUNTING WARBURGER SEC 14,145,167.66 28,249.14 0.00 0.00 0.00
BURNS FRY & TIMMINS 10,066,075.78 8,520.45 0.00 0.00 0.00
BURTON J VINCENT CHESLEY & CO. 499,420.88 280.00 0.00 0.00 0.00
C.L. KING & ASSOC. 11,194,574.85 14,586.50 0.00 0.00 0.00
CA IB INVESTMENT 706,848.32 3,644.44 0.00 0.00 0.00
CAI CHEUVREUX, LONDON 1,858,945.83 4,635.78 0.00 0.00 0.00
CAMBRIDGE GROUP INV 0.00 0.00 2,446,492.50 0.00 0.00
CANADIAN I 5,357,053.15 7,142.68 0.00 0.00 0.00
CANTOR FITZGERALD 405,947,777.10 462,920.18 4,566,509.83 0.00 0.00
CAPITAL CALL 123,324.00 0.00 0.00 0.00 0.00
CAPITAL INST. SERVICES 13,153,825.67 26,790.00 0.00 0.00 0.00
CARIS & CO 362,206.93 1,374.00 0.00 0.00 0.00
CARLIN EQUITIES 3,116,791.52 6,545.00 0.00 0.00 0.00
CARNEGIE 5,089,886.43 8,149.82 0.00 0.00 0.00
CARROLL MCENTEE & MCG 0.00 0.00 10,415,600.00 0.00 3,805,786.87
CAZENOVE & CO. 51,222,177.82 89,813.18 0.00 0.00 0.00
CHARLES, AK 129,278.58 120.00 0.00 0.00 0.00
CHASE MANHATTAN BANK 0.00 0.00 37,285,167.50 0.00 0.00
CHASE SECURITIES INC 0.00 0.00 603,222,889.99 0.00 0.00
CHEMICAL BANK 0.00 0.00 234,163,949.25 0.00 0.00
CHEUVREUX 22,987,571.51 52,490.96 222,889.08 558.62 0.00
CHICAGO CORP 0.00 0.00 3,018,045.80 0.00 0.00
CHINA INTERNATIONAL CAP CORP 232,420.10 579.48 0.00 0.00 0.00
CHINA SECURITIES CO LTD 658,672.51 939.36 0.00 0.00 0.00
CHRISTOPHER (B.C.) & CO. 0.00 0.00 2,860,841.10 0.00 0.00
CI NORDIC 9,592,155.45 21,960.85 0.00 0.00 0.00
CISCO OF AMERICA INC 0.00 0.00 2,454,250.25 0.00 0.00
CITATION GROUP 270,142,141.20 308,005.37 0.00 0.00 0.00
CITIBANK 556,410.73 1,860.00 0.00 0.00 0.00
CITIBANK NA TOKYO 851,436.83 1,706.28 0.00 0.00 0.00
CITIGROUP GLOBAL MARKETS INC 1,297,304.12 742.12 98,289,638.92 0.00 5,503,947,407.63
CITIGROUP INC 0.00 0.00 2,531,030.96 0.00 1,156,248,690.56
CJS SECURITIES 372,466.10 1,023.45 0.00 0.00 0.00
CL GLAZER INC. 10,994,107.74 29,004.11 0.00 0.00 0.00
CLARKE & CO 0.00 0.00 39,674,882.81 0.00 0.00
CLARKE GX & CO. 0.00 0.00 8,417,139.06 0.00 0.00
Statistical Data
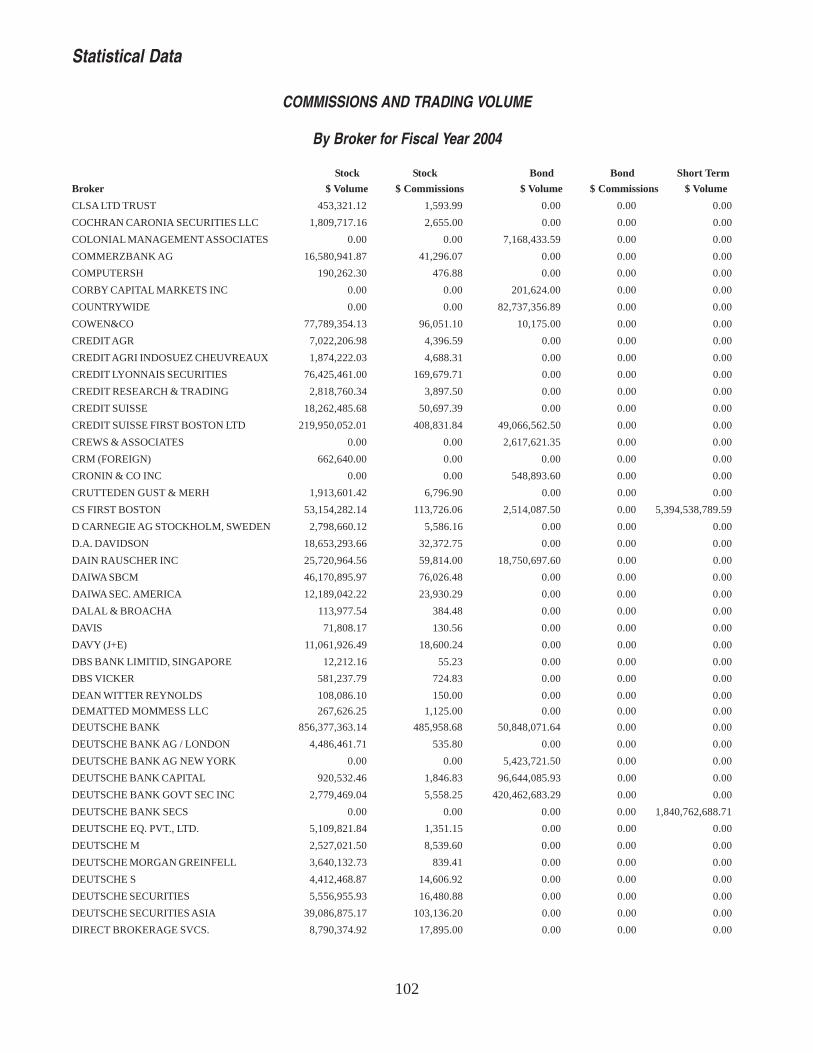
102
COMMISSIONS AND TRADING VOLUME
By Broker for Fiscal Year 2004
Stock Stock Bond Bond Short Term
Broker $ Volume $ Commissions $ Volume $ Commissions $ Volume
CLSA LTD TRUST 453,321.12 1,593.99 0.00 0.00 0.00
COCHRAN CARONIA SECURITIES LLC 1,809,717.16 2,655.00 0.00 0.00 0.00
COLONIAL MANAGEMENT ASSOCIATES 0.00 0.00 7,168,433.59 0.00 0.00
COMMERZBANK AG 16,580,941.87 41,296.07 0.00 0.00 0.00
COMPUTERSH 190,262.30 476.88 0.00 0.00 0.00
CORBY CAPITAL MARKETS INC 0.00 0.00 201,624.00 0.00 0.00
COUNTRYWIDE 0.00 0.00 82,737,356.89 0.00 0.00
COWEN&CO 77,789,354.13 96,051.10 10,175.00 0.00 0.00
CREDIT AGR 7,022,206.98 4,396.59 0.00 0.00 0.00
CREDIT AGRI INDOSUEZ CHEUVREAUX 1,874,222.03 4,688.31 0.00 0.00 0.00
CREDIT LYONNAIS SECURITIES 76,425,461.00 169,679.71 0.00 0.00 0.00
CREDIT RESEARCH & TRADING 2,818,760.34 3,897.50 0.00 0.00 0.00
CREDIT SUISSE 18,262,485.68 50,697.39 0.00 0.00 0.00
CREDIT SUISSE FIRST BOSTON LTD 219,950,052.01 408,831.84 49,066,562.50 0.00 0.00
CREWS & ASSOCIATES 0.00 0.00 2,617,621.35 0.00 0.00
CRM (FOREIGN) 662,640.00 0.00 0.00 0.00 0.00
CRONIN & CO INC 0.00 0.00 548,893.60 0.00 0.00
CRUTTEDEN GUST & MERH 1,913,601.42 6,796.90 0.00 0.00 0.00
CS FIRST BOSTON 53,154,282.14 113,726.06 2,514,087.50 0.00 5,394,538,789.59
D CARNEGIE AG STOCKHOLM, SWEDEN 2,798,660.12 5,586.16 0.00 0.00 0.00
D.A. DAVIDSON 18,653,293.66 32,372.75 0.00 0.00 0.00
DAIN RAUSCHER INC 25,720,964.56 59,814.00 18,750,697.60 0.00 0.00
DAIWA SBCM 46,170,895.97 76,026.48 0.00 0.00 0.00
DAIWA SEC. AMERICA 12,189,042.22 23,930.29 0.00 0.00 0.00
DALAL & BROACHA 113,977.54 384.48 0.00 0.00 0.00
DAVIS 71,808.17 130.56 0.00 0.00 0.00
DAVY (J+E) 11,061,926.49 18,600.24 0.00 0.00 0.00
DBS BANK LIMITID, SINGAPORE 12,212.16 55.23 0.00 0.00 0.00
DBS VICKER 581,237.79 724.83 0.00 0.00 0.00
DEAN WITTER REYNOLDS 108,086.10 150.00 0.00 0.00 0.00
DEMATTED MOMMESS LLC 267,626.25 1,125.00 0.00 0.00 0.00
DEUTSCHE BANK 856,377,363.14 485,958.68 50,848,071.64 0.00 0.00
DEUTSCHE BANK AG / LONDON 4,486,461.71 535.80 0.00 0.00 0.00
DEUTSCHE BANK AG NEW YORK 0.00 0.00 5,423,721.50 0.00 0.00
DEUTSCHE BANK CAPITAL 920,532.46 1,846.83 96,644,085.93 0.00 0.00
DEUTSCHE BANK GOVT SEC INC 2,779,469.04 5,558.25 420,462,683.29 0.00 0.00
DEUTSCHE BANK SECS 0.00 0.00 0.00 0.00 1,840,762,688.71
DEUTSCHE EQ. PVT., LTD. 5,109,821.84 1,351.15 0.00 0.00 0.00
DEUTSCHE M 2,527,021.50 8,539.60 0.00 0.00 0.00
DEUTSCHE MORGAN GREINFELL 3,640,132.73 839.41 0.00 0.00 0.00
DEUTSCHE S 4,412,468.87 14,606.92 0.00 0.00 0.00
DEUTSCHE SECURITIES 5,556,955.93 16,480.88 0.00 0.00 0.00
DEUTSCHE SECURITIES ASIA 39,086,875.17 103,136.20 0.00 0.00 0.00
DIRECT BROKERAGE SVCS. 8,790,374.92 17,895.00 0.00 0.00 0.00
Statistical Data
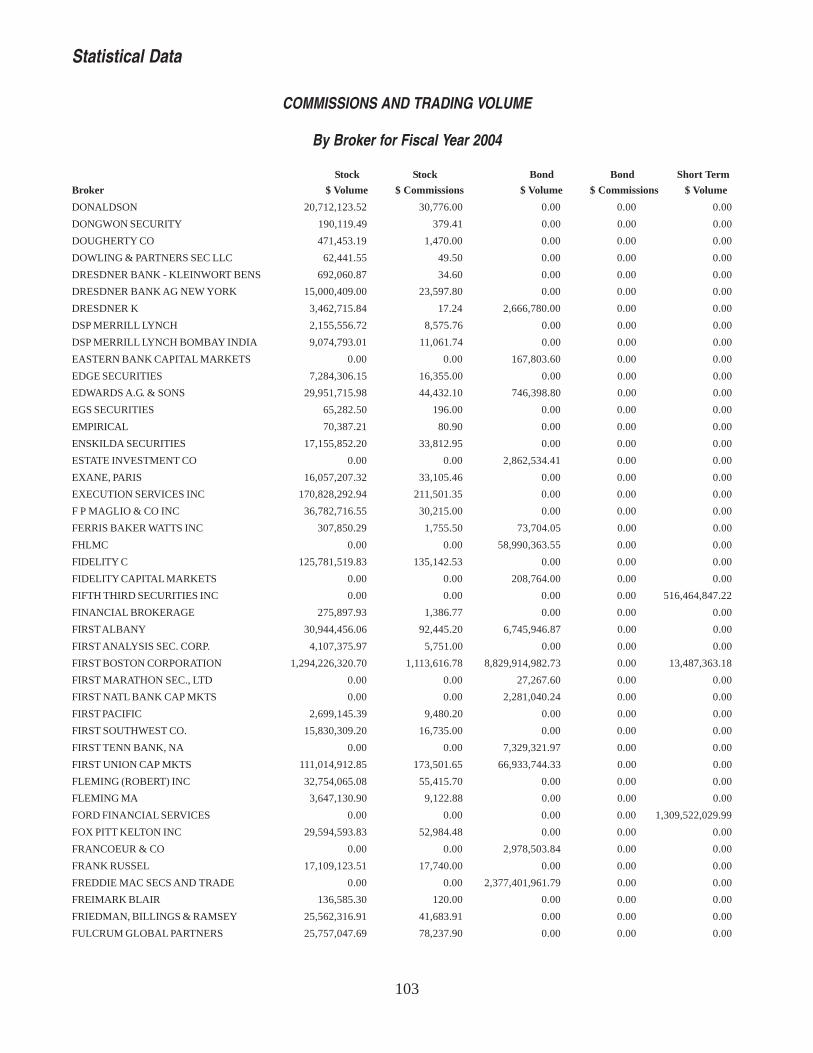
103
COMMISSIONS AND TRADING VOLUME
By Broker for Fiscal Year 2004
Stock Stock Bond Bond Short Term
Broker $ Volume $ Commissions $ Volume $ Commissions $ Volume
DONALDSON 20,712,123.52 30,776.00 0.00 0.00 0.00
DONGWON SECURITY 190,119.49 379.41 0.00 0.00 0.00
DOUGHERTY CO 471,453.19 1,470.00 0.00 0.00 0.00
DOWLING & PARTNERS SEC LLC 62,441.55 49.50 0.00 0.00 0.00
DRESDNER BANK - KLEINWORT BENS 692,060.87 34.60 0.00 0.00 0.00
DRESDNER BANK AG NEW YORK 15,000,409.00 23,597.80 0.00 0.00 0.00
DRESDNER K 3,462,715.84 17.24 2,666,780.00 0.00 0.00
DSP MERRILL LYNCH 2,155,556.72 8,575.76 0.00 0.00 0.00
DSP MERRILL LYNCH BOMBAY INDIA 9,074,793.01 11,061.74 0.00 0.00 0.00
EASTERN BANK CAPITAL MARKETS 0.00 0.00 167,803.60 0.00 0.00
EDGE SECURITIES 7,284,306.15 16,355.00 0.00 0.00 0.00
EDWARDS A.G. & SONS 29,951,715.98 44,432.10 746,398.80 0.00 0.00
EGS SECURITIES 65,282.50 196.00 0.00 0.00 0.00
EMPIRICAL 70,387.21 80.90 0.00 0.00 0.00
ENSKILDA SECURITIES 17,155,852.20 33,812.95 0.00 0.00 0.00
ESTATE INVESTMENT CO 0.00 0.00 2,862,534.41 0.00 0.00
EXANE, PARIS 16,057,207.32 33,105.46 0.00 0.00 0.00
EXECUTION SERVICES INC 170,828,292.94 211,501.35 0.00 0.00 0.00
F P MAGLIO & CO INC 36,782,716.55 30,215.00 0.00 0.00 0.00
FERRIS BAKER WATTS INC 307,850.29 1,755.50 73,704.05 0.00 0.00
FHLMC 0.00 0.00 58,990,363.55 0.00 0.00
FIDELITY C 125,781,519.83 135,142.53 0.00 0.00 0.00
FIDELITY CAPITAL MARKETS 0.00 0.00 208,764.00 0.00 0.00
FIFTH THIRD SECURITIES INC 0.00 0.00 0.00 0.00 516,464,847.22
FINANCIAL BROKERAGE 275,897.93 1,386.77 0.00 0.00 0.00
FIRST ALBANY 30,944,456.06 92,445.20 6,745,946.87 0.00 0.00
FIRST ANALYSIS SEC. CORP. 4,107,375.97 5,751.00 0.00 0.00 0.00
FIRST BOSTON CORPORATION 1,294,226,320.70 1,113,616.78 8,829,914,982.73 0.00 13,487,363.18
FIRST MARATHON SEC., LTD 0.00 0.00 27,267.60 0.00 0.00
FIRST NATL BANK CAP MKTS 0.00 0.00 2,281,040.24 0.00 0.00
FIRST PACIFIC 2,699,145.39 9,480.20 0.00 0.00 0.00
FIRST SOUTHWEST CO. 15,830,309.20 16,735.00 0.00 0.00 0.00
FIRST TENN BANK, NA 0.00 0.00 7,329,321.97 0.00 0.00
FIRST UNION CAP MKTS 111,014,912.85 173,501.65 66,933,744.33 0.00 0.00
FLEMING (ROBERT) INC 32,754,065.08 55,415.70 0.00 0.00 0.00
FLEMING MA 3,647,130.90 9,122.88 0.00 0.00 0.00
FORD FINANCIAL SERVICES 0.00 0.00 0.00 0.00 1,309,522,029.99
FOX PITT KELTON INC 29,594,593.83 52,984.48 0.00 0.00 0.00
FRANCOEUR & CO 0.00 0.00 2,978,503.84 0.00 0.00
FRANK RUSSEL 17,109,123.51 17,740.00 0.00 0.00 0.00
FREDDIE MAC SECS AND TRADE 0.00 0.00 2,377,401,961.79 0.00 0.00
FREIMARK BLAIR 136,585.30 120.00 0.00 0.00 0.00
FRIEDMAN, BILLINGS & RAMSEY 25,562,316.91 41,683.91 0.00 0.00 0.00
FULCRUM GLOBAL PARTNERS 25,757,047.69 78,237.90 0.00 0.00 0.00
Statistical Data
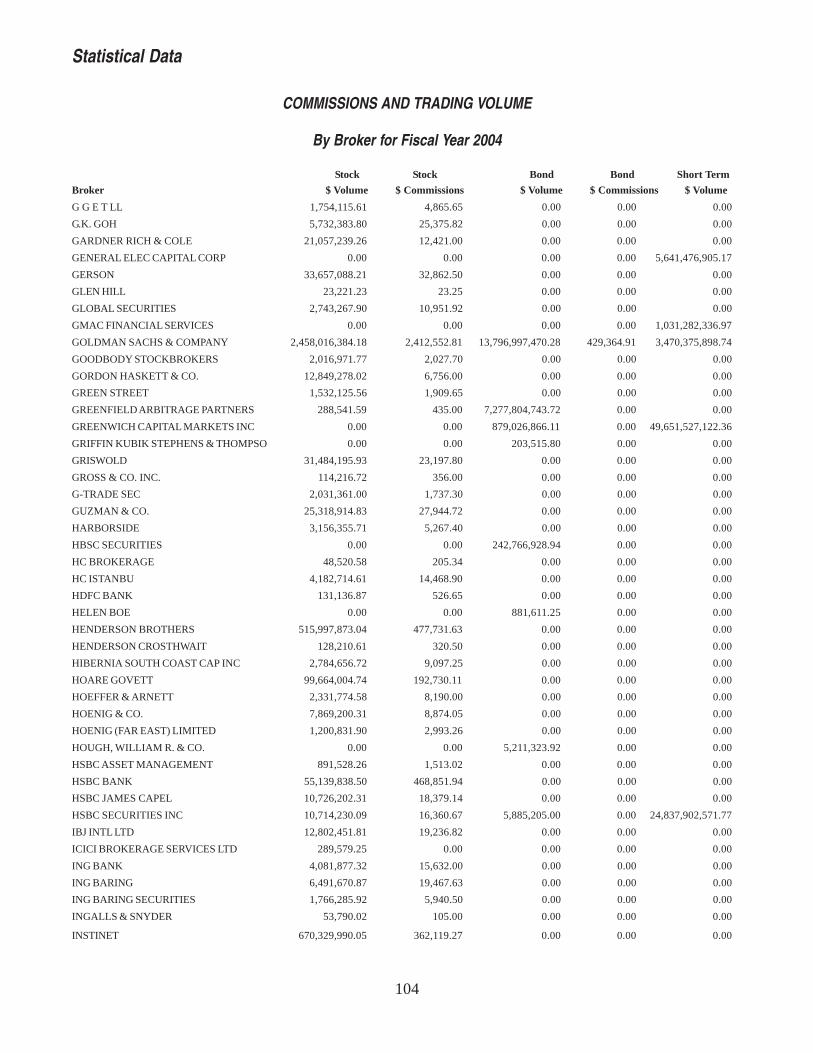
104
COMMISSIONS AND TRADING VOLUME
By Broker for Fiscal Year 2004
Stock Stock Bond Bond Short Term
Broker $ Volume $ Commissions $ Volume $ Commissions $ Volume
G G E T LL 1,754,115.61 4,865.65 0.00 0.00 0.00
G.K. GOH 5,732,383.80 25,375.82 0.00 0.00 0.00
GARDNER RICH & COLE 21,057,239.26 12,421.00 0.00 0.00 0.00
GENERAL ELEC CAPITAL CORP 0.00 0.00 0.00 0.00 5,641,476,905.17
GERSON 33,657,088.21 32,862.50 0.00 0.00 0.00
GLEN HILL 23,221.23 23.25 0.00 0.00 0.00
GLOBAL SECURITIES 2,743,267.90 10,951.92 0.00 0.00 0.00
GMAC FINANCIAL SERVICES 0.00 0.00 0.00 0.00 1,031,282,336.97
GOLDMAN SACHS & COMPANY 2,458,016,384.18 2,412,552.81 13,796,997,470.28 429,364.91 3,470,375,898.74
GOODBODY STOCKBROKERS 2,016,971.77 2,027.70 0.00 0.00 0.00
GORDON HASKETT & CO. 12,849,278.02 6,756.00 0.00 0.00 0.00
GREEN STREET 1,532,125.56 1,909.65 0.00 0.00 0.00
GREENFIELD ARBITRAGE PARTNERS 288,541.59 435.00 7,277,804,743.72 0.00 0.00
GREENWICH CAPITAL MARKETS INC 0.00 0.00 879,026,866.11 0.00 49,651,527,122.36
GRIFFIN KUBIK STEPHENS & THOMPSO 0.00 0.00 203,515.80 0.00 0.00
GRISWOLD 31,484,195.93 23,197.80 0.00 0.00 0.00
GROSS & CO. INC. 114,216.72 356.00 0.00 0.00 0.00
G-TRADE SEC 2,031,361.00 1,737.30 0.00 0.00 0.00
GUZMAN & CO. 25,318,914.83 27,944.72 0.00 0.00 0.00
HARBORSIDE 3,156,355.71 5,267.40 0.00 0.00 0.00
HBSC SECURITIES 0.00 0.00 242,766,928.94 0.00 0.00
HC BROKERAGE 48,520.58 205.34 0.00 0.00 0.00
HC ISTANBU 4,182,714.61 14,468.90 0.00 0.00 0.00
HDFC BANK 131,136.87 526.65 0.00 0.00 0.00
HELEN BOE 0.00 0.00 881,611.25 0.00 0.00
HENDERSON BROTHERS 515,997,873.04 477,731.63 0.00 0.00 0.00
HENDERSON CROSTHWAIT 128,210.61 320.50 0.00 0.00 0.00
HIBERNIA SOUTH COAST CAP INC 2,784,656.72 9,097.25 0.00 0.00 0.00
HOARE GOVETT 99,664,004.74 192,730.11 0.00 0.00 0.00
HOEFFER & ARNETT 2,331,774.58 8,190.00 0.00 0.00 0.00
HOENIG & CO. 7,869,200.31 8,874.05 0.00 0.00 0.00
HOENIG (FAR EAST) LIMITED 1,200,831.90 2,993.26 0.00 0.00 0.00
HOUGH, WILLIAM R. & CO. 0.00 0.00 5,211,323.92 0.00 0.00
HSBC ASSET MANAGEMENT 891,528.26 1,513.02 0.00 0.00 0.00
HSBC BANK 55,139,838.50 468,851.94 0.00 0.00 0.00
HSBC JAMES CAPEL 10,726,202.31 18,379.14 0.00 0.00 0.00
HSBC SECURITIES INC 10,714,230.09 16,360.67 5,885,205.00 0.00 24,837,902,571.77
IBJ INTL LTD 12,802,451.81 19,236.82 0.00 0.00 0.00
ICICI BROKERAGE SERVICES LTD 289,579.25 0.00 0.00 0.00 0.00
ING BANK 4,081,877.32 15,632.00 0.00 0.00 0.00
ING BARING 6,491,670.87 19,467.63 0.00 0.00 0.00
ING BARING SECURITIES 1,766,285.92 5,940.50 0.00 0.00 0.00
INGALLS & SNYDER 53,790.02 105.00 0.00 0.00 0.00
INSTINET 670,329,990.05 362,119.27 0.00 0.00 0.00
Statistical Data
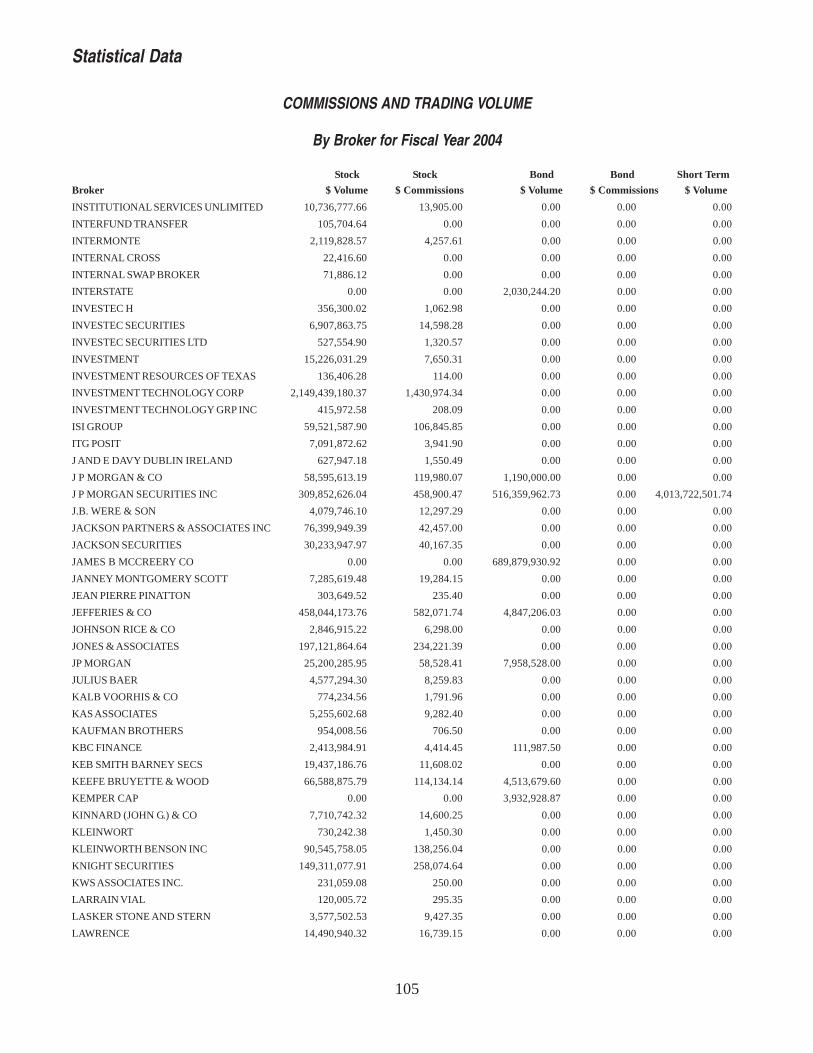
105
COMMISSIONS AND TRADING VOLUME
By Broker for Fiscal Year 2004
Stock Stock Bond Bond Short Term
Broker $ Volume $ Commissions $ Volume $ Commissions $ Volume
INSTITUTIONAL SERVICES UNLIMITED 10,736,777.66 13,905.00 0.00 0.00 0.00
INTERFUND TRANSFER 105,704.64 0.00 0.00 0.00 0.00
INTERMONTE 2,119,828.57 4,257.61 0.00 0.00 0.00
INTERNAL CROSS 22,416.60 0.00 0.00 0.00 0.00
INTERNAL SWAP BROKER 71,886.12 0.00 0.00 0.00 0.00
INTERSTATE 0.00 0.00 2,030,244.20 0.00 0.00
INVESTEC H 356,300.02 1,062.98 0.00 0.00 0.00
INVESTEC SECURITIES 6,907,863.75 14,598.28 0.00 0.00 0.00
INVESTEC SECURITIES LTD 527,554.90 1,320.57 0.00 0.00 0.00
INVESTMENT 15,226,031.29 7,650.31 0.00 0.00 0.00
INVESTMENT RESOURCES OF TEXAS 136,406.28 114.00 0.00 0.00 0.00
INVESTMENT TECHNOLOGY CORP 2,149,439,180.37 1,430,974.34 0.00 0.00 0.00
INVESTMENT TECHNOLOGY GRP INC 415,972.58 208.09 0.00 0.00 0.00
ISI GROUP 59,521,587.90 106,845.85 0.00 0.00 0.00
ITG POSIT 7,091,872.62 3,941.90 0.00 0.00 0.00
J AND E DAVY DUBLIN IRELAND 627,947.18 1,550.49 0.00 0.00 0.00
J P MORGAN & CO 58,595,613.19 119,980.07 1,190,000.00 0.00 0.00
J P MORGAN SECURITIES INC 309,852,626.04 458,900.47 516,359,962.73 0.00 4,013,722,501.74
J.B. WERE & SON 4,079,746.10 12,297.29 0.00 0.00 0.00
JACKSON PARTNERS & ASSOCIATES INC 76,399,949.39 42,457.00 0.00 0.00 0.00
JACKSON SECURITIES 30,233,947.97 40,167.35 0.00 0.00 0.00
JAMES B MCCREERY CO 0.00 0.00 689,879,930.92 0.00 0.00
JANNEY MONTGOMERY SCOTT 7,285,619.48 19,284.15 0.00 0.00 0.00
JEAN PIERRE PINATTON 303,649.52 235.40 0.00 0.00 0.00
JEFFERIES & CO 458,044,173.76 582,071.74 4,847,206.03 0.00 0.00
JOHNSON RICE & CO 2,846,915.22 6,298.00 0.00 0.00 0.00
JONES & ASSOCIATES 197,121,864.64 234,221.39 0.00 0.00 0.00
JP MORGAN 25,200,285.95 58,528.41 7,958,528.00 0.00 0.00
JULIUS BAER 4,577,294.30 8,259.83 0.00 0.00 0.00
KALB VOORHIS & CO 774,234.56 1,791.96 0.00 0.00 0.00
KAS ASSOCIATES 5,255,602.68 9,282.40 0.00 0.00 0.00
KAUFMAN BROTHERS 954,008.56 706.50 0.00 0.00 0.00
KBC FINANCE 2,413,984.91 4,414.45 111,987.50 0.00 0.00
KEB SMITH BARNEY SECS 19,437,186.76 11,608.02 0.00 0.00 0.00
KEEFE BRUYETTE & WOOD 66,588,875.79 114,134.14 4,513,679.60 0.00 0.00
KEMPER CAP 0.00 0.00 3,932,928.87 0.00 0.00
KINNARD (JOHN G.) & CO 7,710,742.32 14,600.25 0.00 0.00 0.00
KLEINWORT 730,242.38 1,450.30 0.00 0.00 0.00
KLEINWORTH BENSON INC 90,545,758.05 138,256.04 0.00 0.00 0.00
KNIGHT SECURITIES 149,311,077.91 258,074.64 0.00 0.00 0.00
KWS ASSOCIATES INC. 231,059.08 250.00 0.00 0.00 0.00
LARRAIN VIAL 120,005.72 295.35 0.00 0.00 0.00
LASKER STONE AND STERN 3,577,502.53 9,427.35 0.00 0.00 0.00
LAWRENCE 14,490,940.32 16,739.15 0.00 0.00 0.00
Statistical Data

106
COMMISSIONS AND TRADING VOLUME
By Broker for Fiscal Year 2004
Stock Stock Bond Bond Short Term
Broker $ Volume $ Commissions $ Volume $ Commissions $ Volume
LAZARD BROS CAPITAL MKT 2,843,556.80 3,383.95 0.00 0.00 0.00
LAZARD FRERES & CO 14,654,412.52 17,598.00 1,688,848.00 0.00 0.00
LEERINK SW 12,040,288.79 11,977.85 0.00 0.00 0.00
LEGG MASON 19,791,155.32 43,017.65 58,569,508.20 0.00 0.00
LEHMAN BROS INC 1,385,130,344.15 1,250,891.21 423,239,351.60 0.00 2,062,191,432.10
LEHMAN BROTHERS 0.00 0.00 2,986,370.78 0.00 0.00
LEHMAN BROTHERS INC 851,140,721.49 983,642.14 7,219,317,218.89 1,020.00 14,841,634.30
LEHMAN GOVT SECURITIES 344,022.49 512.69 4,105,763,448.09 0.00 0.00
LIQUIDNETI 281,650,774.24 205,785.02 0.00 0.00 0.00
LOEWEN 183,300.20 457.54 0.00 0.00 0.00
LOOP CAPITAL 1,172,095.80 2,210.00 0.00 0.00 0.00
LYNCH, JONES & RYAN 199,235,624.90 274,908.84 0.00 0.00 0.00
MACQUARIE EQUITIES 1,999,536.41 6,016.66 0.00 0.00 0.00
MAGNA SECURITIES CORP 6,133,530.92 15,764.25 513,825.00 0.00 0.00
MAINFIRST 1,576,223.80 2,599.79 0.00 0.00 0.00
MALONEY & CO 2,448,678.90 2,121.52 0.00 0.00 0.00
MARUSAN SECURITIES CO. LTD 4,795,219.84 7,182.05 0.00 0.00 0.00
MAXCOR FINANCIAL INC 299,655.25 1,782.00 0.00 0.00 0.00
MCDANIEL LEWIS & CO 4,095,690.20 2,468.36 0.00 0.00 0.00
MCDONALD & COMPANY 12,346,736.19 28,020.26 19,461,165.30 0.00 0.00
MERRILL LYNCH 577,696,248.09 915,882.37 16,700,519.83 0.00 3,952,227,235.59
MERRILL LYNCH INTERNATIONAL 2,279,016.48 6,875.72 0.00 0.00 0.00
MERRILL LYNCH P F & S 3,224,184.33 7,400.63 1,010,431,963.15 280.00 10,390,500.80
MERRILL LYNCH PIERCE 11,767,490.09 10,923.74 18,336,781.25 0.00 0.00
MERRIL-PERFORMANCE MEASURE 1,224,875,088.50 1,304,504.53 3,986,204,833.70 61,660.28 6,012,373.50
MERRIMAN 1,481,715.58 2,949.75 0.00 0.00 0.00
MERRION CAPITAL GROUP 3,731,948.40 5,772.26 0.00 0.00 0.00
MESIROW AND COMPANY 0.00 0.00 13,277,479.17 0.00 0.00
MESIROW FINANCIAL INC 0.00 0.00 3,004,380.00 0.00 149,877,690.27
MIDLAND MANAGEMENT CORP 469,766.88 864.99 0.00 0.00 0.00
MIDWEST RESEARCH 73,498,668.52 72,489.76 0.00 0.00 0.00
MILLER TABAK HIRCH 206,056.28 940.50 0.00 0.00 0.00
MINOT MCDUFFIE 0.00 0.00 14,122.31 0.00 0.00
MIZUHO CORP 647,125.10 1,296.84 0.00 0.00 0.00
MIZUHO INT 222,389.34 443.89 0.00 0.00 0.00
MIZUHO SECURITIES 1,960,236.19 3,506.24 63,639,866.25 0.00 0.00
MONNESS CRESPI HARDT 1,303,224.53 4,697.50 0.00 0.00 0.00
MONTGOMERY SECURITIES 211,416,020.79 222,125.85 1,438,122,567.96 0.00 0.00
MORGAN GRENFELL 641,111.12 1,878.64 0.00 0.00 0.00
MORGAN KEEGAN INC. 32,909,300.68 62,587.50 6,980,028.78 0.00 0.00
MORGAN STANLEY 140,043,721.49 293,005.78 235,425,204.26 0.00 0.00
MORGAN STANLEY & CO 2,787,692,942.49 1,413,074.15 7,722,067,364.41 0.00 4,321,122,484.09
MORGAN STANLEY INDIA SEC PRVT 7,689,317.47 9,981.96 0.00 0.00 0.00
NATIONAL AUSTRALIA BANK LIMITED 0.00 0.00 3,915,125.00 0.00 0.00
Statistical Data

107
COMMISSIONS AND TRADING VOLUME
By Broker for Fiscal Year 2004
Stock Stock Bond Bond Short Term
Broker $ Volume $ Commissions $ Volume $ Commissions $ Volume
NATIONAL FINANCIAL 23,188,162.53 31,805.63 0.00 0.00 0.00
NBC CAP MKTS CORP INC 0.00 0.00 4,157,360.00 0.00 0.00
NBC LEVESQUE 1,693,888.35 4,224.16 0.00 0.00 0.00
NCNB CAPITAL 0.00 0.00 2,095,540.00 0.00 0.00
NED DAVIS & CO 73,335.05 141.20 0.00 0.00 0.00
NESBITT BURNS 3,430,126.06 7,943.49 0.00 0.00 0.00
NEUBERGER & BERMAN 30,171,018.33 51,117.49 0.00 0.00 0.00
NEWBRIDGE SECURITIES 286,184.61 237.00 0.00 0.00 0.00
NOMURA INTL LONDON-SECS 1,926,282.44 3,860.28 0.00 0.00 0.00
NOMURA SEC 4,250,737.08 12,772.09 196,105.39 0.00 0.00
NOMURA SECURITIES INTL 76,827,134.61 113,990.37 379,810,210.88 0.00 19,170,000,000.00
NOMURA SINGAPORE LTD 188,661.48 948.24 0.00 0.00 0.00
NORDEA INV 0.00 0.00 3,167,339.16 0.00 0.00
NUMIS SECURITIES LTD 1,082,267.36 1,612.89 0.00 0.00 0.00
NUTMEG SECURITIES 190,048,462.87 107,266.98 0.00 0.00 0.00
ODDO FINANCE 1,166,258.17 2,337.20 0.00 0.00 0.00
OPPENHEIMER & CO 165,616,970.26 203,497.67 3,979,124.65 0.00 0.00
ORMES CAPITAL 28,736,957.62 31,622.40 0.00 0.00 0.00
OSCAR GRUSSMAN 16,043,727.80 19,743.00 0.00 0.00 0.00
OTA LTD PARTNERSHIP 98,449.28 143.57 0.00 0.00 0.00
OYAK MENKU 913,070.20 2,793.37 0.00 0.00 0.00
PACIFIC CR 7,562,605.06 17,918.20 0.00 0.00 0.00
PACIFIC GROWTH EQUITIES 2,469,211.66 5,498.50 0.00 0.00 0.00
PACIFIC SECURITIES INC. 442,731.15 884.76 0.00 0.00 0.00
PAINE WEBBER INC 0.00 0.00 1,411,917,368.69 0.00 0.00
PAINE WEBBER J & C 19,179,409.14 33,861.80 34,492,240.83 0.00 0.00
PARAMOUNT BROKERAGE CO 5,416,077.01 6,650.56 0.00 0.00 0.00
PARIBAS CAPITAL MARKETS 631,139.40 1,363.91 0.00 0.00 0.00
PARIBAS CO 0.00 0.00 13,937,507.37 0.00 0.00
PARK RAYMOND 227,436.48 1,162.69 0.00 0.00 0.00
PARKMIX LTD 613,197.10 3,082.01 0.00 0.00 0.00
PAULSEN, DOWLING 7,990,043.05 6,687.00 0.00 0.00 0.00
PCS SECURITIES INC. 9,693,227.16 13,995.00 0.00 0.00 0.00
PENSION FINANCIAL SERVICES INC. 1,263,839.08 954.32 0.00 0.00 0.00
PERSH PERSHING DIV OF DLJ 829,567.04 2,070.60 0.00 0.00 0.00
PERSHING SECURITIES LTD 48,520,151.41 47,721.89 16,167,407.52 0.00 0.00
PETRON SECURITIES LTD 0.00 0.00 32,526,145.39 0.00 0.00
PHILLIPS & DREW 4,918,465.12 0.00 0.00 0.00 0.00
PICTET & CO 13,022,476.06 22,613.30 0.00 0.00 0.00
PIONEER SECURITIES INC. 0.00 0.00 559,438,610.51 0.00 249,953.25
PIPER,JAFFRAY & HOP S 58,360,377.05 105,740.50 35,942,657.22 0.00 0.00
POLCARI 2,160,833.85 4,382.70 0.00 0.00 0.00
PORTALES P 76,512.41 80.00 0.00 0.00 0.00
Statistical Data
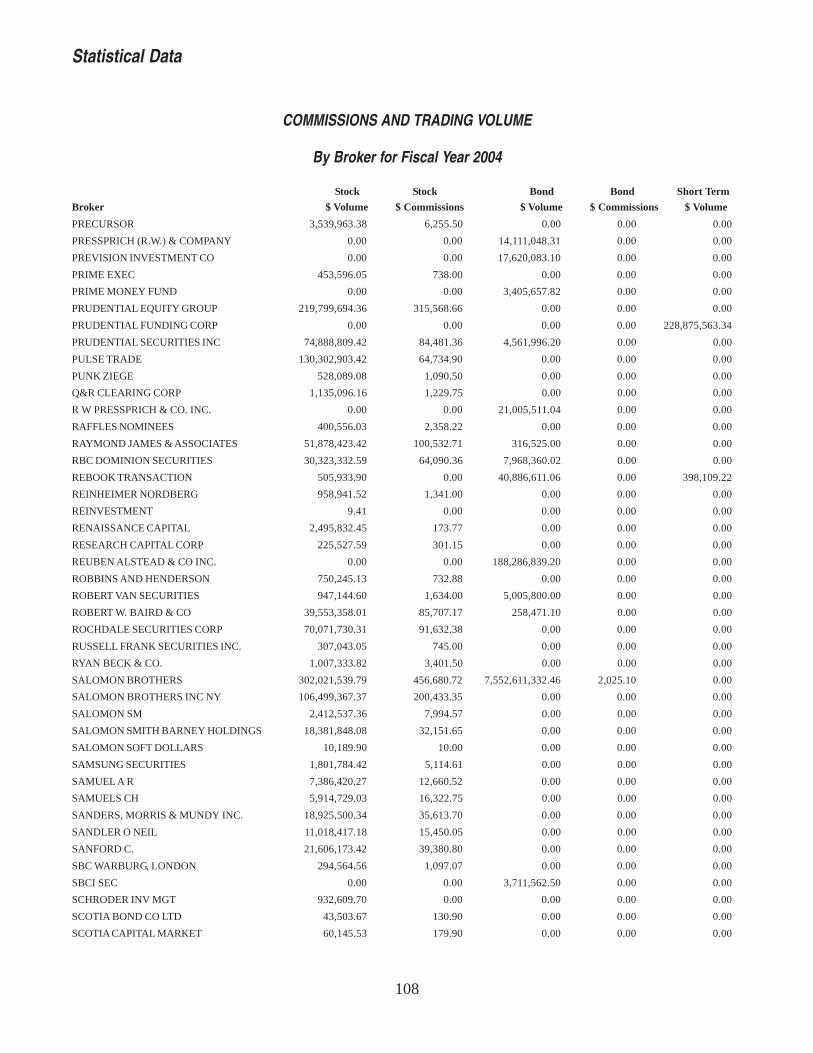
108
COMMISSIONS AND TRADING VOLUME
By Broker for Fiscal Year 2004
Stock Stock Bond Bond Short Term
Broker $ Volume $ Commissions $ Volume $ Commissions $ Volume
PRECURSOR 3,539,963.38 6,255.50 0.00 0.00 0.00
PRESSPRICH (R.W.) & COMPANY 0.00 0.00 14,111,048.31 0.00 0.00
PREVISION INVESTMENT CO 0.00 0.00 17,620,083.10 0.00 0.00
PRIME EXEC 453,596.05 738.00 0.00 0.00 0.00
PRIME MONEY FUND 0.00 0.00 3,405,657.82 0.00 0.00
PRUDENTIAL EQUITY GROUP 219,799,694.36 315,568.66 0.00 0.00 0.00
PRUDENTIAL FUNDING CORP 0.00 0.00 0.00 0.00 228,875,563.34
PRUDENTIAL SECURITIES INC 74,888,809.42 84,481.36 4,561,996.20 0.00 0.00
PULSE TRADE 130,302,903.42 64,734.90 0.00 0.00 0.00
PUNK ZIEGE 528,089.08 1,090.50 0.00 0.00 0.00
Q&R CLEARING CORP 1,135,096.16 1,229.75 0.00 0.00 0.00
R W PRESSPRICH & CO. INC. 0.00 0.00 21,005,511.04 0.00 0.00
RAFFLES NOMINEES 400,556.03 2,358.22 0.00 0.00 0.00
RAYMOND JAMES & ASSOCIATES 51,878,423.42 100,532.71 316,525.00 0.00 0.00
RBC DOMINION SECURITIES 30,323,332.59 64,090.36 7,968,360.02 0.00 0.00
REBOOK TRANSACTION 505,933.90 0.00 40,886,611.06 0.00 398,109.22
REINHEIMER NORDBERG 958,941.52 1,341.00 0.00 0.00 0.00
REINVESTMENT 9.41 0.00 0.00 0.00 0.00
RENAISSANCE CAPITAL 2,495,832.45 173.77 0.00 0.00 0.00
RESEARCH CAPITAL CORP 225,527.59 301.15 0.00 0.00 0.00
REUBEN ALSTEAD & CO INC. 0.00 0.00 188,286,839.20 0.00 0.00
ROBBINS AND HENDERSON 750,245.13 732.88 0.00 0.00 0.00
ROBERT VAN SECURITIES 947,144.60 1,634.00 5,005,800.00 0.00 0.00
ROBERT W. BAIRD & CO 39,553,358.01 85,707.17 258,471.10 0.00 0.00
ROCHDALE SECURITIES CORP 70,071,730.31 91,632.38 0.00 0.00 0.00
RUSSELL FRANK SECURITIES INC. 307,043.05 745.00 0.00 0.00 0.00
RYAN BECK & CO. 1,007,333.82 3,401.50 0.00 0.00 0.00
SALOMON BROTHERS 302,021,539.79 456,680.72 7,552,611,332.46 2,025.10 0.00
SALOMON BROTHERS INC NY 106,499,367.37 200,433.35 0.00 0.00 0.00
SALOMON SM 2,412,537.36 7,994.57 0.00 0.00 0.00
SALOMON SMITH BARNEY HOLDINGS 18,381,848.08 32,151.65 0.00 0.00 0.00
SALOMON SOFT DOLLARS 10,189.90 10.00 0.00 0.00 0.00
SAMSUNG SECURITIES 1,801,784.42 5,114.61 0.00 0.00 0.00
SAMUEL A R 7,386,420.27 12,660.52 0.00 0.00 0.00
SAMUELS CH 5,914,729.03 16,322.75 0.00 0.00 0.00
SANDERS, MORRIS & MUNDY INC. 18,925,500.34 35,613.70 0.00 0.00 0.00
SANDLER O NEIL 11,018,417.18 15,450.05 0.00 0.00 0.00
SANFORD C. 21,606,173.42 39,380.80 0.00 0.00 0.00
SBC WARBURG, LONDON 294,564.56 1,097.07 0.00 0.00 0.00
SBCI SEC 0.00 0.00 3,711,562.50 0.00 0.00
SCHRODER INV MGT 932,609.70 0.00 0.00 0.00 0.00
SCOTIA BOND CO LTD 43,503.67 130.90 0.00 0.00 0.00
SCOTIA CAPITAL MARKET 60,145.53 179.90 0.00 0.00 0.00
Statistical Data

109
COMMISSIONS AND TRADING VOLUME
By Broker for Fiscal Year 2004
Stock Stock Bond Bond Short Term
Broker $ Volume $ Commissions $ Volume $ Commissions $ Volume
SCOTIA MCLEOD 9,474,759.03 15,247.79 6,516,345.39 0.00 0.00
SCOTT & STRINGFELLOW 13,162,234.15 27,872.35 2,410,755.17 0.00 0.00
SEASONGOOD & MAYER 0.00 0.00 279,300.00 0.00 0.00
SEATTLE NORTHWEST SECURITIES COR 0.00 0.00 732,577.35 0.00 0.00
SECURITY PLANNING COMPANY 864,623.52 1,596.49 0.00 0.00 0.00
SEI INVESTMENT 243,329.25 1,303.50 0.00 0.00 0.00
SERVICE ASSET MANAGEMENT COMPA 3,973,255.11 1,658.64 0.00 0.00 0.00
SG COWEN SECURITIES CORP 6,417,324.39 13,293.25 0.00 0.00 0.00
SG SECURITIES 3,981,025.14 6,929.66 0.00 0.00 0.00
SIDOTI 6,261,637.62 12,560.25 0.00 0.00 0.00
SIMMONS + 1,338,238.68 1,057.05 0.00 0.00 0.00
SIMMONS FIRST NATL BANK 0.00 0.00 35,616,179.05 0.00 0.00
SK INTERNATIONAL SECURITIES 53,236,973.10 56,378.50 0.00 0.00 0.00
SMITH BARNEY & COMPANY 0.00 0.00 2,673,691.67 0.00 0.00
SOCIETE GE 8,785,814.04 14,093.55 0.00 0.00 0.00
SOCIETE GENERAL 9,842.50 53.50 0.00 0.00 0.00
SOCIETE GENERALE NA 0.00 0.00 0.00 0.00 1,165,796,192.71
SOUNDVIEW 2,976,592.02 5,308.25 0.00 0.00 0.00
SOUTHWEST SECURITIES 10,092,985.82 10,841.45 0.00 0.00 0.00
SOVEREIGN SECURITIES 0.00 0.00 300,242.80 0.00 0.00
SPEAR,LEEDS & KELLOGG 17,899,581.75 9,759.21 30,800,311.65 0.00 0.00
SS KANTIISHWARLAL LTD 3,368,137.13 13,432.87 0.00 0.00 0.00
SSANGYONG INVESTMENTS 1,381,481.35 4,587.84 0.00 0.00 0.00
SSGA EXTERNAL 5,736,088.11 0.00 0.00 0.00 0.00
STANDARD & POOR SECURITIES 117,975,008.76 176,935.50 0.00 0.00 0.00
STANDARD BANK OF SA JOHANNESBUR 566,708.49 1,413.18 0.00 0.00 0.00
STATE BOARD OF INVESTMENT 0.00 0.00 25,137,559.00 0.00 0.00
STATE ST BK & TRUST 157,368,499.81 174,242.67 7,701.16 0.00 25,987,766,230.68
STATUS SECURITIES 753,745.17 746.10 0.00 0.00 0.00
STEPHENS, INC. 7,819,582.97 12,930.85 4,500,108.05 0.00 0.00
STEVEN AMES 0.00 0.00 11,007,296.88 0.00 0.00
STIFEL NICOLAUS & COMPANY 4,713,390.35 5,074.50 0.00 0.00 0.00
STOKES HOYT & CO. 0.00 0.00 40,700.00 0.00 0.00
SUN EQUITIES INC 0.00 0.00 36,321,371.15 0.00 0.00
SUNTRUST CAPITAL MARKETS INC 28,024,230.60 65,967.15 0.00 0.00 0.00
SUSQUEHANNA FINANCIAL GROUP 20,277.48 53.40 0.00 0.00 0.00
SVENSKA HANDELSBANKEN 1,543,128.30 3,082.00 0.00 0.00 0.00
SWISS AMERICAN SECURITIES 562,622.50 1,127.50 0.00 0.00 0.00
SWISS BANK 243,926,617.94 386,043.32 4,407,995,503.39 0.00 0.00
TEATHER AND GREENWOOD 5,421,629.62 6,058.03 0.00 0.00 0.00
THOMAS C BOWLES & CO. 1,063,117.88 4,326.00 12,114,857.45 0.00 0.00
THOMAS WEISEL PARTNERS 71,949,150.61 128,594.88 0.00 0.00 0.00
THOMASON INV 1,468,413.46 9,564.50 0.00 0.00 0.00
TMR SECURITIES INC 0.00 0.00 10,735,434.88 0.00 0.00
Statistical Data

110
COMMISSIONS AND TRADING VOLUME
By Broker for Fiscal Year 2004
Stock Stock Bond Bond Short Term
Broker $ Volume $ Commissions $ Volume $ Commissions $ Volume
TOKAI BANK LONDON 1,881,985.01 3,137.65 0.00 0.00 0.00
TOKYO MITSUBISHI 4,880,638.85 6,684.70 0.00 0.00 0.00
TORONTO DOMINION SEC INC 95,531,019.00 92,702.10 0.00 0.00 24,990,083.33
TROIKA MOSCOW 133,910.00 0.00 0.00 0.00 0.00
TULLET LIBERTY INC 67,168.89 235.00 0.00 0.00 0.00
U.S. CLEARING 60,610,140.81 66,419.70 0.00 0.00 0.00
UBS AG 83,489,681.32 163,476.77 2,480,507.80 0.00 0.00
UBS SECURITIES 139,450,435.47 299,788.25 922,025.00 0.00 8,862,681,375.19
UBS WARBUR 653,766.48 667.60 34,513,045.24 0.00 0.00
UBS WARBURG 294,398.68 881.90 0.00 0.00 0.00
UBS-DB CORPORATION 450,761.21 1,155.00 54,079,883.72 0.00 0.00
UNITED FINANCIAL CORPORATION 1,194,958.40 0.00 0.00 0.00 0.00
UNITED SERVICES PLANNING ASSOC 0.00 0.00 124,076,883.86 0.00 0.00
UNTERBURG HARRIS & DESANTIS 12,013,812.51 38,016.80 0.00 0.00 0.00
UNX INC. 25,485.62 16.50 0.00 0.00 0.00
UOB KAY HIAM PVT LTD, SINGAPORE 50,587.65 151.28 0.00 0.00 0.00
UTENDAHL 950,475.51 1,455.00 14,158,780.69 0.00 0.00
VANDHAM SECURITIES 4,293,890.25 5,930.00 0.00 0.00 0.00
VERITAS SECURITIES 686,789.49 938.00 0.00 0.00 0.00
VIANET DIRECT INC. 26,830.16 16.00 0.00 0.00 0.00
WACHOVIA BANK 0.00 0.00 10,002,812.51 0.00 0.00
WAGNER STOTT & CO. 315,144,851.44 277,894.58 0.00 0.00 0.00
WALL STREET PLANNING INC. 0.00 0.00 2,623,431.00 0.00 4,072,319.10
WARBURG DI 11,831,371.95 11,258.17 0.00 0.00 0.00
WARBURG S.G. 8,304,760.58 18,089.00 0.00 0.00 0.00
WARBURG, DILLON READ 138,695,548.59 294,795.95 0.00 0.00 0.00
WASHINGTON NATIONAL EQUITY CO 0.00 0.00 944,905.72 0.00 0.00
WAVE SECURITIES 30,693,292.00 15,291.50 0.00 0.00 0.00
WEDBUSH SECURITIES 19,540,046.91 45,607.75 0.00 0.00 0.00
WEEDEN & COMPANY 138,239,928.45 166,637.66 0.00 0.00 0.00
WEISS 21,516,108.09 20,048.40 0.00 0.00 0.00
WELLS FARGO BANK 7,020,332.57 11,099.50 0.00 0.00 0.00
WELLS FARGO INSTITUTL BROK & SAL 0.00 0.00 110,858.00 0.00 25,000,000.00
WERE STOCKBROKING LTD 6,369,517.57 19,090.47 0.00 0.00 0.00
WESTDEUTSCHE LANDESBANK 5,173,337.18 10,326.01 0.00 0.00 0.00
WESTMINSTER 58,179,346.81 172,580.00 0.00 0.00 0.00
WESTPAC AUSTRALIA 0.00 0.00 28,915.07 0.00 0.00
WESTPAC BK 0.00 0.00 4,407,954.69 0.00 0.00
WEXFORD CLEARING SVCS CORP 14,020,924.28 11,194.00 0.00 0.00 0.00
WHEATON FIRST SECURITIES INC 4,615,959.10 6,205.50 3,663,355.48 0.00 0.00
WHITE CAP TRADING 1,699,891.59 1,181.95 0.00 0.00 0.00
WILIAM R. HOUGH & CO 312,514.72 0.00 42,677.50 0.00 0.00
WILLIAM BLAIR & CO. 0.00 0.00 11,766,600.88 0.00 0.00
WILLIAM JENNINGS & CO INC. 1,832,150.86 1,878.10 0.00 0.00 0.00
Statistical Data
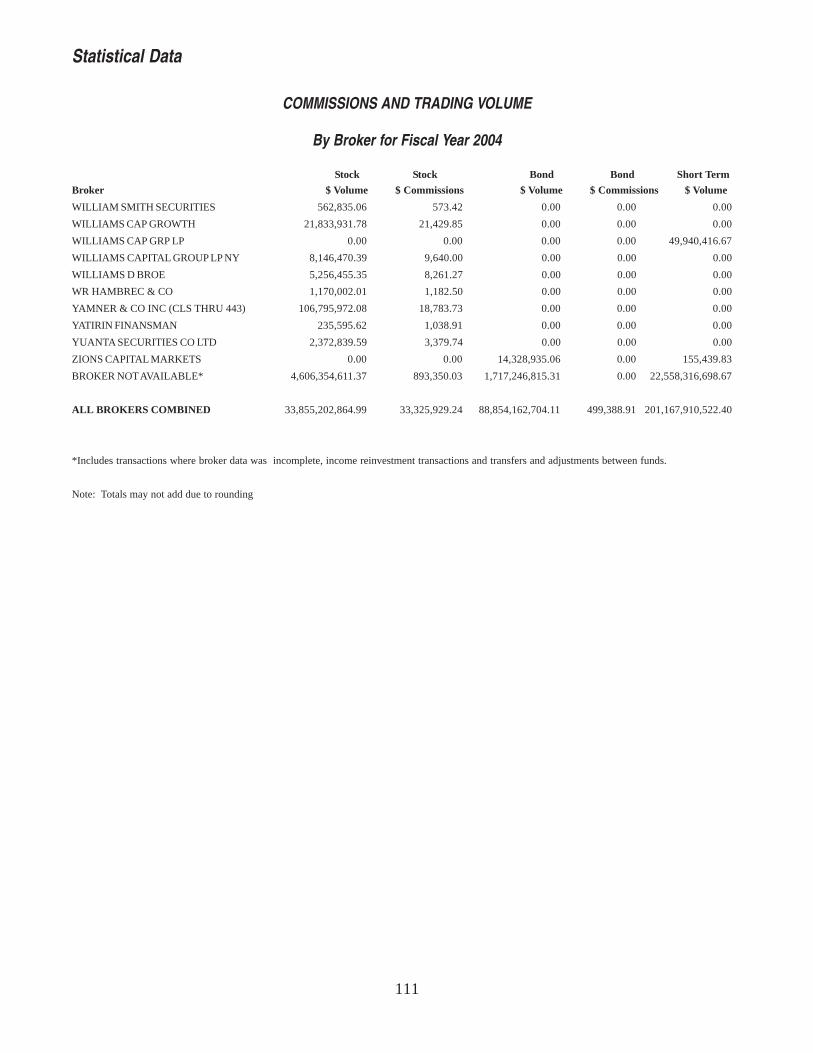
111
COMMISSIONS AND TRADING VOLUME
By Broker for Fiscal Year 2004
Stock Stock Bond Bond Short Term
Broker $ Volume $ Commissions $ Volume $ Commissions $ Volume
WILLIAM SMITH SECURITIES 562,835.06 573.42 0.00 0.00 0.00
WILLIAMS CAP GROWTH 21,833,931.78 21,429.85 0.00 0.00 0.00
WILLIAMS CAP GRP LP 0.00 0.00 0.00 0.00 49,940,416.67
WILLIAMS CAPITAL GROUP LP NY 8,146,470.39 9,640.00 0.00 0.00 0.00
WILLIAMS D BROE 5,256,455.35 8,261.27 0.00 0.00 0.00
WR HAMBREC & CO 1,170,002.01 1,182.50 0.00 0.00 0.00
YAMNER & CO INC (CLS THRU 443) 106,795,972.08 18,783.73 0.00 0.00 0.00
YATIRIN FINANSMAN 235,595.62 1,038.91 0.00 0.00 0.00
YUANTA SECURITIES CO LTD 2,372,839.59 3,379.74 0.00 0.00 0.00
ZIONS CAPITAL MARKETS 0.00 0.00 14,328,935.06 0.00 155,439.83
BROKER NOT AVAILABLE* 4,606,354,611.37 893,350.03 1,717,246,815.31 0.00 22,558,316,698.67
ALL BROKERS COMBINED 33,855,202,864.99 33,325,929.24 88,854,162,704.11 499,388.91 201,167,910,522.40
*Includes transactions where broker data was incomplete, income reinvestment transactions and transfers and adjustments between funds.
Note: Totals may not add due to rounding
Statistical Data

112
This page intentionally left blank.
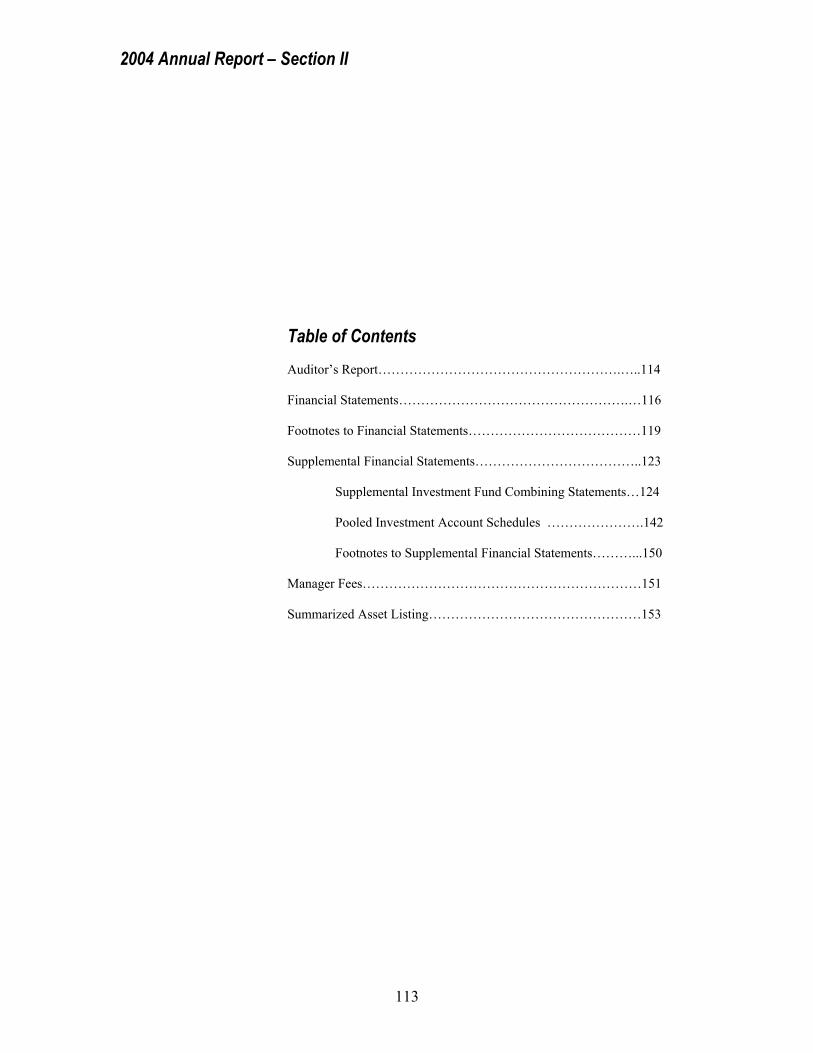
2004 Annual Report – Section II
113
Table of Contents Auditor’s Report……………………………………………….…..114 Financial Statements…………………………………………….…116 Footnotes to Financial Statements…………………………………119 Supplemental Financial Statements………………………………..123 Supplemental Investment Fund Combining Statements…124 Pooled Investment Account Schedules ………………….142 Footnotes to Supplemental Financial Statements………...150 Manager Fees………………………………………………………151 Summarized Asset Listing…………………………………………153

114
OFFICE OF THE LEGISLATIVE AUDITOR State of Minnesota � James Nobles, Legislative Auditor
Independent Auditor’s Report
Members of the State Board of Investment and Howard J. Bicker, Executive Director State Board of Investment We have audited the accompanying financial statements of the State of Minnesota’s Supplemental Investment Fund and the Post Retirement Investment Fund as of and for the year ended June 30, 2004, as shown on pages 116-121. These financial statements are the responsibility of the State Board of Investment’s management. Our responsibility is to express an opinion on these financial statements based on our audit. We conducted our audit in accordance with auditing standards generally accepted in the United States of America and the standards applicable to financial audits contained in Government Auditing Standards, issued by the Comptroller General of the United States. Those standards require that we plan and perform the audit to obtain reasonable assurance about whether the financial statements are free of material misstatement. An audit includes examining, on a test basis, evidence supporting the amounts and disclosures in the financial statements. An audit also includes assessing the accounting principles used and significant estimates made by management, as well as evaluating the overall financial statement presentation. We believe that our audit provides a reasonable basis for our opinion. The financial statements present only the Supplemental Investment Fund and the Post Retirement Investment Fund of the State of Minnesota and are not intended to present fairly the financial position and results of operation of the State Board of Investment or the State of Minnesota in conformity with accounting principles generally accepted in the United States of America. In our opinion, the financial statements of the Supplemental Investment Fund and the Post Retirement Investment Fund, referred to above, present fairly, in all material respects, the net assets as of June 30, 2004, and the changes in net assets and results of operations for the year then ended, in conformity with accounting principles generally accepted in the United States of America. In accordance with Government Auditing Standards, we will also issue our report dated December 14, 2004, on our consideration of the State Board of Investment’s internal control over financial reporting and on our tests of its compliance with certain provisions of laws, regulations, contracts, and other matters. The purpose of that report is to describe the scope of our testing of internal control over financial reporting and compliance and the results of that testing
Room 140, 658 Cedar Street, St. Paul, Minnesota 55155-1603 � Tel: 651/296-4708 � Fax: 651/296-4712 E-mail: [email protected] � TDD Relay: 651/297-5353 � Website: www.auditor.leg.state.mn.us
O L A

115
Members of the State Board of Investment and Howard J. Bicker, Executive Director Page 2 and not to provide an opinion on the internal control over financial reporting or on compliance. That report is an integral part of an audit performed in accordance with Government Auditing Standards and should be considered in assessing the results of our audit. Our audit was conducted for the purpose of forming an opinion on the financial statements taken as a whole. The supporting schedules on pages 123-170 are presented for the purpose of additional analysis and are not a required part of the financial statements of the Supplemental Investment and Post Retirement Funds of the State of Minnesota. Such information has been subject to the auditing procedures applied in the audit of the financial statements and, in our opinion, is fairly stated in all material respects in relation to the financial statements taken as a whole.
James R. Nobles Claudia J. Gudvangen, CPA Legislative Auditor Deputy Legislative Auditor December 14, 2004
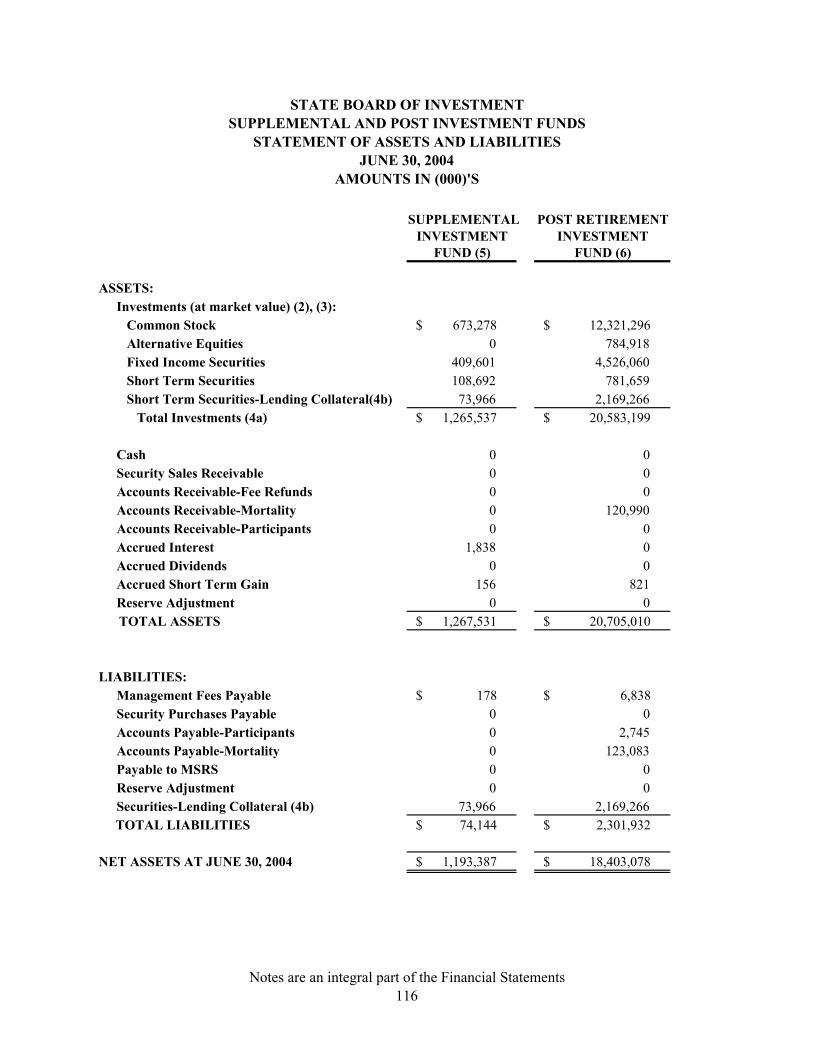
STATE BOARD OF INVESTMENTSUPPLEMENTAL AND POST INVESTMENT FUNDS
STATEMENT OF ASSETS AND LIABILITIESJUNE 30, 2004
AMOUNTS IN (000)'S
SUPPLEMENTAL POST RETIREMENTINVESTMENT INVESTMENT
FUND (5) FUND (6)
ASSETS:Investments (at market value) (2), (3): Common Stock 673,278 $ 12,321,296 $ Alternative Equities 0 784,918 Fixed Income Securities 409,601 4,526,060 Short Term Securities 108,692 781,659 Short Term Securities-Lending Collateral(4b) 73,966 2,169,266 Total Investments (4a) 1,265,537 $ 20,583,199 $
Cash 0 0 Security Sales Receivable 0 0 Accounts Receivable-Fee Refunds 0 0 Accounts Receivable-Mortality 0 120,990 Accounts Receivable-Participants 0 0 Accrued Interest 1,838 0 Accrued Dividends 0 0 Accrued Short Term Gain 156 821 Reserve Adjustment 0 0
TOTAL ASSETS 1,267,531 $ 20,705,010 $
LIABILITIES:Management Fees Payable 178 $ 6,838 $ Security Purchases Payable 0 0 Accounts Payable-Participants 0 2,745 Accounts Payable-Mortality 0 123,083 Payable to MSRS 0 0 Reserve Adjustment 0 0 Securities-Lending Collateral (4b) 73,966 2,169,266
TOTAL LIABILITIES 74,144 $ 2,301,932 $
NET ASSETS AT JUNE 30, 2004 1,193,387 $ 18,403,078 $
Notes are an integral part of the Financial Statements116

STATE BOARD OF INVESTMENT SUPPLEMENTAL AND POST INVESTMENT FUNDS
STATEMENT OF CHANGES IN NET ASSETSYEAR ENDED JUNE 30, 2004
AMOUNTS IN (000)'S
SUPPLEMENTAL POST RETIREMENTINVESTMENT INVESTMENT
FUND FUND
FROM UNDISTRIBUTED INCOME:Net Investment Income 86,270 $ 1,598,543 $ Realized Gains (Losses) 41,283 34,146 Unrealized Gains (Losses) 69,363 990,319
TOTAL INCOME 196,916 $ 2,623,008 $
Less Distribution To Participant Accounts 196,916) ( 2,623,008) ( Undistributed Dedicated Income 0 0 Net Change From Undistributed Income 0 $ 0 $
FROM PARTICIPANT TRANSACTIONS:
Additions To Participant Accounts Participant Contributions 270,298 1,599,763 Income Distribution 196,920 2,623,007 Income To Be Distributed 0 0
Total Additions 467,218 $ 4,222,770 $ Deductions From Participant Accounts Withdrawals 768,856 2,352,626
Total Deductions 768,856 $ 2,352,626 $ Net From Participant Transactions 301,638) ($ 1,870,144 $
TOTAL CHANGE IN ASSETS 301,638) ($ 1,870,144 $
NET ASSETS:Beginning Of Period 1,495,025 16,532,934 End Of Period 1,193,387 $ 18,403,078 $
Notes are an integral part of the Financial Statements117
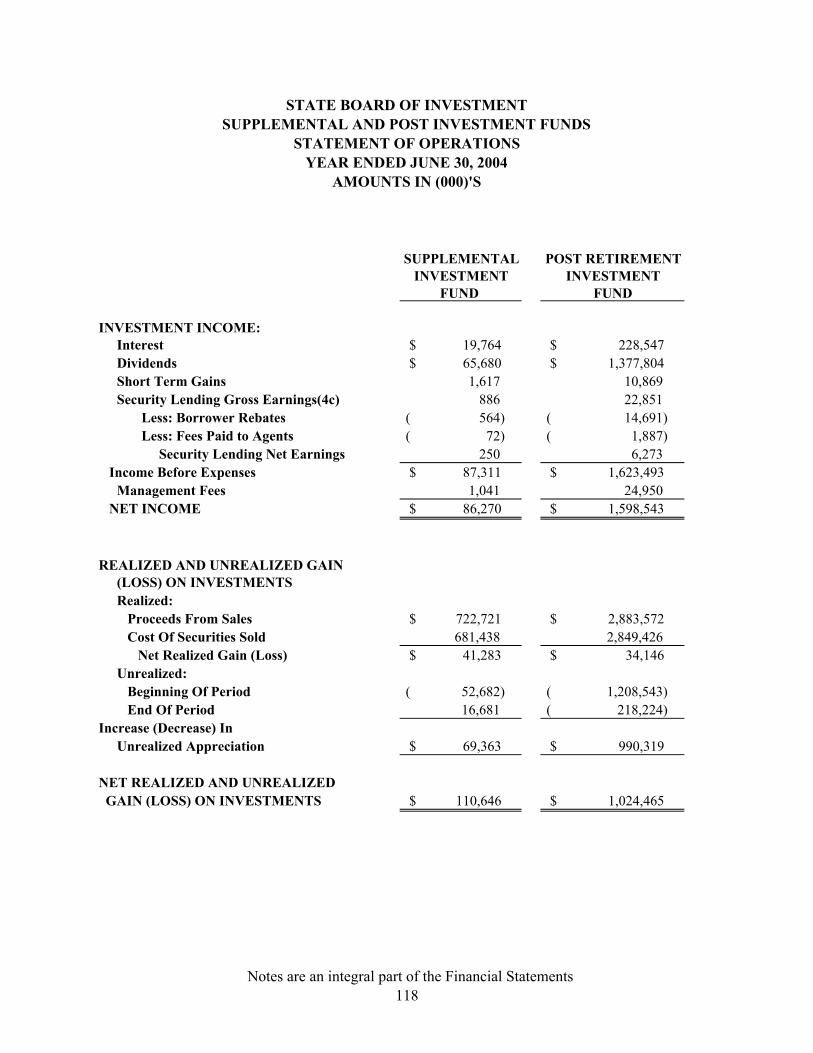
STATE BOARD OF INVESTMENTSUPPLEMENTAL AND POST INVESTMENT FUNDS
STATEMENT OF OPERATIONSYEAR ENDED JUNE 30, 2004
AMOUNTS IN (000)'S
SUPPLEMENTAL POST RETIREMENTINVESTMENT INVESTMENT
FUND FUND
INVESTMENT INCOME:Interest 19,764 $ 228,547 $ Dividends 65,680 $ 1,377,804 $ Short Term Gains 1,617 10,869 Security Lending Gross Earnings(4c) 886 22,851 Less: Borrower Rebates 564) ( 14,691) ( Less: Fees Paid to Agents 72) ( 1,887) ( Security Lending Net Earnings 250 6,273
Income Before Expenses 87,311 $ 1,623,493 $ Management Fees 1,041 24,950
NET INCOME 86,270 $ 1,598,543 $
REALIZED AND UNREALIZED GAIN (LOSS) ON INVESTMENTSRealized: Proceeds From Sales 722,721 $ 2,883,572 $ Cost Of Securities Sold 681,438 2,849,426 Net Realized Gain (Loss) 41,283 $ 34,146 $ Unrealized: Beginning Of Period 52,682) ( 1,208,543) ( End Of Period 16,681 218,224) (
Increase (Decrease) In Unrealized Appreciation 69,363 $ 990,319 $
NET REALIZED AND UNREALIZED GAIN (LOSS) ON INVESTMENTS 110,646 $ 1,024,465 $
Notes are an integral part of the Financial Statements118

NOTES TO THE FINANCIAL STATEMENTS JUNE 30, 2004
119
1. SUMMARY OF SIGNIFICANT ACCOUNTING POLICIES Financial Reporting Entity and Basis of Presentation: This report includes financial statements for the Supplemental Investment, and Post Retirement Trust Funds of the State of Minnesota, which are administered by the State Board of Investment under authority of Minnesota Statutes Chapter 11A. The financial statements presented for these funds are based on the preferred accounting practices described in the American Institute of Certified Public Accountants audit guide, "Audits of Investment Companies". These practices, and the significant accounting policies which follow, conform with generally accepted accounting principles. Authorized Investments: Minnesota Statutes, Section 11A.24 broadly restricts investments to obligations and stocks of the U.S. and Canadian governments, their agencies and their registered corporations; short term obligations of specified high quality; international securities; restricted participation as a limited partner in venture capital, real estate or resource equity investments; and restricted participation in registered mutual funds. Risk Categories: At June 30, 2004, all investments of the Investment Trust Funds and pooled investment accounts are in risk category 1, and are insured or registered, or are held by the state or its agent in the state's name. In addition, all security lending transactions are collateralized by at least 100% of the value of loaned securities. A State Board of Investment policy, which limits transactions to those with primary government securities dealers whose net excess capital is greater than $200,000,000 reduces the state’s investment risk for repurchase agreements. Security Valuation: All securities are valued at market except for U.S. Government short-term securities and commercial paper, which are valued at market less accrued interest. Accrued short-term interest is recognized as income as part of "Short-Term Gain". For long-term fixed income securities the SBI uses the Merrill Lynch valuation system. This pricing service is capable of providing prices for both actively traded and privately placed bonds. For equity securities the State Board uses a valuation service provided by Financial Control Systems, Inc. The basis for determining the fair value of investments that are not based on market quotations includes audited financial statements, analysis of future cash flows, and independent appraisals.
Recognition of Security Transactions: Security transactions are accounted for on the date the securities are purchased or sold. Income Recognition: Pool dividend income is recorded on the ex-dividend date. Pool interest and dividend income are accrued monthly. Short-term interest is accrued monthly and is presented as "Accrued Short-Term Gain". Amortization of Fixed Income Securities: Premiums and discounts on fixed income purchases are amortized over the remaining life of the security using the "Effective Interest Method". Loaning Securities: State Statutes do not prohibit the SBI from participating in security lending. As such, domestic and international corporate securities as well as certain US Government and Government Agency securities are loaned out by the State Board to banks and brokers for additional income. Collateral in the amount of 100% of the market value of the security loaned is required. The collateral held and the market value of securities on loan for the State Board as of June 30, 2004 were $4,668,704,112.81 and $4,552,158,475.11 respectively. The SBI utilizes State Street Bank (SSB) to manage its Securities Lending program. SSB provides the SBI indemnification in the event a borrower defaults by failing to return a loaned security. 2. PORTFOLIO LISTING Asset listings summarizing the securities held by these funds can be found starting on page 153 of this report. A complete listing is available by contacting the State Board's office. Fixed income and equity securities are presented at market value. 3. COST OF INVESTMENTS At June 30, 2004, the cost of investments for the Trust Funds, excluding security lending collateral, was: Supplemental Investment Fund $ 1,176,389,747 Post Retirement Fund $ 18,632,977,140
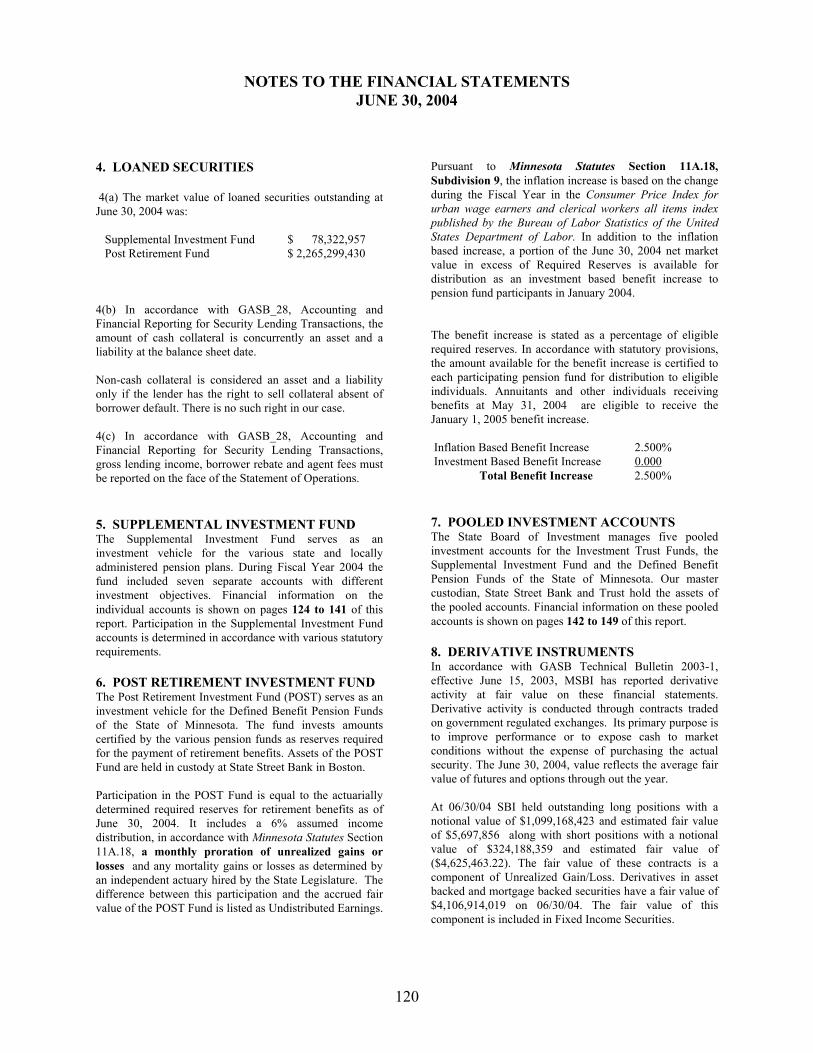
NOTES TO THE FINANCIAL STATEMENTS JUNE 30, 2004
120
4. LOANED SECURITIES 4(a) The market value of loaned securities outstanding at June 30, 2004 was: Supplemental Investment Fund $ 78,322,957 Post Retirement Fund $ 2,265,299,430 4(b) In accordance with GASB_28, Accounting and Financial Reporting for Security Lending Transactions, the amount of cash collateral is concurrently an asset and a liability at the balance sheet date. Non-cash collateral is considered an asset and a liability only if the lender has the right to sell collateral absent of borrower default. There is no such right in our case. 4(c) In accordance with GASB_28, Accounting and Financial Reporting for Security Lending Transactions, gross lending income, borrower rebate and agent fees must be reported on the face of the Statement of Operations. 5. SUPPLEMENTAL INVESTMENT FUND The Supplemental Investment Fund serves as an investment vehicle for the various state and locally administered pension plans. During Fiscal Year 2004 the fund included seven separate accounts with different investment objectives. Financial information on the individual accounts is shown on pages 124 to 141 of this report. Participation in the Supplemental Investment Fund accounts is determined in accordance with various statutory requirements. 6. POST RETIREMENT INVESTMENT FUND The Post Retirement Investment Fund (POST) serves as an investment vehicle for the Defined Benefit Pension Funds of the State of Minnesota. The fund invests amounts certified by the various pension funds as reserves required for the payment of retirement benefits. Assets of the POST Fund are held in custody at State Street Bank in Boston. Participation in the POST Fund is equal to the actuarially determined required reserves for retirement benefits as of June 30, 2004. It includes a 6% assumed income distribution, in accordance with Minnesota Statutes Section 11A.18, a monthly proration of unrealized gains or losses and any mortality gains or losses as determined by an independent actuary hired by the State Legislature. The difference between this participation and the accrued fair value of the POST Fund is listed as Undistributed Earnings.
Pursuant to Minnesota Statutes Section 11A.18, Subdivision 9, the inflation increase is based on the change during the Fiscal Year in the Consumer Price Index for urban wage earners and clerical workers all items index published by the Bureau of Labor Statistics of the United States Department of Labor. In addition to the inflation based increase, a portion of the June 30, 2004 net market value in excess of Required Reserves is available for distribution as an investment based benefit increase to pension fund participants in January 2004. The benefit increase is stated as a percentage of eligible required reserves. In accordance with statutory provisions, the amount available for the benefit increase is certified to each participating pension fund for distribution to eligible individuals. Annuitants and other individuals receiving benefits at May 31, 2004 are eligible to receive the January 1, 2005 benefit increase. Inflation Based Benefit Increase 2.500% Investment Based Benefit Increase 0.000 Total Benefit Increase 2.500% 7. POOLED INVESTMENT ACCOUNTS The State Board of Investment manages five pooled investment accounts for the Investment Trust Funds, the Supplemental Investment Fund and the Defined Benefit Pension Funds of the State of Minnesota. Our master custodian, State Street Bank and Trust hold the assets of the pooled accounts. Financial information on these pooled accounts is shown on pages 142 to 149 of this report. 8. DERIVATIVE INSTRUMENTS In accordance with GASB Technical Bulletin 2003-1, effective June 15, 2003, MSBI has reported derivative activity at fair value on these financial statements. Derivative activity is conducted through contracts traded on government regulated exchanges. Its primary purpose is to improve performance or to expose cash to market conditions without the expense of purchasing the actual security. The June 30, 2004, value reflects the average fair value of futures and options through out the year. At 06/30/04 SBI held outstanding long positions with a notional value of $1,099,168,423 and estimated fair value of $5,697,856 along with short positions with a notional value of $324,188,359 and estimated fair value of ($4,625,463.22). The fair value of these contracts is a component of Unrealized Gain/Loss. Derivatives in asset backed and mortgage backed securities have a fair value of $4,106,914,019 on 06/30/04. The fair value of this component is included in Fixed Income Securities.

SCHEDULE OF PARTICIPATION June 30, 2004
AMOUNTS IN (000)'S
SUPPLEMENTAL POST RETIREMENTINVESTMENT INVESTMENT
FUND FUND
Teacher's Retirement Fund 0 $ 9,969,710 $ Public Employees Retirement Fund 0 6,244,887 State Employees Retirement Fund 0 3,244,126 Public Employees Police & Fire Fund 0 2,165,865 Public Employees Consolidation Fund 0 2,224 Highway Patrolmen's Retirement Fund 0 341,427 Legislators & Survivors Retirement Fund 0 40,695 Correctional Employees Retirement Fund 0 225,519 Judges Retirement Fund 0 97,000 Income Share Account 466,657 0 Growth Share Account 133,517 0 Money Market Account 95,870 0 Common Stock Index Account 191,829 0 International Stock Account 58,842 0 Bond Market Account 93,398 0 Stable Value Account 153,274 0 TOTAL PARTICIPATION 1,193,387 $ 22,331,453 $
Adjustments
Undistributed Earnings 0 3,928,375) ( NET ASSETS 1,193,387 $ 18,403,078 $
Notes are an integral part of the Financial Statements
121

THIS PAGE LEFT BLANK INTENTIONALLY
122
123
Supplemental Financial Statements………………………………..123 Supplemental Investment Fund Combining Statements…124 Pooled Investment Account Statements………………….142 Footnotes to Supplemental Financial Statements………...150
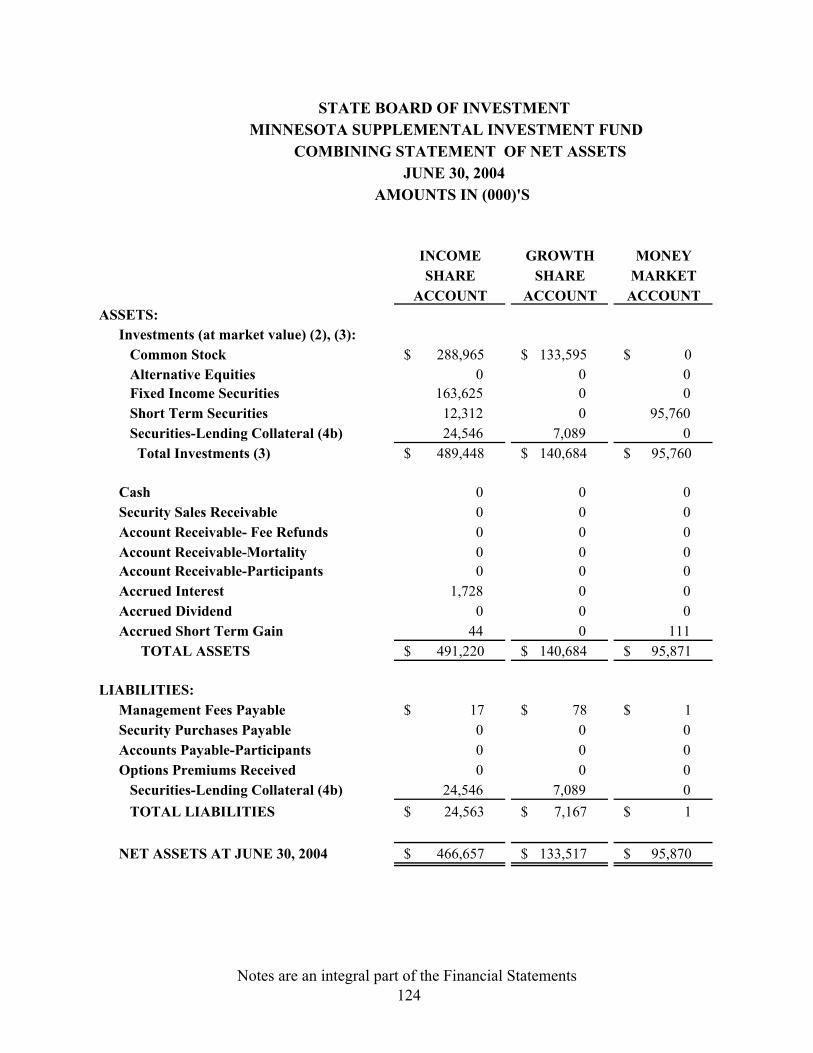
STATE BOARD OF INVESTMENT MINNESOTA SUPPLEMENTAL INVESTMENT FUND
COMBINING STATEMENT OF NET ASSETS JUNE 30, 2004
AMOUNTS IN (000)'S
INCOME GROWTH MONEYSHARE SHARE MARKET
ACCOUNT ACCOUNT ACCOUNTASSETS:
Investments (at market value) (2), (3): Common Stock 288,965 $ 133,595 $ 0 $ Alternative Equities 0 0 0 Fixed Income Securities 163,625 0 0 Short Term Securities 12,312 0 95,760 Securities-Lending Collateral (4b) 24,546 7,089 0 Total Investments (3) 489,448 $ 140,684 $ 95,760 $
Cash 0 0 0 Security Sales Receivable 0 0 0 Account Receivable- Fee Refunds 0 0 0 Account Receivable-Mortality 0 0 0 Account Receivable-Participants 0 0 0 Accrued Interest 1,728 0 0 Accrued Dividend 0 0 0 Accrued Short Term Gain 44 0 111 TOTAL ASSETS 491,220 $ 140,684 $ 95,871 $
LIABILITIES:Management Fees Payable 17 $ 78 $ 1 $ Security Purchases Payable 0 0 0 Accounts Payable-Participants 0 0 0 Options Premiums Received 0 0 0 Securities-Lending Collateral (4b) 24,546 7,089 0 TOTAL LIABILITIES 24,563 $ 7,167 $ 1 $
NET ASSETS AT JUNE 30, 2004 466,657 $ 133,517 $ 95,870 $
Notes are an integral part of the Financial Statements 124
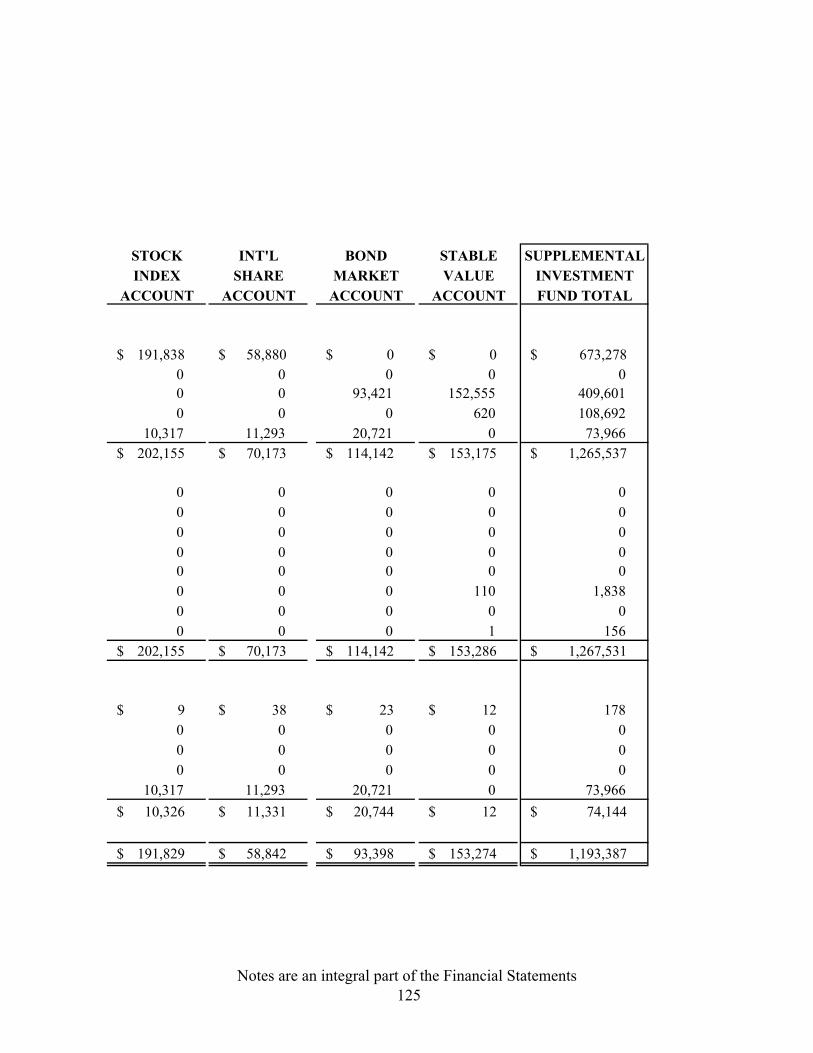
STOCK INT'L BOND STABLE SUPPLEMENTALINDEX SHARE MARKET VALUE INVESTMENT
ACCOUNT ACCOUNT ACCOUNT ACCOUNT FUND TOTAL
191,838 $ 58,880 $ 0 $ 0 $ 673,278 $ 0 0 0 0 0 0 0 93,421 152,555 409,601 0 0 0 620 108,692
10,317 11,293 20,721 0 73,966 202,155 $ 70,173 $ 114,142 $ 153,175 $ 1,265,537 $
0 0 0 0 0 0 0 0 0 0 0 0 0 0 0 0 0 0 0 0 0 0 0 0 0 0 0 0 110 1,838 0 0 0 0 0 0 0 0 1 156
202,155 $ 70,173 $ 114,142 $ 153,286 $ 1,267,531 $
9 $ 38 $ 23 $ 12 $ 178 0 0 0 0 0 0 0 0 0 0 0 0 0 0 0
10,317 11,293 20,721 0 73,966 10,326 $ 11,331 $ 20,744 $ 12 $ 74,144 $
191,829 $ 58,842 $ 93,398 $ 153,274 $ 1,193,387 $
Notes are an integral part of the Financial Statements 125

STATE BOARD OF INVESTMENT MINNESOTA SUPPLEMENTAL INVESTMENT FUND
COMBINING STATEMENT OF CHANGES IN NET ASSETS YEAR ENDED JUNE 30, 2004
AMOUNTS IN (000)'S
INCOME GROWTH MONEYSHARE SHARE MARKET
ACCOUNT ACCOUNT ACCOUNTFROM UNDISTRIBUTED INCOME:
Net Investment Income 27,804 $ 27,103 $ 1,284 $ Realized Gains (Losses) 21,573 4,105 0 Unrealized Gains (Losses) 22,684 9,322 0 TOTAL INCOME 72,061 $ 40,530 $ 1,284 $
Less Distributions to participants Accounts 72,061) ($ 40,530) ($ 1,284) ($ Undistributed Dedicated Income 0 0 0 Net Change In Undistributed Income 0 $ 0 $ 0 $
FROM PARTICIPANT TRANSACTIONS: Additions To Participant Accounts Participant Contributions 15,257 $ 13,282 $ 58,061 $ Income Distributions 72,062 40,530 1,284 Income To Be Distributed 0 0 0 Total Additions 87,319 $ 53,812 $ 59,345 $ Deductions From Participant Accounts Withdrawals 189,653 $ 119,546 $ 62,348 $ Total Deductions 189,653 119,546 62,348 Net change In Participation 102,334) ($ 65,734) ($ 3,003) ($ TOTAL CHANGE IN ASSETS 102,334) ($ 65,734) ($ 3,003) ($
NET ASSETS:Beginning Of Period 568,991 199,251 98,873 End Of Period 466,657 $ 133,517 $ 95,870 $ ,
Notes are an integral part of the Financial Statements 126

STOCK INT'L BOND STABLE SUPPLEMENTALINDEX SHARE MARKET VALUE INVESTMENT
ACCOUNT ACCOUNT ACCOUNT ACCOUNT FUND TOTAL
14,389 $ 5,094 $ 6,981 $ 3,615 $ 86,270 $ 7,680 2,704 2,150 3,071 41,283
35,716 8,634 6,518) ( 475) ( 69,363 57,785 $ 16,432 $ 2,613 $ 6,211 $ 196,916 $
57,785) ($ 16,432) ($ 2,613) ($ 6,211) ($ 196,916) ($
0 0 0 0 0 0 $ 0 $ 0 $ 0 $ 0 $
39,849 $ 15,967 $ 6,797 $ 121,085 $ 270,298 $ 57,785 16,432 2,615 6,212 196,920
0 0 0 0 0 97,634 $ 32,399 $ 9,412 $ 127,297 $ 467,218 $
187,463 $ 22,853 $ 78,448 $ 108,545 $ 768,856 $ 187,463 22,853 78,448 108,545 768,856
89,829) ($ 9,546 $ 69,036) ($ 18,752 $ 301,638) ($ 89,829) ($ 9,546 $ 69,036) ($ 18,752 $ 301,638) ($
281,658 49,296 162,434 134,522 1,495,025 191,829 $ 58,842 $ 93,398 $ 153,274 $ 1,193,387 $
Notes are an integral part of the Financial Statements 127

STATE BOARD OF INVESTMENT MINNESOTA SUPPLEMENTAL INVESTMENT FUND
COMBINING STATEMENT OF OPERATIONS YEAR ENDED JUNE 30, 2004
AMOUNTS IN (000)'S
INCOME GROWTH MONEYSHARE SHARE MARKET
ACCOUNT ACCOUNT ACCOUNT
INVESTMENT INCOME:Interest 8,851 $ 0 $ 0 $ Dividends 18,627 27,438 0 Short Term Gains 307 0 1,289 Security Lending Gross Earnings (4c) 345 74 0 Less: Borrower Rebates 219) ( 50) ( 0 Less:Fees Paid to Agents 27) ( 5) ( 0 Security Lending Net Earnings 99 19 0 Income Before Expenses 27,884 $ 27,457 $ 1,289 $ Management Fees 80 354 5 NET INCOME 27,804 $ 27,103 $ 1,284 $
REALIZED AND UNREALIZED GAIN (LOSS) ON INVESTMENTS
Realized: Proceeds From Sales 150,000 119,556 0 Cost Of Securities Sold 128,427 115,451 0 Net Realized Gain (Loss) 21,573 $ 4,105 $ 0 $ Unrealized: Beginning Of Period 19,396 30,669) ( 0 End Of Period 42,080 21,347) ( 0
Increase (decrease) In Unrealized Appreciation 22,684 $ 9,322 $ 0 $
NET REALIZED AND UNREALIZED GAIN (LOSS) ON INVESTMENTS 44,257 $ 13,427 $ 0 $
Notes are an integral part of the Financial Statements128

STOCK INTERNATIONAL BOND STABLE SUPPLEMENTALINDEX SHARE MARKET VALUE INVESTMENT
ACCOUNT ACCOUNT ACCOUNT ACCOUNT FUND TOTAL
0 $ 0 $ 7,068 $ 3,845 $ 19,764 $ 14,410 5,205 0 0 65,680
0 0 0 21 1,617 128 140 199 0 886
83) ( 66) ( 146) ( 0 564) ( 10) ( 20) ( 10) ( 0 72) ( 35 54 43 0 250
14,445 $ 5,259 $ 7,111 $ 3,866 $ 87,311 $ 56 165 130 251 1,041
14,389 $ 5,094 $ 6,981 $ 3,615 $ 86,270 $
187,477 22,856 78,456 164,376 722,721 179,797 20,152 76,306 161,305 681,438
7,680 $ 2,704 $ 2,150 $ 3,071 $ 41,283 $
40,344) ( 6,268) ( 2,023 3,180 52,682) ( 4,628) ( 2,366 4,495) ( 2,705 16,681
35,716 $ 8,634 $ 6,518) ($ 475) ($ 69,363 $
43,396 $ 11,338 $ 4,368) ( $ 2,596 $ 110,646 $
Notes are an integral part of the Financial Statements129
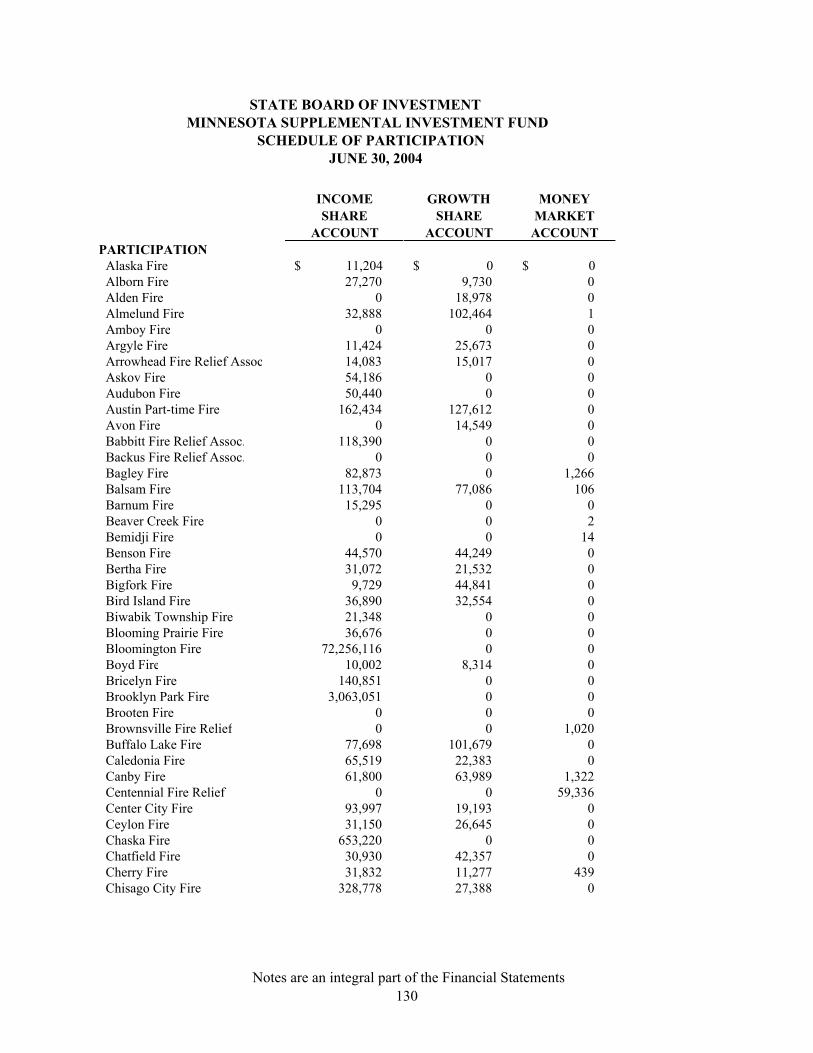
STATE BOARD OF INVESTMENT MINNESOTA SUPPLEMENTAL INVESTMENT FUND
SCHEDULE OF PARTICIPATION JUNE 30, 2004
INCOME GROWTH MONEYSHARE SHARE MARKET
ACCOUNT ACCOUNT ACCOUNTPARTICIPATION
Alaska Fire 11,204 $ 0 $ 0 $ Alborn Fire 27,270 9,730 0 Alden Fire 0 18,978 0 Almelund Fire 32,888 102,464 1 Amboy Fire 0 0 0 Argyle Fire 11,424 25,673 0 Arrowhead Fire Relief Assoc 14,083 15,017 0 Askov Fire 54,186 0 0 Audubon Fire 50,440 0 0 Austin Part-time Fire 162,434 127,612 0 Avon Fire 0 14,549 0 Babbitt Fire Relief Assoc. 118,390 0 0 Backus Fire Relief Assoc. 0 0 0 Bagley Fire 82,873 0 1,266 Balsam Fire 113,704 77,086 106 Barnum Fire 15,295 0 0 Beaver Creek Fire 0 0 2 Bemidji Fire 0 0 14 Benson Fire 44,570 44,249 0 Bertha Fire 31,072 21,532 0 Bigfork Fire 9,729 44,841 0 Bird Island Fire 36,890 32,554 0 Biwabik Township Fire 21,348 0 0 Blooming Prairie Fire 36,676 0 0 Bloomington Fire 72,256,116 0 0 Boyd Fire 10,002 8,314 0 Bricelyn Fire 140,851 0 0 Brooklyn Park Fire 3,063,051 0 0 Brooten Fire 0 0 0 Brownsville Fire Relief 0 0 1,020 Buffalo Lake Fire 77,698 101,679 0 Caledonia Fire 65,519 22,383 0 Canby Fire 61,800 63,989 1,322 Centennial Fire Relief 0 0 59,336 Center City Fire 93,997 19,193 0 Ceylon Fire 31,150 26,645 0 Chaska Fire 653,220 0 0 Chatfield Fire 30,930 42,357 0 Cherry Fire 31,832 11,277 439 Chisago City Fire 328,778 27,388 0
Notes are an integral part of the Financial Statements130
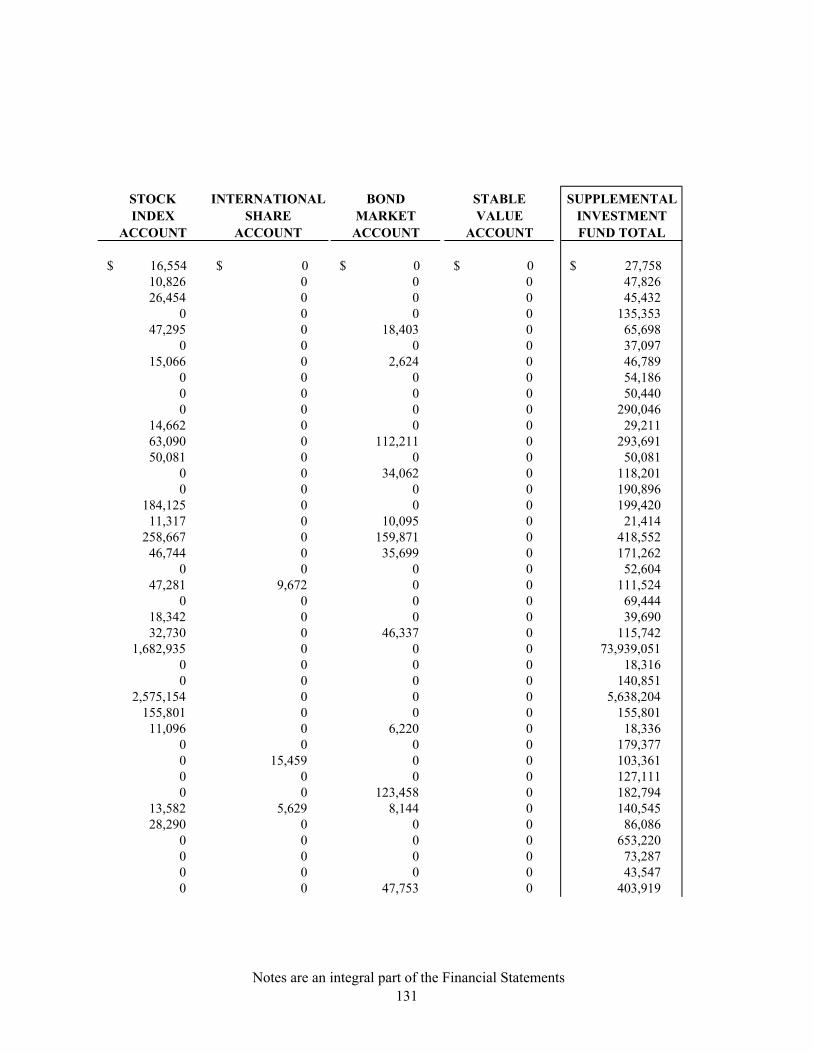
STOCK INTERNATIONAL BOND STABLE SUPPLEMENTALINDEX SHARE MARKET VALUE INVESTMENT
ACCOUNT ACCOUNT ACCOUNT ACCOUNT FUND TOTAL
16,554 $ 0 $ 0 $ 0 $ 27,758 $ 10,826 0 0 0 47,826 26,454 0 0 0 45,432
0 0 0 0 135,353 47,295 0 18,403 0 65,698
0 0 0 0 37,097 15,066 0 2,624 0 46,789
0 0 0 0 54,186 0 0 0 0 50,440 0 0 0 0 290,046
14,662 0 0 0 29,211 63,090 0 112,211 0 293,691 50,081 0 0 0 50,081
0 0 34,062 0 118,201 0 0 0 0 190,896
184,125 0 0 0 199,420 11,317 0 10,095 0 21,414
258,667 0 159,871 0 418,552 46,744 0 35,699 0 171,262
0 0 0 0 52,604 47,281 9,672 0 0 111,524
0 0 0 0 69,444 18,342 0 0 0 39,690 32,730 0 46,337 0 115,742
1,682,935 0 0 0 73,939,051 0 0 0 0 18,316 0 0 0 0 140,851
2,575,154 0 0 0 5,638,204 155,801 0 0 0 155,801
11,096 0 6,220 0 18,336 0 0 0 0 179,377 0 15,459 0 0 103,361 0 0 0 0 127,111 0 0 123,458 0 182,794
13,582 5,629 8,144 0 140,545 28,290 0 0 0 86,086
0 0 0 0 653,220 0 0 0 0 73,287 0 0 0 0 43,547 0 0 47,753 0 403,919
Notes are an integral part of the Financial Statements131

STATE BOARD OF INVESTMENT MINNESOTA SUPPLEMENTAL INVESTMENT FUND
SCHEDULE OF PARTICIPATION JUNE 30, 2004
INCOME GROWTH MONEYSHARE SHARE MARKET
ACCOUNT ACCOUNT ACCOUNTPARTICIPATION
Chokio Fire 97,592 $ 0 $ 0 $ Clarissa Fire Relief 0 12,295 0 Clarkfield Fire 134,443 30,865 0 Clear Lake Fire 195,227 137,389 0 Cleveland Fire 0 0 2,316 Cohasset Fire 13,571 28,886 0 Colerane Fire 0 0 17,768 Columbia Heights Fire 0 448,787 0 Coon Rapids Fire 1,103,210 0 0 Crane Lake Fire 36,038 41,727 7,336 Dakota Fire Relief 11,029 4,886 0 Dawson Fire 155,777 72,819 0 Deer Creek Fire 25,719 46,431 0 Delano Fire 0 35,626 0 Dover Fire 57,452 4,998 31,695 East Grand Forks Fire 690,378 0 0 Edgerton Fire 115,668 0 0 Edina Fire 0 1,618,305 457,228 Elbow Lake Fire 84,209 39,082 0 Elk River Fire 666,251 159,534 8,914 Elmore Fire 0 23,242 0 Emmons Fire 46,649 0 0 Excelsior Fire 1,253,700 458,100 0 Eyota Fire 43,205 0 29,488 Farmington Cataract 101,705 0 0 Fayal Fire 21,002 16,001 1,799 Fergus Falls Fire 0 355,567 0 Forest Lake Fire 222,511 0 0 Frazee Fire 123,699 29,520 0 Frost Fire 13,008 12,061 0 Glencoe Fire 0 127,065 0 Glenville Fire Relief 16,299 0 15,517 Glenwood Fire 69,005 45,322 0 Golden Valley Fire 1,089,446 804,826 0 Gonvick Fire 29,111 27,490 0 Good Thunder Fire 116,893 52,200 0 Goodland Fire 0 31,491 0 Grand Marais Fire 47,336 38,753 64,379 Grand Meadow Fire 37,092 34,517 0 Grand Rapids Fire 484,298 0 0
Notes are an integral part of the Financial Statements132
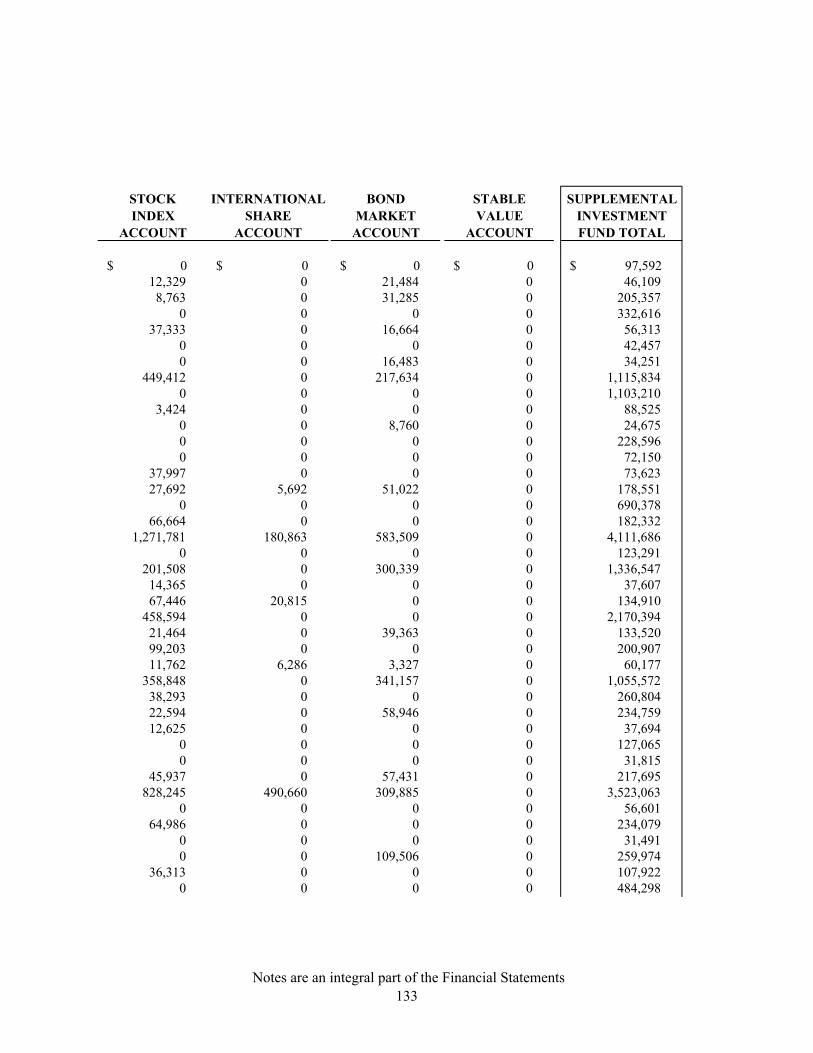
STOCK INTERNATIONAL BOND STABLE SUPPLEMENTALINDEX SHARE MARKET VALUE INVESTMENT
ACCOUNT ACCOUNT ACCOUNT ACCOUNT FUND TOTAL
0 $ 0 $ 0 $ 0 $ 97,592 $ 12,329 0 21,484 0 46,109
8,763 0 31,285 0 205,357 0 0 0 0 332,616
37,333 0 16,664 0 56,313 0 0 0 0 42,457 0 0 16,483 0 34,251
449,412 0 217,634 0 1,115,834 0 0 0 0 1,103,210
3,424 0 0 0 88,525 0 0 8,760 0 24,675 0 0 0 0 228,596 0 0 0 0 72,150
37,997 0 0 0 73,623 27,692 5,692 51,022 0 178,551
0 0 0 0 690,378 66,664 0 0 0 182,332
1,271,781 180,863 583,509 0 4,111,686 0 0 0 0 123,291
201,508 0 300,339 0 1,336,547 14,365 0 0 0 37,607 67,446 20,815 0 0 134,910
458,594 0 0 0 2,170,394 21,464 0 39,363 0 133,520 99,203 0 0 0 200,907 11,762 6,286 3,327 0 60,177
358,848 0 341,157 0 1,055,572 38,293 0 0 0 260,804 22,594 0 58,946 0 234,759 12,625 0 0 0 37,694
0 0 0 0 127,065 0 0 0 0 31,815
45,937 0 57,431 0 217,695 828,245 490,660 309,885 0 3,523,063
0 0 0 0 56,601 64,986 0 0 0 234,079
0 0 0 0 31,491 0 0 109,506 0 259,974
36,313 0 0 0 107,922 0 0 0 0 484,298
Notes are an integral part of the Financial Statements133
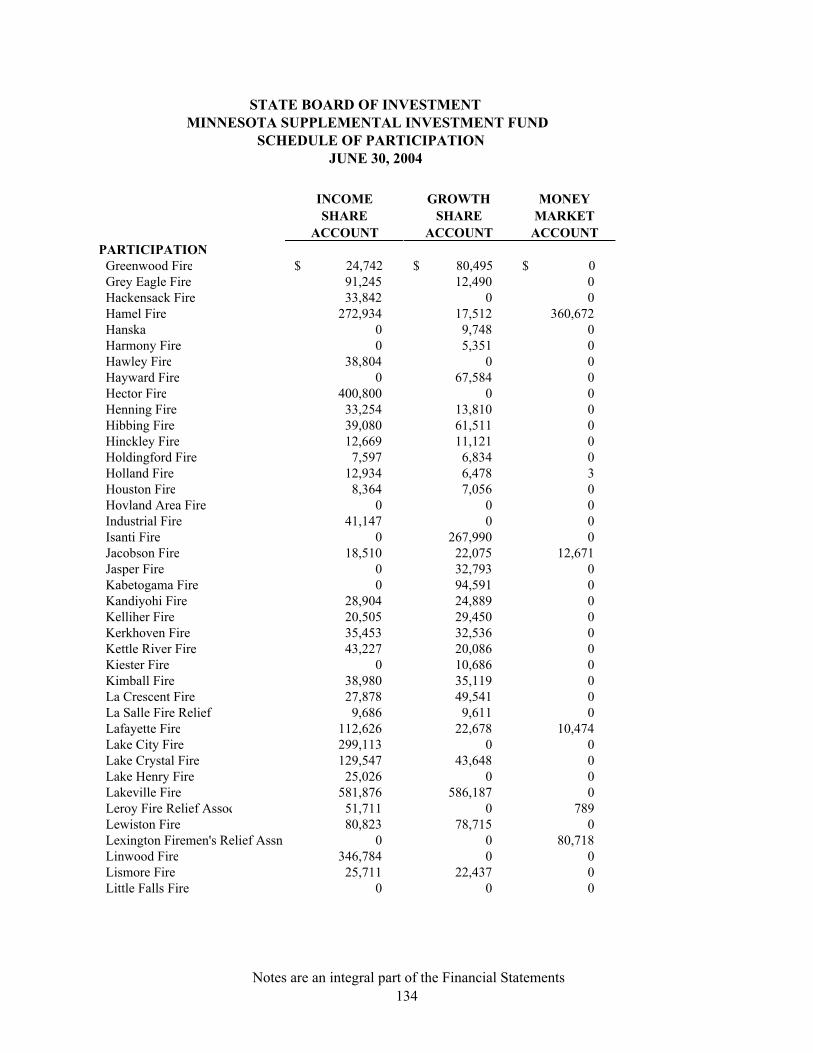
STATE BOARD OF INVESTMENT MINNESOTA SUPPLEMENTAL INVESTMENT FUND
SCHEDULE OF PARTICIPATION JUNE 30, 2004
INCOME GROWTH MONEYSHARE SHARE MARKET
ACCOUNT ACCOUNT ACCOUNTPARTICIPATION
Greenwood Fire 24,742 $ 80,495 $ 0 $ Grey Eagle Fire 91,245 12,490 0 Hackensack Fire 33,842 0 0 Hamel Fire 272,934 17,512 360,672 Hanska 0 9,748 0 Harmony Fire 0 5,351 0 Hawley Fire 38,804 0 0 Hayward Fire 0 67,584 0 Hector Fire 400,800 0 0 Henning Fire 33,254 13,810 0 Hibbing Fire 39,080 61,511 0 Hinckley Fire 12,669 11,121 0 Holdingford Fire 7,597 6,834 0 Holland Fire 12,934 6,478 3 Houston Fire 8,364 7,056 0 Hovland Area Fire 0 0 0 Industrial Fire 41,147 0 0 Isanti Fire 0 267,990 0 Jacobson Fire 18,510 22,075 12,671 Jasper Fire 0 32,793 0 Kabetogama Fire 0 94,591 0 Kandiyohi Fire 28,904 24,889 0 Kelliher Fire 20,505 29,450 0 Kerkhoven Fire 35,453 32,536 0 Kettle River Fire 43,227 20,086 0 Kiester Fire 0 10,686 0 Kimball Fire 38,980 35,119 0 La Crescent Fire 27,878 49,541 0 La Salle Fire Relief 9,686 9,611 0 Lafayette Fire 112,626 22,678 10,474 Lake City Fire 299,113 0 0 Lake Crystal Fire 129,547 43,648 0 Lake Henry Fire 25,026 0 0 Lakeville Fire 581,876 586,187 0 Leroy Fire Relief Assoc 51,711 0 789 Lewiston Fire 80,823 78,715 0 Lexington Firemen's Relief Assn 0 0 80,718 Linwood Fire 346,784 0 0 Lismore Fire 25,711 22,437 0 Little Falls Fire 0 0 0
Notes are an integral part of the Financial Statements134

STOCK INTERNATIONAL BOND STABLE SUPPLEMENTALINDEX SHARE MARKET VALUE INVESTMENT
ACCOUNT ACCOUNT ACCOUNT ACCOUNT FUND TOTAL
0 $ 0 $ 10,832 $ 0 $ 116,069 $ 0 18,388 0 0 122,123 0 0 0 0 33,842 0 17,332 0 0 668,450 0 5,385 0 0 15,133
23,163 14,131 0 0 42,646 44,824 0 0 0 83,628 94,402 0 0 0 161,986
0 0 0 0 400,800 35,502 15,254 27,500 0 125,321 58,592 27,749 0 0 186,931 11,805 3,697 14,264 0 53,555
7,223 0 0 0 21,654 15,631 29,665 28,140 0 92,851
7,193 7,891 0 0 30,504 10,922 0 0 0 10,922 38,814 0 0 0 79,961
174,325 180,911 0 0 623,226 0 0 0 0 53,257 0 0 0 0 32,793 0 0 0 0 94,591
22,441 0 25,579 0 101,813 30,483 0 0 0 80,438 34,024 0 0 0 102,013 20,574 0 0 0 83,887 11,416 11,253 0 0 33,355 18,131 0 0 0 92,230 27,165 0 23,510 0 128,093
9,732 0 0 0 29,030 46,745 0 66,461 0 258,984
0 0 0 0 299,113 121,033 0 0 0 294,229
0 0 0 0 25,026 910,648 0 0 0 2,078,711
0 0 4,018 0 56,518 0 0 0 0 159,538 0 0 0 0 80,718 0 0 0 0 346,784
23,333 0 0 0 71,482 195,984 0 0 0 195,984
Notes are an integral part of the Financial Statements135
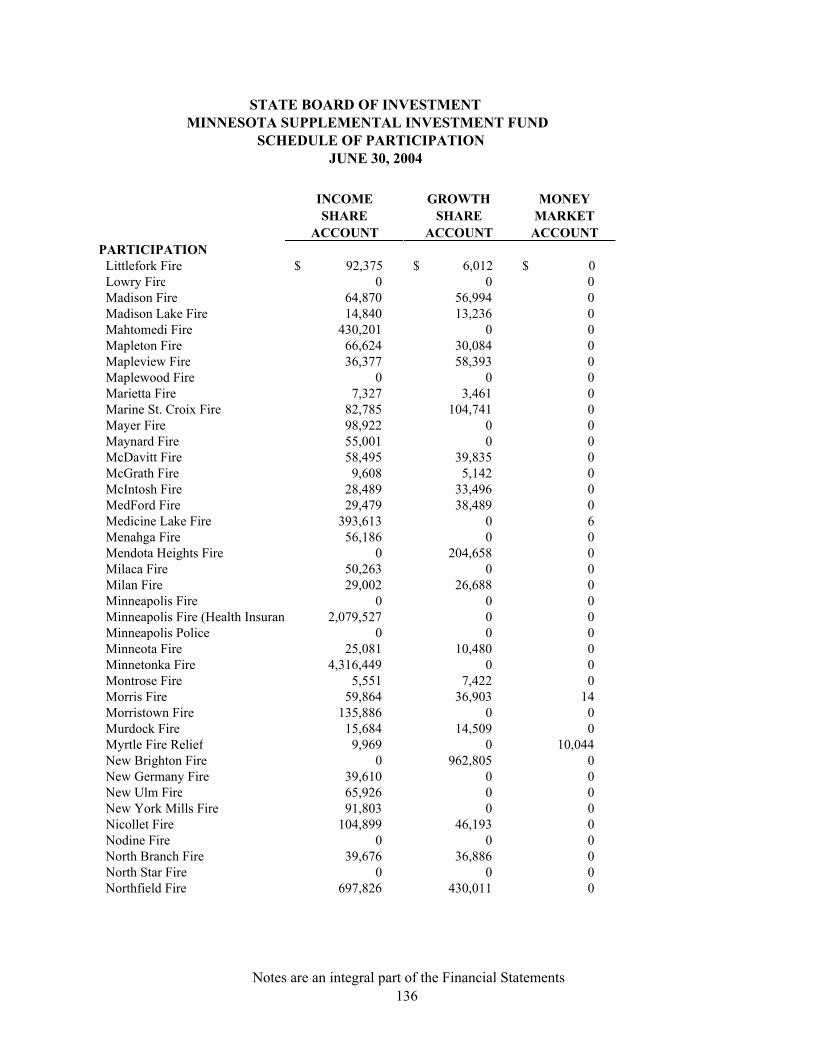
STATE BOARD OF INVESTMENT MINNESOTA SUPPLEMENTAL INVESTMENT FUND
SCHEDULE OF PARTICIPATION JUNE 30, 2004
INCOME GROWTH MONEYSHARE SHARE MARKET
ACCOUNT ACCOUNT ACCOUNTPARTICIPATION
Littlefork Fire 92,375 $ 6,012 $ 0 $ Lowry Fire 0 0 0 Madison Fire 64,870 56,994 0 Madison Lake Fire 14,840 13,236 0 Mahtomedi Fire 430,201 0 0 Mapleton Fire 66,624 30,084 0 Mapleview Fire 36,377 58,393 0 Maplewood Fire 0 0 0 Marietta Fire 7,327 3,461 0 Marine St. Croix Fire 82,785 104,741 0 Mayer Fire 98,922 0 0 Maynard Fire 55,001 0 0 McDavitt Fire 58,495 39,835 0 McGrath Fire 9,608 5,142 0 McIntosh Fire 28,489 33,496 0 MedFord Fire 29,479 38,489 0 Medicine Lake Fire 393,613 0 6 Menahga Fire 56,186 0 0 Mendota Heights Fire 0 204,658 0 Milaca Fire 50,263 0 0 Milan Fire 29,002 26,688 0 Minneapolis Fire 0 0 0 Minneapolis Fire (Health Insuran 2,079,527 0 0 Minneapolis Police 0 0 0 Minneota Fire 25,081 10,480 0 Minnetonka Fire 4,316,449 0 0 Montrose Fire 5,551 7,422 0 Morris Fire 59,864 36,903 14 Morristown Fire 135,886 0 0 Murdock Fire 15,684 14,509 0 Myrtle Fire Relief 9,969 0 10,044 New Brighton Fire 0 962,805 0 New Germany Fire 39,610 0 0 New Ulm Fire 65,926 0 0 New York Mills Fire 91,803 0 0 Nicollet Fire 104,899 46,193 0 Nodine Fire 0 0 0 North Branch Fire 39,676 36,886 0 North Star Fire 0 0 0 Northfield Fire 697,826 430,011 0
Notes are an integral part of the Financial Statements136
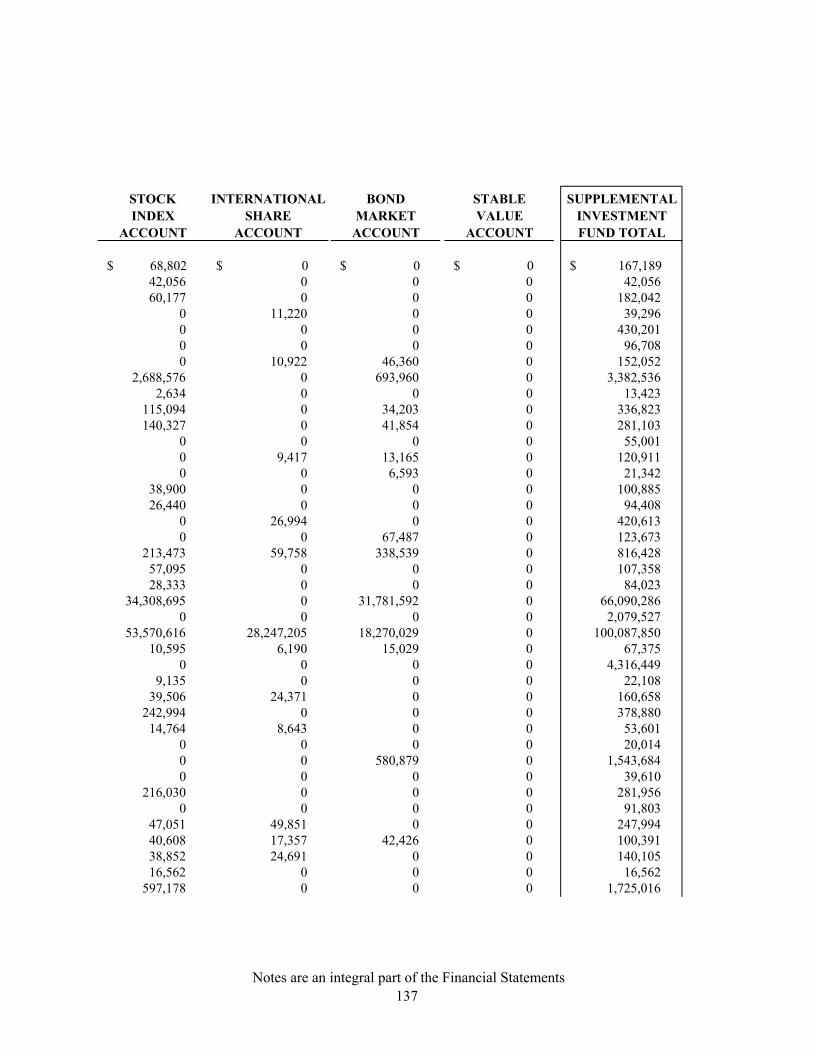
STOCK INTERNATIONAL BOND STABLE SUPPLEMENTALINDEX SHARE MARKET VALUE INVESTMENT
ACCOUNT ACCOUNT ACCOUNT ACCOUNT FUND TOTAL
68,802 $ 0 $ 0 $ 0 $ 167,189 $ 42,056 0 0 0 42,056 60,177 0 0 0 182,042
0 11,220 0 0 39,296 0 0 0 0 430,201 0 0 0 0 96,708 0 10,922 46,360 0 152,052
2,688,576 0 693,960 0 3,382,536 2,634 0 0 0 13,423
115,094 0 34,203 0 336,823 140,327 0 41,854 0 281,103
0 0 0 0 55,001 0 9,417 13,165 0 120,911 0 0 6,593 0 21,342
38,900 0 0 0 100,885 26,440 0 0 0 94,408
0 26,994 0 0 420,613 0 0 67,487 0 123,673
213,473 59,758 338,539 0 816,428 57,095 0 0 0 107,358 28,333 0 0 0 84,023
34,308,695 0 31,781,592 0 66,090,286 0 0 0 0 2,079,527
53,570,616 28,247,205 18,270,029 0 100,087,850 10,595 6,190 15,029 0 67,375
0 0 0 0 4,316,449 9,135 0 0 0 22,108
39,506 24,371 0 0 160,658 242,994 0 0 0 378,880
14,764 8,643 0 0 53,601 0 0 0 0 20,014 0 0 580,879 0 1,543,684 0 0 0 0 39,610
216,030 0 0 0 281,956 0 0 0 0 91,803
47,051 49,851 0 0 247,994 40,608 17,357 42,426 0 100,391 38,852 24,691 0 0 140,105 16,562 0 0 0 16,562
597,178 0 0 0 1,725,016
Notes are an integral part of the Financial Statements137
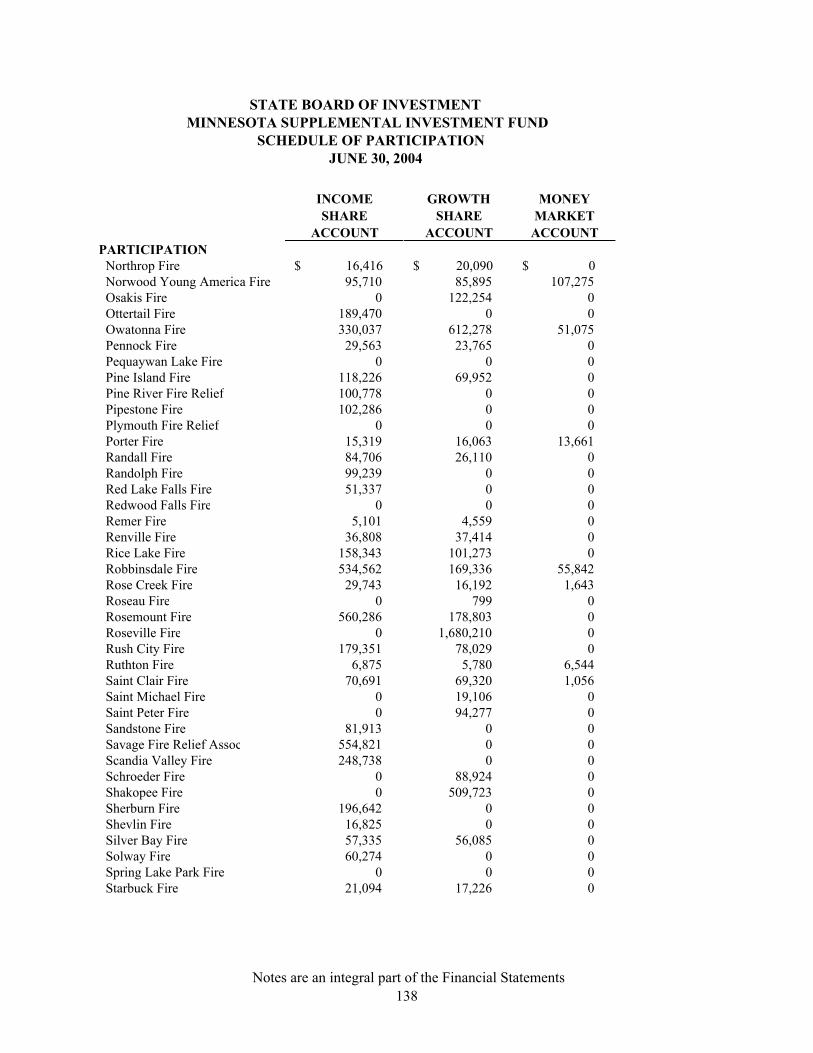
STATE BOARD OF INVESTMENT MINNESOTA SUPPLEMENTAL INVESTMENT FUND
SCHEDULE OF PARTICIPATION JUNE 30, 2004
INCOME GROWTH MONEYSHARE SHARE MARKET
ACCOUNT ACCOUNT ACCOUNTPARTICIPATION
Northrop Fire 16,416 $ 20,090 $ 0 $ Norwood Young America Fire 95,710 85,895 107,275 Osakis Fire 0 122,254 0 Ottertail Fire 189,470 0 0 Owatonna Fire 330,037 612,278 51,075 Pennock Fire 29,563 23,765 0 Pequaywan Lake Fire 0 0 0 Pine Island Fire 118,226 69,952 0 Pine River Fire Relief 100,778 0 0 Pipestone Fire 102,286 0 0 Plymouth Fire Relief 0 0 0 Porter Fire 15,319 16,063 13,661 Randall Fire 84,706 26,110 0 Randolph Fire 99,239 0 0 Red Lake Falls Fire 51,337 0 0 Redwood Falls Fire 0 0 0 Remer Fire 5,101 4,559 0 Renville Fire 36,808 37,414 0 Rice Lake Fire 158,343 101,273 0 Robbinsdale Fire 534,562 169,336 55,842 Rose Creek Fire 29,743 16,192 1,643 Roseau Fire 0 799 0 Rosemount Fire 560,286 178,803 0 Roseville Fire 0 1,680,210 0 Rush City Fire 179,351 78,029 0 Ruthton Fire 6,875 5,780 6,544 Saint Clair Fire 70,691 69,320 1,056 Saint Michael Fire 0 19,106 0 Saint Peter Fire 0 94,277 0 Sandstone Fire 81,913 0 0 Savage Fire Relief Assoc 554,821 0 0 Scandia Valley Fire 248,738 0 0 Schroeder Fire 0 88,924 0 Shakopee Fire 0 509,723 0 Sherburn Fire 196,642 0 0 Shevlin Fire 16,825 0 0 Silver Bay Fire 57,335 56,085 0 Solway Fire 60,274 0 0 Spring Lake Park Fire 0 0 0 Starbuck Fire 21,094 17,226 0
Notes are an integral part of the Financial Statements138

STOCK INTERNATIONAL BOND STABLE SUPPLEMENTALINDEX SHARE MARKET VALUE INVESTMENT
ACCOUNT ACCOUNT ACCOUNT ACCOUNT FUND TOTAL
0 $ 0 $ 0 $ 0 $ 36,507 $ 0 0 117,533 0 406,414
125,768 6,368 89,578 0 343,969 0 0 0 0 189,470
56,651 60,606 0 0 1,110,647 24,241 25,691 0 0 103,261 14,040 0 0 0 14,040
0 0 0 0 188,178 0 0 0 0 100,778
91,740 0 0 0 194,026 0 0 871,910 0 871,910
67,238 0 25,091 0 137,371 42,861 0 0 0 153,677
111,771 0 0 0 211,010 0 0 0 0 51,337 0 0 29,155 0 29,155
4,725 4,894 0 0 19,279 9,624 0 33,008 0 116,853
87,232 0 13,407 0 360,255 169,932 99,513 0 0 1,029,186
16,636 0 0 0 64,213 0 0 0 0 799
180,535 0 0 0 919,624 1,783,174 811,766 2,241,938 0 6,517,088
74,676 0 0 0 332,056 11,888 0 0 0 31,088 72,661 0 30,415 0 244,144 19,997 17,367 0 0 56,470 49,261 53,428 470 0 197,436
0 0 0 0 81,913 0 0 0 0 554,821 0 0 0 0 248,738
6,414 0 0 0 95,339 531,438 97,817 0 0 1,138,979
0 0 0 0 196,642 0 0 28,137 0 44,962 0 10,959 0 0 124,379 0 0 72,157 0 132,431
706,292 0 0 0 706,292 17,698 4,522 0 0 60,539
Notes are an integral part of the Financial Statements139
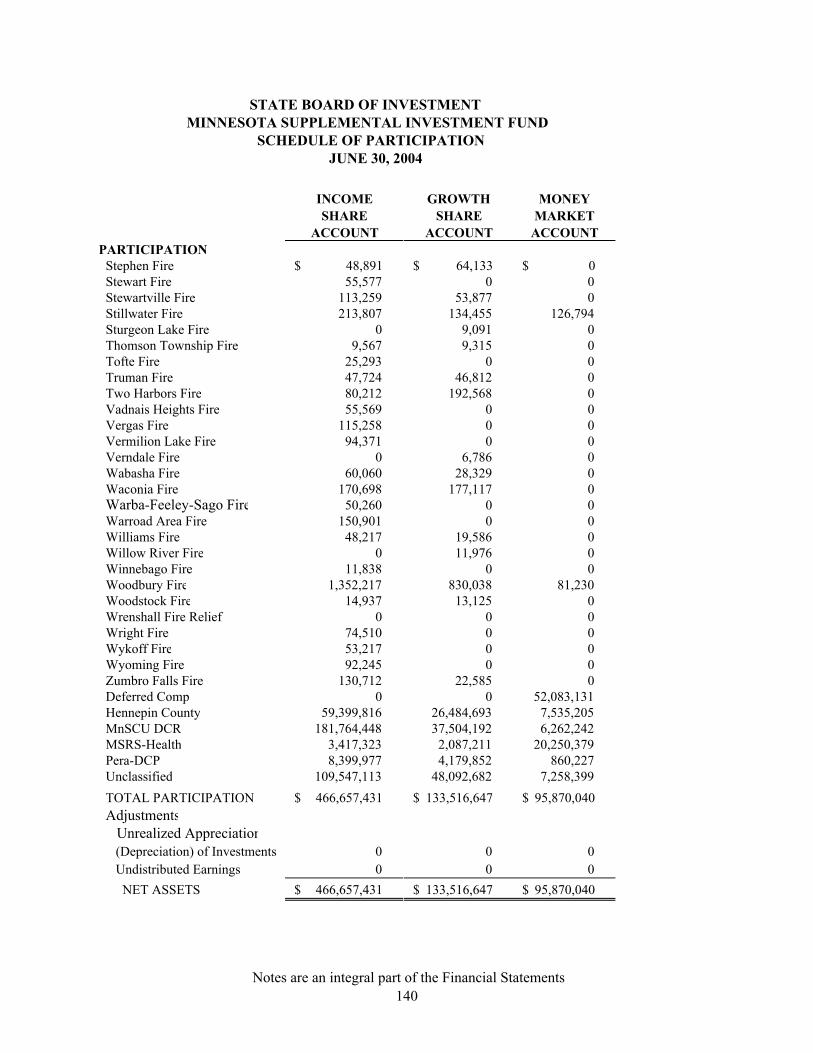
STATE BOARD OF INVESTMENT MINNESOTA SUPPLEMENTAL INVESTMENT FUND
SCHEDULE OF PARTICIPATION JUNE 30, 2004
INCOME GROWTH MONEYSHARE SHARE MARKET
ACCOUNT ACCOUNT ACCOUNTPARTICIPATION
Stephen Fire 48,891 $ 64,133 $ 0 $ Stewart Fire 55,577 0 0 Stewartville Fire 113,259 53,877 0 Stillwater Fire 213,807 134,455 126,794 Sturgeon Lake Fire 0 9,091 0 Thomson Township Fire 9,567 9,315 0 Tofte Fire 25,293 0 0 Truman Fire 47,724 46,812 0 Two Harbors Fire 80,212 192,568 0 Vadnais Heights Fire 55,569 0 0 Vergas Fire 115,258 0 0 Vermilion Lake Fire 94,371 0 0 Verndale Fire 0 6,786 0 Wabasha Fire 60,060 28,329 0 Waconia Fire 170,698 177,117 0 Warba-Feeley-Sago Fire 50,260 0 0 Warroad Area Fire 150,901 0 0 Williams Fire 48,217 19,586 0 Willow River Fire 0 11,976 0 Winnebago Fire 11,838 0 0 Woodbury Fire 1,352,217 830,038 81,230 Woodstock Fire 14,937 13,125 0 Wrenshall Fire Relief 0 0 0 Wright Fire 74,510 0 0 Wykoff Fire 53,217 0 0 Wyoming Fire 92,245 0 0 Zumbro Falls Fire 130,712 22,585 0 Deferred Comp 0 0 52,083,131 Hennepin County 59,399,816 26,484,693 7,535,205 MnSCU DCR 181,764,448 37,504,192 6,262,242 MSRS-Health 3,417,323 2,087,211 20,250,379 Pera-DCP 8,399,977 4,179,852 860,227 Unclassified 109,547,113 48,092,682 7,258,399 TOTAL PARTICIPATION 466,657,431 $ 133,516,647 $ 95,870,040 $ Adjustments Unrealized Appreciation (Depreciation) of Investments 0 0 0 Undistributed Earnings 0 0 0 NET ASSETS 466,657,431 $ 133,516,647 $ 95,870,040 $
Notes are an integral part of the Financial Statements140
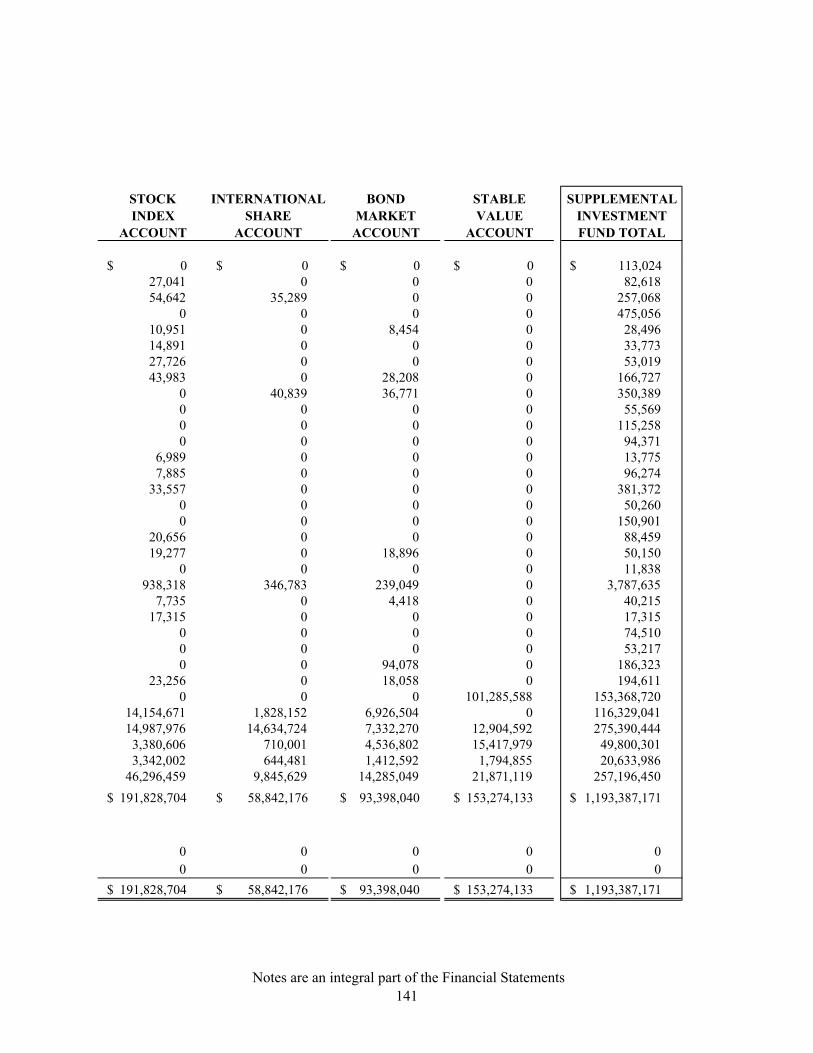
STOCK INTERNATIONAL BOND STABLE SUPPLEMENTALINDEX SHARE MARKET VALUE INVESTMENT
ACCOUNT ACCOUNT ACCOUNT ACCOUNT FUND TOTAL
0 $ 0 $ 0 $ 0 $ 113,024 $ 27,041 0 0 0 82,618 54,642 35,289 0 0 257,068
0 0 0 0 475,056 10,951 0 8,454 0 28,496 14,891 0 0 0 33,773 27,726 0 0 0 53,019 43,983 0 28,208 0 166,727
0 40,839 36,771 0 350,389 0 0 0 0 55,569 0 0 0 0 115,258 0 0 0 0 94,371
6,989 0 0 0 13,775 7,885 0 0 0 96,274
33,557 0 0 0 381,372 0 0 0 0 50,260 0 0 0 0 150,901
20,656 0 0 0 88,459 19,277 0 18,896 0 50,150
0 0 0 0 11,838 938,318 346,783 239,049 0 3,787,635
7,735 0 4,418 0 40,215 17,315 0 0 0 17,315
0 0 0 0 74,510 0 0 0 0 53,217 0 0 94,078 0 186,323
23,256 0 18,058 0 194,611 0 0 0 101,285,588 153,368,720
14,154,671 1,828,152 6,926,504 0 116,329,041 14,987,976 14,634,724 7,332,270 12,904,592 275,390,444
3,380,606 710,001 4,536,802 15,417,979 49,800,301 3,342,002 644,481 1,412,592 1,794,855 20,633,986
46,296,459 9,845,629 14,285,049 21,871,119 257,196,450 191,828,704 $ 58,842,176 $ 93,398,040 $ 153,274,133 $ 1,193,387,171 $
0 0 0 0 0 0 0 0 0 0
191,828,704 $ 58,842,176 $ 93,398,040 $ 153,274,133 $ 1,193,387,171 $
Notes are an integral part of the Financial Statements141

STATE BOARD OF INVESTMENT
MINNESOTA POOLED INVESTMENT ACCOUNTS
SCHEDULE OF ASSETS AND LIABILITIES
JUNE 30, 2004
AMOUNTS IN (000)'S
ALTERNATIVE DOMESTICINVESTMENTS BOND
ACCOUNT(4) ACCOUNTASSETS:
Investments (at market value) (2),(3): Common Stock 0 $ 44,403 $ Alternative Equities 3,117,643 0 Fixed Income Securities 0 8,724,767 Short Term Securities 64,400 1,015,962 Securities-Lending Collateral(4b) 3,785 1,902,274 Total Investments 3,185,828 $ 11,687,406 $
Cash 1,255 577 Security Sales Receivable 0 699,902 Accounts Receivable-Fee Refunds 0 0 Accounts Receivable-Mortality 0 0 Accounts Receivable-Participants 0 0 Accrued Interest 0 71,734 Accrued Dividends 1,939 0 Accrued Short Term Gain 31 (438) TOTAL ASSETS 3,189,053 $ 12,459,181 $
LIABILITIES:Management Fees Payable 0 1,920 Security Purchases Payable 0 1,980,485 Accounts Payable-Participants 0 0 Options Premiums Received 0 0 Securities-Lending Collateral(4b) 3,785 1,902,274 TOTAL LIABILITIES 3,785 $ 3,884,679 $
NET ASSETS AT JUNE 30, 2004 3,185,268 $ 8,574,502 $
Notes are an integral part of the Financial Statements142

DOMESTIC INTERNATIONAL POOLEDEQUITY EQUITY INVESTMENT
ACCOUNTS ACCOUNT FUND TOTAL
18,963,031 $ 5,673,152 $ 24,680,586 $ 0 0 3,117,643
650 479 8,725,896 142,159 46,405 1,268,926
1,019,467 1,107,725 4,033,251 20,125,307 $ 6,827,761 $ 41,826,302 $
(368) 41,784 43,248 42,594 10,620 753,116
0 0 0 0 0 0 0 0 0 4 1 71,739
18,784 13,200 33,923 214 (619) (812)
20,186,535 $ 6,892,747 $ 42,727,516 $
6,750 3,740 12,410 42,560 9,283 2,032,328
0 0 0 0 0 0
1,019,467 1,107,725 4,033,251 1,068,777 $ 1,120,748 $ 6,077,989 $
19,117,758 $ 5,771,999 $ 36,649,527 $
Notes are an integral part of the Financial Statements143

STATE BOARD OF INVESTMENT
MINNESOTA POOLED INVESTMENT ACCOUNTS
SCHEDULE OF CHANGES IN NET ASSETS
JUNE 30, 2004
AMOUNTS IN (000)'S
ALTERNATIVE DOMESTICINVESTMENTS BOND
ACCOUNT(4) ACCOUNTFROM INVESTMENT ACTIVITY:
Net Investment Income 413,440 $ 402,560 $
Realized Gains (Losses) 28,846) ( 27,510
Unrealized Gains (Losses) 99,377 305,421) (
TOTAL INCOME 483,971 $ 124,649 $
Less Distribution To
Participant Accounts 384,595) ( 432,355) (
Undistributed Dedicated Income 0 2,286
Net Change In Undistributed Income 99,376 $ 305,420) ($
FROM PARTICIPANT TRANSACTIONS:
Additional To Participant Accounts
Participant Contributions 320,234 0
Income Distribution 384,595 432,355
Income To Be Distributed 0 2,286) (
Total Additions 704,829 $ 430,069 $
Deductions From Participant Accounts
Withdrawals 711,643 122,999
Total Deductions 711,643 $ 122,999 $
Net Change In Participation 6,814) ($ 307,070 $
TOTAL CHANGE IN ASSETS 92,562 $ 1,650 $
NET ASSETS:
Beginning Of Period 3,092,706 8,572,852 End Of Period 3,185,268 $ 8,574,502 $
Notes are an integral part of the Financial Statements 144

DOMESTIC INTERNATIONAL POOLEDEQUITY EQUITY INVESTMENT
ACCOUNTS ACCOUNT FUND TOTAL
280,224 $ 119,720 $ 1,215,944 $
1,778,841 353,532 2,131,037 $
1,350,519 1,033,579 2,178,054
3,409,584 $ 1,506,831 $ 5,525,035 $
2,060,238) ( 476,762) ( 3,353,950) (
1,173 3,511 6,970
1,350,519 $ 1,033,580 $ 2,178,055 $
319 57,004 377,557
2,060,238 476,762 3,353,950
1,173) ( 3,511) ( 6,970) (
2,059,384 $ 530,255 $ 3,724,537 $
1,644,078 662,334 3,141,054
1,644,078 $ 662,334 $ 3,141,054 $
415,306 $ 132,079) ($ 583,483 $
1,765,825 $ 901,501 $ 2,761,538 $
17,351,933 4,870,498 33,887,989 19,117,758 $ 5,771,999 $ 36,649,527 $
Notes are an integral part of the Financial Statements 145
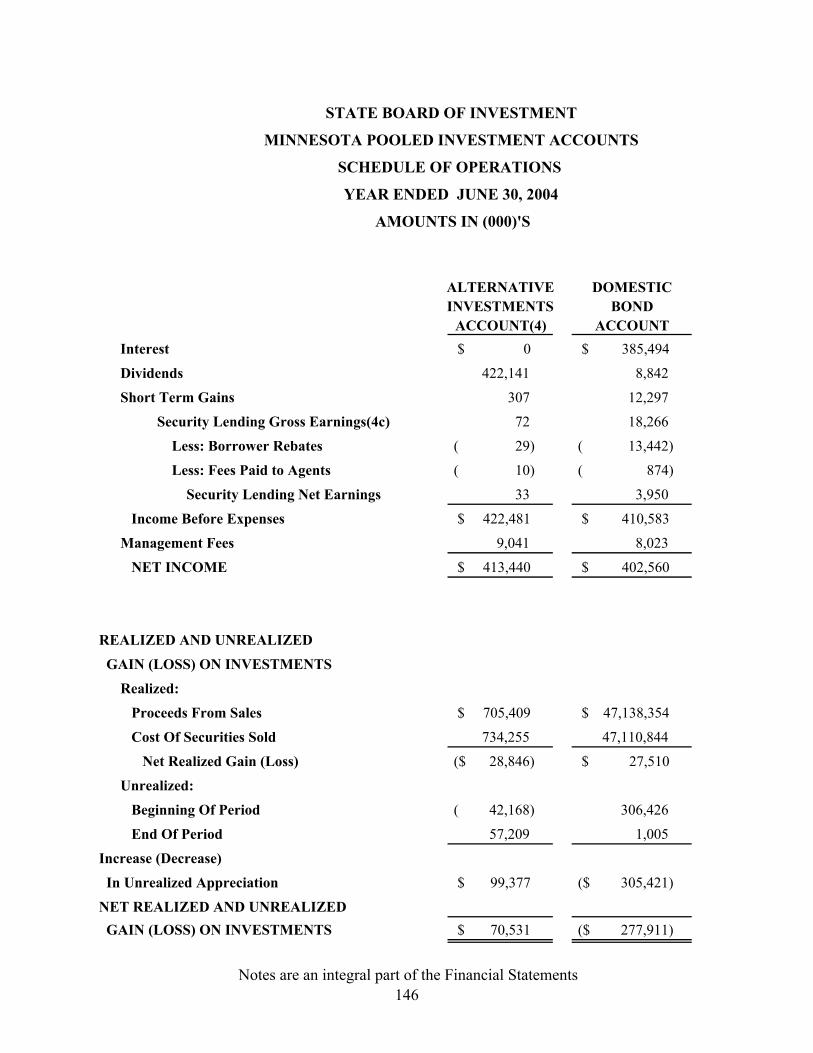
STATE BOARD OF INVESTMENT
MINNESOTA POOLED INVESTMENT ACCOUNTS
SCHEDULE OF OPERATIONS
YEAR ENDED JUNE 30, 2004
AMOUNTS IN (000)'S
ALTERNATIVE DOMESTICINVESTMENTS BOND
ACCOUNT(4) ACCOUNTInterest 0 $ 385,494 $
Dividends 422,141 8,842
Short Term Gains 307 12,297
Security Lending Gross Earnings(4c) 72 18,266
Less: Borrower Rebates 29) ( 13,442) (
Less: Fees Paid to Agents 10) ( 874) (
Security Lending Net Earnings 33 3,950
Income Before Expenses 422,481 $ 410,583 $
Management Fees 9,041 8,023
NET INCOME 413,440 $ 402,560 $
REALIZED AND UNREALIZED
GAIN (LOSS) ON INVESTMENTS
Realized:
Proceeds From Sales 705,409 $ 47,138,354 $
Cost Of Securities Sold 734,255 47,110,844
Net Realized Gain (Loss) 28,846) ($ 27,510 $
Unrealized:
Beginning Of Period 42,168) ( 306,426
End Of Period 57,209 1,005
Increase (Decrease)
In Unrealized Appreciation 99,377 $ 305,421) ($
NET REALIZED AND UNREALIZED GAIN (LOSS) ON INVESTMENTS 70,531 $ 277,911) ($
Notes are an integral part of the Financial Statements 146

DOMESTIC INTERNATIONAL POOLEDEQUITY EQUITY INVESTMENT
ACCOUNTS ACCOUNT FUND TOTAL19 $ 12 $ 385,525 $
298,492 131,767 861,242
2,826 2,121) ( 13,309
11,301 13,686 43,325
7,531) ( 6,443) ( 27,445) (
848) ( 1,978) ( 3,710) (
2,922 5,265 12,170
304,259 $ 134,923 $ 1,272,246 $
24,035 15,203 56,302
280,224 $ 119,720 $ 1,215,944 $
14,854,716 $ 2,950,551 $ 65,649,030 $
13,075,875 2,597,019 63,517,993
1,778,841 $ 353,532 $ 2,131,037 $
2,405,793 237,953) ( 2,432,098
3,756,312 795,626 4,610,152
1,350,519 $ 1,033,579 $ 2,178,054 $
3,129,360 $ 1,387,111 $ 4,309,091 $
Notes are an integral part of the Financial Statements 147
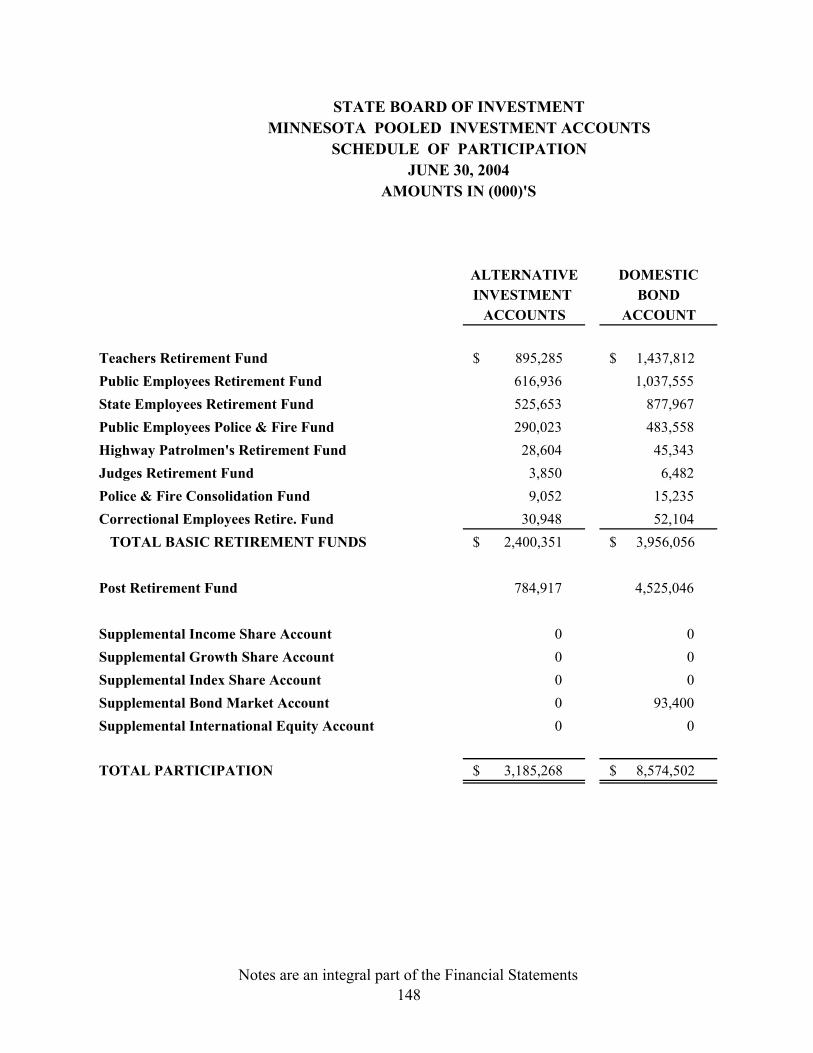
STATE BOARD OF INVESTMENTMINNESOTA POOLED INVESTMENT ACCOUNTS
SCHEDULE OF PARTICIPATIONJUNE 30, 2004
AMOUNTS IN (000)'S
ALTERNATIVE DOMESTICINVESTMENT BOND
ACCOUNTS ACCOUNT
Teachers Retirement Fund 895,285 $ 1,437,812 $ Public Employees Retirement Fund 616,936 1,037,555 State Employees Retirement Fund 525,653 877,967 Public Employees Police & Fire Fund 290,023 483,558 Highway Patrolmen's Retirement Fund 28,604 45,343 Judges Retirement Fund 3,850 6,482 Police & Fire Consolidation Fund 9,052 15,235 Correctional Employees Retire. Fund 30,948 52,104 TOTAL BASIC RETIREMENT FUNDS 2,400,351 $ 3,956,056 $
Post Retirement Fund 784,917 4,525,046
Supplemental Income Share Account 0 0 Supplemental Growth Share Account 0 0 Supplemental Index Share Account 0 0 Supplemental Bond Market Account 0 93,400 Supplemental International Equity Account 0 0
TOTAL PARTICIPATION 3,185,268 $ 8,574,502 $
Notes are an integral part of the Financial Statements 148

DOMESTIC INTERNATIONAL POOLED
EQUITY EQUITY INVESTMENTACCOUNTS ACCOUNT FUNDS TOTAL
3,296,595 $ 1,044,539 $ 6,674,231 $ 2,361,283 751,240 4,767,014 2,000,135 636,004 4,039,759 1,101,914 350,338 2,225,833
104,123 32,973 211,043 14,751 4,693 29,776 34,666 11,030 69,983
118,560 37,723 239,335 9,032,027 $ 2,868,540 $ 18,256,974 $
9,471,420 2,844,617 17,626,000
288,954 0 288,954 133,526 0 133,526 191,831 0 191,831
0 0 93,400 0 58,842 58,842
19,117,758 $ 5,771,999 $ 36,649,527 $
Notes are an integral part of the Financial Statements 149
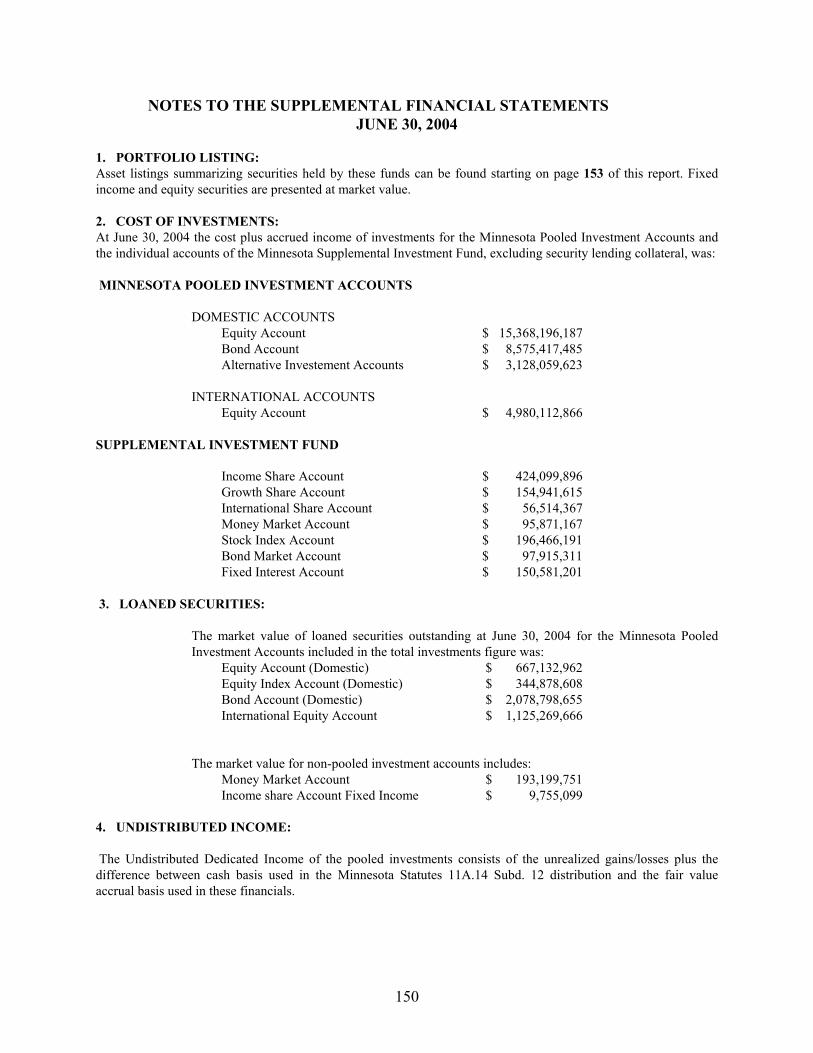
150
NOTES TO THE SUPPLEMENTAL FINANCIAL STATEMENTS JUNE 30, 2004
1. PORTFOLIO LISTING: Asset listings summarizing securities held by these funds can be found starting on page 153 of this report. Fixed income and equity securities are presented at market value. 2. COST OF INVESTMENTS: At June 30, 2004 the cost plus accrued income of investments for the Minnesota Pooled Investment Accounts and the individual accounts of the Minnesota Supplemental Investment Fund, excluding security lending collateral, was: MINNESOTA POOLED INVESTMENT ACCOUNTS DOMESTIC ACCOUNTS
Equity Account $ 15,368,196,187 Bond Account $ 8,575,417,485 Alternative Investement Accounts $ 3,128,059,623
INTERNATIONAL ACCOUNTS Equity Account $ 4,980,112,866
SUPPLEMENTAL INVESTMENT FUND Income Share Account $ 424,099,896
Growth Share Account $ 154,941,615 International Share Account $ 56,514,367 Money Market Account $ 95,871,167 Stock Index Account $ 196,466,191 Bond Market Account $ 97,915,311
Fixed Interest Account $ 150,581,201 3. LOANED SECURITIES:
The market value of loaned securities outstanding at June 30, 2004 for the Minnesota Pooled Investment Accounts included in the total investments figure was:
Equity Account (Domestic) $ 667,132,962 Equity Index Account (Domestic) $ 344,878,608 Bond Account (Domestic) $ 2,078,798,655 International Equity Account $ 1,125,269,666
The market value for non-pooled investment accounts includes: Money Market Account $ 193,199,751 Income share Account Fixed Income $ 9,755,099 4. UNDISTRIBUTED INCOME: The Undistributed Dedicated Income of the pooled investments consists of the unrealized gains/losses plus the difference between cash basis used in the Minnesota Statutes 11A.14 Subd. 12 distribution and the fair value accrual basis used in these financials.

External Stock and Bond Managers' Fees
Total Payments for Fiscal Year 2004
Active Domestic Stock Managers (1)Alliance Capital $ 4,011,325American Express Kenwood 175,101Artemis Investment Management 165,067Barrow Hanley Mewhinney Staus 216,484Bay Isle Corp. 225,256Cohen Klingenstein & Marks 1,263,110Earnest Partners 201,670FLA Asset Management* (458,920)Franklin Portfolio 1,103,911GeoCapital Corp.* (666,505)Goldman Sachs Asset Management 386,802Holt Smith & Yates Advisors 258,698Hotchkis and Wiley Capital Management 564,111Lord Abbett & Co LLC 250,373LVS Asset Management 241,363Lincoln Capital* (344,520)Martingale Asset Management 394,698Mc Kinley Capital Management 501,486New Amsterdam Partners 1,047,606Next Century 304,557Oppenheimer Capital 1,061,696Peregrine Capital Management 1,543,158Systematic Financial Management 178,926Turner Investment Partners 573,561UBS Global Asset Management (Brinson) 1,209,987U S Bank Corp.* 126,764Valenzuela Capital* 57,819Voyageur Asset Management 235,032Winslow Capital 846,284Zevenbergen Capital 628,333
Passive Domestic Stock Managers (2)Barclays Global Investors 963,499
Semi-Passive Domestic Stock Managers (2)Barclays Global Investors 2,762,970Franklin Portfolio 1,646,128JP Morgan 2,277,169
cont.151
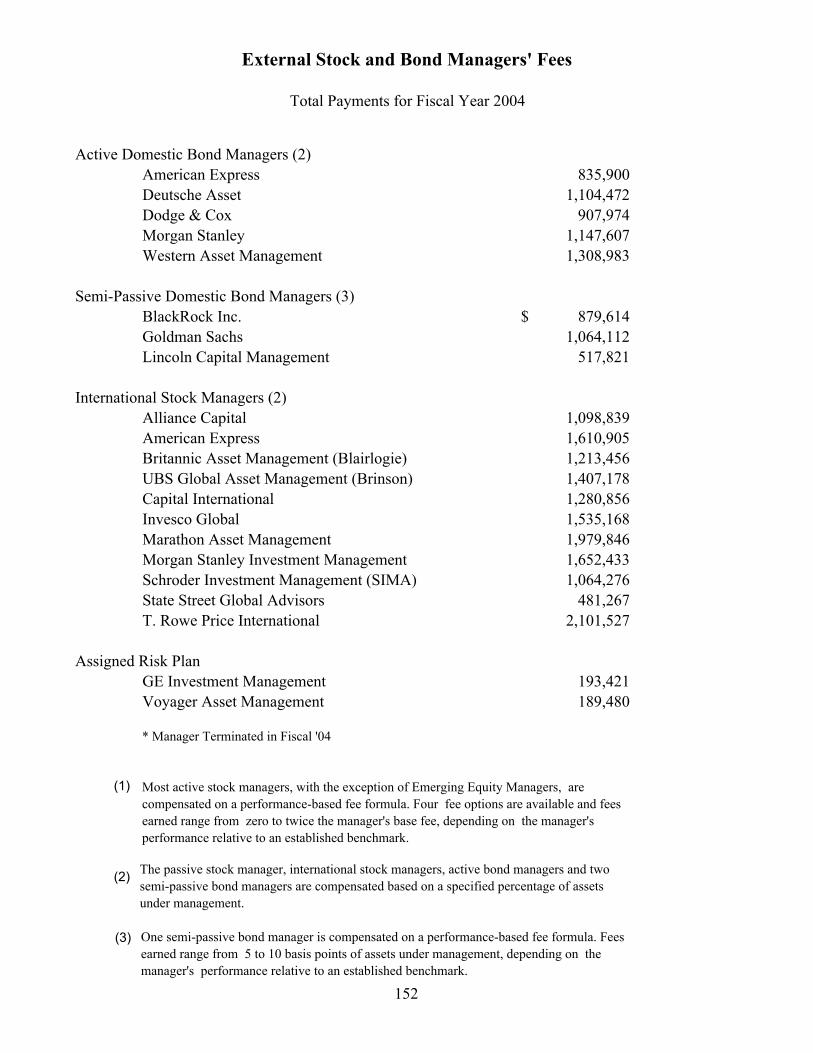
External Stock and Bond Managers' Fees
Total Payments for Fiscal Year 2004
Active Domestic Bond Managers (2)American Express 835,900Deutsche Asset 1,104,472Dodge & Cox 907,974Morgan Stanley 1,147,607Western Asset Management 1,308,983
Semi-Passive Domestic Bond Managers (3)BlackRock Inc. $ 879,614Goldman Sachs 1,064,112Lincoln Capital Management 517,821
International Stock Managers (2)Alliance Capital 1,098,839American Express 1,610,905Britannic Asset Management (Blairlogie) 1,213,456UBS Global Asset Management (Brinson) 1,407,178Capital International 1,280,856Invesco Global 1,535,168Marathon Asset Management 1,979,846Morgan Stanley Investment Management 1,652,433Schroder Investment Management (SIMA) 1,064,276State Street Global Advisors 481,267T. Rowe Price International 2,101,527
Assigned Risk PlanGE Investment Management 193,421Voyager Asset Management 189,480
* Manager Terminated in Fiscal '04
Most active stock managers, with the exception of Emerging Equity Managers, are compensated on a performance-based fee formula. Four fee options are available and fees earned range from zero to twice the manager's base fee, depending on the manager's performance relative to an established benchmark.
The passive stock manager, international stock managers, active bond managers and two semi-passive bond managers are compensated based on a specified percentage of assets under management.
One semi-passive bond manager is compensated on a performance-based fee formula. Fees earned range from 5 to 10 basis points of assets under management, depending on the manager's performance relative to an established benchmark.
(1)
(3)
(2)
(1)
152
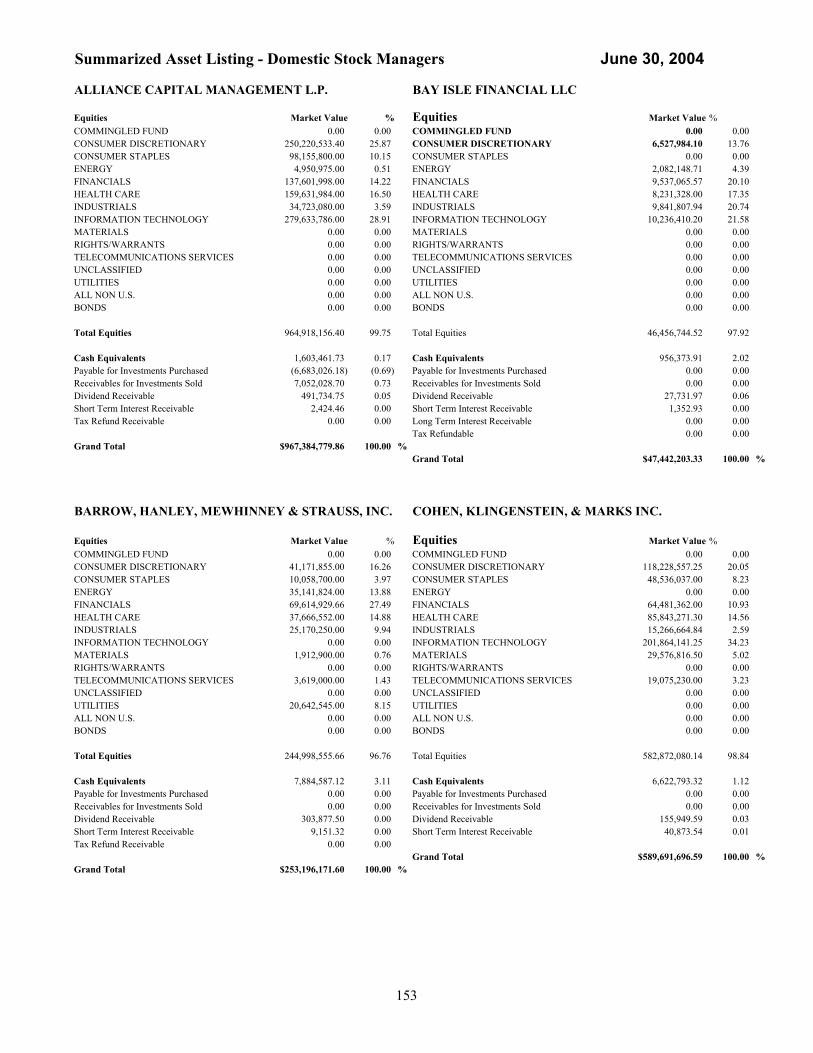
Summarized Asset Listing - Domestic Stock Managers June 30, 2004
ALLIANCE CAPITAL MANAGEMENT L.P. BAY ISLE FINANCIAL LLC
Equities Market Value % Equities Market Value %COMMINGLED FUND 0.00 0.00 COMMINGLED FUND 0.00 0.00 CONSUMER DISCRETIONARY 250,220,533.40 25.87 CONSUMER DISCRETIONARY 6,527,984.10 13.76CONSUMER STAPLES 98,155,800.00 10.15 CONSUMER STAPLES 0.00 0.00ENERGY 4,950,975.00 0.51 ENERGY 2,082,148.71 4.39FINANCIALS 137,601,998.00 14.22 FINANCIALS 9,537,065.57 20.10HEALTH CARE 159,631,984.00 16.50 HEALTH CARE 8,231,328.00 17.35INDUSTRIALS 34,723,080.00 3.59 INDUSTRIALS 9,841,807.94 20.74INFORMATION TECHNOLOGY 279,633,786.00 28.91 INFORMATION TECHNOLOGY 10,236,410.20 21.58MATERIALS 0.00 0.00 MATERIALS 0.00 0.00RIGHTS/WARRANTS 0.00 0.00 RIGHTS/WARRANTS 0.00 0.00TELECOMMUNICATIONS SERVICES 0.00 0.00 TELECOMMUNICATIONS SERVICES 0.00 0.00UNCLASSIFIED 0.00 0.00 UNCLASSIFIED 0.00 0.00UTILITIES 0.00 0.00 UTILITIES 0.00 0.00ALL NON U.S. 0.00 0.00 ALL NON U.S. 0.00 0.00BONDS 0.00 0.00 BONDS 0.00 0.00
Total Equities 964,918,156.40 99.75 Total Equities 46,456,744.52 97.92
Cash Equivalents 1,603,461.73 0.17 Cash Equivalents 956,373.91 2.02Payable for Investments Purchased (6,683,026.18) (0.69) Payable for Investments Purchased 0.00 0.00Receivables for Investments Sold 7,052,028.70 0.73 Receivables for Investments Sold 0.00 0.00Dividend Receivable 491,734.75 0.05 Dividend Receivable 27,731.97 0.06Short Term Interest Receivable 2,424.46 0.00 Short Term Interest Receivable 1,352.93 0.00Tax Refund Receivable 0.00 0.00 Long Term Interest Receivable 0.00 0.00
Tax Refundable 0.00 0.00Grand Total $967,384,779.86 100.00 %
Grand Total $47,442,203.33 100.00 %
BARROW, HANLEY, MEWHINNEY & STRAUSS, INC. COHEN, KLINGENSTEIN, & MARKS INC.
Equities Market Value % Equities Market Value %COMMINGLED FUND 0.00 0.00 COMMINGLED FUND 0.00 0.00 CONSUMER DISCRETIONARY 41,171,855.00 16.26 CONSUMER DISCRETIONARY 118,228,557.25 20.05CONSUMER STAPLES 10,058,700.00 3.97 CONSUMER STAPLES 48,536,037.00 8.23ENERGY 35,141,824.00 13.88 ENERGY 0.00 0.00FINANCIALS 69,614,929.66 27.49 FINANCIALS 64,481,362.00 10.93HEALTH CARE 37,666,552.00 14.88 HEALTH CARE 85,843,271.30 14.56INDUSTRIALS 25,170,250.00 9.94 INDUSTRIALS 15,266,664.84 2.59INFORMATION TECHNOLOGY 0.00 0.00 INFORMATION TECHNOLOGY 201,864,141.25 34.23MATERIALS 1,912,900.00 0.76 MATERIALS 29,576,816.50 5.02RIGHTS/WARRANTS 0.00 0.00 RIGHTS/WARRANTS 0.00 0.00TELECOMMUNICATIONS SERVICES 3,619,000.00 1.43 TELECOMMUNICATIONS SERVICES 19,075,230.00 3.23UNCLASSIFIED 0.00 0.00 UNCLASSIFIED 0.00 0.00UTILITIES 20,642,545.00 8.15 UTILITIES 0.00 0.00ALL NON U.S. 0.00 0.00 ALL NON U.S. 0.00 0.00BONDS 0.00 0.00 BONDS 0.00 0.00
Total Equities 244,998,555.66 96.76 Total Equities 582,872,080.14 98.84
Cash Equivalents 7,884,587.12 3.11 Cash Equivalents 6,622,793.32 1.12Payable for Investments Purchased 0.00 0.00 Payable for Investments Purchased 0.00 0.00Receivables for Investments Sold 0.00 0.00 Receivables for Investments Sold 0.00 0.00Dividend Receivable 303,877.50 0.00 Dividend Receivable 155,949.59 0.03Short Term Interest Receivable 9,151.32 0.00 Short Term Interest Receivable 40,873.54 0.01Tax Refund Receivable 0.00 0.00
Grand Total $589,691,696.59 100.00 %Grand Total $253,196,171.60 100.00 %
153

Summarized Asset Listing - Domestic Stock Managers June 30, 2004
EARNEST PARTNERS GOLDMAN SACHS ASSET MANAGEMENT
Equities Market Value % Equities Market Value %COMMINGLED FUND 0.00 0.00 COMMINGLED FUND 0.00 0.00 CONSUMER DISCRETIONARY 8,508,765.00 15.79 CONSUMER DISCRETIONARY 17,699,080.73 17.98CONSUMER STAPLES 0.00 0.00 CONSUMER STAPLES 3,142,074.18 3.19ENERGY 9,050,928.14 16.80 ENERGY 6,778,866.72 6.89FINANCIALS 18,235,627.75 33.85 FINANCIALS 29,619,121.09 30.09HEALTH CARE 5,966,374.00 11.07 HEALTH CARE 3,751,366.96 3.81INDUSTRIALS 3,410,467.00 6.33 INDUSTRIALS 13,967,863.03 14.19INFORMATION TECHNOLOGY 4,292,175.00 7.97 INFORMATION TECHNOLOGY 8,855,176.50 9.00MATERIALS 0.00 0.00 MATERIALS 7,050,394.69 7.16RIGHTS/WARRANTS 0.00 0.00 RIGHTS/WARRANTS 0.00 0.00TELECOMMUNICATIONS SERVICES 2,394,688.00 4.44 TELECOMMUNICATIONS SERVICES 413,372.88 0.42UNCLASSIFIED 0.00 0.00 UNCLASSIFIED 0.00 0.00UTILITIES 656,930.00 1.22 UTILITIES 4,841,722.88 4.92ALL NON U.S. 0.00 0.00 ALL NON U.S. 0.00 0.00BONDS 0.00 0.00 BONDS 0.00 0.00
Total Equities 52,515,954.89 97.47 Total Equities 96,119,039.66 97.64
Cash Equivalents 1,334,860.30 2.48 Cash Equivalents 2,172,565.52 2.21Payable for Investments Purchased 0.00 0.00 Payable for Investments Purchased (258,818.81) (0.61)Receivables for Investments Sold 0.00 0.00 Receivables for Investments Sold 305,555.83 0.73Dividend Receivable 27,096.66 0.05 Dividend Receivable 98,024.70 0.23Short Term Interest Receivable 1,501.96 0.00 Short Term Interest Receivable 3,243.09 0.01Long Term Interest Receivable 0.00 0.00 Long Term Interest Receivable 0.00 0.00Tax Refundable 0.00 0.00 Tax Refundable 0.00 0.00
Grand Total $53,879,413.81 100.00 % Grand Total $98,439,609.99 100.00 %
FRANKLIN PORTFOLIO ASSOC. HOLT-SMITH AND YATES ADVISORS
Equities Market Value % Equities Market Value %COMMINGLED FUND 0.00 0.00 COMMINGLED FUND 0.00 0.00 CONSUMER DISCRETIONARY 120,420,280.50 18.16 CONSUMER DISCRETIONARY 10,075,696.00 23.92CONSUMER STAPLES 54,061,351.00 8.15 CONSUMER STAPLES 2,027,760.00 4.81ENERGY 58,968,578.00 8.89 ENERGY 0.00 0.00FINANCIALS 150,686,606.00 22.72 FINANCIALS 6,370,698.00 15.13HEALTH CARE 82,184,143.00 12.39 HEALTH CARE 8,882,428.00 21.09INDUSTRIALS 46,442,835.00 7.00 INDUSTRIALS 4,259,020.00 10.11INFORMATION TECHNOLOGY 97,287,289.00 14.67 INFORMATION TECHNOLOGY 9,766,912.00 23.19MATERIALS 20,168,118.00 3.04 MATERIALS 0.00 0.00RIGHTS/WARRANTS 0.00 0.00 RIGHTS/WARRANTS 0.00 0.00TELECOMMUNICATIONS SERVICES 23,151,544.00 3.49 TELECOMMUNICATIONS SERVICES 0.00 0.00UNCLASSIFIED 8,330,420.00 1.26 UNCLASSIFIED 0.00 0.00UTILITIES 0.00 0.00 UTILITIES 0.00 0.00ALL NON U.S. 0.00 0.00 ALL NON U.S. 0.00 0.00BONDS 0.00 0.00 BONDS 0.00 0.00
Total Equities 661,701,164.50 99.77 Total Equities 41,382,514.00 98.25
Cash Equivalents 722,890.88 0.11 Cash Equivalents 733,829.26 1.74Payable for Investments Purchased 0.00 0.00 Payable for Investments Purchased 0.00 0.00Receivables for Investments Sold 0.00 0.00 Receivables for Investments Sold 0.00 0.00Dividend Receivable 828,435.25 0.12 Dividend Receivable 1,860.00 0.00Short Term Interest Receivable 1,397.26 0.00 Short Term Interest Receivable 833.47 0.00
Long Term Interest Receivable 0.00 0.00Grand Total $663,253,887.89 100.00 % Tax Refundable 0.00 0.00
Grand Total $42,119,036.73 100.00 %
154

Summarized Asset Listing - Domestic Stock Managers June 30, 2004
HOTCHKIS AND WILEY CAPITAL MANAGEMENT LLCLORD ABBETT & CO, LLC
Equities Market Value % Equities Market Value %COMMINGLED FUND 0.00 0.00 COMMINGLED FUND 0.00 0.00 CONSUMER DISCRETIONARY 27,578,670.00 26.56 CONSUMER DISCRETIONARY 29,920,135.00 11.93CONSUMER STAPLES 4,166,674.00 4.01 CONSUMER STAPLES 22,759,838.00 9.08ENERGY 5,067,097.00 4.88 ENERGY 20,484,682.00 8.17FINANCIALS 24,360,421.00 23.46 FINANCIALS 39,784,898.52 15.86HEALTH CARE 2,180,940.00 2.10 HEALTH CARE 27,587,646.00 11.00INDUSTRIALS 22,631,237.00 21.79 INDUSTRIALS 38,027,268.60 15.16INFORMATION TECHNOLOGY 4,961,280.00 4.78 INFORMATION TECHNOLOGY 28,307,467.00 11.29MATERIALS 2,780,169.00 2.68 MATERIALS 23,704,239.00 9.45RIGHTS/WARRANTS 0.00 0.00 RIGHTS/WARRANTS 0.00 0.00TELECOMMUNICATIONS SERVICES 971,500.00 0.94 TELECOMMUNICATIONS SERVICES 8,674,195.00 3.46UNCLASSIFIED 0.00 0.00 UNCLASSIFIED 0.00 0.00UTILITIES 7,037,689.00 6.78 UTILITIES 3,316,230.00 1.32ALL NON U.S. 0.00 0.00 ALL NON U.S. 0.00 0.00BONDS 0.00 0.00 BONDS 0.00 0.00
Total Equities 101,735,677.00 97.97 Total Equities 242,566,599.12 96.73
Cash Equivalents 2,695,943.28 2.60 Cash Equivalents 8,332,750.23 3.32Payable for Investments Purchased (681,849.19) (0.66) Payable for Investments Purchased (793,620.31) (0.32)Receivables for Investments Sold 0.00 0.00 Receivables for Investments Sold 426,335.02 0.17Dividend Receivable 90,741.25 0.09 Dividend Receivable 234,027.75 0.09Short Term Interest Receivable 3,120.57 0.00 Short Term Interest Receivable 9,087.12 0.00Tax Refundable 0.00 0.00 Long Term Interest Receivable 0.00 0.00
Tax Refundable 0.00 0.00Grand Total $103,843,632.91 100.00 %
Grand Total $250,775,178.93 100.00 %
KENWOOD CAPITAL MANAGEMENT, LLC LSV ASSET MANAGEMENT
Equities Market Value % Equities Market Value %COMMINGLED FUND 0.00 0.00 COMMINGLED FUND 0.00 0.00 CONSUMER DISCRETIONARY 7,680,666.00 16.59 CONSUMER DISCRETIONARY 32,154,648.00 12.57CONSUMER STAPLES 2,228,100.50 4.81 CONSUMER STAPLES 12,590,340.00 4.92ENERGY 2,310,382.00 4.99 ENERGY 33,651,767.00 13.16FINANCIALS 10,354,306.82 22.36 FINANCIALS 89,564,770.92 35.03HEALTH CARE 2,758,296.00 5.96 HEALTH CARE 10,422,491.00 4.08INDUSTRIALS 7,667,342.25 16.56 INDUSTRIALS 20,658,654.00 8.08INFORMATION TECHNOLOGY 4,500,962.00 9.72 INFORMATION TECHNOLOGY 14,298,444.00 5.59MATERIALS 4,506,454.00 9.73 MATERIALS 9,017,211.00 3.53RIGHTS/WARRANTS 0.00 0.00 RIGHTS/WARRANTS 0.00 0.00TELECOMMUNICATIONS SERVICES 439,633.00 0.95 TELECOMMUNICATIONS SERVICES 10,037,136.00 3.93UNCLASSIFIED 0.00 0.00 UNCLASSIFIED 0.00 0.00UTILITIES 3,181,250.50 6.87 UTILITIES 21,474,576.00 8.40ALL NON U.S. 0.00 0.00 ALL NON U.S. 0.00 0.00BONDS 0.00 0.00 BONDS 0.00 0.00
Total Equities 45,627,393.07 98.53 Total Equities 253,870,037.92 99.28
Cash Equivalents 822,140.60 1.78 Cash Equivalents 1,467,416.87 0.57Payable for Investments Purchased (744,527.84) (1.61) Payable for Investments Purchased 0.00 0.00Receivables for Investments Sold 574,433.06 1.24 Receivables for Investments Sold 0.00 0.00Dividend Receivable 28,432.00 0.06 Dividend Receivable 372,459.25 0.15Short Term Interest Receivable 991.68 0.00 Short Term Interest Receivable 1,386.20 0.00Long Term Interest Receivable 73.81 0.00 Tax Refundable 0.00 0.00Tax Refundable 0.00 0.00
Grand Total $255,711,300.24 100.00 %Grand Total $46,308,936.38 100.00 %
155

Summarized Asset Listing - Domestic Stock Managers June 30, 2004
MARTINGALE ASSET MANAGEMENT LP NEW AMSTERDAM PARTNERS LLC
Equities Market Value % Equities Market Value %COMMINGLED FUND 0.00 0.00 COMMINGLED FUND 0.00 0.00 CONSUMER DISCRETIONARY 18,373,394.00 17.49 CONSUMER DISCRETIONARY 70,369,958.00 17.77CONSUMER STAPLES 5,350,248.00 5.09 CONSUMER STAPLES 55,824,321.00 14.09ENERGY 3,599,567.00 3.43 ENERGY 24,708,698.00 6.24FINANCIALS 32,986,937.00 31.40 FINANCIALS 80,567,536.25 20.34HEALTH CARE 4,294,798.00 4.09 HEALTH CARE 51,763,222.00 13.07INDUSTRIALS 18,762,735.00 17.86 INDUSTRIALS 24,550,189.00 6.20INFORMATION TECHNOLOGY 6,049,387.00 5.76 INFORMATION TECHNOLOGY 63,033,995.00 15.91MATERIALS 8,480,286.00 8.07 MATERIALS 8,317,244.00 2.10RIGHTS/WARRANTS 0.00 0.00 RIGHTS/WARRANTS 0.00 0.00TELECOMMUNICATIONS SERVICES 206,025.00 0.20 TELECOMMUNICATIONS SERVICES 0.00 0.00UNCLASSIFIED 356,402.00 0.34 UNCLASSIFIED 0.00 0.00UTILITIES 5,696,976.00 5.42 UTILITIES 9,243,120.00 2.33ALL NON U.S. 0.00 0.00 ALL NON U.S. 0.00 0.00BONDS 0.00 0.00 BONDS 0.00 0.00
Total Equities 104,156,755.00 99.13 Total Equities 388,378,283.25 98.06
Cash Equivalents 779,388.95 0.74 Cash Equivalents 7,290,290.67 1.84Payable for Investments Purchased 0.00 0.00 Payable for Investments Purchased 0.00 0.00Receivables for Investments Sold 0.00 0.00 Receivables for Investments Sold 0.00 0.00Dividend Receivable 130,655.35 0.12 Dividend Receivable 396,548.00 0.86Short Term Interest Receivable 1,276.50 0.00 Short Term Interest Receivable 10,056.66 0.02Long Term Interest Receivable 0.00 0.00 Long Term Interest Receivable 0.00 0.00Tax Refundable 0.00 0.00 Tax Refundable 0.00 0.00
Grand Total $105,068,075.80 100.00 % Grand Total $396,075,178.58 100.00 %
MCKINLEY CAPITAL MANAGEMENT INC NEXT CENTURY GROWTH INVESTORS LLC
Equities Market Value % Equities Market Value %COMMINGLED FUND 0.00 0.00 COMMINGLED FUND 0.00 0.00 CONSUMER DISCRETIONARY 21,563,237.56 12.19 CONSUMER DISCRETIONARY 6,213,243.58 19.61CONSUMER STAPLES 13,814,414.25 7.81 CONSUMER STAPLES 0.00 0.00ENERGY 7,266,078.75 4.11 ENERGY 1,911,919.25 6.03FINANCIALS 14,838,176.55 8.39 FINANCIALS 2,032,171.95 6.41HEALTH CARE 44,522,892.45 25.18 HEALTH CARE 6,152,964.15 19.42INDUSTRIALS 16,176,225.20 9.15 INDUSTRIALS 6,575,109.30 20.75INFORMATION TECHNOLOGY 43,921,749.35 24.84 INFORMATION TECHNOLOGY 8,739,412.27 27.58MATERIALS 9,439,599.25 5.34 MATERIALS 0.00 0.00RIGHTS/WARRANTS 0.00 0.00 RIGHTS/WARRANTS 0.00 0.00TELECOMMUNICATIONS SERVICES 0.00 0.00 TELECOMMUNICATIONS SERVICES 0.00 0.00UNCLASSIFIED 0.00 0.00 UNCLASSIFIED 0.00 0.00UTILITIES 0.00 0.00 UTILITIES 0.00 0.00ALL NON U.S. 0.00 0.00 ALL NON U.S. 0.00 0.00BONDS 0.00 0.00 BONDS 0.00 0.00
Total Equities 171,542,373.36 97.00 Total Equities 31,624,820.50 99.81
Cash Equivalents 5,518,460.22 3.12 Cash Equivalents 166,855.73 0.53Payable for Investments Purchased (955,444.14) (0.54) Payable for Investments Purchased (247,065.46) (0.78)Receivables for Investments Sold 717,322.37 0.41 Receivables for Investments Sold 139,604.09 0.44Dividend Receivable 18,810.10 0.01 Dividend Receivable 0.00 0.00Short Term Interest Receivable 4,376.06 0.00 Short Term Interest Receivable 330.36 0.00Long Term Interest Receivable 0.00 0.00 Long Term Interest Receivable 0.00 0.00Tax Refundable 0.00 0.00 Tax Refundable 112.15 0.00
Grand Total $176,845,897.97 100.00 % Grand Total $31,684,657.37 100.00 %
156
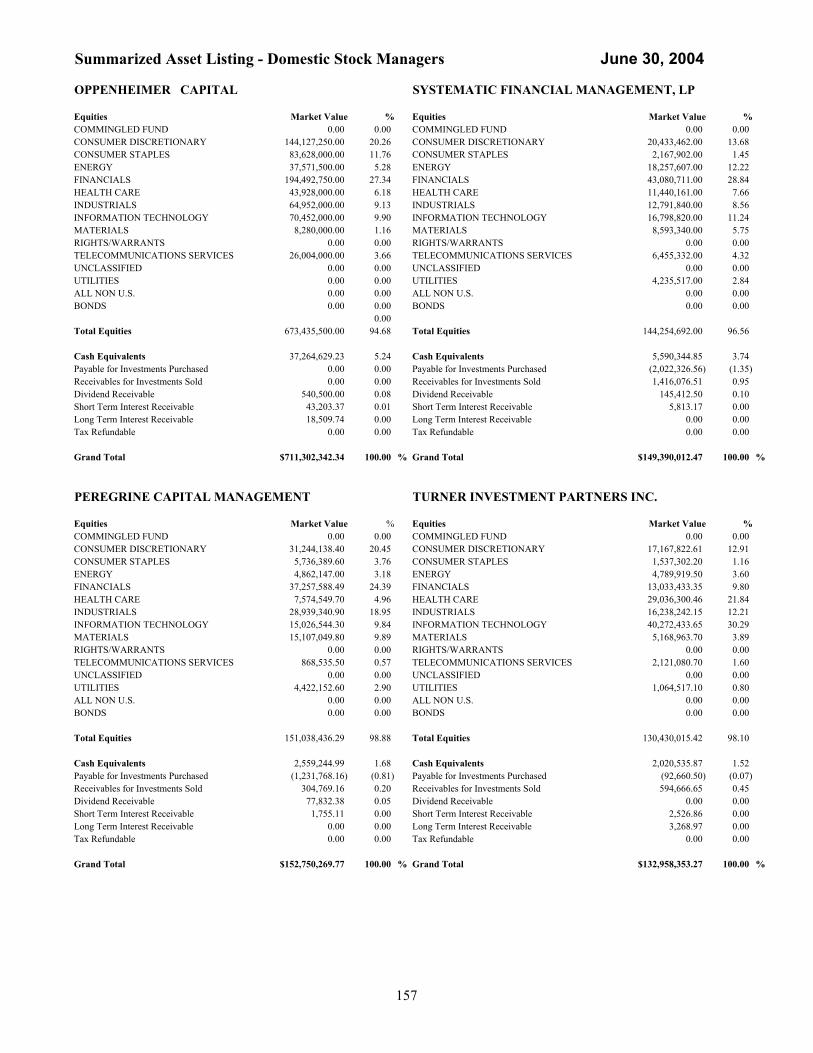
Summarized Asset Listing - Domestic Stock Managers June 30, 2004
OPPENHEIMER CAPITAL SYSTEMATIC FINANCIAL MANAGEMENT, LP
Equities Market Value % Equities Market Value %COMMINGLED FUND 0.00 0.00 COMMINGLED FUND 0.00 0.00CONSUMER DISCRETIONARY 144,127,250.00 20.26 CONSUMER DISCRETIONARY 20,433,462.00 13.68CONSUMER STAPLES 83,628,000.00 11.76 CONSUMER STAPLES 2,167,902.00 1.45ENERGY 37,571,500.00 5.28 ENERGY 18,257,607.00 12.22FINANCIALS 194,492,750.00 27.34 FINANCIALS 43,080,711.00 28.84HEALTH CARE 43,928,000.00 6.18 HEALTH CARE 11,440,161.00 7.66INDUSTRIALS 64,952,000.00 9.13 INDUSTRIALS 12,791,840.00 8.56INFORMATION TECHNOLOGY 70,452,000.00 9.90 INFORMATION TECHNOLOGY 16,798,820.00 11.24MATERIALS 8,280,000.00 1.16 MATERIALS 8,593,340.00 5.75RIGHTS/WARRANTS 0.00 0.00 RIGHTS/WARRANTS 0.00 0.00TELECOMMUNICATIONS SERVICES 26,004,000.00 3.66 TELECOMMUNICATIONS SERVICES 6,455,332.00 4.32UNCLASSIFIED 0.00 0.00 UNCLASSIFIED 0.00 0.00UTILITIES 0.00 0.00 UTILITIES 4,235,517.00 2.84ALL NON U.S. 0.00 0.00 ALL NON U.S. 0.00 0.00BONDS 0.00 0.00 BONDS 0.00 0.00
0.00Total Equities 673,435,500.00 94.68 Total Equities 144,254,692.00 96.56
Cash Equivalents 37,264,629.23 5.24 Cash Equivalents 5,590,344.85 3.74Payable for Investments Purchased 0.00 0.00 Payable for Investments Purchased (2,022,326.56) (1.35)Receivables for Investments Sold 0.00 0.00 Receivables for Investments Sold 1,416,076.51 0.95Dividend Receivable 540,500.00 0.08 Dividend Receivable 145,412.50 0.10Short Term Interest Receivable 43,203.37 0.01 Short Term Interest Receivable 5,813.17 0.00Long Term Interest Receivable 18,509.74 0.00 Long Term Interest Receivable 0.00 0.00Tax Refundable 0.00 0.00 Tax Refundable 0.00 0.00
Grand Total $711,302,342.34 100.00 % Grand Total $149,390,012.47 100.00 %
PEREGRINE CAPITAL MANAGEMENT TURNER INVESTMENT PARTNERS INC.
Equities Market Value % Equities Market Value %COMMINGLED FUND 0.00 0.00 COMMINGLED FUND 0.00 0.00 CONSUMER DISCRETIONARY 31,244,138.40 20.45 CONSUMER DISCRETIONARY 17,167,822.61 12.91CONSUMER STAPLES 5,736,389.60 3.76 CONSUMER STAPLES 1,537,302.20 1.16ENERGY 4,862,147.00 3.18 ENERGY 4,789,919.50 3.60FINANCIALS 37,257,588.49 24.39 FINANCIALS 13,033,433.35 9.80HEALTH CARE 7,574,549.70 4.96 HEALTH CARE 29,036,300.46 21.84INDUSTRIALS 28,939,340.90 18.95 INDUSTRIALS 16,238,242.15 12.21INFORMATION TECHNOLOGY 15,026,544.30 9.84 INFORMATION TECHNOLOGY 40,272,433.65 30.29MATERIALS 15,107,049.80 9.89 MATERIALS 5,168,963.70 3.89RIGHTS/WARRANTS 0.00 0.00 RIGHTS/WARRANTS 0.00 0.00TELECOMMUNICATIONS SERVICES 868,535.50 0.57 TELECOMMUNICATIONS SERVICES 2,121,080.70 1.60UNCLASSIFIED 0.00 0.00 UNCLASSIFIED 0.00 0.00UTILITIES 4,422,152.60 2.90 UTILITIES 1,064,517.10 0.80ALL NON U.S. 0.00 0.00 ALL NON U.S. 0.00 0.00BONDS 0.00 0.00 BONDS 0.00 0.00
Total Equities 151,038,436.29 98.88 Total Equities 130,430,015.42 98.10
Cash Equivalents 2,559,244.99 1.68 Cash Equivalents 2,020,535.87 1.52Payable for Investments Purchased (1,231,768.16) (0.81) Payable for Investments Purchased (92,660.50) (0.07)Receivables for Investments Sold 304,769.16 0.20 Receivables for Investments Sold 594,666.65 0.45Dividend Receivable 77,832.38 0.05 Dividend Receivable 0.00 0.00Short Term Interest Receivable 1,755.11 0.00 Short Term Interest Receivable 2,526.86 0.00Long Term Interest Receivable 0.00 0.00 Long Term Interest Receivable 3,268.97 0.00Tax Refundable 0.00 0.00 Tax Refundable 0.00 0.00
Grand Total $152,750,269.77 100.00 % Grand Total $132,958,353.27 100.00 %
157
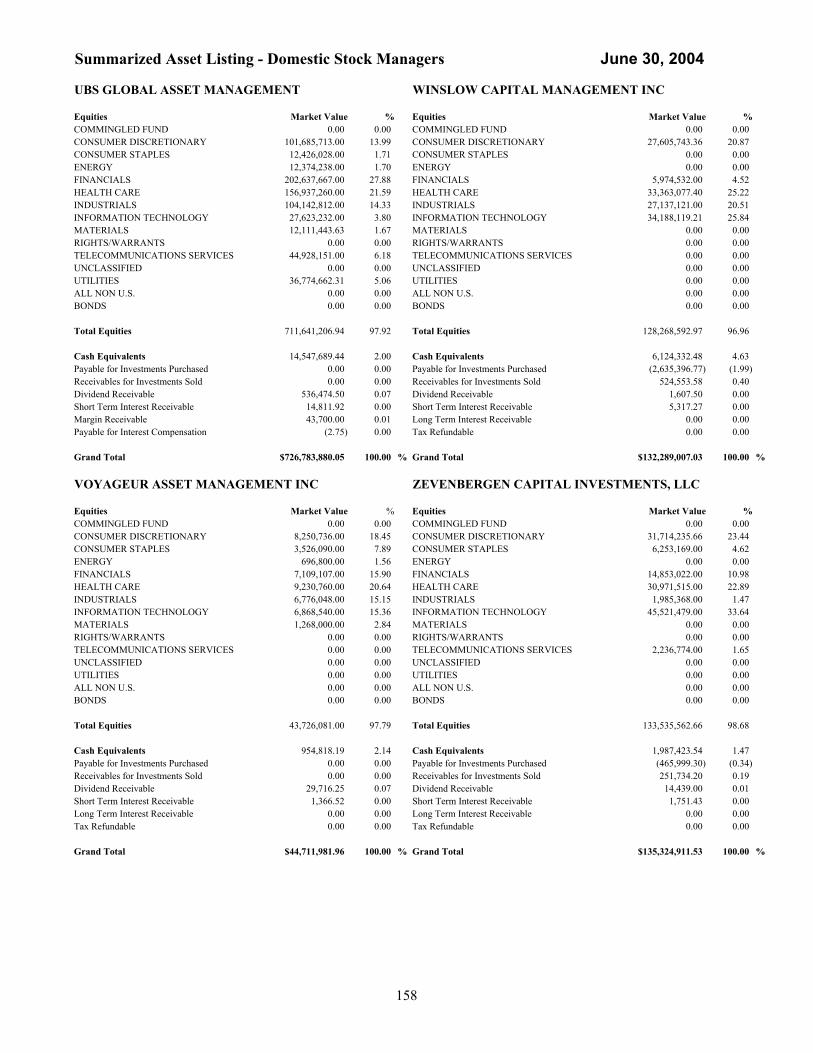
Summarized Asset Listing - Domestic Stock Managers June 30, 2004
UBS GLOBAL ASSET MANAGEMENT WINSLOW CAPITAL MANAGEMENT INC
Equities Market Value % Equities Market Value %COMMINGLED FUND 0.00 0.00 COMMINGLED FUND 0.00 0.00 CONSUMER DISCRETIONARY 101,685,713.00 13.99 CONSUMER DISCRETIONARY 27,605,743.36 20.87CONSUMER STAPLES 12,426,028.00 1.71 CONSUMER STAPLES 0.00 0.00ENERGY 12,374,238.00 1.70 ENERGY 0.00 0.00FINANCIALS 202,637,667.00 27.88 FINANCIALS 5,974,532.00 4.52HEALTH CARE 156,937,260.00 21.59 HEALTH CARE 33,363,077.40 25.22INDUSTRIALS 104,142,812.00 14.33 INDUSTRIALS 27,137,121.00 20.51INFORMATION TECHNOLOGY 27,623,232.00 3.80 INFORMATION TECHNOLOGY 34,188,119.21 25.84MATERIALS 12,111,443.63 1.67 MATERIALS 0.00 0.00RIGHTS/WARRANTS 0.00 0.00 RIGHTS/WARRANTS 0.00 0.00TELECOMMUNICATIONS SERVICES 44,928,151.00 6.18 TELECOMMUNICATIONS SERVICES 0.00 0.00UNCLASSIFIED 0.00 0.00 UNCLASSIFIED 0.00 0.00UTILITIES 36,774,662.31 5.06 UTILITIES 0.00 0.00ALL NON U.S. 0.00 0.00 ALL NON U.S. 0.00 0.00BONDS 0.00 0.00 BONDS 0.00 0.00
Total Equities 711,641,206.94 97.92 Total Equities 128,268,592.97 96.96
Cash Equivalents 14,547,689.44 2.00 Cash Equivalents 6,124,332.48 4.63Payable for Investments Purchased 0.00 0.00 Payable for Investments Purchased (2,635,396.77) (1.99)Receivables for Investments Sold 0.00 0.00 Receivables for Investments Sold 524,553.58 0.40Dividend Receivable 536,474.50 0.07 Dividend Receivable 1,607.50 0.00Short Term Interest Receivable 14,811.92 0.00 Short Term Interest Receivable 5,317.27 0.00Margin Receivable 43,700.00 0.01 Long Term Interest Receivable 0.00 0.00Payable for Interest Compensation (2.75) 0.00 Tax Refundable 0.00 0.00
Grand Total $726,783,880.05 100.00 % Grand Total $132,289,007.03 100.00 %
VOYAGEUR ASSET MANAGEMENT INC ZEVENBERGEN CAPITAL INVESTMENTS, LLC
Equities Market Value % Equities Market Value %COMMINGLED FUND 0.00 0.00 COMMINGLED FUND 0.00 0.00 CONSUMER DISCRETIONARY 8,250,736.00 18.45 CONSUMER DISCRETIONARY 31,714,235.66 23.44CONSUMER STAPLES 3,526,090.00 7.89 CONSUMER STAPLES 6,253,169.00 4.62ENERGY 696,800.00 1.56 ENERGY 0.00 0.00FINANCIALS 7,109,107.00 15.90 FINANCIALS 14,853,022.00 10.98HEALTH CARE 9,230,760.00 20.64 HEALTH CARE 30,971,515.00 22.89INDUSTRIALS 6,776,048.00 15.15 INDUSTRIALS 1,985,368.00 1.47INFORMATION TECHNOLOGY 6,868,540.00 15.36 INFORMATION TECHNOLOGY 45,521,479.00 33.64MATERIALS 1,268,000.00 2.84 MATERIALS 0.00 0.00RIGHTS/WARRANTS 0.00 0.00 RIGHTS/WARRANTS 0.00 0.00TELECOMMUNICATIONS SERVICES 0.00 0.00 TELECOMMUNICATIONS SERVICES 2,236,774.00 1.65UNCLASSIFIED 0.00 0.00 UNCLASSIFIED 0.00 0.00UTILITIES 0.00 0.00 UTILITIES 0.00 0.00ALL NON U.S. 0.00 0.00 ALL NON U.S. 0.00 0.00BONDS 0.00 0.00 BONDS 0.00 0.00
Total Equities 43,726,081.00 97.79 Total Equities 133,535,562.66 98.68
Cash Equivalents 954,818.19 2.14 Cash Equivalents 1,987,423.54 1.47Payable for Investments Purchased 0.00 0.00 Payable for Investments Purchased (465,999.30) (0.34)Receivables for Investments Sold 0.00 0.00 Receivables for Investments Sold 251,734.20 0.19Dividend Receivable 29,716.25 0.07 Dividend Receivable 14,439.00 0.01Short Term Interest Receivable 1,366.52 0.00 Short Term Interest Receivable 1,751.43 0.00Long Term Interest Receivable 0.00 0.00 Long Term Interest Receivable 0.00 0.00Tax Refundable 0.00 0.00 Tax Refundable 0.00 0.00
Grand Total $44,711,981.96 100.00 % Grand Total $135,324,911.53 100.00 %
158

Summarized Asset Listing - Domestic Stock Managers June 30, 2004
BARCLAYS GLOBAL INVESTORS J.P. MORGAN FLEMING ASSET MANAGEMENT(Semi - Passive) (Semi - Passive)Equities Market Value % Equities Market Value %COMMINGLED FUND 0.00 0.00 COMMINGLED FUND 0.00 0.00CONSUMER DISCRETIONARY 360,194,637.68 14.48 CONSUMER DISCRETIONARY 320,299,618.83 15.16CONSUMER STAPLES 162,226,417.11 6.52 CONSUMER STAPLES 154,660,994.00 7.32ENERGY 156,080,247.35 6.27 ENERGY 131,925,294.00 6.24FINANCIALS 510,954,052.71 20.54 FINANCIALS 446,315,167.00 21.12HEALTH CARE 357,710,867.71 14.38 HEALTH CARE 295,237,913.00 13.97INDUSTRIALS 257,034,354.08 10.33 INDUSTRIALS 219,997,330.00 10.41INFORMATION TECHNOLOGY 431,787,338.02 17.36 INFORMATION TECHNOLOGY 340,709,664.00 16.12MATERIALS 87,109,233.40 3.50 MATERIALS 63,707,209.00 3.02RIGHTS/WARRANTS 0.00 0.00 RIGHTS/WARRANTS 0.00 0.00TELECOMMUNICATIONS SERVICES 83,918,849.03 3.37 TELECOMMUNICATIONS SERVICES 69,413,092.00 3.29UNCLASSIFIED 0.00 0.00 UNCLASSIFIED 0.00 0.00UTILITIES 62,881,664.87 2.53 UTILITIES 64,814,283.00 3.07ALL NON U.S. 0.00 0.00 ALL NON U.S. 0.00 0.00BONDS 0.00 0.00 BONDS 649,619.10 0.03
Total Equities 2,469,897,661.96 99.28 Total Equities 2,107,730,183.93 99.75
Cash Equivalents 11,798,847.20 0.47 Cash Equivalents 3,251,023.95 0.15Payable for Investments Purchased (21,788,672.96) (0.88) Payable for Investments Purchased (3,952,626.82) (0.19)Receivables for Investments Sold 25,677,026.05 1.03 Receivables for Investments Sold 3,947,114.94 0.19Dividend Receivable 2,173,518.17 0.09 Dividend Receivable 1,926,396.00 0.09Short Term Interest Receivable 16,596.36 0.00 Short Term Interest Receivable 7,521.80 0.00Long Term Interest Receivable 0.00 0.00 Long Term Interest Receivable 4,410.71 0.00Margin Receivable 69,000.00 0.00 Tax Receivable 0.00 0.00Tax Receivable 38.15 0.00 Margin Receivable 14,700.00 0.00Payable for Interest Compensation 0.00 0.00 Payable for Interest Compensation (9.71) 0.00
Grand Total $2,487,844,014.93 100.00 % Grand Total $2,112,928,714.80 100.00 %
FRANKLIN PORTFOLIO ASSOCIATES BARCLAYS GLOBAL INVESTORS(Semi - Passive) (Passive)Equities Market Value % Equities Market Value %COMMINGLED FUND 0.00 0.00 COMMINGLED FUND 46,044,036.20 0.71CONSUMER DISCRETIONARY 268,591,816.68 14.98 CONSUMER DISCRETIONARY 868,134,088.28 13.43CONSUMER STAPLES 125,380,368.88 6.99 CONSUMER STAPLES 498,913,779.61 7.72 ENERGY 124,573,198.87 6.95 ENERGY 384,440,909.47 5.95FINANCIALS 378,906,686.27 21.14 FINANCIALS 1,358,784,210.57 21.02HEALTH CARE 256,562,121.74 14.31 HEALTH CARE 891,097,343.65 13.79INDUSTRIALS 207,105,786.00 11.55 INDUSTRIALS 751,143,813.26 11.62INFORMATION TECHNOLOGY 285,983,352.00 15.95 INFORMATION TECHNOLOGY 1,040,258,689.30 16.09MATERIALS 37,698,922.00 2.10 MATERIALS 209,972,194.88 3.25RIGHTS/WARRANTS 0.00 0.00 RIGHTS/WARRANTS 0.02 0.00TELECOMMUNICATIONS SERVICES 63,420,206.72 3.54 TELECOMMUNICATIONS SERVICES 203,547,854.57 3.15UNCLASSIFIED 0.00 0.00 UNCLASSIFIED 467,679.37 0.01UTILITIES 38,510,527.00 2.15 UTILITIES 199,718,567.87 3.09ALL NON U.S. 0.00 0.00 ALL NON U.S. 0.00 0.00BONDS 0.00 0.00 BONDS 0.00 0.00
Total Equities 1,786,732,986.16 99.67 Total Equities 6,452,523,167.05 99.82
Cash Equivalents 3,139,750.91 0.18 Cash Equivalents 3,448,139.19 0.05Payable for Investments Purchased 0.00 0.00 Payable for Investments Purchased (5,836.89) 0.00Receivables for Investments Sold 0.00 0.00 Receivables for Investments Sold 662,640.00 0.01Dividend Receivable 2,696,171.60 0.15 Dividend Receivable 7,306,745.41 0.11Short Term Interest Receivable 5,161.06 0.00 Long Term Interest Receivable 24.66 0.00Tax Refundable 0.00 0.00 Short Term Interest Receivable 6,051.05 0.00
Tax Refundable 329.49 0.00Grand Total $1,792,574,069.73 100.00 % Payable for Interest Compensation (9.63) 0.00
Grand Total $6,463,941,250.33 100.00 %
159
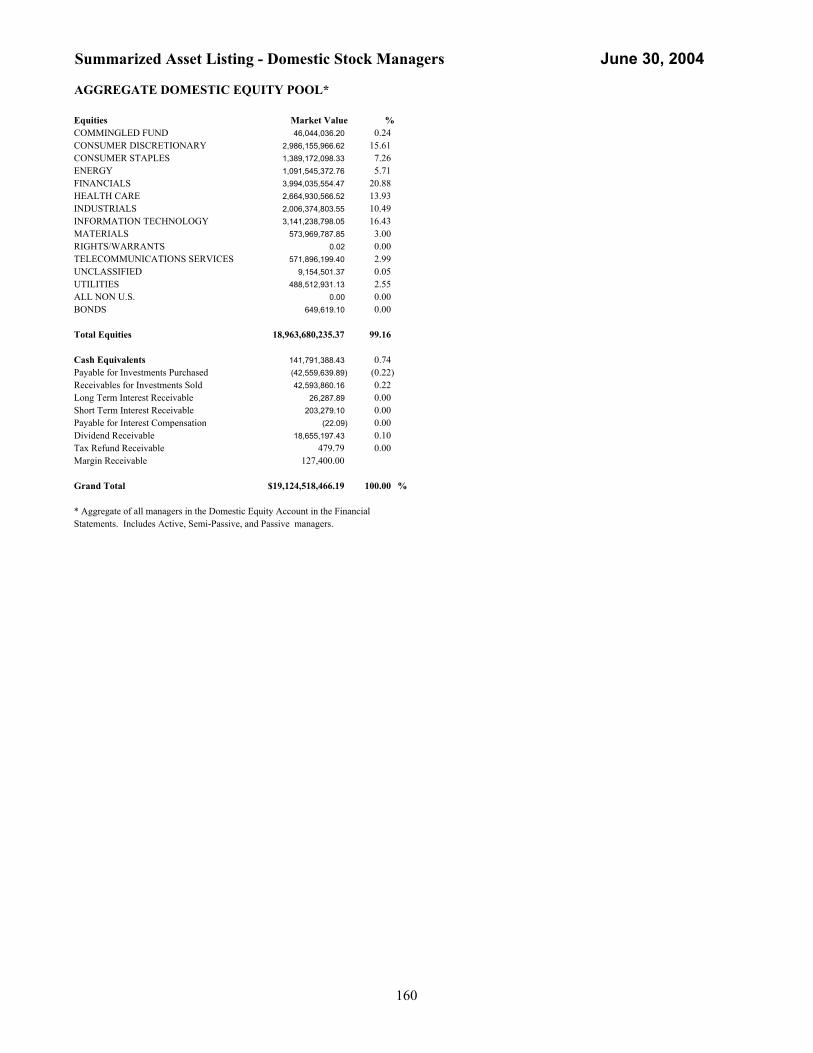
Summarized Asset Listing - Domestic Stock Managers June 30, 2004
AGGREGATE DOMESTIC EQUITY POOL*
Equities Market Value %COMMINGLED FUND 46,044,036.20 0.24CONSUMER DISCRETIONARY 2,986,155,966.62 15.61CONSUMER STAPLES 1,389,172,098.33 7.26ENERGY 1,091,545,372.76 5.71FINANCIALS 3,994,035,554.47 20.88HEALTH CARE 2,664,930,566.52 13.93INDUSTRIALS 2,006,374,803.55 10.49INFORMATION TECHNOLOGY 3,141,238,798.05 16.43MATERIALS 573,969,787.85 3.00RIGHTS/WARRANTS 0.02 0.00TELECOMMUNICATIONS SERVICES 571,896,199.40 2.99UNCLASSIFIED 9,154,501.37 0.05UTILITIES 488,512,931.13 2.55ALL NON U.S. 0.00 0.00BONDS 649,619.10 0.00
Total Equities 18,963,680,235.37 99.16
Cash Equivalents 141,791,388.43 0.74Payable for Investments Purchased (42,559,639.89) (0.22)Receivables for Investments Sold 42,593,860.16 0.22Long Term Interest Receivable 26,287.89 0.00Short Term Interest Receivable 203,279.10 0.00Payable for Interest Compensation (22.09) 0.00Dividend Receivable 18,655,197.43 0.10Tax Refund Receivable 479.79 0.00Margin Receivable 127,400.00
Grand Total $19,124,518,466.19 100.00 %
* Aggregate of all managers in the Domestic Equity Account in the Financial Statements. Includes Active, Semi-Passive, and Passive managers.
160

Summarized Asset Listing - International Stock Managers June 30, 2004
AMERICAN EXPRESS ASSET MGMT INVESCO GLOBAL ASSET MGMT.
Exposure by Country Market Value % Exposure by Country Market Value %AUSTRALIA 15,989,164.43 3.10 AUSTRALIA 8,809,337.78 1.77CANADA 18,281,790.11 3.54 CANADA 7,065,925.04 1.42DENMARK 2,266,879.67 0.44 DENMARK 11,704,628.23 2.35EURO 148,662,626.52 28.82 EURO 118,876,975.97 23.90HONG KONG 17,354,176.83 3.36 HONG KONG 4,682,706.61 0.94JAPAN 114,963,555.84 22.29 JAPAN 114,326,036.24 22.98NORWAY 5,903,543.18 1.14 NORWAY 5,652,109.93 1.14UNITED KINGDOM 133,706,729.33 25.92 UNITED KINGDOM 97,067,029.68 19.51SINGAPORE 7,241,828.14 1.40 SWEDEN 13,787,364.74 2.77SWEDEN 5,890,042.71 1.14 SWITZERLAND 57,475,386.79 11.55SWITZERLAND 39,974,731.03 7.75 UNITED STATES 57,385,936.43 11.54UNITED STATES 3,328,557.04 0.65
Dividend Receivable 1,003,771.64 0.20Dividend Receivable 625,057.86 0.12 Long Term Interest Receivable 0.00 0.00Payable for Investments Purchased (228,643.12) (0.04) Payable for Investment Purchased (997,549.38) (0.20)Receivables for Investments Sold 1,722,607.71 0.33 Receivable for Investment Sold 318,792.02 0.06Short Term Interest Receivable 654.76 0.00 Short Term Interest Receivable 13,173.67 0.00Tax Refundable 166,226.16 0.03 TAX Refundable 308,466.03 0.06Unrealized on fx payables 0.00 0.00 Unrealized on fx receivables (466.22) (0.00)Unrealized on fx receivables 0.00 0.00 Unrealized on Income receivables 3,389.36 0.00Unrealized on Income receivables 1,723.18 0.00 Unrealized on Investment payables (2,338.00) (0.00)Unrealized on Investment payables (1,641.82) (0.00)Unrealized on Investment receivables (7,564.95) (0.00) Grand Total $497,480,676.56 100.00 %
Grand Total $515,842,044.61 100.00 %
BRITANNIC ASSET MANAGEMENTMARATHON ASSET MGMT.
Exposure by Country Market Value %AUSTRALIA 3,582,881.45 1.06 Exposure by Country Market Value %CANADA 15,242,495.20 4.51 AUSTRALIA 19,917,156.62 3.48DENMARK 2,226,710.41 0.66 CANADA 24,535,088.48 4.29EURO 103,386,203.50 30.62 DENMARK 7,119,871.26 1.24HONG KONG 3,388,950.37 1.00 EURO 126,574,021.50 22.12JAPAN 75,474,668.29 22.35 HONG KONG 34,894,920.02 6.10UNITED KINGDOM 80,931,561.71 23.97 JAPAN 140,511,032.70 24.56SINGAPORE 4,469,436.88 1.32 NEW ZEALAND 2,762,430.39 0.48SWEDEN 8,466,934.50 2.51 NORWAY 3,912,192.89 0.68SWITZERLAND 33,478,674.98 9.92 UNITED KINGDOM 131,931,212.59 23.06UNITED STATES 4,895,803.23 1.45 SINGAPORE 9,851,402.94 1.72
SWEDEN 17,625,283.06 3.08Dividend Receivable 482,752.91 0.14 SWITZERLAND 19,084,933.74 3.34Payable for Investments Purchased (3,380,130.16) (1.00) UNITED STATES 33,154,230.19 5.79Receivables for Investments Sold 4,847,241.56 1.44 Short Term Interest Receivable 7,667.71 0.00TAX Refundable 184,149.74 0.05 Dividend Receivable 1,051,766.12 0.18Unrealized on fx payables (6,707.52) (0.00) Payable for Interest Compensation (13.35) (0.00)Unrealized on fx receivables 5,260.00 0.00 Payable for Investments Purchased (1,186,650.80) (0.21)Unrealized on Income receivables 2,668.04 0.00 Receivables for Investments Sold 318,135.58 0.06Unrealized on Investment payables (13,216.80) (0.00) Short Term Interest Receivable 14,235.25 0.00Unrealized on Investment receivables (19,593.32) (0.01) Tax Refundable 95,999.42 0.02
Unrealized on fx payables 952.66 0.00Grand Total $337,654,412.68 100.00 % Unrealized on fx receivables (806.49) (0.00)
Unrealized on Income receivables 472.61 0.00 Unrealized on Investment payables (2,146.28) (0.00)
Unrealized on Investment receivables (3,106.96) (0.00)
Grand Total $572,162,614.14 100.00 %
161

Summarized Asset Listing - International Stock Managers June 30, 2004
T. ROWE PRICE INTERNATIONAL, INC. STATE STREET GLOBAL ADVISORS (Passive)
Exposure by Country Market Value %AUSTRALIA 6,792,694.16 1.27 Exposure by CountryCANADA 13,804,580.27 2.58 Market Value %DENMARK 4,075,551.79 0.76 AUSTRALIA 104,364,351.96 4.57EURO 182,610,747.27 34.18 CANADA 133,637,155.60 5.85HONG KONG 8,981,845.69 1.68 DENMARK 16,788,005.28 0.73JAPAN 131,356,584.71 24.59 EURO 708,660,614.29 31.00UNITED KINGDOM 128,222,101.59 24.00 HONG KONG 33,815,179.84 1.48SINGAPORE 3,780,893.49 0.71 ISRAEL 1.44 0.00SWEDEN 10,613,153.02 1.99 JAPAN 512,564,346.49 22.42SWITZERLAND 38,010,853.57 7.11 MALAYSIA 10,469.93 0.00UNITED STATES 5,784,325.01 1.08 NEW ZEALAND 4,920,035.36 0.22
NORWAY 11,090,877.86 0.49Dividend Receivable 457,851.24 0.09 UNITED KINGDOM 535,412,962.23 23.42Payable for Investments Purchased (589,661.30) (0.11) SINGAPORE 16,972,197.24 0.74Receivables for Investments Sold 0.00 0.00 SWEDEN 51,013,764.98 2.23Short Term Interest Receivable 4,378.48 0.00 SWITZERLAND 151,650,279.59 6.63TAX Refundable 355,397.00 0.07 THAILAND 4.38 0.00Unrealized on fx payables 0.00 0.00 UNITED STATES 254,648.92 0.01Unrealized on fx receivables (3,179.57) (0.00) Unrealized on Income receivables 22,352.95 0.00 Dividend Receivable 4,169,472.70 0.18Unrealized on Investment receivables 6,809.09 0.00 Long Term Interest Receivable 677.16 0.00
Margin Variation Receivable 24,092.52 0.00Grand Total $534,287,278.46 100.00 % Other Payable (13,776.10) (0.00)
Payable for Interest Compensation (14.59) (0.00)Payable for Investments Purchased (206,217.20) (0.01)Receivables for Investments Sold 31,242.27 0.00
UBS GLOBAL ASSET MANAGEMENT Short Term Interest Receivable 353.88 0.00TAX Refundable 947,027.69 0.04
Exposure by Country Market Value % Unrealized on Income receivables 44,083.89 0.00AUSTRALIA 11,763,873.40 2.31 Unrealized on Investment payables (5,495.47) (0.00)CANADA 10,488,856.18 2.06 Unrealized on Investment receivables 5,020.59 0.00DENMARK 16.20 0.00EURO 177,340,366.22 34.79 Grand Total $2,286,151,362.73 100.00 %HONG KONG 542.94 0.00JAPAN 120,238,670.87 23.59 ALLIANCE CAPITAL MANAGEMENT L.P.NEW ZEALAND 2,389.89 0.00 (Emerging Markets)NORWAY 113.56 0.00UNITED KINGDOM 142,228,394.35 27.90 Exposure by Country Market Value %SINGAPORE 5,217.85 0.00 BRAZIL 2,600,874.07 1.42SWEDEN 813.71 0.00 CHILE 72,958.74 0.04SWITZERLAND 40,450,474.91 7.94 CZECH REPUBLIC 1,425,907.72 0.78UNITED STATES 5,857,616.01 1.15 EGPYT 382,343.70 0.21
HONG KONG 12,511,982.15 6.81Dividend Receivable 1,468,354.38 0.29 HUNGARY 3,332,917.95 1.81Payable for Investments Purchased 0.00 0.00 INDIA 12,377,204.53 6.74Receivables for Investments Sold 0.00 0.00 INDONESIA 2,792,555.00 1.52Short Term Interest Receivable 7,162.46 0.00 ISRAEL 1,318,534.99 0.72TAX Refundable 184,642.89 0.04 MALAYSIA 4,134,656.26 2.25Unrealized on fx payables (347,064.29) (0.07) MEXICO 2,873,810.13 1.56Unrealized on fx receivables 31,803.44 0.01 TAIWAN 22,883,170.07 12.45Unrealized on Income receivables 12,514.79 0.00 SOUTH AFRICA 27,070,836.86 14.73Unrealized on Investment payables 0.00 0.00 SOUTH KOREA 33,424,597.37 18.19Unrealized on Investment receivables 0.00 0.00 THAILAND 7,211,028.55 3.92
TURKEY 3,758,293.24 2.05Grand Total $509,734,759.76 100.00 % UNITED STATES 45,165,155.93 24.58
Dividend Receivable 485,655.77 0.26Payable for Investments Purchased (1,643,205.30) (0.89)Receivables for Investments Sold 1,603,320.54 0.87Short Term Interest Receivable 682.24 0.00Tax Refundable 3,241.73 0.00Unrealized on fx receivables (401.00) (0.00)Unrealized on Income receivables 745.19 0.00Unrealized on Investment payables (21,884.30) (0.01)Unrealized on Investment receivables 295.22 0.00
Grand Total $183,765,277.35 100.00 %
162
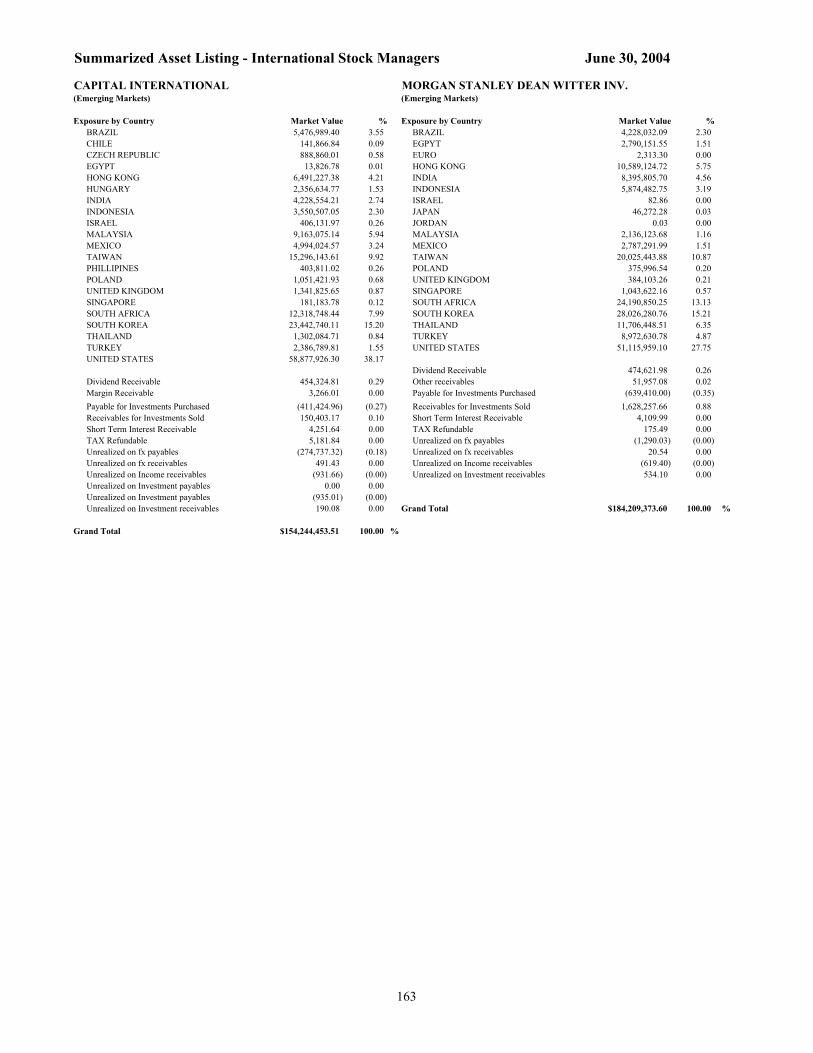
Summarized Asset Listing - International Stock Managers June 30, 2004
CAPITAL INTERNATIONAL MORGAN STANLEY DEAN WITTER INV.(Emerging Markets) (Emerging Markets)
Exposure by Country Market Value % Exposure by Country Market Value %BRAZIL 5,476,989.40 3.55 BRAZIL 4,228,032.09 2.30CHILE 141,866.84 0.09 EGPYT 2,790,151.55 1.51CZECH REPUBLIC 888,860.01 0.58 EURO 2,313.30 0.00EGYPT 13,826.78 0.01 HONG KONG 10,589,124.72 5.75HONG KONG 6,491,227.38 4.21 INDIA 8,395,805.70 4.56HUNGARY 2,356,634.77 1.53 INDONESIA 5,874,482.75 3.19INDIA 4,228,554.21 2.74 ISRAEL 82.86 0.00INDONESIA 3,550,507.05 2.30 JAPAN 46,272.28 0.03ISRAEL 406,131.97 0.26 JORDAN 0.03 0.00MALAYSIA 9,163,075.14 5.94 MALAYSIA 2,136,123.68 1.16MEXICO 4,994,024.57 3.24 MEXICO 2,787,291.99 1.51TAIWAN 15,296,143.61 9.92 TAIWAN 20,025,443.88 10.87PHILLIPINES 403,811.02 0.26 POLAND 375,996.54 0.20POLAND 1,051,421.93 0.68 UNITED KINGDOM 384,103.26 0.21UNITED KINGDOM 1,341,825.65 0.87 SINGAPORE 1,043,622.16 0.57SINGAPORE 181,183.78 0.12 SOUTH AFRICA 24,190,850.25 13.13SOUTH AFRICA 12,318,748.44 7.99 SOUTH KOREA 28,026,280.76 15.21SOUTH KOREA 23,442,740.11 15.20 THAILAND 11,706,448.51 6.35THAILAND 1,302,084.71 0.84 TURKEY 8,972,630.78 4.87TURKEY 2,386,789.81 1.55 UNITED STATES 51,115,959.10 27.75UNITED STATES 58,877,926.30 38.17
Dividend Receivable 474,621.98 0.26Dividend Receivable 454,324.81 0.29 Other receivables 51,957.08 0.02Margin Receivable 3,266.01 0.00 Payable for Investments Purchased (639,410.00) (0.35)Payable for Investments Purchased (411,424.96) (0.27) Receivables for Investments Sold 1,628,257.66 0.88Receivables for Investments Sold 150,403.17 0.10 Short Term Interest Receivable 4,109.99 0.00Short Term Interest Receivable 4,251.64 0.00 TAX Refundable 175.49 0.00TAX Refundable 5,181.84 0.00 Unrealized on fx payables (1,290.03) (0.00)Unrealized on fx payables (274,737.32) (0.18) Unrealized on fx receivables 20.54 0.00Unrealized on fx receivables 491.43 0.00 Unrealized on Income receivables (619.40) (0.00)Unrealized on Income receivables (931.66) (0.00) Unrealized on Investment receivables 534.10 0.00Unrealized on Investment payables 0.00 0.00Unrealized on Investment payables (935.01) (0.00)Unrealized on Investment receivables 190.08 0.00 Grand Total $184,209,373.60 100.00 %
Grand Total $154,244,453.51 100.00 %
163
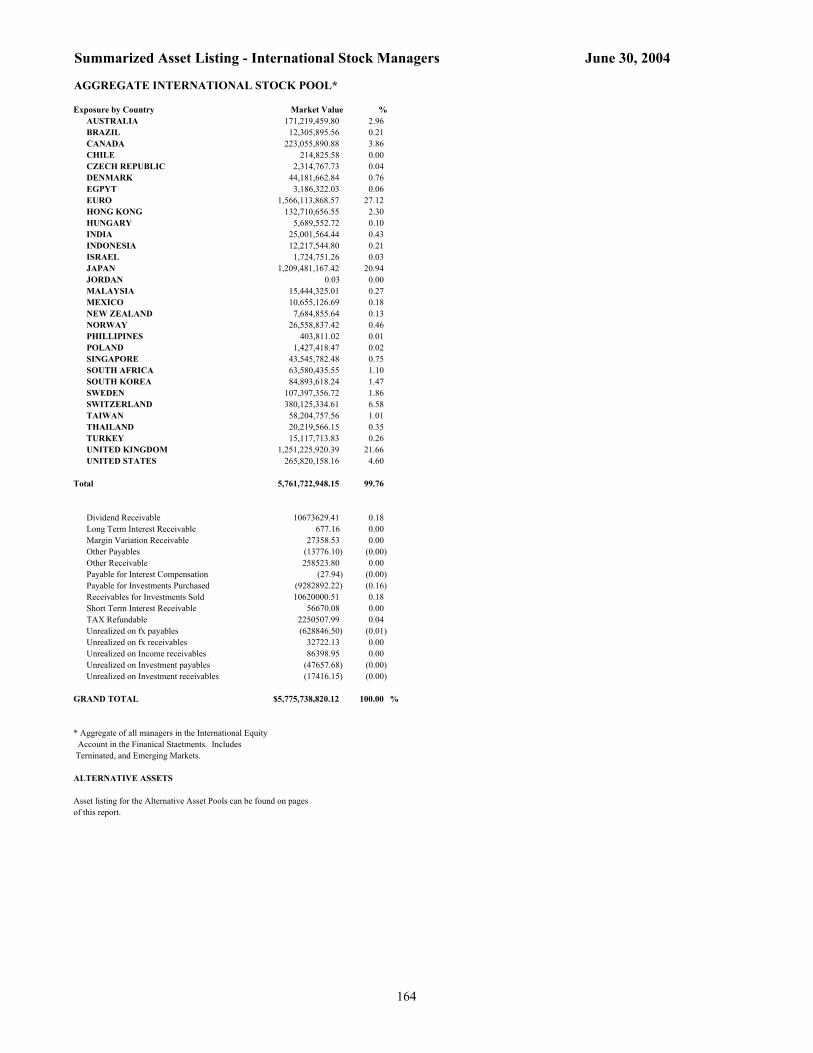
Summarized Asset Listing - International Stock Managers June 30, 2004
AGGREGATE INTERNATIONAL STOCK POOL*
Exposure by Country Market Value %AUSTRALIA 171,219,459.80 2.96BRAZIL 12,305,895.56 0.21CANADA 223,055,890.88 3.86CHILE 214,825.58 0.00CZECH REPUBLIC 2,314,767.73 0.04DENMARK 44,181,662.84 0.76EGPYT 3,186,322.03 0.06EURO 1,566,113,868.57 27.12HONG KONG 132,710,656.55 2.30HUNGARY 5,689,552.72 0.10INDIA 25,001,564.44 0.43INDONESIA 12,217,544.80 0.21ISRAEL 1,724,751.26 0.03JAPAN 1,209,481,167.42 20.94JORDAN 0.03 0.00MALAYSIA 15,444,325.01 0.27MEXICO 10,655,126.69 0.18NEW ZEALAND 7,684,855.64 0.13NORWAY 26,558,837.42 0.46PHILLIPINES 403,811.02 0.01POLAND 1,427,418.47 0.02SINGAPORE 43,545,782.48 0.75SOUTH AFRICA 63,580,435.55 1.10SOUTH KOREA 84,893,618.24 1.47SWEDEN 107,397,356.72 1.86SWITZERLAND 380,125,334.61 6.58TAIWAN 58,204,757.56 1.01THAILAND 20,219,566.15 0.35TURKEY 15,117,713.83 0.26UNITED KINGDOM 1,251,225,920.39 21.66UNITED STATES 265,820,158.16 4.60
Total 5,761,722,948.15 99.76
Dividend Receivable 10673629.41 0.18Long Term Interest Receivable 677.16 0.00Margin Variation Receivable 27358.53 0.00Other Payables (13776.10) (0.00)Other Receivable 258523.80 0.00Payable for Interest Compensation (27.94) (0.00)Payable for Investments Purchased (9282892.22) (0.16)Receivables for Investments Sold 10620000.51 0.18 Short Term Interest Receivable 56670.08 0.00 TAX Refundable 2250507.99 0.04Unrealized on fx payables (628846.50) (0.01)Unrealized on fx receivables 32722.13 0.00Unrealized on Income receivables 86398.95 0.00Unrealized on Investment payables (47657.68) (0.00)Unrealized on Investment receivables (17416.15) (0.00)
GRAND TOTAL $5,775,738,820.12 100.00 %
* Aggregate of all managers in the International Equity Account in the Finanical Staetments. Includes Terninated, and Emerging Markets.
ALTERNATIVE ASSETS
Asset listing for the Alternative Asset Pools can be found on pages of this report.
164

Summarized Asset Listing - Bond Managers
AMERICAN EXPRESS ASSET MANAGEMENT GROUP DODGE & COX INC.
Fixed Income Market Value % Fixed Income Market Value %U.S. AGENCY $62,855,625.90 8.02 U.S. AGENCY $16,333,974.08 2.05U.S. CORPORATE 177,501,646.72 22.65 U.S. CORPORATE 274,320,908.58 34.39U.S. MTG. REL. 284,654,945.45 36.33 U.S. MTG. REL. 358,188,909.05 44.90U.S. MUNICIPALS 0.00 0.00 U.S. MUNICIPALS 0.00 0.00U.S. PREFERRED STOCK 0.00 0.00 U.S. PREFERRED STOCK 0.00 0.00U.S. TREASURY 162,457,524.26 20.73 U.S. TREASURY 130,666,857.00 16.38PRIVATE PLACEMENTS 0.00 0.00 PRIVATE PLACEMENTS 0.00 0.00YANKEE 9,977,197.20 1.27 YANKEE 0.00 0.00FOREIGN RELATED 13,537,155.64 1.73 FOREIGN RELATED 0.00 0.00MISCELLANEOUS 0.00 0.00 MISCELLANEOUS 0.00 0.00
Total Fixed Income 710,984,095.17 90.74 Total Fixed Income 779,510,648.71 97.72
Cash Equivalent Cash EquivalentU.S. 70759953.07 9.03 U.S. 56,256,256.46 7.05Non U.S. 0.00 0.00 Non U.S. 0.00 0.00Payable for Investments Purchased (13883657.41) (1.77) Payable for Investments Purchased (46,435,920.96) (5.82)Receivables for Investments Sold 9051578.80 1.16 Receivables for Investments Sold 0.00 0.00Long Term Interest Receivable 6599151.70 0.84 Long Term Interest Receivable 8,337,941.41 1.05Short Term Interest Receivable 71180.34 0.01 Short Term Interest Receivable 29,657.44 0.00Payable for Interest Compensation (157.28) (0.00) Payable for Interest Compensation (69.24) (0.00)Unrealized on FX Receivables 0.00 0.00Unrealized on FX Payables 0.00 0.00 Grand Total $797,698,513.82 100.00 %
Grand Total $783,582,144.39 100.00 % MORGAN STANLEY INVESTMENT MANAGEMENT
DEUTSCHE ASSET MANAGEMENT Fixed Income Market Value %U.S. AGENCY $8,666,727.20 1.14
Fixed Income Market Value % U.S. CORPORATE 157,658,163.78 20.71U.S. AGENCY $3,890,378.79 0.61 U.S. MTG. REL. 371,355,679.24 48.78U.S. CORPORATE 161,723,561.32 25.46 U.S. MUNICIPALS 0.00 0.00U.S. MTG. REL. 325,514,745.04 51.25 U.S. PREFERRED STOCK 7,272,332.30 0.96U.S. MUNICIPALS 40,891,444.91 6.44 U.S. TREASURY 121,580,103.85 15.97U.S. PREFERRED STOCK 5,094,749.18 0.80 PRIVATE PLACEMENTS 0.00 0.00U.S. TREASURY 68,269,275.26 10.75 YANKEE 7,730,075.18 1.02PRIVATE PLACEMENTS 0.00 0.00 FOREIGN RELATED 0.00 0.00YANKEE 10,406,920.58 1.64 MISCELLANEOUS 15,190,206.62 2.00FOREIGN RELATED 0.00 0.00MISCELLANEOUS 0.00 0.00 Total Fixed Income 689,453,288.17 90.56
Total Fixed Income 615,791,075.08 96.96 Cash EquivalentU.S. 207,089,337.62 27.20
Cash Equivalent Non U.S. 0.00 0.00U.S. 29,828,685.32 4.70 Payable for Investments Purchased (187,281,655.33) (24.60)Non. U.S. 0.00 0.00 Receivables for Investments Sold 45,810,699.22 6.02Payable for Investments Purchased (24,702,293.86) (3.89) Long Term Interest Receivable 6,317,117.13 0.83Receivables for Investments Sold 8,538,115.05 1.34 Short Term Interest Receivable 171,146.31 0.02Long Term Interest Receivable 5,625,485.87 0.89 Payable for Interest Compensation (393.14) (0.00)Short Term Interest Receivable 36,941.10 0.01 Other Payables (197,031.25) (0.03)Payable for Interest Compensation 0.00 0.00Other Payables 0.00 0.00 Grand Total $761,362,508.73 100.00 %
June 30, 2004
165

Summarized Asset Listing - Bond Managers June 30, 2004
GOLDMAN SACHS ASSET MANAGEMENTWESTERN ASSET MANAGEMENT (Semi-Passive)
Fixed Income Market Value % Fixed Income Market Value %U.S. AGENCY $30,044,223.15 2.35 U.S. AGENCY $200,706,071.73 14.01U.S. CORPORATE 340,694,691.13 26.65 U.S. CORPORATE 243,799,266.86 17.02U.S. MTG. REL. 584,459,393.76 45.72 U.S. MTG. REL. 688,187,205.02 48.05U.S. MUNICIPALS 0.00 0.00 U.S. MUNICIPALS 0.00 0.00U.S. PREFERRED STOCK 23,019,451.01 1.80 U.S. PREFERRED STOCK 4,532,695.00 0.32U.S. TREASURY 297,703,160.39 23.29 U.S. TREASURY 260,459,507.60 18.18PRIVATE PLACEMENTS 921,200.00 0.07 PRIVATE PLACEMENTS 1,625,716.80 0.11YANKEE 39,594,439.84 3.10 YANKEE 8,578,894.00 0.60FOREIGN RELATED 77,413,138.36 6.06 FOREIGN RELATED 0.00 0.00MISCELLANEOUS 2,213,430.25 0.17 MISCELLANEOUS 0.00 0.00
Total Fixed Income 1,396,063,127.89 109.22 Total Fixed Income 1,407,889,357.01 98.29
Cash Equivalent Cash EquivalentU.S. 256,325,839.79 20.05 U.S. 266,618,086.99 18.61Non U.S. 0.00 0.00 Non. U.S. 0.00 0.00Payable for Investments Purchased (407,588,644.11) (31.89) Payable for Investments Purchased (591,778,768.97) (41.32)Receivables for Investments Sold 24,235,168.48 1.90 Receivables for Investments Sold 339,255,971.56 23.69Long Term Interest Receivable 11,302,459.40 0.88 Long Term Interest Receivable 10,042,012.11 0.70Short Term Interest Receivable 344,912.00 0.03 Short Term Interest Receivable 313,319.62 0.02Margin Variation Receivable 800,728.74 0.06 Payable for Interest Compensation (1,563.94) (0.00)Payable for Interest Compensation (2,056.26) (0.00)Other Payables (1,448,559.67) (0.11) Grand Total $1,432,338,414.38 100.00 %Unrealized on Foreign Currency 0.00 0.00Unrealized on fx Receivables 401,951.56 0.03Unrealized on fx Payables (2,216,699.54) (0.17)
Grand Total $1,278,218,228.28 100.00 %
LINCOLN CAPITAL MANAGEMENTBLACKROCK INC (Semi-Passive)(Semi-Passive)
Fixed Income Market Value %Fixed Income Market Value % U.S. AGENCY $150,881,282.86 10.45 U.S. AGENCY $122,990,623.50 8.51 U.S. CORPORATE 320,761,154.26 22.23U.S. CORPORATE 252,712,466.78 17.49 U.S. MTG. REL. 808,851,904.56 56.04U.S. MTG. REL. 583,388,389.10 40.37 U.S. MUNICIPALS 1,780,000.00 0.12U.S. MUNICIPALS 0.00 0.00 U.S. PREFERRED STOCK 0.00 0.00U.S. PREFERRED STOCK 0.00 0.00 U.S. TREASURY 348,402,467.99 24.14U.S. TREASURY 384,871,310.70 26.63 PRIVATE PLACEMENTS 0.00 0.00PRIVATE PLACEMENTS 0.00 0.00 YANKEE 13,197,943.76 0.91YANKEE 35,054,138.36 2.43 FOREIGN RELATED 0.00 0.00FOREIGN RELATED 0.00 0.00 MISCELLANEOUS 730,785.89 0.05MISCELLANEOUS (53,156.25) (0.00)
Total Fixed Income 1,644,605,539.32 113.95Total Fixed Income 1,378,963,772.19 95.43
Cash EquivalentCash Equivalent U.S. 36,557,976.45 2.53U.S. 239,029,745.43 16.54 Non U.S. 0.00 0.00Non U.S. 0.00 0.00 Payable for Investments Purchased (299,113,925.33) (20.73)Payable for Investments Purchased (411,433,523.86) (28.47) Receivables for Investments Sold 47,518,995.13 3.29Receivables for Investments Sold 226,385,729.88 15.66 Long Term Interest Receivable 13,623,396.22 0.94Long Term Interest Receivable 11,549,925.10 0.80 Short Term Interest Receivable 30,708.79 0.00Short Term Interest Receivable 394,303.80 0.03 Payable for Interest Compensation (416.87) (0.00)Margin Variation Receivable 291,906.25 0.02Tax Refund Receivable 4,024.22 0.00 Grand Total $1,443,222,273.71 100.00 %Payable for Interest Compensation (3,077.25) (0.00)Other Payables (150,183.34) (0.01)
Grand Total $1,445,032,622.42 100.00 %
166

Summarized Asset Listing - Bond Managers June 30, 2004
AGGREGATE BOND POOL* Fixed Income Market Value %U.S. AGENCY $596,368,907.21 6.92 U.S. CORPORATE $1,929,171,859.43 22.37U.S. MTG. REL. $4,004,601,171.22 46.44U.S. MUNICIPALS $42,671,444.91 0.49U.S. PREFERRED STOCK $39,919,227.49 0.46U.S. TREASURY $1,774,410,207.05 20.58PRIVATE PLACEMENTS $2,546,916.80 0.03YANKEE $124,539,608.92 1.44FOREIGN RELATED $90,950,294.00 1.05MISCELLANEOUS $18,081,266.51 0.21
Total Fixed Income 8,623,260,903.54 100.00
Cash EquivalentU.S. 1,162,465,881.13 0.13Non. U.S. 0.00 0.00Payable for Investments Purchased (1,982,218,389.83) (0.23)Receivables for Investments Sold 700,796,258.12 0.08Long Term Interest Receivable 73,397,488.94 0.01Short Term Interest Receivable 1,392,169.40 0.00Payable for Interest Compensation (7,733.98) (0.00)Other Payables (1,795,774.26) (0.00)Tax Refund Receivables 4,024.22 0.00Margin Variation Receivable 1,092,634.99 0.01Unrealized on fx Receivables 401,951.56 0.00Unrealized on fx Payables (2,216,699.54) (0.00)
Grand Total $8,576,572,714.29 100.00 %
* Aggregate of all managers in the Bond Account in the Financial Statements. Includes both Active and Semi-Passive managers.
167
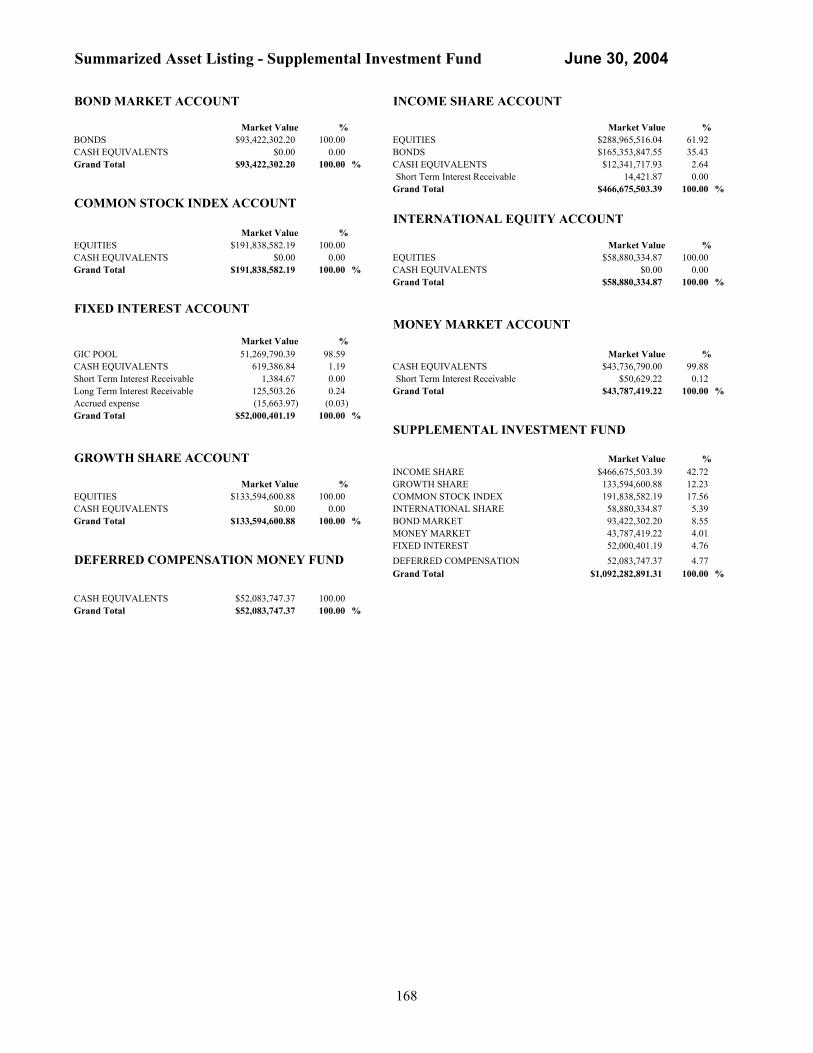
Summarized Asset Listing - Supplemental Investment Fund
BOND MARKET ACCOUNT INCOME SHARE ACCOUNT
Market Value % Market Value %BONDS $93,422,302.20 100.00 EQUITIES $288,965,516.04 61.92 CASH EQUIVALENTS $0.00 0.00 BONDS $165,353,847.55 35.43Grand Total $93,422,302.20 100.00 % CASH EQUIVALENTS $12,341,717.93 2.64
Short Term Interest Receivable 14,421.87 0.00Grand Total $466,675,503.39 100.00 %
COMMON STOCK INDEX ACCOUNT
INTERNATIONAL EQUITY ACCOUNT Market Value %EQUITIES $191,838,582.19 100.00 Market Value %CASH EQUIVALENTS $0.00 0.00 EQUITIES $58,880,334.87 100.00 Grand Total $191,838,582.19 100.00 % CASH EQUIVALENTS $0.00 0.00
Grand Total $58,880,334.87 100.00 %
FIXED INTEREST ACCOUNTMONEY MARKET ACCOUNT
Market Value %GIC POOL 51,269,790.39 98.59 Market Value %CASH EQUIVALENTS 619,386.84 1.19 CASH EQUIVALENTS $43,736,790.00 99.88 Short Term Interest Receivable 1,384.67 0.00 Short Term Interest Receivable $50,629.22 0.12Long Term Interest Receivable 125,503.26 0.24 Grand Total $43,787,419.22 100.00 %Accrued expense (15,663.97) (0.03)Grand Total $52,000,401.19 100.00 %
SUPPLEMENTAL INVESTMENT FUND
GROWTH SHARE ACCOUNT Market Value %INCOME SHARE $466,675,503.39 42.72
Market Value % GROWTH SHARE 133,594,600.88 12.23EQUITIES $133,594,600.88 100.00 COMMON STOCK INDEX 191,838,582.19 17.56CASH EQUIVALENTS $0.00 0.00 INTERNATIONAL SHARE 58,880,334.87 5.39Grand Total $133,594,600.88 100.00 % BOND MARKET 93,422,302.20 8.55
MONEY MARKET 43,787,419.22 4.01FIXED INTEREST 52,000,401.19 4.76
DEFERRED COMPENSATION MONEY FUND DEFERRED COMPENSATION 52,083,747.37 4.77 Grand Total $1,092,282,891.31 100.00 %
CASH EQUIVALENTS $52,083,747.37 100.00Grand Total $52,083,747.37 100.00 %
June 30, 2004
168

Summarized Asset Listing - Other Funds June 30, 2004
ASSIGNED RISK PLAN CLOSED LANDFILL INVESTMENT FUND Market Value %
Equities Market Value % EQUITIES 19,979,649.34 99.86 COMMINGLED FUND 95,976.14 0.15 BONDS 0.00 0.00CONSUMER DISCRETIONARY 8,142,796.27 13.00 CASH EQUIVALENTS 27,020.26 0.14CONSUMER STAPLES 4,520,216.17 7.21 Grand Total $20,006,669.60 100.00 %ENERGY 5,066,580.35 8.09FINANCIALS 13,669,075.94 21.82 EMERGENCY MEDICAL SERVICESHEALTH CARE 7,970,293.48 12.72 Market Value % INDUSTRIALS 10,013,395.21 15.98 EQUITIES 7,009,997.72 62.08 INFORMATION TECHNOLOGY 8,382,334.80 13.38 BONDS 3,873,752.14 34.31MATERIALS 1,933,602.63 3.09 CASH EQUIVALENTS 407,844.98 3.61RIGHTS/WARRANTS 0.00 0.00 Short Term Interest Receivable 365.30 0.00TELECOMMUNICATIONS SERVICES 1,764,634.82 2.82 Grand Total $11,291,960.14 100.00 %UNCLASSIFIED 0.00 0.00UTILITIES 1,096,103.84 1.75 ENVIRONMENTAL TRUST FUNDALL NON U.S. 0.00 0.00 Market Value %BONDS 0.00 0.00 EQUITIES 239,272,510.87 69.89 Total Equities $62,655,009.65 100.00 % BONDS 101,044,107.60 29.51
CASH EQUIVALENTS 2,037,311.33 0.60Fixed Income Market Value % Short Term Interest Receivable 1,261.75 0.00U.S. AGENCY 48,189,170.30 18.29 Grand Total $342,355,191.55 100.00 %U.S. CORPORATE 0.00 0.00U.S. MTG. REL. 88,393,591.73 33.55U.S. TREASURY 49,744,834.66 18.88 ETHEL CURREY FUNDMISCELLANEOUS 0.00 0.00 Market Value %Fixed Income Total 186,327,596.69 70.72 EQUITIES 354,088.82 55.68 Cash Equivalents 13,145,542.17 4.99 BONDS 280,272.97 44.07Payable for Investments Purchased -137,875.76 -0.05 CASH EQUIVALENTS 1,558.81 0.25Receivables for Investments Sold 180,035.46 0.07 Grand Total $635,920.60 100.00 %Dividend Receivable 51,685.81 0.02Short Term Interest Receivable 22,161.11 0.01Long Term Interest Receivable 1,210,848.39 0.46 IRON RANGE RESOURCESPayable for Interest Compensation 0.00 0.00 Market Value %
CASH 127,056.12 0.26Grand Total $263,455,003.52 100.00 % EQUITIES 23,859,350.59 49.11
BONDS 24,600,279.66 50.63Grand Total $48,586,686.37 100.00 %
INTERNAL FIXED ACCOUNTLIFETIME FISH & WILDLIFE TRUST
Fixed Income Market Value % Market Value % U.S. AGENCY 0.00 0.00 EQUITIES 1,834,675.57 70.82 U.S. CORPORATE 192,362,299.59 49.10 BONDS 750,615.46 28.97U.S. MTG. REL. 102,312,847.54 26.11 CASH EQUIVALENTS 5,373.44 0.21U.S. TREASURY 17,637,315.80 4.50 Grand Total $2,590,664.47 100.00 %MISCELLANEOUS 0.00 0.00Fixed Income Total 312,312,462.93 79.71 PERMANENT SCHOOL FUNDCash Equivalents 75,522,855.34 19.28 Market Value %Payable for Interest Compensation (128.32) (0.00) EQUITIES 311,351,966.44 53.87 Long Term Interest Receivable 3,885,964.86 0.99 BONDS 258,150,839.20 44.66Short Term Interest Receivable 81,483.42 0.02 CASH EQUIVALENTS 8,507,178.83 1.47
INTEREST RECEIVABLE 6,756.28 0.00Grand Total $391,802,638.23 100.00 % Grand Total $578,016,740.75 100.00 %
169
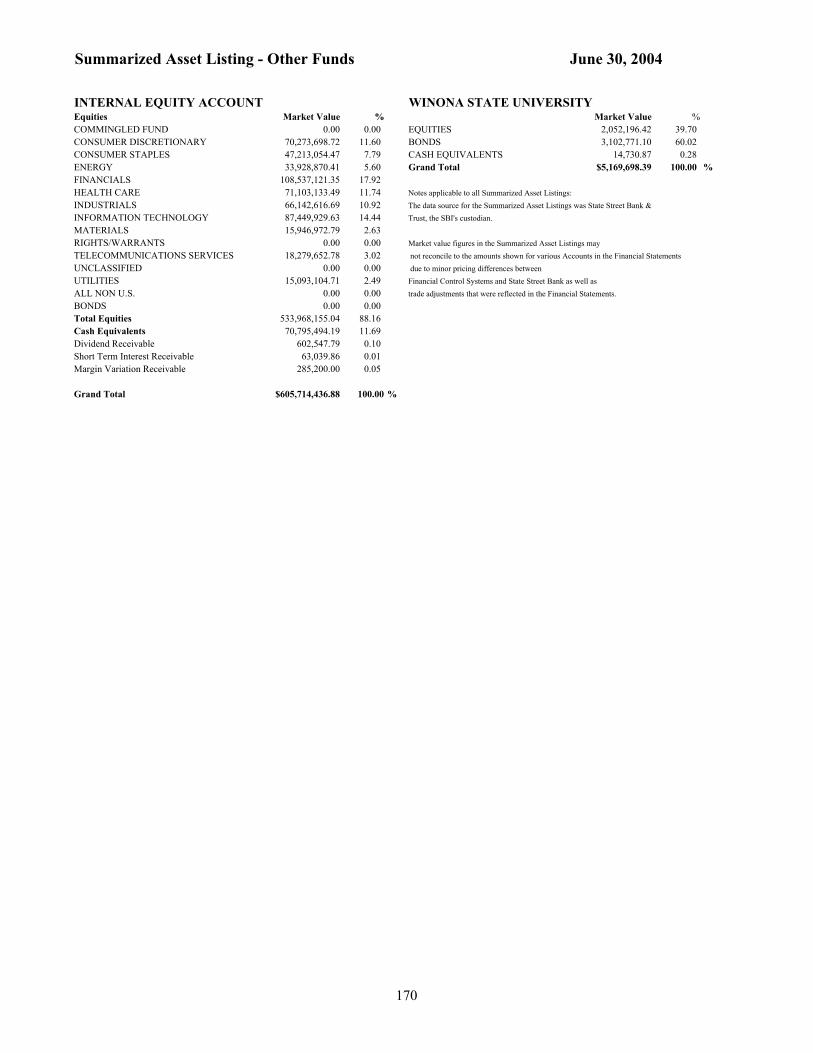
Summarized Asset Listing - Other Funds June 30, 2004
INTERNAL EQUITY ACCOUNT WINONA STATE UNIVERSITYEquities Market Value % Market Value %COMMINGLED FUND 0.00 0.00 EQUITIES 2,052,196.42 39.70 CONSUMER DISCRETIONARY 70,273,698.72 11.60 BONDS 3,102,771.10 60.02CONSUMER STAPLES 47,213,054.47 7.79 CASH EQUIVALENTS 14,730.87 0.28ENERGY 33,928,870.41 5.60 Grand Total $5,169,698.39 100.00 %FINANCIALS 108,537,121.35 17.92HEALTH CARE 71,103,133.49 11.74 Notes applicable to all Summarized Asset Listings:INDUSTRIALS 66,142,616.69 10.92 The data source for the Summarized Asset Listings was State Street Bank & INFORMATION TECHNOLOGY 87,449,929.63 14.44 Trust, the SBI's custodian.MATERIALS 15,946,972.79 2.63RIGHTS/WARRANTS 0.00 0.00 Market value figures in the Summarized Asset Listings mayTELECOMMUNICATIONS SERVICES 18,279,652.78 3.02 not reconcile to the amounts shown for various Accounts in the Financial StatementsUNCLASSIFIED 0.00 0.00 due to minor pricing differences between UTILITIES 15,093,104.71 2.49 Financial Control Systems and State Street Bank as well as ALL NON U.S. 0.00 0.00 trade adjustments that were reflected in the Financial Statements.BONDS 0.00 0.00Total Equities 533,968,155.04 88.16Cash Equivalents 70,795,494.19 11.69Dividend Receivable 602,547.79 0.10Short Term Interest Receivable 63,039.86 0.01Margin Variation Receivable 285,200.00 0.05
Grand Total $605,714,436.88 100.00 %
170

This report was produced using recycled paper with a minimum of 20% post-consumer waste and Agri Ink.
Minnesota State Board of Investment60 Empire Drive
Suite 355St. Paul, MN 55103-3555
(651) 296-3328