Oct.27, 2003 Curator Meeting, Oct. 2003 Gene Expression Curation ~WormBase, 2003 ~
SWED
RES
2003
The Swedish StrategicProgramme for the RationalUse of Antimicrobial Agents
STRAMA
A Report on Swedish Antibiotic Utilisation and Resistance in Human Medicine

2 S W E D R E S 2 0 0 3
SMI – The Swedish Institute for Infectious Disease Control (SMI) is a government expert authority with a mission to monitor the epidemiology of infectious disease among Swedish citizens and promote control and prevention of these diseases.
STRAMA – The Swedish Strategic Pro-gramme for the Rational use of Antimicro-bial Agents, was founded in 1995 and is supported by the Swedish Government since year 2000. A national steering com-mittee with members from all relevant authorities and organisations collaborates with regional expert groups in every county.
PUBLISHERS: The Swedish Strategic Programme for the Rational Use of Antimicrobial Agents (STRAMA), and the Swedish Institute for Infectious Disease Control
EDITORS:Otto Cars and Karl Ekdahl
ADDRESS:Swedish Institute for Infectious Disease ControlSE 171 82 Solna, SwedenPhone: +46 8 457 23 00Fax:+46 8 30 06 26E-mail: [email protected]
LAYOUT: Björn Lundquist AB, Malmö
PRINT:Elanders Berlings, Malmö
ISSN 1400-3473
SMI-tryck 144-2003
1. Preface ..........................................................................................3
2.1. Summary ....................................................................................4
2.2. Sammanfattning ........................................................................6
2.3. Contributors ...............................................................................7
3. Use of antimicrobials .....................................................................8
3.1. Use of antibiotics ........................................................................8
3.2. Use of antifungals ....................................................................14Out-patient care .................................................................................................14
Hospital care ......................................................................................................15
4. Antimicrobial resistance ..............................................................16Streptococcus pneumoniae ................................................................................16
Staphylococcus aureus ......................................................................................17
Enterococcus faecium and faecalis .....................................................................19
Streptococcus pyogenes ....................................................................................20
Haemophilus influenzae ......................................................................................21
Escherichia coli ...................................................................................................21
Klebsiella pneumoniae ........................................................................................22
Enterobacter species ..........................................................................................22
Helicobacter pylori ..............................................................................................22
Salmonella and Shigella spp. ..............................................................................22
Campylobacter spp ............................................................................................23
Pseudomonas aeruginosa ...................................................................................23
Neisseria gonorrhoeae ........................................................................................23
Neisseria meningitidis .........................................................................................24
Mycobacterium tuberculosis ...............................................................................24
5. National and regional projects .....................................................255.1. Survey of Activities at the County Level .......................................................25
5.2. Studies on antibiotic use in out-patient care ................................................25
1. A Study of Hygienic Routines and Infections in Child Day Care .................25
2. Self-Medication with Antibiotics in a Swedish General Population ............26
3. Weekly Antibiotic Prescribing and Influenza Activity in Sweden; A Study throughout Five Influenza Seasons ..................................................26
5.3. Studies on antibiotic use in hospital care .....................................................27
1. The STRAMA Point Prevalence Study 2003 on Hospital Antibiotic Use .....27
2. Swedish Antibiotic Nursing home Trial (SANT) ..........................................27
Appendix 1 – Abbreviations .............................................................28
Appendix 2 – Demographics and denominator data ........................29
Appendix 3 – Surveillance of antibiotic consumption ......................31
Appendix 4 – Antibiotic Susceptibility testing ..................................32
Appendix 5 – National surveillance of antibiotic resistance .............33Surveillance of pathogens regulated in the Communicable Disease Act .............33
Voluntary laboratory reporting ............................................................................33
Swedish combined surveillance and QC program (RSQC surveys) further developed into ResNet 2002. ..................................................................33
Development of ResNet ......................................................................................33
EARSS ................................................................................................................34
Sentinel surveillance ...........................................................................................34
Appendix 6 – Recent publications ...................................................35
The Swedish StrategicProgramme for the RationalUse of Antimicrobial Agents
STRAMA

S W E D R E S 2 0 0 3 3
WELCOME to the second Swedish report combining results from the monitoring of antimicrobial resistance and anti-microbial usage in both human and veterinary medicine: SWEDRES and SVARM. It is today generally accepted that all use of antimicrobials in different sectors contributes to the development of resistance. This joint report will facili-tate comparisons of resistance levels and incidence of use in the two areas. In Sweden human and veterinary medicine have collaborated and communicated over a number of years, not least within the Swedish Strategic Programme for The Rational Use of Antimicrobial Agents and Surveillance of Resistance (STRAMA). Based on this experience, we are con-vinced that collaboration and joint efforts between human and veterinary medicine are essential in order to counteract the threat that antimicrobial resistance poses to both human and animal health.
Data in this report indicate that the Swedish strategies in
human and veterinary medicine have been successful in con-taining resistance. The general concept is to use antimicrobials only when needed, on prescription by a professional only, and that the choice of treatment is based on relevant informa-tion. Notwithstanding, some of the presented results in both veterinary and human fields are causes for concern. Examples on unfavourable development of resistance indicate that the antimicrobial arsenal available is becoming more and more limited. Further efforts must be made to prevent infectious diseases both in human and in veterinary medicine by other means.
Our hope is that this report will serve as a basis for policy recommendations and intervention strategies, and that it will increase our understanding of the dynamics of resistance. The ultimate goal is to preserve the effectiveness of available anti-microbials for man and animals.
1. Preface

SINCE SEVERAL YEARS there hase been a close collaboration in Sweden between human and veterinary medicine regard-ing anitbiotic resistance. The ultimate goal is to preserve the possibility for effective treatment of bacterial infections in humans and animals.
This second joint report SWEDRES/SVARM (available on www.sva.se) shows that, in both fields, the situation in Sweden is more favourable than in many other parts of the world. However, in both human and veterinary medicine there are trends that cause concern.
Use of antibioticsIn 2003 the total antibiotic sale (out-patient and hospital care) was 16.3 DDD/1000 inhabitants per day (DDD/1000/day) and in out-patient care 14.7 DDD/1000/day (13.0 excl methenamine). There has been a small reduction in the use of antibiotics in Sweden the last years. The total antibiotic sale was reduced by 0.5 DDD/1000/day between 2000 and 2003. The most notable change was the decreasing use of antibiot-ics against respiratory tract infections. The use of penicillin V, which is the most commonly prescribed antibiotic substance in Sweden, has decreased from 4.6 DDD/1000/day in out-patient care 2000, to 4.1 DDD/1000/day 2003. The sales numbers for other respiratory tract antibiotics; macrolides, tetracyclines and cephalosporins, were decreasing as well. This is probably caused by a reduced tendency for patients in Sweden to seek medical care for common colds.
A favourable trend was seen concerning treatment against urinary tract infections where the use of fluoroquinolones continued to decrease among women and the use of nitro-furantoin, on the other hand, increased. The worrying increase in the use of fluoroquinolones among older men seemed to have halted, although the total consumption of fluoroquinolones was still high compared to the other Nordic countries.
In the last years there has been an increase in the use of beta-lactamase resistant penicillins. One reason for this increase could probably be the ongoing epidemic of impetigo contagiosa, caused by S. aureus resistant to fucidic acid. Data show a seasonal increase in the use of beta-lactamase resistant penicillins among children.
Lincosamides is another group with increasing use where further analysis is needed.
Use of antifungalsThe use of antifungals for systemic use against nail infections increased markedly during the first quarter of 2002 and has since then been continuously high. This was probably the result of a widespread marketing programme directed towards the general public, even though these drugs needs to be prescribed by a doctor. Whether the increased use of these
drugs has influenced resistance against antifungals needs to be investigated.
Within hospital care the use of the new substances, vori-conazole and caspofungin, continued to increase. The sales numbers of antifungals for systemic use (J02A) increased with 36% (0.015 DDD/1000/day) from 2000 to 2003.
Antibiotic resistanceFrom an international viewpoint Sweden has a comparatively low rate of infections caused by Streptococcus pneumoniae with reduced susceptibility to penicillin. Since 1996, infections and carriage due to S. pneumoniae with reduced susceptibil-ity to penicillin (MIC ≥ 0.5 mg/L, PRP) have been notifi-able by law. The number of PRP notifications in 2003 was stable compared to the previous year. A vast majority of the cases were detected by nasopharyngeal cultures. The high-est incidence was seen in pre-school children, with a distinct seasonality (most cases in late autumn to early spring). Since 1996, there has been a decreasing trend in incidence, but this has been paralleled by a decreasing trend in numbers of cul-tures. In voluntary reports from the laboratories, a significant increasing trend was noted for resistance to other antibiotics (erythromycin, tetracycline and trimethoprim-sulfonamide), with resistance levels now twice as high as in the mid 1990s.
Also for methicillin resistant Staphylococcus aureus (MRSA), the Swedish incidence figures are comparatively low. A large outbreak in Göteborg in western Sweden in the late 1990s was curbed, but an increasing incidence in the Stockholm county reflects an ongoing outbreak since 2000. However, MRSA is a national problem with patients reported from all counties. Previously mainly being an imported dis-ease, MRSA is now a domestic problem, with more than 75% of the cases infected in Sweden. Community-acquired MRSA is an increasing problem, and in almost half of the reported domestic cases in 2003 the infection was acquired outside hospitals and nursing homes. Almost all Swedish isolates since 2000 have been genetically typed with pulsed field gel electrophoresis (PFGE). The three most common types were identical or similar to the international clones UK E 15, DK E 97-1 and Berlin IV. In 2003, 0.8% of the invasive S. aureus isolates in the country have been MRSA.
Enterococcus faecium and faecalis with resistance to vanco-mycin (VRE) have also been notifiable since 2000. In 2003, the number of reported cases doubled to 45 from previous figures between 18 and 20 cases per year. The main part of this increase was due to hospital outbreaks in two counties, lead-ing to extensive contact tracing. 2.2% of 231 invasive isolates of E.faecium, and 0 of 593 invasive isolates of E. faecalis were resistant to vancomycin in 2003. The corresponding figures for ampicillin resistance in 2003 was 76% and 0%, respec-tively.
2.1. Summary
4 S W E D R E S 2 0 0 3
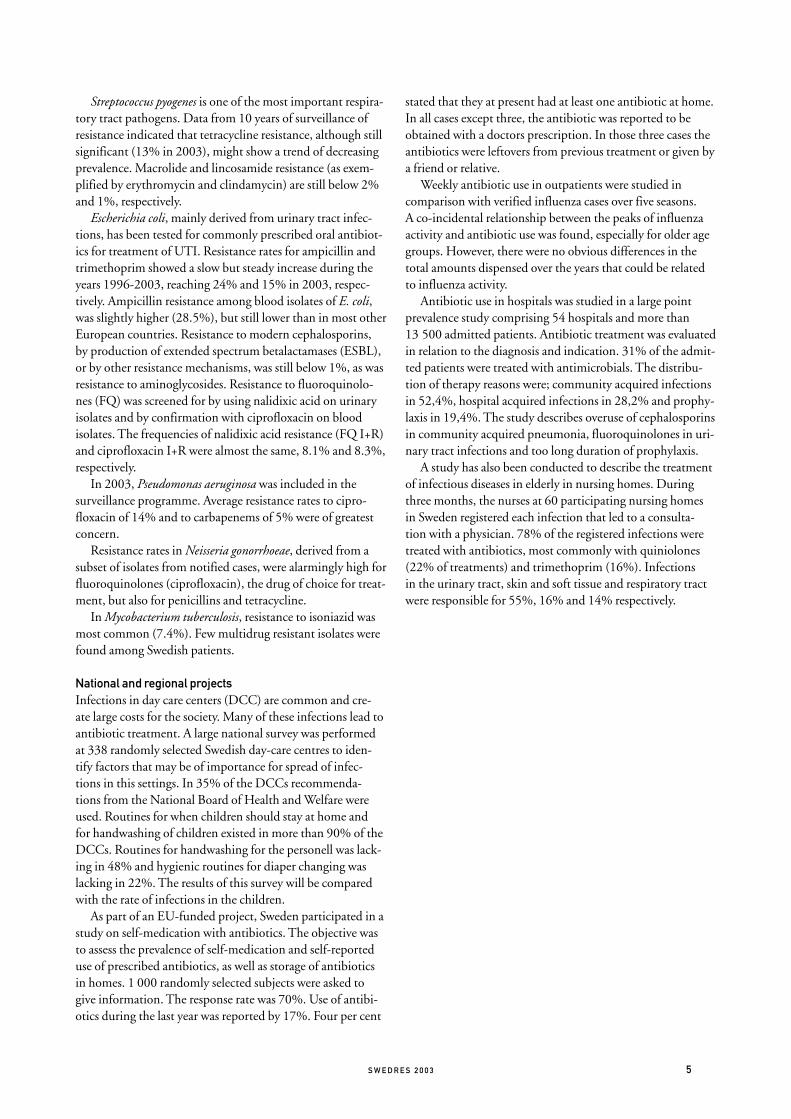
Streptococcus pyogenes is one of the most important respira-tory tract pathogens. Data from 10 years of surveillance of resistance indicated that tetracycline resistance, although still significant (13% in 2003), might show a trend of decreasing prevalence. Macrolide and lincosamide resistance (as exem-plified by erythromycin and clindamycin) are still below 2% and 1%, respectively.
Escherichia coli, mainly derived from urinary tract infec-tions, has been tested for commonly prescribed oral antibiot-ics for treatment of UTI. Resistance rates for ampicillin and trimethoprim showed a slow but steady increase during the years 1996-2003, reaching 24% and 15% in 2003, respec-tively. Ampicillin resistance among blood isolates of E. coli, was slightly higher (28.5%), but still lower than in most other European countries. Resistance to modern cephalosporins, by production of extended spectrum betalactamases (ESBL), or by other resistance mechanisms, was still below 1%, as was resistance to aminoglycosides. Resistance to fluoroquinolo-nes (FQ) was screened for by using nalidixic acid on urinary isolates and by confirmation with ciprofloxacin on blood isolates. The frequencies of nalidixic acid resistance (FQ I+R) and ciprofloxacin I+R were almost the same, 8.1% and 8.3%, respectively.
In 2003, Pseudomonas aeruginosa was included in the surveillance programme. Average resistance rates to cipro-floxacin of 14% and to carbapenems of 5% were of greatest concern.
Resistance rates in Neisseria gonorrhoeae, derived from a subset of isolates from notified cases, were alarmingly high for fluoroquinolones (ciprofloxacin), the drug of choice for treat-ment, but also for penicillins and tetracycline.
In Mycobacterium tuberculosis, resistance to isoniazid was most common (7.4%). Few multidrug resistant isolates were found among Swedish patients.
National and regional projectsInfections in day care centers (DCC) are common and cre-ate large costs for the society. Many of these infections lead to antibiotic treatment. A large national survey was performed at 338 randomly selected Swedish day-care centres to iden-tify factors that may be of importance for spread of infec-tions in this settings. In 35% of the DCCs recommenda-tions from the National Board of Health and Welfare were used. Routines for when children should stay at home and for handwashing of children existed in more than 90% of the DCCs. Routines for handwashing for the personell was lack-ing in 48% and hygienic routines for diaper changing was lacking in 22%. The results of this survey will be compared with the rate of infections in the children.
As part of an EU-funded project, Sweden participated in a study on self-medication with antibiotics. The objective was to assess the prevalence of self-medication and self-reported use of prescribed antibiotics, as well as storage of antibiotics in homes. 1 000 randomly selected subjects were asked to give information. The response rate was 70%. Use of antibi-otics during the last year was reported by 17%. Four per cent
stated that they at present had at least one antibiotic at home. In all cases except three, the antibiotic was reported to be obtained with a doctors prescription. In those three cases the antibiotics were leftovers from previous treatment or given by a friend or relative.
Weekly antibiotic use in outpatients were studied in comparison with verified influenza cases over five seasons. A co-incidental relationship between the peaks of influenza activity and antibiotic use was found, especially for older age groups. However, there were no obvious differences in the total amounts dispensed over the years that could be related to influenza activity.
Antibiotic use in hospitals was studied in a large point prevalence study comprising 54 hospitals and more than 13 500 admitted patients. Antibiotic treatment was evaluated in relation to the diagnosis and indication. 31% of the admit-ted patients were treated with antimicrobials. The distribu-tion of therapy reasons were; community acquired infections in 52,4%, hospital acquired infections in 28,2% and prophy-laxis in 19,4%. The study describes overuse of cephalosporins in community acquired pneumonia, fluoroquinolones in uri-nary tract infections and too long duration of prophylaxis.
A study has also been conducted to describe the treatment of infectious diseases in elderly in nursing homes. During three months, the nurses at 60 participating nursing homes in Sweden registered each infection that led to a consulta-tion with a physician. 78% of the registered infections were treated with antibiotics, most commonly with quiniolones (22% of treatments) and trimethoprim (16%). Infections in the urinary tract, skin and soft tissue and respiratory tract were responsible for 55%, 16% and 14% respectively.
S W E D R E S 2 0 0 3 5

2.2. Sammanfattning
6 S W E D R E S 2 0 0 3
Användning av antibiotikaÅr 2003 var den sammanlagda försäljningen av antibio-tika (öppenvård och slutenvård) 16.3 definierade dygnsdo-ser/1000 invånare och dag (DDD/1000/dag) och enbart i öppenvård 14.7 DDD/1000/dag (13.0 exkl methenamin). Försäljningen av antibiotika i Sverige har minskat de senaste åren, även om nedgången är ganska liten. Den totala försälj-ningen var 0.5 DDD/1000/dag lägre år 2003 jämfört med 2000. Den mest märkbara minskningen är bland antibiotika som används vid luftvägsinfektioner. Användningen av peni-cillin V, som är det mest förskrivna medlet i Sverige, sjönk från 4.6 DDD/1000/dag år 2000 till 4.1 DDD/1000/dag 2003. Försäljningssiffrorna för andra luftvägsantibiotika; makrolider, tetracykliner och cefalosporiner, minskar också. Den här minskningen beror troligtvis på att man, i mindre utsträckning, söker läkarvård vid vanliga förkylningar.
Beträffande behandling av urinvägsinfektioner bland kvinnor ses en fördelaktig trend där användningen av kino-loner bland kvinnor fortsätter att minska och användningen av nitrofurantoin i stället ökar. Trenden med ökande använd-ning av kinoloner bland äldre män verkar ha avstannat, även om användningen av kinoloner fortfarande är hög jämfört med övriga nordiska länder.
Användningen av penicilliner resistenta mot betalaktamas har ökat de senaste åren. En möjlig anledning till ökningen är den pågående epidemin med impetigo contagiosa, orsakad av S. aureus resistenta mot fucidinsyra. Försäljningssiffrorna visar en säsongsbunden ökning av betalaktamas-resistenta penicilliner bland barn upp till 19 år.
Linkosamider är en annan grupp antibiotika som ökar och där vidare undersökningar krävs för att finna möjliga orsaker till detta.
Användning av antimykotikaAnvändningen av antimykotika för systemiskt bruk mot nagelsvamp ökade märkbart under det första kvartalet 2002 och ligger kvar på den nivån. Detta är troligen en följd av en landsomfattande reklamkampanj riktad till allmänheten, trots att dessa medel måste förskrivas på recept. I vilken grad den ökade användningen av dessa medel påverkar resistensen mot antimykotika är oklart och kräver vidare utredning.
Inom slutenvården fortsätter användningen av de nya sub-stanserna, vorikonazol och caspofungin, att öka. Användningen av antimykotika för systemiskt bruk (J02A) ökade med 36% (0.015 DDD/1000/day) från år 2000 till 2003.
AntibiotikaresistensUr internationell synvinkel har Sverige en låg andel infektio-ner orsakade av Streptococcus pneumoniae med nedsatt käns-lighet för penicillin. Sedan 1996 är infektioner och bärar-skap av S. pneumoniae med nedsatt känslighet mot penicil-
lin (MIC = ≥0.5 mg/L, PRP) anmälningspliktiga enligt lag. Antalet anmälningar av PRP 2003 var stabila jämfört med 2002. En övervägande del av dessa fall upptäcktes vid naso-farynxodling. Den högsta förekomsten sågs bland gruppen förskolebarn och med tydlig årstidsvariation (de flesta fallen under sen höst till tidig vår). Sedan 1996 har en sjunkan-de trend noterats i antal fall parallellt med färre antal tagna odlingar. I laboratoriernas frivilliga rapportering noterades en signifikant ökning av resistens mot andra antibiotika (erytro-mycin, tetracyklin och trimetoprim-sulfa), med resistensni-våer dubbelt så höga som i mitten av 90-talet.
Antal fall av meticillinresistenta Staphylococcus aureus (MRSA) i Sverige är också jämförbart få. Ett stort utbrott i slutet av 90-talet i Göteborg i västra Sverige har bromsats, men sedan 2000 tyder en ökning i antal fall i Stockholms län på ett pågående utbrott. Dock är MRSA ett nationellt problem med rapporterade fall från alla län. Efter att tidigare enbart varit en importerad smitta är MRSA nu ett inhemskt problem där mer än 75% av fallen infekterats i Sverige. Samhällsförvärvad förekomst av MRSA ökar och i nästan hälften av de inhemskt rapporterade fallen var infektionen förvärvad utanför sjukhus eller äldreboende. Nästan alla svenska isolat sedan 2000 har typats med pulsfältsgelelek-trofores (PFGE) för genetisk information. De tre vanligaste typerna var identiska eller liknande de internationellt beskriv-na typerna UK E15, DK E 97-1 och Berlin IV. År 2003 var 0,8% av landets invasiva S. aureus isolat MRSA.
Enterococcus faecium och faecalis, resistenta mot vankomy-cin, är anmälningspliktiga sedan 2000. 2003 fördubblades antalet rapporterade fall till 45 från att tidigare ha utgjort 18 till 20 fall per år. Den huvudsakliga delen av denna ökning härrörde från sjukhusutbrott i två län vilka ledde till en omfattande kontaktspårning. 2.2% av 231 invasiva isolat av E. faecium och 0 av 593 invasiva isolat av E. faecalis var resi-stenta mot vankomycin 2003. Motsvarande siffra för ampicil-lin resistens var 76% respektive 0%.
Streptococcus pyogenes är en av de viktigaste luftvägspato-generna. Data från 10 års övervakning visar att tetracyklin-resistensen fortfarande är omfattande (13% år 2003) även om en tendens till minskning kan ses. Makrolid- och linkosamid-resistensen är fortfarande låg, 2 respektive 1%.
Escherichia coli, i huvudsak härrörande från urinvägsinfek-tioner, har testats för de vanligast förskrivna orala medlen vid behandling av urinvägsinfektioner. Resistensnivåerna för ampi-cillin och trimetoprim visar en långsam men stadig ökning under åren 1996-2003, och nådde 2003 24 respektive 15%. Ampicillin-resistens hos E. coli bland invasiva blodisolat var något högre (28,5%) men fortfarande lägre än i de flesta andra europeiska länder. Resistens mot nya cefalosporiner, orsakad av betalaktamasproduktion (ESBL) eller andra mekanismer, var fortfarande under 1% vilket också gällde för resistens mot

2.3. ContributorsSeth-Olof Bergquist, STRAMA, [email protected]
Otto Cars, STRAMA, [email protected]
Karl Ekdahl, Swedish Institute for Infectious Disease Control, [email protected]
Mats Erntell, Department of Infectious Dis-eases, Halmstad County Hospital, [email protected]
Hans Fredlund, Communicable Disease Control, Örebro University Hospital, [email protected]
Frida Ganestam, The National Corporation of Swedish Pharmacies, [email protected]
Patricia Geli, Swedish Institute for Infectious Disease Control, [email protected]
Katarina Hedin, The FoU-department, Växjö, Kronoberg County, [email protected]
Birgitta Henriques Normark, Swedish Institute for Infectious Disease Control, [email protected]
Liselotte Högberg, Swedish Institute for Infectious Disease Control, [email protected]
Gunnar Kahlmeter, Department of Clinical Microbiology, Växjö Hospital, [email protected]
Per Olcén, Department of Clinical Microbiol-ogy, Örebro University Hospital, [email protected]
Eva Olsson, The National Corporation of Swedish Pharmacies, [email protected]
Barbro Olsson Liljequist, Swedish Institute for Infectious Disease Control, [email protected]
Victoria Romanus, Swedish Institute for Infectious Disease Control, [email protected]
Gunilla Skoog, STRAMA and The National Corporation of Swedish Pharmacies, [email protected]
Mikael Stenhem, Swedish Institute for Infec-tious Disease Control, [email protected]
Cecilia Stålsby Lundborg, The National Cor-poration of Swedish Pharmacies, [email protected]
Emma Svensson, The National Corporation of Swedish Pharmacies, [email protected]
Magnus Unemo, Department of Clinical Microbiology, Örebro University Hospital, [email protected]
Mats Walder, Department of Clinical Micro-biology, Malmö University Hospital, [email protected]
aminoglykosider. Resistens mot fluorokinoloner testades med nalidixinsyra på urinisolat och med ciprofloxacin på blodisolat. Frekvensen resistens mot nalidixinsyra (R) respektive ciproflox-acin (I+R) var ungefär densamma; 8.1 och 8,3%.
2003 inkluderades Pseudomonas aeruginosa i övervaknings-programmet. De genomsnittliga värdena 14% ciprofloxacin-resistens och 5% karbapenemresistens var mest anmärknings-värda.
Resistenssiffror för Neisseria gonorrhoeae är baserade endast på en del av de stammar som anmälts enligt Smittskyddslagen. Resistens mot ciprofloxacin, som är förstahandsval vid behand-ling, var alarmerande hög, liksom också penicillin- och tetra-cyklinresistens.
För Mycobacterium tuberculosis var resistens mot isoniazid vanligast (7.4%). Ett fåtal multiresistenta isolat har hittats bland svenska patienter.
Nationella och regionala projektInfektioner på daghem är vanliga och orsakar stora kostnader för samhället. Många av dessa infektioner resulterar också i antibiotikabehandling. En nationell studie genomfördes på 338 slumpvis utvalda daghem i Sverige för att identifiera vil-ka faktorer som påverkar smittspridning i denna miljö. 35% av daghemmen använde riktlinjer utgivna av Socialstyrelsen. Rutiner för när barnen ska vara hemma, när handtvätt ska ske fanns på fler än 90% av daghemmen. Rutiner för handtvätt hos personalen saknades i 48% och hygienrutiner för blöj-byte saknades i 22%. Resultatet av denna studie kommer att jämföras med antalet infektioner hos barnen.
Sverige har deltagit i en EU-studie kring självmedicinering med antibiotika. Målet med studien var att bedöma före-komsten av självmedicinering med antibiotika och tillgången
till antibiotika i hemmet. 1 000 slumpvis utvalda personer tillfrågades. Svarsfrekvensen var 70%. 17% rapporterade användning av antibiotika det senaste året. 4% uppgav att de för tillfället hade minst ett antibiotikum hemma. I alla fall utom tre var medlet erhållet via läkarordination. Dessa tre uppgav att medlet var överbliven från tidigare behandling eller tillhandahållits av vän eller släkting.
Veckovis antibiotikaförbrukning inom öppenvård har studerats i jämförelse med verifierade influensafall över fem säsonger. Ett tidsmässigt samband mellan influensatopp och antibiotikaanvändning kunde ses, särskilt i de äldre ålders-grupperna. Över åren var det emellertid ingen skillnad i den totala antibiotikaförskrivningen som kunde relateras till influensaaktiviteten.
Antibiotikaanvändning inom slutenvård studerades i en stor punktprevalensstudie på 54 sjukhus och mer än 13 500 patienter. Antibiotikabehandlingen bedömdes i förhållande till diagnos och indikation. 31% av de intagna patienterna var behandlade med antibiotika. Fördelningen av terapiorsaker var: samhällsförvärvade infektioner 52,4%, sjukhusförvärvade infektioner 28,2% och profylax 19,4%. Studien vittnar om överanvändning av cefalosporiner vid samhällsförvärvad pneu-moni, fluourokinoloner vid urinvägsinfektioner och för lång profylaxbehandling.
En studie har utförts för att kartlägga behandlingen av infektioner hos äldre på sjukhem. Under 3 månader har skö-terskor vid 60 äldreboenden registrerat alla infektioner som lett till en läkarkonsultation. 78% av de registrerade infektio-nerna blev behandlade med antibiotika, oftast med fluouro-kinoloner (22%) och trimetoprim (16%). Av alla infektioner var 55% urinvägsinfektioner, 16% hud- och mjukdelar och 14% luftvägar.
S W E D R E S 2 0 0 3 7

3. Use of antimicrobials
8 S W E D R E S 2 0 0 3
3.1. Use of antibiotics
BackgroundIn 2003 a new system for retrieving data of drug sales came into use in Sweden. This new database includes data from 2000 (see Appendix 3) which complicates long-term analysis. This report includes data for the period 2000-2003. For his-torical comparison we refer to Swedres 2001 and 2002.
Who prescribes antibiotics in Sweden? A few years ago a coding system was introduced in Sweden to make it possible to derive a redeemed prescription to a certain health care centre, ward or even doctor. The reason was mainly to follow the costs but the system can also be used to follow, for instance, the prescriptions of antibiotics. According to data received from the National board of health and welfare more than 90% of the prescriptions were coded in 14 out of 21 counties. With data from these counties it is possible to calculate to which extent general practitioners, other specialists (mainly out-patient care in hospitals) and dentists prescribes antibiotics. General practitioners accounts for approximately 60% of the antibiotic prescriptions, other specialists almost 30% and dentists 5%. The total antibiotic sale in Sweden 2000-2003, out-patient and hospital care, was 16.8, 16.8, 16.4 and 16.3 DDD/1000 inhabitants per day (DDD/1000/day) respectively. Below, the use of antibiotics is presented as out-patient care and hospital care separately.
Out-patient careIn 2000 the WHO classified methenamine as an antibacte-rial. Since the substance is of no interest regarding resistance the amount prescribed will be separated from the total anti-biotic consumption in this report. There has been a small reduction in the use of antibiotics in out-patient care the last years. The antibiotic sale 2000-2003, excluding meth-enamine, was 13.7, 13.8, 13.3 and 13.0 DDD/1000/day respectively (Figure 3.1).
Figure 3.1. Antibiotics, out-patient care in Sweden (J01), DDD/1000/day, 2000-2003.
The most notable change is the decreasing use of anti-biotics against respiratory tract infections. The use of beta-lactamase sensitive penicillins, tetracyclines, macrolides and cephalosporins, has decreased although to a different extent. This development is probably caused by a reduced tendency for patients to seek medical care for common colds. The largest decrease was seen for beta-lactamase sensitive penicil-lins when expressed in total amounts. The greatest relative reduction (%) was seen for macrolides and cephalosporins. The increase of beta-lactamase resistant penicillins that was noted in 2002 continued in 2003 and will be further analysed below. The use of lincosamides (clindamycin) and nitrofuran-toin also increased (Figures 3.2 and 3.3).
Figure 3.2. Out-patient care, changes in consumption 2003 compared to 2000, DDD/1000/day
Figure 3.3. Out-patient care, percent change in consumption 2003 compared to 2000.
In Table 3.1 and 3.2 figures for different groups of antibiot-ics, age groups and sex are presented and some comments follow below. According to Table 3.1 the use of tetracyclines is highest (DDD) for women in the age group 20-59 years. When dividing data in smaller age groups it turns out that women 20-24 years old accounts for the highest use with 4.8 DDD/1000/day 2003. Among men the age group 15-19 has the highest comsumption, 6.2 DDD/1000/day. This most probably reflects the treatment of acne vulgaris.
The highest prescription rate of penicillins with extended spectrum is seen for women >80 years. This is mostly due to the prescription of pivmecillinam (J01CA08), against urinary
0
5
10
15
20 Methenamine (J01XX05)
Antibiotics (J01) excl methenamine
2003200220012000
DD
D/1
000/
day
-0,6 -0,5 -0,4 -0,3 -0,2 -0,1 0,0 0,1
Beta-lactamase resistant penicillins (J01CF)Lincosamides (J01FF) Nitrofurantoin (J01XE)
Pivmecillinam (J01CA08)Penicillins with extended spectrum excl pivmec (J01CA)
Trimethoprim and sulfonamides (J01EE) Combinations of penicillins (J01CR)
Trimethoprim (J01EA)Quinolones (J01MA)
Cephalosporins (J01DA)Macrolides (J01FA)
Tetracyclines (J01AA)Beta-lactamase sensitive penicillins (J01CE)
DDD/1000/day
-20%
-15%
-10% -5% 0% 5% 10%
15%
20%
25%
30%
Lincosamides (J01FF) Nitrofurantoin (J01XE)
Beta-lactamase resistant penicillins (J01CF)Pivmecillinam (J01CA08)
Penicillins with extended spectrum exkl pivmec (J01CA)Trimethoprim and sulfonamides (J01EE)
Quinolones (J01MA) Trimethoprim (J01EA)
Combinations of penicillins (J01CR)Tetracyclines (J01AA)
Beta-lactamase sensitive penicillins (J01CE)Cephalosporins (J01DA)
Macrolides (J01FA)
DDD/1000/day

S W E D R E S 2 0 0 3 9
tract infections, that was 2.8 DDD/1000/day for women >80 years old 2003.
Beta-lactamase sensitive penicillins includes penicillin V and penicillin G. Penicillin V is the most prescribed sub-stance in Sweden and represents about 30% of all agents sold in out-patient care (31% 2000, reduced to 28% 2003). There has been a reduction in all age groups, but most notable for patients <60. Most prescriptions are given to children 0-6 years old.
The number of prescriptions for combinations of penicil-lins (amoxicillin with clavulanic acid) decreases in the age group 0-6 years. There is also a small reduction in number of prescriptions for cephalosporins, except for women in the youngest ages. The number of prescriptions of trimethoprim decreases slightly among women >80 years and is probably
replaced by nitrofurantoin which increases in the same age group during the period.
As for the other agents against respiratory tract infections, the sales number for macrolides decreases. There is a slight change which is most notable among number of prescriptions for the younger age groups, both girls and boys.
The use of lincosamides increases, most notable among the elderly. The reason for this could be the treatments of leg ulcers but needs further analysis.
In Swedres 2002 a decrease in the use of fluoroquinolones among women was described as well as an increase among older men. There is still an ongoing decreasing trend among women and the increase among older men seem to have halted, although the total consumption of fluoroquinolones is still high compared to the other Nordic countries.
Table 3.1. Antibiotics, out-patient care, different groups of antibiotics and different age-groups, women and men, 2000-2003 DDD/1000/day.
Age-group (years)
Women DDD/1000/day Men DDD/1000/day
2000 2001 2002 2003 2000 2001 2002 2003
Tetracyclines (J01AA)
0-6 0.0 0.0 0.0 0.0 0.0 0.0 0.0 0.0
7-19 2.2 2.0 2.0 2.1 2.3 2.2 2.2 2.4
20-59 4.3 4.2 4.0 4.0 2.9 2.9 2.7 2.7
60-79 4.0 3.9 3.8 3.9 3.9 3.8 3.6 3.7
80- 2.8 2.6 2.6 2.6 3.9 3.7 3.5 3.5
All ages 3.5 3.4 3.3 3.3 2.7 2.7 2.6 2.6
Penicillins with extended spectrum (J01CA)
0-6 1.4 1.4 1.3 1.2 1.5 1.5 1.5 1.4
7-19 0.6 0.7 0.7 0.7 0.3 0.4 0.4 0.3
20-59 1.4 1.4 1.4 1.4 0.6 0.6 0.6 0.5
60-79 2.3 2.3 2.4 2.5 1.4 1.5 1.5 1.5
80- 3.8 4.0 4.1 4.1 2.6 2.7 2.7 2.7
All ages 1.6 1.6 1.6 1.6 0.8 0.9 0.8 0.8
Beta-lactamase sensitive penicillins (J01CE)
0-6 4.3 4.2 3.8 3.5 4.8 4.8 4.4 4.0
7-19 4.4 4.6 4.1 3.7 3.7 4.1 3.6 3.2
20-59 5.8 5.8 5.4 5.0 4.2 4.1 3.8 3.6
60-79 4.3 4.1 4.1 4.3 3.9 3.7 3.8 3.9
80- 3.5 3.4 3.3 3.2 4.1 3.9 3.7 3.7
All ages 5.0 5.0 4.7 4.5 4.1 4.1 3.8 3.6
Beta-lactamase resistant penicillins (J01CF)
0-6 0.2 0.2 0.3 0.4 0.2 0.2 0.4 0.4
7-19 0.5 0.5 0.6 0.7 0.6 0.6 0.8 0.8
20-59 0.7 0.7 0.8 0.8 0.9 0.9 1.0 1.0
60-79 1.6 1.7 1.7 1.7 2.1 2.2 2.3 2.3
80- 4.1 4.4 4.5 4.4 4.5 4.8 5.0 4.9
All ages 1.0 1.1 1.2 1.1 1.1 1.2 1.2 1.3
Combinations of penicillins (J01CR)
0-6 0.8 0.7 0.7 0.7 1.0 0.9 0.9 0.9
7-19 0.2 0.2 0.2 0.2 0.2 0.2 0.2 0.2
20-59 0.2 0.2 0.2 0.2 0.1 0.1 0.1 0.1
60-79 0.1 0.1 0.2 0.2 0.1 0.1 0.2 0.2
80- 0.1 0.1 0.1 0.1 0.1 0.1 0.1 0.1
All ages 0.2 0.2 0.2 0.2 0.2 0.2 0.2 0.2

10 S W E D R E S 2 0 0 3
Cephalosporins (J01DA)
0-6 0.6 0.5 0.6 0.6 0.6 0.6 0.6 0.6
7-19 0.4 0.4 0.4 0.4 0.3 0.3 0.3 0.3
20-59 0.5 0.5 0.4 0.4 0.3 0.3 0.3 0.2
60-79 0.6 0.5 0.5 0.5 0.6 0.5 0.5 0.5
80- 0.9 0.9 0.8 0.8 1.1 1.0 1.0 0.9
All ages 0.5 0.5 0.5 0.5 0.4 0.4 0.4 0.3
Trimethoprim (J01EA)
0-6 0.2 0.2 0.2 0.2 0.1 0.1 0.1 0.1
7-19 0.4 0.4 0.4 0.4 0.0 0.0 0.0 0.0
20-59 0.7 0.7 0.7 0.7 0.1 0.1 0.1 0.1
60-79 1.5 1.4 1.4 1.4 0.5 0.5 0.5 0.5
80- 3.4 3.3 3.2 3.1 1.8 1.8 1.7 1.7
All ages 0.9 0.9 0.9 0.9 0.2 0.2 0.2 0.2
Trimethoprim and sulfonamides (J01EE)
0-6 0.2 0.2 0.2 0.2 0.2 0.2 0.2 0.1
7-19 0.1 0.1 0.1 0.1 0.1 0.1 0.1 0.1
20-59 0.1 0.1 0.1 0.1 0.1 0.1 0.1 0.1
60-79 0.2 0.2 0.2 0.2 0.4 0.4 0.4 0.4
80- 0.2 0.2 0.2 0.2 0.5 0.5 0.5 0.5
All ages 0.1 0.1 0.1 0.1 0.2 0.2 0.2 0.2
Macrolides (J01FA)
0-6 0.9 1.0 0.9 0.7 1.0 1.1 1.0 0.8
7-19 0.9 1.0 0.8 0.7 0.9 0.9 0.7 0.6
20-59 0.9 0.9 0.8 0.8 0.5 0.5 0.4 0.4
60-79 0.6 0.6 0.6 0.5 0.5 0.4 0.4 0.4
80- 0.4 0.4 0.4 0.3 0.4 0.4 0.4 0.3
All ages 0.8 0.8 0.7 0.7 0.6 0.6 0.5 0.5
Lincosamides (J01FF)
0-6 0.0 0.0 0.0 0.0 0.0 0.0 0.0 0.0
7-19 0.1 0.1 0.1 0.1 0.1 0.1 0.1 0.1
20-59 0.2 0.2 0.2 0.3 0.2 0.2 0.2 0.2
60-79 0.3 0.3 0.4 0.4 0.4 0.5 0.5 0.6
80- 0.5 0.6 0.6 0.6 0.6 0.7 0.7 0.8
All ages 0.2 0.2 0.2 0.3 0.2 0.2 0.2 0.3
Fluoroquinolones (J01MA)
0-6 0.0 0.0 0.0 0.0 0.0 0.0 0.0 0.0
7-19 0.2 0.2 0.2 0.2 0.1 0.1 0.1 0.1
20-59 0.8 0.8 0.8 0.8 0.8 0.9 0.8 0.9
60-79 1.8 1.7 1.6 1.6 2.4 2.5 2.5 2.6
80- 3.2 3.0 2.8 2.6 4.7 4.8 4.7 4.6
All ages 1.0 1.0 0.9 0.9 1.0 1.1 1.1 1.1
Nitrofurantoin (J01XE)
0-6 0.1 0.1 0.1 0.1 0.0 0.0 0.0 0.0
7-19 0.2 0.2 0.2 0.2 0.0 0.0 0.0 0.0
20-59 0.2 0.3 0.3 0.3 0.0 0.0 0.0 0.0
60-79 0.3 0.3 0.3 0.4 0.1 0.1 0.1 0.1
80- 0.5 0.5 0.6 0.7 0.3 0.3 0.4 0.4
All ages 0.2 0.3 0.3 0.3 0.0 0.0 0.0 0.0
All agents (J01 excl methenamine)
0-6 8.7 8.6 8.2 7.5 9.5 9.5 9.0 8.4
7-19 10.1 10.4 9.9 9.4 8.5 9.0 8.6 8.2
20-59 15.9 15.9 15.2 14.6 10.6 10.6 10.1 9.9
60-79 17.5 17.3 17.1 17.5 16.5 16.4 16.4 16.7
80- 23.5 23.5 23.2 22.8 24.8 24.9 24.5 24.2
All ages 15.2 15.2 14.7 14.4 11.6 11.7 11.3 11.1

S W E D R E S 2 0 0 3 11
Table 3.2. Antibiotics, out-patient care, different groups of antibiotics and different age-groups, women and men, 2000-2003, prescriptions/1000/inh/day.
Age group (years)
Women prescriptions/1000/year Men prescriptions/1000/year
2000 2001 2002 2003 2000 2001 2002 2003
Tetracyclines (J01AA)
0-6 0 0 0 0 0 0 0 0
7-19 27 25 24 25 25 25 23 25
20-59 91 91 82 78 57 58 52 50
60-79 104 101 97 99 91 87 82 82
80- 79 74 71 72 103 98 91 90
All ages 75 75 69 67 54 54 50 49
Penicillins with extended spectrum (J01CA)
0-6 94 94 93 85 100 101 100 96
7-19 27 31 29 27 13 15 14 12
20-59 48 51 51 50 15 16 15 14
60-79 83 87 90 93 43 43 44 45
80- 160 168 172 171 86 89 86 84
All ages 62 65 65 65 29 30 29 28
Beta-lactamase sensitive penicillins (J01CE)
0-6 387 380 353 322 429 427 393 364
7-19 195 206 180 161 168 181 158 138
20-59 154 152 140 131 106 105 97 90
60-79 107 103 102 106 95 90 90 92
80- 99 97 90 85 112 111 100 97
All ages 166 165 151 142 141 141 129 120
Beta-lactamase resistant penicillins (J01CF)
0-6 18 23 34 37 20 25 37 39
7-19 22 25 32 33 26 29 37 38
20-59 26 28 30 30 30 32 33 34
60-79 47 48 50 50 56 59 62 62
80- 121 129 130 128 123 132 134 133
All ages 35 37 41 41 36 39 43 43
Combinations of penicillins (J01CR)
0-6 66 56 53 48 80 71 67 62
7-19 8 9 8 6 8 9 8 7
20-59 5 5 4 4 3 3 3 3
60-79 3 3 3 3 3 3 3 3
80- 2 3 2 2 3 5 4 3
All ages 10 9 8 7 10 9 9 8
Cephalosporins (J01DA)
0-6 50 51 53 55 55 54 54 55
7-19 26 27 27 27 20 22 22 22
20-59 27 26 24 23 15 14 14 13
60-79 28 26 26 26 27 25 24 24
80- 50 49 46 45 57 53 51 48
All ages 30 29 29 28 23 22 21 21
Trimethoprim (J01EA)
0-6 22 22 22 23 8 8 8 8
7-19 25 25 25 25 1 2 1 2
20-59 39 39 39 38 3 3 3 3
60-79 75 74 73 73 21 20 20 20
80- 193 192 187 182 89 86 84 83
All ages 52 52 51 51 9 9 9 9

12 S W E D R E S 2 0 0 3
In the last years there has been an increase in the use of beta-lactamase resistant penicillins. As seen in Figure 3.4 this increase occurred in almost all Swedish counties, expressed as DDD/1000/day. These figures can be interpreted as an increase in use of dose. Since the number DDDs/prescription did not increase, a change in dose seems unlikely (Figure 3.5).
Trimethoprim and sulfonamides (J01EE)
0-6 27 25 23 23 20 19 18 17
7-19 6 6 6 5 4 4 3 3
20-59 3 3 3 3 3 3 3 3
60-79 5 4 5 5 9 9 10 10
80- 7 8 7 7 18 18 19 18
All ages 6 6 5 5 6 6 6 6
Macrolides (J01FA)
0-6 44 47 41 34 48 52 45 38
7-19 28 31 25 21 26 28 23 18
20-59 28 29 26 23 14 15 13 12
60-79 19 19 18 17 13 13 12 11
80- 13 12 11 10 12 12 11 9
All ages 27 28 25 22 19 20 17 15
Lincosamides (J01FF)
0-6 4 4 5 5 4 4 6 6
7-19 6 7 7 8 5 6 6 6
20-59 11 12 13 14 8 9 9 10
60-79 14 16 17 20 14 16 18 21
80- 24 25 27 29 22 28 28 32
All ages 11 12 13 15 9 10 11 12
Fluoroquinolones (J01MA)
0-6 1 1 1 1 1 1 1 1
7-19 11 11 10 9 3 3 3 3
20-59 48 47 44 40 28 29 29 30
60-79 98 93 88 83 98 99 100 102
80- 200 185 169 152 231 231 222 212
All ages 57 55 51 48 40 41 41 42
Nitrofurantoin (J01XE)
0-6 11 12 11 11 3 3 3 3
7-19 8 8 8 8 1 1 1 1
20-59 9 10 12 13 0 0 0 0
60-79 9 10 12 14 3 3 4 4
80- 19 24 29 33 12 12 15 15
All ages 10 11 12 14 2 2 2 2
All agents (J01 excl methenamine)
0-6 724 715 690 643 770 767 733 690
7-19 391 414 384 357 300 325 301 274
20-59 492 494 469 449 284 288 273 263
60-79 599 591 585 593 477 472 471 480
80- 979 974 947 922 875 881 851 829
All ages 544 546 524 505 378 383 367 354
DD
D/1
000/
day
0,0
0,2
0,4
0,6
0,8
1,0
1,2
1,4
1,6
1,8
2,0
2003200220012000
Tota
l cou
ntry
Väst
erbo
tten
Öst
ergö
tland
Blek
inge
Värm
land
Jönk
öpin
g
Dalar
na
Skån
e
Kron
ober
g
Väst
man
land
Gäv
le
Väst
ergö
tland
Söde
rman
land
Jäm
tland
Väst
erno
rrlan
d
Stoc
khol
m
Halla
nd
Norrb
otte
n
Kalm
ar
Upps
ala
Öre
bro
Got
land
Figure 3.4. Swedish counties, beta-lactamase resistant penicillins (J01CF), DDD/1000/day, 2000-2003. The counties are sorted after the highest use 2003. Data is standardized to minimize differences in age and sex in the population.

S W E D R E S 2 0 0 3 13
Figure 3.5. Swedish counties, beta-lactamase resistant penicillins (J01CF), DDD/prescription, 2000-2003. The counties are sorted after the highest use 2003.
One reason for this increase could probably be the ongoing epidemic of impetigo contagiosa caused by S. aureus resistant to fusidic acid. There is an obvious increase in the age groups 0-4, 5-9 and 10-14 years, with a peak in August each year, when impetigo can be expected to increase since the chil-dren start day care centres and school again after the summer (Figure 3.6).
Figure 3.6. Beta-lactamase resistant penicillins (J01CF), out-patient care, per month 2000-2003, different age groups.
Among antibiotics used for urinary tract infections nitro-furantoin represents the greatest difference between 2000 and 2003, an increase of 29%, and the relative proportion between pivmecillinam, nitrofurantoin and trimethoprim was slightly affected by this (Figure 3.7 and 3.8). Note that the total amount of DDD for these substances against uri-nary tract infections is about six times larger for women than for men.
Figure 3.7. Proportion of pivmecillinam, nitrofurantoin and trimethoprim, DDD, men in out patient care, 2000-2003 Sweden.
Figure 3.8. Proportion of pivmecillinam, nitrofurantoin and trimethoprim, DDD, women in out-patient care, 2000-2003 Sweden.
Hospital care The antibiotic consumption (J01 excl methenamine) in hos-pital care has been constant during the period 2000-2003; 1.3 DDD/1000/day. However, slight changes in use are seen for different groups of antibiotics and penicillins with extend-ed spectrum accounts for the greatest increase, followed by beta-lactamase resistant pencillins (Figure 3.9).
Figure 3.9. Antibiotics (J01) hospital care, changes, DDD/1000/day, 2003 compared to 2000.
DD
D/p
resc
riptio
n
0
2
4
6
8
10
12
14
2003200220012000
Tota
l cou
ntry
Öst
ergö
tland
Väst
erbo
tten
Väst
erno
rrlan
d
Jönk
öpin
g
Kron
ober
g
Kalm
ar
Dalar
na
Blek
inge
Värm
land
Gäv
le
Söde
rman
land
Skån
e
Halla
nd
Stoc
khol
m
Väst
ergö
tland
Norrb
otte
n
Väst
man
land
Jäm
tland
Upps
ala
Got
land
Öre
bro
DD
D/1
000/
day
0
1
2
3
4
5
680 -
60 - 7920 - 5915 - 1910 - 14
5 - 90 - 4
jan-0
4
nov-
03
sep-
03
jul-0
3
may
-03
mar
-03
jan-0
3
nov-
02
sep-
02
jul-0
2
may
-02
mar
-02
jan-0
2
nov-
01
sep-
01
jul-0
1
may
-01
mar
-01
jan-0
1
nov-
00
sep-
00
jul-0
0
may
-00
mar
-00
jan-0
0
Pro
port
ion
in D
DD
0%
20%
40%
60%
80%
100%
J01XE01 - nitrofurantoin
J01EA01 - trimethoprimJ01CA08 - pivmecillinam
2003200220012000
Pro
port
ion
in D
DD
0%
20%
40%
60%
80%
100%
J01XE01 - nitrofurantoin
J01EA01 - trimethoprim
J01CA08 - pivmecillinam
2003200220012000
DDD/1000/day
-0,0
10-0
,005
0,00
00,
005
0,01
00,
015
0,02
0
Penicillins with extended spectrum (J01CA)
Beta-lactamase resistant penicillins (J01CF)
Quinolones (J01MA)
Trimethoprim (J01EA)
Combinations of penicillins (J01CR)
Lincosamides (J01FF)
Carbapenems (J01DH)
Trimethoprim and sulfonamides (J01EE)
Glycopeptides (J01XA)
Cephalosporins (J01DA)
Imidazole derivatives (J01XD)
Aminoglycosides (J01GB)
Tetracyclines (J01AA)
Macrolides (J01FA)
Beta-lactamase sensitive penicillins (J01CE)
14 S W E D R E S 2 0 0 3
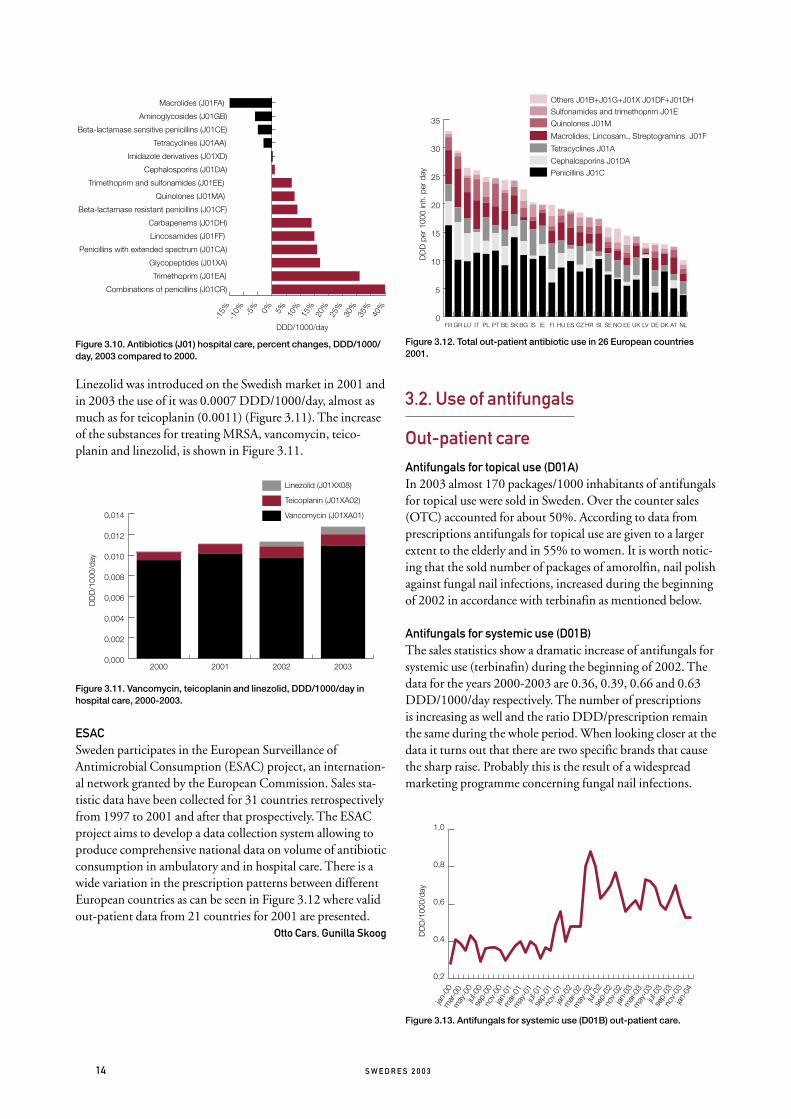
Figure 3.10. Antibiotics (J01) hospital care, percent changes, DDD/1000/day, 2003 compared to 2000.
Linezolid was introduced on the Swedish market in 2001 and in 2003 the use of it was 0.0007 DDD/1000/day, almost as much as for teicoplanin (0.0011) (Figure 3.11). The increase of the substances for treating MRSA, vancomycin, teico-planin and linezolid, is shown in Figure 3.11.
Figure 3.11. Vancomycin, teicoplanin and linezolid, DDD/1000/day in hospital care, 2000-2003.
ESACSweden participates in the European Surveillance of Antimicrobial Consumption (ESAC) project, an internation-al network granted by the European Commission. Sales sta-tistic data have been collected for 31 countries retrospectively from 1997 to 2001 and after that prospectively. The ESAC project aims to develop a data collection system allowing to produce comprehensive national data on volume of antibiotic consumption in ambulatory and in hospital care. There is a wide variation in the prescription patterns between different European countries as can be seen in Figure 3.12 where valid out-patient data from 21 countries for 2001 are presented.
Otto Cars, Gunilla Skoog
Figure 3.12. Total out-patient antibiotic use in 26 European countries 2001.
3.2. Use of antifungals
Out-patient care
Antifungals for topical use (D01A)In 2003 almost 170 packages/1000 inhabitants of antifungals for topical use were sold in Sweden. Over the counter sales (OTC) accounted for about 50%. According to data from prescriptions antifungals for topical use are given to a larger extent to the elderly and in 55% to women. It is worth notic-ing that the sold number of packages of amorolfin, nail polish against fungal nail infections, increased during the beginning of 2002 in accordance with terbinafin as mentioned below.
Antifungals for systemic use (D01B)The sales statistics show a dramatic increase of antifungals for systemic use (terbinafin) during the beginning of 2002. The data for the years 2000-2003 are 0.36, 0.39, 0.66 and 0.63 DDD/1000/day respectively. The number of prescriptions is increasing as well and the ratio DDD/prescription remain the same during the whole period. When looking closer at the data it turns out that there are two specific brands that cause the sharp raise. Probably this is the result of a widespread marketing programme concerning fungal nail infections.
Figure 3.13. Antifungals for systemic use (D01B) out-patient care.
DDD/1000/day
-15%
-10% -5% 0% 5% 10%
15%
20%
25%
30%
35%
40%
Combinations of penicillins (J01CR)
Trimethoprim (J01EA)
Glycopeptides (J01XA)
Penicillins with extended spectrum (J01CA)
Lincosamides (J01FF)
Carbapenems (J01DH)
Beta-lactamase resistant penicillins (J01CF)
Quinolones (J01MA)
Trimethoprim and sulfonamides (J01EE)
Cephalosporins (J01DA)
Imidazole derivatives (J01XD)
Tetracyclines (J01AA)
Beta-lactamase sensitive penicillins (J01CE)
Aminoglycosides (J01GB)
Macrolides (J01FA)
DD
D/1
000/
day
0,000
0,002
0,004
0,006
0,008
0,010
0,012
0,014
Linezolid (J01XX08)
Teicoplanin (J01XA02)
Vancomycin (J01XA01)
2003200220012000
DD
D p
er 1
000
inh.
per
day
0
5
10
15
20
25
30
35
Others J01B+J01G+J01X J01DF+J01DHSulfonamides and trimethoprim J01E
Quinolones J01M
Macrolides, Lincosam., Streptogramins J01F
Tetracyclines J01A
Cephalosporins J01DA
Penicillins J01C
NLATDKDELVUKEENOSESIHRCZESHUFIIEISBGSKBEPTPLITLUGRFR
DD
D/1
000/
day
0,2
0,4
0,6
0,8
1,0
jan-0
4
nov-
03
sep-
03
jul-0
3
may
-03
mar
-03
jan-0
3
nov-
02
sep-
02
jul-0
2
may
-02
mar
-02
jan-0
2
nov-
01
sep-
01
jul-0
1
may
-01
mar
-01
jan-0
1
nov-
00
sep-
00
jul-0
0
may
-00
mar
-00
jan-0
0

S W E D R E S 2 0 0 3 15
Antifungals for gynaecological use (G01AF)There has been no increase in the number of packages of antifungals for gynaecological use in the last four years. The sales numbers, prescription and OTC, show about 50 pack-ages/1000 inhabitants and the amount sold as OTC is stable near 90%. Econazole and klotrimazole are the dominating substances.
Antifungals for systemic use (J02A)The use of antifungals for systemic use has been stable during the last four years. About two thirds of the use are prescribed to women and the dominating substances are fluconazole, itraconazole and ketoconazole.
Hospital care
Antifungals for systemic use (D01B)In the same way as in out-patient care the use of terbinafin whitin hospital care increases dramatically during 2002 and remains on this (higher) level.
Antifungals for systemic use (J02A)The total use of antifungals for systemic use has increased by 35% from 2000 to 2003 within hospital care. The new sub-stances voriconazole and caspofungin, continue to increase with little expense of other substances. The use of flucyto-sine has been on a low level the last few years and has now decreased to almost zero. A slight decrease is seen for ampho-tericin B and itraconazole (Figure 3.14.).
Gunilla Skoog
Figure 3.14. Antifungals for systemic use (J02), hospital care, 2000-2003, DDD/1000/day.
DD
D/1
000/
day
0,00
0,01
0,02
0,03
0,04
0,05
0,06
Caspofungin
Voriconazole
Itraconazole
Fluconazole
Ketoconazole
Amphotericin B
2003200220012000
16 S W E D R E S 2 0 0 3
In Sweden, routine susceptibility testing of clinical isolates is performed using standardized methods (Appendix 4). According to the national programme for surveillance of resistance which has been in place for three years (Appendix 5), well-characterised data on many bacterial pathogens are now available.
Streptococcus pneumoniae
BackgroundFrom an international perspective, Sweden still has a com-paratively low rate of infections caused by S. pneumoniae with reduced susceptibility to penicillin, MIC> 0.12 mg/L (hence-forth designated PNSP). Since 1996, infections and carriage due to S. pneumoniae with reduced susceptibility to penicil-lin, MIC ≥ 0.5 mg/L (henceforth designated PRP) has been notifiable according to the Communicable Disease Act.
Notifications according to the Communicable Disease Act SurveillanceThe number of notified PRP cases in 2003 was relatively sta-ble compared to the year of 2002. A vast majority of the cases were detected by nasopharyngeal culture. All but a few iso-lates had MICs of penicillin below 2 mg/L (categorized as I), and the few isolates with MICs above 2 mg/L (R) generally were from cases infected abroad.
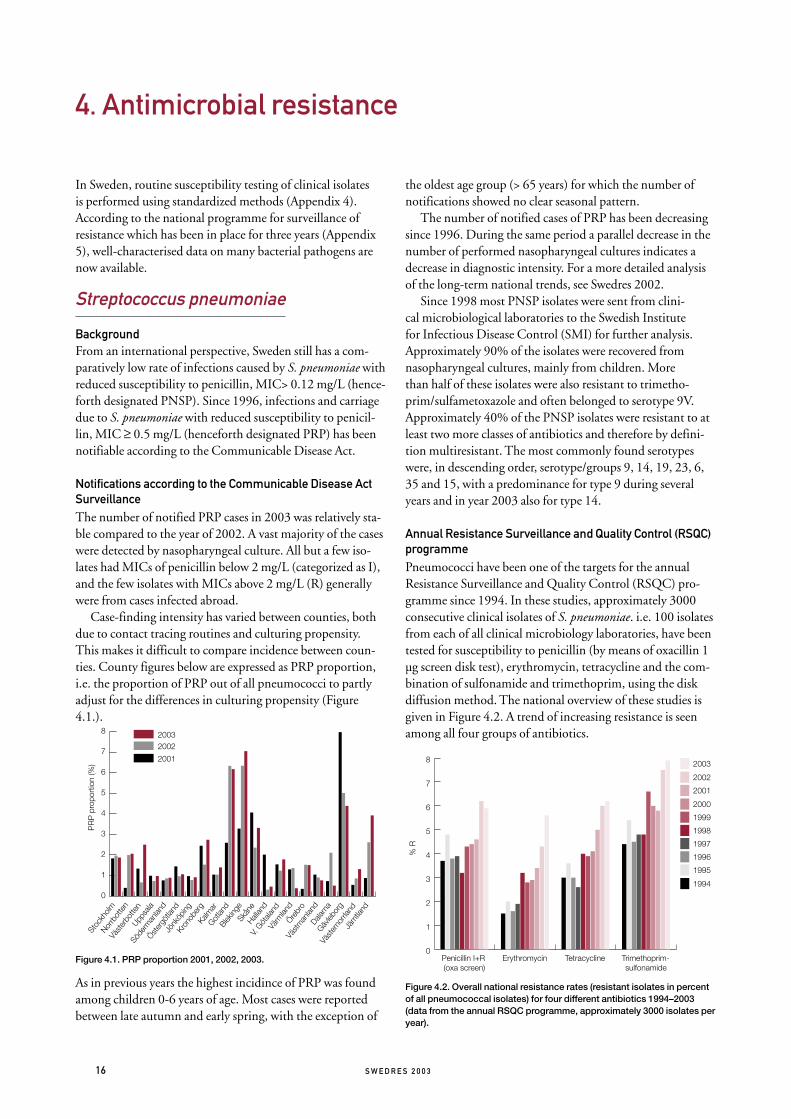
Case-finding intensity has varied between counties, both due to contact tracing routines and culturing propensity. This makes it difficult to compare incidence between coun-ties. County figures below are expressed as PRP proportion, i.e. the proportion of PRP out of all pneumococci to partly adjust for the differences in culturing propensity (Figure 4.1.).
Figure 4.1. PRP proportion 2001, 2002, 2003.
As in previous years the highest incidince of PRP was found among children 0-6 years of age. Most cases were reported between late autumn and early spring, with the exception of
the oldest age group (> 65 years) for which the number of notifications showed no clear seasonal pattern.
The number of notified cases of PRP has been decreasing since 1996. During the same period a parallel decrease in the number of performed nasopharyngeal cultures indicates a decrease in diagnostic intensity. For a more detailed analysis of the long-term national trends, see Swedres 2002.
Since 1998 most PNSP isolates were sent from clini-cal microbiological laboratories to the Swedish Institute for Infectious Disease Control (SMI) for further analysis. Approximately 90% of the isolates were recovered from nasopharyngeal cultures, mainly from children. More than half of these isolates were also resistant to trimetho-prim/sulfametoxazole and often belonged to serotype 9V. Approximately 40% of the PNSP isolates were resistant to at least two more classes of antibiotics and therefore by defini-tion multiresistant. The most commonly found serotypes were, in descending order, serotype/groups 9, 14, 19, 23, 6, 35 and 15, with a predominance for type 9 during several years and in year 2003 also for type 14.
Annual Resistance Surveillance and Quality Control (RSQC) programmePneumococci have been one of the targets for the annual Resistance Surveillance and Quality Control (RSQC) pro-gramme since 1994. In these studies, approximately 3000 consecutive clinical isolates of S. pneumoniae. i.e. 100 isolates from each of all clinical microbiology laboratories, have been tested for susceptibility to penicillin (by means of oxacillin 1 µg screen disk test), erythromycin, tetracycline and the com-bination of sulfonamide and trimethoprim, using the disk diffusion method. The national overview of these studies is given in Figure 4.2. A trend of increasing resistance is seen among all four groups of antibiotics.
Figure 4.2. Overall national resistance rates (resistant isolates in percent of all pneumococcal isolates) for four different antibiotics 1994–2003 (data from the annual RSQC programme, approximately 3000 isolates per year).
4. Antimicrobial resistance
% R
0
1
2
3
4
5
6
7
8 2003
2002
2001
2000
1999
1998
1997
1996
1995
1994
Trimethoprim-sulfonamide
TetracyclineErythromycinPenicillin I+R (oxa screen)
PR
P p
ropo
rtio
n (%
)
0
1
2
3
4
5
6
7
8 20032002
2001
Jäm
tland
Väst
erno
rrlan
d
Gävleb
org
Dalarn
a
Väst
man
land
Örebr
o
Värm
land
V. Göt
aland
Hallan
d
Skån
e
Bleking
e
Gotlan
d
Kalm
ar
Kron
ober
g
Jönk
öping
Öster
götla
nd
Söde
rman
land
Uppsa
la
Väst
erbo
tten
Norrb
otte
n
Stoc
kholm

S W E D R E S 2 0 0 3 17
Data from the EARSS networkTwentyone of the Swedish clinical microbiology laboratories, covering approximately 75% of the population, are report-ing susceptibility data on invasive isolates of S. pneumoniae to EARSS (European Antimicrobial Resistance Surveillance System), enabling comparisons with other European coun-tries (Figure 4.3).
Figure 4.3. Frequencies of reduced susceptibility to penicillin among invasive isolates of Streptococcus pneumoniae in Europe 2003. Data from EARSS (www.earss.rivm.nl 2004-04-26)
The Swedish data on susceptibility to penicillin and erythro-mycin is given in Table 4.1. Overall levels of resistance have been lower in invasive isolates than in the nasopharyngeal isolates from the RSQC programme. This could partly be explained by a lower proportion of samples from children among the invasive isolates. It should be noted that MIC breakpoints for EARSS reporting (penicillin G MIC > 0.12 mg/L - PNSP) and notification by the Communicable Disease Act (MIC ≥ 0.5 mg/L - PRP) differ, and the figures from the different reporting systems are therefore not comparable.
Table 4.1. Invasive isolates of Streptococcus pneumoniae reported to EARSS.
Year
Penicillin
S% I% R% Total
1999 98.5 1.4 0.1 805
2000 98.0 2.0 0.0 803
2001 97.2 2.3 0.5 788
2002 97.5 2.4 0.1 783
2003 95.3 4.3 0.4 920
Year
Erythromycin
S% I% R% Total
1999 94.2 2.2 3.6 535
2000 96.7 0.5 2.8 643
2001 95.4 0.2 4.4 653
2002 94.7 0.1 5.2 700
2003 95.4 0.1 4.5 759
* S < 0.12 mg/L; I 0.12-1.0 mg/L; R > 1.0 mg/L
Karl Ekdahl, Birgitta Henriques Normark, Liselotte Högberg, Gunnar Kahlmeter, Barbro Olsson Liljequist
Staphylococcus aureus
BackgroundCompared to many other European countries, the prevalence of MRSA in Sweden is still low. Policies for screening high-risk patients for multiresistant bacteria and continuous sur-veillance have been of importance in order to prevent spread of the organism. The decision to include both infection and colonisation with MRSA in the Communicable Disease Act in the year 2000 was due to an increasing national alertness, responding to the situation seen in many other European countries, where MRSA now represents an increasing propor-tion of staphylococcal infections in hospital settings, totally exceeding 50%.
Notifications of MRSA according to the Communicable Disease Act The duration of MRSA carriage can be long, which might complicate the statistics when reporting systems change. A case that was reported through the voluntary reporting sys-tem before or during 1999, would be considered as a new case if the person provided a new culture positive for MRSA from the year 2000, even though that person was already known by the local Communicable Disease Officers. This situation was relevant especially for the Västra Götaland province, which had experienced a local outbreak of MRSA in the late 1990s, and screened many carriers from this outbreak in 2000. The notable decrease in reported cases from the Västra Götaland region is likely to in part be explained by such an over report-ing in 2000 and in part by a true decrease in incidence.
The other most notable change in MRSA incidence dur-ing this period is the increasing incidence in the Stockholm region reflecting an ongoing MRSA epidemic. The Stockholm region, with a fifth of the total Swedish popula-tion, contributed more than two fifths of the reported MRSA cases in Sweden in 2002 (Table 4.2.).
Proportion of isolates (%)
0 5 10 15 20 25 30 35 40
% resistant
% intermediate
Estonia (26)Netherlands (343)Czech rep. (204)
Denmark (606)England (668)Sweden (916)
Austria (146)Finland (490)Slovakia (27)
Belgium (1488)Ireland (362)
Italy (201)Bulgaria (22)
Slovenia (172)Luxembourg (48)
Poland (16)Croatia (87)
Portugal (95)Hungary (134)
Spain (654)Romania (22)
Israel (180)

18 S W E D R E S 2 0 0 3
During 2003 a total of 549 cases were reported. The MRSA incidence was highest among the elderly (Figure 4.4.).
Figure 4.4. Age adjusted incidence of MRSA (n=549 cases).
Of the reported cases 55% were considered to be infected with MRSA. Of the cases with a reported country of acqui-sition 76% were regarded as having acquired MRSA in Sweden. More than half of the imported cases had acquired MRSA in health care settings abroad. For the 306 domestic cases health care facilities were the most common place of MRSA acquisition (53%).
Of health care related acquisition 62% were reported to have taken place in in-patient care in hospital settings and 15% were occupational (Figure 4.5.). Many of the MRSA-cas-es in the older age group had frequent contacts with both in-patient and out-patient health care services as well as nursing homes. Thus, it was difficult to determine where the patient initially acquired MRSA. The multiple contacts with health care services for many of these patients pose a great challenge in information exchange between health care providers.
Figure 4.5. Reported mode of domestic health care related acquisition.
Typing of MRSAA DNA-based method was used for typing of most MRSA isolates since the year 2000 (pulsed field gel electrophoresis; PFGE). PFGE patterns were included in a database and com-pared with international reference strains (epidemic MRSA from European countries, the Harmony project) (Table 4.3). Awaiting international consensus on nomenclature, names were adopted from the Harmony project for patterns identi-cal to one of the reference strains (e.g. UK E15). Other pat-terns, when found in isolates from at least two patients, were given Swedish designations including the year of isolation (e.g. SE97-3). These patterns could be either related or unre-lated to a reference strain.
Table 4.2. MRSA notified in 2000-2003 by county according to the Communicable Disease Act.
County
2000 2001 2002 2003
NumberIncidence/100 000 inh Number
Incidence/100 000 inh Number
Incidence/100 000 inh Number
Incidence/100 000 inh
Stockholm 96 5.2 166 9.0 205 11.1 228 12.3
Uppsala 19 6.4 17 5.7 10 3.3 12 4.0
Södermanland 2 0.7 1 0.3 4 1.5 2 0.7
Östergötland 2 0.4 7 1.6 7 1.6 14 3.3
Jönköping 7 2.1 5 1.5 5 1.5 24 7.3
Kronoberg 1 0.5 0 0 4 2.2 5 2.8
Kalmar 3 1.2 2 0.8 5 2.1 6 2.5
Gotland 1 1.7 10 17.4 3 5.2 2 3.4
Blekinge 7 4.6 1 0.6 3 1.9 2 1.3
Skåne 22 1.9 75 6.6 68 5.9 104 9.1
Halland 10 3.6 25 9.0 13 4.6 13 4.6
Västra Götaland 110 7.3 54 3.6 48 3.1 63 4.1
Värmland 9 3.2 7 2.5 5 1.8 11 4.0
Örebro 8 2.9 6 2.1 16 5.8 8 2.9
Västmanland 3 1.1 8 3.1 7 2.7 11 4.2
Dalarna 0 0 4 1.4 1 0.3 2 0.7
Gävleborg 2 0.7 1 0.3 12 4.3 5 1.8
Västernorrland 14 5.6 12 4.8 7 2.8 10 4.0
Jämtland 0 0 0 0 2 1.5 5 3.8
Västerbotten 3 1.1 18 7.0 10 3.9 13 5.0
Norrbotten 3 1.1 5 1.9 6 2.3 9 3.5
Total 322 3.6 424 4.7 441 4.9 549 6.1
Inci
denc
e (n
umbe
r of
cas
es/1
00 0
00 in
h.)
0
5
10
15
20
25
30
90-80-8970-7960-6950-5940-4930-3920-2910-1900-09
Occupational
Outside hospital
Hospital

S W E D R E S 2 0 0 3 19
Table 4.3. PFGE patterns of MRSA isolated in Sweden 2000-2003.
PFGE pattern
No. of isolates with identical or related patterns (% of total)
2000 2001 2002 2003
UK E15 20 (13) 66 (17.6) 111 (25.2) 125 (22.8)
DK E97-1 17 (11) 47 (12.5) 75 (17) 73 (13.3)
Berlin IV 7 (4.5) 50 (13.3) 13 (2.9) 62 (11.3)
Bel EC-3a 5 (3.2) 22 (5.9) 30 (6.8) 47 (8.6)
UK E16 8 (5.2) 31 (8.3) 40 (9.1) 31 (5.6)
Fra B 4 (2.6) 19 (5.1) 14 (3.2) 28 (5.1)
Fra A 33 (21.4) 31 (8.3) 28 (6.3) 20 (3.6)
UK E1 14 (9.1) 21 (5.6) 36 (8.2) 19 (3.5)
UK E3 3 (1.9) 9 (2.4) 11 (2.5) 16 (2.9)
S German II 3 (1.9) 6 (1.6) 8 (1.8) 7 (1.3)
Unrelated SE-patterns 38 (24.7) 73 (19.5) 75 (17) 100 (18.2)
Total 154 375 441 549
Annual Resistance Surveillance and Quality Control (RSQC) programmeStaphylococcus aureus from wound infections were included in the annual RSQC programme since 2001 (Appendix 5). Twenty-nine laboratories delivered data on consecutive iso-lates using the disk diffusion method for oxacillin, clindamy-cin, fusidic acid, aminoglycoside (gentamicin, netilmicin or tobramycin) and vancomycin. Resistance rates, compared to corresponding data for invasive isolates (as reported to EARSS), are presented in Table 4.4.
Table 4.4. Resistance rates for Staphylococcus aureus in 2001-2003 (RSQC-data compared to EARSS-data for Sweden)
Oxa-cillin
Clinda-mycin
Fusidic acid
Amino-glyco-side
Vanco-mycin
2001 RSQC wound isolates
Total (n) 3466 3458 3209 2817 2910
R (%) 0.1 2.1 7.1 0.4 0
2001 EARSS (Sweden). invasive isolates
Total (n) 1632 1588 586 1575 1395
R (%) 0.9 1.2 2.5 0.3 0
2002 RSQC wound isolates
Total (n) 4291 3778 3812 2755 2841
R (%) 0.2 1.9 9.5 0.2 0
2002 EARSS (Sweden). invasive isolates
Total (n) 1842 1826 797 1711 1653
R (%) 0.7 1.8 2.9 0.5 0
2003 RSQC wound isolates
Total (n) 2929 3578 3700 3257 3061
R (%) 0.5 1.8 8.4 0.6 0
2003 EARSS (Sweden). invasive isolates
Total (n) 1861 1860 886 1828 1804
R (%) 0.8 1.9 10.5 0.8 0
The observations from year 2001 and 2002 of high rates of fusidic acid resistance in wound infections were verified also in 2003. One fusidic acid resistant clone (MIC of fusidic acid 4 m/L) was shown to cause impetigo in young children in 2002. The constant high resistance rate in 2003 implies the continuing presence of this clone.
Data from the EARSS networkTwenty-one of the Swedish laboratories (covering approxi-mately 75% of the population) are reporting susceptibility data on invasive isolates of S. aureus to EARSS (Appendix 5). On average 0.75% of the invasive S. aureus isolates were MRSA (identified by the oxacillin screen disk test and con-firmed by the detection of the mecA gene). Swedish data from the last five years indicate a low rate of MRSA among invasive isolates (Table 4.5.). Comparative data for Europe are given in Figure 4.6.
Table 4.5. Staphylococcus aureus susceptibility results (number of strains and percentage) using the oxacillin disk diffusion method according to SRGA in Sweden. Data reported from SMI to EARSS .
Year S I R Total
1999 1307 (99%) 0 13 (1.0%) 1320
2000 1469 (99.4%) 0 9 (0.6%) 1478
2001 1618 (99.1%) 0 14 (0.9%) 1632
2002 1830 (99.4%) 0 12 (0.6%) 1842
2003 1647 (98.9%) 0 18 (1.1%) 1665
Figure 4.6. MRSA in Europe 2003, invasive isolates. Data from EARSS (www.earss.rivm.nl 2004-04-26).
Gunnar Kahlmeter, Barbro Olsson Liljequist, Mikael Stenhem
Enterococcus faecium and faecalis
Background Enterococci, and specifically VRE, have become important causes of nosocomial outbreaks in many parts of the world, usually involving high-risk populations such as immunosup-pressed and intensive care patients. Like MRSA, VRE were made notifiable pathogens according to the Communicable Disease Act in the year 2000. Surveillance of this pathogen was previously done through the voluntary laboratory report-ing system.
% MRSA
0 10 20 30 40 50 60
Denmark (671)Netherlands (546)
Sweden (1854)Finland (727)Estonia (98)
Czech rep. (1387)Slovakia (267)Slovenia (299)
Austria (747)Hungary (858)
Germany (225)Poland (166)
Luxembourg (95)Spain (1391)
Belgium (1141)Bulgaria (157)Croatia (360)
Italien (394)Ireland (1109)
Malta (122)Israel (368)
England (1877)Portugal (1033)
Romania (85)Greece (321)

20 S W E D R E S 2 0 0 3
Notifications of VRE according to the Communicable Disease Act and the Voluntary Laboratory Report System
Between 2000 and 2002, the number of annually reported cases varied between 18 and 20 cases. In 2003 however, this number more than doubled to 45 reported cases. The main part of this increase was due to two hospital outbreaks in Örebro County and Skåne Region (Malmö), respectively, leading to extensive contact tracing (Figure 4.7.). Previously one such outbreak took place in Västerbotten County (Umeå) in the year 2000. Stockholm is the only county that each year in the period has had eight or more cases.
Figure 4.7. Reported VRE cases by county 2000–2003 (counties not in the graph did not report any case).
Carriage/infection with VRE is increasingly common with older age, except for the oldest age group (Figure 4.8.).
Figure 4.8. Reported VRE cases 2000–2003; age adjusted incidence.
Data from the EARSS networkSince the year 2001, Enterococcus faecalis and Enterococcus faecium were included in the EARSS network (Appendix 5). The main focus has been on vancomycin resistance, but also on high-level resistance to aminoglycoside antibiot-ics. This latter property may be of major clinical concern since it makes combination therapy using penicillin and aminoglycoside of no use. From Sweden 21 laboratories
(covering approximately 75% of the population) contrib-uted with quality assured routine disk diffusion data (Table 4.6). Alarming was that five vancomycin resistant isolates of Enterococcus faecium were found among the blood isolates.
Table 4.6. Susceptibility of invasive isolates of Enterococcus faecalis and Enterococcus faecium to three antibiotic groups in Sweden 2001-2003. Data from EARSS.
Ampicillin
Amiono-glycosides
(gentamicin or tobramycin) Vancomycin
2001 Enterococcus faecalis, invasive isolates
R (%) 0 13 0
Total (n) 479 212 396
2002 Enterococcus faecalis, invasive isolates
R (%) 0 15 0
Total (n) 453 368 368
2003 Enterococcus faecalis, invasive isolates
R (%) 0 17.5 0
Total (n) 612 448 593
2001 Enterococcus faecium, invasive isolates
R (%) 71 9 0
Total (n) 196 102 172
2002 Enterococcus faecium, invasive isolates
R (%) 72 5.6 0
Total (n) 167 88 148
2003 Enterococcus faecium, invasive isolates
R (%) 76.3 11.2 2.2
Total (n) 241 170 231
Karl Ekdahl, Barbro Olsson Liljequist
Streptococcus pyogenes
Annual Resistance Surveillance and Quality Control (RSQC) programmeBeing one of the most important respiratory tract pathogens, Streptococcus pyogenes has been one of the regular pathogens of the national surveillance program since 1994. The antibi-otics chosen for surveillance are those which are considered as treatment options and for which resistance mechanisms have been described. Penicillin is still the drug of choice, and remarkably enough resistance to penicillin or other betalactams has never been described in clinical isolates. Resistance to macrolides (represented by erythromycin), clin-damycin and tetracyclines occur more or less frequently.
Resistance to erythromycin and clindamycin are in some cases mechanistically related (altered target, so called MLS-resistance) but in others unrelated (efflux mechanism) and affecting only erythromycin.
Summarized data for the years 1994-2002 are presented in Figure 4.9. For more detailed information, please visit http://www4.smittskyddsinstitutet.se/ResNet/index.jsp where data on county level can be found.
0
3
6
9
12
15
2003
2002
2001
2000
Östergötland
Örebro
Västmanlan
d
Värmlan
d
Västergötland
Västerbotten
Uppsala
Södermanlan
d
Stockholm
Skåne
Kronoberg
Kalmar
Jämtland
Jönköping
Halland
Blekinge
Num
ber
0,0
0,5
1,0
1,5
2,0
2,5
3,0
3,5
4,0
4,5
80+70-7960-6950-5940-4930-3920-290-19

S W E D R E S 2 0 0 3 21
Figure 4.9. Resistance rates (resistant isolates in percent of all Streptococus pyogenes isolates) for three different antibiotics 1994-2003.
Data on invasive isolates were available from 2002, since dur-ing almost 9 months in 2002 all invasive isolates of Group A streptococci were sent to SMI for further characterization. The frequencies of resistance were 3% to erythromycin, <1% to clindamycin, 39% to tetracycline and none to penicillin. The most common T-type among the tetracycline resistant isolates was T3.13.B3264.
Birgitta Henriques Normark, Gunnar Kahlmeter,
Barbro Olsson Liljequist
Haemophilus influenzae
There are no data in the RSQC programme on Haemophilus influenzae for 2003. The most recent data are given in Swedres 2001.
Escherichia coli
Annual Resistance Surveillance and Quality Control (RSQC) programmeEscherichia coli, mainly derived from urinary tract infections, has been included in the national surveillance program sev-eral times since 1996 and every year since 2001. Resistance to commonly prescribed oral antibiotics for treatment of UTI were tested each year. The average resistance rates to ampicillin have shown a steady increase every year from 17 to 24%. The same was true for trimethoprim where resist-ance rates varied between 8 and 15%. Fluoroquinolone resist-ance (represented by norfloxacin) was below 5% but slightly increasing year by year, requiring special attention. In 2002, it was proposed by SRGA-M to use nalidixic acid instead of norfloxacin to screen for resistance to fluoroquinolones. It was anticipated that the screening result R would include all isolates that deviated from the wild-type population of E. coli with respect to fluoroquinolone susceptibility. This was shown to be true when analysing data from 6 laboratories who delivered data for both nalidixic acid and norfloxacin,
and when adjusted breakpoints close to the wildtype popu-lations were applied for norfloxacin (data not shown). In 2002 and 2003 all but five of the Swedish laboratories used nalidixic acid, and enough data for comparison were thereby obtained. No increase in resistance to fluoroquinolones was seen in this period (Figure 4.10).
Figur 4.10.Resistance rates (resistant isolates in percent of all Escherichia coli isolates) for six different antibiotics 1996-2003.* Between 1996-2001 fluoroquinolone resistance was detected with Norfloxacin, from 2002 with Nalidixic acid.
Data from the EARSS networkEscherichia coli derived from invasive infections (blood isolates) have been part of the European Antimicrobial Resistance Surveillance System (EARSS) since the year 2001. Focus for the surveillance activities has been on resistance to betalactam antibiotics, especially occurrence of strains produc-ing betalactamases with so called extended spectrum (ESBL), resistance to aminoglycosides and to fluoroquinolones.
Twentyone Swedish laboratories have taken part in this surveillance and have delivered data on more than 2500 blood isolates in 2003. Results are presented in Table 4.7. together with data from the RSQC programme on urine isolates from 2001-2003. Ampicillin resistance, caused by production of plasmid-mediated betalactamase (TEM-type most common) was equally high in the two sets of isolates, yet these figures are low compared to most other countries in Europe. The level of resistance to third generation cepha-losporins among blood isolates was only 0.4%, and in most of those resistance was contributed to the presence of ESBL. Aminoglycoside resistance in Escherichia coli is extremely rare in Sweden. Resistance to fluoroquinolones is increasing every year, and taking into account both resistant (R) and indeter-minant/intermediate (I) isolates, the rates are almost the same in blood as in urine isolates. Data from other European coun-tries 2003 are presented in Figure 4.11. (data from EARSS).
% R
0
5
10
15
20
2003
2002
2001
2000
1999
1998
1997
1996
1995
1994
TetracyclineClindamycinErythromycin
% R
0
5
10
15
20
25
2003
2002
2001
1999
1997
1996
Trim
etop
rim
Qui
nolo
nes
*
Nitro
fura
ntoi
n
Cefa
drox
il
Mec
illina
m
Ampi
cillin

22 S W E D R E S 2 0 0 3
Table.4.7. E. coli from UTI and blood in Sweden 2001-2002.
Ampicillin
Cefotaxime (3rd gen
cef)Amino-
glycosides*Fluoro-
quinolone
2001 RSQC, urine isolates
R (%) 20.8 Nt Nt 2.8 (nor)
Total (n) 3803 Nt Nt 3814
2001 EARSS (Sweden),Invasive isolates
R (%) 26.5 0.5 1.0 3.7R/1.8I (cip)
Total (n) 1513 2627 1241 2273
2002 RSQC, urine isolates
R (%) 22 Nt Nt 8.5 (nal)
Total (n) 5906 Nt Nt 4253
2002 EARSS (Sweden),Invasive isolates
R (%) 24.9 0.5 0.6 5.1R/2.0I (cip)
Total (n) 1753 3062 1585 2414
2003 RSQC. urine isolates
R (%) 23.5 Nt Nt 8.2 (nal)
Total (n) 4488 Nt Nt 3971
2003 EARSS (Sweden),Invasive isolates
R (%) 28.5 0.4 1.0 6.6R/1.7I(cip)
Total (n) 1953 3300 2819 3120
* gentamicin. tobramycin.
Figure 4.11. Resistance rates (% R and I) to fluoroquinolones in Escherichia coli in Europe 2003. Data from EARSS (www.earss.rivm.nl 2004-04-26)
Gunnar Kahlmeter, Barbro Olsson Liljequist
Klebsiella pneumoniae
There are no data in the RSQC programme on Klebsiella pneu-moniae for 2003. Sporadic cases of both Klebsiella pneumoniae and Klebsiella oxytoca are found, which exhibit high-level resistance to third generation cephalosporins, often caused by ESBL. The most recent data are given in Swedres 2001.
Enterobacter species
There are no data in the RSQC programme on Enterobacter species for 2003. The most recent data are given in Swedres 2001.
Helicobacter pylori
Annual Resistance Surveillance and Quality Control (RSQC) programmeHelicobacter pylori derived from gastric biopsies have been monitored locally at a few laboratories in Sweden. In vitro resistance against metronidazole has been reported in 10-40% of Scandinavian strains. Resistance to clarithromy-cin is less common (3-7%) and not increasing and has not reached over 10% at any laboratory. Resistance to tetracy-cline is less than 1% and resistance to amoxicillin has only been described in a few strains and only outside Scandinavia. Resistance-figures from strains isolated in southwest of Sweden are presented. The population is about 300 000 and between 100-600 new Helicobacter strains are isolated yearly.
Table 4.8. Helicobacter pylori University Hospital MAS. Sweden 1994-2003,%R (- = not tested).
YearTotal
numberClarithro-
mycinMetro-
nidazoleTetra-
cyclineAmoxi-
cillin
1994 536 1.0 29.0 0.2 0
1995 588 2.9 32.1 0.1 0
1996 381 3.9 35.2 - 0
1997 331 7.7 39.8 - 0
1998 116 6.7 34.3 - 0
1999 149 6.1 33.1 - 0
2000 216 7.8 30.5 - 0
2001 188 8.8 40.2 - 0
2002 124 9 44.1 - 0
2003 112 7.2 42.6 - 0
Mats Walder
Salmonella and Shigella spp.
Annual Resistance Surveillance and Quality Control (RSQC) programme Salmonella spp. and Shigella spp. derived from faecal cultures have not been included in the annual RSQC program until 2002 but have been monitored locally by a few laboratories.
Since most of the Salmonella and more than 90% of the Shigella strains isolated in Sweden originate from tourists returning home, the sensitivity patterns reflect their geo-graphical origin. Too few strains are included in the Swedish survey to obtain a conclusive result.
Mats Walder
Proportion of isolates (%)
0 5 10 15 20 25 30
% intermediate
% resistant
Portugal (743)Italy (669)Malta (90)
Spain (2640)Israel (773)
Bulgaria (155)Slovakia (238)Romania (50)
Hungary (812)Germany (217)Belgium (174)Austria (896)
Luxembourg (226)Czech rep. (1764)
Slovenia (401)Greece (507)Ireland (950)
Sweden (3120)Croatia (547)
Netherlands (848)Poland (120)
Finland (1372)Estonia (87)

S W E D R E S 2 0 0 3 23
Campylobacter spp.
Annual Resistance Surveillance and Quality Control (RSQC) programme Campylobacter spp. derived from patients with diarrhoea has not until 2001 been included in the annual RSQC pro-gramme but has been monitored locally at a few laborato-ries. About 50% of Campylobacter strains are imported cas-es. Since resistance to fluoroquinolones is a major concern worldwide it is interesting to notice a small decline in fluoro-quinolone resistance among Campylobacter isolates. This is despite the fact that many laboratories perform resistance screening with nalidixic acid since 2001, which was expected to increase resistance figures with 25-30%. The overall fluo-roquinolone resistance for Campylobacter spp. isolated in Sweden was approximately 30% (Table 4.9.).
Table 4.9. Campylobacter jejuni/coli, University Hospital MAS, Sweden 1991-2003,%R
Percentage of resistant strains (R%)
Year Nalidixic acid Ciprofloxacin Tetracycline Erythromycin
1991 - 16 27 4
1992 - 17 30 2
1993 - 24 28 5
1995 - 22 27 4
1997 - 23 30 3
1998 - 34 33 2
1999 - 45 35 1
2000 - 55 45 1
2001 32 30 28 1
2002 29 28 30 0.5
2003 48 46 24 0
Mats Walder
Pseudomonas aeruginosa
Annual Resistance Surveillance and Quality Control (RSQC) programmePseudomonas aeruginosa was included the first year of the RSQC programme (1994) using the disc diffusion (DD) method. Those data are compared with two sentinel studies from 1984 and 1994, respectively, in which isolates were col-lected and tested at SMI from 8 and 4 laboratories, respec-tively (total of 200 isolates in each collection), MICs were determined by agar dilution method.
In 2003 Pseudomonas aeruginosa again was included in the RSQC programme. Laboratories were asked to collect and test 50 isolates of Pseudomonas aeruginosa from wound infec-tions and 50 isolates (or as many as possible, not less than 30) from respiratory tract infections. Data from all these collec-tions are shown in Figure 4.12.
Figure 4.12. Resistance rates (resistant isolates in percent of all Pseudomonas aeruginosa isolates)
Gunnar Kahlmeter, Barbro Olsson Liljequist
Neisseria gonorrhoeae
Notifications according to the Communicable Disease ActGonorrhoea is a notifiable disease, and 596 clinical cases of the disease were reported in 2003. Clinical isolates were ana-lysed at the Swedish Reference Laboratory for Pathogenic Neisseria, Department of Clinical Microbiology, Örebro University Hospital.
In 2003, isolates from 130 patients were sent to the ref-erence laboratory, representing 22% of the notified cases. Isolates from the counties containing the largest cities in Sweden were underrepresented in this material. Susceptibility testing was performed according to standardized methodol-ogy using Etest for determination of MIC for ampicillin, cefixime, ceftriaxone, azithromycin, ciprofloxacin and spec-tinomycin. Production of ß-lactamase was examined by using Nitrocefin discs. Results for 2003 are compared with those from 1998, and 2000-2002 in Table 4.10.
Table 4.10. Antibiotic resistance rates (%) and ß-lactamase production of Neisseria gonorrhoeae in 1998 and 2000-2003 (data from the Swedish Reference Laboratory).
1998 (n=348)
2000 (n=131)
2001 (n=141)
2002 (n=120)
2003 (n=130)
ß-lactamase pos. 24 37 37 39 22
Penicillin G 32 42 38 48 -
Ampicillin 24 37 37 39 22
Cefuroxime 0 2 0 4 -
Cefixime - - - 0 0
Ceftriaxone 0 - - 0 0
Azithromycin 0 - - 0 <1
Tetracycline 32 52 56 54 -
Ciprofloxacin 10 28 43 48 52
Spectinomycin 0 0 0 0 0
(- = not analysed)
Hans Fredlund, Magnus Unemo
0%
5%
10%
15%
20%
2003, DD
1994, DD
1994, MIC
1984, MIC
Cipr
oflo
xacin
Mer
open
em
Imip
enem
Cefta
zidim
Tobr
amyc
in
Gen
tam
icin
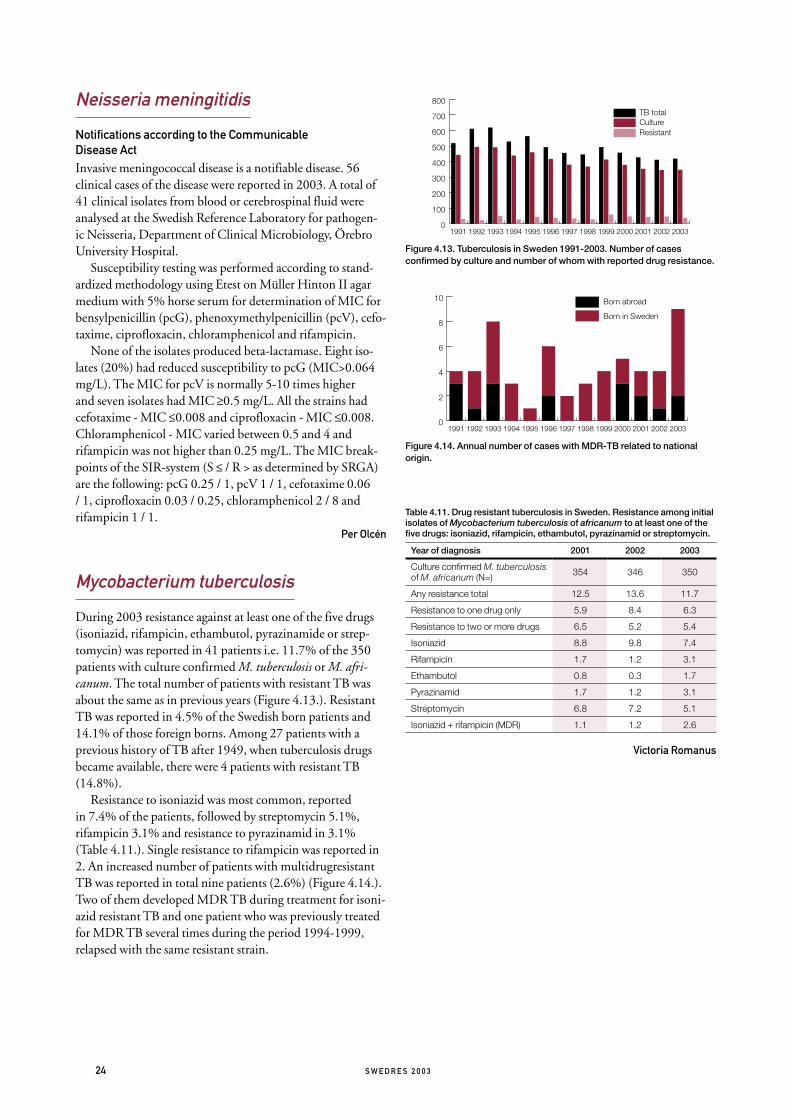
24 S W E D R E S 2 0 0 3
Neisseria meningitidis
Notifications according to the Communicable Disease ActInvasive meningococcal disease is a notifiable disease. 56 clinical cases of the disease were reported in 2003. A total of 41 clinical isolates from blood or cerebrospinal fluid were analysed at the Swedish Reference Laboratory for pathogen-ic Neisseria, Department of Clinical Microbiology, Örebro University Hospital.
Susceptibility testing was performed according to stand-ardized methodology using Etest on Müller Hinton II agar medium with 5% horse serum for determination of MIC for bensylpenicillin (pcG), phenoxymethylpenicillin (pcV), cefo-taxime, ciprofloxacin, chloramphenicol and rifampicin.
None of the isolates produced beta-lactamase. Eight iso-lates (20%) had reduced susceptibility to pcG (MIC>0.064 mg/L). The MIC for pcV is normally 5-10 times higher and seven isolates had MIC ≥0.5 mg/L. All the strains had cefotaxime - MIC ≤0.008 and ciprofloxacin - MIC ≤0.008. Chloramphenicol - MIC varied between 0.5 and 4 and rifampicin was not higher than 0.25 mg/L. The MIC break-points of the SIR-system (S ≤ / R > as determined by SRGA) are the following: pcG 0.25 / 1, pcV 1 / 1, cefotaxime 0.06 / 1, ciprofloxacin 0.03 / 0.25, chloramphenicol 2 / 8 and rifampicin 1 / 1.
Per Olcén
Mycobacterium tuberculosis
During 2003 resistance against at least one of the five drugs (isoniazid, rifampicin, ethambutol, pyrazinamide or strep-tomycin) was reported in 41 patients i.e. 11.7% of the 350 patients with culture confirmed M. tuberculosis or M. afri-canum. The total number of patients with resistant TB was about the same as in previous years (Figure 4.13.). Resistant TB was reported in 4.5% of the Swedish born patients and 14.1% of those foreign borns. Among 27 patients with a previous history of TB after 1949, when tuberculosis drugs became available, there were 4 patients with resistant TB (14.8%).
Resistance to isoniazid was most common, reported in 7.4% of the patients, followed by streptomycin 5.1%, rifampicin 3.1% and resistance to pyrazinamid in 3.1% (Table 4.11.). Single resistance to rifampicin was reported in 2. An increased number of patients with multidrugresistant TB was reported in total nine patients (2.6%) (Figure 4.14.). Two of them developed MDR TB during treatment for isoni-azid resistant TB and one patient who was previously treated for MDR TB several times during the period 1994-1999, relapsed with the same resistant strain.
Figure 4.13. Tuberculosis in Sweden 1991-2003. Number of cases confirmed by culture and number of whom with reported drug resistance.
Figure 4.14. Annual number of cases with MDR-TB related to national origin.
Table 4.11. Drug resistant tuberculosis in Sweden. Resistance among initial isolates of Mycobacterium tuberculosis of africanum to at least one of the five drugs: isoniazid, rifampicin, ethambutol, pyrazinamid or streptomycin.
Year of diagnosis 2001 2002 2003
Culture confirmed M. tuberculosis of M. africanum (N=) 354 346 350
Any resistance total 12.5 13.6 11.7
Resistance to one drug only 5.9 8.4 6.3
Resistance to two or more drugs 6.5 5.2 5.4
Isoniazid 8.8 9.8 7.4
Rifampicin 1.7 1.2 3.1
Ethambutol 0.8 0.3 1.7
Pyrazinamid 1.7 1.2 3.1
Streptomycin 6.8 7.2 5.1
Isoniazid + rifampicin (MDR) 1.1 1.2 2.6
Victoria Romanus
0
100
200
300
400
500
600
700
800
ResistantCulture TB total
2003200220012000199919981997199619951994199319921991
0
2
4
6
8
10 Born abroad
Born in Sweden
2003200220012000199919981997199619951994199319921991

S W E D R E S 2 0 0 3 25
5.1. Survey of Activities at the County Level
AimA prerequisite for a successful work to minimize the emer-gence of antibiotic resistance is recognition of the problem and activities at the local level. In 2003 a nationwide survey was conducted to get an overview of the local organization, its resources and barriers in the Swedish counties.
MethodAll twenty-one county councils have been visited by a spe-cialist in infectious diseases and a pharmacist. Both of them have participated in meetings with all twenty-four regional STRAMA groups. Furthermore interviewed were held with the heads of the following units; communicable disease con-trol, infectious diseases, microbiological laboratories and infection control sections. In addition, they interviewed all directors of county councils, county council primary care units, and drug committees. In connection to this all phar-macists working in a STRAMA group was formed into a net-work.
The proposal for a “National Action Plan Against Antibiotic Resistance” has been used as the basis of discus-sions and interviews. The intention was to review the follow-ing factors, stated in the action plan, that are regarded the most significant in prevention of resistance development:● resources and methods of resistance surveillance● surveillance of antibiotic use● prevention of infectious diseases● improved diagnostic methods● improved antibiotic therapy● education and information
Preliminary resultsAlready at this point it is clear that this inventory will help to bring forward good examples of well-functioning local networks for prevention of resistance development. Concurrently it will point out obvious shortcomings in health and medical care preventing efficient STRAMA work:
● lack of resources for infection control: in eight of the counties the accessibility for doctors within the hygiene sector is only ten hours or less per week.
● lack of single rooms with private WC and shower facilities; in more than half of the Swedish county councils, less than 20 percent of the in-patients have access to such rooms.
● acute wards with shortages of beds with isolation care facilities; 90 percent of the county councils are reported to have such shortages.
● lack of competence in the area of medical care and infec-
tion control within nursing homes; half of the Swedish municipalities lack in hygiene competence at their nursing homes.
● lack of infectious disease specialists at certain hospitals; in six counties there are hospitals lacking such competence.
● resource related obstacles for continuous training of health care workers within the area of infectious diseases and antibiotic use
● in only seven of the twenty-one counties an automatic annual report on antibacterial resistance within the region is fed back to physicians.
The result of the inventory will also be returned to all local STRAMA groups and will constitute a basis on which to set a program for educational training days throughout 2004 and ahead.
Seth-Olof Bergquist
5.2. Studies on antibiotic use in out-patient care
1. A Study of Hygienic Routines and Infections in Child Day Care
AimThe primary aim of the study was to survey factors of poten-tial importance for spread of infections in child day-care e.g. hand washing, diaper changing, length of outdoor stay-ing and food hygiene. The second aim was to study how the staff handle infections and how information of infections are mediated to the child day-care centre (DCC). The study will be the basis for further interventions in DCC.
MethodDuring three weeks in the autumn 2003 a national survey at Swedish DCCs was performed. The DCCs were chosen at random and each DCC was visited by a study-nurse who interviewed the staff using a structured questionnaire.
Results338 DCCs participated. There were totally 14 172 children and 2 735 personnel in the DCCs. Almost 40% of the chil-dren were younger than three years old. 86% of the children stayed at the DCCs more than 15 hours a week. The DCC had between one and eight departments and 75% of the DCCs had 3 or less departments. 84% were public managed. The DCCs were on average open 55 hours a week. On aver-age there were 16 children in each department and 5 chil-dren/child care personnel. Data adjusted to be representa-tive for the whole country showed that 35% had the recom-
5. National and regional projects

26 S W E D R E S 2 0 0 3
mendations from the National Board of Health and Welfare about infections in child day care. For 55% of these, the rec-ommendations had changed the routines at the DCC.
The policies for hygiene routines are shown in Table 1 and the attitudes for the DCC in Table 2.
Table 1. Hygiene routines at the Child Day Care Centres
Do you have routines for: N=
Written routines
%
Routines but not written
%
No routines
%
Do not know
%
When children should stay at home? 338 53.1 43.2 3.7 0
Hand washing for the children? 338 10.2 82.0 7.7 0.1
Hand washing for the personnel? 338 0.9 50.7 47.6 0.8
Diaper changing? 333 3.0 74.4 22.2 0.4
For food hygiene control? 330 51.0 16.9 16.4 15.7
Table 2. Attitudes at the Child Day Care Centres
How is the attitude to: N =
Very permittive
%
Rather permit-
tive%
Neither permittive
nor rigorous
%
Rather rigorous
%
Very rigorous
%
Children being at the child day care centre with fever, runny nose and cough?
338 6.5 28.9 22.4 36.2 6.0
Children being at the child day care centre with diarrhoea?
338 2.3 17.5 24.8 43.7 11.7
Patricia Geli, Katarina Hedin
2. Self-Medication with Antibiotics in a Swedish General Population
AimTo investigate the issue of self-medication with antibiot-ics among the general public of Europe, the University of Groningen, the Netherlands, initiated a study in 19 European countries. The objective of the study was to assess the prevalence of self-medication and self-reported use of pre-scribed antibiotics, as well as storage of antibiotics in homes, sources for obtaining antibiotics, reasons for self-medica-tion and types of antibiotics used. The long-term aim of the project is to achieve an overview of antibiotic consumption including self medication in order to plan future interven-tions.
MethodA self-administered postal questionnaire was distributed to 1000 randomly selected subjects in four municipalities in Västmanland county, Sweden. The study population consist-ed of adults, aged 18 and above, who, when appropriate, were also asked to give information about their children less than
16 years of age. The participants were asked a series of stand-ardized questions regarding their use of antibiotics during the last 12 months, how these were obtained, if they had any antibiotics at home and if they would consider using antibi-otics without consulting a physician.
ResultsThe response rate totalled 70% after two reminders. Use of antibiotics during the last year was reported by 17% of the respondents. Four per cent stated that they at present had at least one antibiotic at home. In both cases penicillin V was the most frequently mentioned antibiotic. The antibiotics were in all cases, except three, reported to have been obtained with a prescription. In those three cases the antibiotics were leftovers from previous treatment or given by a friend or rela-tive. Eleven per cent said that they would consider self-medi-cating with antibiotics if possible. The most common reason stated for using antibiotics, as well as a reason for possible self-medication, was cystitis. From the findings in this report, it is concluded that persons from the study area in general only use antibiotics after consultation with a doctor.
Emma Svensson, Cecilia Stålsby Lundborg
3. Weekly Antibiotic Prescribing and Influenza Activity in Sweden; A Study throughout Five Influenza Seasons
Influenza is caused by a virus and can therefore not be cured with antibiotics. However, the disease often leads to bacte-rial complications that require treatment. Influenza may also be confused with bacterial respiratory infections, leading to unnecessary prescription of antibiotics.
This study is the first that examines influenza activity and antibiotic prescribing on a weekly basis for a whole country. The study includes the total dispensing of antibiotics used for respiratory tract infections, for all ages, in relation to verified influenza cases throughout 5 influenza seasons, 1997-2002. The peak of influenza activity occurred during the winter. In 4 out of the 5 monitored seasons it occurred in February-March. The dispensing of the selected antibiotics was rela-
0
200 000
400 000
600 000
800 000
1 000 000
1/021/011/001/991/980
50
100
150
200
250
300
350
400DDDInfluenza
Agg
rega
ted
DD
D/w
eek
Verif
ied
influ
enza
cas
es
Figure 5.1. Antibiotic dispensing presented as the aggregated amount of defined daily doses of the selected antibiotics for each calendar week, and the number of laboratory verified influenza cases, from calendar week No. 40, 1997 through calendar week No. 22, 2002, in Sweden.

S W E D R E S 2 0 0 3 27
tively stable throughout the years under study. Narrow-spec-trum penicillins were commonly used which is in accordance with national and local guidelines.
For all the included years a fluctuation in antibiotic dis-pensing over the year with 2 peaks during the wintertime was noted. The figure presents the variability in antibiotic dispensing for the 5 seasons, in relation to the number of verified influenza cases. There were no obvious differences in the total amount of antibiotics dispensed over the years that could be related to influenza activity, but a coincidental rela-tionship between the peaks of diagnosed influenza cases and the peaks of antibiotic utilization was indicated, especially for older age groups.
Frida Ganestam, Cecilia Stålsby Lundborg
5.3. Studies on antibiotic use in hospital care
1. The STRAMA Point Prevalence Study 2003 on Hospital Antibiotic Use
AimAlthough some hospitals in Sweden have carried out local studies on the indication for hospital antibiotic prescriptions, no nationwide data are available. The objective of this study was to introduce a system for frequent assessment of the use of antimicrobial agents against bacteria and fungi, in relation to diagnosis in hospital wards.
MethodA case record form was developed which included demo-graphic data as well as the amounts and indications for anti-microbial agents against bacteria and fungi. Data were col-lected at the hospital ward level through personal visits and separated for treatment of infection vs prophylaxis and com-munity vs hospital acquired infections. 19 pre-defined diag-nosis groups were used. Data were reported to STRAMA using a web-based reporting system. The study was per-formed during a two-week period in November 2003.
ResultsThe method was successfully introduced resulting in one of the largest surveys in Europe of antimicrobial use in hos-pital. 19 out of the 21 Swedish counties participated. Data was reported from 54 hospitals and included over 13 500 admitted patients. 31% of the admitted patients were treat-ed with antimicrobials. The distribution of therapy reasons were; community acquired infections in 52,4%, hospital acquired infections in 28,2% and prophylaxis in 19,4%. The total amount of antimicrobials for adults was 40 DDD/100 admitted patients and the most commonly used antimicrobi-als were cephalosporins (8.5 DDD/100 admitted patients), beta-lactamase resistant penicillins (7.6), fluoroquinolones (4.7) and penicillins with extended spectrum (3.4).
Among the pre-defined diagnosis groups the most reported in adults were pneumonia 16%, skin and soft tissue infections 13%, cystitis 12%, bone and joint infections 11%, pyelone-phritis 8% and infections in the lower gastrointestinal tract 7%.
The study describes sub-optimal prescription patterns for certain diagnoses. Analysis reveal over-use of cephalosporins particularly in community acquired pneumonia and of fluoroquinolones in urinary tract infections. The duration of perioperative prophylaxis was too long, 47% of all given prophylaxis were administered for more than one day.
Mats Erntell
2. Swedish Antibiotic Nursing home Trial (SANT)
AimThe aim of this study is to describe the treatment of infec-tious diseases in elderly in nursing homes and evaluate the effect of an intervention package aiming at improving the treatment with antibiotics in nursing homes.
MethodSeven nursing homes in the county of Norrbotten partici-pated in a pilot study. Baseline data, about diagnosis and prescribing pattern, were collected and the intervention was conducted. The intervention consisted of two group discus-sions of about 1.5 h each with nurses and physicians. The participants received the results from the diagnosis-prescrib-ing study done earlier and were asked to read it before the group sessions. The participating peers were considered to have the necessary knowledge, but there were two facilitators for discussion: one pharmacist and one physician. During the first session the pharmacist showed the results from the diagnosis/prescribing study and initiated discussions around specific problem areas such as the trimethoprim resistance in the county and the use of fluoroquinolones for cystitis (a non-recommended treatment in Sweden). The physician also introduced the hygiene aspects and all participants received a small brochure concerning this area. During the second session the physician informed about pneumonia, UTI and skin- and soft tissue infections in elderly and the pharmacist and the physician informed together with the participants about the recommended treatment for these infections. At the end of the discussion all participants received a short writ-ten guideline for antibiotic prescribing in elderly.
In mid-September the diagnosis-prescribing survey in the main study started. The nurses at 60 participating nursing homes in Sweden registered each infection that led to a consul-tation with a physician during three months. The nurses and the physicians at the nursing homes was also asked to fill in a knowledge and attitudes questionnaire. It included questions on management of infectious disease, antibiotics and also ficti-tious cases on infections. A nursing home questionnaire with questions concerning e.g. human resources, care burden and availability of physicians, has also been filled in by the nurses. The analysis of these baseline data is in its initial stage.

28 S W E D R E S 2 0 0 3
AST Antibiotic susceptibility testing
ATC The Anatomical Therapeutic Chemical classification system
CCDC Centre of Communicable Disease Control
DCC Day care-centre
DDD Defined daily dose
DST Drug susceptibility testing
EARSS European Antimicrobial Resistance Surveillance System
ESAC European Surveillance of Antimicrobial Consumption
ICU Intensive care unit
MDR Multidrug resistance
MIC Minimal Inhibitory concentration
MRSA Methicillin resistant Staphylococcus aureus
PFGE Pulsed field gel electrophoresis
PNSP Penicillin non-susceptible pneumococci. MIC ≥ 0.12 mg/L
PRP Penicillin non-susceptible pneumococci. MIC ≥ 0.5 mg/L
RSQC Resistance Surveillance and Quality Programme
SMI Swedish Institute for Infectious Disease Control
SRGA-M The Swedish Reference Group of Antibiotics- subcommittee on Methodology
STRAMA Swedish Strategic Programme for the Rational use of Antimicrobial Agents and Surveillence of Resistance
TB Tuberculosis
UTI Urinary tract infection
VRE Vancomycin resistant enterococci
Appendix 1 – Abbreviations
ResultsA selection of some of the preliminary results:● A total of 737 forms were returned. Expected number
was 770, based on the number of residents at the nursing homes and general frequency of infections.
● The average age was 86 years, (range between 48 and 101 and median 86 years).
● Infections in the urinary tract dominated (55% of treat-ments). Skin and soft tissue infections were responsible for 16%, respiratory infections for 14% and other infections for 15%.
● 78% of the registered infections were treated with antibi-otics.
● Fluoroquinolone treatment dominated (22%) followed by trimethoprim 16%. Pivmecillinam was prescribed in 14% of the cases and flucloxacillin in 12%.
Eva Olsson, Cecilia Stålsby Lundborg

S W E D R E S 2 0 0 3 29
Appendix 2 – Demographics and denominator data
Table App 2.1. Population by county and age group 31 December 2003.
Age (years)
County 0 - 6 7 - 19 20 - 59 60 - 79 > 80 Total
Blekinge 10 141 24 162 76 400 30 323 8 863 149 889
Dalarna 17 894 48 095 139 659 53 756 17 116 276 520
Gotland 3 730 10 300 29 618 10 660 3 227 57 535
Gävleborg 18 014 45 957 141 503 54 806 16 586 276 866
Halland 21 477 50 309 143 868 50 607 15 061 281 322
Jämtland 8 211 21 526 65 077 24 674 8 157 127 645
Jönköping 24 495 59 143 166 984 58 909 19 128 328 659
Kalmar 15 003 40 338 117 558 47 037 14 950 234 886
Kronoberg 12 423 29 964 91 878 32 813 10 370 177 448
Norrbotten 16 752 42 285 131 322 50 416 12 099 252 874
Skåne 84 112 188 961 611 875 205 053 62 696 1 152 697
Stockholm 153 463 293 247 1 055 735 275 570 82 857 1 860 872
Södermanland 18 488 45 282 132 873 49 340 14 397 260 380
Uppsala 22 777 51 738 167 143 45 449 13 388 300 495
Värmland 18 022 45 232 139 404 54 476 16 429 273 563
Västerbotten 17 602 43 917 135 561 46 296 12 580 255 956
Västernorrland 16 276 39 540 123 673 50 201 14 415 244 105
Västmanland 18 208 44 600 134 238 49 007 14 081 260 134
Västra Götaland 111 483 254 084 810 172 258 807 80 446 1 514 992
Örebro 19 594 45 930 142 384 49 724 16 303 273 935
Östergötland 29 263 70 252 219 127 73 466 22 789 414 897
All counties 657 428 1 494 862 4 776 052 1 571 390 475 938 8 975 670
Table App 2.2. Population of Sweden 1998-2003 (December 2003)
1998 1999 2000 2001 2002 2003
Population (x1000) 8 851 8 861 8 882 8 908 8 940 8 976
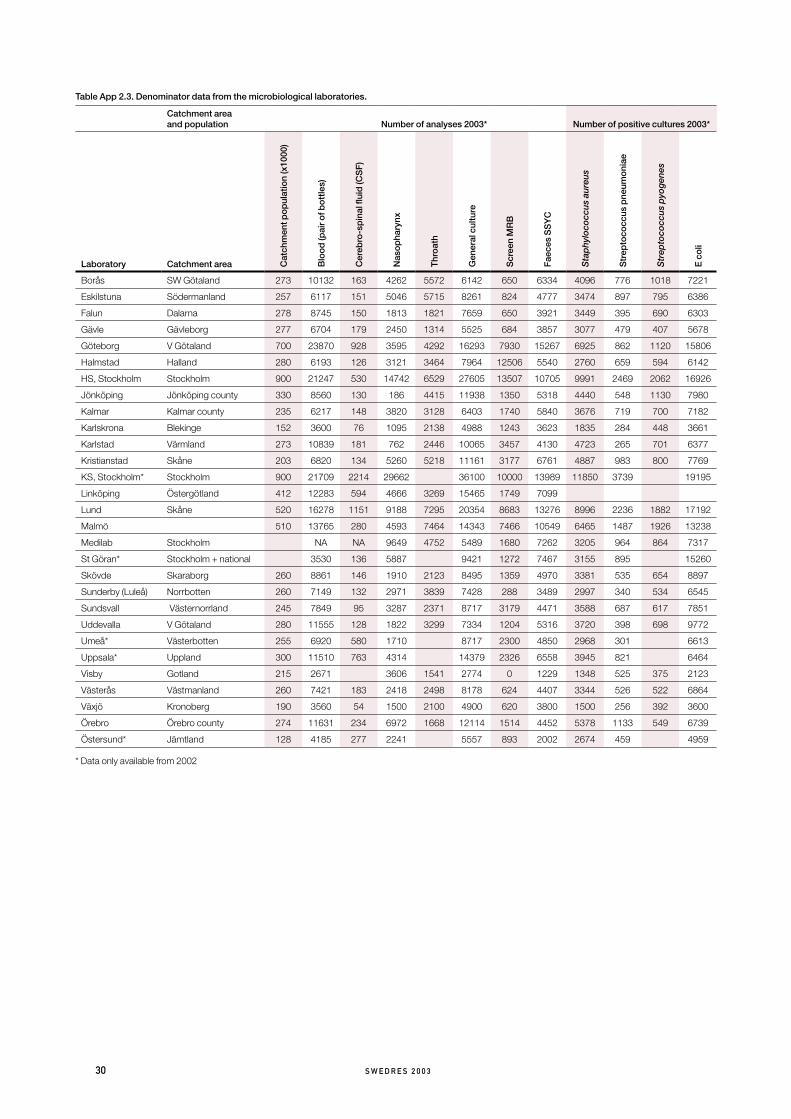
30 S W E D R E S 2 0 0 3
Table App 2.3. Denominator data from the microbiological laboratories.
Catchment area and population Number of analyses 2003* Number of positive cultures 2003*
Laboratory Catchment area Cat
chm
ent p
op
ulat
ion
(x10
00)
Blo
od
(pai
r of b
ott
les)
Cer
ebro
-sp
inal
flui
d (C
SF
)
Nas
op
hary
nx
Thr
oat
h
Gen
eral
cul
ture
Scr
een
MR
B
Fae
ces
SS
YC
Sta
phy
loco
ccus
aur
eus
Str
epto
cocc
us p
neum
oni
ae
Str
epto
cocc
us p
yog
enes
E c
oli
Borås SW Götaland 273 10132 163 4262 5572 6142 650 6334 4096 776 1018 7221
Eskilstuna Södermanland 257 6117 151 5046 5715 8261 824 4777 3474 897 795 6386
Falun Dalarna 278 8745 150 1813 1821 7659 650 3921 3449 395 690 6303
Gävle Gävleborg 277 6704 179 2450 1314 5525 684 3857 3077 479 407 5678
Göteborg V Götaland 700 23870 928 3595 4292 16293 7930 15267 6925 862 1120 15806
Halmstad Halland 280 6193 126 3121 3464 7964 12506 5540 2760 659 594 6142
HS, Stockholm Stockholm 900 21247 530 14742 6529 27605 13507 10705 9991 2469 2062 16926
Jönköping Jönköping county 330 8560 130 186 4415 11938 1350 5318 4440 548 1130 7980
Kalmar Kalmar county 235 6217 148 3820 3128 6403 1740 5840 3676 719 700 7182
Karlskrona Blekinge 152 3600 76 1095 2138 4988 1243 3623 1835 284 448 3661
Karlstad Värmland 273 10839 181 762 2446 10065 3457 4130 4723 265 701 6377
Kristianstad Skåne 203 6820 134 5260 5218 11161 3177 6761 4887 983 800 7769
KS, Stockholm* Stockholm 900 21709 2214 29662 36100 10000 13989 11850 3739 19195
Linköping Östergötland 412 12283 594 4666 3269 15465 1749 7099
Lund Skåne 520 16278 1151 9188 7295 20354 8683 13276 8996 2236 1882 17192
Malmö 510 13765 280 4593 7464 14343 7466 10549 6465 1487 1926 13238
Medilab Stockholm NA NA 9649 4752 5489 1680 7262 3205 964 864 7317
St Göran* Stockholm + national 3530 136 5887 9421 1272 7467 3155 895 15260
Skövde Skaraborg 260 8861 146 1910 2123 8495 1359 4970 3381 535 654 8897
Sunderby (Luleå) Norrbotten 260 7149 132 2971 3839 7428 288 3489 2997 340 534 6545
Sundsvall Västernorrland 245 7849 95 3287 2371 8717 3179 4471 3588 687 617 7851
Uddevalla V Götaland 280 11555 128 1822 3299 7334 1204 5316 3720 398 698 9772
Umeå* Västerbotten 255 6920 580 1710 8717 2300 4850 2968 301 6613
Uppsala* Uppland 300 11510 763 4314 14379 2326 6558 3945 821 6464
Visby Gotland 215 2671 3606 1541 2774 0 1229 1348 525 375 2123
Västerås Västmanland 260 7421 183 2418 2498 8178 624 4407 3344 526 522 6864
Växjö Kronoberg 190 3560 54 1500 2100 4900 620 3800 1500 256 392 3600
Örebro Örebro county 274 11631 234 6972 1668 12114 1514 4452 5378 1133 549 6739
Östersund* Jämtland 128 4185 277 2241 5557 893 2002 2674 459 4959
* Data only available from 2002

S W E D R E S 2 0 0 3 31
Appendix 3 – Surveillance of antibiotic consumption
The ATC classification system and defined daily doses (DDD)Since 1988 the Anatomical Therapeutic Chemical (ATC) classification, recommended by the WHO, is used in Sweden for national drug statistics.
To facilitate drug utilisation studies from a medical point of view, the concept of defined daily dose (DDD) is used as a unit of comparison in drug statistics. The DDD for a drug is established on the basis of the assumed average dose per day for the drug given to adults for its main indication. If possible the DDD is given as the amount of active substance. The DDDs are usually equal for all dosage forms of a preparation. The statistical data systems of Apoteket AB are upgraded yearly according to the recommendations made by the WHO Collaborating Centre for Drug Statistics methodology in Oslo, Norway.
The sales of medicines are presented as number of DDDs per 1000 inhabitants and day (DDD/1000/day), which give an estimate of the proportion of the population daily exposed to a particular drug. This figure is a rough estimate and should be read with caution.
Swedish national statistics on drug utilisationSince 1974 the National Corporation of Swedish Pharmacies (Apoteket AB) regularly produces sales statistics on medi-cines, for the country as a whole and for individual counties. The sales are registered as number of DDD, cash value and number of packages.
Out-patient care data includes information on the sales of medicines dispensed on prescription by all Swedish pharmacies by the prescription survey, running since 1974. The statistical material was until 1995 built of samples of dispensed prescriptions. From 1996 all prescriptions dispensed by pharmacies are included. From 1999, ApoDos (individually packed doses of drugs) is also included in the survey.
Recorded data include trade name, quantity, patient fee, total cost, sex and year of birth of the patient. Data can be expressed as DDD/1000/day or number of prescrip-tions/1000 inhabitants and packages.
Hospital care data includes medicines delivered by all hos-pital pharmacies to the hospital departments. The system also produces sales statistics for each hospital department and on national and county sales to hospitals. The sales are expressed as cash value, number of packages and number of defined daily doses. Since 2003 Apoteket AB has a new statistical sys-tem; Xplain. Through this system data since 2000 are avail-able. Data from previous years are no longer automatically accessable but can be obtained after specific request.

32 S W E D R E S 2 0 0 3
The agar dilution method is the reference method in Swedish susceptibility testing to which other methods are compared.
Clinical microbiology in Sweden has a long tradition of using paper disk diffusion antibiotic suseptibility testing (AST). This method is quantitative (diameter of inhibition zones measured in mm) but results are normally interpreted to give a qualitative “recommendation”: S (susceptible, sensi-tive), I (indeterminate; in previous nomenclature intermedi-ate) and R (resistant).
The disk diffusion method has been successfully stand-ardized by the Swedish clinical microbiology laboratories in collaboration with the SRGA-M. It is used as the routine method for susceptibility testing, and as a screening method which in some instances needs to be followed up by methods for gene detection (e.g. MRSA, VRE) and in other instances by MIC-determination using broth- or agar-dilution or with Etest (betalactam resistance in pneumococci, chromosomally mediated betalactam resistance in Haemophilus influenzae), and still in others by methods for enzyme detection (beta-lactamase detection in Haemophilus influenzae, Neisseria gon-orrhoeae and others).
Phenotypic methods (disk diffusion or MIC) are per-formed on one of two basic media for AST, PDM Antibiotic Sensitivity Medium from Biodisk, Sweden, and ISA (IsoSensitest Agar) from Oxoid Ltd, UK. For these two media and their corresponding antibiotic paper disks, interpretive criteria for SIR-categorization are provided by the SRGA-M. They are regularly updated and available through the web-site www.srga.org .
Internal and external quality assurance and quality con-trol of susceptibility testing is performed by each laboratory. Internal quality control includes using international QC strains regularly (every day or once a week) and analysing data in relation to national guidelines. Validation of susceptibility testing can also be done by histogram analysis of consecutive clinical isolates (see www.srga.org). External quality control is often done by participation in UK-NEQAS and/or other international programs, whereas quality assurance is one of the features of the Swedish ”100-strains or RSQC surveys”.
Appendix 4 – Antibiotic Susceptibility testing

S W E D R E S 2 0 0 3 33
Surveillance of pathogens regulated in the Communicable Disease ActStatutory notifications of certain communicable diseas-es are regulated in the Communicable Disease Act (SFS 1988:1472). With the exception of certain sexually transmit-ted infection (STI), both the clinician caring for a patient with a notifiable disease (clinical notification) and the labora-tory diagnosing the pathogen causing the disease (laboratory notification) are obliged to notify. This double notification significantly enhances the sensitivity of the surveillance sys-tem.
Notification shall be done within 24 hours, in duplicate to the County Medical Officer for Communicable Disease Control and to the Swedish Institute for Infectious Disease Control (SMI). Some diseases, mainly gastrointestinal infec-tions, should also be notified to the municipal environmental health office. Notifications, with the exception of STI, are done with full person identification. The clinical notification shall also include information on the likely source and route of infection, as well as other information of epidemiological importance.
Infections (or carriage) with four different antibiotic resist-ant pathogens are included in the list of notifiable diseases. Penicillin-resistant Streptococcus pneumoniae with Penicillin G MIC ≥ 0.5 mg/L (PRP) have been notifiable since 1996. Methicillin-resistant Staphylococcus aureus (MRSA) and vancomycin-resistant Enterococcus faecalis and Enterococcus faecium (VRE) have been notifiable since 2000.
The notifications are entered into the national computer-ized surveillance system, SmiNet. At the SMI, the clinical and laboratory notification for each case are merged and checked for errors. If data are missing, contact persons in the counties are requested to supplement the information. As an impor-tant complement to the notifications, the MRSA and PRP strains are sent to the SMI for epidemiological typing, using pulsed-field gel electrophoresis (PFGE) and other molecular epidemiological methods.
Tuberculosis (TB) is a notifiable disease, irrespective of drug resistance. On a voluntary basis the TB laboratories are reporting all drug-resistant isolates of Mycobacterium tubercu-losis and bovis to the SMI. All resistant isolates are sent to the SMI for epidemiological typing, using restriction fragment length polymorphism (RFLP).
The feed back of notification data is done monthly on the SMI Internet homepage (http://www.smittskyddsinstitutet.se) and yearly in “Communicable Diseases in Sweden – the Yearly Report of the Department of Epidemiology” and in this report. Data on drug-resistant TB is also annually pub-lished in “the Swedish Tuberculosis Index”.
Possible epidemiological links between patients from dif-ferent counties, as identified from the epidemiological typing
results and the notifications, are communicated to the per-sons in charge of the communicable disease control actions at the county level.
Voluntary laboratory reportingA system for individual, anonymised case reporting of certain very rare (or not yet identified) pathogen-resistance combi-nations is under construction. The pathogens are so selected that each finding should trigger some action (either confir-mation testing or infection control measures). To make the system exhaustive, the identification and reporting of these pathogens from the local laboratory computer systems to the SmiNet must be automated.
Swedish combined surveillance and QC program (RSQC surveys) further developed into ResNet 2002In 1994 a model for the concomitant surveillance of anti-microbial resistance and quality assurance of antimicrobial susceptibility testing was devised. In Sweden there are 29 microbiological laboratories, each covering a county (or part of county) of Sweden. The demographics of the laboratories, their geographic areas and their corresponding populations are well characterized. The antimicrobial susceptibility test-ing methods of the laboratories are standardized through the combined work of the SRGA-M (Swedish Reference Group of Antibiotics – subcommittee on Methodology) and the 29 laboratories (see also Appendix 4).
Each year the laboratories are asked to collect quantitative data (zone diameters) for defined antibiotics in 100 consecu-tive clinical isolates of a number of bacterial species. Since 1994, Streptococcus pneumoniae, Streptococcus pyogenes and Haemophilus influenzae have been part of this yearly program. On one or several occasions Escherichia coli, Enterococcus faecalis/E. faecium, Staphylococcus aureus, Pseudomonas aeru-ginosa, Klebsiella and Enterobacter have been part of these surveys. The number of antibiotics tested for each pathogen has varied between 4 and 6.
Laboratory specific zone diameter distributions were com-pared with SRGA-M reference distributions. The median, the width and the shape of the distributions were used for methodological discussions with the laboratories. Provided the individual distributions fitted the reference distributions, the SRGA recommended breakpoints were used to calculate the resistance frequencies of clinical isolates from the labora-tories. In a few selected cases adjusted breakpoints based on the deviation of individual distributions were used.
Development of ResNet Originally data were sent on paper (1994-1997) to be entered in spreadsheet (Excel)-format at the reference labora-tory. Between 1998 and 2001 the laboratories have sent their
Appendix 5 – National surveillance of antibiotic resistance

34 S W E D R E S 2 0 0 3
data in Excel-format for a central semi-automatic work-up with “on-paper” feedback in the mail and in yearly workshops on AST methodology and resistance development.
From 2002 a web-based newly developed software (ResNet) will receive the data from the laboratories and, following approval of registered data by one of two web administrators, instantly displayed it in the form of resistance frequencies on the geographical areas on maps of Sweden. Behind each resistance frequency the distribution of zone diameters or MICs together with the relevant demographic data are directly accessible. The software will accept both MIC and zone distributions of well-characterized data sets. The graphs presenting the data are designed to include all necessary information in order for the graphs to be used on their own (in presentations etc). Recently the software has been updated to display also the quantitative data of invasive isolates which form the Swedish part of the EARSS network (see below).
EARSS EARSS, funded by DG SANCO of the European Commission, is an international network of national surveil-lance systems, collecting comparable and validated antimi-crobial susceptibility data for public health action. EARSS performs on-going surveillance of antimicrobial susceptibil-ity of invasive infections of Staphylococcus aureus, Streptococcus pneumoniae, Escherichia coli, and Enterococcus faecalis/faecium and monitors variations in antimicrobial resistance over time and place.
Participation in EARSS was initially intended for member states of the European Union, also including Norway and Iceland, but in year 2000 six countries in eastern Europe were included, and by 2003 28 countries provide susceptibility data regularly. Information about EARSS, as well as a data-base yielding information about the susceptibility results for each country, year and pathogen, is available through a web-site (www.earss.rivm.nl).
Data collected by EARSS should be routinely generated quantitative data (MICs or inhibition zones), but the data presented are only in the format of susceptibility cathegories (SIR). External quality assurance exercises have been car-ried out by EARSS in cooperation with UK-NEQAS and the EARSS Advisory Board in 2000, 2001, 2002 and 2003. Results of those exercises showed that participating labora-tories were capable of delivering good quality susceptibility data, indicating that the overall resistance rates as monitored through EARSS are accurate.
Although not perfect, the EARSS network of networks seems to form a solid base for surveillance of resistance, yet could and should be extended and improved.
The participation from twentyone laboratories in Sweden is coordinated through the SMI, where electronic data collec-tion, validation and verification of specific resistance mecha-nisms is performed. Sweden, because of its well organised network of clinical laboratories and high quality of routine susceptibility testing, is so far the largest contributor of national data to EARSS.
Sentinel surveillance Susceptibility testing of gastrointestinal pathogens such as Salmonella, Shigella, Campylobacter jejuni/coli and Helicocobacter pylori is not performed on a regular basis by clinical laboratories. Existing data are mainly derived from special investigations by devoted researchers / laboratories.
In order to get a national overview of the situation, the ResNet software developed by SMI (see above) available also for data on these pathogens, as well as for national quantita-tive data on Neisseria gonorrhoeae and N. meningitidis per-formed by the reference centre in Örebro. Also collections of quantitative susceptibility data on other pathogens of general interest are suitable for entering and dispaying in ResNet.

S W E D R E S 2 0 0 3 35
Use of antibioticsCars O, Mölstad S, Melander A. Variation in antibiotic use in the European Union. The Lancet 2001;357:1851-53.
Mölstad S, Stålsby Lundborg C, Karlsson AK, Cars O. Antibiotic prescription rates vary markedly between 13 European countries. Scand J Infect Dis 2002;34:366-71.
Österlund A, Edén T, Olsson-Liljequist B, Haeggman S, Kahlmeter G and the Swed-ish study group on Fusidic acid-resistant Staphyloccous aureus. Clonal spread among Swedish children of a Staphylococcus aureus
strain resistant to fusidic acid. Scand J Infect Dis 2002;34:729-34.
Stålsby Lundborg C, Olsson E, Mölstad S and the Swedish Study Group on Antibiotic Use. Antibiotic prescribing in outpatients – A 1-week diagnosis–prescribing study in five counties in Sweden. Scand J Infect Dis 2002;34:442.48.
Andre M, Odenholt I, Schwan A and the Swedish Study Group on Antibiotic Use. Upper respiratory tract infections in general practice: diagnosis, antibiotic prescribing, duration of symptoms and use of diagnostic tests. Scand J Infect Dis. 2002;34:880-6.
Ganestam F, Stålsby Lundborg C, Grabowska K, Cars O, Linde A. Weekly Antibiotic Prescribing and Influenza Activity in Sweden: A Study throughout Five Influenza Seasons. Scand J Infect Dis 2003;35(11-12):836-42
André M, Mölstad S, Stålsby Lundborg C, Odenholt I and the Swedish Study Group on Antibiotic use. Management of urinary tract infections in primary care: A repeated 1-week diagnosis-prescribing study in five coun-ties in Sweden in the years 2000 and 2002. Accepted in Scand J Infect Dis 2003.
Andre M, Schwan Å, Odenholt I, Axels-son I, Eriksson M, Mölstad S, Runehagen A, Stålsby Lundborg C. The use of CRP in patients with respiratory tract infections in primary care in Sweden can be questioned. Scand J Infect Dis (accepted).
Svensson E, Haaijer-Ruskamp F, Stålsby Lundborg C. Self-medication with antibiot-ics in a Swedish general populaton. Scand J Infect Dis (accepted 2004).
Use of antifungalsÖsterlund A. Läkarkåren tappar kontrollen när antimykotika säljs receptfritt. Läkartid-ningen 2002;99:39.3868-70 (in Swedish).
Antimicrobial resistanceBerglund T, Unemo M, Olcén P, Giesecke J, Fredlund H. One year of Neisseria gonor-
rhoeae isolates in Sweden: the prevalence study of antibiotic susceptibility shows rela-tion to the geographic area of exposure. Int J STD & AIDS 2002;13:109-114.
Iversen A, Kuhn I, Rahman M, Frankli A, Burman LG, Olsson-Liljequist B, Torell E, Mollby R. Evidence for transmission between humans and the environment of a nosoco-mial strain of enterococcus faecium. Environ Microbiol. 2004;6(1):55-9.
Werngren J, Olsson-Liljequist B, Gezelius L, Hoffner SE. Antimicrobial susceptibility of Mycobactyerium marinum determined by E-test and agar dilution. Scand J Infect Dis 2001;33:585-588.
Henriques Normark B, Örtqvist Å, Kalin M, Olsson-Liljequist B, Hedlund J, Svenson SB, Källenius G. Changes in serotype distri-bution may hamper efficacy of pneumococ-cal conjugate vaccines in children. Scand J Infect Dis 2001;33:848-850.
Smyth RW, Kahlmeter G, Olsson Liljequist B, Hoffman B-M. Methods for identifying methicillin resistance in Staphylococcus
aureus. J Hosp Infect 2001;48:103-107.
Henriques Normark B, Kalin M, Örtqvist Å, Åkerlund T, Olsson-Liljequist B, Hedlund J, Svenson SB, Zhou J, Spratt B, Normark S, Källenius G. Dynamics of penicillin-sus-ceptible clones in invasive pneumococcal disease. J Infect Dis 2001;184:861-869.
Burman LG, Olsson-Liljequist B. A global perspective on bacterial infections, antibiotic usage and the antibiotic resistance problem. Chapter 1 in: Antibiotic Development and Resistance (Eds. Hughes D and Andersson DI. Taylor & Francis, London and New York) 2001:1-21.
Osterlund A, Eden T, Olsson-Liljequist B, Haeggman S, Kahlmeter G and the Swed-ish Study Group on Fusidic Acid-resistant Staphylococcus aureus. Clonal spread among Swedish children of a Staphylococ-
cus aureus strain resistant to fusidic acid. Scand J Infect Dis 2002;34:729-34.
Olsson-Liljequist B, Koljalg S, Karlsson I, Kronvall G. Calibration of fusidic acid disk diffusion susceptibility testing of Staphylo-
coccus aureus. APMIS 2002;110:690-696.
Torell E, Kuhn I, Olsson-Liljequist B, Hae-ggman S, Hoffman B-M, Lindahl C, Bur-man LG. Clonality among ampicillin resistant Enterococcus faecium isolates in Sweden and relation to ciprofloxacin resistance. Clin Microbiol Infect. 2003;9(10):1011-9.
Walther S, Erlandsson M, Burman LG, Cars O, Gill H, Hoffman M, Isaksson B, Kahlmeter G, Lindgren S, Nilsson LE, Olsson-Liljequist B, Hanberger H and the STRAMA-ICU study group. Antibiotic con-sumption, prescription practices and bacte-rial resistance in a cross section of Swedish intensive care units Acta Anaesth. Scand 2002;46:1075-81.
WorkshopsMedical Products Agency. Behandling av vulvovaginit. Information från Läkemedels-verket 2000;11(5) (in Swedish).
Management of pharyngotonsillitis (in Swedish). Information. Uppsala: Medical Products Agency 2001; 7-8:44-71.
Swedish Medical research Council. Treat-ment for acute inflammation of the middle ear. Consensus Statement. Available at: www.strama.se
Web siteswww.strama.se
www.srga.org
www.srga.org/resnet_sok.htm
http://dior.imt.liu.se/icustrama/
www.ua.ac.be/main.asp?c=*ESAC
Appendix 6 – Recent publications

The Swedish StrategicProgramme for the RationalUse of Antimicrobial Agents
STRAMA