2003-2004 SEARS Data Casebook
451
2003-2004 SEARS Data Casebook
Transcript of 2003-2004 SEARS Data Casebook

2003-2004 SEARS Data Casebook

Acknowledgements A project such as the Student Expenses and Resources Survey (SEARS) could not be accomplished without the cooperation of the postsecondary education segments within the State of California. SEARS data is of timely and great value to the higher education community. We would like to recognize certain individuals and organizations for their assistance in the development and the execution of the survey. Without their assistance this survey could not have been possible, especially in such a timely manner.
Willard Hom California Community Colleges Chancellor’s Office Matthew Yurdin University of California Office of the President Dr. Waddell Herron California State University Chancellor’s Office Beth Benedetti Association of Independent Colleges and Universities Mary Lindsay Private Career Colleges Representative
Produced by: California Student Aid Commission
Diana Fuentes-Michel, Executive Director Governmental and Public Affaris Division
Carlos Machado, Division Chief
Contributing Staff:
Liisa Rohmer Michael Barbour
Karen Vogel-Henderson

Table of Contents
i Note: Totals on weighted tables may vary due to rounding.
Background..............................................................................................................1
General Methodology Advisory Committee .............................................................................................................. 2 Questionnaire Design ............................................................................................................ 2
Survey Administration California Community Colleges ............................................................................................. 3 University of California........................................................................................................... 4 California State University ..................................................................................................... 4 Independent Colleges and Universities ................................................................................. 5 Private Career Colleges ........................................................................................................ 6
Data Handling 2003-04 Survey Response Rates.......................................................................................... 8
Looking Ahead: 2006-07.......................................................................... 8
Tables
The table for each topic listed below includes a copy of the survey question, weighted data (W), unweighted data (U), and means and medians (M), where appropriate. All data are presented by segment, course load and dependency status.
I. Student Demographic Information 1. Gender............................................................................................................................ 10
2. Age ................................................................................................................................. 13
3. Veteran Status................................................................................................................ 17
4. Student Marital Status .................................................................................................... 20
5. Students with Dependents.............................................................................................. 23
6. Ethnicity .......................................................................................................................... 26
7. California Residency Status ........................................................................................... 29
8. Living Arrangement ........................................................................................................32
9. Distance from Campus ................................................................................................... 35
10. Number of Roommates .................................................................................................. 39
11. Academic Year Enrollment............................................................................................. 42
Table of Contents
ii
12. Previous Educational Institution Attended...................................................................... 45
II. Parental Information 13. Parent(s)’ Education Level ........................................................................................... 48 Mother’s Education Level Father’s Education Level 14. Marital Status of Parents .............................................................................................. 53
15. Parent(s)’ Number of Dependents................................................................................ 56
16. Parent(s)’ Calendar Year Income ................................................................................. 59
III. Student Resources 17. Work and Volunteer Hours ........................................................................................... 67
17.1 Academic Year Work Hours 17.2 Academic Year Hourly Wages 17.3 Academic Year Volunteer Hours 17.3.1 Academic Year Internship Hours 17.4 Academic Year Work and Volunteer Pattern 17.5 Summer Work Hours 17.6 Summer Hourly Wages 17.7 Summer Volunteer Hours 17.8 Summer Internship Hours 18. Welfare Recipient Status ............................................................................................ 105
19. Student Calendar Year Income ................................................................................. 108
20. Student Summer Income ........................................................................................... 116
21. Student Academic Year Income (2003-2004) ............................................................ 124
IV. Paying for College 22. Students who Did or Did Not Apply for Financial Aid ................................................. 132
23. Total Academic Year Grant Award Amount................................................................ 135
24. Total Academic Year Borrowing ................................................................................. 143
25. Academic Year Borrowing from Family or Friends ..................................................... 151
26. Academic Year Borrowing from Credit Cards............................................................. 151
27. Student Cumulative Borrowing in Previous Academic Years ..................................... 166
28. Spouse’s Borrowing in Previous Academic Years...................................................... 166
29. Total Consumer Credit Card Debt .............................................................................. 179
30. Parent(s)’ Academic Year Contribution Towards College Expenses ......................... 187

Table of Contents
iii
31. Student Academic Year Contribution Towards College Expenses............................. 195
32. Use of the Hope and Lifetime Educational Tax Credits.............................................. 203
33. Reasons for not Claiming Hope and Lifetime Educational Tax Credits ...................... 203
34. Total Amount Saved for College................................................................................. 214
35. College Savings Methods........................................................................................... 222
V. Education & Living Expenses 36. Current Campus Housing Arrangement............................................................................ 229
37. On-Campus Housing Expenses ....................................................................................... 232
38. Monthly Food Expenses not Included in Housing Contract .............................................. 236
39. Monthly Off-Campus Housing Expenses .......................................................................... 240
40. Monthly Off-Campus Household Food Expenses............................................................. 248
41. Monthly Average Food Expenses for Meals Away from Home......................................... 256
42. Book Expenses................................................................................................................. 260
43. Supply Expenses.............................................................................................................. 268
44. Course Material Fees ....................................................................................................... 276
45. Computer Ownership........................................................................................................ 284
46. Cost of Computer.............................................................................................................. 287
47. Academic Year Computer Expenses................................................................................ 291
48. Monthly Average Transportation Expenses ...................................................................... 307
49. Travel Expenses Within California (to and from Parents) ................................................. 315
50. Travel Expenses Outside of California (to and from Parents)........................................... 315
51. Average Monthly Medical Expenses................................................................................. 330
52. Average Monthly Childcare Expenses .............................................................................. 334
53. Monthly Other Expenses .................................................................................................. 338
54. Monthly Recreation Expense............................................................................................ 346
VI. Vocational Information 55. Equipment Expenses (one time purchase) ....................................................................... 354
56. Vocational Education Enrollment...................................................................................... 358
57. Vocational Course of Study .............................................................................................. 361

1
Background The Student Expenses and Resources Survey (SEARS) is conducted every three years
by the California Student Aid Commission (Commission) to assess the financial
circumstances, attendance costs, and resources of California’s college students. This
survey is carried out in cooperation with California’s five segments of higher education:
the California Community Colleges (CCC), the University of California (UC), the
California State University (CSU), the Association of Independent California Colleges
and Universities (AICCU), and the private career colleges (PCC). The 2003-04 SEARS
is the twelfth survey conducted since 1972.
The Commission administered the 2003-04 survey to approximately 80,000 California
postsecondary students.
The data in this casebook reflect student responses to questions that are considered
“core” subjects and are essential to the Commission’s administration of the Cal Grant
programs. These “core” subjects include age, veteran status, student marital status,
parent marital status, number of dependents, and graduate status (required to determine
dependency), educational and living expenses, student and family financial resources ,
and housing arrangements while attending college.

2
General Methodology
Advisory Committee The Commission worked with an advisory committee (Committee) made up of representatives from each segment, the California Postsecondary Education Commission and other interested parties. The Committee ensured that the questions were relevant, clearly worded, and effective. The segments were also responsible for providing the Commission with datasets and additional contacts within their segment. Questionnaire Design The 2003-04 survey was more complex than prior versions. For the first time, the segments were given the option of a Web-based survey or a paper survey. In addition, the paper version was redesigned to enable automated data-capture. Each segment opting for an on-line survey also requested a paper questionnaire for those students without Internet access. All students were asked questions about their basic demographic characteristics, work and volunteer patterns, living expenses, and their resources for the current academic year. Students were also asked about their parents, including their education level, number of dependents, marital status and income. Each segment was invited to add additional questions. Web Version For the first time in its history, the SEARS was available on-line to students at the University of California, the California State University and the independent colleges and universities (ICU). The Commission worked with its consultant, Atlantis InfoTech, to design a user-friendly, efficient, and secure Web-based survey for each of the participating segments. Paper Version The basic design of the 2003-04 SEARS questionnaire did not change from prior years. Each segment was provided with its own version, , which was designed to be reverse-folded for pre-paid postage return. However, the 2003-04 questionnaires were designed to utilize automated data capture, which eliminated the need for manual data entry and reduced the possibility of errors. Also, “fill-in” style questions used in previous years to obtain specific information about age, distance to campus, work hours, and other topics, have been replaced with predetermined intervals, to facilitate data capture.

3
Survey Administration The administration of the SEARS varied by segment. A brief description for each segment is provided below. California Community Colleges The California Community College (CCC) system is composed of 109 colleges and serves over 2.9 million credit and non-credit students. By law, the CCC must admit any California resident with a high school diploma (or its equivalent), and those capable of benefiting from the instruction available. The primary mission of the CCC is to offer academic and vocational education at the lower division level for both recent high school graduates and those returning to school. The CCC also strives to advance California’s economic growth and global competitiveness through education, training, and services that contribute to continuous workforce improvement. The system’s other essential functions include: basic skills instruction, English as a second language instruction, adult non-credit instruction, and providing support services to help students succeed. Methodology To address recent declining response rates, the Commission and the California Community Colleges Chancellor’s Office administered the surveys to CCC students in-class . Each campus assisted in distributing, administering, and returning the completed surveys to the Commission. The Chancellor’s Office contracted with the Center for Student Success with the Research and Planners Group of the California Community Colleges to design the CCC survey. A three-stage process was used to determine college participation in the survey. First, the colleges in the CCC system were grouped into eight categories based on enrollment by size (small, small-medium, medium-large, and large) and by region (Northern, Central, Southern California and the Bay Area). Second, the colleges were screened for a student population with an ethnic distribution similar to the ethnic distribution of the total population and also ranked within each group by combined percent of basic skills and Board of Governors’ grant enrollment. Finally, one or two colleges were selected from each group to participate. The CCC had a 50.8 percent response rate for the 2003-04 SEARS. This high response rate was due, in large part, to the in-class administration of the survey.

4
University of California The University of California (UC) system has nine campuses (a 10th campus is scheduled to open in Merced in 2005) that serve more than 201,000 students. UC’s fundamental missions are teaching, research and public service. The UC educates students at all levels, from undergraduate to the most advanced graduate and first professional degree programs. Undergraduate programs are available to all eligible California high-school graduates and community college transfer students who qualify to attend UC. Some of the world's best research faculty and brightest students in hundreds of disciplines are found on UC campuses, national laboratories, medical centers and other research facilities around the state. Today, through its public service programs and industry partnerships, UC disseminates research results and translates scientific discoveries into practical knowledge and technological innovations that benefit California and the nation. Methodology The UC Office of the President (UCOP) specified the number and type of students included in the sample for this year’s SEARS. The undergraduate sample was stratified solely by campus, while the graduate sample was stratified by campus and type of degree program (academic or professional). At each campus, the Director of Institutional Research was responsible for drawing the random sample according to the UCOP's specifications. Both the Commission and the UCOP took steps to encourage students to participate in the survey. The Commission developed a postcard announcing the survey that students received a week before the survey Web site was launched. The UCOP sent an email announcement requesting students’ participation. Students were later provided with an official email invitation with an active hyperlink, unique identifier, and a password to access the survey Website. A paper questionnaire was sent to students who did not have a valid email address on file with the UC and to students who had not responded to the survey invitation or reminder (Graduate students did not have the option of a paper survey). Of the 20,000 UC students surveyed, 7,455 (37.3 percent) returned a completed questionnaire. California State University The California State University (CSU) is the largest (23 campuses), most diverse, and one of the most affordable public university systems in the country for students seeking a baccalaureate education or professional training as a teacher, nurse, social worker, or engineer. The CSU awards more than one-half of the bachelor's degrees and a third of the master's degrees granted in California each year. CSU enrollment totaled nearly 409,000 students in fall 2003. The mission of the California State University is: • To advance and extend knowledge, learning, and culture

5
• To provide opportunities for individuals to develop intellectually, personally, and professionally
• To prepare significant numbers of educated, responsible people to contribute to California's schools, economy, culture, and future
• To encourage and provide access to an excellent education to all who are eligible and prepared to participate in collegiate study
• To offer undergraduate and graduate instruction leading to bachelor's and higher degrees in liberal arts and sciences and in applied fields;
• To prepare students for an international, multi-cultural society • To provide public services that enrich the university and its communities. Methodology The CSU Office of the Chancellor developed the CSU survey. In past years, the sample was stratified by academic level (undergraduate or graduate), ethnicity, and load level. In an effort to increase both campus- and system-wide participation and response rates, the 2003-04 sample was stratified by campus only. The Commission notified students by electronic and regular mail. A postcard was sent to students a week before the survey Web site was launched, followed by an official email invitation with an active hyperlink, unique identifier, and a password. Non-respondents were sent a reminder email within ten days. A paper questionnaire was sent to students who did not have a valid email address on file, and to students who had not responded to the survey invitation or reminder. In addition, the Commission contacted nearly 7,000 students by telephone. More than 5,100 of the 20,744 sampled responded to the survey, resulting in a 24.7 percent response rate. Independent Colleges and Universities (ICU) The Association of Independent California Colleges and Universities (AICCU), which serves as the unified statewide voice of independent higher education in California, worked as a liaison between AICCU member schools and the Commission. Of the 81 member schools in the organization, 43 chose to participate. Methodology Institutional Research staff at each participating school was asked to provide a random sample of students comprised of at least ten percent of their enrollment or a minimum of 100 students. Sample sizes ranged from 30 students (total enrollment) at Phillips Graduate Institute to 3,000 students at the University of Southern California. The total sample size for the ICU was 16,856 students. The Commission developed a school-specific timeline for participating ICU schools. Students received an official email invitation with an active hyperlink, unique identifier, and a password. Non-respondents were sent a reminder email within ten days.

6
A paper questionnaire was sent to students who did not have a valid email address on file, and to students who had not responded to the survey invitation or reminder. In addition, the Commission contacted nearly 7,000 students by telephone. The overall response rate for the ICU was 27.9 percent. Participating Institutions Alliant University Azusa Pacific University California Baptist University California College of the Arts California Institute of the Arts California Lutheran University Chapman University Claremont Graduate University Claremont McKenna College Concordia Dominican University of California Fresno Pacific University Harvey Mudd College Hope International University Keck Graduate Institute Loma Linda University Loyola Marymount University Marymount College Mount St. Mary's College National University Notre Dame de Namur Occidental College
Pacific Union College Pepperdine University Phillips Graduate Institute Point Loma Nazarene University Pomona College Saint Mary's College of California Samuel Merritt College San Francisco Conservatory of Music Santa Clara University Scripps College Simpson College The Master's College University of La Verne University of Redlands University of San Diego University of San Francisco University of Southern California Vanguard University Western Univ of Health Sciences Westmont College Woodbury University
Private Career Colleges (PCC) Survey administration for the PCCs required a different approach. In prior years, the Commission worked with the California Association of Private Postsecondary Schools (CAPPS) to select participating institutions that were also Title IV eligible, as defined in 34 CFR Parts 600 and 668. For 2003-04, the Commission sent surveys to all 114 Cal Grant eligible PCCs, requesting their participation. Eighty-seven schools (76.3 percent) administered the survey during class and returned completed questionnaires to the Commission. Sample sizes ranged from ten to 551 students, which represented anywhere from four to 100 percent of the school’s enrollment. The overall 2003-04 PCC response rate was 40.2 percent.

7
Participating Schools Academy Pacific Business & Travel American Career College 1 American Intercontinental University Argosy University, Orange County Argosy University, San Francisco Brooks College Brooks Institute of Photography Bryan College of Court Reporting Bryman College, El Monte Bryman College, Gardena Bryman College, Reseda Bryman College, San Francisco California School of Court Reporting-
Riverside California College of Technology California School Of Culinary Arts California Design College CEI, Carson CEI, Irwindale CEI, Lake Forest CEI, Pomona Central Coast College College of Oceaneering Concorde Career Instute, North
Hollywood Concorde Career Instute, San
Bernardino Design Institute of San Diego Devry Institute of Technology-Pomona Empire College Everest College Fashion Careers of California Fashion Institute of Design And
Merchandizing (all) Fresno Institute of Technology Galen College of Medical & Dental
Assisting Glendale Career College Golden State Business College Institute for Business & Technology
Institute of Computer Technology ITT Technical Institute (all) Je Boutique College of Beauty L.A.County College Nursing & Allied
Health Los Angeles ORT Technical Institute Maric College Maric College of Medical Careers Modern Technology College Mount Sierra College MTI College of Business & Technology Musicians Institute Pima Medical Institute Platt College, San Diego San Joaquin Valley College, Bakersfield San Joaquin Valley College, Fresno Santa Barbara Business College,
Bakersfield Santa Barbara Business College, Santa
Maria Silicon Valley College, Emeryville Silicon Valley College, Fremont Silicon Valley College, Walnut Creek Southern California Institute of
Technology The Art Institute of California, Los
Angeles The Art Institute of California, Orange
County The Art Institute of California, San Diego The Art Institutes International Universal Technical Institute University of Phoenix Western Career College (all) Westwood College of Aviation Westwood College of Technology,
Anaheim Westwood College of Technology, Los
Angeles

8
Data Handling Once all Web based data were downloaded and paper survey data input, Commission staff began data verification and normalization. Each segment and data-capture method was processed differently to produce five segmental datasets, which were then checked for duplicate responses. In instances where a student began or completed a Web and a paper survey the most complete record was retained. Finally, incomplete surveys were reviewed and kept or deleted on a case-by-case basis.
2003-04 SEARS Response Rates
Sample Size Useable Returns
Response Rate
California Community Colleges 12,550 6,377 50.8%University of California 20, 000 7,455 37.3%California State University 20,744 5,130 24.7%Independent Colleges & Universities 16,856 4,702 27.9%Private Career Colleges 9,784 3,934 40.2%
All 79,934 27,598 34.5%
Looking Ahead: 2006-07 The Commission is looking ahead to the 2006-07 Student Expenses and Resources Survey. On-going discussions about the 2003-04 survey process will identify areas of improvement in survey design and administration.


Question for Tables: W-1 and U-1
Your gender: 0 Female 1 Male
NOTE: The UC and CSU segments provided this data element electronically.
10 2003-04 SEARS

TABLE W-1: GENDER BY SEGMENT, COURSE LOAD, AND DEPENDENCY STATUS
Female MaleDependent Independent All Dependent Independent All# % # % # % # % # % # % # %
CCC Part-time 216,000 21.9 390,875 39.6 606,875 61.5 175,232 17.8 204,914 20.8 380,146 38.5 987,021 100 Full-time 152,377 35.5 91,523 21.3 243,900 56.8 125,089 29.2 60,130 14.0 185,219 43.2 429,119 100 All 368,377 26.0 482,397 34.1 850,775 60.1 300,321 21.2 265,044 18.7 565,365 39.9 1,416,140 100
UC Part-time 16,479 53.9 2,514 8.2 18,993 62.2 10,353 33.9 1,213 4.0 11,566 37.8 30,560 100 Full-time 69,297 54.1 8,653 6.8 77,950 60.9 44,756 35.0 5,283 4.1 50,039 39.1 127,989 100 All 85,776 54.1 11,168 7.0 96,944 61.1 55,109 34.8 6,496 4.1 61,605 38.9 158,548 100
CSU Part-time 13,168 20.3 32,867 50.5 46,035 70.8 734 1.1 18,254 28.1 18,988 29.2 65,023 100 Full-time 98,683 41.1 50,609 21.1 149,292 62.2 57,848 24.1 33,058 13.8 90,906 37.8 240,198 100 All 111,851 36.6 83,476 27.3 195,327 64.0 58,582 19.2 51,312 16.8 109,894 36.0 305,221 100
ICU Part-time 3,177 20.8 6,918 45.4 10,095 66.2 2,157 14.2 2,992 19.6 5,149 33.8 15,244 100 Full-time 61,777 56.5 11,568 10.6 73,345 67.1 30,011 27.4 5,994 5.5 36,005 32.9 109,350 100 All 64,954 52.1 18,486 14.8 83,440 67.0 32,168 25.8 8,986 7.2 41,154 33.0 124,595 100
PCC Part-time 3,579 12.5 14,016 49.0 17,595 61.6 2,931 10.3 8,060 28.2 10,991 38.4 28,586 100 Full-time 13,898 18.4 30,660 40.5 44,558 58.9 10,093 13.3 20,971 27.7 31,064 41.1 75,622 100 All 17,477 16.8 44,676 42.9 62,153 59.6 13,024 12.5 29,031 27.9 42,055 40.4 104,208 100
ALL Part-time 252,404 22.4 447,190 39.7 699,594 62.1 191,407 17.0 235,433 20.9 426,840 37.9 1,126,434 100 Full-time 396,032 40.3 193,013 19.6 589,045 60.0 267,797 27.3 125,435 12.8 393,233 40.0 982,278 100 All 648,436 30.8 640,203 30.4 1,288,639 61.1 459,204 21.8 360,869 17.1 820,073 38.9 2,108,712 100
Total
Source: California Student Aid Commission 11 2003-04 SEARS

TABLE U-1: GENDER BY SEGMENT, COURSE LOAD, AND DEPENDENCY STATUS
Female MaleDependent Independent All Dependent Independent All# % # % # % # % # % # % # %
CCC Part-time 604 21.9 1,093 39.6 1,697 61.5 490 17.8 573 20.8 1,063 38.5 2,760 100 Full-time 1,262 35.5 758 21.3 2,020 56.8 1,036 29.2 498 14.0 1,534 43.2 3,554 100 All 1,866 29.6 1,851 29.3 3,717 58.9 1,526 24.2 1,071 17.0 2,597 41.1 6,314 100
UC Part-time 254 52.5 43 8.9 297 61.4 164 33.9 23 4.8 187 38.6 484 100 Full-time 1,817 53.9 223 6.6 2,040 60.6 1,190 35.3 139 4.1 1,329 39.4 3,369 100 All 2,071 53.8 266 6.9 2,337 60.7 1,354 35.1 162 4.2 1,516 39.3 3,853 100
CSU Part-time 147 17.6 405 48.6 552 66.2 78 9.4 204 24.5 282 33.8 834 100 Full-time 1,214 38.9 713 22.9 1,927 61.8 754 24.2 439 14.1 1,193 38.2 3,120 100 All 1,361 34.4 1,118 28.3 2,479 62.7 832 21.0 643 16.3 1,475 37.3 3,954 100
ICU Part-time 107 33.6 110 34.6 217 68.2 48 15.1 53 16.7 101 31.8 318 100 Full-time 1,377 57.1 236 9.8 1,613 66.9 674 28.0 123 5.1 797 33.1 2,410 100 All 1,484 54.4 346 12.7 1,830 67.1 722 26.5 176 6.5 898 32.9 2,728 100
PCC Part-time 161 17.8 358 39.6 519 57.3 136 15.0 250 27.6 386 42.7 905 100 Full-time 612 21.2 1,060 36.8 1,672 58.0 491 17.0 718 24.9 1,209 42.0 2,881 100 All 773 20.4 1,418 37.5 2,191 57.9 627 16.6 968 25.6 1,595 42.1 3,786 100
ALL Part-time 1,273 24.0 2,009 37.9 3,282 61.9 916 17.3 1,103 20.8 2,019 38.1 5,301 100 Full-time 6,282 41.0 2,990 19.5 9,272 60.5 4,145 27.0 1,917 12.5 6,062 39.5 15,334 100 All 7,555 36.6 4,999 24.2 12,554 60.8 5,061 24.5 3,020 14.6 8,081 39.2 20,635 100
Total
Source: California Student Aid Commission 12 2003-04 SEARS

Questions for Tables: W-2, U-2, and M-2 How old were you on January 1, 2004?
00 18 or younger 04 22 08 30 through 34 01 19 05 23 09 35 through 39 02 20 06 24 10 40 or older 03 21 07 25 through 29
NOTE: The UC and CSU segments provided this data element electronically.
13 2003-04 SEARS

TABLE W-2: AGE BY SEGMENT, COURSE LOAD, AND DEPENDENCY STATUS
DEPENDENT UNDERGRADUATES18 or Less 19 20 21 22-24 25-29 30-39 40+ Total# % # % # % # % # % # % # % # % # %
CCC Part-time 115,510 29.6 80,106 20.5 69,735 17.9 61,510 15.8 63,298 16.2 390,159 100 Full-time 80,535 29.0 93,334 33.6 53,006 19.1 29,703 10.7 20,888 7.5 277,466 100 All 196,045 29.4 173,440 26.0 122,741 18.4 91,213 13.7 84,187 12.6 667,626 100
UC Part-time 9,214 34.3 5,266 19.6 4,563 17.0 4,269 15.9 3,519 13.1 26,831 100 Full-time 24,830 21.7 26,436 23.2 24,777 21.7 21,527 18.9 16,593 14.5 114,163 100 All 34,044 24.1 31,702 22.5 29,340 20.8 25,796 18.3 20,112 14.3 140,994 100
CSU Part-time 1,169 5.7 1,251 6.1 3,277 16.0 3,029 14.8 11,775 57.4 20,502 100 Full-time 26,082 16.7 26,321 16.8 28,237 18.0 29,581 18.9 46,310 29.6 By definition, a dependent 156,531 100 All 27,251 15.4 27,572 15.6 31,514 17.8 32,610 18.4 58,085 32.8 student is less than 25 177,033 100
ICU Part-time 980 18.3 1,036 19.3 793 14.8 1,441 26.9 1,105 20.6 years of age. 5,356 100 Full-time 15,250 16.7 23,975 26.2 24,070 26.3 18,486 20.2 9,674 10.6 91,455 100 All 16,230 16.8 25,011 25.8 24,863 25.7 19,927 20.6 10,779 11.1 96,811 100
PCC Part-time 1,771 27.3 1,352 20.9 1,216 18.8 573 8.8 1,569 24.2 6,481 100 Full-time 5,957 24.9 5,770 24.1 4,605 19.2 3,045 12.7 4,572 19.1 23,949 100 All 7,728 25.4 7,121 23.4 5,821 19.1 3,618 11.9 6,141 20.2 30,429 100
ALL Part-time 128,645 28.6 89,011 19.8 79,584 17.7 70,822 15.8 81,267 18.1 449,328 100 Full-time 152,654 23.0 175,836 26.5 134,695 20.3 102,342 15.4 98,037 14.8 663,564 100 All 281,299 25.3 264,846 23.8 214,279 19.3 173,163 15.6 179,304 16.1 1,112,892 100
INDEPENDENT UNDERGRADUATES18 or Less 19 20 21 22-24 25-29 30-39 40+ Total# % # % # % # % # % # % # % # % # %
CCC Part-time 16,808 2.8 19,669 3.3 20,384 3.4 16,093 2.7 75,815 12.7 122,305 20.6 154,490 26.0 169,153 28.4 594,716 100 Full-time 11,833 7.8 12,557 8.2 12,678 8.3 9,176 6.0 26,563 17.4 30,186 19.8 29,582 19.4 19,802 13.0 152,377 100 All 28,641 3.8 32,226 4.3 33,062 4.4 25,269 3.4 102,378 13.7 152,490 20.4 184,072 24.6 188,954 25.3 747,093 100
UC Part-time 356 9.6 189 5.1 281 7.5 248 6.6 1,156 31.0 867 23.3 403 10.8 227 6.1 3,727 100 Full-time 934 6.7 747 5.3 801 5.7 1,248 8.9 3,782 27.1 3,634 26.0 2,195 15.7 631 4.5 13,973 100 All 1,290 7.3 936 5.3 1,082 6.1 1,496 8.5 4,938 27.9 4,501 25.4 2,598 14.7 859 4.9 17,700 100
CSU Part-time 34 0.1 42 0.1 248 0.5 459 0.9 7,676 15.1 17,021 33.4 13,619 26.7 11,863 23.3 50,962 100 Full-time 1,567 1.9 2,526 3.0 2,910 3.5 3,040 3.6 23,632 28.2 25,310 30.3 13,368 16.0 11,313 13.5 83,666 100 All 1,602 1.2 2,569 1.9 3,158 2.3 3,499 2.6 31,308 23.3 42,331 31.4 26,987 20.0 23,176 17.2 134,628 100
ICU Part-time 22 0.2 96 1.0 88 0.9 281 2.8 849 8.5 1,692 17.0 3,253 32.7 3,675 36.9 9,955 100 Full-time 693 3.9 819 4.6 1,282 7.2 779 4.4 3,351 18.9 5,665 32.0 2,368 13.4 2,742 15.5 17,698 100 All 714 2.6 914 3.3 1,370 5.0 1,060 3.8 4,200 15.2 7,356 26.6 5,621 20.3 6,417 23.2 27,653 100
PCC Part-time 401 1.8 640 2.9 323 1.5 429 1.9 3,123 14.2 6,266 28.4 5,871 26.6 5,005 22.7 22,057 100 Full-time 885 1.7 1,476 2.9 2,123 4.1 1,671 3.2 8,589 16.6 13,588 26.3 13,520 26.2 9,737 18.9 51,589 100 All 1,286 1.7 2,116 2.9 2,446 3.3 2,101 2.9 11,713 15.9 19,854 27.0 19,391 26.3 14,742 20.0 73,646 100
ALL Part-time 17,621 2.6 20,635 3.0 21,324 3.1 17,510 2.6 88,619 13.0 148,150 21.7 177,636 26.1 189,922 27.9 681,417 100 Full-time 15,912 5.0 18,125 5.7 19,794 6.2 15,915 5.0 65,918 20.6 78,382 24.5 61,033 19.1 44,225 13.9 319,304 100 All 33,532 3.4 38,761 3.9 41,117 4.1 33,424 3.3 154,537 15.4 226,533 22.6 238,669 23.8 234,148 23.4 1,000,721 100
ALL UNDERGRADUATESPart-time 146,266 12.9 109,646 9.7 100,908 8.9 88,331 7.8 169,886 15.0 148,150 13.1 177,636 15.7 189,922 16.8 1,130,746 100 Full-time 168,566 17.2 193,961 19.7 154,489 15.7 118,256 12.0 163,955 16.7 78,382 8.0 61,033 6.2 44,225 4.5 982,867 100 All 314,831 14.9 303,607 14.4 255,397 12.1 206,588 9.8 333,841 15.8 226,533 10.7 238,669 11.3 234,148 11.1 2,113,613 100
Source: California Student Aid Commission 14 2003-04 SEARS
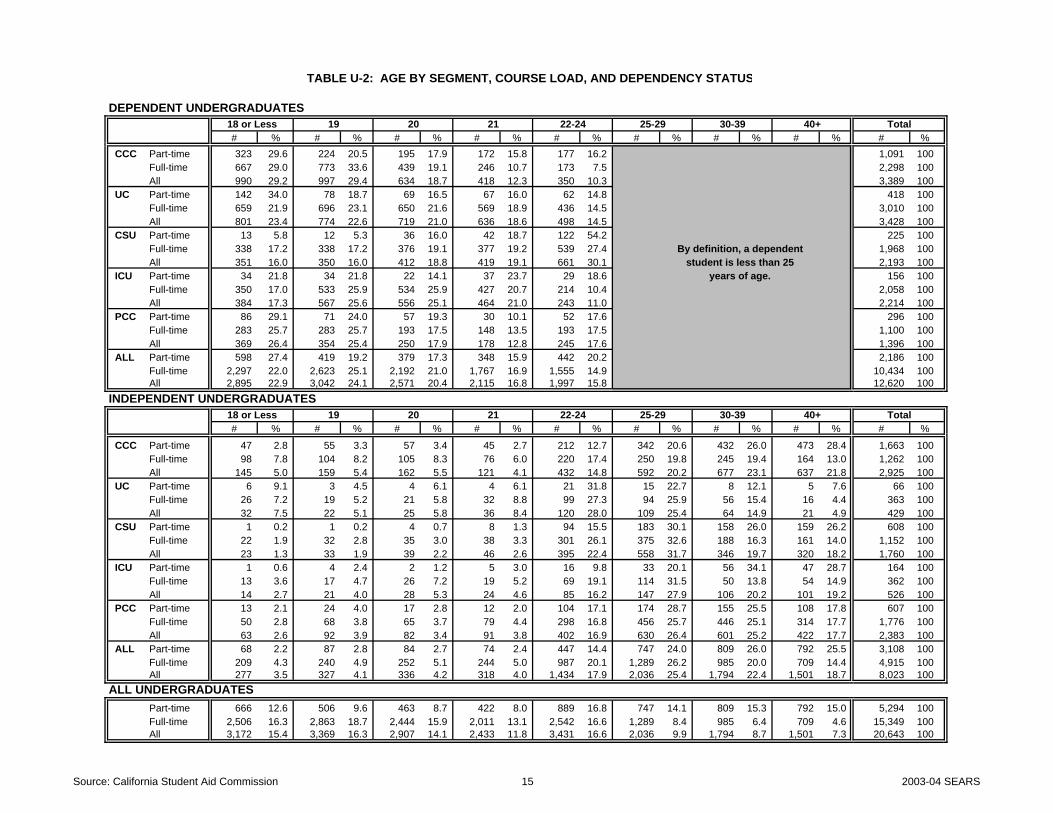
TABLE U-2: AGE BY SEGMENT, COURSE LOAD, AND DEPENDENCY STATUS
DEPENDENT UNDERGRADUATES18 or Less 19 20 21 22-24 25-29 30-39 40+ Total# % # % # % # % # % # % # % # % # %
CCC Part-time 323 29.6 224 20.5 195 17.9 172 15.8 177 16.2 1,091 100 Full-time 667 29.0 773 33.6 439 19.1 246 10.7 173 7.5 2,298 100 All 990 29.2 997 29.4 634 18.7 418 12.3 350 10.3 3,389 100
UC Part-time 142 34.0 78 18.7 69 16.5 67 16.0 62 14.8 418 100 Full-time 659 21.9 696 23.1 650 21.6 569 18.9 436 14.5 3,010 100 All 801 23.4 774 22.6 719 21.0 636 18.6 498 14.5 3,428 100
CSU Part-time 13 5.8 12 5.3 36 16.0 42 18.7 122 54.2 225 100 Full-time 338 17.2 338 17.2 376 19.1 377 19.2 539 27.4 By definition, a dependent 1,968 100 All 351 16.0 350 16.0 412 18.8 419 19.1 661 30.1 student is less than 25 2,193 100
ICU Part-time 34 21.8 34 21.8 22 14.1 37 23.7 29 18.6 years of age. 156 100 Full-time 350 17.0 533 25.9 534 25.9 427 20.7 214 10.4 2,058 100 All 384 17.3 567 25.6 556 25.1 464 21.0 243 11.0 2,214 100
PCC Part-time 86 29.1 71 24.0 57 19.3 30 10.1 52 17.6 296 100 Full-time 283 25.7 283 25.7 193 17.5 148 13.5 193 17.5 1,100 100 All 369 26.4 354 25.4 250 17.9 178 12.8 245 17.6 1,396 100
ALL Part-time 598 27.4 419 19.2 379 17.3 348 15.9 442 20.2 2,186 100 Full-time 2,297 22.0 2,623 25.1 2,192 21.0 1,767 16.9 1,555 14.9 10,434 100 All 2,895 22.9 3,042 24.1 2,571 20.4 2,115 16.8 1,997 15.8 12,620 100
INDEPENDENT UNDERGRADUATES18 or Less 19 20 21 22-24 25-29 30-39 40+ Total# % # % # % # % # % # % # % # % # %
CCC Part-time 47 2.8 55 3.3 57 3.4 45 2.7 212 12.7 342 20.6 432 26.0 473 28.4 1,663 100 Full-time 98 7.8 104 8.2 105 8.3 76 6.0 220 17.4 250 19.8 245 19.4 164 13.0 1,262 100 All 145 5.0 159 5.4 162 5.5 121 4.1 432 14.8 592 20.2 677 23.1 637 21.8 2,925 100
UC Part-time 6 9.1 3 4.5 4 6.1 4 6.1 21 31.8 15 22.7 8 12.1 5 7.6 66 100 Full-time 26 7.2 19 5.2 21 5.8 32 8.8 99 27.3 94 25.9 56 15.4 16 4.4 363 100 All 32 7.5 22 5.1 25 5.8 36 8.4 120 28.0 109 25.4 64 14.9 21 4.9 429 100
CSU Part-time 1 0.2 1 0.2 4 0.7 8 1.3 94 15.5 183 30.1 158 26.0 159 26.2 608 100 Full-time 22 1.9 32 2.8 35 3.0 38 3.3 301 26.1 375 32.6 188 16.3 161 14.0 1,152 100 All 23 1.3 33 1.9 39 2.2 46 2.6 395 22.4 558 31.7 346 19.7 320 18.2 1,760 100
ICU Part-time 1 0.6 4 2.4 2 1.2 5 3.0 16 9.8 33 20.1 56 34.1 47 28.7 164 100 Full-time 13 3.6 17 4.7 26 7.2 19 5.2 69 19.1 114 31.5 50 13.8 54 14.9 362 100 All 14 2.7 21 4.0 28 5.3 24 4.6 85 16.2 147 27.9 106 20.2 101 19.2 526 100
PCC Part-time 13 2.1 24 4.0 17 2.8 12 2.0 104 17.1 174 28.7 155 25.5 108 17.8 607 100 Full-time 50 2.8 68 3.8 65 3.7 79 4.4 298 16.8 456 25.7 446 25.1 314 17.7 1,776 100 All 63 2.6 92 3.9 82 3.4 91 3.8 402 16.9 630 26.4 601 25.2 422 17.7 2,383 100
ALL Part-time 68 2.2 87 2.8 84 2.7 74 2.4 447 14.4 747 24.0 809 26.0 792 25.5 3,108 100 Full-time 209 4.3 240 4.9 252 5.1 244 5.0 987 20.1 1,289 26.2 985 20.0 709 14.4 4,915 100 All 277 3.5 327 4.1 336 4.2 318 4.0 1,434 17.9 2,036 25.4 1,794 22.4 1,501 18.7 8,023 100
ALL UNDERGRADUATESPart-time 666 12.6 506 9.6 463 8.7 422 8.0 889 16.8 747 14.1 809 15.3 792 15.0 5,294 100 Full-time 2,506 16.3 2,863 18.7 2,444 15.9 2,011 13.1 2,542 16.6 1,289 8.4 985 6.4 709 4.6 15,349 100 All 3,172 15.4 3,369 16.3 2,907 14.1 2,433 11.8 3,431 16.6 2,036 9.9 1,794 8.7 1,501 7.3 20,643 100
Source: California Student Aid Commission 15 2003-04 SEARS

DEPENDENT UNDERGRADUATES INDEPENDENT UNDERGRADUATES ALL UNDERGRADUATES
CCC Part-time 1,091 20 19 CCC Part-time 1,663 32 31 CCC Part-time 2,754 27 23 Full-time 2,298 19 19 Full-time 1,262 28 25 Full-time 3,560 22 19 All 3,389 20 19 All 2,925 30 29 All 6,314 25 21
UC Part-time 418 20 19 UC Part-time 66 26 24 UC Part-time 484 21 19 Full-time 3,010 20 19 Full-time 363 26 24 Full-time 3,373 21 19 All 3,428 20 19 All 429 26 24 All 3,857 21 19
CSU Part-time 225 22 21 CSU Part-time 608 33 29 CSU Part-time 833 30 26 Full-time 1,968 20 20 Full-time 1,152 29 26 Full-time 3,120 24 21
All 2,193 21 20 All 1,760 30 27 All 3,953 25 22 ICU Part-time 156 20 20 ICU Part-time 164 34 35 ICU Part-time 320 27 27 Full-time 2,058 20 19 Full-time 362 28 26 Full-time 2,420 21 20
All 2,214 20 19 All 526 30 28 All 2,740 22 20 PCC Part-time 296 20 19 PCC Part-time 607 31 29 PCC Part-time 903 27 26 Full-time 1,100 20 19 Full-time 1,776 30 28 Full-time 2,876 26 24
All 1,396 20 19 All 2,383 30 28 All 3,779 26 25 ALL Part-time 2,186 20 19 ALL Part-time 3,108 32 25 ALL Part-time 5,294 27 23
Full-time 10,434 20 19 Full-time 4,915 29 26 Full-time 15,349 23 20 All 12,620 20 19 All 8,023 30 28 All 20,643 24 21
TABLE M-2: MEAN AND MEDIAN AGE BY SEGMENT, COURSE LOAD, AND DEPENDENCY STATUS
Number Mean Median Number MedianMean Median Number Mean
Source: California Student Aid Commission 16 2003-04 SEARS

Questions for Tables: W-3 and U-3
Are you a veteran of active service in the U.S. Armed Forces? 0 Yes 1 No
17 2003-04 SEARS

TABLE W-3: VETERAN STATUS BY SEGMENT, COURSE LOAD, AND DEPENDENCY STATUS
Veteran Non-VeteranDependent Independent All Dependent Independent All# % # % # % # % # % # % # %
CCC Part-time 34,689 3.5 34,689 3.5 388,729 39.6 558,597 56.9 947,326 96.5 982,014 100 Full-time 16,059 3.7 16,059 3.7 277,466 64.6 135,715 31.6 413,181 96.3 429,240 100 All 50,748 3.6 50,748 3.6 666,195 47.2 694,311 49.2 1,360,506 96.4 1,411,254 100
UC Part-time 97 0.3 97 0.3 27,992 87.7 3,814 12.0 31,806 99.7 31,902 100 Full-time 285 0.2 285 0.2 113,974 89.1 13,613 10.6 127,587 99.8 127,872 100 All 382 0.2 382 0.2 141,966 88.9 17,427 10.9 159,393 99.8 159,775 100
CSU Part-time By definition, 3,734 5.2 3,734 5.2 20,502 28.6 47,388 66.2 67,890 94.8 71,624 100 Full-time a student who 4,066 1.7 4,066 1.7 156,469 65.2 79,601 33.1 236,070 98.3 240,136 100 All is a veteran is 7,800 2.5 7,800 2.5 176,971 56.8 126,989 40.7 303,960 97.5 311,760 100
ICU Part-time independent. 1,133 7.4 1,133 7.4 5,356 35.0 8,822 57.6 14,177 92.6 15,310 100 Full-time 1,151 1.0 1,151 1.0 92,037 83.9 16,548 15.1 108,585 99.0 109,736 100 All 2,284 1.8 2,284 1.8 97,393 77.9 25,370 20.3 122,762 98.2 125,046 100
PCC Part-time 1,767 6.2 1,767 6.2 6,481 22.7 20,306 71.1 26,787 93.8 28,553 100 Full-time 5,064 6.7 5,064 6.7 23,970 31.9 46,185 61.4 70,155 93.3 75,219 100 All 6,831 6.6 6,831 6.6 30,451 29.3 66,491 64.1 96,942 93.4 103,772 100
ALL Part-time 41,419 3.7 41,419 3.7 449,059 39.8 638,926 56.6 1,087,985 96.3 1,129,404 100 Full-time 26,625 2.7 26,625 2.7 663,916 67.6 291,662 29.7 955,578 97.3 982,203 100 All 68,044 3.2 68,044 3.2 1,112,975 52.7 930,588 44.1 2,043,563 96.8 2,111,607 100
Total
Source: California Student Aid Commission 18 2003-04 SEARS

TABLE U-3: VETERAN STATUS BY SEGMENT, COURSE LOAD, AND DEPENDENCY STATUS
Veteran Non-VeteranDependent Independent All Dependent Independent All# % # % # % # % # % # % # %
CCC Part-time 97 3.5 97 3.5 1,087 39.6 1,562 56.9 2,649 96.5 2,746 100 Full-time 133 3.7 133 3.7 2,298 64.6 1,124 31.6 3,422 96.3 3,555 100 All 230 3.7 230 3.7 3,385 53.7 2,686 42.6 6,071 96.3 6,301 100
UC Part-time 2 0.4 2 0.4 454 86.3 70 13.3 524 99.6 526 100 Full-time 8 0.2 8 0.2 3,005 89.3 353 10.5 3,358 99.8 3,366 100 All 10 0.3 10 0.3 3,459 88.9 423 10.9 3,882 99.7 3,892 100
CSU Part-time By definition, 44 5.3 44 5.3 225 27.0 565 67.7 790 94.7 834 100 Full-time a student who 67 2.1 67 2.1 1,967 63.1 1,085 34.8 3,052 97.9 3,119 100 All is a veteran is 111 2.8 111 2.8 2,192 55.5 1,650 41.7 3,842 97.2 3,953 100
ICU Part-time independent. 19 5.9 19 5.9 156 48.8 145 45.3 301 94.1 320 100 Full-time 22 0.9 22 0.9 2,058 85.0 340 14.0 2,398 99.1 2,420 100 All 41 1.5 41 1.5 2,214 80.8 485 17.7 2,699 98.5 2,740 100
PCC Part-time 56 6.2 56 6.2 296 32.8 551 61.0 847 93.8 903 100 Full-time 165 5.7 165 5.7 1,106 38.5 1,604 55.8 2,710 94.3 2,875 100 All 221 5.8 221 5.8 1,402 37.1 2,155 57.0 3,557 94.2 3,778 100
ALL Part-time 218 4.1 218 4.1 2,218 41.6 2,893 54.3 5,111 95.9 5,329 100 Full-time 395 2.6 395 2.6 10,434 68.0 4,506 29.4 14,940 97.4 15,335 100 All 613 3.0 613 3.0 12,652 61.2 7,399 35.8 20,051 97.0 20,664 100
Total
Source: California Student Aid Commission 19 2003-04 SEARS

Question for Tables: W-4 and U-4
What is your current marital status? 0 Never married 1 Married 2 Separated 3 Divorced 4 Widowed 5 Registered Domestic Partner
20 2003-04 SEARS

TABLE W-4: STUDENT MARITAL STATUS BY SEGMENT, COURSE LOAD, AND DEPENDENCY STATUS
DEPENDENT UNDERGRADUATES
Never Married Married Separated Divorced Widowed Registered Domestic Partner Total
# % # % # % # % # % # % # %CCC Part-time 388,371 99.5 - - - - 358 0.1 358 0.1 1,430 0.4 390,517 100
Full-time 275,655 99.5 - - - - 724 0.3 362 0.1 362 0.1 277,104 100 All 664,026 99.5 - - - - 1,082 0.2 720 0.1 1,793 0.3 667,621 100
UC Part-time 28,295 99.7 - - - 74 0.3 - - - - 28,369 100 Full-time 113,983 99.8 - - - - - - 27 0.0 154 0.1 114,163 100 All 142,278 99.8 - - - - 74 0.1 27 0.0 154 0.1 142,532 100
CSU Part-time 20,344 99.2 - - - - - - - - 158 0.8 20,502 100 Full-time 156,283 99.9 - - - - 42 0.0 - - 124 0.1 156,450 100 All 176,627 99.8 - - - - 42 0.0 - - 282 0.2 176,952 100
ICU Part-time 5,356 100.0 - - - - - - - - - - 5,356 100 Full-time 92,141 100.0 - - - - - - - - - 92,141 100 All 97,497 100.0 - - - - - - - - - - 97,497 100
PCC Part-time 6,457 99.8 - - - - - - - 11 0.2 6,468 100 Full-time 23,895 99.6 - - - - 43 0.2 - 41 0.2 23,980 100 All 30,352 99.7 - - - - 43 0.1 - 52 0.2 30,447 100
ALL Part-time 448,823 99.5 - - - - 432 0.1 358 0.1 1,599 0.4 451,211 100 Full-time 661,957 99.7 - - - - 810 0.1 389 0.1 681 0.1 663,837 100 All 1,110,780 99.6 - - - - 1,242 0.1 746 0.1 2,281 0.2 1,115,049 100
INDEPENDENT UNDERGRADUATES
Never Married Married Separated Divorced Widowed Registered Domestic Partner Total
# % # % # % # % # % # % # %CCC Part-time 231,735 39.2 264,636 44.7 17,523 3.0 65,444 11.1 6,795 1.1 5,364 0.9 591,497 100
Full-time 84,640 55.7 43,830 28.8 6,037 4.0 14,489 9.5 1,690 1.1 1,328 0.9 152,015 100 All 316,376 42.6 308,466 41.5 23,560 3.2 79,933 10.8 8,485 1.1 6,692 0.9 743,512 100
UC Part-time 2,813 71.9 677 17.3 - - 350 9.0 - - 70 1.8 3,910 100 Full-time 10,692 76.5 2,270 16.2 342 2.4 668 4.8 - - - - 13,972 100 All 13,505 75.5 2,947 16.5 342 1.9 1,019 5.7 - - 70 0.4 17,883 100
CSU Part-time 23,852 46.7 20,728 40.5 966 1.9 4,650 9.1 422 0.8 505 1.0 51,121 100 Full-time 48,638 58.1 25,710 30.7 2,049 2.4 6,770 8.1 499 0.6 - - 83,666 100 All 72,490 53.8 46,438 34.5 3,015 2.2 11,420 8.5 920 0.7 505 0.4 134,787 100
ICU Part-time 3,288 33.0 4,294 43.1 233 2.3 1,857 18.7 62 0.6 221 2.2 9,955 100 Full-time 10,008 56.6 5,361 30.3 457 2.6 1,731 9.8 - - 132 0.7 17,689 100 All 13,296 48.1 9,655 34.9 690 2.5 3,588 13.0 62 0.2 353 1.3 27,644 100
PCC Part-time 10,499 47.6 7,585 34.4 841 3.8 3,083 14.0 53 0.2 2 0.0 22,064 100 Full-time 24,372 47.3 17,557 34.0 2,550 4.9 6,430 12.5 354 0.7 310 0.6 51,573 100 All 34,871 47.4 25,142 34.1 3,391 4.6 9,513 12.9 408 0.6 313 0.4 73,637 100
ALL Part-time 272,188 40.1 297,920 43.9 19,563 2.9 75,384 11.1 7,331 1.1 6,162 0.9 678,548 100 Full-time 178,350 55.9 94,728 29.7 11,435 3.6 30,088 9.4 2,543 0.8 1,771 0.6 318,916 100 All 450,538 45.2 392,648 39.4 30,998 3.1 105,472 10.6 9,875 1.0 7,933 0.8 997,463 100
ALL UNDERGRADUATESPart-time 721,010 63.8 297,920 26.4 19,563 1.7 75,816 6.7 7,689 0.7 7,761 0.7 1,129,759 100 Full-time 840,308 85.5 94,728 9.6 11,435 1.2 30,899 3.1 2,932 0.3 2,452 0.2 982,753 100 All 1,561,318 73.9 392,648 18.6 30,998 1.5 106,714 5.1 10,621 0.5 10,213 0.5 2,112,512 100
Source: California Student Aid Commission 21 2003-04 SEARS

TABLE U-4: STUDENT MARITAL STATUS BY SEGMENT, COURSE LOAD, AND DEPENDENCY STATUS
DEPENDENT UNDERGRADUATES
Never Married Married Separated Divorced Widowed Registered Domestic Partner Total
# % # % # % # % # % # % # %CCC Part-time 1,086 99.5 - - - - 1 0.1 1 0.1 4 0.4 1,092 100
Full-time 2,283 99.5 - - - - 6 0.3 3 0.1 3 0.1 2,295 100 All 3,369 99.5 - - - - 7 0.2 4 0.1 7 0.2 3,387 100
UC Part-time 458 99.6 - - - 2 0.4 - - - - 460 100 Full-time 3,005 99.8 - - - - - - 1 0.0 4 0.1 3,010 100 All 3,463 99.8 - - - - 2 0.1 1 0.0 4 0.1 3,470 100
CSU Part-time 224 99.6 - - - - - - - - 1 0.4 225 100 Full-time 1,964 99.9 - - - - 1 0.1 - - 1 0.1 1,966 100 All - - - - - - 1 33.3 - - 2 66.7 3 100
ICU Part-time 156 100.0 - - - - - - - - - - 156 100 Full-time 2,060 100.0 - - - - - - - - - - 2,060 100 All 2,216 100.0 - - - - - - - - - - 2,216 100
PCC Part-time 294 99.7 - - - - - - - - 1 0.3 295 100 Full-time 1,096 99.5 - - - - 4 0.4 - - 2 0.2 1,102 100 All 1,390 99.5 - - - - 4 0.3 - - 3 0.2 1,397 100
ALL Part-time 2,218 99.6 - - - - 3 0.1 1 0.0 6 0.3 2,228 100 Full-time 10,408 99.8 - - - - 11 0.1 4 0.0 10 0.1 10,433 100 All 12,626 99.7 - - - - 14 0.1 5 0.0 16 0.1 12,661 100
INDEPENDENT UNDERGRADUATES
Never Married Married Separated Divorced Widowed Registered Domestic Partner Total
# % # % # % # % # % # % # %CCC Part-time 648 39.2 740 44.7 49 3.0 183 11.1 19 1.1 15 0.9 1,654 100
Full-time 701 55.7 363 28.8 50 4.0 120 9.5 14 1.1 11 0.9 1,259 100 All 1,349 46.3 1,103 37.9 99 3.4 303 10.4 33 1.1 26 0.9 2,913 100
UC Part-time 51 70.8 13 18.1 - - 7 9.7 - - 1 1.4 72 100 Full-time 277 76.3 59 16.3 10 2.8 17 4.7 - - - - 363 100 All 328 75.4 72 16.6 10 2.3 24 5.5 - - 1 0.2 435 100
CSU Part-time 267 43.8 255 41.9 13 2.1 61 10.0 7 1.1 6 1.0 609 100 Full-time 670 58.2 354 30.7 27 2.3 96 8.3 5 0.4 - - 1,152 100 All 937 53.2 609 34.6 40 2.3 157 8.9 12 0.7 6 0.3 1,761 100
ICU Part-time 62 37.8 71 43.3 4 2.4 22 13.4 1 0.6 4 2.4 164 100 Full-time 210 58.2 107 29.6 8 2.2 33 9.1 - - 3 0.8 361 100 All 272 51.8 178 33.9 12 2.3 55 10.5 1 0.2 7 1.3 525 100
PCC Part-time 283 46.6 208 34.3 29 4.8 83 13.7 3 0.5 1 0.2 607 100 Full-time 883 49.8 556 31.3 92 5.2 217 12.2 16 0.9 10 0.6 1,774 100 All 1,166 49.0 764 32.1 121 5.1 300 12.6 19 0.8 11 0.5 2,381 100
ALL Part-time 1,311 42.2 1,287 41.4 95 3.1 356 11.5 30 1.0 27 0.9 3,106 100 Full-time 2,741 55.8 1,439 29.3 187 3.8 483 9.8 35 0.7 24 0.5 4,909 100 All 4,052 50.6 2,726 34.0 282 3.5 839 10.5 65 0.8 51 0.6 8,015 100
ALL UNDERGRADUATESPart-time 3,529 66.2 1,287 24.1 95 1.8 359 6.7 31 0.6 33 0.6 5,334 100 Full-time 13,149 85.7 1,439 9.4 187 1.2 494 3.2 39 0.3 34 0.2 15,342 100 All 16,678 80.7 2,726 13.2 282 1.4 853 4.1 70 0.3 67 0.3 20,676 100
Source: California Student Aid Commission 22 2003-04 SEARS

Question for Tables: W-5 and U-5
How many people are dependent on you for financial support? Do NOT count yourself or your spouse. 0 None 1 One 2 Two 3 Three 4 Four 5 Five 6 Six or more
23 2003-04 SEARS

TABLE W-5: STUDENTS WITH DEPENDENTS BY SEGMENT, COURSE LOAD, AND DEPENDENCY STATUS
By definition, a dependent student does not have any dependents.
INDEPENDENT UNDERGRADUATES
None One Dependent Six or More Dependents Total
# % # % # % # % # % # % # % # %CCC Part-time 239,245 40.2 135,179 22.7 114,080 19.2 64,371 10.8 27,179 4.6 8,940 1.5 6,437 1.1 595,431 100
Full-time 56,870 37.3 40,328 26.5 30,306 19.9 13,282 8.7 5,313 3.5 3,864 2.5 2,415 1.6 152,377 100 All 296,115 39.6 175,507 23.5 144,386 19.3 77,653 10.4 32,492 4.3 12,804 1.7 8,852 1.2 747,808 100
UC Part-time 1,998 51.1 948 24.2 782 20.0 112 2.9 - - 70 1.8 - - 3,910 100 Full-time 8,301 59.4 2,909 20.8 2,010 14.4 389 2.8 241 1.7 123 0.9 - - 13,973 100 All 10,299 57.6 3,857 21.6 2,792 15.6 501 2.8 241 1.3 193 1.1 - - 17,883 100
CSU Part-time 29,931 58.6 8,812 17.2 6,753 13.2 4,284 8.4 932 1.8 117 0.2 258 0.5 51,087 100 Full-time 48,772 58.3 16,405 19.6 11,655 13.9 4,151 5.0 1,371 1.6 790 0.9 522 0.6 83,666 100 All 78,703 58.4 25,217 18.7 18,408 13.7 8,436 6.3 2,303 1.7 907 0.7 780 0.6 134,754 100
ICU Part-time 4,878 49.0 2,195 22.0 1,875 18.8 737 7.4 101 1.0 47 0.5 123 1.2 9,955 100 Full-time 10,226 57.8 3,313 18.7 2,801 15.8 1,072 6.1 120 0.7 139 0.8 28 0.2 17,698 100 All 15,104 54.6 5,508 19.9 4,676 16.9 1,809 6.5 221 0.8 185 0.7 151 0.5 27,653 100
PCC Part-time 8,769 39.7 6,474 29.3 3,821 17.3 2,049 9.3 736 3.3 54 0.2 174 0.8 22,076 100 Full-time 20,480 39.8 12,499 24.3 10,665 20.7 4,226 8.2 2,607 5.1 684 1.3 350 0.7 51,510 100 All 29,249 39.7 18,973 25.8 14,486 19.7 6,275 8.5 3,343 4.5 737 1.0 524 0.7 73,586 100
ALL Part-time 284,821 41.7 153,607 22.5 127,310 18.7 71,553 10.5 28,947 4.2 9,228 1.4 6,992 1.0 682,460 100 Full-time 144,649 45.3 75,454 23.6 57,437 18.0 23,120 7.2 9,651 3.0 5,598 1.8 3,315 1.0 319,225 100 All 429,470 42.9 229,061 22.9 184,747 18.4 94,674 9.5 38,598 3.9 14,827 1.5 10,307 1.0 1,001,684 100
Two Dependents Three Dependents Four Dependents Five Dependents
Source: California Student Aid Commission 24 2003-04 SEARS

TABLE U-5: STUDENTS WITH DEPENDENTS BY SEGMENT, COURSE LOAD, AND DEPENDENCY STATUS
By definition, a dependent student does not have any dependents.
INDEPENDENT UNDERGRADUATES
None One Dependent Six or More Dependents Total
# % # % # % # % # % # % # % # %CCC Part-time 669 40.2 378 22.7 319 19.2 180 10.8 76 4.6 25 1.5 18 1.1 1,665 100
Full-time 471 37.3 334 26.5 251 19.9 110 8.7 44 3.5 32 2.5 20 1.6 1,262 100 All 1,140 38.9 712 24.3 570 19.5 290 9.9 120 4.1 57 1.9 38 1.3 2,927 100
UC Part-time 39 54.2 15 20.8 15 20.8 2 2.8 - - 1 1.4 - - 72 100 Full-time 216 59.5 75 20.7 53 14.6 10 2.8 6 1.7 3 0.8 - - 363 100 All 255 58.6 90 20.7 68 15.6 12 2.8 6 1.4 4 0.9 - - 435 100
CSU Part-time 350 57.6 107 17.6 80 13.2 53 8.7 13 2.1 2 0.3 3 0.5 608 100 Full-time 684 59.4 221 19.2 157 13.6 53 4.6 22 1.9 10 0.9 5 0.4 1,152 100 All 1,034 58.8 328 18.6 237 13.5 106 6.0 35 2.0 12 0.7 8 0.5 1,760 100
ICU Part-time 86 52.4 29 17.7 32 19.5 12 7.3 2 1.2 1 0.6 2 1.2 164 100 Full-time 218 60.2 61 16.9 56 15.5 20 5.5 4 1.1 2 0.6 1 0.3 362 100 All 304 57.8 90 17.1 88 16.7 32 6.1 6 1.1 3 0.6 3 0.6 526 100
PCC Part-time 246 40.5 156 25.7 121 19.9 57 9.4 23 3.8 2 0.3 3 0.5 608 100 Full-time 705 39.7 441 24.8 356 20.0 152 8.6 83 4.7 23 1.3 16 0.9 1,776 100 All 951 39.9 597 25.0 477 20.0 209 8.8 106 4.4 25 1.0 19 0.8 2,384 100
ALL Part-time 1,390 44.6 685 22.0 567 18.2 304 9.8 114 3.7 31 1.0 26 0.8 3,117 100 Full-time 2,294 46.7 1,132 23.0 873 17.8 345 7.0 159 3.2 70 1.4 42 0.9 4,915 100 All 3,684 45.9 1,817 22.6 1,440 17.9 649 8.1 273 3.4 101 1.3 68 0.8 8,032 100
Two Dependents Three Dependents Four Dependents Five Dependents
Source: California Student Aid Commission 25 2003-04 SEARS

Question for Tables: W-6 and U-6
Your ethnic identity (please check only one): 00 African American/Black Hispanic/Latino Pacific Islander 01 American Indian or Alaskan Native 13 Central American 19 Guamanian 02 White/Caucasian 14 Cuban 20 Hawaiian Asian 15 Chicano/Mexican American 21 Samoan 03 Asian Indian 08 Filipino 16 Puerto Rican 21 Other Pacific Islander 04 Chinese 09 Laotian 17 South American 22 Other 05 Japanese 10 Cambodian 18 Other Latino 23 Multi-racial 06 Korean 11 Pakistani 07 Vietnamese 12 Other Asian
NOTE: The UC and CSU segments provided this data element electronically.
26 2003-04 SEARS

TABLE W-6: ETHNICITY BY SEGMENT, COURSE LOAD, AND DEPENDENCY STATUS
DEPENDENT UNDERGRADUATES
Black HispanicAsian & Pacific
Islander White Other Total# % # % # % # % # % # %
CCC Part-time 16,450 4.3 138,755 35.9 62,583 16.2 138,040 35.7 30,397 7.9 386,226 100 Full-time 11,108 4.1 76,189 28.0 43,709 16.0 120,742 44.3 20,768 7.6 272,516 100 All 27,559 4.2 214,944 32.6 106,292 16.1 258,782 39.3 51,165 7.8 658,741 100
UC Part-time 492 1.9 7,443 28.8 11,387 44.0 5,473 21.2 1,066 4.1 25,860 100 Full-time 2,492 2.3 13,032 12.2 41,134 38.5 47,476 44.4 2,697 2.5 106,832 100 All 2,984 2.2 20,475 15.4 52,521 39.6 52,949 39.9 3,764 2.8 132,692 100
CSU Part-time 512 2.9 5,709 32.1 5,237 29.5 5,300 29.8 1,000 5.6 17,757 100 Full-time 6,111 4.3 31,286 22.1 33,555 23.7 65,289 46.1 5,263 3.7 141,504 100 All 6,623 4.2 36,995 23.2 38,792 24.4 70,589 44.3 6,263 3.9 159,261 100
ICU Part-time 139 2.8 815 16.3 913 18.3 3,124 62.6 - - 4,990 100 Full-time 3,454 4.2 10,615 13.0 12,439 15.3 54,314 66.6 735 0.9 81,557 100 All 3,592 4.2 11,430 13.2 13,352 15.4 57,438 66.4 735 0.8 86,546 100
PCC Part-time 466 7.2 2,360 36.5 808 12.5 2,165 33.4 674 10.4 6,473 100 Full-time 1,533 6.5 8,558 36.3 4,070 17.3 7,130 30.2 2,289 9.7 23,581 100 All 2,000 6.7 10,918 36.3 4,878 16.2 9,295 30.9 2,963 9.9 30,053 100
ALL Part-time 18,059 4.1 155,081 35.1 80,927 18.3 154,101 34.9 33,138 7.5 441,305 100 Full-time 24,699 3.9 139,680 22.3 134,907 21.6 294,951 47.1 31,751 5.1 625,988 100 All 42,758 4.0 294,760 27.6 215,834 20.2 449,052 42.1 64,889 6.1 1,067,293 100
INDEPENDENT UNDERGRADUATES
Black HispanicAsian & Pacific
Islander White Other Total# % # % # % # % # % # %
CCC Part-time 36,834 6.3 192,398 33.0 116,583 20.0 202,053 34.7 34,689 6.0 582,557 100 Full-time 12,678 8.5 42,139 28.1 36,585 24.4 44,795 29.9 13,523 9.0 149,721 100 All 49,512 6.8 234,537 32.0 153,168 20.9 246,849 33.7 48,212 6.6 732,278 100
UC Part-time 259 7.1 1,117 30.7 919 25.3 1,201 33.0 141 3.9 3,637 100 Full-time 389 2.9 3,035 23.0 3,616 27.4 5,616 42.5 551 4.2 13,207 100 All 648 3.8 4,152 24.7 4,535 26.9 6,817 40.5 692 4.1 16,844 100
CSU Part-time 2,783 6.1 12,460 27.4 7,935 17.5 19,307 42.5 2,965 6.5 45,449 100 Full-time 6,068 8.3 18,681 25.4 14,619 19.9 31,251 42.6 2,818 3.8 73,437 100 All 8,851 7.4 31,141 26.2 22,554 19.0 50,558 42.5 5,783 4.9 118,887 100
ICU Part-time 1,046 11.1 1,514 16.1 774 8.2 5,954 63.2 139 1.5 9,427 100 Full-time 1,055 6.6 2,853 17.9 2,633 16.5 9,121 57.3 258 1.6 15,918 100 All 2,101 8.3 4,367 17.2 3,406 13.4 15,074 59.5 396 1.6 25,344 100
PCC Part-time 2,790 12.9 6,708 31.1 2,131 9.9 7,861 36.4 2,097 9.7 21,586 100 Full-time 6,301 12.4 12,385 24.4 7,807 15.4 19,537 38.4 4,791 9.4 50,821 100 All 9,092 12.6 19,093 26.4 9,938 13.7 27,398 37.8 6,888 9.5 72,408 100
ALL Part-time 43,713 6.6 214,196 32.3 128,341 19.4 236,376 35.7 40,030 6.0 662,656 100 Full-time 26,491 8.7 79,093 26.1 65,259 21.5 110,320 36.4 21,941 7.2 303,104 100 All 70,203 7.3 293,289 30.4 193,600 20.0 346,695 35.9 61,971 6.4 965,760 100
ALL UNDERGRADUATESPart-time 61,772 5.6 369,277 33.5 209,269 19.0 390,476 35.4 73,168 6.6 1,103,962 100 Full-time 51,190 5.5 218,772 23.5 200,166 21.5 405,271 43.6 53,693 5.8 929,092 100 All 112,962 5.6 588,049 28.9 409,435 20.1 795,748 39.1 126,860 6.2 2,033,053 100
Source: California Student Aid Commission 27 2003-04 SEARS

TABLE U-6: ETHNICITY BY SEGMENT, COURSE LOAD, AND DEPENDENCY STATUS
DEPENDENT UNDERGRADUATES
Black HispanicAsian & Pacific
Islander White Other Total# % # % # % # % # % # %
CCC Part-time 46 4.3 388 35.9 175 16.2 386 35.7 85 7.9 1,080 100 Full-time 92 4.1 631 28.0 362 16.0 1,000 44.3 172 7.6 2,257 100 All 138 4.1 1,019 30.5 537 16.1 1,386 41.5 257 7.7 3,337 100
UC Part-time 7 1.7 112 27.9 176 43.8 90 22.4 17 4.2 402 100 Full-time 65 2.3 347 12.3 1,095 38.9 1,237 44.0 69 2.5 2,813 100 All 72 2.2 459 14.3 1,271 39.5 1,327 41.3 86 2.7 3,215 100
CSU Part-time 5 2.5 60 30.2 52 26.1 71 35.7 11 5.5 199 100 Full-time 66 3.7 390 22.1 367 20.8 875 49.5 68 3.9 1,766 100 All 71 3.6 450 22.9 419 21.3 946 48.1 79 4.0 1,965 100
ICU Part-time 5 3.5 13 9.2 27 19.0 97 68.3 - - 142 100 Full-time 73 4.0 216 11.9 289 15.9 1,227 67.5 14 0.8 1,819 100 All 78 4.0 229 11.7 316 16.1 1,324 67.5 14 0.7 1,961 100
PCC Part-time 19 6.5 106 36.1 29 9.9 110 37.4 30 10.2 294 100 Full-time 73 6.9 400 38.0 139 13.2 349 33.1 93 8.8 1,054 100 All 92 6.8 506 37.5 168 12.5 459 34.1 123 9.1 1,348 100
ALL Part-time 82 3.9 679 32.1 459 21.7 754 35.6 143 6.8 2,117 100 Full-time 369 3.8 1,984 20.4 2,252 23.2 4,688 48.3 416 4.3 9,709 100 All 451 3.8 2,663 22.5 2,711 22.9 5,442 46.0 559 4.7 11,826 100
INDEPENDENT UNDERGRADUATES
Black HispanicAsian & Pacific
Islander White Other Total# % # % # % # % # % # %
CCC Part-time 103 6.3 538 33.0 326 20.0 565 34.7 97 6.0 1,629 100 Full-time 105 8.5 349 28.1 303 24.4 371 29.9 112 9.0 1,240 100 All 208 7.2 887 30.9 629 21.9 936 32.6 209 7.3 2,869 100
UC Part-time 4 6.3 19 29.7 15 23.4 24 37.5 2 3.1 64 100 Full-time 10 2.9 80 23.3 94 27.4 145 42.3 14 4.1 343 100 All 14 3.4 99 24.3 109 26.8 169 41.5 16 3.9 407 100
CSU Part-time 30 5.6 146 27.3 81 15.2 244 45.7 33 6.2 534 100 Full-time 82 8.2 242 24.1 155 15.4 481 47.8 46 4.6 1,006 100 All 112 7.3 388 25.2 236 15.3 725 47.1 79 5.1 1,540 100
ICU Part-time 19 12.3 27 17.4 16 10.3 91 58.7 2 1.3 155 100 Full-time 19 5.8 59 18.2 53 16.3 187 57.5 7 2.2 325 100 All 38 7.9 86 17.9 69 14.4 278 57.9 9 1.9 480 100
PCC Part-time 75 12.5 161 26.8 91 15.1 217 36.1 57 9.5 601 100 Full-time 208 11.8 476 27.1 292 16.6 635 36.1 146 8.3 1,757 100 All 283 12.0 637 27.0 383 16.2 852 36.1 203 8.6 2,358 100
ALL Part-time 231 7.7 891 29.9 529 17.7 1,141 38.3 191 6.4 2,983 100 Full-time 424 9.1 1,206 25.8 897 19.2 1,819 38.9 325 7.0 4,671 100 All 655 8.6 2,097 27.4 1,426 18.6 2,960 38.7 516 6.7 7,654 100
ALL UNDERGRADUATESPart-time 313 6.1 1,570 30.8 988 19.4 1,895 37.2 334 6.5 5,100 100 Full-time 793 5.5 3,190 22.2 3,149 21.9 6,507 45.3 741 5.2 14,380 100 All 1,106 5.7 4,760 24.4 4,137 21.2 8,402 43.1 1,075 5.5 19,480 100
Source: California Student Aid Commission 28 2003-04 SEARS

Question for Tables: W-7 and U-7
When you first applied at this institution were you a California resident? 0 Yes 1 No
NOTE: The UC and CSU segments provided this data element electronically. 29 2003-04 SEARS

TABLE W-7: CALIFORNIA RESIDENCY STATUS BY SEGMENT, COURSE LOAD, AND DEPENDENCY STATUS
Resident Non-ResidentDependent Independent All Dependent Independent All# % # % # % # % # % # % # %
CCC Part-time 371,206 37.7 567,895 57.7 939,100 95.4 17,881 1.8 27,179 2.8 45,060 4.6 984,160 100 Full-time 260,683 60.8 137,163 32.0 397,847 92.8 16,179 3.8 14,610 3.4 30,789 7.2 428,636 100 All 631,889 44.7 705,058 49.9 1,336,947 94.6 34,060 2.4 41,789 3.0 75,849 5.4 1,412,796 100
UC Part-time 25,701 84.1 3,620 11.8 29,321 96.0 1,130 3.7 107 0.4 1,238 4.0 30,559 100 Full-time 107,138 83.6 13,195 10.3 120,333 93.9 7,025 5.5 777 0.6 7,803 6.1 128,136 100 All 132,839 83.7 16,815 10.6 149,654 94.3 8,156 5.1 885 0.6 9,040 5.7 158,694 100
CSU Part-time 20,353 28.4 50,222 70.1 70,575 98.5 149 0.2 899 1.3 1,048 1.5 71,623 100 Full-time 150,856 62.8 81,456 33.9 232,312 96.7 5,675 2.4 2,211 0.9 7,886 3.3 240,198 100 All 171,209 54.9 131,678 42.2 302,887 97.1 5,824 1.9 3,110 1.0 8,933 2.9 311,820 100
ICU Part-time 3,621 24.0 9,122 60.4 12,743 84.3 1,626 10.8 745 4.9 2,371 15.7 15,114 100 Full-time 64,371 58.8 14,395 13.1 78,766 71.9 27,534 25.1 3,223 2.9 30,757 28.1 109,523 100 All 67,992 54.6 23,517 18.9 91,509 73.4 29,160 23.4 3,968 3.2 33,128 26.6 124,638 100
PCC Part-time 5,502 19.3 21,037 73.9 26,539 93.2 975 3.4 951 3.3 1,926 6.8 28,465 100 Full-time 20,723 27.5 48,367 64.2 69,090 91.7 3,197 4.2 3,037 4.0 6,234 8.3 75,324 100 All 26,225 25.3 69,404 66.9 95,629 92.1 4,172 4.0 3,988 3.8 8,160 7.9 103,789 100
ALL Part-time 426,383 37.7 651,896 57.7 1,078,279 95.4 21,761 1.9 29,881 2.6 51,641 4.6 1,129,920 100 Full-time 603,771 61.5 294,576 30.0 898,348 91.5 59,611 6.1 23,859 2.4 83,469 8.5 981,817 100 All 1,030,154 48.8 946,473 44.8 1,976,626 93.6 81,371 3.9 53,740 2.5 135,111 6.4 2,111,737 100
Total
Source: California Student Aid Commission 30 2003-04 SEARS

TABLE U-7: CALIFORNIA RESIDENCY STATUS BY SEGMENT, COURSE LOAD, AND DEPENDENCY STATUS
Resident Non-ResidentDependent Independent All Dependent Independent All# % # % # % # % # % # % # %
CCC Part-time 1,038 37.7 1,588 57.7 2,626 95.4 50 1.8 76 2.8 126 4.6 2,752 100 Full-time 2,159 60.8 1,136 32.0 3,295 92.8 134 3.8 121 3.4 255 7.2 3,550 100 All 3,197 50.7 2,724 43.2 5,921 94.0 184 2.9 197 3.1 381 6.0 6,302 100
UC Part-time 401 82.9 64 13.2 465 96.1 17 3.5 2 0.4 19 3.9 484 100 Full-time 2,822 83.7 343 10.2 3,165 93.8 188 5.6 20 0.6 208 6.2 3,373 100 All 3,223 83.6 407 10.6 3,630 94.1 205 5.3 22 0.6 227 5.9 3,857 100
CSU Part-time 223 26.7 599 71.8 822 98.6 2 0.2 10 1.2 12 1.4 834 100 Full-time 1,894 60.7 1,125 36.1 3,019 96.8 74 2.4 27 0.9 101 3.2 3,120 100 All 2,117 53.5 1,724 43.6 3,841 97.1 76 1.9 37 0.9 113 2.9 3,954 100
ICU Part-time 82 26.0 147 46.7 229 72.7 71 22.5 15 4.8 86 27.3 315 100 Full-time 1,406 58.2 294 12.2 1,700 70.4 648 26.8 66 2.7 714 29.6 2,414 100 All 1,488 54.5 441 16.2 1,929 70.7 719 26.3 81 3.0 800 29.3 2,729 100
PCC Part-time 250 27.9 564 62.9 814 90.7 44 4.9 39 4.3 83 9.3 897 100 Full-time 978 34.1 1,663 58.0 2,641 92.1 120 4.2 106 3.7 226 7.9 2,867 100 All 1,228 32.6 2,227 59.2 3,455 91.8 164 4.4 145 3.9 309 8.2 3,764 100
ALL Part-time 1,994 37.8 2,962 56.1 4,956 93.8 184 3.5 142 2.7 326 6.2 5,282 100 Full-time 9,259 60.4 4,561 29.8 13,820 90.2 1,164 7.6 340 2.2 1,504 9.8 15,324 100 All 11,253 54.6 7,523 36.5 18,776 91.1 1,348 6.5 482 2.3 1,830 8.9 20,606 100
Total
Source: California Student Aid Commission 31 2003-04 SEARS
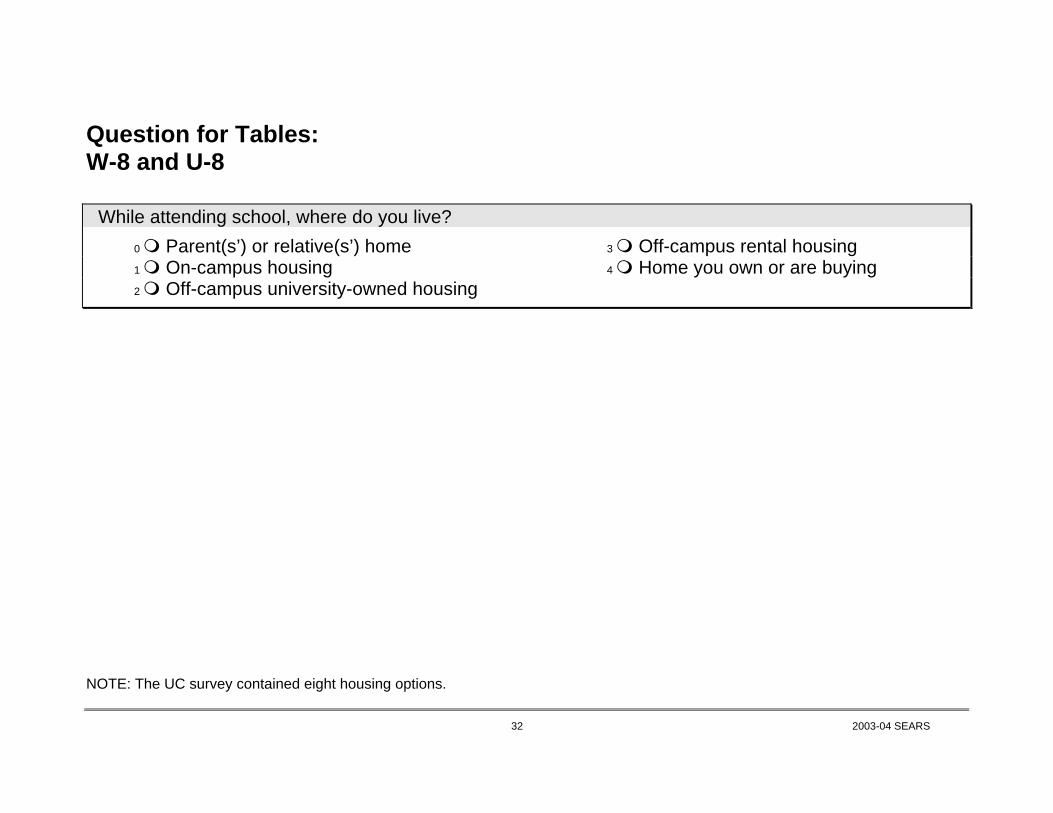
Question for Tables: W-8 and U-8
While attending school, where do you live? 0 Parent(s’) or relative(s’) home 3 Off-campus rental housing
1 On-campus housing 4 Home you own or are buying 2 Off-campus university-owned housing
NOTE: The UC survey contained eight housing options. 32 2003-04 SEARS

TABLE W-8: LIVING ARRANGEMENT BY SEGMENT, COURSE LOAD, AND DEPENDENCY STATUS
DEPENDENT UNDERGRADUATESParent or Relative's House On-Campus Housing Total
# % # % # % # %CCC Part-time 332,583 85.1 2,503 0.6 55,788 14.3 390,875 100
Full-time 238,708 86.1 3,502 1.3 35,015 12.6 277,225 100All 571,291 85.5 6,005 0.9 90,803 13.6 668,099 100
UC Part-time 6,206 25.7 8,420 34.9 9,510 39.4 24,136 100Full-time 8,983 8.8 36,702 36.1 55,875 55.0 101,560 100All 15,189 12.1 45,122 35.9 65,385 52.0 125,696 100
CSU Part-time 13,343 65.1 1,553 7.6 5,605 27.3 20,502 100Full-time 77,602 49.7 22,915 14.7 55,637 35.6 156,154 100All 90,945 51.5 24,468 13.9 61,242 34.7 176,656 100
ICU Part-time 869 16.5 2,947 56.0 1,443 27.4 5,259 100Full-time 11,694 12.8 54,755 59.8 25,120 27.4 91,569 100All 12,563 13.0 57,702 59.6 26,563 27.4 96,828 100
PCC Part-time 4,198 64.5 - - 2,313 35.5 6,510 100Full-time 16,541 69.3 - - 7,339 30.7 23,880 100All 20,739 68.2 - - 9,652 31.8 30,390 100
ALL Part-time 357,199 79.9 15,425 3.4 74,658 16.7 447,281 100Full-time 353,528 54.4 117,874 18.1 178,986 27.5 650,388 100All 710,727 64.7 133,298 12.1 253,644 23.1 1,097,669 100
INDEPENDENT UNDERGRADUATES
Parent or Relative's House On-Campus Housing Total# % # % # % # %
CCC Part-time 155,921 26.2 1,430 0.2 437,365 73.5 594,716 100Full-time 58,922 38.7 1,811 1.2 91,402 60.1 152,136 100All 214,843 28.8 3,242 0.4 528,767 70.8 746,851 100
UC Part-time 476 14.6 335 10.3 2,452 75 3,263 100Full-time 904 7.9 1,431 12.4 9,172 79.7 11,507 100All 1,380 9.3 1,765 12.0 11,624 78.7 14,769 100
CSU Part-time 23,356 46.6 3,628 7.2 23,142 46.2 50,126 100Full-time 37,030 44.8 8,971 10.9 36,682 44.4 82,683 100All 60,386 45.5 12,599 9.5 59,824 45.0 132,809 100
ICU Part-time 851 8.6 181 1.8 8,876 89.6 9,908 100Full-time 2,665 15.1 2,841 16.1 12,088 68.7 17,593 100All 3,515 12.8 3,021 11.0 20,964 76.2 27,501 100
PCC Part-time 5,548 25.3 - - 16,353 74.7 21,901 100Full-time 14,443 28.1 - - 36,949 71.9 51,392 100All 19,991 27.3 - - 53,302 72.7 73,293 100
ALL Part-time 186,151 27.4 5,574 0.8 488,188 71.8 679,913 100Full-time 113,963 36.1 15,054 4.8 186,293 59.1 315,311 100All 300,115 30.2 20,628 2.1 674,482 67.8 995,224 100
ALL UNDERGRADUATESPart-time 543,350 48.2 20,998 1.9 562,846 49.9 1,127,195 100 Full-time 467,491 48.4 132,927 13.8 365,280 37.8 965,698 100 All 1,010,842 48.3 153,926 7.4 928,126 44.3 2,092,893 100
Off Campus Housing
Off Campus Housing
Source: California Student Aid Commission 33 2003-04 SEARS

TABLE U-8: LIVING ARRANGEMENT BY SEGMENT, COURSE LOAD, AND DEPENDENCY STATUS
DEPENDENT UNDERGRADUATESParent or Relative's House On-Campus Housing Total
# % # % # % # %CCC Part-time 930 85.1 7 0.6 156 14.3 1,093 100
Full-time 1,977 86.1 29 1.3 290 12.6 2,296 100All 2,907 85.8 36 1.1 446 13.2 3,389 100
UC Part-time 98 21.5 186 40.9 171 37.6 455 100Full-time 259 8.6 1,239 41.3 1,502 50.1 3,000 100All 357 10.3 1,425 41.2 1,673 48.4 3,455 100
CSU Part-time 138 61.3 22 9.8 65 28.9 225 100Full-time 949 48.4 331 16.9 681 34.7 1,961 100All 1,087 49.7 353 16.1 746 34.1 2,186 100
ICU Part-time 16 10.5 107 69.9 30 19.6 153 100Full-time 241 11.8 1,265 61.8 541 26.4 2,047 100All 257 11.7 1,372 62.4 571 26.0 2,200 100
PCC Part-time 202 68.0 - - 95 32.0 297 100Full-time 795 72.2 - - 306 27.8 1,101 100All 997 71.3 - - 401 28.7 1,398 100
ALL Part-time 1,384 62.3 322 14.5 517 23.3 2,223 100Full-time 4,221 40.6 2,864 27.5 3,320 31.9 10,405 100All 5,605 44.4 3,186 25.2 3,837 30.4 12,628 100
INDEPENDENT UNDERGRADUATES
Parent or Relative's House On-Campus Housing Total# % # % # % # %
CCC Part-time 436 26.2 4 0.2 1,223 73.5 1,663 100Full-time 488 38.7 15 1.2 757 60.1 1,260 100All 924 31.6 19 0.7 1,980 67.7 2,923 100
UC Part-time 8 13.1 6 9.8 47 77 61 100Full-time 24 8.0 39 13.0 236 78.9 299 100All 32 8.9 45 12.5 283 78.6 360 100
CSU Part-time 285 47.5 48 8.0 267 44.5 600 100Full-time 512 45.0 140 12.3 486 42.7 1,138 100All 797 45.9 188 10.8 753 43.3 1,738 100
ICU Part-time 16 9.8 7 4.3 140 85.9 163 100Full-time 54 15.0 61 16.9 245 68.1 360 100All 70 13.4 68 13.0 385 73.6 523 100
PCC Part-time 180 29.8 - - 424 70.2 604 100Full-time 561 31.7 - - 1,208 68.3 1,769 100All 741 31.2 - - 1,632 68.8 2,373 100
ALL Part-time 925 29.9 65 2.1 2,101 68.0 3,091 100Full-time 1,639 34.0 255 5.3 2,932 60.8 4,826 100All 2,564 32.4 320 4.0 5,033 63.6 7,917 100
ALL UNDERGRADUATESPart-time 2,309 43.5 387 7.3 2,618 49.3 5,314 100 Full-time 5,860 38.5 3,119 20.5 6,252 41.0 15,231 100 All 8,169 39.8 3,506 17.1 8,870 43.2 20,545 100
Off Campus Housing
Off Campus Housing
Source: California Student Aid Commission 34 2003-04 SEARS

Question for Tables: W-9, U-9, and M-9
How far away from school do you live during the academic year (e.g., September through May or
October through June)? 00 I live on campus 05 7 to 8.9 miles 10 26 to 30.9 miles 01 Less than 1 mile 06 9 to 10.9 miles 11 31 to 35.9 miles 02 1 to 2.9 miles 07 11 to 15.9 miles 12 36 to 39.9 miles 03 3 to 4.9 miles 08 16 to 20.9 miles 13 More than 40 miles 04 5 to 6.9 miles 09 21 to 25.9 miles
35 2003-04 SEARS

TABLE W-9: DISTANCE FROM CAMPUS BY SEGMENT, COURSE LOAD, AND DEPENDENCY STATUS
DEPENDENT UNDERGRADUATES
On Campus 7 to 10.9 Miles 11 to 20.9 Miles 21 to 30.9 Miles 31 to 39.9 Miles 40 or More Miles Total# % # % # % # % # % # % # % # % # %
CCC Part-time 715 0.2 67,232 17.3 117,656 30.4 76,888 19.8 76,888 19.8 31,470 8.1 8,225 2.1 8,583 2.2 387,656 100 Full-time 2,777 1.0 42,260 15.3 73,653 26.6 54,093 19.6 58,439 21.1 28,857 10.4 10,505 3.8 5,916 2.1 276,500 100 All 3,492 0.5 109,492 16.5 191,309 28.8 130,980 19.7 135,327 20.4 60,328 9.1 18,730 2.8 14,499 2.2 664,156 100
UC Part-time 7,976 28.2 8,615 30.4 1,632 5.8 2,265 8.0 2,800 9.9 1,469 5.2 1,217 4.3 2,325 8.2 28,299 100 Full-time 33,190 29.1 48,824 42.8 12,754 11.2 5,251 4.6 5,674 5.0 3,222 2.8 1,665 1.5 3,461 3.0 114,041 100 All 41,166 28.9 57,439 40.4 14,386 10.1 7,516 5.3 8,474 6.0 4,691 3.3 2,881 2.0 5,786 4.1 142,340 100
CSU Part-time 88 0.4 4,179 20.4 2,661 13.0 2,868 14.0 4,406 21.5 3,775 18.4 1,440 7.0 1,085 5.3 20,502 100 Full-time 19,993 12.8 35,646 22.8 23,555 15.1 17,495 11.2 26,855 17.2 17,961 11.5 6,200 4.0 8,350 5.4 156,055 100 All 20,081 11.4 39,825 22.6 26,216 14.8 20,363 11.5 31,261 17.7 21,736 12.3 7,640 4.3 9,436 5.3 176,557 100
ICU Part-time 2,668 49.8 767 14.3 480 9.0 301 5.6 568 10.6 140 2.6 48 0.9 383 7.2 5,356 100 Full-time 46,148 50.4 18,426 20.1 6,394 7.0 3,549 3.9 6,974 7.6 3,071 3.4 1,545 1.7 5,512 6.0 91,618 100 All 48,816 50.3 19,193 19.8 6,874 7.1 3,851 4.0 7,541 7.8 3,211 3.3 1,593 1.6 5,895 6.1 96,974 100
PCC Part-time - - 495 7.8 1,220 19.1 1,206 18.9 1,743 27.3 834 13.1 318 5.0 563 8.8 6,380 100 Full-time - - 3,335 14.4 3,711 16.1 3,691 16.0 4,443 19.2 3,394 14.7 1,594 6.9 2,918 12.6 23,085 100 All - - 3,830 13.0 4,931 16.7 4,897 16.6 6,186 21.0 4,228 14.3 1,912 6.5 3,480 11.8 29,465 100
ALL Part-time 11,448 2.6 81,288 18.1 123,649 27.6 83,528 18.6 86,404 19.3 37,688 8.4 11,248 2.5 12,940 2.9 448,192 100 Full-time 102,108 15.4 148,491 22.5 120,067 18.2 84,079 12.7 102,385 15.5 56,505 8.5 21,508 3.3 26,157 4.0 661,299 100 All 113,556 10.2 229,779 20.7 243,715 22.0 167,607 15.1 188,789 17.0 94,193 8.5 32,755 3.0 39,096 3.5 1,109,491 100
INDEPENDENT UNDERGRADUATES
On Campus 7 to 10.9 Miles 11 to 20.9 Miles 21 to 30.9 Miles 31 to 39.9 Miles 40 or More Miles Total# % # % # % # % # % # % # % # % # %
CCC Part-time 358 0.1 78,318 13.2 185,603 31.3 128,742 21.7 120,517 20.3 46,490 7.8 17,523 3.0 15,020 2.5 592,570 100 Full-time 966 0.6 25,235 16.6 42,381 27.9 31,514 20.7 29,703 19.5 14,489 9.5 4,347 2.9 3,381 2.2 152,015 100 All 1,324 0.2 103,553 13.9 227,983 30.6 160,256 21.5 150,219 20.2 60,979 8.2 21,870 2.9 18,401 2.5 744,585 100
UC Part-time 686 17.5 811 20.7 338 8.6 529 13.5 523 13.4 214 5.5 219 5.6 591 15.1 3,910 100 Full-time 1,832 13.1 4,527 32.4 2,294 16.4 1,462 10.5 1,861 13.3 817 5.8 522 3.7 658 4.7 13,973 100 All 2,518 14.1 5,338 29.8 2,632 14.7 1,991 11.1 2,384 13.3 1,031 5.8 741 4.1 1,249 7.0 17,883 100
CSU Part-time 183 0.4 4,591 9.0 7,484 14.7 7,116 14.0 16,267 32.0 6,785 13.3 3,590 7.1 4,844 9.5 50,862 100 Full-time 1,746 2.1 11,608 13.9 11,788 14.2 12,541 15.1 18,320 22.0 11,486 13.8 6,056 7.3 9,758 11.7 83,302 100 All 1,929 1.4 16,199 12.1 19,272 14.4 19,657 14.7 34,587 25.8 18,271 13.6 9,646 7.2 14,602 10.9 134,164 100
ICU Part-time 181 1.9 1,414 14.6 2,658 27.4 1,286 13.3 1,763 18.2 1,145 11.8 390 4.0 850 8.8 9,687 100 Full-time 2,258 12.9 3,189 18.2 2,023 11.6 2,108 12.1 3,276 18.7 1,629 9.3 994 5.7 2,013 11.5 17,488 100 All 2,438 9.0 4,602 16.9 4,681 17.2 3,394 12.5 5,039 18.5 2,774 10.2 1,384 5.1 2,863 10.5 27,176 100
PCC Part-time - - 1,159 5.3 4,227 19.2 4,192 19.1 6,660 30.3 3,236 14.7 1,345 6.1 1,173 5.3 21,991 100 Full-time - - 4,215 8.2 9,018 17.6 10,614 20.7 13,233 25.8 7,533 14.7 3,182 6.2 3,433 6.7 51,226 100 All - - 5,374 7.3 13,245 18.1 14,806 20.2 19,893 27.2 10,769 14.7 4,527 6.2 4,605 6.3 73,218 100
ALL Part-time 1,407 0.2 86,292 12.7 200,311 29.5 141,864 20.9 145,730 21.5 57,871 8.5 23,067 3.4 22,478 3.3 679,021 100 Full-time 6,801 2.1 48,774 15.3 67,503 21.2 58,238 18.3 66,392 20.9 35,954 11.3 15,099 4.7 19,242 6.1 318,004 100 All 8,208 0.8 135,066 13.5 267,814 26.9 200,103 20.1 212,122 21.3 93,825 9.4 38,167 3.8 41,720 4.2 997,025 100
ALL UNDERGRADUATESPart-time 12,855 1.1 167,580 14.9 323,960 28.7 225,392 20.0 232,134 20.6 95,559 8.5 34,315 3.0 35,418 3.1 1,127,213 100 Full-time 108,909 11.1 197,265 20.1 187,570 19.2 142,318 14.5 168,778 17.2 92,458 9.4 36,607 3.7 45,399 4.6 979,303 100 All 121,765 5.8 364,845 17.3 511,530 24.3 367,710 17.5 400,911 19.0 188,018 8.9 70,922 3.4 80,816 3.8 2,106,516 100
3 to 6.9 Miles
3 to 6.9 Miles
Less Than Three Miles
Less Than Three Miles
Source: California Student Aid Commission 36 2003-04 SEARS

TABLE U-9: DISTANCE FROM CAMPUS BY SEGMENT, COURSE LOAD, AND DEPENDENCY STATUS
DEPENDENT UNDERGRADUATES
On Campus 7 to 10.9 Miles 11 to 20.9 Miles 21 to 30.9 Miles 31 to 39.9 Miles 40 or More Miles Total# % # % # % # % # % # % # % # % # %
CCC Part-time 2 0.2 188 17.3 329 30.4 215 19.8 215 19.8 88 8.1 23 2.1 24 2.2 1,084 100 Full-time 23 1.0 350 15.3 610 26.6 448 19.6 484 21.1 239 10.4 87 3.8 49 2.1 2,290 100 All 25 0.7 538 15.9 939 27.8 663 19.7 699 20.7 327 9.7 110 3.3 73 2.2 3,374 100
UC Part-time 129 28.1 141 30.7 30 6.5 37 8.1 43 9.4 22 4.8 20 4.4 37 8.1 459 100 Full-time 895 29.8 1,249 41.5 330 11.0 149 5.0 157 5.2 92 3.1 43 1.4 92 3.1 3,007 100 All 1,024 29.5 1,390 40.1 360 10.4 186 5.4 200 5.8 114 3.3 63 1.8 129 3.7 3,466 100
CSU Part-time 2 0.9 50 22.2 28 12.4 30 13.3 44 19.6 36 16.0 18 8.0 17 7.6 225 100 Full-time 324 16.5 446 22.8 283 14.5 206 10.5 300 15.3 207 10.6 81 4.1 111 5.7 1,958 100 All 326 14.9 496 22.7 311 14.2 236 10.8 344 15.8 243 11.1 99 4.5 128 5.9 2,183 100
ICU Part-time 100 64.1 17 10.9 9 5.8 6 3.8 10 6.4 3 1.9 1 0.6 10 6.4 156 100 Full-time 1,065 52.0 406 19.8 129 6.3 73 3.6 145 7.1 65 3.2 34 1.7 131 6.4 2,048 100 All 1,165 52.9 423 19.2 138 6.3 79 3.6 155 7.0 68 3.1 35 1.6 141 6.4 2,204 100
PCC Part-time - - 26 9.0 54 18.6 44 15.2 82 28.3 39 13.4 18 6.2 27 9.3 290 100 Full-time - - 128 11.8 189 17.5 170 15.7 229 21.1 156 14.4 74 6.8 137 12.7 1,083 100 All - - 154 11.2 243 17.7 214 15.6 311 22.7 195 14.2 92 6.7 164 11.9 1,373 100
ALL Part-time 233 10.5 422 19.1 450 20.3 332 15.0 394 17.8 188 8.5 80 3.6 115 5.2 2,214 100 Full-time 2,307 22.2 2,579 24.8 1,541 14.8 1,046 10.1 1,315 12.7 759 7.3 319 3.1 520 5.0 10,386 100 All 2,540 20.2 3,001 23.8 1,991 15.8 1,378 10.9 1,709 13.6 947 7.5 399 3.2 635 5.0 12,600 100
INDEPENDENT UNDERGRADUATES
On Campus 7 to 10.9 Miles 11 to 20.9 Miles 21 to 30.9 Miles 31 to 39.9 Miles 40 or More Miles Total# % # % # % # % # % # % # % # % # %
CCC Part-time 1 0.1 219 13.2 519 31.3 360 21.7 337 20.3 130 7.8 49 3.0 42 2.5 1,657 100 Full-time 8 0.6 209 16.6 351 27.9 261 20.7 246 19.5 120 9.5 36 2.9 28 2.2 1,259 100 All 9 0.3 428 14.7 870 29.8 621 21.3 583 20.0 250 8.6 85 2.9 70 2.4 2,916 100
UC Part-time 11 15.3 15 20.8 7 9.7 8 11.1 11 15.3 4 5.6 4 5.6 12 16.7 72 100 Full-time 49 13.5 114 31.4 59 16.3 39 10.7 49 13.5 23 6.3 14 3.9 16 4.4 363 100 All 60 13.8 129 29.7 66 15.2 47 10.8 60 13.8 27 6.2 18 4.1 28 6.4 435 100
CSU Part-time 4 0.7 66 10.9 81 13.4 84 13.9 174 28.8 77 12.7 45 7.4 74 12.2 605 100 Full-time 31 2.7 191 16.7 156 13.6 158 13.8 243 21.2 144 12.6 89 7.8 135 11.8 1,147 100 All 35 2.0 257 14.7 237 13.5 242 13.8 417 23.8 221 12.6 134 7.6 209 11.9 1,752 100
ICU Part-time 7 4.4 24 15.0 34 21.3 23 14.4 31 19.4 19 11.9 6 3.8 16 10.0 160 100 Full-time 48 13.4 69 19.2 39 10.9 40 11.1 67 18.7 33 9.2 21 5.8 42 11.7 359 100 All 55 10.6 93 17.9 73 14.1 63 12.1 98 18.9 52 10.0 27 5.2 58 11.2 519 100
PCC Part-time - - 44 7.3 108 17.9 113 18.8 179 29.7 91 15.1 32 5.3 35 5.8 602 100 Full-time - - 160 9.1 349 19.8 349 19.8 422 23.9 228 12.9 115 6.5 141 8.0 1,764 100 All - - 204 8.6 457 19.3 462 19.5 601 25.4 319 13.5 147 6.2 176 7.4 2,366 100
ALL Part-time 23 0.7 368 11.9 749 24.2 588 19.0 732 23.6 321 10.4 136 4.4 179 5.8 3,096 100 Full-time 136 2.8 743 15.2 954 19.5 847 17.3 1,027 21.0 548 11.2 275 5.6 362 7.4 4,892 100 All 159 2.0 1,111 13.9 1,703 21.3 1,435 18.0 1,759 22.0 869 10.9 411 5.1 541 6.8 7,988 100
ALL UNDERGRADUATESPart-time 256 4.8 790 14.9 1,199 22.6 920 17.3 1,126 21.2 509 9.6 216 4.1 294 5.5 5,310 100 Full-time 2,443 16.0 3,322 21.7 2,495 16.3 1,893 12.4 2,342 15.3 1,307 8.6 594 3.9 882 5.8 15,278 100 All 2,699 13.1 4,112 20.0 3,694 17.9 2,813 13.7 3,468 16.8 1,816 8.8 810 3.9 1,176 5.7 20,588 100
3 to 6.9 Miles
3 to 6.9 Miles
Less Than Three Miles
Less Than Three Miles
Source: California Student Aid Commission 37 2003-04 SEARS
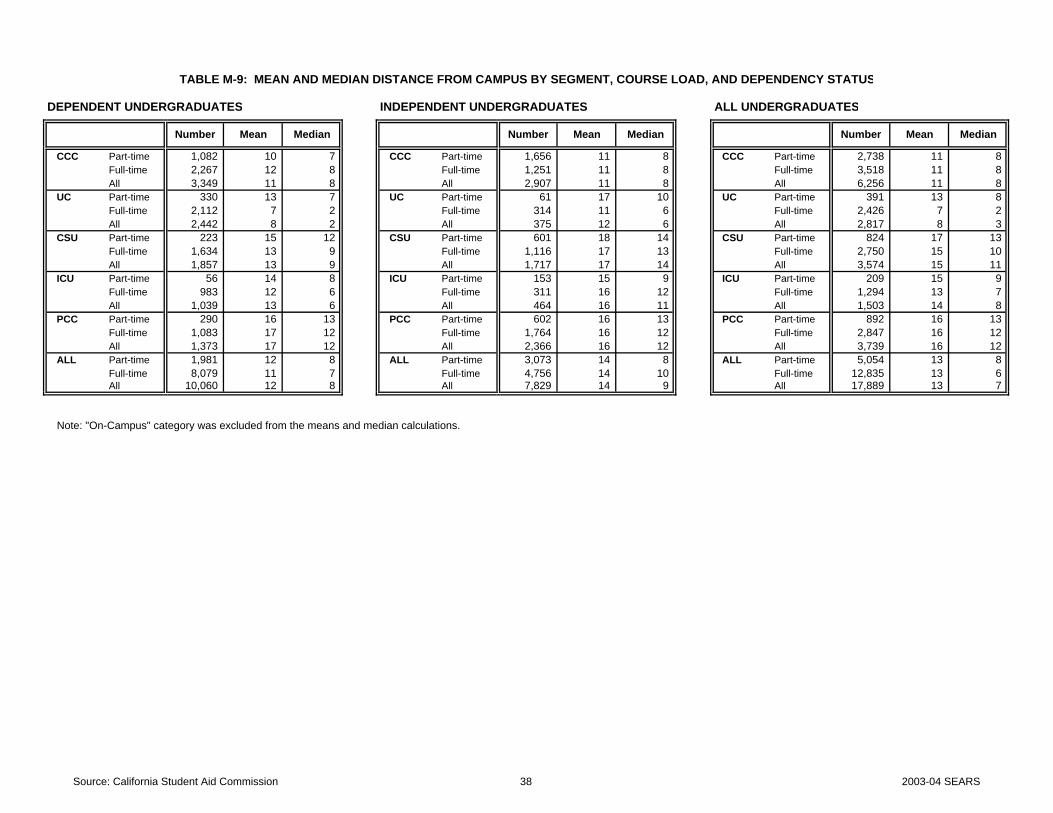
DEPENDENT UNDERGRADUATES INDEPENDENT UNDERGRADUATES ALL UNDERGRADUATES
CCC Part-time 1,082 10 7 CCC Part-time 1,656 11 8 CCC Part-time 2,738 11 8 Full-time 2,267 12 8 Full-time 1,251 11 8 Full-time 3,518 11 8 All 3,349 11 8 All 2,907 11 8 All 6,256 11 8
UC Part-time 330 13 7 UC Part-time 61 17 10 UC Part-time 391 13 8 Full-time 2,112 7 2 Full-time 314 11 6 Full-time 2,426 7 2 All 2,442 8 2 All 375 12 6 All 2,817 8 3
CSU Part-time 223 15 12 CSU Part-time 601 18 14 CSU Part-time 824 17 13 Full-time 1,634 13 9 Full-time 1,116 17 13 Full-time 2,750 15 10
All 1,857 13 9 All 1,717 17 14 All 3,574 15 11 ICU Part-time 56 14 8 ICU Part-time 153 15 9 ICU Part-time 209 15 9 Full-time 983 12 6 Full-time 311 16 12 Full-time 1,294 13 7
All 1,039 13 6 All 464 16 11 All 1,503 14 8 PCC Part-time 290 16 13 PCC Part-time 602 16 13 PCC Part-time 892 16 13 Full-time 1,083 17 12 Full-time 1,764 16 12 Full-time 2,847 16 12
All 1,373 17 12 All 2,366 16 12 All 3,739 16 12 ALL Part-time 1,981 12 8 ALL Part-time 3,073 14 8 ALL Part-time 5,054 13 8
Full-time 8,079 11 7 Full-time 4,756 14 10 Full-time 12,835 13 6 All 10,060 12 8 All 7,829 14 9 All 17,889 13 7
Note: "On-Campus" category was excluded from the means and median calculations.
TABLE M-9: MEAN AND MEDIAN DISTANCE FROM CAMPUS BY SEGMENT, COURSE LOAD, AND DEPENDENCY STATUS
Number Mean Median Number MedianMean Median Number Mean
Source: California Student Aid Commission 38 2003-04 SEARS

Question for Tables: W-10 and U-10
With how many roommates or housemates do you share some, or all, of the living expenses while
attending college? Exclude yourself, spouse, children, parents, or other family members. 0 None 1 One 2 Two 3 Three 4 Four 5 Five 6 Six or more
39 2003-04 SEARS

TABLE W-10: NUMBER OF ROOMMATES BY SEGMENT, COURSE LOAD, AND DEPENDENCY STATUSDEPENDENT UNDERGRADUATES
None One RoommateSix or More Roommates Total
# % # % # % # % # % # % # % # %CCC Part-time 237,457 60.9 33,974 8.7 32,185 8.3 28,967 7.4 17,523 4.5 19,669 5.0 20,027 5.1 389,802 100
Full-time 184,857 67.0 20,888 7.6 18,474 6.7 17,628 6.4 14,248 5.2 10,505 3.8 9,297 3.4 275,897 100 All 422,314 63.4 54,862 8.2 50,659 7.6 46,595 7.0 31,771 4.8 30,174 4.5 29,324 4.4 665,699 100
UC Part-time 10,072 35.6 8,069 28.5 3,951 14.0 3,466 12.2 1,761 6.2 345 1.2 637 2.3 28,299 100 Full-time 28,538 25.1 26,683 23.4 19,754 17.3 20,957 18.4 8,757 7.7 4,368 3.8 4,842 4.3 113,898 100 All 38,610 27.2 34,752 24.4 23,705 16.7 24,423 17.2 10,517 7.4 4,712 3.3 5,479 3.9 142,198 100
CSU Part-time 11,567 56.8 1,638 8.0 5,666 27.8 928 4.6 123 0.6 127 0.6 329 1.6 20,377 100 Full-time 70,405 45.5 28,385 18.3 40,875 26.4 9,171 5.9 3,019 1.9 1,312 0.8 1,734 1.1 154,901 100 All 81,972 46.8 30,023 17.1 46,541 26.6 10,099 5.8 3,141 1.8 1,439 0.8 2,063 1.2 175,278 100
ICU Part-time 3,128 58.4 911 17.0 563 10.5 619 11.6 - - 42 0.8 93 1.7 5,356 100 Full-time 38,428 42.1 22,902 25.1 9,125 10.0 14,145 15.5 3,014 3.3 1,152 1.3 2,611 2.9 91,377 100 All 41,556 43.0 23,813 24.6 9,688 10.0 14,764 15.3 3,014 3.1 1,194 1.2 2,703 2.8 96,732 100
PCC Part-time 3,475 53.5 879 13.5 493 7.6 736 11.3 355 5.5 257 4.0 300 4.6 6,493 100 Full-time 12,335 51.6 3,986 16.7 2,035 8.5 2,369 9.9 1,644 6.9 829 3.5 715 3.0 23,912 100 All 15,810 52.0 4,864 16.0 2,528 8.3 3,105 10.2 1,999 6.6 1,086 3.6 1,014 3.3 30,406 100
ALL Part-time 265,698 59.0 45,471 10.1 42,856 9.5 34,716 7.7 19,761 4.4 20,439 4.5 21,385 4.7 450,327 100 Full-time 334,563 50.7 102,844 15.6 90,264 13.7 64,270 9.7 30,682 4.6 18,166 2.8 19,199 2.9 659,986 100 All 600,261 54.1 148,314 13.4 133,120 12.0 98,986 8.9 50,443 4.5 38,605 3.5 40,584 3.7 1,110,313 100
INDEPENDENT UNDERGRADUATES
None One RoommateSix or More Roommates Total
# % # % # % # % # % # % # % # %CCC Part-time 395,166 66.8 65,801 11.1 43,272 7.3 33,974 5.7 22,530 3.8 15,378 2.6 15,735 2.7 591,856 100
Full-time 85,848 56.7 19,560 12.9 15,093 10.0 11,108 7.3 8,452 5.6 5,071 3.3 6,399 4.2 151,532 100 All 481,014 64.7 85,361 11.5 58,365 7.9 45,082 6.1 30,982 4.2 20,449 2.8 22,134 3.0 743,388 100
UC Part-time 2,096 53.6 1,081 27.6 338 8.6 230 5.9 165 4.2 - - - - 3,910 100 Full-time 6,138 44.0 3,663 26.3 1,501 10.8 1,672 12.0 404 2.9 166 1.2 391 2.8 13,936 100 All 8,234 46.1 4,744 26.6 1,839 10.3 1,902 10.7 569 3.2 166 0.9 391 2.2 17,846 100
CSU Part-time 24,366 47.8 3,416 6.7 12,318 24.1 10,262 20.1 559 1.1 - - 96 0.2 51,018 100 Full-time 32,549 39.2 8,559 10.3 30,306 36.5 9,898 11.9 773 0.9 504 0.6 404 0.5 82,993 100 All 56,915 42.5 11,975 8.9 42,624 31.8 20,160 15.0 1,332 1.0 504 0.4 501 0.4 134,010 100
ICU Part-time 7,520 76.5 1,469 14.9 387 3.9 403 4.1 - - - - 54 0.6 9,833 100 Full-time 10,833 61.6 3,194 18.2 1,925 10.9 1,171 6.7 213 1.2 180 1.0 66 0.4 17,582 100 All 18,353 66.9 4,663 17.0 2,313 8.4 1,574 5.7 213 0.8 180 0.7 120 0.4 27,415 100
PCC Part-time 14,957 68.0 2,914 13.2 1,905 8.7 744 3.4 807 3.7 458 2.1 211 1.0 21,995 100 Full-time 31,434 61.4 7,564 14.8 4,940 9.6 3,987 7.8 1,581 3.1 692 1.4 997 1.9 51,197 100 All 46,391 63.4 10,479 14.3 6,846 9.4 4,731 6.5 2,387 3.3 1,150 1.6 1,208 1.7 73,192 100
ALL Part-time 444,104 65.4 74,681 11.0 58,221 8.6 45,613 6.7 24,061 3.5 15,836 2.3 16,096 2.4 678,612 100 Full-time 166,802 52.6 42,540 13.4 53,766 16.9 27,836 8.8 11,423 3.6 6,613 2.1 8,259 2.6 317,238 100 All 610,907 61.3 117,221 11.8 111,986 11.2 73,449 7.4 35,483 3.6 22,449 2.3 24,355 2.4 995,850 100
ALL UNDERGRADUATESPart-time 709,803 62.9 120,151 10.6 101,077 9.0 80,329 7.1 43,822 3.9 36,275 3.2 37,481 3.3 1,128,939 100 Full-time 501,365 51.3 145,384 14.9 144,029 14.7 92,106 9.4 42,104 4.3 24,779 2.5 27,457 2.8 977,224 100 All 1,211,168 57.5 265,535 12.6 245,106 11.6 172,435 8.2 85,926 4.1 61,054 2.9 64,939 3.1 2,106,163 100
Two Roommates Three Roommates
Two Roommates Three Roommates
Four Roomates Five Roomates
Four Roomates Five Roomates
Source: California Student Aid Commission 40 2003-04 SEARS

TABLE U-10: NUMBER OF ROOMMATES BY SEGMENT, COURSE LOAD, AND DEPENDENCY STATUSDEPENDENT UNDERGRADUATES
None One RoommateSix or More Roommates Total
# % # % # % # % # % # % # % # %CCC Part-time 664 60.9 95 8.7 90 8.3 81 7.4 49 4.5 55 5.0 56 5.1 1,090 100
Full-time 1,531 67.0 173 7.6 153 6.7 146 6.4 118 5.2 87 3.8 77 3.4 2,285 100 All 2,195 65.0 268 7.9 243 7.2 227 6.7 167 4.9 142 4.2 133 3.9 3,375 100
UC Part-time 161 35.1 131 28.5 64 13.9 58 12.6 29 6.3 6 1.3 10 2.2 459 100 Full-time 769 25.6 691 23.0 511 17.0 565 18.8 227 7.6 113 3.8 127 4.2 3,003 100 All 930 26.9 822 23.7 575 16.6 623 18.0 256 7.4 119 3.4 137 4.0 3,462 100
CSU Part-time 126 56.3 21 9.4 61 27.2 9 4.0 3 1.3 1 0.4 3 1.3 224 100 Full-time 842 43.2 421 21.6 507 26.0 110 5.6 37 1.9 13 0.7 19 1.0 1,949 100 All 968 44.5 442 20.3 568 26.1 119 5.5 40 1.8 14 0.6 22 1.0 2,173 100
ICU Part-time 96 61.5 27 17.3 15 9.6 15 9.6 - - 1 0.6 2 1.3 156 100 Full-time 923 45.2 518 25.4 186 9.1 268 13.1 64 3.1 24 1.2 58 2.8 2,041 100 All 1,019 46.4 545 24.8 201 9.1 283 12.9 64 2.9 25 1.1 60 2.7 2,197 100
PCC Part-time 156 52.7 48 16.2 27 9.1 29 9.8 21 7.1 5 1.7 10 3.4 296 100 Full-time 584 53.3 141 12.9 113 10.3 126 11.5 56 5.1 33 3.0 43 3.9 1,096 100 All 740 53.2 189 13.6 140 10.1 155 11.1 77 5.5 38 2.7 53 3.8 1,392 100
ALL Part-time 1,203 54.1 322 14.5 257 11.6 192 8.6 102 4.6 68 3.1 81 3.6 2,225 100 Full-time 4,649 44.8 1,944 18.7 1,470 14.2 1,215 11.7 502 4.8 270 2.6 324 3.1 10,374 100 All 5,852 46.4 2,266 18.0 1,727 13.7 1,407 11.2 604 4.8 338 2.7 405 3.2 12,599 100
INDEPENDENT UNDERGRADUATES
None One RoommateSix or More Roommates Total
# % # % # % # % # % # % # % # %CCC Part-time 1,105 66.8 184 11.1 121 7.3 95 5.7 63 3.8 43 2.6 44 2.7 1,655 100
Full-time 711 56.7 162 12.9 125 10.0 92 7.3 70 5.6 42 3.3 53 4.2 1,255 100 All 1,816 62.4 346 11.9 246 8.5 187 6.4 133 4.6 85 2.9 97 3.3 2,910 100
UC Part-time 37 51.4 20 27.8 7 9.7 4 5.6 4 5.6 - - - - 72 100 Full-time 160 44.2 94 26.0 38 10.5 45 12.4 11 3.0 4 1.1 10 2.8 362 100 All 197 45.4 114 26.3 45 10.4 49 11.3 15 3.5 4 0.9 10 2.3 434 100
CSU Part-time 283 46.6 39 6.4 154 25.4 125 20.6 4 0.7 - - 2 0.3 607 100 Full-time 414 36.2 125 10.9 452 39.5 137 12.0 8 0.7 5 0.4 4 0.3 1,145 100 All 697 39.8 164 9.4 606 34.6 262 15.0 12 0.7 5 0.3 6 0.3 1,752 100
ICU Part-time 118 73.3 27 16.8 8 5.0 7 4.3 - - - - 1 0.6 161 100 Full-time 223 61.9 64 17.8 40 11.1 22 6.1 5 1.4 4 1.1 2 0.6 360 100 All 341 65.5 91 17.5 48 9.2 29 5.6 5 1.0 4 0.8 3 0.6 521 100
PCC Part-time 379 62.6 88 14.5 53 8.8 33 5.5 26 4.3 15 2.5 11 1.8 605 100 Full-time 1,032 58.5 262 14.8 183 10.4 118 6.7 82 4.6 38 2.2 50 2.8 1,765 100 All 1,411 59.5 350 14.8 236 10.0 151 6.4 108 4.6 53 2.2 61 2.6 2,370 100
ALL Part-time 1,922 62.0 358 11.5 343 11.1 264 8.5 97 3.1 58 1.9 58 1.9 3,100 100 Full-time 2,540 52.7 707 14.7 838 17.4 414 8.6 176 3.7 93 1.9 51 1.1 4,819 100 All 4,462 56.3 1,065 13.4 1,181 14.9 678 8.6 273 3.4 151 1.9 109 1.4 7,919 100
ALL UNDERGRADUATESPart-time 3,125 58.7 680 12.8 600 11.3 456 8.6 199 3.7 126 2.4 139 2.6 5,325 100 Full-time 7,189 47.3 2,651 17.4 2,308 15.2 1,629 10.7 678 4.5 363 2.4 375 2.5 15,193 100 All 10,314 50.3 3,331 16.2 2,908 14.2 2,085 10.2 877 4.3 489 2.4 514 2.5 20,518 100
Two Roommates Three Roommates Four Roomates Five Roomates
Two Roommates Three Roommates Four Roomates Five Roomates
Source: California Student Aid Commission 41 2003-04 SEARS

Questions for Tables: W-11 and U-11
For how much of the 2003-04 academic year (e.g., September through May or October through June) do
you intend to be enrolled in college? 0 At least two semesters or three quarters 1 Less than two semesters or three quarters
Note: For PCC and CCC version of this question please refer to appendices.
42 2003-04 SEARS

TABLE W-11: ACADEMIC YEAR ENROLLMENT BY SEGMENT, COURSE LOAD, AND DEPENDENCY STATUS
Will Attend Full-Year Will Not Attend Full-YearDependent Independent All Dependent Independent All# % # % # % # % # % # % # %
CCC Part-time 327,934 33.2 462,040 46.8 789,974 80.0 63,298 6.4 133,748 13.6 197,046 20.0 987,020 100 Full-time 242,692 56.4 126,659 29.4 369,351 85.8 35,257 8.2 25,839 6.0 61,096 14.2 430,447 100 All 570,626 40.3 588,699 41.5 1,159,325 81.8 98,555 7.0 159,587 11.3 258,142 18.2 1,417,467 100
UC Part-time 26,037 80.7 3,412 10.6 29,449 91.2 2,332 7.2 499 1.5 2,831 8.8 32,280 100 Full-time 105,339 82.2 12,392 9.7 117,731 91.9 8,825 6.9 1,581 1.2 10,406 8.1 128,137 100 All 131,376 81.9 15,804 9.9 147,180 91.7 11,157 7.0 2,079 1.3 13,236 8.3 160,416 100
CSU Part-time 18,327 25.6 44,125 61.6 62,452 87.2 2,175 3.0 6,997 9.8 9,171 12.8 71,623 100 Full-time 149,654 62.3 75,510 31.4 225,164 93.7 6,877 2.9 8,157 3.4 15,034 6.3 240,198 100 All 167,981 53.9 119,635 38.4 287,616 92.2 9,052 2.9 15,153 4.9 24,205 7.8 311,821 100
ICU Part-time 4,703 30.7 7,935 51.8 12,638 82.5 653 4.3 2,020 13.2 2,672 17.5 15,310 100 Full-time 88,694 80.7 16,451 15.0 105,145 95.7 3,447 3.1 1,248 1.1 4,695 4.3 109,840 100 All 93,397 74.6 24,386 19.5 117,783 94.1 4,100 3.3 3,267 2.6 7,367 5.9 125,150 100
PCC Part-time 6,142 21.5 20,400 71.4 26,542 92.8 368 1.3 1,676 5.9 2,045 7.2 28,587 100 Full-time 21,105 27.9 44,872 59.3 65,977 87.2 2,886 3.8 6,795 9.0 9,680 12.8 75,657 100 All 27,247 26.1 65,272 62.6 92,519 88.8 3,254 3.1 8,471 8.1 11,725 11.2 104,244 100
ALL Part-time 383,143 33.8 537,912 47.4 921,055 81.2 68,826 6.1 144,939 12.8 213,765 18.8 1,134,820 100 Full-time 607,484 61.7 275,884 28.0 883,368 89.7 57,292 5.8 43,618 4.4 100,910 10.3 984,278 100 All 990,627 46.7 813,796 38.4 1,804,423 85.2 126,118 6.0 188,557 8.9 314,675 14.8 2,119,098 100
Total
Source: California Student Aid Commission 43 2003-04 SEARS

TABLE U-11: ACADEMIC YEAR ENROLLMENT BY SEGMENT, COURSE LOAD, AND DEPENDENCY STATUS
Will Attend Full-Year Will Not Attend Full-YearDependent Independent All Dependent Independent All# % # % # % # % # % # % # %
CCC Part-time 917 33.2 1,292 46.8 2,209 80.0 177 6.4 374 13.6 551 20.0 2,760 100 Full-time 2,010 56.4 1,049 29.4 3,059 85.8 292 8.2 214 6.0 506 14.2 3,565 100 All 2,927 46.3 2,341 37.0 5,268 83.3 469 7.4 588 9.3 1,057 16.7 6,325 100
UC Part-time 420 78.9 60 11.3 480 90.2 40 7.5 12 2.3 52 9.8 532 100 Full-time 2,781 82.4 321 9.5 3,102 92.0 229 6.8 42 1.2 271 8.0 3,373 100 All 3,201 82.0 381 9.8 3,582 91.7 269 6.9 54 1.4 323 8.3 3,905 100
CSU Part-time 200 24.0 527 63.2 727 87.2 25 3.0 82 9.8 107 12.8 834 100 Full-time 1,892 60.6 1,046 33.5 2,938 94.2 76 2.4 106 3.4 182 5.8 3,120 100 All 2,092 52.9 1,573 39.8 3,665 92.7 101 2.6 188 4.8 289 7.3 3,954 100
ICU Part-time 144 45.0 132 41.3 276 86.3 12 3.8 32 10.0 44 13.8 320 100 Full-time 1,983 81.9 336 13.9 2,319 95.7 77 3.2 26 1.1 103 4.3 2,422 100 All 2,127 77.6 468 17.1 2,595 94.6 89 3.2 58 2.1 147 5.4 2,742 100
PCC Part-time 273 30.2 534 59.0 807 89.2 24 2.7 74 8.2 98 10.8 905 100 Full-time 959 33.3 1,434 49.7 2,393 83.0 144 5.0 346 12.0 490 17.0 2,883 100 All 1,232 32.5 1,968 52.0 3,200 84.5 168 4.4 420 11.1 588 15.5 3,788 100
ALL Part-time 1,954 36.5 2,545 47.6 4,499 84.1 278 5.2 574 10.7 852 15.9 5,351 100 Full-time 9,625 62.7 4,186 27.2 13,811 89.9 818 5.3 734 4.8 1,552 10.1 15,363 100 All 11,579 55.9 6,731 32.5 18,310 88.4 1,096 5.3 1,308 6.3 2,404 11.6 20,714 100
Total
Source: California Student Aid Commission 44 2003-04 SEARS
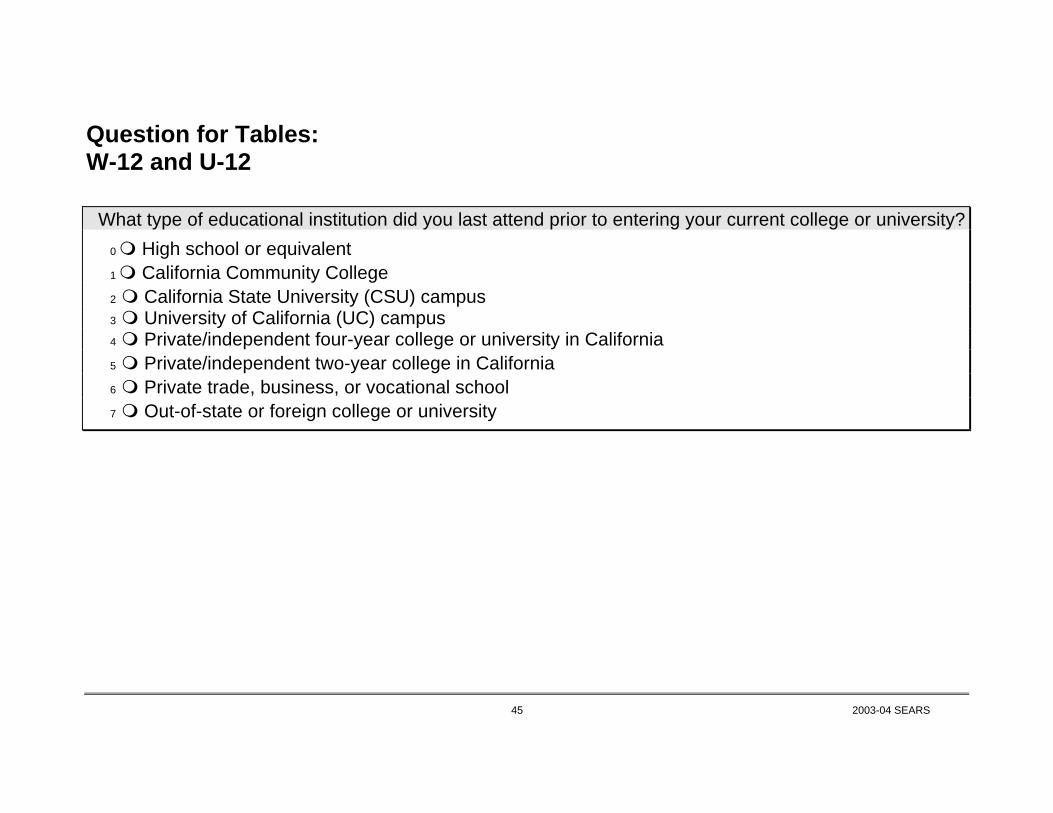
Question for Tables: W-12 and U-12
What type of educational institution did you last attend prior to entering your current college or university? 0 High school or equivalent 1 California Community College 2 California State University (CSU) campus 3 University of California (UC) campus 4 Private/independent four-year college or university in California 5 Private/independent two-year college in California 6 Private trade, business, or vocational school 7 Out-of-state or foreign college or university
45 2003-04 SEARS

TABLE W-12: PREVIOUS EDUCATIONAL INSTITUTION ATTENDED BY SEGMENT, COURSE LOAD, AND DEPENDENCY STATUS
DEPENDENT UNDERGRADUATESHigh School /
Equivalent CCC CSU UC Independent Four-Year
Independent Two-Year
Private Career College Out-of-State Total
# % # % # % # % # % # % # % # % # %CCC Part-time 312,199 80.0 32,901 8.4 13,589 3.5 5,007 1.3 5,722 1.5 1,431 0.4 8,583 2.2 10,728 2.7 390,159 100
Full-time 232,067 83.7 19,077 6.9 7,848 2.8 2,536 0.9 2,536 0.9 483 0.2 3,622 1.3 8,935 3.2 277,104 100 All 544,266 81.6 51,978 7.8 21,437 3.2 7,542 1.1 8,258 1.2 1,913 0.3 12,205 1.8 19,663 2.9 667,262 100
UC Part-time 24,371 86.2 2,941 10.4 250 0.9 566 2.0 - - 37 0.1 - - 107 0.4 28,272 100 Full-time 94,907 83.5 15,598 13.7 500 0.4 1,295 1.1 168 0.1 170 0.1 - - 986 0.9 113,624 100 All 119,278 84.1 18,539 13.1 750 0.5 1,861 1.3 168 0.1 207 0.1 - - 1,094 0.8 141,896 100
CSU Part-time 11,246 55.1 8,170 40.0 408 2.0 63 0.3 158 0.8 - - - - 373 1.8 20,418 100 Full-time 103,276 66.3 41,716 26.8 4,027 2.6 2,205 1.4 882 0.6 570 0.4 202 0.1 2,833 1.8 155,711 100 All 114,522 65.0 49,886 28.3 4,435 2.5 2,269 1.3 1,040 0.6 570 0.3 202 0.1 3,206 1.8 176,130 100
ICU Part-time 4,125 78.4 457 8.7 112 2.1 43 0.8 220 4.2 89 1.7 - - 215 4.1 5,262 100 Full-time 73,340 80.6 8,645 9.5 898 1.0 906 1.0 2,520 2.8 415 0.5 80 0.1 4,221 4.6 91,025 100 All 77,465 80.5 9,102 9.5 1,010 1.0 949 1.0 2,740 2.8 505 0.5 80 0.1 4,436 4.6 96,287 100
PCC Part-time 3,938 60.5 1,795 27.6 22 0.3 21 0.3 46 0.7 200 3.1 198 3.0 290 4.5 6,510 100 Full-time 13,765 57.6 6,093 25.5 623 2.6 97 0.4 251 1.0 463 1.9 923 3.9 1,701 7.1 23,915 100 All 17,703 58.2 7,887 25.9 645 2.1 118 0.4 297 1.0 663 2.2 1,121 3.7 1,991 6.5 30,425 100
ALL Part-time 355,879 79.0 46,263 10.3 14,382 3.2 5,700 1.3 6,147 1.4 1,757 0.4 8,781 1.9 11,714 2.6 450,622 100 Full-time 517,355 78.2 91,129 13.8 13,895 2.1 7,038 1.1 6,355 1.0 2,101 0.3 4,828 0.7 18,677 2.8 661,379 100 All 873,234 78.5 137,392 12.4 28,277 2.5 12,738 1.1 12,502 1.1 3,858 0.3 13,608 1.2 30,390 2.7 1,112,000 100
INDEPENDENT UNDERGRADUATESHigh School /
Equivalent CCC CSU UC Independent Four-Year
Independent Two-Year
Private Career College Out-of-State Total
# % # % # % # % # % # % # % # % # %CCC Part-time 264,994 45.0 119,444 20.3 47,205 8.0 17,881 3.0 10,013 1.7 10,013 1.7 45,060 7.7 74,027 12.6 588,637 100
Full-time 87,418 58.3 23,545 15.7 5,433 3.6 1,690 1.1 1,328 0.9 1,449 1.0 8,090 5.4 21,009 14.0 149,963 100 All 352,412 47.7 142,989 19.4 52,638 7.1 19,571 2.6 11,341 1.5 11,462 1.6 53,150 7.2 95,036 12.9 738,600 100
UC Part-time 1,367 35.0 1,991 50.9 196 5.0 141 3.6 40 1.0 - - - - 175 4.5 3,910 100 Full-time 4,082 29.3 9,011 64.7 117 0.8 251 1.8 78 0.6 40 0.3 37 0.3 315 2.3 13,931 100 All 5,449 30.5 11,002 61.7 313 1.8 392 2.2 118 0.7 40 0.2 37 0.2 491 2.8 17,841 100
CSU Part-time 5,546 10.9 37,897 74.5 2,194 4.3 1,300 2.6 1,422 2.8 691 1.4 25 0.0 1,817 3.6 50,892 100 Full-time 13,878 16.6 57,276 68.6 3,250 3.9 1,691 2.0 1,138 1.4 930 1.1 501 0.6 4,879 5.8 83,544 100 All 19,424 14.4 95,173 70.8 5,444 4.0 2,991 2.2 2,560 1.9 1,622 1.2 526 0.4 6,696 5.0 134,436 100
ICU Part-time 1,162 11.8 4,982 50.4 685 6.9 290 2.9 434 4.4 776 7.8 275 2.8 1,283 13.0 9,886 100 Full-time 3,892 22.2 7,761 44.3 1,324 7.6 488 2.8 728 4.2 318 1.8 550 3.1 2,461 14.0 17,520 100 All 5,054 18.4 12,742 46.5 2,009 7.3 778 2.8 1,161 4.2 1,093 4.0 825 3.0 3,744 13.7 27,407 100
PCC Part-time 5,626 25.6 9,337 42.5 1,382 6.3 389 1.8 526 2.4 543 2.5 2,435 11.1 1,731 7.9 21,969 100 Full-time 16,547 32.5 18,897 37.1 2,857 5.6 777 1.5 1,197 2.3 1,327 2.6 4,422 8.7 4,920 9.7 50,943 100 All 22,173 30.4 28,234 38.7 4,239 5.8 1,166 1.6 1,723 2.4 1,870 2.6 6,856 9.4 6,651 9.1 72,912 100
ALL Part-time 278,696 41.3 173,651 25.7 51,662 7.7 20,000 3.0 12,434 1.8 12,023 1.8 47,794 7.1 79,033 11.7 675,294 100 Full-time 125,817 39.8 116,490 36.9 12,981 4.1 4,898 1.6 4,469 1.4 4,063 1.3 13,600 4.3 33,584 10.6 315,901 100 All 404,513 40.8 290,140 29.3 64,643 6.5 24,898 2.5 16,903 1.7 16,086 1.6 61,395 6.2 112,618 11.4 991,195 100
ALL UNDERGRADUATESPart-time 634,575 56.4 219,914 19.5 66,044 5.9 25,700 2.3 18,581 1.7 13,780 1.2 56,575 5.0 90,747 8.1 1,125,916 100 Full-time 643,172 65.8 207,619 21.2 26,876 2.8 11,936 1.2 10,824 1.1 6,164 0.6 18,428 1.9 52,261 5.3 977,280 100 All 1,277,747 60.8 427,533 20.3 92,920 4.4 37,636 1.8 29,405 1.4 19,944 0.9 75,003 3.6 143,008 6.8 2,103,196 100
Source: California Student Aid Commission 46 2003-04 SEARS

TABLE U-12: PREVIOUS EDUCATIONAL INSTITUTION ATTENDED BY SEGMENT, COURSE LOAD, AND DEPENDENCY STATUS
DEPENDENT UNDERGRADUATESHigh School /
Equivalent CCC CSU UC Independent Four-Year
Independent Two-Year
Private Career College Out-of-State Total
# % # % # % # % # % # % # % # % # %CCC Part-time 873 80.0 92 8.4 38 3.5 14 1.3 16 1.5 4 0.4 24 2.2 30 2.7 1,091 100
Full-time 1,922 83.7 158 6.9 65 2.8 21 0.9 21 0.9 4 0.2 30 1.3 74 3.2 2,295 100 All 2,795 82.5 250 7.4 103 3.0 35 1.0 37 1.1 8 0.2 54 1.6 104 3.1 3,386 100
UC Part-time 390 85.2 52 11.4 4 0.9 9 2.0 - - 1 0.2 - - 2 0.4 458 100 Full-time 2,508 83.7 408 13.6 13 0.4 34 1.1 4 0.1 5 0.2 - - 25 0.8 2,997 100 All 2,898 83.9 460 13.3 17 0.5 43 1.2 4 0.1 6 0.2 - - 27 0.8 3,455 100
CSU Part-time 119 53.1 92 41.1 7 3.1 1 0.4 2 0.9 - - - - 3 1.3 224 100 Full-time 1,291 65.9 521 26.6 47 2.4 35 1.8 13 0.7 10 0.5 4 0.2 37 1.9 1,958 100 All 1,410 64.6 613 28.1 54 2.5 36 1.6 15 0.7 10 0.5 4 0.2 40 1.8 2,182 100
ICU Part-time 124 81.0 9 5.9 2 1.3 2 1.3 6 3.9 2 1.3 - - 8 5.2 153 100 Full-time 1,647 81.0 180 8.8 22 1.1 20 1.0 54 2.7 10 0.5 1 0.0 100 4.9 2,034 100 All 1,771 81.0 189 8.6 24 1.1 22 1.0 60 2.7 12 0.5 1 0.0 108 4.9 2,187 100
PCC Part-time 196 66.0 69 23.2 2 0.7 2 0.7 4 1.3 5 1.7 3 1.0 16 5.4 297 100 Full-time 633 57.7 289 26.3 36 3.3 8 0.7 15 1.4 18 1.6 35 3.2 64 5.8 1,098 100 All 829 59.4 358 25.7 38 2.7 10 0.7 19 1.4 23 1.6 38 2.7 80 5.7 1,395 100
ALL Part-time 1,702 76.6 314 14.1 53 2.4 28 1.3 28 1.3 12 0.5 27 1.2 59 2.7 2,223 100 Full-time 8,001 77.1 1,556 15.0 183 1.8 118 1.1 107 1.0 47 0.5 70 0.7 300 2.9 10,382 100 All 9,703 77.0 1,870 14.8 236 1.9 146 1.2 135 1.1 59 0.5 97 0.8 359 2.8 12,605 100
INDEPENDENT UNDERGRADUATESHigh School /
Equivalent CCC CSU UC Independent Four-Year
Independent Two-Year
Private Career College Out-of-State Total
# % # % # % # % # % # % # % # % # %CCC Part-time 741 45.0 334 20.3 132 8.0 50 3.0 28 1.7 28 1.7 126 7.7 207 12.6 1,646 100
Full-time 724 58.3 195 15.7 45 3.6 14 1.1 11 0.9 12 1.0 67 5.4 174 14.0 1,242 100 All 1,465 50.7 529 18.3 177 6.1 64 2.2 39 1.4 40 1.4 193 6.7 381 13.2 2,888 100
UC Part-time 24 33.3 37 51.4 4 5.6 2 2.8 1 1.4 - - - - 4 5.6 72 100 Full-time 108 29.8 233 64.4 3 0.8 6 1.7 2 0.6 1 0.3 1 0.3 8 2.2 362 100 All 132 30.4 270 62.2 7 1.6 8 1.8 3 0.7 1 0.2 1 0.2 12 2.8 434 100
CSU Part-time 64 10.6 447 73.8 27 4.5 15 2.5 15 2.5 9 1.5 1 0.2 28 4.6 606 100 Full-time 181 15.7 805 69.9 45 3.9 21 1.8 14 1.2 10 0.9 5 0.4 70 6.1 1,151 100 All 245 13.9 1,252 71.3 72 4.1 36 2.0 29 1.7 19 1.1 6 0.3 98 5.6 1,757 100
ICU Part-time 23 14.1 83 50.9 13 8.0 5 3.1 7 4.3 3 1.8 5 3.1 24 14.7 163 100 Full-time 81 22.6 158 44.0 27 7.5 12 3.3 16 4.5 6 1.7 9 2.5 50 13.9 359 100 All 104 19.9 241 46.2 40 7.7 17 3.3 23 4.4 9 1.7 14 2.7 74 14.2 522 100
PCC Part-time 178 29.5 225 37.3 40 6.6 9 1.5 14 2.3 22 3.6 55 9.1 61 10.1 604 100 Full-time 636 36.3 598 34.2 83 4.7 25 1.4 42 2.4 49 2.8 141 8.1 177 10.1 1,751 100 All 814 34.6 823 34.9 123 5.2 34 1.4 56 2.4 71 3.0 196 8.3 238 10.1 2,355 100
ALL Part-time 1,030 33.3 1,126 36.4 216 7.0 81 2.6 65 2.1 62 2.0 187 6.0 324 10.5 3,091 100 Full-time 1,730 35.6 1,989 40.9 203 4.2 78 1.6 85 1.7 78 1.6 223 4.6 479 9.8 4,865 100 All 2,760 34.7 3,115 39.2 419 5.3 159 2.0 150 1.9 140 1.8 410 5.2 803 10.1 7,956 100
ALL UNDERGRADUATESPart-time 2,732 51.4 1,440 27.1 269 5.1 109 2.1 93 1.8 74 1.4 214 4.0 383 7.2 5,314 100 Full-time 9,731 63.8 3,545 23.3 386 2.5 196 1.3 192 1.3 125 0.8 293 1.9 779 5.1 15,247 100 All 12,463 60.6 4,985 24.2 655 3.2 305 1.5 285 1.4 199 1.0 507 2.5 1,162 5.7 20,561 100
Source: California Student Aid Commission 47 2003-04 SEARS

Questions for Tables: W-13.1 and U-13.1 (Mother’s Education Level) W-13.2 and U-13.2 (Father’s Education Level)
What is the highest level of education attained by your parents? Please answer even if one or both of
your parents are deceased, or if your parents are separated or divorced. Please check only one for each parent.
Mother’s Education Father’s Education No formal education 00 00 Grade school (K-8) 01 01 Some high school 02 02 High school diploma 03 03 Some college classes 04 04 Private trade, business or vocational school 05 05 Two-year college degree/certificate 06 06 Four-year college degree (BA, BS, etc.) 07 07 Teaching credential 08 08 Some post-baccalaureate classes 09 09 Post-baccalaureate degree (MA, Ph.D., JD, etc.) 10 10 I do not know 11 11
48 2003-04 SEARS

TABLE W-13.1: MOTHER'S EDUCATION LEVEL BY SEGMENT, COURSE LOAD, AND DEPENDENCY STATUS
DEPENDENT UNDERGRADUATES
Less Than High School Diploma
High School Diploma
Some College Classes
Vocational, Two-Year Degree
Attained Four-Year Degree
Credential/Post Baccalaureate
DegreeI Do Not Know Total
# % # % # % # % # % # % # % # %CCC Part-time 94,768 24.4 69,020 17.8 82,609 21.3 46,848 12.1 47,563 12.2 30,755 7.9 17,166 4.4 388,729 100
Full-time 55,421 20.1 46,727 17.0 64,235 23.4 40,328 14.7 37,913 13.8 19,560 7.1 10,867 4.0 275,051 100 All 150,189 22.6 115,747 17.4 146,844 22.1 87,176 13.1 85,476 12.9 50,315 7.6 28,033 4.2 663,780 100
UC Part-time 6,456 23.2 4,142 14.9 4,747 17.1 2,668 9.6 6,448 23.2 2,766 9.9 604 2.2 27,831 100 Full-time 13,074 11.6 14,139 12.5 16,935 15.0 12,551 11.1 30,034 26.6 24,880 22.0 1,259 1.1 112,872 100 All 19,530 13.9 18,281 13.0 21,682 15.4 15,219 10.8 36,482 25.9 27,646 19.6 1,863 1.3 140,702 100
CSU Part-time 4,509 22.0 3,156 15.4 4,101 20.0 2,639 12.9 3,299 16.1 2,254 11.0 544 2.7 20,502 100 Full-time 28,713 18.5 24,883 16.0 29,505 19.0 22,934 14.8 28,275 18.2 18,258 11.8 2,602 1.7 155,170 100 All 33,222 18.9 28,039 16.0 33,606 19.1 25,573 14.6 31,574 18.0 20,512 11.7 3,146 1.8 175,672 100
ICU Part-time 445 8.4 662 12.5 503 9.5 737 13.9 1,630 30.8 1,156 21.8 160 3.0 5,293 100 Full-time 6,806 7.5 9,935 11.0 15,730 17.4 12,341 13.6 25,405 28.1 19,425 21.5 819 0.9 90,460 100 All 7,250 7.6 10,597 11.1 16,233 17.0 13,078 13.7 27,035 28.2 20,581 21.5 979 1.0 95,753 100
PCC Part-time 1,815 28.4 931 14.5 1,265 19.8 904 14.1 784 12.2 233 3.6 471 7.4 6,402 100 Full-time 5,556 23.5 5,903 24.9 4,646 19.6 2,544 10.7 2,900 12.2 1,148 4.8 986 4.2 23,683 100 All 7,371 24.5 6,833 22.7 5,911 19.6 3,448 11.5 3,684 12.2 1,381 4.6 1,457 4.8 30,085 100
ALL Part-time 107,993 24.1 77,911 17.4 93,226 20.8 53,796 12.0 59,723 13.3 37,163 8.3 18,945 4.2 448,756 100 Full-time 109,570 16.7 101,587 15.5 131,051 19.9 90,698 13.8 124,527 18.9 83,271 12.7 16,533 2.5 657,236 100 All 217,563 19.7 179,498 16.2 224,276 20.3 144,494 13.1 184,250 16.7 120,434 10.9 35,478 3.2 1,105,993 100
INDEPENDENT UNDERGRADUATES
Less Than High School Diploma
High School Diploma
Some College Classes
Vocational, Two-Year Degree
Attained Four-Year Degree
Credential/Post Baccalaureate
DegreeI Do Not Know Total
# % # % # % # % # % # % # % # %CCC Part-time 202,768 35.0 125,523 21.7 79,748 13.8 63,656 11.0 50,424 8.7 34,689 6.0 21,815 3.8 578,623 100
Full-time 49,987 33.7 26,322 17.7 24,390 16.4 17,145 11.6 13,765 9.3 7,365 5.0 9,418 6.3 148,392 100 All 252,755 34.8 151,845 20.9 104,138 14.3 80,801 11.1 64,189 8.8 42,054 5.8 31,233 4.3 727,015 100
UC Part-time 958 24.5 724 18.5 561 14.3 527 13.5 736 18.8 405 10.4 - - 3,910 100 Full-time 2,854 20.7 2,667 19.4 2,301 16.7 1,315 9.5 2,648 19.2 1,787 13.0 195 1.4 13,767 100 All 3,812 21.6 3,391 19.2 2,862 16.2 1,842 10.4 3,384 19.1 2,192 12.4 195 1.1 17,677 100
CSU Part-time 13,059 25.9 12,095 23.9 8,661 17.1 5,939 11.8 6,279 12.4 3,893 7.7 583 1.2 50,508 100 Full-time 22,093 26.8 16,736 20.3 16,923 20.5 9,475 11.5 9,007 10.9 6,579 8.0 1,596 1.9 82,408 100 All 35,152 26.4 28,831 21.7 25,584 19.2 15,413 11.6 15,286 11.5 10,472 7.9 2,178 1.6 132,917 100
ICU Part-time 1,683 17.1 3,586 36.5 1,106 11.3 1,009 10.3 913 9.3 1,318 13.4 201 2.1 9,816 100 Full-time 3,568 20.6 4,086 23.6 2,984 17.2 1,764 10.2 1,980 11.4 2,454 14.1 509 2.9 17,344 100 All 5,251 19.3 7,671 28.2 4,090 15.1 2,773 10.2 2,893 10.7 3,772 13.9 710 2.6 27,161 100
PCC Part-time 6,309 29.3 4,902 22.8 3,203 14.9 2,653 12.3 2,045 9.5 1,154 5.4 1,268 5.9 21,534 100 Full-time 12,520 24.8 13,536 26.9 8,161 16.2 5,330 10.6 5,447 10.8 2,752 5.5 2,647 5.3 50,394 100 All 18,829 26.2 18,438 25.6 11,365 15.8 7,983 11.1 7,491 10.4 3,906 5.4 3,915 5.4 71,927 100
ALL Part-time 224,777 33.8 146,830 22.1 93,279 14.0 73,784 11.1 60,396 9.1 41,459 6.2 23,867 3.6 664,392 100 Full-time 91,021 29.1 63,347 20.3 54,759 17.5 35,028 11.2 32,847 10.5 20,938 6.7 14,365 4.6 312,306 100 All 315,798 32.3 210,177 21.5 148,039 15.2 108,812 11.1 93,243 9.5 62,397 6.4 38,232 3.9 976,697 100
ALL UNDERGRADUATESPart-time 332,770 29.9 224,741 20.2 186,505 16.8 127,579 11.5 120,119 10.8 78,622 7.1 42,812 3.8 1,113,148 100 Full-time 200,591 20.7 164,934 17.0 185,810 19.2 125,726 13.0 157,374 16.2 104,209 10.7 30,898 3.2 969,542 100 All 533,361 25.6 389,675 18.7 372,315 17.9 253,305 12.2 277,493 13.3 182,831 8.8 73,709 3.5 2,082,690 100
Source: California Student Aid Commission 49 2003-04 SEARS

TABLE U-13.1: MOTHER'S EDUCATION LEVEL BY SEGMENT, COURSE LOAD, AND DEPENDENCY STATUS
DEPENDENT UNDERGRADUATES
Less Than High School Diploma
High School Diploma
Some College Classes
Vocational, Two-Year Degree
Attained Four-Year Degree
Credential/Post Baccalaureate
DegreeI Do Not Know Total
# % # % # % # % # % # % # % # %CCC Part-time 265 24.4 193 17.8 231 21.3 131 12.1 133 12.2 86 7.9 48 4.4 1,087 100
Full-time 459 20.1 387 17.0 532 23.4 334 14.7 314 13.8 162 7.1 90 4.0 2,278 100 All 724 21.5 580 17.2 763 22.7 465 13.8 447 13.3 248 7.4 138 4.1 3,365 100
UC Part-time 102 22.7 66 14.7 73 16.2 43 9.6 108 24.0 48 10.7 10 2.2 450 100 Full-time 343 11.5 373 12.5 445 15.0 331 11.1 798 26.8 652 21.9 34 1.1 2,976 100 All 445 13.0 439 12.8 518 15.1 374 10.9 906 26.4 700 20.4 44 1.3 3,426 100
CSU Part-time 48 21.3 33 14.7 46 20.4 27 12.0 41 18.2 23 10.2 7 3.1 225 100 Full-time 346 17.8 298 15.3 381 19.6 271 13.9 372 19.1 250 12.8 28 1.4 1,946 100 All 394 18.1 331 15.2 427 19.7 298 13.7 413 19.0 273 12.6 35 1.6 2,171 100
ICU Part-time 7 4.6 12 7.9 16 10.5 19 12.5 52 34.2 44 28.9 2 1.3 152 100 Full-time 134 6.7 198 9.8 347 17.3 245 12.2 589 29.3 480 23.9 18 0.9 2,011 100 All 141 6.5 210 9.7 363 16.8 264 12.2 641 29.6 524 24.2 20 0.9 2,163 100
PCC Part-time 73 25.1 58 19.9 54 18.6 38 13.1 33 11.3 16 5.5 19 6.5 291 100 Full-time 264 24.2 257 23.6 202 18.5 134 12.3 126 11.5 52 4.8 56 5.1 1,091 100 All 337 24.4 315 22.8 256 18.5 172 12.4 159 11.5 68 4.9 75 5.4 1,382 100
ALL Part-time 495 22.4 362 16.4 420 19.0 258 11.7 367 16.6 217 9.8 86 3.9 2,205 100 Full-time 1,546 15.0 1,513 14.7 1,907 18.5 1,315 12.8 2,199 21.3 1,596 15.5 226 2.2 10,302 100 All 2,041 16.3 1,875 15.0 2,327 18.6 1,573 12.6 2,566 20.5 1,813 14.5 312 2.5 12,507 100
INDEPENDENT UNDERGRADUATES
Less Than High School Diploma
High School Diploma
Some College Classes
Vocational, Two-Year Degree
Attained Four-Year Degree
Credential/Post Baccalaureate
DegreeI Do Not Know Total
# % # % # % # % # % # % # % # %CCC Part-time 567 35.0 351 21.7 223 13.8 178 11.0 141 8.7 97 6.0 61 3.8 1,618 100
Full-time 414 33.7 218 17.7 202 16.4 142 11.6 114 9.3 61 5.0 78 6.3 1,229 100 All 981 34.5 569 20.0 425 14.9 320 11.2 255 9.0 158 5.5 139 4.9 2,847 100
UC Part-time 17 23.6 12 16.7 12 16.7 10 13.9 12 16.7 9 12.5 - - 72 100 Full-time 76 21.2 70 19.6 59 16.5 34 9.5 67 18.7 47 13.1 5 1.4 358 100 All 93 21.6 82 19.1 71 16.5 44 10.2 79 18.4 56 13.0 5 1.2 430 100
CSU Part-time 155 25.7 139 23.1 103 17.1 74 12.3 72 11.9 53 8.8 7 1.2 603 100 Full-time 262 23.0 234 20.5 237 20.8 146 12.8 130 11.4 111 9.7 20 1.8 1,140 100 All 417 23.9 373 21.4 340 19.5 220 12.6 202 11.6 164 9.4 27 1.5 1,743 100
ICU Part-time 28 17.3 48 29.6 19 11.7 18 11.1 17 10.5 28 17.3 4 2.5 162 100 Full-time 69 19.4 81 22.8 62 17.5 37 10.4 42 11.8 54 15.2 10 2.8 355 100 All 97 18.8 129 25.0 81 15.7 55 10.6 59 11.4 82 15.9 14 2.7 517 100
PCC Part-time 127 21.4 153 25.8 86 14.5 91 15.3 72 12.1 31 5.2 34 5.7 594 100 Full-time 431 24.9 424 24.5 291 16.8 191 11.0 196 11.3 86 5.0 115 6.6 1,734 100 All 558 24.0 577 24.8 377 16.2 282 12.1 268 11.5 117 5.0 149 6.4 2,328 100
ALL Part-time 894 29.3 703 23.1 443 14.5 371 12.2 314 10.3 218 7.1 106 3.5 3,049 100 Full-time 1,252 26.0 1,027 21.3 851 17.7 550 11.4 549 11.4 359 7.5 228 4.7 4,816 100 All 2,146 27.3 1,730 22.0 1,294 16.5 921 11.7 863 11.0 577 7.3 334 4.2 7,865 100
ALL UNDERGRADUATESPart-time 1,389 26.4 1,065 20.3 863 16.4 629 12.0 681 13.0 435 8.3 192 3.7 5,254 100 Full-time 2,798 18.5 2,540 16.8 2,758 18.2 1,865 12.3 2,748 18.2 1,955 12.9 454 3.0 15,118 100 All 4,187 20.6 3,605 17.7 3,621 17.8 2,494 12.2 3,429 16.8 2,390 11.7 646 3.2 20,372 100
Source: California Student Aid Commission 50 2003-04 SEARS

TABLE W-13.2: FATHER'S EDUCATION LEVEL BY SEGMENT, COURSE LOAD, AND DEPENDENCY STATUS
DEPENDENT UNDERGRADUATES
Less Than High School Diploma
High School Diploma
Some College Classes
Vocational, Two-Year Degree
Attained Four-Year Degree
Credential/Post Baccalaureate
DegreeI Do Not Know Total
# % # % # % # % # % # % # % # %CCC Part-time 94,411 24.9 56,861 15.0 69,020 18.2 52,570 13.9 47,205 12.5 29,325 7.7 29,325 7.7 378,717 100
Full-time 51,316 19.1 43,105 16.0 54,817 20.4 32,842 12.2 46,607 17.3 21,009 7.8 19,319 7.2 269,015 100 All 145,727 22.5 99,966 15.4 123,837 19.1 85,412 13.2 93,812 14.5 50,334 7.8 48,644 7.5 647,732 100
UC Part-time 5,887 21.3 3,261 11.8 3,871 14.0 1,905 6.9 7,136 25.8 4,693 16.9 937 3.4 27,690 100 Full-time 11,294 10.0 11,978 10.6 13,737 12.2 8,773 7.8 30,655 27.2 33,051 29.4 3,084 2.7 112,572 100 All 17,181 12.2 15,239 10.9 17,608 12.6 10,678 7.6 37,791 26.9 37,744 26.9 4,021 2.9 140,262 100
CSU Part-time 4,442 21.8 2,807 13.8 3,557 17.5 2,483 12.2 3,261 16.0 2,734 13.4 1,092 5.4 20,375 100 Full-time 26,645 17.4 22,906 14.9 25,652 16.7 18,132 11.8 33,392 21.8 20,332 13.2 6,391 4.2 153,450 100 All 31,087 17.9 25,713 14.8 29,209 16.8 20,615 11.9 36,653 21.1 23,066 13.3 7,483 4.3 173,825 100
ICU Part-time 372 7.0 491 9.3 631 11.9 531 10.0 1,345 25.4 1,791 33.9 125 2.4 5,286 100 Full-time 6,834 7.6 9,083 10.1 11,473 12.7 9,117 10.1 26,357 29.3 24,832 27.6 2,346 2.6 90,043 100 All 7,206 7.6 9,574 10.0 12,104 12.7 9,648 10.1 27,702 29.1 26,623 27.9 2,471 2.6 95,329 100
PCC Part-time 1,893 30.2 1,260 20.1 816 13.0 531 8.5 643 10.3 360 5.7 767 12.2 6,270 100 Full-time 4,841 21.2 4,668 20.5 4,063 17.8 2,548 11.2 3,209 14.1 1,439 6.3 2,019 8.9 22,786 100 All 6,734 23.2 5,927 20.4 4,880 16.8 3,079 10.6 3,852 13.3 1,798 6.2 2,786 9.6 29,057 100
ALL Part-time 107,005 24.4 64,680 14.8 77,896 17.8 58,020 13.2 59,589 13.6 38,902 8.9 32,246 7.4 438,338 100 Full-time 100,930 15.6 91,740 14.2 109,742 16.9 71,412 11.0 140,220 21.6 100,663 15.5 33,159 5.1 647,865 100 All 207,934 19.1 156,420 14.4 187,638 17.3 129,432 11.9 199,809 18.4 139,565 12.8 65,405 6.0 1,086,204 100
INDEPENDENT UNDERGRADUATES
Less Than High School Diploma
High School Diploma
Some College Classes
Vocational, Two-Year Degree
Attained Four-Year Degree
Credential/Post Baccalaureate
DegreeI Do Not Know Total
# % # % # % # % # % # % # % # %CCC Part-time 181,669 32.0 105,854 18.7 66,517 11.7 64,729 11.4 70,808 12.5 37,907 6.7 39,695 7.0 567,179 100
Full-time 45,761 31.2 24,631 16.8 17,266 11.8 16,059 11.0 18,232 12.4 10,142 6.9 14,489 9.9 146,580 100 All 227,430 31.9 130,485 18.3 83,783 11.7 80,788 11.3 89,040 12.5 48,049 6.7 54,184 7.6 713,759 100
UC Part-time 932 23.8 382 9.8 523 13.4 544 13.9 472 12.1 616 15.7 442 11.3 3,910 100 Full-time 2,483 18.1 2,289 16.7 1,783 13.0 1,167 8.5 2,609 19.0 2,501 18.2 898 6.5 13,730 100 All 3,415 19.4 2,670 15.1 2,306 13.1 1,711 9.7 3,081 17.5 3,117 17.7 1,340 7.6 17,641 100
CSU Part-time 11,437 22.8 10,470 20.9 7,557 15.1 5,429 10.8 8,600 17.2 5,372 10.7 1,207 2.4 50,071 100 Full-time 21,738 26.4 14,289 17.3 11,827 14.3 8,094 9.8 13,637 16.5 7,609 9.2 5,244 6.4 82,439 100 All 33,175 25.0 24,759 18.7 19,384 14.6 13,523 10.2 22,237 16.8 12,981 9.8 6,451 4.9 132,510 100
ICU Part-time 1,506 15.3 2,074 21.1 1,310 13.3 1,488 15.2 1,582 16.1 1,209 12.3 648 6.6 9,818 100 Full-time 3,149 18.3 3,021 17.6 2,261 13.2 2,212 12.9 3,204 18.7 2,741 16.0 574 3.3 17,161 100 All 4,655 17.3 5,095 18.9 3,571 13.2 3,700 13.7 4,786 17.7 3,950 14.6 1,222 4.5 26,979 100
PCC Part-time 5,759 27.4 5,131 24.4 2,277 10.8 2,651 12.6 2,175 10.4 946 4.5 2,050 9.8 20,989 100 Full-time 11,369 23.2 10,988 22.4 6,977 14.3 5,777 11.8 7,244 14.8 2,635 5.4 3,965 8.1 48,955 100 All 17,128 24.5 16,119 23.0 9,254 13.2 8,428 12.0 9,419 13.5 3,581 5.1 6,015 8.6 69,944 100
ALL Part-time 201,303 30.9 123,911 19.0 78,184 12.0 74,841 11.5 83,637 12.8 46,050 7.1 44,042 6.8 651,967 100 Full-time 84,500 27.4 55,218 17.9 40,114 13.0 33,310 10.8 44,926 14.5 25,629 8.3 25,170 8.1 308,865 100 All 285,803 29.7 179,128 18.6 118,297 12.3 108,151 11.3 128,563 13.4 71,678 7.5 69,212 7.2 960,832 100
ALL UNDERGRADUATESPart-time 308,308 28.3 188,591 17.3 156,080 14.3 132,861 12.2 143,225 13.1 84,952 7.8 76,289 7.0 1,090,306 100 Full-time 185,429 19.4 146,957 15.4 149,856 15.7 104,722 10.9 185,146 19.4 126,291 13.2 58,329 6.1 956,730 100 All 493,737 24.1 335,548 16.4 305,936 14.9 237,583 11.6 328,372 16.0 211,243 10.3 134,617 6.6 2,047,036 100
Source: California Student Aid Commission 51 2003-04 SEARS

TABLE U-13.2: FATHER'S EDUCATION LEVEL BY SEGMENT, COURSE LOAD, AND DEPENDENCY STATUS
DEPENDENT UNDERGRADUATES
Less Than High School Diploma
High School Diploma
Some College Classes
Vocational, Two-Year Degree
Attained Four-Year Degree
Credential/Post Baccalaureate
DegreeI Do Not Know Total
# % # % # % # % # % # % # % # %CCC Part-time 264 24.9 159 15.0 193 18.2 147 13.9 132 12.5 82 7.7 82 7.7 1,059 100
Full-time 425 19.1 357 16.0 454 20.4 272 12.2 386 17.3 174 7.8 160 7.2 2,228 100 All 689 21.0 516 15.7 647 19.7 419 12.7 518 15.8 256 7.8 242 7.4 3,287 100
UC Part-time 91 20.3 52 11.6 60 13.4 31 6.9 115 25.7 83 18.5 16 3.6 448 100 Full-time 293 9.9 316 10.6 363 12.2 236 8.0 809 27.3 871 29.3 80 2.7 2,968 100 All 384 11.2 368 10.8 423 12.4 267 7.8 924 27.0 954 27.9 96 2.8 3,416 100
CSU Part-time 49 21.9 31 13.8 44 19.6 24 10.7 35 15.6 29 12.9 12 5.4 224 100 Full-time 327 16.9 275 14.2 324 16.8 216 11.2 449 23.3 268 13.9 72 3.7 1,931 100 All 376 17.4 306 14.2 368 17.1 240 11.1 484 22.5 297 13.8 84 3.9 2,155 100
ICU Part-time 7 4.6 13 8.6 15 9.9 12 7.9 36 23.8 65 43.0 3 2.0 151 100 Full-time 136 6.8 198 9.9 237 11.9 197 9.9 582 29.1 601 30.1 49 2.5 2,000 100 All 143 6.6 211 9.8 252 11.7 209 9.7 618 28.7 666 31.0 52 2.4 2,151 100
PCC Part-time 75 26.4 62 21.8 43 15.1 22 7.7 32 11.3 17 6.0 33 11.6 284 100 Full-time 260 24.6 216 20.4 166 15.7 101 9.5 149 14.1 62 5.9 104 9.8 1,058 100 All 335 25.0 278 20.7 209 15.6 123 9.2 181 13.5 79 5.9 137 10.2 1,342 100
ALL Part-time 486 22.4 317 14.6 355 16.4 236 10.9 350 16.2 276 12.7 146 6.7 2,166 100 Full-time 1,441 14.1 1,362 13.4 1,544 15.2 1,022 10.0 2,375 23.3 1,976 19.4 465 4.6 10,185 100 All 1,927 15.6 1,679 13.6 1,899 15.4 1,258 10.2 2,725 22.1 2,252 18.2 611 4.9 12,351 100
INDEPENDENT UNDERGRADUATES
Less Than High School Diploma
High School Diploma
Some College Classes
Vocational, Two-Year Degree
Attained Four-Year Degree
Credential/Post Baccalaureate
DegreeI Do Not Know Total
# % # % # % # % # % # % # % # %CCC Part-time 508 32.0 296 18.7 186 11.7 181 11.4 198 12.5 106 6.7 111 7.0 1,586 100
Full-time 379 31.2 204 16.8 143 11.8 133 11.0 151 12.4 84 6.9 120 9.9 1,214 100 All 887 31.7 500 17.9 329 11.8 314 11.2 349 12.5 190 6.8 231 8.3 2,800 100
UC Part-time 16 22.2 7 9.7 11 15.3 10 13.9 9 12.5 11 15.3 8 11.1 72 100 Full-time 66 18.5 59 16.5 45 12.6 30 8.4 67 18.8 66 18.5 24 6.7 357 100 All 82 19.1 66 15.4 56 13.1 40 9.3 76 17.7 77 17.9 32 7.5 429 100
CSU Part-time 145 24.2 117 19.5 84 14.0 73 12.2 96 16.0 69 11.5 15 2.5 599 100 Full-time 261 22.9 192 16.9 181 15.9 125 11.0 199 17.5 114 10.0 67 5.9 1,139 100 All 406 23.4 309 17.8 265 15.2 198 11.4 295 17.0 183 10.5 82 4.7 1,738 100
ICU Part-time 27 16.7 31 19.1 23 14.2 16 9.9 28 17.3 26 16.0 11 6.8 162 100 Full-time 62 17.6 63 17.9 46 13.1 43 12.2 67 19.0 59 16.8 12 3.4 352 100 All 89 17.3 94 18.3 69 13.4 59 11.5 95 18.5 85 16.5 23 4.5 514 100
PCC Part-time 123 21.6 141 24.7 79 13.9 71 12.5 73 12.8 33 5.8 50 8.8 570 100 Full-time 388 23.2 372 22.2 223 13.3 187 11.2 237 14.2 97 5.8 170 10.2 1,674 100 All 511 22.8 513 22.9 302 13.5 258 11.5 310 13.8 130 5.8 220 9.8 2,244 100
ALL Part-time 819 27.4 592 19.8 383 12.8 351 11.7 404 13.5 245 8.2 195 6.5 2,989 100 Full-time 1,156 24.4 890 18.8 638 13.5 518 10.9 721 15.2 420 8.9 393 8.3 4,736 100 All 1,975 25.6 1,482 19.2 1,021 13.2 869 11.2 1,125 14.6 665 8.6 588 7.6 7,725 100
ALL UNDERGRADUATESPart-time 1,305 25.3 909 17.6 738 14.3 587 11.4 754 14.6 521 10.1 341 6.6 5,155 100 Full-time 2,597 17.4 2,252 15.1 2,182 14.6 1,540 10.3 3,096 20.7 2,396 16.1 858 5.8 14,921 100 All 3,902 19.4 3,161 15.7 2,920 14.5 2,127 10.6 3,850 19.2 2,917 14.5 1,199 6.0 20,076 100
Source: California Student Aid Commission 52 2003-04 SEARS

Question for Tables: W-14 and U-14
What is the current marital status of your parent(s)? 0 My parents are married to each other. 1 My parents are separated or divorced from one another, or my parent is widowed or single. 2 Both of my parents are deceased, 3 I am a ward of the court, or I was a ward of the court until age 18.
53 2003-04 SEARS

TABLE W-14: MARITAL STATUS OF PARENTS BY SEGMENT, COURSE LOAD, AND DEPENDENCY STATUS
DEPENDENT UNDERGRADUATES INDEPENDENT UNDERGRADUATES
MarriedSeparated,
Divorced, or Widowed
Parent Deceased; or Student Ward of
the CourtTotal Married
Separated, Divorced, or
Widowed
Parent Deceased; or Student Ward of
the CourtTotal
# % # % # % # % # % # % # % # %CCC Part-time 257,484 66.3 130,888 33.7 388,372 100 CCC Part-time 277,510 48.1 243,537 42.2 55,788 9.7 576,835 100
Full-time 192,584 69.7 83,916 30.3 276,500 100 Full-time 74,136 50.0 62,062 41.8 12,195 8.2 148,393 100 All 450,068 67.7 214,804 32.3 664,872 100 All 351,646 48.5 305,599 42.1 67,983 9.4 725,228 100
UC Part-time 21,609 76.6 6,583 23.4 28,192 100 UC Part-time 2,193 57.1 1,441 37.5 207 5.4 3,840 100 Full-time 83,024 73.3 30,315 26.7 113,339 100 Full-time 6,803 48.8 6,376 45.7 767 5.5 13,946 100 All 104,633 73.9 36,898 26.1 141,531 100 All 8,995 50.6 7,817 43.9 974 5.5 17,786 100
CSU Part-time 13,300 65.0 7,148 35.0 20,448 100 CSU Part-time 23,347 46.1 22,353 44.2 4,890 9.7 50,590 100 Full-time 107,786 69.2 47,879 30.8 155,665 100 Full-time 44,041 52.9 35,258 42.3 4,016 4.8 83,315 100 All 121,086 68.8 55,027 31.2 176,113 100 All 67,388 50.3 57,611 43.0 8,906 6.7 133,905 100
ICU Part-time 3,854 72.0 1,495 28.0 5,349 100 ICU Part-time 4,483 46.2 4,523 46.6 695 7.2 9,701 100 Full-time 66,899 73.7 23,853 26.3 90,752 100 Full-time 9,348 53.6 6,625 38.0 1,471 8.4 17,444 100 All 70,753 73.6 25,348 26.4 96,101 100 All 13,831 51.0 11,148 41.1 2,166 8.0 27,145 100
PCC Part-time 3,542 57.7 2,592 42.3 6,134 100 PCC Part-time 8,970 41.5 10,580 49.0 2,046 9.5 21,597 100 Full-time 14,617 61.9 9,014 38.1 23,631 100 Full-time 21,823 43.2 25,073 49.6 3,632 7.2 50,528 100 All 18,159 61.0 11,606 39.0 29,765 100 All 30,793 42.7 35,653 49.4 5,678 7.9 72,125 100
ALL Part-time 299,788 66.8 148,707 33.2 448,495 100 ALL Part-time 316,503 47.8 282,434 42.6 63,626 9.6 662,563 100 Full-time 464,910 70.5 194,977 29.5 659,887 100 Full-time 156,151 49.8 135,394 43.2 22,081 7.0 313,625 100 All 764,698 69.0 343,683 31.0 1,108,382 100 All 472,653 48.4 417,828 42.8 85,707 8.8 976,188 100
ALL UNDERGRADUATESPart-time 616,291 55.5 431,140 38.8 63,626 5.7 1,111,057 100 Full-time 621,061 63.8 330,371 33.9 22,081 2.3 973,512 100 All 1,237,351 59.4 761,511 36.5 85,707 4.1 2,084,570 100
By
defin
ition
stu
dent
s in
this
ca
tego
ry a
re c
onsi
dere
d in
depe
nden
t
Source: California Student Aid Commission 54 2003-04 SEARS
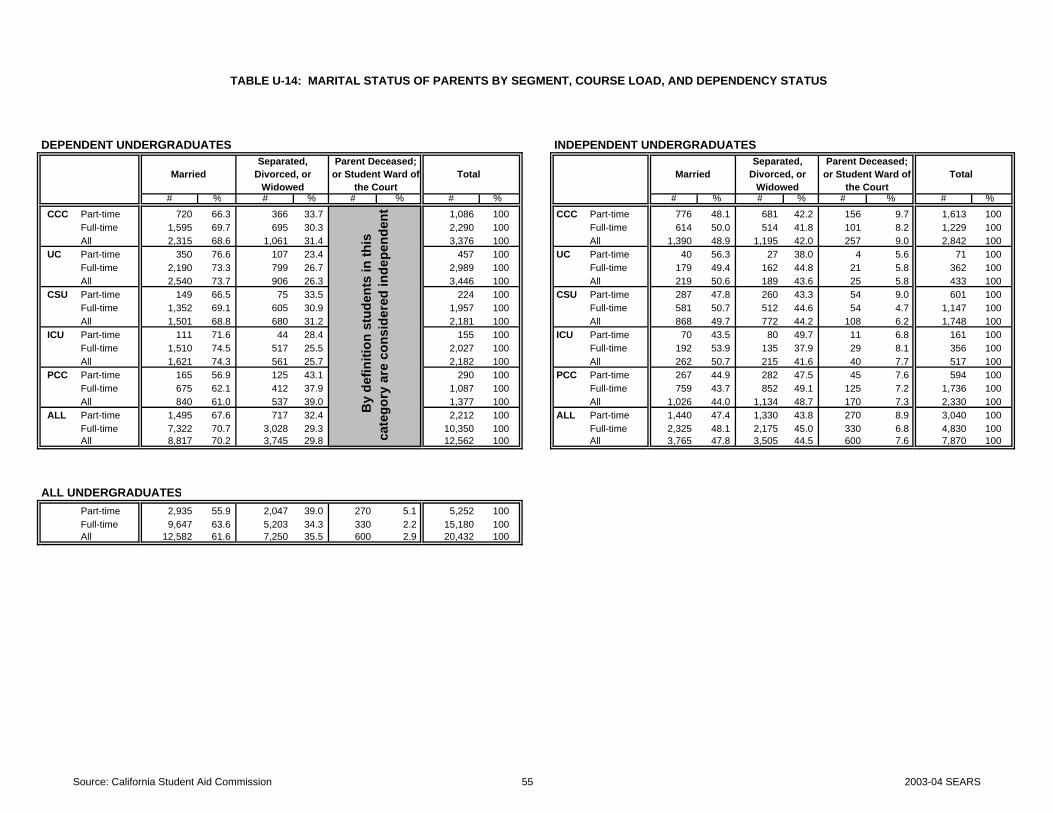
TABLE U-14: MARITAL STATUS OF PARENTS BY SEGMENT, COURSE LOAD, AND DEPENDENCY STATUS
DEPENDENT UNDERGRADUATES INDEPENDENT UNDERGRADUATES
MarriedSeparated,
Divorced, or Widowed
Parent Deceased; or Student Ward of
the CourtTotal Married
Separated, Divorced, or
Widowed
Parent Deceased; or Student Ward of
the CourtTotal
# % # % # % # % # % # % # % # %CCC Part-time 720 66.3 366 33.7 1,086 100 CCC Part-time 776 48.1 681 42.2 156 9.7 1,613 100
Full-time 1,595 69.7 695 30.3 2,290 100 Full-time 614 50.0 514 41.8 101 8.2 1,229 100 All 2,315 68.6 1,061 31.4 3,376 100 All 1,390 48.9 1,195 42.0 257 9.0 2,842 100
UC Part-time 350 76.6 107 23.4 457 100 UC Part-time 40 56.3 27 38.0 4 5.6 71 100 Full-time 2,190 73.3 799 26.7 2,989 100 Full-time 179 49.4 162 44.8 21 5.8 362 100 All 2,540 73.7 906 26.3 3,446 100 All 219 50.6 189 43.6 25 5.8 433 100
CSU Part-time 149 66.5 75 33.5 224 100 CSU Part-time 287 47.8 260 43.3 54 9.0 601 100 Full-time 1,352 69.1 605 30.9 1,957 100 Full-time 581 50.7 512 44.6 54 4.7 1,147 100 All 1,501 68.8 680 31.2 2,181 100 All 868 49.7 772 44.2 108 6.2 1,748 100
ICU Part-time 111 71.6 44 28.4 155 100 ICU Part-time 70 43.5 80 49.7 11 6.8 161 100 Full-time 1,510 74.5 517 25.5 2,027 100 Full-time 192 53.9 135 37.9 29 8.1 356 100 All 1,621 74.3 561 25.7 2,182 100 All 262 50.7 215 41.6 40 7.7 517 100
PCC Part-time 165 56.9 125 43.1 290 100 PCC Part-time 267 44.9 282 47.5 45 7.6 594 100 Full-time 675 62.1 412 37.9 1,087 100 Full-time 759 43.7 852 49.1 125 7.2 1,736 100 All 840 61.0 537 39.0 1,377 100 All 1,026 44.0 1,134 48.7 170 7.3 2,330 100
ALL Part-time 1,495 67.6 717 32.4 2,212 100 ALL Part-time 1,440 47.4 1,330 43.8 270 8.9 3,040 100 Full-time 7,322 70.7 3,028 29.3 10,350 100 Full-time 2,325 48.1 2,175 45.0 330 6.8 4,830 100 All 8,817 70.2 3,745 29.8 12,562 100 All 3,765 47.8 3,505 44.5 600 7.6 7,870 100
ALL UNDERGRADUATESPart-time 2,935 55.9 2,047 39.0 270 5.1 5,252 100 Full-time 9,647 63.6 5,203 34.3 330 2.2 15,180 100 All 12,582 61.6 7,250 35.5 600 2.9 20,432 100
By
defin
ition
stu
dent
s in
this
ca
tego
ry a
re c
onsi
dere
d in
depe
nden
t
Source: California Student Aid Commission 55 2003-04 SEARS

Question for Tables: W-15 and U-15 How many people, other than yourself, are dependent on your parent(s) for financial support?
Do NOT count your parent(s). 0 None 1 One 2 Two 3 Three 4 Four 5 Five 6 Six or more
56 2003-04 SEARS

TABLE W-15: PARENT(S)' NUMBER OF DEPENDENTS BY SEGMENT, COURSE LOAD, AND DEPENDENCY STATUS
DEPENDENT UNDERGRADUATESNone One Dependent Six or More Dependents Total
# % # % # % # % # % # % # % # %CCC Part-time 91,550 23.5 107,643 27.7 81,537 21.0 47,205 12.1 32,543 8.4 16,450 4.2 12,159 3.1 389,087 100
Full-time 56,870 20.6 81,622 29.5 63,752 23.1 35,015 12.7 20,768 7.5 9,418 3.4 9,056 3.3 276,501 100 All 148,420 22.3 189,265 28.4 145,289 21.8 82,220 12.4 53,311 8.0 25,868 3.9 21,215 3.2 665,588 100
UC Part-time 5,165 18.3 10,092 35.7 8,154 28.8 2,743 9.7 1,399 4.9 425 1.5 318 1.1 28,296 100 Full-time 24,033 21.2 46,687 41.2 24,581 21.7 11,006 9.7 3,871 3.4 1,693 1.5 1,468 1.3 113,338 100 All 29,198 20.6 56,779 40.1 32,735 23.1 13,749 9.7 5,269 3.7 2,118 1.5 1,786 1.3 141,633 100
CSU Part-time 5,173 25.4 7,426 36.5 3,891 19.1 2,198 10.8 1,447 7.1 167 0.8 62 0.3 20,365 100 Full-time 34,990 22.4 58,004 37.2 33,923 21.7 15,645 10.0 6,960 4.5 3,987 2.6 2,529 1.6 156,038 100 All 40,163 22.8 65,430 37.1 37,814 21.4 17,843 10.1 8,407 4.8 4,154 2.4 2,592 1.5 176,403 100
ICU Part-time 1,313 24.7 2,204 41.5 1,212 22.8 303 5.7 157 3.0 48 0.9 70 1.3 5,307 100 Full-time 18,673 20.5 35,068 38.5 21,896 24.1 8,999 9.9 3,624 4.0 1,873 2.1 857 0.9 90,990 100 All 19,986 20.8 37,272 38.7 23,108 24.0 9,302 9.7 3,781 3.9 1,921 2.0 927 1.0 96,297 100
PCC Part-time 1,872 28.8 1,750 26.9 1,388 21.4 473 7.3 460 7.1 252 3.9 302 4.7 6,497 100 Full-time 6,243 26.3 6,601 27.8 4,928 20.8 3,326 14.0 1,309 5.5 824 3.5 493 2.1 23,723 100 All 8,115 26.9 8,350 27.6 6,316 20.9 3,799 12.6 1,769 5.9 1,076 3.6 796 2.6 30,220 100
ALL Part-time 105,074 23.4 129,114 28.7 96,181 21.4 52,922 11.8 36,006 8.0 17,342 3.9 12,912 2.9 449,551 100 Full-time 140,809 21.3 227,982 34.5 149,080 22.6 73,991 11.2 36,532 5.5 17,794 2.7 14,403 2.2 660,590 100 All 245,882 22.1 357,096 32.2 245,261 22.1 126,913 11.4 72,538 6.5 35,136 3.2 27,315 2.5 1,110,141 100
INDEPENDENT UNDERGRADUATESNone One Dependent Six or More Dependents Total
# % # % # % # % # % # % # % # %CCC Part-time 353,683 61.7 81,179 14.2 59,007 10.3 36,119 6.3 16,808 2.9 11,444 2.0 15,378 2.7 573,618 100
Full-time 72,083 48.7 24,994 16.9 21,613 14.6 12,074 8.1 6,882 4.6 5,192 3.5 5,313 3.6 148,151 100 All 425,766 59.0 106,173 14.7 80,620 11.2 48,193 6.7 23,690 3.3 16,636 2.3 20,691 2.9 721,769 100
UC Part-time 1,485 39.1 1,054 27.7 323 8.5 688 18.1 141 3.7 40 1.0 70 1.8 3,801 100 Full-time 5,701 41.4 4,022 29.2 2,464 17.9 821 6.0 466 3.4 221 1.6 68 0.5 13,763 100 All 7,186 40.9 5,076 28.9 2,786 15.9 1,509 8.6 607 3.5 261 1.5 138 0.8 17,564 100
CSU Part-time 30,643 60.8 8,006 15.9 6,382 12.7 3,137 6.2 781 1.6 220 0.4 1,227 2.4 50,396 100 Full-time 42,025 50.8 15,666 18.9 11,621 14.0 5,698 6.9 3,957 4.8 1,939 2.3 1,889 2.3 82,795 100 All 72,668 54.6 23,672 17.8 18,003 13.5 8,835 6.6 4,738 3.6 2,159 1.6 3,115 2.3 133,190 100
ICU Part-time 6,144 63.1 2,116 21.7 758 7.8 444 4.6 175 1.8 - - 108 1.1 9,744 100 Full-time 9,046 52.0 3,778 21.7 1,946 11.2 1,356 7.8 419 2.4 444 2.6 401 2.3 17,389 100 All 15,190 56.0 5,894 21.7 2,704 10.0 1,799 6.6 594 2.2 444 1.6 509 1.9 27,134 100
PCC Part-time 13,522 62.8 3,132 14.6 2,766 12.8 823 3.8 640 3.0 247 1.1 396 1.8 21,526 100 Full-time 31,766 62.9 6,548 13.0 6,560 13.0 2,825 5.6 1,385 2.7 719 1.4 713 1.4 50,516 100 All 45,288 62.9 9,681 13.4 9,325 12.9 3,648 5.1 2,026 2.8 966 1.3 1,109 1.5 72,042 100
ALL Part-time 405,477 61.5 95,487 14.5 69,236 10.5 41,211 6.3 18,545 2.8 11,950 1.8 17,179 2.6 659,084 100 Full-time 160,621 51.4 55,009 17.6 44,204 14.1 22,774 7.3 13,110 4.2 8,515 2.7 8,383 2.7 312,615 100 All 566,098 58.3 150,495 15.5 113,439 11.7 63,985 6.6 31,655 3.3 20,465 2.1 25,562 2.6 971,699 100
ALL UNDERGRADUATESPart-time 510,551 46.1 224,601 20.3 165,417 14.9 94,133 8.5 54,551 4.9 29,292 2.6 30,091 2.7 1,108,636 100 Full-time 301,429 31.0 282,990 29.1 193,283 19.9 96,765 9.9 49,642 5.1 26,309 2.7 22,787 2.3 973,205 100 All 811,980 39.0 507,591 24.4 358,700 17.2 190,898 9.2 104,193 5.0 55,602 2.7 52,877 2.5 2,081,840 100
Note: Excludes Respondent
Two Dependents Five Dependents
Two Dependents Five Dependents
Three Dependents
Three Dependents
Four Dependents
Four Dependents
Source: California Student Aid Commission 57 2003-04 SEARS

TABLE U-15: PARENT(S)' NUMBER OF DEPENDENTS BY SEGMENT, COURSE LOAD, AND DEPENDENCY STATUS
DEPENDENT UNDERGRADUATESNone One Dependent Six or More Dependents Total
# % # % # % # % # % # % # % # %CCC Part-time 256 23.5 301 27.7 228 21.0 132 12.1 91 8.4 46 4.2 34 3.1 1,088 100
Full-time 471 20.6 676 29.5 528 23.1 290 12.7 172 7.5 78 3.4 75 3.3 2,290 100 All 727 21.5 977 28.9 756 22.4 422 12.5 263 7.8 124 3.7 109 3.2 3,378 100
UC Part-time 91 19.9 164 35.8 128 27.9 42 9.2 21 4.6 7 1.5 5 1.1 458 100 Full-time 631 21.1 1,228 41.1 651 21.8 295 9.9 101 3.4 44 1.5 39 1.3 2,989 100 All 722 20.9 1,392 40.4 779 22.6 337 9.8 122 3.5 51 1.5 44 1.3 3,447 100
CSU Part-time 55 24.7 80 35.9 48 21.5 21 9.4 15 6.7 3 1.3 1 0.4 223 100 Full-time 435 22.2 717 36.5 442 22.5 204 10.4 87 4.4 41 2.1 36 1.8 1,962 100 All 490 22.4 797 36.5 490 22.4 225 10.3 102 4.7 44 2.0 37 1.7 2,185 100
ICU Part-time 43 27.9 58 37.7 34 22.1 12 7.8 4 2.6 1 0.6 2 1.3 154 100 Full-time 436 21.5 796 39.2 479 23.6 198 9.7 68 3.3 38 1.9 17 0.8 2,032 100 All 479 21.9 854 39.1 513 23.5 210 9.6 72 3.3 39 1.8 19 0.9 2,186 100
PCC Part-time 91 30.7 83 28.0 63 21.3 27 9.1 17 5.7 8 2.7 7 2.4 296 100 Full-time 302 27.7 297 27.2 228 20.9 137 12.6 70 6.4 30 2.8 26 2.4 1,090 100 All 393 28.4 380 27.4 291 21.0 164 11.8 87 6.3 38 2.7 33 2.4 1,386 100
ALL Part-time 536 24.2 686 30.9 501 22.6 234 10.5 148 6.7 65 2.9 49 2.2 2,219 100 Full-time 2,275 22.0 3,714 35.8 2,328 22.5 1,124 10.8 498 4.8 231 2.2 193 1.9 10,363 100 All 2,811 22.3 4,400 35.0 2,829 22.5 1,358 10.8 646 5.1 296 2.4 242 1.9 12,582 100
INDEPENDENT UNDERGRADUATESNone One Dependent Six or More Dependents Total
# % # % # % # % # % # % # % # %CCC Part-time 989 61.7 227 14.2 165 10.3 101 6.3 47 2.9 32 2.0 43 2.7 1,604 100
Full-time 597 48.7 207 16.9 179 14.6 100 8.1 57 4.6 43 3.5 44 3.6 1,227 100 All 1,586 56.0 434 15.3 344 12.2 201 7.1 104 3.7 75 2.6 87 3.1 2,831 100
UC Part-time 30 42.9 18 25.7 6 8.6 12 17.1 2 2.9 1 1.4 1 1.4 70 100 Full-time 147 41.2 105 29.4 65 18.2 20 5.6 12 3.4 6 1.7 2 0.6 357 100 All 177 41.5 123 28.8 71 16.6 32 7.5 14 3.3 7 1.6 3 0.7 427 100
CSU Part-time 377 62.7 101 16.8 65 10.8 28 4.7 9 1.5 6 1.0 15 2.5 601 100 Full-time 592 52.1 221 19.5 149 13.1 76 6.7 48 4.2 27 2.4 23 2.0 1,136 100 All 969 55.8 322 18.5 214 12.3 104 6.0 57 3.3 33 1.9 38 2.2 1,737 100
ICU Part-time 104 64.6 27 16.8 16 9.9 7 4.3 4 2.5 - - 3 1.9 161 100 Full-time 184 51.8 75 21.1 43 12.1 27 7.6 8 2.3 10 2.8 8 2.3 355 100 All 288 55.8 102 19.8 59 11.4 34 6.6 12 2.3 10 1.9 11 2.1 516 100
PCC Part-time 362 61.4 95 16.1 70 11.9 33 5.6 16 2.7 8 1.4 6 1.0 590 100 Full-time 1,055 60.7 260 15.0 195 11.2 108 6.2 62 3.6 26 1.5 31 1.8 1,737 100 All 1,417 60.9 355 15.3 265 11.4 141 6.1 78 3.4 34 1.5 37 1.6 2,327 100
ALL Part-time 1,862 61.5 468 15.5 322 10.6 181 6.0 78 2.6 47 1.6 68 2.2 3,026 100 Full-time 2,575 53.5 868 18.0 631 13.1 331 6.9 187 3.9 112 2.3 108 2.2 4,812 100 All 4,437 56.6 1,336 17.0 953 12.2 512 6.5 265 3.4 159 2.0 176 2.2 7,838 100
ALL UNDERGRADUATESPart-time 2,398 45.7 1,154 22.0 823 15.7 415 7.9 226 4.3 112 2.1 117 2.2 5,245 100 Full-time 4,850 32.0 4,582 30.2 2,959 19.5 1,455 9.6 685 4.5 343 2.3 301 2.0 15,175 100 All 7,248 35.5 5,736 28.1 3,782 18.5 1,870 9.2 911 4.5 455 2.2 418 2.0 20,420 100
Note: Excludes Respondent
Two Dependents Three Dependents Four Dependents Five Dependents
Two Dependents Three Dependents Four Dependents Five Dependents
Source: California Student Aid Commission 58 2003-04 SEARS

Question for Tables: W-16, U-16, and M-16
What was the total combined income of your parents from all sources in calendar year 2000? Include
salaries, wages, retirement benefits, public assistance, income from investments, child support, and all other income. If you are not sure of the figure, please ask your parents or estimate.
00 Less than $6,000 08 $48,000 to $53,999 16 $96,000 to $107,999 01 $6,000 to $11,999 09 $54,000 to $59,999 17 $108,000 to $119,999 02 $12,000 to $17,999 10 $60,000 to $65,999 18 $120,000 to $143,999 03 $18,000 to $23,999 11 $66,000 to $71,999 19 $144,000 to $167,999 04 $24,000 to $29,999 12 $72,000 to $77,999 20 $168,000 to $191,999 05 $30,000 to $35,999 13 $78,000 to $83,999 21 $192,000 to $215,999 06 $36,000 to $41,999 14 $84,000 to $89,999 22 $216,000 to $239,999 07 $42,000 to $47,999 15 $90,000 to $95,999 23 $240,000 or more
59 2003-04 SEARS

DEPENDENT UNDERGRADUATES
$ % $ % $ % $ % $ % $ % $ % $ % $ % $ % $ % $ %CCC Part-time 16,808 4.6 21,815 6.0 26,821 7.4 30,397 8.4 27,894 7.7 28,252 7.8 20,384 5.6 13,589 3.8 21,815 6.0 13,947 3.9 18,954 5.2 13,232 3.7
Full-time 8,331 3.3 17,508 6.8 18,232 7.1 17,749 6.9 19,198 7.5 15,093 5.9 11,229 4.4 10,022 3.9 14,610 5.7 11,712 4.6 12,195 4.8 11,350 4.4 All 25,139 4.1 39,323 6.4 45,053 7.3 48,146 7.8 47,092 7.6 43,345 7.0 31,613 5.1 23,611 3.8 36,425 5.9 25,659 4.2 31,149 5.0 24,582 4.0
UC Part-time 851 3.1 1,926 7.0 2,071 7.6 1,347 4.9 1,834 6.7 2,260 8.2 1,387 5.1 1,028 3.8 1,746 6.4 1,030 3.8 1,062 3.9 1,157 4.2 Full-time 2,109 1.9 3,757 3.4 5,617 5.1 5,304 4.8 5,175 4.7 5,278 4.8 3,965 3.6 4,360 4.0 4,567 4.2 4,157 3.8 5,344 4.9 4,658 4.3 All 2,960 2.2 5,683 4.1 7,687 5.6 6,651 4.9 7,009 5.1 7,538 5.5 5,352 3.9 5,388 3.9 6,313 4.6 5,187 3.8 6,406 4.7 5,815 4.2
CSU Part-time 252 1.3 777 4.0 767 4.0 1,444 7.4 1,302 6.7 1,030 5.3 1,696 8.7 211 1.1 2,292 11.8 671 3.5 786 4.1 730 3.8 Full-time 5,399 3.6 7,313 4.8 10,240 6.8 7,896 5.2 7,904 5.2 7,605 5.0 7,144 4.7 7,147 4.7 8,035 5.3 7,366 4.9 8,878 5.9 4,960 3.3 All 5,652 3.3 8,091 4.7 11,007 6.5 9,339 5.5 9,207 5.4 8,635 5.1 8,840 5.2 7,358 4.3 10,327 6.1 8,037 4.7 9,664 5.7 5,690 3.3
ICU Part-time 40 0.8 219 4.5 351 7.2 187 3.8 140 2.9 95 1.9 144 2.9 189 3.9 66 1.4 315 6.4 274 5.6 148 3.0 Full-time 1,117 1.3 1,894 2.2 3,132 3.7 3,538 4.2 4,126 4.9 3,888 4.6 3,653 4.3 3,206 3.8 3,933 4.6 4,484 5.3 4,923 5.8 3,720 4.4 All 1,157 1.3 2,113 2.4 3,483 3.9 3,725 4.2 4,266 4.8 3,983 4.4 3,797 4.2 3,395 3.8 3,999 4.5 4,800 5.3 5,197 5.8 3,868 4.3
PCC Part-time 460 8.1 237 4.2 547 9.6 368 6.4 390 6.8 871 15.3 512 9.0 508 8.9 234 4.1 194 3.4 127 2.2 97 1.7 Full-time 1,318 6.1 1,278 5.9 1,612 7.5 1,614 7.5 2,202 10.2 1,825 8.5 1,265 5.9 1,051 4.9 1,406 6.5 730 3.4 1,004 4.7 796 3.7 All 1,778 6.5 1,515 5.6 2,159 7.9 1,981 7.3 2,592 9.5 2,696 9.9 1,777 6.5 1,559 5.7 1,640 6.0 924 3.4 1,130 4.1 893 3.3
ALL Part-time 18,411 4.4 24,974 6.0 30,556 7.3 33,742 8.1 31,560 7.5 32,508 7.8 24,122 5.8 15,525 3.7 26,153 6.2 16,158 3.9 21,202 5.1 15,364 3.7 Full-time 18,275 2.9 31,750 5.1 38,833 6.2 36,100 5.8 38,605 6.2 33,689 5.4 27,256 4.4 25,786 4.1 32,551 5.2 28,449 4.6 32,345 5.2 25,484 4.1 All 36,686 3.5 56,725 5.4 69,390 6.7 69,842 6.7 70,165 6.7 66,197 6.4 51,379 4.9 41,311 4.0 58,704 5.6 44,607 4.3 53,547 5.1 40,848 3.9
$240,000 or more
$ % $ % $ % $ % $ % $ % $ % $ % $ % $ % $ % $ % $ %CCC Part-time 13,232 3.7 9,298 2.6 10,013 2.8 14,662 4.1 17,523 4.8 8,225 2.3 9,298 2.6 5,364 1.5 2,146 0.6 4,291 1.2 1,788 0.5 11,801 3.3 361,550 100
Full-time 8,211 3.2 9,056 3.5 7,365 2.9 7,969 3.1 15,817 6.2 9,056 3.5 12,919 5.0 5,192 2.0 3,381 1.3 3,864 1.5 966 0.4 5,313 2.1 256,337 100 All 21,443 3.5 18,354 3.0 17,378 2.8 22,631 3.7 33,340 5.4 17,281 2.8 22,217 3.6 10,556 1.7 5,527 0.9 8,155 1.3 2,754 0.4 17,114 2.8 617,886 100
UC Part-time 999 3.6 681 2.5 592 2.2 778 2.8 1,843 6.7 1,233 4.5 1,208 4.4 540 2.0 330 1.2 459 1.7 248 0.9 791 2.9 27,398 100 Full-time 4,892 4.5 4,270 3.9 3,954 3.6 4,405 4.0 8,625 7.9 7,319 6.7 7,006 6.4 4,112 3.8 2,767 2.5 2,148 2.0 993 0.9 4,762 4.3 109,544 100 All 5,891 4.3 4,951 3.6 4,547 3.3 5,183 3.8 10,468 7.6 8,551 6.2 8,213 6.0 4,652 3.4 3,097 2.3 2,606 1.9 1,241 0.9 5,553 4.1 136,942 100
CSU Part-time 885 4.6 946 4.9 841 4.3 712 3.7 745 3.8 971 5.0 442 2.3 492 2.5 246 1.3 226 1.2 122 0.6 803 4.1 19,393 100 Full-time 6,169 4.1 6,234 4.1 6,080 4.0 6,783 4.5 10,362 6.9 6,930 4.6 5,642 3.7 3,864 2.6 2,106 1.4 1,442 1.0 1,723 1.1 3,977 2.6 151,199 100 All 7,054 4.1 7,181 4.2 6,922 4.1 7,495 4.4 11,107 6.5 7,901 4.6 6,084 3.6 4,356 2.6 2,352 1.4 1,668 1.0 1,845 1.1 4,781 2.8 170,592 100
ICU Part-time 359 7.3 101 2.1 68 1.4 166 3.4 542 11.1 328 6.7 264 5.4 195 4.0 22 0.4 68 1.4 20 0.4 595 12.2 4,896 100 Full-time 3,574 4.2 3,133 3.7 3,233 3.8 3,064 3.6 6,990 8.2 3,634 4.3 4,301 5.1 3,508 4.1 1,807 2.1 2,097 2.5 705 0.8 7,158 8.4 84,819 100 All 3,933 4.4 3,234 3.6 3,301 3.7 3,231 3.6 7,531 8.4 3,962 4.4 4,564 5.1 3,703 4.1 1,828 2.0 2,166 2.4 726 0.8 7,753 8.6 89,715 100
PCC Part-time 206 3.6 85 1.5 166 2.9 76 1.3 30 0.5 193 3.4 38 0.7 53 0.9 29 0.5 - - 55 1.0 234 4.1 5,707 100 Full-time 1,258 5.8 646 3.0 246 1.1 357 1.7 662 3.1 584 2.7 494 2.3 212 1.0 236 1.1 99 0.5 105 0.5 549 2.5 21,549 100 All 1,464 5.4 731 2.7 412 1.5 433 1.6 692 2.5 777 2.9 531 1.9 265 1.0 265 1.0 99 0.4 160 0.6 783 2.9 27,256 100
ALL Part-time 15,681 3.7 11,110 2.7 11,680 2.8 16,393 3.9 20,683 4.9 10,950 2.6 11,249 2.7 6,644 1.6 2,772 0.7 5,044 1.2 2,233 0.5 14,224 3.4 418,943 100 Full-time 24,105 3.9 23,339 3.7 20,879 3.3 22,579 3.6 42,456 6.8 27,522 4.4 30,361 4.9 16,887 2.7 10,297 1.7 9,650 1.5 4,492 0.7 21,760 3.5 623,448 100 All 39,785 3.8 34,450 3.3 32,559 3.1 38,973 3.7 63,138 6.1 38,472 3.7 41,610 4.0 23,532 2.3 13,069 1.3 14,694 1.4 6,725 0.6 35,984 3.5 1,042,390 100
TABLE W-16A: PARENT(S)' CALENDAR YEAR INCOME BY SEGMENT, COURSE LOAD, AND DEPENDENCY STATUS
$144,000 to $167,999
$168,000 to $191,999
$192,000 to $215,999
$66,000 to $71,999
$216,000 to $239,999
$48,000 to $53,999
$54,000 to $59,999
$60,000 to $65,999
$42,000 to $47,999
$36,000 to $41,999
$72,000 to $77,999
$78,000 to $83,999
$84,000 to $89,999
$90,000 to $95,999 Total
Less Than $6,000
$6,000 to $11,999
$12,000 to $17,999
$18,000 to $23,999
$96,000 to $107,999
$108,000 to $119,999
$120,000 to $143,999
$24,000 to $29,999
$30,000 to $35,999
Source: California Student Aid Commission 60 2003-04 SEARS

INDEPENDENT UNDERGRADUATESLess Than
$6,000$6,000 to $11,999
$12,000 to $17,999
$18,000 to $23,999
$24,000 to $29,999
$30,000 to $35,999
$36,000 to $41,999
$42,000 to $47,999
$48,000 to $53,999
$66,000 to $71,999
$ % $ % $ % $ % $ % $ % $ % $ % $ % $ % $ % $ %CCCPart-time 69,378 14.0 49,351 10.0 39,695 8.0 38,980 7.9 36,477 7.4 37,907 7.7 27,894 5.6 22,172 4.5 30,040 6.1 16,808 3.4 20,742 4.2 10,371 2.1
Full-time 19,923 15.2 14,489 11.1 12,678 9.7 10,988 8.4 7,003 5.4 8,935 6.8 5,554 4.2 5,916 4.5 7,365 5.6 3,864 3.0 5,192 4.0 2,415 1.8 All 89,301 14.3 63,840 10.2 52,373 8.4 49,968 8.0 43,480 7.0 46,842 7.5 33,448 5.4 28,088 4.5 37,405 6.0 20,672 3.3 25,934 4.2 12,786 2.0
UC Part-time 253 6.8 316 8.5 145 3.9 219 5.9 216 5.8 382 10.2 290 7.8 259 6.9 119 3.2 119 3.2 70 1.9 279 7.5 Full-time 1,237 9.6 863 6.7 1,084 8.4 912 7.0 826 6.4 891 6.9 972 7.5 435 3.4 473 3.7 641 4.9 801 6.2 563 4.4 All 1,490 8.9 1,178 7.1 1,230 7.4 1,131 6.8 1,042 6.2 1,273 7.6 1,262 7.6 694 4.2 592 3.5 760 4.6 871 5.2 842 5.1
CSU Part-time 6,661 14.3 2,983 6.4 2,040 4.4 4,127 8.9 3,898 8.4 1,864 4.0 2,559 5.5 2,305 5.0 3,242 7.0 1,450 3.1 3,144 6.8 2,533 5.4 Full-time 7,911 10.3 5,220 6.8 6,919 9.0 4,934 6.4 5,357 6.9 6,603 8.6 4,122 5.3 4,067 5.3 4,982 6.5 2,407 3.1 3,485 4.5 3,057 4.0 All 14,573 11.8 8,203 6.6 8,959 7.2 9,061 7.3 9,254 7.5 8,467 6.8 6,681 5.4 6,372 5.2 8,224 6.6 3,857 3.1 6,628 5.4 5,590 4.5
ICU Part-time 605 6.9 223 2.6 411 4.7 486 5.6 824 9.5 807 9.3 595 6.8 543 6.2 356 4.1 429 4.9 587 6.7 224 2.6 Full-time 1,019 6.7 1,056 6.9 875 5.7 1,330 8.7 823 5.4 703 4.6 947 6.2 355 2.3 952 6.2 432 2.8 842 5.5 842 5.5 All 1,624 6.8 1,279 5.3 1,286 5.4 1,816 7.6 1,647 6.9 1,509 6.3 1,541 6.4 898 3.7 1,308 5.5 861 3.6 1,428 6.0 1,066 4.4
PCC Part-time 1,980 11.4 1,295 7.5 1,679 9.7 1,315 7.6 1,451 8.4 833 4.8 1,268 7.3 979 5.7 698 4.0 687 4.0 781 4.5 264 1.5 Full-time 4,827 11.4 3,227 7.6 3,168 7.4 2,726 6.4 2,439 5.7 3,173 7.5 1,885 4.4 2,400 5.6 2,825 6.6 1,172 2.8 3,273 7.7 1,944 4.6 All 6,807 11.4 4,522 7.6 4,847 8.1 4,040 6.8 3,891 6.5 4,006 6.7 3,153 5.3 3,379 5.6 3,524 5.9 1,858 3.1 4,055 6.8 2,208 3.7
ALL Part-time 78,877 13.8 54,169 9.5 43,970 7.7 45,127 7.9 42,865 7.5 41,792 7.3 32,606 5.7 26,259 4.6 34,455 6.0 19,492 3.4 25,324 4.4 13,671 2.4 Full-time 34,918 12.5 24,854 8.9 24,723 8.9 20,890 7.5 16,448 5.9 20,305 7.3 13,480 4.8 13,173 4.7 16,597 6.0 8,515 3.1 13,592 4.9 8,822 3.2 All 113,795 13.4 79,023 9.3 68,694 8.1 66,017 7.8 59,313 7.0 62,097 7.3 46,086 5.4 39,432 4.6 51,053 6.0 28,008 3.3 38,917 4.6 22,493 2.6
$72,000 to $77,999
$78,000 to $83,999
$84,000 to $89,999
$90,000 to $95,999
$96,000 to $107,999
$108,000 to $119,999
$120,000 to $143,999
$144,000 to $167,999
$240,000 or more Total
$ % $ % $ % $ % $ % $ % $ % $ % $ % $ % $ % $ % $ %CCCPart-time 11,086 2.2 8,225 1.7 6,795 1.4 13,589 2.8 16,093 3.3 7,152 1.4 10,371 2.1 3,934 0.8 2,861 0.6 2,503 0.5 1,431 0.3 10,013 2.0 493,868 100
Full-time 4,347 3.3 2,294 1.8 2,173 1.7 3,743 2.9 2,536 1.9 2,656 2.0 2,536 1.9 483 0.4 845 0.6 1,570 1.2 - - 3,260 2.5 130,765 100 All 15,433 2.5 10,519 1.7 8,968 1.4 17,332 2.8 18,629 3.0 9,809 1.6 12,907 2.1 4,417 0.7 3,706 0.6 4,073 0.7 1,431 0.2 13,273 2.1 624,633 100
UC Part-time 27 0.7 70 1.9 37 1.0 222 5.9 244 6.5 180 4.8 37 1.0 37 1.0 141 3.8 - - - - 70 1.9 3,730 100 Full-time 352 2.7 295 2.3 298 2.3 237 1.8 298 2.3 429 3.3 506 3.9 215 1.7 144 1.1 40 0.3 75 0.6 361 2.8 12,948 100 All 379 2.3 365 2.2 335 2.0 458 2.7 542 3.2 609 3.6 543 3.3 252 1.5 285 1.7 40 0.2 75 0.4 431 2.6 16,678 100
CSU Part-time 1,490 3.2 1,101 2.4 1,301 2.8 685 1.5 2,043 4.4 1,299 2.8 589 1.3 327 0.7 280 0.6 - - 138 0.3 504 1.1 46,562 100 Full-time 3,072 4.0 1,692 2.2 3,123 4.0 1,660 2.2 2,934 3.8 1,742 2.3 1,250 1.6 399 0.5 395 0.5 826 1.1 232 0.3 744 1.0 77,131 100 All 4,562 3.7 2,792 2.3 4,423 3.6 2,345 1.9 4,977 4.0 3,041 2.5 1,839 1.5 726 0.6 675 0.5 826 0.7 370 0.3 1,247 1.0 123,693 100
ICU Part-time 283 3.2 158 1.8 358 4.1 251 2.9 232 2.7 123 1.4 184 2.1 - - 754 8.7 114 1.3 - - 161 1.8 8,707 100 Full-time 847 5.5 575 3.8 284 1.9 350 2.3 737 4.8 539 3.5 626 4.1 369 2.4 227 1.5 129 0.8 51 0.3 363 2.4 15,272 100 All 1,129 4.7 733 3.1 642 2.7 601 2.5 969 4.0 662 2.8 810 3.4 369 1.5 981 4.1 243 1.0 51 0.2 524 2.2 23,978 100
PCC Part-time 1,069 6.2 280 1.6 404 2.3 441 2.5 329 1.9 458 2.6 139 0.8 306 1.8 226 1.3 143 0.8 - - 301 1.7 17,328 100 Full-time 828 1.9 712 1.7 981 2.3 1,091 2.6 1,319 3.1 1,329 3.1 826 1.9 231 0.5 498 1.2 193 0.5 224 0.5 1,230 2.9 42,520 100 All 1,897 3.2 992 1.7 1,385 2.3 1,532 2.6 1,648 2.8 1,787 3.0 964 1.6 537 0.9 724 1.2 336 0.6 224 0.4 1,532 2.6 59,848 100
ALL Part-time 13,955 2.4 9,833 1.7 8,895 1.6 15,187 2.7 18,941 3.3 9,213 1.6 11,320 2.0 4,604 0.8 4,261 0.7 2,760 0.5 1,568 0.3 11,049 1.9 570,195 100 Full-time 9,445 3.4 5,567 2.0 6,859 2.5 7,081 2.5 7,824 2.8 6,694 2.4 5,743 2.1 1,697 0.6 2,109 0.8 2,758 1.0 581 0.2 5,958 2.1 278,635 100 All 23,400 2.8 15,401 1.8 15,754 1.9 22,268 2.6 26,765 3.2 15,908 1.9 17,063 2.0 6,301 0.7 6,371 0.8 5,518 0.7 2,150 0.3 17,007 2.0 848,830 100
TABLE W-16B: PARENT(S)' CALENDAR YEAR INCOME BY SEGMENT, COURSE LOAD, AND DEPENDENCY STATUS
$168,000 to $191,999
$216,000 to $239,999
$54,000 to $59,999
$60,000 to $65,999
$192,000 to $215,000
Source: California Student Aid Commission 61 2003-04 SEARS

TABLE W-16C: PARENT(S)' CALENDAR YEAR INCOME BY SEGMENT, COURSE LOAD, AND DEPENDENCY STATUS
ALL UNDERGRADUATESLess Than
$6,000$6,000 to $11,999
$12,000 to $17,999
$18,000 to $23,999
$24,000 to $29,999
$30,000 to $35,999
$36,000 to $41,999
$42,000 to $47,999
$48,000 to $53,999
$54,000 to $59,999
$ % $ % $ % $ % $ % $ % $ % $ % $ % $ % $ % $ %Part-time 97,288 10 79,143 8.0 74,527 7.5 78,870 8.0 74,425 7.5 74,301 7.5 56,728 5.7 41,784 4.2 60,609 6.1 35,650 3.6 46,526 4.7 29,036 2.9 Full-time 53,193 5.9 56,604 6.3 63,556 7.0 56,990 6.3 55,053 6.1 53,994 6.0 40,736 4.5 38,959 4.3 49,148 5.4 36,964 4.1 45,937 5.1 34,305 3.8 All 150,481 8.0 135,747 7.2 138,083 7.3 135,859 7.2 129,478 6.8 128,294 6.8 97,464 5.2 80,743 4.3 109,757 5.8 72,615 3.8 92,463 4.9 63,341 3.3
$72,000 to $77,999
$78,000 to $83,999
$84,000 to $89,999
$90,000 to $95,999
$96,000 to $107,999
$108,000 to $119,999
$120,000 to $143,999
$144,000 to $167,999
$168,000 to $191,999
$192,000 to $215,000
$240,000 or more Total
$ % $ % $ % $ % $ % $ % $ % $ % $ % $ % $ % $ % $ %Part-time 29,635 3 20,944 2 20,575 2 31,581 3 39,624 4 20,163 2 22,568 2 11,248 1 7,033 1 7,804 1 3,802 0 25,273 3 989,138 100 Full-time 33,549 3.7 28,907 3.2 27,738 3.1 29,660 3.3 50,280 5.6 34,216 3.8 36,104 4.0 18,585 2.1 12,406 1.4 12,408 1.4 5,073 0.6 27,717 3.1 902,083 100 All 63,185 3.3 49,850 2.6 48,313 2.6 61,241 3.2 89,903 4.8 54,380 2.9 58,673 3.1 29,833 1.6 19,440 1.0 20,212 1.1 8,875 0.5 52,991 2.8 1,891,220 100
$60,000 to $65,999
$216,000 to $239,000
$66,000 to $71,999
Source: California Student Aid Commission 62 2003-04 SEARS
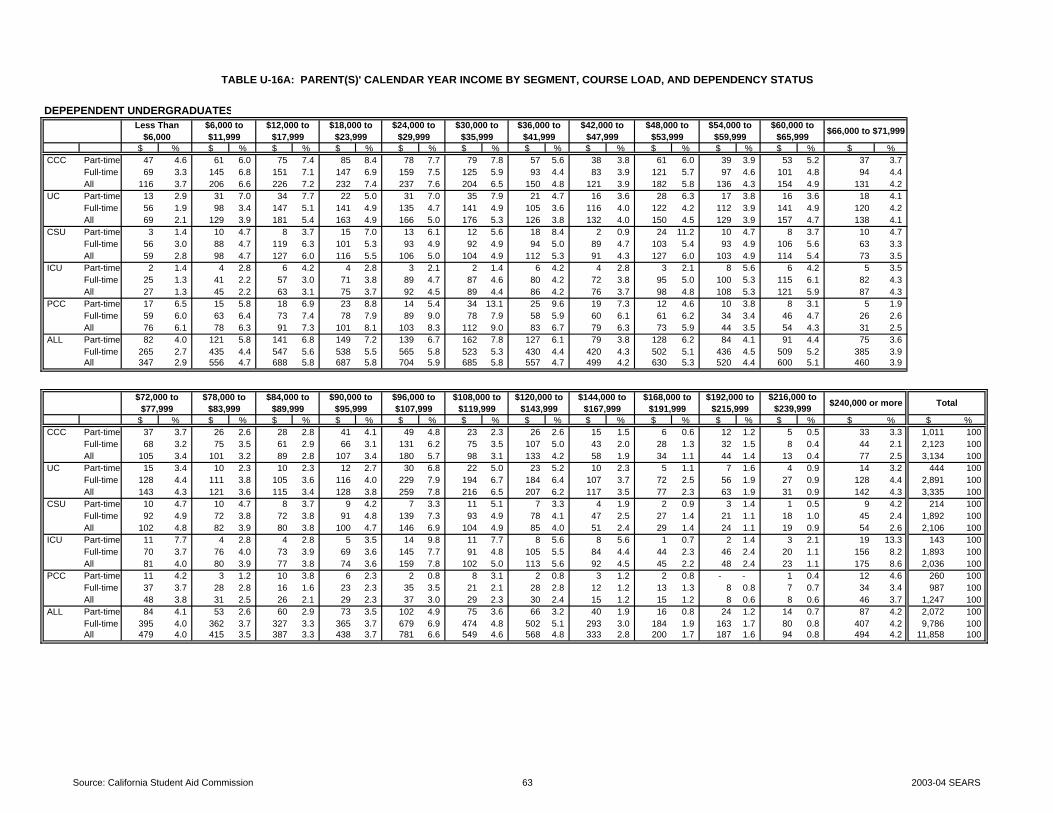
DEPEPENDENT UNDERGRADUATES
$ % $ % $ % $ % $ % $ % $ % $ % $ % $ % $ % $ %CCC Part-time 47 4.6 61 6.0 75 7.4 85 8.4 78 7.7 79 7.8 57 5.6 38 3.8 61 6.0 39 3.9 53 5.2 37 3.7
Full-time 69 3.3 145 6.8 151 7.1 147 6.9 159 7.5 125 5.9 93 4.4 83 3.9 121 5.7 97 4.6 101 4.8 94 4.4 All 116 3.7 206 6.6 226 7.2 232 7.4 237 7.6 204 6.5 150 4.8 121 3.9 182 5.8 136 4.3 154 4.9 131 4.2
UC Part-time 13 2.9 31 7.0 34 7.7 22 5.0 31 7.0 35 7.9 21 4.7 16 3.6 28 6.3 17 3.8 16 3.6 18 4.1 Full-time 56 1.9 98 3.4 147 5.1 141 4.9 135 4.7 141 4.9 105 3.6 116 4.0 122 4.2 112 3.9 141 4.9 120 4.2 All 69 2.1 129 3.9 181 5.4 163 4.9 166 5.0 176 5.3 126 3.8 132 4.0 150 4.5 129 3.9 157 4.7 138 4.1
CSU Part-time 3 1.4 10 4.7 8 3.7 15 7.0 13 6.1 12 5.6 18 8.4 2 0.9 24 11.2 10 4.7 8 3.7 10 4.7 Full-time 56 3.0 88 4.7 119 6.3 101 5.3 93 4.9 92 4.9 94 5.0 89 4.7 103 5.4 93 4.9 106 5.6 63 3.3 All 59 2.8 98 4.7 127 6.0 116 5.5 106 5.0 104 4.9 112 5.3 91 4.3 127 6.0 103 4.9 114 5.4 73 3.5
ICU Part-time 2 1.4 4 2.8 6 4.2 4 2.8 3 2.1 2 1.4 6 4.2 4 2.8 3 2.1 8 5.6 6 4.2 5 3.5 Full-time 25 1.3 41 2.2 57 3.0 71 3.8 89 4.7 87 4.6 80 4.2 72 3.8 95 5.0 100 5.3 115 6.1 82 4.3 All 27 1.3 45 2.2 63 3.1 75 3.7 92 4.5 89 4.4 86 4.2 76 3.7 98 4.8 108 5.3 121 5.9 87 4.3
PCC Part-time 17 6.5 15 5.8 18 6.9 23 8.8 14 5.4 34 13.1 25 9.6 19 7.3 12 4.6 10 3.8 8 3.1 5 1.9 Full-time 59 6.0 63 6.4 73 7.4 78 7.9 89 9.0 78 7.9 58 5.9 60 6.1 61 6.2 34 3.4 46 4.7 26 2.6 All 76 6.1 78 6.3 91 7.3 101 8.1 103 8.3 112 9.0 83 6.7 79 6.3 73 5.9 44 3.5 54 4.3 31 2.5
ALL Part-time 82 4.0 121 5.8 141 6.8 149 7.2 139 6.7 162 7.8 127 6.1 79 3.8 128 6.2 84 4.1 91 4.4 75 3.6 Full-time 265 2.7 435 4.4 547 5.6 538 5.5 565 5.8 523 5.3 430 4.4 420 4.3 502 5.1 436 4.5 509 5.2 385 3.9 All 347 2.9 556 4.7 688 5.8 687 5.8 704 5.9 685 5.8 557 4.7 499 4.2 630 5.3 520 4.4 600 5.1 460 3.9
$216,000 to $239,999
$ % $ % $ % $ % $ % $ % $ % $ % $ % $ % $ % $ % $ %CCC Part-time 37 3.7 26 2.6 28 2.8 41 4.1 49 4.8 23 2.3 26 2.6 15 1.5 6 0.6 12 1.2 5 0.5 33 3.3 1,011 100
Full-time 68 3.2 75 3.5 61 2.9 66 3.1 131 6.2 75 3.5 107 5.0 43 2.0 28 1.3 32 1.5 8 0.4 44 2.1 2,123 100 All 105 3.4 101 3.2 89 2.8 107 3.4 180 5.7 98 3.1 133 4.2 58 1.9 34 1.1 44 1.4 13 0.4 77 2.5 3,134 100
UC Part-time 15 3.4 10 2.3 10 2.3 12 2.7 30 6.8 22 5.0 23 5.2 10 2.3 5 1.1 7 1.6 4 0.9 14 3.2 444 100 Full-time 128 4.4 111 3.8 105 3.6 116 4.0 229 7.9 194 6.7 184 6.4 107 3.7 72 2.5 56 1.9 27 0.9 128 4.4 2,891 100 All 143 4.3 121 3.6 115 3.4 128 3.8 259 7.8 216 6.5 207 6.2 117 3.5 77 2.3 63 1.9 31 0.9 142 4.3 3,335 100
CSU Part-time 10 4.7 10 4.7 8 3.7 9 4.2 7 3.3 11 5.1 7 3.3 4 1.9 2 0.9 3 1.4 1 0.5 9 4.2 214 100 Full-time 92 4.9 72 3.8 72 3.8 91 4.8 139 7.3 93 4.9 78 4.1 47 2.5 27 1.4 21 1.1 18 1.0 45 2.4 1,892 100 All 102 4.8 82 3.9 80 3.8 100 4.7 146 6.9 104 4.9 85 4.0 51 2.4 29 1.4 24 1.1 19 0.9 54 2.6 2,106 100
ICU Part-time 11 7.7 4 2.8 4 2.8 5 3.5 14 9.8 11 7.7 8 5.6 8 5.6 1 0.7 2 1.4 3 2.1 19 13.3 143 100 Full-time 70 3.7 76 4.0 73 3.9 69 3.6 145 7.7 91 4.8 105 5.5 84 4.4 44 2.3 46 2.4 20 1.1 156 8.2 1,893 100 All 81 4.0 80 3.9 77 3.8 74 3.6 159 7.8 102 5.0 113 5.6 92 4.5 45 2.2 48 2.4 23 1.1 175 8.6 2,036 100
PCC Part-time 11 4.2 3 1.2 10 3.8 6 2.3 2 0.8 8 3.1 2 0.8 3 1.2 2 0.8 - - 1 0.4 12 4.6 260 100 Full-time 37 3.7 28 2.8 16 1.6 23 2.3 35 3.5 21 2.1 28 2.8 12 1.2 13 1.3 8 0.8 7 0.7 34 3.4 987 100 All 48 3.8 31 2.5 26 2.1 29 2.3 37 3.0 29 2.3 30 2.4 15 1.2 15 1.2 8 0.6 8 0.6 46 3.7 1,247 100
ALL Part-time 84 4.1 53 2.6 60 2.9 73 3.5 102 4.9 75 3.6 66 3.2 40 1.9 16 0.8 24 1.2 14 0.7 87 4.2 2,072 100 Full-time 395 4.0 362 3.7 327 3.3 365 3.7 679 6.9 474 4.8 502 5.1 293 3.0 184 1.9 163 1.7 80 0.8 407 4.2 9,786 100 All 479 4.0 415 3.5 387 3.3 438 3.7 781 6.6 549 4.6 568 4.8 333 2.8 200 1.7 187 1.6 94 0.8 494 4.2 11,858 100
$78,000 to $83,999
$90,000 to $95,999
$96,000 to $107,999
$120,000 to $143,999
$60,000 to $65,999
Less Than $6,000
$6,000 to $11,999
$12,000 to $17,999
$18,000 to $23,999
$24,000 to $29,999
$30,000 to $35,999
$36,000 to $41,999
$144,000 to $167,999
$42,000 to $47,999
$48,000 to $53,999
$54,000 to $59,999
$192,000 to $215,999 $240,000 or more
TABLE U-16A: PARENT(S)' CALENDAR YEAR INCOME BY SEGMENT, COURSE LOAD, AND DEPENDENCY STATUS
$66,000 to $71,999
Total$168,000 to $191,999
$72,000 to $77,999
$84,000 to $89,999
$108,000 to $119,999
Source: California Student Aid Commission 63 2003-04 SEARS

INDEPEPENDENT UNDERGRADUATES
$ % $ % $ % $ % $ % $ % $ % $ % $ % $ % $ % $ %CCC Part-time 194 14.0 138 10.0 111 8.0 109 7.9 102 7.4 106 7.7 78 5.6 62 4.5 84 6.1 47 3.4 58 4.2 29 2.1
Full-time 165 15.2 120 11.1 105 9.7 91 8.4 58 5.4 74 6.8 46 4.2 49 4.5 61 5.6 32 3.0 43 4.0 20 1.8 All 359 14.6 258 10.5 216 8.8 200 8.1 160 6.5 180 7.3 124 5.0 111 4.5 145 5.9 79 3.2 101 4.1 49 2.0
UC Part-time 5 7.2 6 8.7 3 4.3 4 5.8 4 5.8 7 10.1 5 7.2 4 5.8 2 2.9 2 2.9 1 1.4 6 8.7 Full-time 32 9.5 23 6.8 26 7.7 24 7.1 21 6.3 23 6.8 25 7.4 11 3.3 12 3.6 17 5.1 21 6.3 14 4.2 All 37 9.1 29 7.2 29 7.2 28 6.9 25 6.2 30 7.4 30 7.4 15 3.7 14 3.5 19 4.7 22 5.4 20 4.9
CSU Part-time 64 11.7 36 6.6 30 5.5 45 8.2 49 8.9 24 4.4 27 4.9 25 4.6 38 6.9 22 4.0 34 6.2 27 4.9 Full-time 94 8.9 75 7.1 82 7.7 66 6.2 67 6.3 89 8.4 55 5.2 56 5.3 69 6.5 33 3.1 53 5.0 47 4.4 All 158 9.8 111 6.9 112 7.0 111 6.9 116 7.2 113 7.0 82 5.1 81 5.0 107 6.7 55 3.4 87 5.4 74 4.6
ICU Part-time 10 7.0 4 2.8 7 4.9 8 5.6 12 8.4 16 11.2 11 7.7 9 6.3 7 4.9 8 5.6 10 7.0 3 2.1 Full-time 21 6.8 21 6.8 19 6.1 26 8.4 16 5.1 16 5.1 19 6.1 7 2.3 18 5.8 10 3.2 17 5.5 16 5.1 All 31 6.8 25 5.5 26 5.7 34 7.5 28 6.2 32 7.0 30 6.6 16 3.5 25 5.5 18 4.0 27 5.9 19 4.2
PCC Part-time 53 11.1 34 7.1 36 7.5 35 7.3 36 7.5 32 6.7 39 8.1 28 5.8 22 4.6 16 3.3 25 5.2 17 3.5 Full-time 196 13.5 118 8.1 134 9.2 91 6.3 96 6.6 104 7.1 77 5.3 77 5.3 83 5.7 41 2.8 81 5.6 43 3.0 All 249 12.9 152 7.9 170 8.8 126 6.5 132 6.8 136 7.0 116 6.0 105 5.4 105 5.4 57 2.9 106 5.5 60 3.1
ALL Part-time 326 12.4 218 8.3 187 7.1 201 7.7 203 7.7 185 7.1 160 6.1 128 4.9 153 5.8 95 3.6 128 4.9 82 3.1 Full-time 508 12.0 357 8.4 366 8.6 298 7.0 258 6.1 306 7.2 222 5.2 200 4.7 243 5.7 133 3.1 215 5.1 140 3.3 All 834 12.1 575 8.4 553 8.1 499 7.3 461 6.7 491 7.2 382 5.6 328 4.8 396 5.8 228 3.3 343 5.0 222 3.2
$216,000 to $239,999
$ % $ % $ % $ % $ % $ % $ % $ % $ % $ % $ % $ % $ %CCC Part-time 31 2.2 23 1.7 19 1.4 38 2.8 45 3.3 20 1.4 29 2.1 11 0.8 8 0.6 7 0.5 4 0.3 28 2.0 1,381 100
Full-time 36 3.3 19 1.8 18 1.7 31 2.9 21 1.9 22 2.0 21 1.9 4 0.4 7 0.6 13 1.2 - - 27 2.5 1,083 100 All 67 2.7 42 1.7 37 1.5 69 2.8 66 2.7 42 1.7 50 2.0 15 0.6 15 0.6 20 0.8 4 0.2 55 2.2 2,464 100
UC Part-time 1 1.4 1 1.4 1 1.4 4 5.8 5 7.2 3 4.3 1 1.4 1 1.4 2 2.9 - - - - 1 1.4 69 100 Full-time 10 3.0 8 2.4 7 2.1 6 1.8 8 2.4 12 3.6 15 4.5 5 1.5 4 1.2 1 0.3 2 0.6 9 2.7 336 100 All 11 2.7 9 2.2 8 2.0 10 2.5 13 3.2 15 3.7 16 4.0 6 1.5 6 1.5 1 0.2 2 0.5 10 2.5 405 100
CSU Part-time 20 3.6 13 2.4 15 2.7 12 2.2 29 5.3 13 2.4 6 1.1 3 0.5 4 0.7 - - 3 0.5 9 1.6 548 100 Full-time 44 4.2 29 2.7 38 3.6 29 2.7 43 4.1 25 2.4 23 2.2 11 1.0 11 1.0 8 0.8 4 0.4 9 0.8 1,060 100 All 64 4.0 42 2.6 53 3.3 41 2.5 72 4.5 38 2.4 29 1.8 14 0.9 15 0.9 8 0.5 7 0.4 18 1.1 1,608 100
ICU Part-time 6 4.2 3 2.1 6 4.2 4 2.8 4 2.8 3 2.1 3 2.1 - - 3 2.1 2 1.4 - - 4 2.8 143 100 Full-time 17 5.5 11 3.5 5 1.6 6 1.9 14 4.5 12 3.9 13 4.2 10 3.2 3 1.0 3 1.0 1 0.3 10 3.2 311 100 All 23 5.1 14 3.1 11 2.4 10 2.2 18 4.0 15 3.3 16 3.5 10 2.2 6 1.3 5 1.1 1 0.2 14 3.1 454 100
PCC Part-time 11 2.3 10 2.1 10 2.1 14 2.9 14 2.9 13 2.7 10 2.1 8 1.7 5 1.0 2 0.4 - - 9 1.9 479 100 Full-time 36 2.5 26 1.8 22 1.5 36 2.5 44 3.0 32 2.2 27 1.9 12 0.8 13 0.9 8 0.5 10 0.7 48 3.3 1,455 100 All 47 2.4 36 1.9 32 1.7 50 2.6 58 3.0 45 2.3 37 1.9 20 1.0 18 0.9 10 0.5 10 0.5 57 2.9 1,934 100
ALL Part-time 69 2.6 50 1.9 51 1.9 72 2.7 97 3.7 52 2.0 49 1.9 23 0.9 22 0.8 11 0.4 7 0.3 51 1.9 2,620 100 Full-time 143 3.4 93 2.2 90 2.1 108 2.5 130 3.1 103 2.4 99 2.3 42 1.0 38 0.9 33 0.8 17 0.4 103 2.4 4,245 100 All 212 3.1 143 2.1 141 2.1 180 2.6 227 3.3 155 2.3 148 2.2 65 0.9 60 0.9 44 0.6 24 0.3 154 2.2 6,865 100
$42,000 to $47,999
$168,000 to $191,999
$240,000 or more
$54,000 to $59,999
$60,000 to $65,999
$192,000 to $215,000
$48,000 to $53,999
$144,000 to $167,999
$18,000 to $23,999
$24,000 to $29,999
$30,000 to $35,999
$36,000 to $41,999
$84,000 to $89,999
Less Than $6,000
$6,000 to $11,999
$12,000 to $17,999
TABLE U-16B: PARENT(S)' CALENDAR YEAR INCOME BY SEGMENT, COURSE LOAD, AND DEPENDENCY STATUS
$66,000 to $71,999
Total$90,000 to $95,999
$96,000 to $107,999
$108,000 to $119,999
$120,000 to $143,999
$72,000 to $77,999
$78,000 to $83,999
Source: California Student Aid Commission 64 2003-04 SEARS

TABLE U-16C: PARENT(S)' CALENDAR YEAR INCOME BY SEGMENT, COURSE LOAD, AND DEPENDENCY STATUS
ALL UNDERGRADUATESLess Than
$6,000$6,000 to $11,999
$12,000 to $17,999
$18,000 to $23,999
$24,000 to $29,999
$30,000 to $35,999
$36,000 to $41,999
$42,000 to $47,999
$48,000 to $53,999
$54,000 to $59,999
$ % $ % $ % $ % $ % $ % $ % $ % $ % $ % $ % $ %Part-time 408 9 339 7.2 328 7.0 350 7.5 342 7.3 347 7.4 287 6.1 207 4.4 281 6.0 179 3.8 219 4.7 157 3.3 Full-time 773 5.5 792 5.6 913 6.5 836 6.0 823 5.9 829 5.9 652 4.6 620 4.4 745 5.3 569 4.1 724 5.2 525 3.7 All 1,181 6.3 1,131 6.0 1,241 6.6 1,186 6.3 1,165 6.2 1,176 6.3 939 5.0 827 4.4 1,026 5.5 748 4.0 943 5.0 682 3.6
$72,000 to $77,999
$78,000 to $83,999
$84,000 to $89,999
$90,000 to $95,999
$96,000 to $107,999
$108,000 to $119,999
$120,000 to $143,999
$144,000 to $167,999
$168,000 to $191,999
$192,000 to $215,000
$240,000 or more Total
$ % $ % $ % $ % $ % $ % $ % $ % $ % $ % $ % $ % $ %Part-time 153 3 103 2 111 2 145 3 199 4 127 3 115 2 63 1 38 1 35 1 21 0 138 3 4,692 100 Full-time 538 3.8 455 3.2 417 3.0 473 3.4 809 5.8 577 4.1 601 4.3 335 2.4 222 1.6 196 1.4 97 0.7 510 3.6 14,031 100 All 691 3.7 558 3.0 528 2.8 618 3.3 1,008 5.4 704 3.8 716 3.8 398 2.1 260 1.4 231 1.2 118 0.6 648 3.5 18,723 100
$66,000 to $71,999
$60,000 to $65,999
$216,000 to $239,000
Source: California Student Aid Commission 65 2003-04 SEARS

DEPENDENT UNDERGRADUATES INDEPENDENT UNDERGRADUATES ALL UNDERGRADUATES
CCC Part-time 1,011 60,315$ 45,710$ CCC Part-time 1,381 45,695$ 32,065$ CCC Part-time 2,392 51,874$ 36,488$ Full-time 2,123 64,549$ 52,437$ Full-time 1,083 45,745$ 30,202$ Full-time 3,206 58,197$ 44,499$ All 3,134 63,183$ 48,925$ All 2,464 45,717$ 31,710$ All 5,598 55,495$ 38,522$
UC Part-time 444 68,291$ 51,419$ UC Part-time 69 57,565$ 43,036$ UC Part-time 513 66,848$ 50,512$ Full-time 2,891 83,487$ 72,588$ Full-time 336 56,607$ 40,075$ Full-time 3,227 80,689$ 68,845$ All 3,335 81,464$ 68,368$ All 405 56,770$ 40,731$ All 3,740 78,790$ 65,267$
CSU Part-time 214 70,738$ 53,800$ CSU Part-time 548 50,633$ 40,005$ CSU Part-time 762 56,280$ 45,758$ Full-time 1,892 70,887$ 59,633$ Full-time 1,060 52,262$ 38,360$ Full-time 2,952 64,199$ 51,864$
All 2,106 70,872$ 59,106$ All 1,608 51,707$ 38,990$ All 3,714 62,574$ 50,407$ ICU Part-time 143 105,713$ 76,666$ ICU Part-time 143 58,490$ 46,448$ ICU Part-time 286 82,101$ 58,191$ Full-time 1,893 92,631$ 73,334$ Full-time 311 63,965$ 47,600$ Full-time 2,204 88,586$ 69,707$
All 2,036 93,550$ 73,638$ All 454 62,240$ 49,781$ All 2,490 87,841$ 68,107$ PCC Part-time 260 54,831$ 35,870$ PCC Part-time 479 50,505$ 36,415$ PCC Part-time 739 52,027$ 36,232$ Full-time 987 58,155$ 40,598$ Full-time 1,455 51,334$ 41,783$ Full-time 2,442 54,091$ 41,307$
All 1,247 57,462$ 39,210$ All 1,934 51,129$ 39,624$ All 3,181 53,611$ 39,475$ ALL Part-time 2,072 65,545$ 44,073$ ALL Part-time 2,620 48,618$ 32,880$ ALL Part-time 4,692 56,093$ 36,820$
Full-time 9,786 76,156$ 56,927$ Full-time 4,245 51,483$ 35,199$ Full-time 14,031 68,691$ 50,320$ All 11,858 74,302$ 51,906$ All 6,865 50,390$ 33,638$ All 18,723 65,534$ 42,667$
TABLE M-16: MEAN AND MEDIAN PARENT(S)' CALENDAR YEAR INCOME BY SEGMENT, COURSE LOAD, AND DEPENDENCY STATUS
Number Mean Median Number MedianMean Median Number Mean
Source: California Student Aid Commission 66 2003-04 SEARS

Question for Table: W-17.1, U-17.1, and M-17.1 (Academic Year Work Hours)
How many hours on average do you, or will you, work for pay per week during the current academic year
(e.g., September through May or October through June 0 I do not/will not work 4 16 to 20 8 36 to 40 1 Less than 5 5 21 to 25 9 40 hours or more 2 5 to 10 6 26 to 30 3 11 to 15 7 31 to 35
Questions for Tables: W-17.2, U-17.2, and M-17.2 (Academic Year Wages)
My average wage per hour is/will be: 0 $6.75 or less 4 $9.25 - $9.74 8 $13.75 - $14.24 1 $6.75 - $7.24 5 $9.75 - $10.24 9 $14.75 - $15.74 2 $7.25 - $7.74 6 $10.25 - $10.74 0 $15.75 - $17.74 3 $7.75 - $8.24 7 $10.75 - $11.74 0 $16.75 or more 0 $8.25 - $8.74 0 $11.75 - $12.74 0 $8.75 - $9.24 0 $12.75 - $13.74
67 2003-04 SEARS

TABLE W-17.1: ACADEMIC YEAR WORK HOURS BY SEGMENT, COURSE LOAD, AND DEPENDENCY STATUS
DEPENDENT UNDERGRADUATES
None Less Than 5 Hours 5 to 10 Hours 11 to 15 Hours 16 to 20 Hours 21 to 25 Hours 26 to 30 Hours 31 to 35 Hours 36 to 40 Hours 40 or More Hours All
# % # % # % # % # % # % # % # % # % # % # %CCC Part-time 83,325 21.6 11,086 2.9 14,662 3.8 18,596 4.8 54,000 14.0 54,358 14.1 49,351 12.8 29,325 7.6 31,470 8.1 40,053 10.4 386,226 100
Full-time 70,997 25.9 4,950 1.8 17,266 6.3 24,148 8.8 40,690 14.9 40,932 14.9 28,737 10.5 16,300 6.0 17,266 6.3 12,557 4.6 273,843 100 All 154,322 23.4 16,036 2.4 31,928 4.8 42,744 6.5 94,690 14.3 95,290 14.4 78,088 11.8 45,625 6.9 48,736 7.4 52,610 8.0 660,069 100
UC Part-time 18,217 65.1 324 1.2 2,373 8.5 1,500 5.4 2,301 8.2 1,466 5.2 849 3.0 461 1.6 141 0.5 371 1.3 28,003 100 Full-time 76,227 67.6 3,755 3.3 7,783 6.9 7,582 6.7 7,353 6.5 4,732 4.2 2,209 2.0 1,247 1.1 364 0.3 1,496 1.3 112,749 100 All 94,444 67.1 4,080 2.9 10,156 7.2 9,083 6.5 9,654 6.9 6,198 4.4 3,058 2.2 1,708 1.2 505 0.4 1,867 1.3 140,752 100
CSU Part-time 2,612 12.8 418 2.0 1,708 8.4 2,159 10.6 2,986 14.6 3,028 14.8 2,540 12.4 1,563 7.6 407 2.0 3,019 14.8 20,438 100 Full-time 39,438 25.3 4,432 2.8 11,627 7.5 18,698 12.0 30,301 19.5 22,249 14.3 12,711 8.2 7,118 4.6 3,452 2.2 5,568 3.6 155,594 100 All 42,050 23.9 4,850 2.8 13,335 7.6 20,857 11.8 33,287 18.9 25,277 14.4 15,251 8.7 8,680 4.9 3,859 2.2 8,587 4.9 176,032 100
ICU Part-time 1,875 35.7 393 7.5 958 18.3 411 7.8 438 8.4 267 5.1 208 4.0 157 3.0 - - 539 10.3 5,247 100 Full-time 25,412 28.2 5,276 5.8 17,646 19.6 14,523 16.1 13,892 15.4 6,225 6.9 3,402 3.8 1,294 1.4 656 0.7 1,910 2.1 90,236 100 All 27,287 28.6 5,669 5.9 18,604 19.5 14,934 15.6 14,330 15.0 6,492 6.8 3,610 3.8 1,451 1.5 656 0.7 2,449 2.6 95,483 100
PCC Part-time 1,053 16.4 181 2.8 219 3.4 393 6.1 1,144 17.8 605 9.4 708 11.0 431 6.7 440 6.8 1,258 19.6 6,432 100 Full-time 6,257 26.9 478 2.1 703 3.0 1,188 5.1 4,112 17.7 1,954 8.4 2,189 9.4 1,712 7.4 1,904 8.2 2,779 11.9 23,276 100 All 7,310 24.6 659 2.2 922 3.1 1,581 5.3 5,256 17.7 2,558 8.6 2,896 9.7 2,143 7.2 2,345 7.9 4,037 13.6 29,707 100
ALL Part-time 107,082 24.0 12,402 2.8 19,920 4.5 23,060 5.2 60,870 13.6 59,724 13.4 53,655 12.0 31,937 7.2 32,458 7.3 45,239 10.1 446,346 100 Full-time 218,331 33.3 18,892 2.9 55,026 8.4 66,140 10.1 96,348 14.7 76,091 11.6 49,248 7.5 27,670 4.2 23,642 3.6 24,311 3.7 655,698 100 All 325,413 29.5 31,294 2.8 74,945 6.8 89,200 8.1 157,218 14.3 135,815 12.3 102,903 9.3 59,607 5.4 56,100 5.1 69,550 6.3 1,102,044 100
INDEPENDENT UNDERGRADUATES
None Less Than 5 Hours 5 to 10 Hours 11 to 15 Hours 16 to 20 Hours 21 to 25 Hours 26 to 30 Hours 31 to 35 Hours 36 to 40 Hours 40 or More Hours All
# % # % # % # % # % # % # % # % # % # % # %CCC Part-time 134,464 23.3 6,437 1.1 15,020 2.6 14,662 2.5 41,841 7.2 37,192 6.4 39,695 6.9 30,755 5.3 54,715 9.5 202,768 35.1 577,549 100
Full-time 58,319 39.5 3,743 2.5 8,090 5.5 7,607 5.1 17,991 12.2 12,074 8.2 10,625 7.2 7,124 4.8 7,969 5.4 14,248 9.6 147,789 100 All 192,783 26.6 10,180 1.4 23,110 3.2 22,269 3.1 59,832 8.2 49,266 6.8 50,320 6.9 37,879 5.2 62,684 8.6 217,016 29.9 725,338 100
UC Part-time 1,944 50.2 70 1.8 318 8.2 179 4.6 367 9.5 180 4.7 107 2.8 261 6.7 70 1.8 375 9.7 3,871 100 Full-time 7,872 57.5 611 4.5 780 5.7 1,166 8.5 1,050 7.7 623 4.5 516 3.8 409 3.0 121 0.9 554 4.0 13,702 100 All 9,816 55.9 681 3.9 1,098 6.2 1,344 7.6 1,417 8.1 803 4.6 624 3.5 670 3.8 191 1.1 930 5.3 17,573 100
CSU Part-time 8,097 16.1 1,264 2.5 1,013 2.0 2,207 4.4 4,372 8.7 2,853 5.7 3,392 6.7 3,483 6.9 2,646 5.2 21,081 41.8 50,407 100 Full-time 24,524 29.6 3,077 3.7 4,304 5.2 6,105 7.4 10,867 13.1 9,237 11.1 7,160 8.6 4,934 6.0 2,134 2.6 10,545 12.7 82,888 100 All 32,621 24.5 4,341 3.3 5,317 4.0 8,312 6.2 15,239 11.4 12,090 9.1 10,552 7.9 8,417 6.3 4,780 3.6 31,626 23.7 133,295 100
ICU Part-time 995 10.1 32 0.3 146 1.5 244 2.5 479 4.8 654 6.6 507 5.1 234 2.4 1,576 15.9 5,018 50.8 9,886 100 Full-time 3,843 22.5 489 2.9 1,196 7.0 1,902 11.1 2,745 16.1 822 4.8 1,069 6.3 597 3.5 701 4.1 3,711 21.7 17,074 100 All 4,839 17.9 521 1.9 1,342 5.0 2,146 8.0 3,223 12.0 1,477 5.5 1,576 5.8 830 3.1 2,277 8.4 8,729 32.4 26,961 100
PCC Part-time 3,230 15.0 73 0.3 522 2.4 226 1.0 1,222 5.7 1,163 5.4 887 4.1 739 3.4 2,407 11.2 11,034 51.3 21,503 100 Full-time 12,819 25.7 578 1.2 1,100 2.2 1,358 2.7 3,105 6.2 3,296 6.6 2,201 4.4 1,661 3.3 5,274 10.6 18,580 37.2 49,971 100 All 16,049 22.5 651 0.9 1,622 2.3 1,583 2.2 4,327 6.1 4,458 6.2 3,088 4.3 2,400 3.4 7,681 10.7 29,614 41.4 71,474 100
ALL Part-time 148,730 22.4 7,877 1.2 17,020 2.6 17,517 2.6 48,281 7.3 42,041 6.3 44,588 6.7 35,471 5.3 61,414 9.3 240,277 36.2 663,216 100 Full-time 107,378 34.5 8,497 2.7 15,469 5.0 18,138 5.8 35,757 11.5 26,052 8.4 21,571 6.9 14,725 4.7 16,199 5.2 47,638 15.3 311,424 100 All 256,108 26.3 16,374 1.7 32,489 3.3 35,655 3.7 84,038 8.6 68,093 7.0 66,159 6.8 50,197 5.2 77,613 8.0 287,915 29.5 974,641 100
ALL UNDERGRADUATESPart-time 255,812 23.1 20,279 1.8 36,940 3.3 40,577 3.7 109,150 9.8 101,765 9.2 98,243 8.9 67,409 6.1 93,872 8.5 285,516 25.7 1,109,562 100 Full-time 325,708 33.7 27,389 2.8 70,495 7.3 84,277 8.7 132,106 13.7 102,143 10.6 70,819 7.3 42,395 4.4 39,842 4.1 71,949 7.4 967,122 100 All 581,520 28.0 47,668 2.3 107,435 5.2 124,854 6.0 241,256 11.6 203,908 9.8 169,062 8.1 109,804 5.3 133,713 6.4 357,465 17.2 2,076,684 100
Source: California Student Aid Commission 68 2003-04 SEARS

TABLE U-17.1: ACADEMIC YEAR WORK HOURS BY SEGMENT, COURSE LOAD, AND DEPENDENCY STATUS
DEPENDENT UNDERGRADUATES
None Less Than 5 Hours 5 to 10 Hours 11 to 15 Hours 16 to 20 Hours 21 to 25 Hours 26 to 30 Hours 31 to 35 Hours 36 to 40 Hours 40 or More Hours All
# % # % # % # % # % # % # % # % # % # % # %CCC Part-time 233 21.6 31 2.9 41 3.8 52 4.8 151 14.0 152 14.1 138 12.8 82 7.6 88 8.1 112 10.4 1,080 100
Full-time 588 25.9 41 1.8 143 6.3 200 8.8 337 14.9 339 14.9 238 10.5 135 6.0 143 6.3 104 4.6 2,268 100 All 821 24.5 72 2.2 184 5.5 252 7.5 488 14.6 491 14.7 376 11.2 217 6.5 231 6.9 216 6.5 3,348 100
UC Part-time 298 65.6 6 1.3 38 8.4 24 5.3 36 7.9 23 5.1 13 2.9 7 1.5 2 0.4 7 1.5 454 100 Full-time 2,003 67.4 99 3.3 203 6.8 203 6.8 197 6.6 127 4.3 59 2.0 33 1.1 9 0.3 40 1.3 2,973 100 All 2,301 67.1 105 3.1 241 7.0 227 6.6 233 6.8 150 4.4 72 2.1 40 1.2 11 0.3 47 1.4 3,427 100
CSU Part-time 33 14.7 6 2.7 17 7.6 21 9.4 33 14.7 34 15.2 28 12.5 17 7.6 6 2.7 29 12.9 224 100 Full-time 501 25.6 71 3.6 158 8.1 255 13.1 360 18.4 253 12.9 153 7.8 84 4.3 40 2.0 79 4.0 1,954 100 All 534 24.5 77 3.5 175 8.0 276 12.7 393 18.0 287 13.2 181 8.3 101 4.6 46 2.1 108 5.0 2,178 100
ICU Part-time 55 35.9 17 11.1 35 22.9 12 7.8 11 7.2 5 3.3 5 3.3 3 2.0 - - 10 6.5 153 100 Full-time 575 28.5 135 6.7 421 20.9 327 16.2 275 13.6 134 6.6 70 3.5 28 1.4 15 0.7 38 1.9 2,018 100 All 630 29.0 152 7.0 456 21.0 339 15.6 286 13.2 139 6.4 75 3.5 31 1.4 15 0.7 48 2.2 2,171 100
PCC Part-time 63 21.6 4 1.4 14 4.8 17 5.8 43 14.7 31 10.6 31 10.6 20 6.8 25 8.6 44 15.1 292 100 Full-time 284 26.4 9 0.8 29 2.7 57 5.3 155 14.4 103 9.6 116 10.8 84 7.8 89 8.3 149 13.9 1,075 100 All 347 25.4 13 1.0 43 3.1 74 5.4 198 14.5 134 9.8 147 10.8 104 7.6 114 8.3 193 14.1 1,367 100
ALL Part-time 682 31.0 64 2.9 145 6.6 126 5.7 274 12.4 245 11.1 215 9.8 129 5.9 121 5.5 202 9.2 2,203 100 Full-time 3,951 38.4 355 3.5 954 9.3 1,042 10.1 1,324 12.9 956 9.3 636 6.2 364 3.5 296 2.9 410 4.0 10,288 100 All 4,633 37.1 419 3.4 1,099 8.8 1,168 9.4 1,598 12.8 1,201 9.6 851 6.8 493 3.9 417 3.3 612 4.9 12,491 100
INDEPENDENT UNDERGRADUATES
None Less Than 5 Hours 5 to 10 Hours 11 to 15 Hours 16 to 20 Hours 21 to 25 Hours 26 to 30 Hours 31 to 35 Hours 36 to 40 Hours 40 or More Hours All
# % # % # % # % # % # % # % # % # % # % # %CCC Part-time 376 23.3 18 1.1 42 2.6 41 2.5 117 7.2 104 6.4 111 6.9 86 5.3 153 9.5 567 35.1 1,615 100
Full-time 483 39.5 31 2.5 67 5.5 63 5.1 149 12.2 100 8.2 88 7.2 59 4.8 66 5.4 118 9.6 1,224 100 All 859 30.3 49 1.7 109 3.8 104 3.7 266 9.4 204 7.2 199 7.0 145 5.1 219 7.7 685 24.1 2,839 100
UC Part-time 34 47.9 1 1.4 5 7.0 3 4.2 7 9.9 3 4.2 2 2.8 6 8.5 1 1.4 9 12.7 71 100 Full-time 204 57.3 15 4.2 20 5.6 30 8.4 29 8.1 17 4.8 14 3.9 11 3.1 3 0.8 13 3.7 356 100 All 238 55.7 16 3.7 25 5.9 33 7.7 36 8.4 20 4.7 16 3.7 17 4.0 4 0.9 22 5.2 427 100
CSU Part-time 100 16.6 15 2.5 16 2.7 25 4.2 50 8.3 38 6.3 46 7.7 39 6.5 32 5.3 240 39.9 601 100 Full-time 328 28.7 44 3.9 74 6.5 84 7.4 161 14.1 120 10.5 99 8.7 63 5.5 33 2.9 135 11.8 1,141 100 All 428 24.6 59 3.4 90 5.2 109 6.3 211 12.1 158 9.1 145 8.3 102 5.9 65 3.7 375 21.5 1,742 100
ICU Part-time 20 12.3 1 0.6 3 1.8 4 2.5 8 4.9 13 8.0 9 5.5 4 2.5 17 10.4 84 51.5 163 100 Full-time 85 24.3 12 3.4 28 8.0 40 11.4 61 17.4 16 4.6 20 5.7 10 2.9 15 4.3 63 18.0 350 100 All 105 20.5 13 2.5 31 6.0 44 8.6 69 13.5 29 5.7 29 5.7 14 2.7 32 6.2 147 28.7 513 100
PCC Part-time 127 21.4 5 0.8 16 2.7 11 1.9 41 6.9 38 6.4 31 5.2 28 4.7 60 10.1 236 39.8 593 100 Full-time 561 32.5 24 1.4 44 2.5 47 2.7 115 6.7 85 4.9 108 6.3 66 3.8 192 11.1 485 28.1 1,727 100 All 688 29.7 29 1.3 60 2.6 58 2.5 156 6.7 123 5.3 139 6.0 94 4.1 252 10.9 721 31.1 2,320 100
ALL Part-time 657 21.6 40 1.3 82 2.7 84 2.8 223 7.3 196 6.4 199 6.5 163 5.4 263 8.6 1,136 37.3 3,043 100 Full-time 1,661 34.6 126 2.6 233 4.9 264 5.5 515 10.7 338 7.0 329 6.9 209 4.4 309 6.4 814 17.0 4,798 100 All 2,318 29.6 166 2.1 315 4.0 348 4.4 738 9.4 534 6.8 528 6.7 372 4.7 572 7.3 1,950 24.9 7,841 100
ALL UNDERGRADUATESPart-time 1,339 25.5 104 2.0 227 4.3 210 4.0 497 9.5 441 8.4 414 7.9 292 5.6 384 7.3 1,338 25.5 5,246 100 Full-time 5,612 37.2 481 3.2 1,187 7.9 1,306 8.7 1,839 12.2 1,294 8.6 965 6.4 573 3.8 605 4.0 1,224 8.1 15,086 100 All 6,951 34.2 585 2.9 1,414 7.0 1,516 7.5 2,336 11.5 1,735 8.5 1,379 6.8 865 4.3 989 4.9 2,562 12.6 20,332 100
Source: California Student Aid Commission 69 2003-04 SEARS

DEPENDENT UNDERGRADUATES INDEPENDENT UNDERGRADUATES ALL UNDERGRADUATES
CCC Part-time 847 26 26 CCC Part-time 1,239 34 39 CCC Part-time 2,086 31 32 Full-time 1,680 23 23 Full-time 741 25 24 Full-time 2,421 24 23 All 2,527 24 25 All 1,980 30 37 All 4,507 27 29
UC Part-time 156 18 18 UC Part-time 37 26 22 UC Part-time 193 20 18 Full-time 970 17 15 Full-time 152 20 18 Full-time 1,122 17 16 All 1,126 17 16 All 189 21 19 All 1,315 17 16
CSU Part-time 191 24 24 CSU Part-time 501 33 41 CSU Part-time 692 30 33 Full-time 1,453 20 20 Full-time 813 24 24 Full-time 2,266 22 21
All 1,644 21 20 All 1,314 27 28 All 2,958 24 23 ICU Part-time 98 15 15 ICU Part-time 143 36 41 ICU Part-time 241 27 39 Full-time 1,443 15 14 Full-time 265 24 18 Full-time 1,708 16 15
All 1,541 15 14 All 408 28 36 All 1,949 18 17 PCC Part-time 229 27 27 PCC Part-time 466 34 41 PCC Part-time 695 32 40 Full-time 791 28 26 Full-time 1,166 33 41 Full-time 1,957 31 37
All 1,020 28 27 All 1,632 33 40 All 2,652 31 37 ALL Part-time 1,521 25 25 ALL Part-time 2,386 34 40 ALL Part-time 3,907 30 32
Full-time 6,337 20 20 Full-time 3,137 27 26 Full-time 9,474 23 21 All 7,858 21 22 All 5,523 30 36 All 13,381 25 27
TABLE M-17.1: MEAN AND MEDIAN ACADEMIC YEAR WORK HOURS BY SEGMENT, COURSE LOAD, AND DEPENDENCY STATUS
Number Mean Median Number MedianMean Median Number Mean
Source: California Student Aid Commission 70 2003-04 SEARS

DEPENDENT UNDERGRADUATES
$6.75 to $7.24 $7.25 to $7.74 $7.75 to $8.24 $8.25 to $8.74 $8.75 to $9.24 $9.25 to $9.74 $9.75 to $10.24 $10.25 to $10.74
# % # % # % # % # % # % # % # %CCC Part-time 123,020 37.2 32,901 10.0 31,470 9.5 21,099 6.4 23,603 7.1 10,013 3.0 22,887 6.9 8,225 2.5
Full-time 103,959 44.8 32,842 14.2 22,820 9.8 14,006 6.0 10,988 4.7 5,554 2.4 11,833 5.1 6,520 2.8 All 226,979 40.4 65,743 11.7 54,290 9.7 35,105 6.2 34,591 6.2 15,567 2.8 34,720 6.2 14,745 2.6
UC Part-time 7,291 53.7 659 4.8 1,192 8.8 388 2.9 398 2.9 710 5.2 1,509 11.1 351 2.6 Full-time 15,684 33.6 3,108 6.7 3,879 8.3 2,292 4.9 2,550 5.5 1,367 2.9 5,223 11.2 1,389 3.0 All 22,975 38.1 3,767 6.3 5,071 8.4 2,680 4.4 2,947 4.9 2,077 3.4 6,732 11.2 1,741 2.9
CSU Part-time 2,684 14.3 1,422 7.6 1,485 7.9 1,635 8.7 1,740 9.3 628 3.3 2,414 12.9 503 2.7 Full-time 37,280 28.8 11,663 9.0 11,272 8.7 9,841 7.6 8,427 6.5 6,826 5.3 11,240 8.7 4,295 3.3 All 39,964 27.0 13,085 8.8 12,757 8.6 11,476 7.7 10,167 6.9 7,454 5.0 13,654 9.2 4,798 3.2
ICU Part-time 1,136 31.1 341 9.3 386 10.5 430 11.7 201 5.5 116 3.2 334 9.1 113 3.1 Full-time 23,000 33.3 10,294 14.9 8,004 11.6 5,055 7.3 4,382 6.3 2,071 3.0 5,901 8.5 1,262 1.8 All 24,136 33.2 10,635 14.6 8,390 11.5 5,484 7.5 4,583 6.3 2,187 3.0 6,236 8.6 1,375 1.9
PCC Part-time 1,766 30.8 510 8.9 913 15.9 306 5.3 479 8.3 122 2.1 222 3.9 103 1.8 Full-time 6,145 32.3 2,561 13.5 2,199 11.6 1,836 9.7 1,411 7.4 861 4.5 993 5.2 1,009 5.3 All 7,911 32.0 3,070 12.4 3,112 12.6 2,142 8.7 1,890 7.6 983 4.0 1,215 4.9 1,112 4.5
ALL Part-time 135,897 36.5 35,833 9.6 35,445 9.5 23,858 6.4 26,420 7.1 11,589 3.1 27,366 7.4 9,297 2.5 Full-time 186,068 37.5 60,468 12.2 48,174 9.7 33,030 6.7 27,758 5.6 16,680 3.4 35,191 7.1 14,474 2.9 All 321,965 37.1 96,301 11.1 83,619 9.6 56,888 6.6 54,177 6.2 28,269 3.3 62,557 7.2 23,771 2.7
$10.75 to $11.74 $11.75 to 12.74 $12.75 to $13.74 $13.75 to $14.74 $14.75 to $15.74 $15.75 to $16.74 More than $16.75 Total
# % # % # % # % # % # % # % # %CCC Part-time 10,371 3.1 16,093 4.9 7,510 2.3 3,934 1.2 5,364 1.6 2,146 0.6 11,801 3.6 330,437 100
Full-time 7,003 3.0 5,554 2.4 2,898 1.2 1,932 0.8 1,932 0.8 724 0.3 3,381 1.5 231,946 100 All 17,374 3.1 21,647 3.8 10,408 1.9 5,866 1.0 7,296 1.3 2,870 0.5 15,182 2.7 562,383 100
UC Part-time 180 1.3 285 2.1 180 1.3 - - 217 1.6 70 0.5 160 1.2 13,589 100 Full-time 1,903 4.1 3,058 6.6 1,390 3.0 745 1.6 1,094 2.3 505 1.1 2,481 5.3 46,668 100 All 2,083 3.5 3,343 5.5 1,570 2.6 745 1.2 1,310 2.2 575 1.0 2,641 4.4 60,257 100
CSU Part-time 1,405 7.5 793 4.2 961 5.1 594 3.2 391 2.1 710 3.8 1,404 7.5 18,769 100 Full-time 7,095 5.5 6,457 5.0 3,498 2.7 2,842 2.2 2,742 2.1 1,724 1.3 4,263 3.3 129,465 100 All 8,501 5.7 7,250 4.9 4,459 3.0 3,437 2.3 3,133 2.1 2,434 1.6 5,667 3.8 148,234 100
ICU Part-time - - 147 4.0 48 1.3 46 1.3 80 2.2 - - 279 7.6 3,657 100 Full-time 1,445 2.1 2,308 3.3 1,032 1.5 686 1.0 1,305 1.9 574 0.8 1,815 2.6 69,133 100 All 1,445 2.0 2,455 3.4 1,079 1.5 733 1.0 1,386 1.9 574 0.8 2,094 2.9 72,790 100
PCC Part-time 303 5.3 307 5.4 75 1.3 110 1.9 55 1.0 35 0.6 432 7.5 5,737 100 Full-time 570 3.0 510 2.7 239 1.3 110 0.6 131 0.7 54 0.3 387 2.0 19,015 100 All 873 3.5 817 3.3 313 1.3 220 0.9 186 0.8 88 0.4 819 3.3 24,752 100
ALL Part-time 12,259 3.3 17,625 4.7 8,773 2.4 4,684 1.3 6,107 1.6 2,960 0.8 14,076 3.8 372,189 100 Full-time 18,015 3.6 17,887 3.6 9,056 1.8 6,316 1.3 7,204 1.5 3,581 0.7 12,326 2.5 496,228 100 All 30,275 3.5 35,513 4.1 17,829 2.1 11,000 1.3 13,311 1.5 6,542 0.8 26,402 3.0 868,417 100
TABLE W-17.2A: STUDENT ACADEMIC YEAR HOURLY WAGES BY SEGMENT, COURSE LOAD, AND DEPENDENCY STATUS
Source: California Student Aid Commission 71 2003-04 SEARS

INDEPENDENT UNDERGRADUATES
$6.75 to $7.24 $7.25 to $7.74 $7.75 to $8.24 $8.25 to $8.74 $8.75 to $9.24 $9.25 to $9.74 $9.75 to $10.24 $10.25 to $10.74
# % # % # % # % # % # % # % # %CCC Part-time 79,391 16.4 15,735 3.2 23,960 4.9 11,086 2.3 18,238 3.8 14,662 3.0 25,391 5.2 20,384 4.2
Full-time 44,916 39.4 10,384 9.1 7,728 6.8 4,226 3.7 5,554 4.9 3,864 3.4 5,675 5.0 3,622 3.2 All 124,307 20.7 26,119 4.4 31,688 5.3 15,312 2.6 23,792 4.0 18,526 3.1 31,066 5.2 24,006 4.0
UC Part-time 721 30.1 - - 141 5.9 70 2.9 70 2.9 - - 483 20.1 119 5.0 Full-time 1,980 27.1 427 5.8 561 7.7 357 4.9 232 3.2 210 2.9 819 11.2 293 4.0 All 2,702 27.8 427 4.4 702 7.2 427 4.4 302 3.1 210 2.2 1,302 13.4 412 4.2
CSU Part-time 4,007 8.8 1,000 2.2 791 1.7 909 2.0 1,059 2.3 795 1.7 2,654 5.8 1,336 2.9 Full-time 13,000 19.6 3,188 4.8 2,977 4.5 2,456 3.7 3,203 4.8 2,032 3.1 7,801 11.8 2,662 4.0 All 17,006 15.2 4,187 3.7 3,768 3.4 3,365 3.0 4,262 3.8 2,826 2.5 10,455 9.4 3,998 3.6
ICU Part-time 930 10.2 171 1.9 26 0.3 130 1.4 107 1.2 - - 326 3.6 182 2.0 Full-time 2,011 14.8 727 5.4 754 5.6 734 5.4 753 5.6 306 2.3 1,503 11.1 204 1.5 All 2,941 13.0 897 4.0 779 3.4 863 3.8 860 3.8 306 1.3 1,829 8.1 386 1.7
PCC Part-time 2,327 12.3 276 1.5 721 3.8 324 1.7 432 2.3 257 1.4 503 2.7 806 4.2 Full-time 7,405 18.0 1,028 2.5 1,521 3.7 1,669 4.1 1,954 4.8 1,489 3.6 1,848 4.5 974 2.4 All 9,732 16.2 1,305 2.2 2,242 3.7 1,993 3.3 2,386 4.0 1,746 2.9 2,351 3.9 1,780 3.0
ALL Part-time 87,376 15.6 17,181 3.1 25,638 4.6 12,519 2.2 19,907 3.5 15,714 2.8 29,357 5.2 22,826 4.1 Full-time 69,311 28.6 15,754 6.5 13,540 5.6 9,442 3.9 11,696 4.8 7,900 3.3 17,646 7.3 7,757 3.2 All 156,687 19.5 32,935 4.1 39,178 4.9 21,961 2.7 31,603 3.9 23,614 2.9 47,003 5.8 30,583 3.8
$10.75 to $11.74 $11.75 to 12.74 $12.75 to $13.74 $13.75 to $14.74 $14.75 to $15.74 $15.75 to $16.74 More than $16.75 Total
# % # % # % # % # % # % # % # %CCC Part-time 23,960 4.9 27,894 5.7 20,384 4.2 26,106 5.4 20,027 4.1 15,378 3.2 142,689 29.4 485,285 100
Full-time 2,898 2.5 3,985 3.5 3,743 3.3 2,294 2.0 2,173 1.9 2,294 2.0 10,625 9.3 113,981 100 All 26,858 4.5 31,879 5.3 24,127 4.0 28,400 4.7 22,200 3.7 17,672 2.9 153,314 25.6 599,266 100
UC Part-time - - 108 4.5 41 1.7 - - 151 6.3 107 4.5 387 16.1 2,399 100 Full-time 279 3.8 378 5.2 314 4.3 289 3.9 235 3.2 280 3.8 660 9.0 7,315 100 All 279 2.9 486 5.0 355 3.7 289 3.0 385 4.0 387 4.0 1,047 10.8 9,714 100
CSU Part-time 3,149 6.9 3,390 7.4 2,785 6.1 951 2.1 2,729 6.0 1,757 3.9 18,237 40.0 45,548 100 Full-time 3,848 5.8 5,019 7.6 3,414 5.2 2,285 3.5 3,368 5.1 1,778 2.7 9,141 13.8 66,170 100 All 6,997 6.3 8,410 7.5 6,198 5.5 3,236 2.9 6,097 5.5 3,535 3.2 27,378 24.5 111,718 100
ICU Part-time 106 1.2 626 6.9 487 5.3 939 10.3 464 5.1 515 5.6 4,126 45.2 9,133 100 Full-time 409 3.0 966 7.1 784 5.8 231 1.7 480 3.5 657 4.8 3,046 22.5 13,564 100 All 516 2.3 1,592 7.0 1,271 5.6 1,170 5.2 943 4.2 1,172 5.2 7,172 31.6 22,697 100
PCC Part-time 1,062 5.6 1,852 9.8 907 4.8 1,122 5.9 721 3.8 740 3.9 6,918 36.5 18,969 100 Full-time 1,899 4.6 2,380 5.8 2,757 6.7 1,642 4.0 1,702 4.1 1,179 2.9 11,671 28.4 41,120 100 All 2,962 4.9 4,232 7.0 3,664 6.1 2,764 4.6 2,424 4.0 1,918 3.2 18,589 30.9 60,088 100
ALL Part-time 28,277 5.0 33,871 6.0 24,604 4.4 29,118 5.2 24,092 4.3 18,497 3.3 172,357 30.7 561,333 100 Full-time 9,334 3.9 12,727 5.3 11,012 4.5 6,741 2.8 7,958 3.3 6,188 2.6 35,143 14.5 242,150 100 All 37,611 4.7 46,598 5.8 35,616 4.4 35,860 4.5 32,050 4.0 24,685 3.1 207,501 25.8 803,483 100
TABLE W-17.2B: STUDENT ACADEMIC YEAR HOURLY WAGES BY SEGMENT, COURSE LOAD, AND DEPENDENCY STATUS
Source: California Student Aid Commission 72 2003-04 SEARS

ALL UNDERGRADUATES
$6.75 to $7.24 $7.25 to $7.74 $7.75 to $8.24 $8.25 to $8.74 $8.75 to $9.24 $9.25 to $9.74 $9.75 to $10.24 $10.25 to $10.74
# % # % # % # % # % # % # % # %Part-time 223,273 23.9 53,014 5.7 61,083 6.5 36,376 3.9 46,326 5.0 27,302 2.9 56,723 6.1 32,123 3.4 Full-time 255,379 34.6 76,222 10.3 61,714 8.4 42,472 5.8 39,453 5.3 24,580 3.3 52,837 7.2 22,231 3.0 All 478,652 28.6 129,236 7.7 122,797 7.3 78,849 4.7 85,780 5.1 51,883 3.1 109,560 6.6 54,354 3.3
$10.75 to $11.74 $11.75 to 12.74 $12.75 to $13.74 $13.75 to $14.74 $14.75 to $15.74 $15.75 to $16.74 More than $16.75 Total
# % # % # % # % # % # % # % # %Part-time 40,536 4.3 51,496 5.5 33,377 3.6 33,803 3.6 30,199 3.2 21,457 2.3 186,434 20.0 933,523 100 Full-time 27,349 3.7 30,615 4.1 20,067 2.7 13,057 1.8 15,162 2.1 9,769 1.3 47,469 6.4 738,377 100 All 67,886 4.1 82,110 4.9 53,444 3.2 46,860 2.8 45,361 2.7 31,226 1.9 233,903 14.0 1,671,900 100
TABLE W-17.2C: STUDENT ACADEMIC YEAR HOURLY WAGES BY SEGMENT, COURSE LOAD, AND DEPENDENCY STATUS
Source: California Student Aid Commission 73 2003-04 SEARS

DEPENDENT UNDERGRADUATES
$6.75 to $7.24 $7.25 to $7.74 $7.75 to $8.24 $8.25 to $8.74 $8.75 to $9.24 $9.25 to $9.74 $9.75 to $10.24 $10.25 to $10.74
# % # % # % # % # % # % # % # %CCC Part-time 344 37.2 92 10.0 88 9.5 59 6.4 66 7.1 28 3.0 64 6.9 23 2.5
Full-time 861 44.8 272 14.2 189 9.8 116 6.0 91 4.7 46 2.4 98 5.1 54 2.8 All 1,205 42.4 364 12.8 277 9.7 175 6.2 157 5.5 74 2.6 162 5.7 77 2.7
UC Part-time 111 51.6 10 4.7 19 8.8 6 2.8 7 3.3 11 5.1 26 12.1 5 2.3 Full-time 412 33.3 83 6.7 102 8.3 59 4.8 67 5.4 37 3.0 140 11.3 38 3.1 All 523 36.0 93 6.4 121 8.3 65 4.5 74 5.1 48 3.3 166 11.4 43 3.0
CSU Part-time 38 18.5 16 7.8 18 8.8 17 8.3 19 9.3 7 3.4 23 11.2 7 3.4 Full-time 482 29.6 170 10.4 158 9.7 124 7.6 110 6.8 75 4.6 128 7.9 49 3.0 All 520 28.4 186 10.1 176 9.6 141 7.7 129 7.0 82 4.5 151 8.2 56 3.1
ICU Part-time 36 34.3 17 16.2 12 11.4 9 8.6 8 7.6 2 1.9 7 6.7 3 2.9 Full-time 482 31.4 276 18.0 177 11.5 114 7.4 95 6.2 44 2.9 127 8.3 28 1.8 All 518 31.6 293 17.9 189 11.5 123 7.5 103 6.3 46 2.8 134 8.2 31 1.9
PCC Part-time 77 30.6 27 10.7 39 15.5 16 6.3 21 8.3 8 3.2 13 5.2 8 3.2 Full-time 273 31.4 112 12.9 105 12.1 68 7.8 70 8.0 33 3.8 51 5.9 34 3.9 All 350 31.2 139 12.4 144 12.8 84 7.5 91 8.1 41 3.7 64 5.7 42 3.7
ALL Part-time 606 35.6 162 9.5 176 10.3 107 6.3 121 7.1 56 3.3 133 7.8 46 2.7 Full-time 2,510 34.9 913 12.7 731 10.2 481 6.7 433 6.0 235 3.3 544 7.6 203 2.8 All 3,116 35.0 1,075 12.1 907 10.2 588 6.6 554 6.2 291 3.3 677 7.6 249 2.8
$10.75 to $11.74 $11.75 to 12.74 $12.75 to $13.74 $13.75 to $14.74 $14.75 to $15.74 $15.75 to $16.74 More than $16.75 Total
# % # % # % # % # % # % # % # %CCC Part-time 29 3.1 45 4.9 21 2.3 11 1.2 15 1.6 6 0.6 33 3.6 924 100
Full-time 58 3.0 46 2.4 24 1.2 16 0.8 16 0.8 6 0.3 28 1.5 1,921 100 All 87 3.1 91 3.2 45 1.6 27 0.9 31 1.1 12 0.4 61 2.1 2,845 100
UC Part-time 3 1.4 5 2.3 3 1.4 - - 4 1.9 1 0.5 4 1.9 215 100 Full-time 50 4.0 82 6.6 37 3.0 19 1.5 31 2.5 13 1.1 66 5.3 1,236 100 All 53 3.7 87 6.0 40 2.8 19 1.3 35 2.4 14 1.0 70 4.8 1,451 100
CSU Part-time 12 5.9 8 3.9 9 4.4 8 3.9 3 1.5 6 2.9 14 6.8 205 100 Full-time 87 5.3 74 4.5 39 2.4 30 1.8 31 1.9 19 1.2 53 3.3 1,629 100 All 99 5.4 82 4.5 48 2.6 38 2.1 34 1.9 25 1.4 67 3.7 1,834 100
ICU Part-time - - 3 2.9 1 1.0 1 1.0 2 1.9 - - 4 3.8 105 100 Full-time 31 2.0 47 3.1 20 1.3 13 0.8 29 1.9 11 0.7 42 2.7 1,536 100 All 31 1.9 50 3.0 21 1.3 14 0.9 31 1.9 11 0.7 46 2.8 1,641 100
PCC Part-time 7 2.8 9 3.6 4 1.6 5 2.0 3 1.2 3 1.2 12 4.8 252 100 Full-time 35 4.0 30 3.4 17 2.0 4 0.5 10 1.1 5 0.6 23 2.6 870 100 All 42 3.7 39 3.5 21 1.9 9 0.8 13 1.2 8 0.7 35 3.1 1,122 100
ALL Part-time 51 3.0 70 4.1 38 2.2 25 1.5 27 1.6 16 0.9 67 3.9 1,701 100 Full-time 261 3.6 279 3.9 137 1.9 82 1.1 117 1.6 54 0.8 212 2.9 7,192 100 All 312 3.5 349 3.9 175 2.0 107 1.2 144 1.6 70 0.8 279 3.1 8,893 100
TABLE U-17.2A: STUDENT ACADEMIC YEAR HOURLY WAGES BY SEGMENT, COURSE LOAD, AND DEPENDENCY STATUS
Source: California Student Aid Commission 74 2003-04 SEARS

INDEPENDENT UNDERGRADUATES
$6.75 to $7.24 $7.25 to $7.74 $7.75 to $8.24 $8.25 to $8.74 $8.75 to $9.24 $9.25 to $9.74 $9.75 to $10.24 $10.25 to $10.74
# % # % # % # % # % # % # % # %CCC Part-time 222 16.4 44 3.2 67 4.9 31 2.3 51 3.8 41 3.0 71 5.2 57 4.2
Full-time 372 39.4 86 9.1 64 6.8 35 3.7 46 4.9 32 3.4 47 5.0 30 3.2 All 594 25.8 130 5.6 131 5.7 66 2.9 97 4.2 73 3.2 118 5.1 87 3.8
UC Part-time 12 26.1 - - 2 4.3 1 2.2 1 2.2 - - 9 19.6 2 4.3 Full-time 50 26.2 11 5.8 16 8.4 10 5.2 6 3.1 5 2.6 22 11.5 7 3.7 All 62 26.2 11 4.6 18 7.6 11 4.6 7 3.0 5 2.1 31 13.1 9 3.8
CSU Part-time 49 9.2 11 2.1 9 1.7 11 2.1 14 2.6 12 2.2 34 6.4 17 3.2 Full-time 180 19.7 52 5.7 53 5.8 35 3.8 44 4.8 32 3.5 102 11.2 38 4.2 All 229 15.8 63 4.3 62 4.3 46 3.2 58 4.0 44 3.0 136 9.4 55 3.8
ICU Part-time 16 11.0 3 2.1 1 0.7 3 2.1 2 1.4 - - 6 4.1 3 2.1 Full-time 41 15.0 15 5.5 19 6.9 14 5.1 16 5.8 7 2.6 33 12.0 5 1.8 All 57 13.6 18 4.3 20 4.8 17 4.0 18 4.3 7 1.7 39 9.3 8 1.9
PCC Part-time 71 14.2 17 3.4 25 5.0 16 3.2 10 2.0 16 3.2 29 5.8 24 4.8 Full-time 300 21.7 60 4.3 73 5.3 55 4.0 78 5.6 42 3.0 90 6.5 49 3.5 All 371 19.7 77 4.1 98 5.2 71 3.8 88 4.7 58 3.1 119 6.3 73 3.9
ALL Part-time 370 14.3 75 2.9 104 4.0 62 2.4 78 3.0 69 2.7 149 5.8 103 4.0 Full-time 943 25.4 224 6.0 225 6.1 149 4.0 190 5.1 118 3.2 294 7.9 129 3.5 All 1,313 20.9 299 4.8 329 5.2 211 3.4 268 4.3 187 3.0 443 7.0 232 3.7
$10.75 to $11.74 $11.75 to 12.74 $12.75 to $13.74 $13.75 to $14.74 $14.75 to $15.74 $15.75 to $16.74 More than $16.75 Total
# % # % # % # % # % # % # % # %CCC Part-time 67 4.9 78 5.7 57 4.2 73 5.4 56 4.1 43 3.2 399 29.4 1,357 100
Full-time 24 2.5 33 3.5 31 3.3 19 2.0 18 1.9 19 2.0 88 9.3 944 100 All 91 4.0 111 4.8 88 3.8 92 4.0 74 3.2 62 2.7 487 21.2 2,301 100
UC Part-time - - 2 4.3 1 2.2 - - 4 8.7 2 4.3 10 21.7 46 100 Full-time 7 3.7 10 5.2 9 4.7 8 4.2 6 3.1 7 3.7 17 8.9 191 100 All 7 3.0 12 5.1 10 4.2 8 3.4 10 4.2 9 3.8 27 11.4 237 100
CSU Part-time 33 6.2 36 6.7 36 6.7 19 3.6 30 5.6 21 3.9 203 37.9 535 100 Full-time 50 5.5 61 6.7 42 4.6 34 3.7 46 5.0 23 2.5 122 13.3 914 100 All 83 5.7 97 6.7 78 5.4 53 3.7 76 5.2 44 3.0 325 22.4 1,449 100
ICU Part-time 3 2.1 11 7.5 9 6.2 6 4.1 7 4.8 10 6.8 66 45.2 146 100 Full-time 7 2.6 17 6.2 15 5.5 4 1.5 11 4.0 14 5.1 56 20.4 274 100 All 10 2.4 28 6.7 24 5.7 10 2.4 18 4.3 24 5.7 122 29.0 420 100
PCC Part-time 32 6.4 27 5.4 22 4.4 20 4.0 19 3.8 19 3.8 154 30.7 501 100 Full-time 68 4.9 68 4.9 76 5.5 47 3.4 55 4.0 36 2.6 288 20.8 1,385 100 All 100 5.3 95 5.0 98 5.2 67 3.6 74 3.9 55 2.9 442 23.4 1,886 100
ALL Part-time 135 5.2 154 6.0 125 4.8 118 4.6 116 4.5 95 3.7 832 32.2 2,585 100 Full-time 156 4.2 189 5.1 173 4.7 112 3.0 136 3.7 99 2.7 571 15.4 3,708 100 All 291 4.6 343 5.5 298 4.7 230 3.7 252 4.0 194 3.1 1,403 22.3 6,293 100
TABLE U-17.2B: STUDENT ACADEMIC YEAR HOURLY WAGES BY SEGMENT, COURSE LOAD, AND DEPENDENCY STATUS
Source: California Student Aid Commission 75 2003-04 SEARS
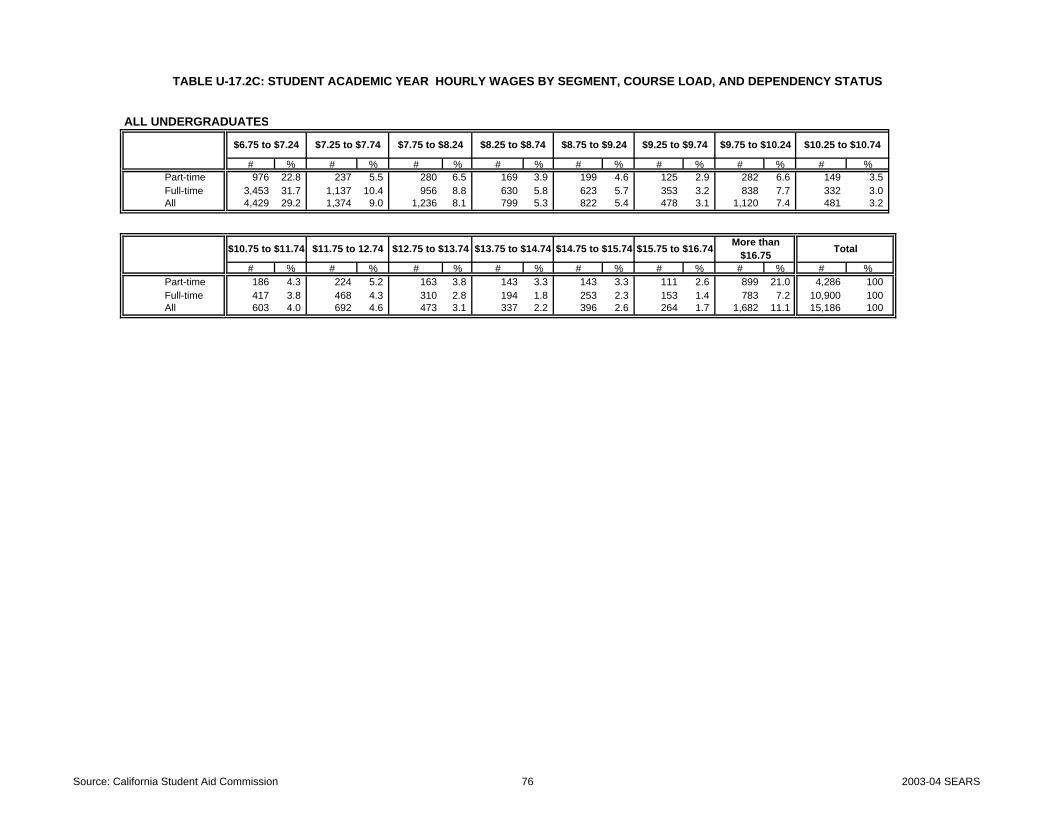
ALL UNDERGRADUATES
$6.75 to $7.24 $7.25 to $7.74 $7.75 to $8.24 $8.25 to $8.74 $8.75 to $9.24 $9.25 to $9.74 $9.75 to $10.24 $10.25 to $10.74
# % # % # % # % # % # % # % # %Part-time 976 22.8 237 5.5 280 6.5 169 3.9 199 4.6 125 2.9 282 6.6 149 3.5 Full-time 3,453 31.7 1,137 10.4 956 8.8 630 5.8 623 5.7 353 3.2 838 7.7 332 3.0 All 4,429 29.2 1,374 9.0 1,236 8.1 799 5.3 822 5.4 478 3.1 1,120 7.4 481 3.2
$10.75 to $11.74 $11.75 to 12.74 $12.75 to $13.74 $13.75 to $14.74 $14.75 to $15.74 $15.75 to $16.74 More than $16.75 Total
# % # % # % # % # % # % # % # %Part-time 186 4.3 224 5.2 163 3.8 143 3.3 143 3.3 111 2.6 899 21.0 4,286 100 Full-time 417 3.8 468 4.3 310 2.8 194 1.8 253 2.3 153 1.4 783 7.2 10,900 100 All 603 4.0 692 4.6 473 3.1 337 2.2 396 2.6 264 1.7 1,682 11.1 15,186 100
TABLE U-17.2C: STUDENT ACADEMIC YEAR HOURLY WAGES BY SEGMENT, COURSE LOAD, AND DEPENDENCY STATUS
Source: California Student Aid Commission 76 2003-04 SEARS

DEPENDENT UNDERGRADUATES INDEPENDENT UNDERGRADUATES ALL UNDERGRADUATES
CCC Part-time 924 8.07$ 7.89$ CCC Part-time 1,357 11.97$ 12.09$ CCC Part-time 2,281 10.39$ 9.77$ Full-time 1,921 7.21$ 7.42$ Full-time 944 8.47$ 7.85$ Full-time 2,865 7.62$ 7.52$ All 2,845 7.49$ 7.65$ All 2,301 10.53$ 10.92$ All 5,146 8.85$ 8.75$
UC Part-time 215 7.05$ 7.11$ UC Part-time 46 10.86$ 9.44$ UC Part-time 261 7.72$ 7.24$ Full-time 1,236 8.52$ 8.38$ Full-time 191 9.53$ 9.48$ Full-time 1,427 8.66$ 8.50$ All 1,451 8.30$ 8.07$ All 237 9.79$ 9.77$ All 1,688 8.51$ 8.18$
CSU Part-time 205 9.62$ 9.57$ CSU Part-time 535 13.23$ 14.69$ CSU Part-time 740 12.23$ 12.35$ Full-time 1,629 8.51$ 8.47$ Full-time 914 10.45$ 10.14$ Full-time 2,543 9.21$ 9.00$
All 1,834 8.64$ 8.60$ All 1,449 11.47$ 11.60$ All 3,283 9.89$ 9.72$ ICU Part-time 105 7.92$ 8.20$ ICU Part-time 146 13.80$ 15.88$ ICU Part-time 251 11.34$ 13.80$ Full-time 1,536 8.13$ 7.82$ Full-time 274 11.20$ 10.24$ Full-time 1,810 8.59$ 8.04$
All 1,641 8.11$ 7.84$ All 420 12.10$ 13.04$ All 2,061 8.93$ 8.24$ PCC Part-time 252 8.40$ 8.07$ PCC Part-time 501 12.17$ 13.73$ PCC Part-time 753 10.91$ 12.15$ Full-time 870 8.04$ 7.91$ Full-time 1,385 10.79$ 12.08$ Full-time 2,255 9.73$ 9.74$
All 1,122 8.12$ 7.96$ All 1,886 11.16$ 12.58$ All 3,008 10.02$ 10.31$ ALL Part-time 1,701 8.17$ 7.94$ ALL Part-time 2,585 12.35$ 12.38$ ALL Part-time 4,286 10.69$ 9.91$
Full-time 7,192 8.03$ 7.76$ Full-time 3,708 10.08$ 9.33$ Full-time 10,900 8.73$ 8.04$ All 8,893 8.05$ 7.84$ All 6,293 11.01$ 11.22$ All 15,186 9.28$ 8.89$
TABLE M-17.2: MEAN AND MEDIAN ACADEMIC YEAR HOURLY WAGES BY SEGMENT, COURSE LOAD, AND DEPENDENCY STATUS
Number Mean Median Number MedianMean Median Number Mean
Source: California Student Aid Commission 77 2003-04 SEARS

W-17.3, U-17.3, and M-17.3 (Academic Year Hours Volunteered) How many hours on average do you, or will you, volunteer per week during the current academic year
(e.g., September through May or October through June 0 None, I can not/will not volunteer 4 16 to 20 8 36 to 40 1 Less than 5 5 21 to 25 9 40 hours or more 2 5 to 10 6 26 to 30 3 11 to 15 7 31 to 35
W-17.3.1, U-17.3.1, and M-17.3.1 (Academic Year Hours Internships) How many hours on average do you, or will you, work in unpaid internships per week during the current
academic year (e.g., September through May or October through June 0 I do not/will not work 4 16 to 20 8 36 to 40 1 Less than 5 5 21 to 25 9 40 hours or more 2 5 to 10 6 26 to 30 3 11 to 15 7 31 to 35
W-17.4 and U-17.4 Work and Volunteer Pattern 78 2003-04 SEARS

TABLE W-17.3: ACADEMIC YEAR VOLUNTEER HOURS BY SEGMENT, COURSE LOAD, AND DEPENDENCY STATUS
DEPENDENT UNDERGRADUATES
None Less Than 5 Hours 5 to 10 Hours 11 to 15 Hours 16 to 20 Hours 21 to 25 Hours 26 to 30 Hours 31 to 35 Hours 36 to 40 Hours 40 or More Hours All
# % # % # % # % # % # % # % # % # % # % # %CCC Part-time 286,093 74.7 38,265 10.0 28,252 7.4 9,656 2.5 6,080 1.6 3,934 1.0 2,503 0.7 715 0.2 1,073 0.3 6,437 1.7 383,007 100
Full-time 187,151 68.3 36,464 13.3 24,511 8.9 9,418 3.4 6,158 2.2 3,019 1.1 2,536 0.9 362 0.1 121 0.0 4,347 1.6 274,086 100 All 473,244 72.0 74,729 11.4 52,763 8.0 19,074 2.9 12,237 1.9 6,952 1.1 5,039 0.8 1,077 0.2 1,194 0.2 10,784 1.6 657,093 100
UC Part-time 15,961 57.0 6,909 24.7 3,827 13.7 683 2.4 189 0.7 70 0.3 141 0.5 - - - - 223 0.8 28,003 100 Full-time 67,519 60.0 25,437 22.6 12,463 11.1 3,402 3.0 1,541 1.4 720 0.6 195 0.2 198 0.2 117 0.1 1,015 0.9 112,606 100 All 83,480 59.4 32,346 23.0 16,290 11.6 4,085 2.9 1,730 1.2 790 0.6 335 0.2 198 0.1 117 0.1 1,238 0.9 140,610 100
CSU Part-time 13,561 68.4 3,516 17.7 1,965 9.9 232 1.2 296 1.5 83 0.4 - - - - - - 159 0.8 19,813 100 Full-time 93,232 60.7 31,236 20.3 17,940 11.7 4,489 2.9 3,036 2.0 475 0.3 951 0.6 442 0.3 268 0.2 1,527 1.0 153,596 100 All 106,793 61.6 34,752 20.0 19,905 11.5 4,721 2.7 3,332 1.9 558 0.3 951 0.5 442 0.3 268 0.2 1,686 1.0 173,408 100
ICU Part-time 3,718 73.2 844 16.6 373 7.3 95 1.9 - - - - 7 0.1 - - - - 42 0.8 5,079 100 Full-time 39,437 44.3 28,409 31.9 13,949 15.7 3,415 3.8 1,466 1.6 535 0.6 547 0.6 173 0.2 143 0.2 961 1.1 89,035 100 All 43,155 45.9 29,253 31.1 14,322 15.2 3,510 3.7 1,466 1.6 535 0.6 553 0.6 173 0.2 143 0.2 1,003 1.1 94,115 100
PCC Part-time 4,866 76.7 522 8.2 389 6.1 41 0.7 165 2.6 83 1.3 157 2.5 - - 12 0.2 110 1.7 6,347 100 Full-time 17,177 74.1 2,055 8.9 1,441 6.2 479 2.1 649 2.8 460 2.0 210 0.9 63 0.3 239 1.0 415 1.8 23,188 100 All 22,043 74.6 2,577 8.7 1,830 6.2 521 1.8 814 2.8 543 1.8 367 1.2 63 0.2 251 0.9 526 1.8 29,535 100
ALL Part-time 324,200 73.3 50,057 11.3 34,806 7.9 10,708 2.4 6,729 1.5 4,170 0.9 2,808 0.6 715 0.2 1,085 0.2 6,972 1.6 442,250 100 Full-time 404,516 62.0 123,601 18.9 70,304 10.8 21,203 3.2 12,849 2.0 5,209 0.8 4,438 0.7 1,238 0.2 888 0.1 8,265 1.3 652,511 100 All 728,716 66.6 173,658 15.9 105,110 9.6 31,911 2.9 19,578 1.8 9,379 0.9 7,246 0.7 1,953 0.2 1,973 0.2 15,237 1.4 1,094,760 100
INDEPENDENT UNDERGRADUATES
None Less Than 5 Hours 5 to 10 Hours 11 to 15 Hours 16 to 20 Hours 21 to 25 Hours 26 to 30 Hours 31 to 35 Hours 36 to 40 Hours 40 or More Hours All
# % # % # % # % # % # % # % # % # % # % # %CCC Part-time 415,908 71.9 58,649 10.1 43,987 7.6 16,093 2.8 14,662 2.5 7,868 1.4 4,649 0.8 2,146 0.4 2,861 0.5 11,801 2.0 578,623 100
Full-time 99,250 66.9 19,319 13.0 13,765 9.3 4,950 3.3 4,347 2.9 1,328 0.9 1,087 0.7 362 0.2 966 0.7 3,019 2.0 148,393 100 All 515,158 70.9 77,968 10.7 57,752 7.9 21,043 2.9 19,009 2.6 9,196 1.3 5,736 0.8 2,508 0.3 3,827 0.5 14,820 2.0 727,016 100
UC Part-time 2,350 61.5 749 19.6 475 12.4 - - 108 2.8 - - 70 1.8 - - - - 70 1.8 3,822 100 Full-time 8,264 61.1 2,655 19.6 1,507 11.1 523 3.9 320 2.4 90 0.7 49 0.4 40 0.3 - - 77 0.6 13,525 100 All 10,614 61.2 3,404 19.6 1,982 11.4 523 3.0 429 2.5 90 0.5 119 0.7 40 0.2 - - 147 0.8 17,347 100
CSU Part-time 32,913 65.3 9,063 18.0 4,513 8.9 1,082 2.1 1,005 2.0 575 1.1 236 0.5 127 0.3 137 0.3 782 1.6 50,433 100 Full-time 50,370 61.8 15,728 19.3 9,666 11.9 2,157 2.6 1,742 2.1 771 0.9 67 0.1 291 0.4 186 0.2 571 0.7 81,549 100 All 83,283 63.1 24,791 18.8 14,179 10.7 3,239 2.5 2,747 2.1 1,346 1.0 303 0.2 418 0.3 323 0.2 1,353 1.0 131,982 100
ICU Part-time 6,142 62.4 2,039 20.7 1,201 12.2 198 2.0 - - 121 1.2 34 0.3 - - - - 104 1.1 9,840 100 Full-time 9,408 55.2 4,408 25.9 1,772 10.4 409 2.4 568 3.3 53 0.3 48 0.3 70 0.4 - - 300 1.8 17,035 100 All 15,551 57.9 6,447 24.0 2,973 11.1 607 2.3 568 2.1 174 0.6 81 0.3 70 0.3 - - 404 1.5 26,875 100
PCC Part-time 16,167 75.9 1,394 6.5 1,688 7.9 657 3.1 400 1.9 123 0.6 64 0.3 - - 224 1.1 592 2.8 21,308 100 Full-time 36,469 74.0 3,915 7.9 2,721 5.5 1,373 2.8 1,099 2.2 634 1.3 339 0.7 104 0.2 516 1.0 2,123 4.3 49,291 100 All 52,636 74.6 5,309 7.5 4,408 6.2 2,031 2.9 1,498 2.1 756 1.1 404 0.6 104 0.1 740 1.0 2,715 3.8 70,600 100
ALL Part-time 473,480 71.3 71,894 10.8 51,864 7.8 18,030 2.7 16,174 2.4 8,687 1.3 5,053 0.8 2,273 0.3 3,222 0.5 13,350 2.0 664,026 100 Full-time 203,762 65.8 46,025 14.9 29,431 9.5 9,413 3.0 8,075 2.6 2,875 0.9 1,589 0.5 867 0.3 1,667 0.5 6,089 2.0 309,793 100 All 677,242 69.5 117,919 12.1 81,295 8.3 27,443 2.8 24,250 2.5 11,562 1.2 6,642 0.7 3,139 0.3 4,890 0.5 19,439 2.0 973,820 100
ALL UNDERGRADUATESPart-time 797,680 72.1 121,951 11.0 86,669 7.8 28,738 2.6 22,903 2.1 12,857 1.2 7,861 0.7 2,988 0.3 4,307 0.4 20,322 1.8 1,106,276 100 Full-time 608,278 63.2 169,625 17.6 99,736 10.4 30,616 3.2 20,925 2.2 8,084 0.8 6,027 0.6 2,105 0.2 2,555 0.3 14,354 1.5 962,304 100 All 1,405,958 68.0 291,576 14.1 186,405 9.0 59,354 2.9 43,828 2.1 20,941 1.0 13,888 0.7 5,093 0.2 6,863 0.3 34,676 1.7 2,068,580 100
Source: California Student Aid Commission 79 2003-04 SEARS
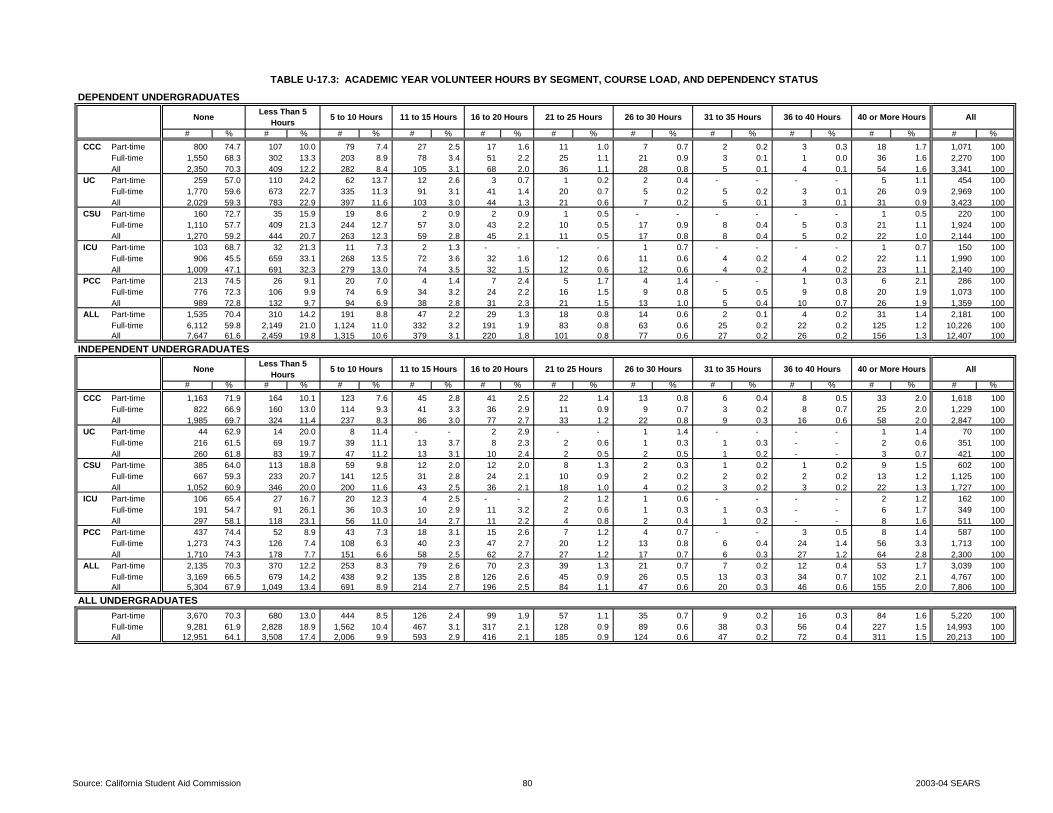
TABLE U-17.3: ACADEMIC YEAR VOLUNTEER HOURS BY SEGMENT, COURSE LOAD, AND DEPENDENCY STATUS
DEPENDENT UNDERGRADUATES
None Less Than 5 Hours 5 to 10 Hours 11 to 15 Hours 16 to 20 Hours 21 to 25 Hours 26 to 30 Hours 31 to 35 Hours 36 to 40 Hours 40 or More Hours All
# % # % # % # % # % # % # % # % # % # % # %CCC Part-time 800 74.7 107 10.0 79 7.4 27 2.5 17 1.6 11 1.0 7 0.7 2 0.2 3 0.3 18 1.7 1,071 100
Full-time 1,550 68.3 302 13.3 203 8.9 78 3.4 51 2.2 25 1.1 21 0.9 3 0.1 1 0.0 36 1.6 2,270 100 All 2,350 70.3 409 12.2 282 8.4 105 3.1 68 2.0 36 1.1 28 0.8 5 0.1 4 0.1 54 1.6 3,341 100
UC Part-time 259 57.0 110 24.2 62 13.7 12 2.6 3 0.7 1 0.2 2 0.4 - - - - 5 1.1 454 100 Full-time 1,770 59.6 673 22.7 335 11.3 91 3.1 41 1.4 20 0.7 5 0.2 5 0.2 3 0.1 26 0.9 2,969 100 All 2,029 59.3 783 22.9 397 11.6 103 3.0 44 1.3 21 0.6 7 0.2 5 0.1 3 0.1 31 0.9 3,423 100
CSU Part-time 160 72.7 35 15.9 19 8.6 2 0.9 2 0.9 1 0.5 - - - - - - 1 0.5 220 100 Full-time 1,110 57.7 409 21.3 244 12.7 57 3.0 43 2.2 10 0.5 17 0.9 8 0.4 5 0.3 21 1.1 1,924 100 All 1,270 59.2 444 20.7 263 12.3 59 2.8 45 2.1 11 0.5 17 0.8 8 0.4 5 0.2 22 1.0 2,144 100
ICU Part-time 103 68.7 32 21.3 11 7.3 2 1.3 - - - - 1 0.7 - - - - 1 0.7 150 100 Full-time 906 45.5 659 33.1 268 13.5 72 3.6 32 1.6 12 0.6 11 0.6 4 0.2 4 0.2 22 1.1 1,990 100 All 1,009 47.1 691 32.3 279 13.0 74 3.5 32 1.5 12 0.6 12 0.6 4 0.2 4 0.2 23 1.1 2,140 100
PCC Part-time 213 74.5 26 9.1 20 7.0 4 1.4 7 2.4 5 1.7 4 1.4 - - 1 0.3 6 2.1 286 100 Full-time 776 72.3 106 9.9 74 6.9 34 3.2 24 2.2 16 1.5 9 0.8 5 0.5 9 0.8 20 1.9 1,073 100 All 989 72.8 132 9.7 94 6.9 38 2.8 31 2.3 21 1.5 13 1.0 5 0.4 10 0.7 26 1.9 1,359 100
ALL Part-time 1,535 70.4 310 14.2 191 8.8 47 2.2 29 1.3 18 0.8 14 0.6 2 0.1 4 0.2 31 1.4 2,181 100 Full-time 6,112 59.8 2,149 21.0 1,124 11.0 332 3.2 191 1.9 83 0.8 63 0.6 25 0.2 22 0.2 125 1.2 10,226 100 All 7,647 61.6 2,459 19.8 1,315 10.6 379 3.1 220 1.8 101 0.8 77 0.6 27 0.2 26 0.2 156 1.3 12,407 100
INDEPENDENT UNDERGRADUATES
None Less Than 5 Hours 5 to 10 Hours 11 to 15 Hours 16 to 20 Hours 21 to 25 Hours 26 to 30 Hours 31 to 35 Hours 36 to 40 Hours 40 or More Hours All
# % # % # % # % # % # % # % # % # % # % # %CCC Part-time 1,163 71.9 164 10.1 123 7.6 45 2.8 41 2.5 22 1.4 13 0.8 6 0.4 8 0.5 33 2.0 1,618 100
Full-time 822 66.9 160 13.0 114 9.3 41 3.3 36 2.9 11 0.9 9 0.7 3 0.2 8 0.7 25 2.0 1,229 100 All 1,985 69.7 324 11.4 237 8.3 86 3.0 77 2.7 33 1.2 22 0.8 9 0.3 16 0.6 58 2.0 2,847 100
UC Part-time 44 62.9 14 20.0 8 11.4 - - 2 2.9 - - 1 1.4 - - - - 1 1.4 70 100 Full-time 216 61.5 69 19.7 39 11.1 13 3.7 8 2.3 2 0.6 1 0.3 1 0.3 - - 2 0.6 351 100 All 260 61.8 83 19.7 47 11.2 13 3.1 10 2.4 2 0.5 2 0.5 1 0.2 - - 3 0.7 421 100
CSU Part-time 385 64.0 113 18.8 59 9.8 12 2.0 12 2.0 8 1.3 2 0.3 1 0.2 1 0.2 9 1.5 602 100 Full-time 667 59.3 233 20.7 141 12.5 31 2.8 24 2.1 10 0.9 2 0.2 2 0.2 2 0.2 13 1.2 1,125 100 All 1,052 60.9 346 20.0 200 11.6 43 2.5 36 2.1 18 1.0 4 0.2 3 0.2 3 0.2 22 1.3 1,727 100
ICU Part-time 106 65.4 27 16.7 20 12.3 4 2.5 - - 2 1.2 1 0.6 - - - - 2 1.2 162 100 Full-time 191 54.7 91 26.1 36 10.3 10 2.9 11 3.2 2 0.6 1 0.3 1 0.3 - - 6 1.7 349 100 All 297 58.1 118 23.1 56 11.0 14 2.7 11 2.2 4 0.8 2 0.4 1 0.2 - - 8 1.6 511 100
PCC Part-time 437 74.4 52 8.9 43 7.3 18 3.1 15 2.6 7 1.2 4 0.7 - - 3 0.5 8 1.4 587 100 Full-time 1,273 74.3 126 7.4 108 6.3 40 2.3 47 2.7 20 1.2 13 0.8 6 0.4 24 1.4 56 3.3 1,713 100 All 1,710 74.3 178 7.7 151 6.6 58 2.5 62 2.7 27 1.2 17 0.7 6 0.3 27 1.2 64 2.8 2,300 100
ALL Part-time 2,135 70.3 370 12.2 253 8.3 79 2.6 70 2.3 39 1.3 21 0.7 7 0.2 12 0.4 53 1.7 3,039 100 Full-time 3,169 66.5 679 14.2 438 9.2 135 2.8 126 2.6 45 0.9 26 0.5 13 0.3 34 0.7 102 2.1 4,767 100 All 5,304 67.9 1,049 13.4 691 8.9 214 2.7 196 2.5 84 1.1 47 0.6 20 0.3 46 0.6 155 2.0 7,806 100
ALL UNDERGRADUATESPart-time 3,670 70.3 680 13.0 444 8.5 126 2.4 99 1.9 57 1.1 35 0.7 9 0.2 16 0.3 84 1.6 5,220 100 Full-time 9,281 61.9 2,828 18.9 1,562 10.4 467 3.1 317 2.1 128 0.9 89 0.6 38 0.3 56 0.4 227 1.5 14,993 100 All 12,951 64.1 3,508 17.4 2,006 9.9 593 2.9 416 2.1 185 0.9 124 0.6 47 0.2 72 0.4 311 1.5 20,213 100
Source: California Student Aid Commission 80 2003-04 SEARS
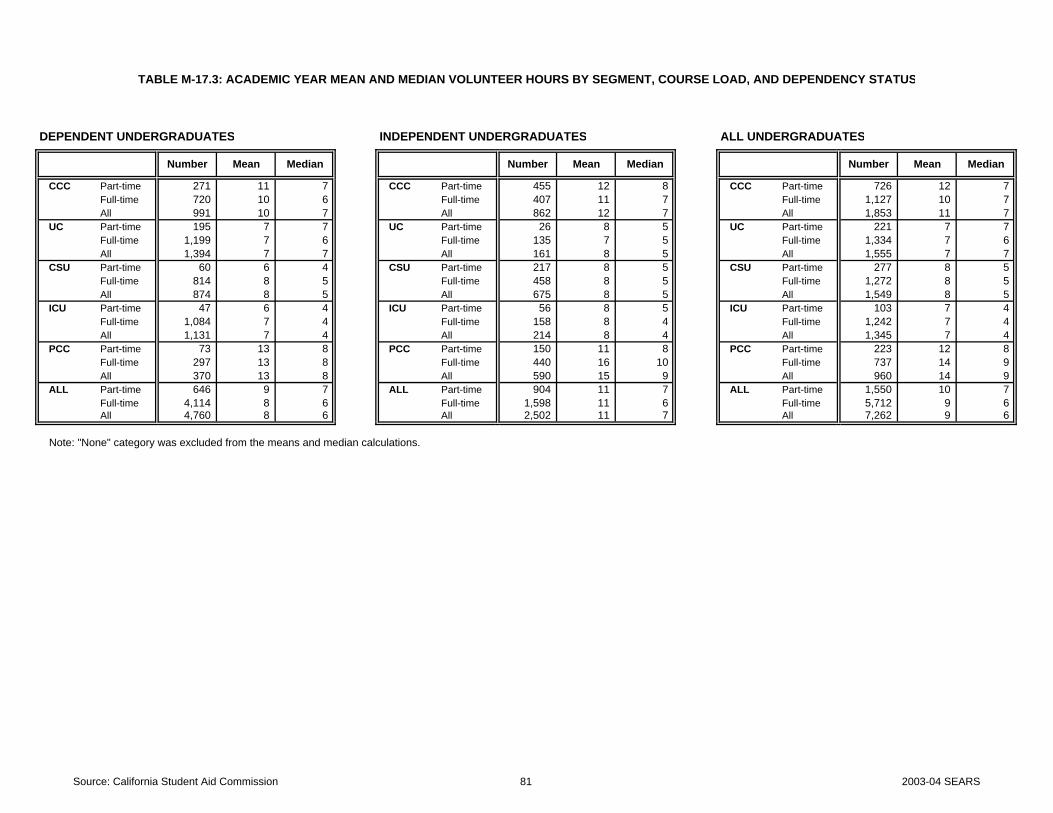
DEPENDENT UNDERGRADUATES INDEPENDENT UNDERGRADUATES ALL UNDERGRADUATES
CCC Part-time 271 11 7 CCC Part-time 455 12 8 CCC Part-time 726 12 7 Full-time 720 10 6 Full-time 407 11 7 Full-time 1,127 10 7 All 991 10 7 All 862 12 7 All 1,853 11 7
UC Part-time 195 7 7 UC Part-time 26 8 5 UC Part-time 221 7 7 Full-time 1,199 7 6 Full-time 135 7 5 Full-time 1,334 7 6 All 1,394 7 7 All 161 8 5 All 1,555 7 7
CSU Part-time 60 6 4 CSU Part-time 217 8 5 CSU Part-time 277 8 5 Full-time 814 8 5 Full-time 458 8 5 Full-time 1,272 8 5
All 874 8 5 All 675 8 5 All 1,549 8 5 ICU Part-time 47 6 4 ICU Part-time 56 8 5 ICU Part-time 103 7 4 Full-time 1,084 7 4 Full-time 158 8 4 Full-time 1,242 7 4
All 1,131 7 4 All 214 8 4 All 1,345 7 4 PCC Part-time 73 13 8 PCC Part-time 150 11 8 PCC Part-time 223 12 8 Full-time 297 13 8 Full-time 440 16 10 Full-time 737 14 9
All 370 13 8 All 590 15 9 All 960 14 9 ALL Part-time 646 9 7 ALL Part-time 904 11 7 ALL Part-time 1,550 10 7
Full-time 4,114 8 6 Full-time 1,598 11 6 Full-time 5,712 9 6 All 4,760 8 6 All 2,502 11 7 All 7,262 9 6
Note: "None" category was excluded from the means and median calculations.
TABLE M-17.3: ACADEMIC YEAR MEAN AND MEDIAN VOLUNTEER HOURS BY SEGMENT, COURSE LOAD, AND DEPENDENCY STATUS
Number Mean Median Number MedianMean Median Number Mean
Source: California Student Aid Commission 81 2003-04 SEARS

TABLE W-17.3.1: ACADEMIC YEAR INTERNSHIPS HOURS BY SEGMENT, COURSE LOAD, AND DEPENDENCY STATUS
DEPENDENT UNDERGRADUATES
None Less Than 5 Hours 5 to 10 Hours 11 to 15 Hours 16 to 20 Hours 21 to 25 Hours 26 to 30 Hours 31 to 35 Hours 36 to 40 Hours 40 or More Hours All
# % # % # % # % # % # % # % # % # % # % # %CCC Part-time 344,742 90.4 8,225 2.2 7,510 2.0 6,437 1.7 3,219 0.8 3,219 0.8 2,503 0.7 715 0.2 1,431 0.4 3,219 0.8 381,219 100
Full-time 245,832 90.3 9,297 3.4 4,709 1.7 3,502 1.3 2,536 0.9 2,656 1.0 1,207 0.4 724 0.3 241 0.1 1,570 0.6 272,275 100 All 590,574 90.4 17,522 2.7 12,219 1.9 9,939 1.5 5,754 0.9 5,875 0.9 3,711 0.6 1,440 0.2 1,672 0.3 4,788 0.7 653,493 100
UC Part-time 23,980 86.2 795 2.9 1,233 4.4 852 3.1 425 1.5 70 0.3 49 0.2 141 0.5 70 0.3 211 0.8 27,826 100 Full-time 93,006 83.2 4,773 4.3 8,177 7.3 2,428 2.2 1,591 1.4 601 0.5 308 0.3 117 0.1 139 0.1 592 0.5 111,731 100 All 116,986 83.8 5,569 4.0 9,410 6.7 3,279 2.3 2,016 1.4 672 0.5 356 0.3 257 0.2 209 0.1 803 0.6 139,557 100
CSU Part-time 17,635 87.9 538 2.7 596 3.0 502 2.5 484 2.4 26 0.1 78 0.4 - - 42 0.2 161 0.8 20,061 100 Full-time 132,439 86.2 4,171 2.7 6,869 4.5 3,317 2.2 3,928 2.6 958 0.6 398 0.3 181 0.1 127 0.1 1,230 0.8 153,617 100 All 150,074 86.4 4,708 2.7 7,465 4.3 3,818 2.2 4,412 2.5 984 0.6 475 0.3 181 0.1 170 0.1 1,391 0.8 173,678 100
ICU Part-time 4,260 83.9 76 1.5 441 8.7 - - 158 3.1 47 0.9 28 0.5 70 1.4 - - - - 5,080 100 Full-time 73,514 83.1 2,690 3.0 4,436 5.0 3,237 3.7 2,516 2.8 692 0.8 258 0.3 374 0.4 88 0.1 690 0.8 88,494 100 All 77,774 83.1 2,766 3.0 4,876 5.2 3,237 3.5 2,673 2.9 738 0.8 286 0.3 444 0.5 88 0.1 690 0.7 93,574 100
PCC Part-time 5,374 83.9 50 0.8 143 2.2 88 1.4 436 6.8 36 0.6 70 1.1 43 0.7 43 0.7 123 1.9 6,406 100 Full-time 18,329 79.8 593 2.6 747 3.3 449 2.0 723 3.1 314 1.4 322 1.4 132 0.6 505 2.2 846 3.7 22,959 100 All 23,703 80.7 643 2.2 890 3.0 538 1.8 1,158 3.9 350 1.2 391 1.3 174 0.6 547 1.9 969 3.3 29,365 100
ALL Part-time 395,992 89.9 9,685 2.2 9,923 2.3 7,879 1.8 4,721 1.1 3,398 0.8 2,727 0.6 968 0.2 1,586 0.4 3,714 0.8 440,591 100 Full-time 563,120 86.8 21,524 3.3 24,937 3.8 12,932 2.0 11,293 1.7 5,221 0.8 2,493 0.4 1,527 0.2 1,100 0.2 4,929 0.8 649,076 100 All 959,112 88.0 31,209 2.9 34,860 3.2 20,811 1.9 16,014 1.5 8,619 0.8 5,220 0.5 2,496 0.2 2,685 0.2 8,642 0.8 1,089,667 100
INDEPENDENT UNDERGRADUATES
None Less Than 5 Hours 5 to 10 Hours 11 to 15 Hours 16 to 20 Hours 21 to 25 Hours 26 to 30 Hours 31 to 35 Hours 36 to 40 Hours 40 or More Hours All
# % # % # % # % # % # % # % # % # % # % # %CCC Part-time 510,676 88.8 12,517 2.2 11,086 1.9 8,940 1.6 9,656 1.7 5,007 0.9 3,934 0.7 1,788 0.3 3,576 0.6 7,868 1.4 575,047 100
Full-time 124,848 85.5 5,313 3.6 5,675 3.9 2,294 1.6 3,381 2.3 483 0.3 604 0.4 483 0.3 483 0.3 2,415 1.7 145,978 100 All 635,524 88.1 17,830 2.5 16,761 2.3 11,235 1.6 13,036 1.8 5,490 0.8 4,538 0.6 2,271 0.3 4,059 0.6 10,282 1.4 721,025 100
UC Part-time 3,674 94.9 - - 112 2.9 37 1.0 49 1.3 - - - - - - - - - - 3,871 100 Full-time 11,224 81.8 710 5.2 849 6.2 432 3.2 177 1.3 93 0.7 41 0.3 76 0.6 - - 113 0.8 13,715 100 All 14,898 84.7 710 4.0 961 5.5 469 2.7 225 1.3 93 0.5 41 0.2 76 0.4 - - 113 0.6 17,586 100
CSU Part-time 43,843 87.2 1,525 3.0 1,816 3.6 942 1.9 663 1.3 317 0.6 127 0.3 243 0.5 137 0.3 680 1.4 50,294 100 Full-time 68,053 83.0 2,210 2.7 4,228 5.2 2,965 3.6 1,460 1.8 730 0.9 728 0.9 263 0.3 122 0.1 1,254 1.5 82,013 100 All 111,896 84.6 3,735 2.8 6,045 4.6 3,907 3.0 2,123 1.6 1,048 0.8 855 0.6 506 0.4 259 0.2 1,934 1.5 132,307 100
ICU Part-time 8,409 87.2 849 8.8 50 0.5 155 1.6 - - - - - - 32 0.3 - - 147 1.5 9,643 100 Full-time 13,904 82.3 475 2.8 1,001 5.9 469 2.8 360 2.1 249 1.5 - - - - 102 0.6 341 2.0 16,901 100 All 22,313 84.1 1,325 5.0 1,051 4.0 623 2.3 360 1.4 249 0.9 - - 32 0.1 102 0.4 488 1.8 26,544 100
PCC Part-time 19,293 91.1 268 1.3 320 1.5 321 1.5 344 1.6 62 0.3 98 0.5 37 0.2 63 0.3 369 1.7 21,175 100 Full-time 39,745 80.4 614 1.2 1,119 2.3 851 1.7 1,116 2.3 776 1.6 380 0.8 170 0.3 1,666 3.4 2,990 6.0 49,426 100 All 59,038 83.6 881 1.2 1,439 2.0 1,171 1.7 1,460 2.1 838 1.2 478 0.7 208 0.3 1,729 2.4 3,359 4.8 70,600 100
ALL Part-time 585,895 88.8 15,159 2.3 13,384 2.0 10,395 1.6 10,712 1.6 5,386 0.8 4,159 0.6 2,100 0.3 3,776 0.6 9,064 1.4 660,030 100 Full-time 257,774 83.7 9,321 3.0 12,872 4.2 7,010 2.3 6,493 2.1 2,331 0.8 1,753 0.6 993 0.3 2,374 0.8 7,113 2.3 308,033 100 All 843,669 87.2 24,481 2.5 26,256 2.7 17,405 1.8 17,205 1.8 7,717 0.8 5,911 0.6 3,093 0.3 6,150 0.6 16,177 1.7 968,063 100
ALL UNDERGRADUATESPart-time 981,887 89.2 24,844 2.3 23,307 2.1 18,273 1.7 15,433 1.4 8,784 0.8 6,886 0.6 3,069 0.3 5,362 0.5 12,778 1.2 1,100,622 100 Full-time 820,894 85.8 30,845 3.2 37,809 4.0 19,943 2.1 17,786 1.9 7,551 0.8 4,245 0.4 2,520 0.3 3,473 0.4 12,042 1.3 957,109 100 All 1,802,781 87.6 55,689 2.7 61,116 3.0 38,216 1.9 33,218 1.6 16,335 0.8 11,131 0.5 5,589 0.3 8,835 0.4 24,819 1.2 2,057,730 100
Source: California Student Aid Commission 82 2003-04 SEARS
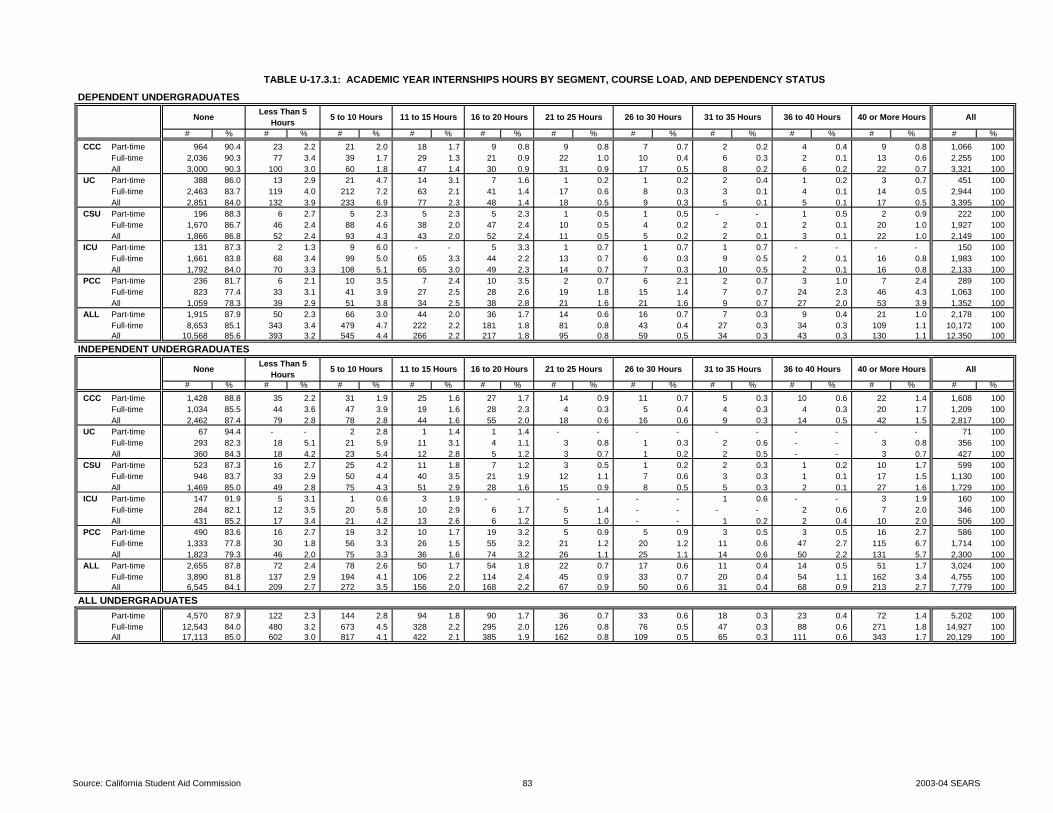
TABLE U-17.3.1: ACADEMIC YEAR INTERNSHIPS HOURS BY SEGMENT, COURSE LOAD, AND DEPENDENCY STATUS
DEPENDENT UNDERGRADUATES
None Less Than 5 Hours 5 to 10 Hours 11 to 15 Hours 16 to 20 Hours 21 to 25 Hours 26 to 30 Hours 31 to 35 Hours 36 to 40 Hours 40 or More Hours All
# % # % # % # % # % # % # % # % # % # % # %CCC Part-time 964 90.4 23 2.2 21 2.0 18 1.7 9 0.8 9 0.8 7 0.7 2 0.2 4 0.4 9 0.8 1,066 100
Full-time 2,036 90.3 77 3.4 39 1.7 29 1.3 21 0.9 22 1.0 10 0.4 6 0.3 2 0.1 13 0.6 2,255 100 All 3,000 90.3 100 3.0 60 1.8 47 1.4 30 0.9 31 0.9 17 0.5 8 0.2 6 0.2 22 0.7 3,321 100
UC Part-time 388 86.0 13 2.9 21 4.7 14 3.1 7 1.6 1 0.2 1 0.2 2 0.4 1 0.2 3 0.7 451 100 Full-time 2,463 83.7 119 4.0 212 7.2 63 2.1 41 1.4 17 0.6 8 0.3 3 0.1 4 0.1 14 0.5 2,944 100 All 2,851 84.0 132 3.9 233 6.9 77 2.3 48 1.4 18 0.5 9 0.3 5 0.1 5 0.1 17 0.5 3,395 100
CSU Part-time 196 88.3 6 2.7 5 2.3 5 2.3 5 2.3 1 0.5 1 0.5 - - 1 0.5 2 0.9 222 100 Full-time 1,670 86.7 46 2.4 88 4.6 38 2.0 47 2.4 10 0.5 4 0.2 2 0.1 2 0.1 20 1.0 1,927 100 All 1,866 86.8 52 2.4 93 4.3 43 2.0 52 2.4 11 0.5 5 0.2 2 0.1 3 0.1 22 1.0 2,149 100
ICU Part-time 131 87.3 2 1.3 9 6.0 - - 5 3.3 1 0.7 1 0.7 1 0.7 - - - - 150 100 Full-time 1,661 83.8 68 3.4 99 5.0 65 3.3 44 2.2 13 0.7 6 0.3 9 0.5 2 0.1 16 0.8 1,983 100 All 1,792 84.0 70 3.3 108 5.1 65 3.0 49 2.3 14 0.7 7 0.3 10 0.5 2 0.1 16 0.8 2,133 100
PCC Part-time 236 81.7 6 2.1 10 3.5 7 2.4 10 3.5 2 0.7 6 2.1 2 0.7 3 1.0 7 2.4 289 100 Full-time 823 77.4 33 3.1 41 3.9 27 2.5 28 2.6 19 1.8 15 1.4 7 0.7 24 2.3 46 4.3 1,063 100 All 1,059 78.3 39 2.9 51 3.8 34 2.5 38 2.8 21 1.6 21 1.6 9 0.7 27 2.0 53 3.9 1,352 100
ALL Part-time 1,915 87.9 50 2.3 66 3.0 44 2.0 36 1.7 14 0.6 16 0.7 7 0.3 9 0.4 21 1.0 2,178 100 Full-time 8,653 85.1 343 3.4 479 4.7 222 2.2 181 1.8 81 0.8 43 0.4 27 0.3 34 0.3 109 1.1 10,172 100 All 10,568 85.6 393 3.2 545 4.4 266 2.2 217 1.8 95 0.8 59 0.5 34 0.3 43 0.3 130 1.1 12,350 100
INDEPENDENT UNDERGRADUATES
None Less Than 5 Hours 5 to 10 Hours 11 to 15 Hours 16 to 20 Hours 21 to 25 Hours 26 to 30 Hours 31 to 35 Hours 36 to 40 Hours 40 or More Hours All
# % # % # % # % # % # % # % # % # % # % # %CCC Part-time 1,428 88.8 35 2.2 31 1.9 25 1.6 27 1.7 14 0.9 11 0.7 5 0.3 10 0.6 22 1.4 1,608 100
Full-time 1,034 85.5 44 3.6 47 3.9 19 1.6 28 2.3 4 0.3 5 0.4 4 0.3 4 0.3 20 1.7 1,209 100 All 2,462 87.4 79 2.8 78 2.8 44 1.6 55 2.0 18 0.6 16 0.6 9 0.3 14 0.5 42 1.5 2,817 100
UC Part-time 67 94.4 - - 2 2.8 1 1.4 1 1.4 - - - - - - - - - - 71 100 Full-time 293 82.3 18 5.1 21 5.9 11 3.1 4 1.1 3 0.8 1 0.3 2 0.6 - - 3 0.8 356 100 All 360 84.3 18 4.2 23 5.4 12 2.8 5 1.2 3 0.7 1 0.2 2 0.5 - - 3 0.7 427 100
CSU Part-time 523 87.3 16 2.7 25 4.2 11 1.8 7 1.2 3 0.5 1 0.2 2 0.3 1 0.2 10 1.7 599 100 Full-time 946 83.7 33 2.9 50 4.4 40 3.5 21 1.9 12 1.1 7 0.6 3 0.3 1 0.1 17 1.5 1,130 100 All 1,469 85.0 49 2.8 75 4.3 51 2.9 28 1.6 15 0.9 8 0.5 5 0.3 2 0.1 27 1.6 1,729 100
ICU Part-time 147 91.9 5 3.1 1 0.6 3 1.9 - - - - - - 1 0.6 - - 3 1.9 160 100 Full-time 284 82.1 12 3.5 20 5.8 10 2.9 6 1.7 5 1.4 - - - - 2 0.6 7 2.0 346 100 All 431 85.2 17 3.4 21 4.2 13 2.6 6 1.2 5 1.0 - - 1 0.2 2 0.4 10 2.0 506 100
PCC Part-time 490 83.6 16 2.7 19 3.2 10 1.7 19 3.2 5 0.9 5 0.9 3 0.5 3 0.5 16 2.7 586 100 Full-time 1,333 77.8 30 1.8 56 3.3 26 1.5 55 3.2 21 1.2 20 1.2 11 0.6 47 2.7 115 6.7 1,714 100 All 1,823 79.3 46 2.0 75 3.3 36 1.6 74 3.2 26 1.1 25 1.1 14 0.6 50 2.2 131 5.7 2,300 100
ALL Part-time 2,655 87.8 72 2.4 78 2.6 50 1.7 54 1.8 22 0.7 17 0.6 11 0.4 14 0.5 51 1.7 3,024 100 Full-time 3,890 81.8 137 2.9 194 4.1 106 2.2 114 2.4 45 0.9 33 0.7 20 0.4 54 1.1 162 3.4 4,755 100 All 6,545 84.1 209 2.7 272 3.5 156 2.0 168 2.2 67 0.9 50 0.6 31 0.4 68 0.9 213 2.7 7,779 100
ALL UNDERGRADUATESPart-time 4,570 87.9 122 2.3 144 2.8 94 1.8 90 1.7 36 0.7 33 0.6 18 0.3 23 0.4 72 1.4 5,202 100 Full-time 12,543 84.0 480 3.2 673 4.5 328 2.2 295 2.0 126 0.8 76 0.5 47 0.3 88 0.6 271 1.8 14,927 100 All 17,113 85.0 602 3.0 817 4.1 422 2.1 385 1.9 162 0.8 109 0.5 65 0.3 111 0.6 343 1.7 20,129 100
Source: California Student Aid Commission 83 2003-04 SEARS

DEPENDENT UNDERGRADUATES INDEPENDENT UNDERGRADUATES ALL UNDERGRADUATES
CCC Part-time 102 16 13 CCC Part-time 180 18 16 CCC Part-time 282 18 15 Full-time 219 13 9 Full-time 175 15 16 Full-time 394 14 9 All 321 14 12 All 355 17 15 All 676 16 13
UC Part-time 63 13 10 UC Part-time 4 12 9 UC Part-time 67 13 10 Full-time 481 11 8 Full-time 63 12 8 Full-time 544 11 8 All 544 11 8 All 67 12 8 All 611 11 8
CSU Part-time 26 15 12 CSU Part-time 76 15 10 CSU Part-time 102 15 10 Full-time 257 14 10 Full-time 184 15 12 Full-time 441 14 11
All 283 14 10 All 260 15 12 All 543 14 11 ICU Part-time 19 13 9 ICU Part-time 13 17 3 ICU Part-time 32 15 6 Full-time 322 13 12 Full-time 62 15 11 Full-time 384 13 12
All 341 13 11 All 75 15 9 All 416 13 10 PCC Part-time 53 20 19 PCC Part-time 96 19 16 PCC Part-time 149 19 10 Full-time 240 22 19 Full-time 381 26 31 Full-time 621 24 18
All 293 22 19 All 477 25 26 All 770 23 25 ALL Part-time 263 16 13 ALL Part-time 369 18 15 ALL Part-time 632 17 23
Full-time 1,519 14 9 Full-time 865 20 13 Full-time 2,384 16 14 All 1,782 14 10 All 1,234 19 14 All 3,016 16 10
Note: "None" category was excluded from the means and median calculations.
TABLE M-17.3.1: MEAN AND MEDIAN ACADEMIC YEAR INTERNSHIPS HOURS BY SEGMENT, COURSE LOAD, AND DEPENDENCY STATUS
Number Mean Median Number MedianMean Median Number Mean
Source: California Student Aid Commission 84 2003-04 SEARS

TABLE W-17.4: ACADEMIC YEAR WORK AND VOLUNTEER PATTERN BY SEGMENT, COURSE LOAD, AND DEPENDENCY STATUS
DEPENDENT UNDERGRADUATES INDEPENDENT UNDERGRADUATESWill Not Work or
Volunteer During the Academic Year
Students Who Work and Volunteer
Will Not Work or Volunteer During the
Academic Year
Students Who Work and Volunteer
# # # #CCC Part-time 62,583 75,457 CCC Part-time 98,702 125,166
Full-time 52,402 67,978 Full-time 43,347 33,566 All 114,985 143,435 All 142,049 158,732
UC Part-time 10,697 4,452 UC Part-time 1,223 800 Full-time 46,043 15,042 Full-time 5,114 2,543 All 56,740 19,494 All 6,337 3,343
CSU Part-time 1,890 5,810 CSU Part-time 5,556 14,937 Full-time 24,629 46,923 Full-time 16,944 24,434 All 26,519 52,733 All 22,500 39,371
ICU Part-time 1,274 873 ICU Part-time 707 3,409 Full-time 12,902 37,347 Full-time 2,320 6,102 All 14,176 38,220 All 3,027 9,511
PCC Part-time 918 1,315 PCC Part-time 2,655 4,602 Full-time 5,155 4,946 Full-time 9,432 9,847 All 6,072 6,261 All 12,087 14,449
ALL Part-time 77,361 87,908 ALL Part-time 108,844 148,914 Full-time 141,131 172,236 Full-time 77,157 76,491 All 218,492 260,144 All 186,000 225,405
ALL UNDERGRADUATESPart-time 186,205 236,822 Full-time 218,287 248,727 All 404,492 485,549
Source: California Student Aid Commission 85 2003-04 SEARS

TABLE U-17.4: ACADEMIC YEAR WORK AND VOLUNTEER PATTERN BY SEGMENT, COURSE LOAD, AND DEPENDENCY STATUS
DEPENDENT UNDERGRADUATES INDEPENDENT UNDERGRADUATESWill Not Work or
Volunteer During the Academic Year
Students Who Work and Volunteer
Will Not Work or Volunteer During the
Academic Year
Students Who Work and Volunteer
# # # #CCC Part-time 175 211 CCC Part-time 276 350
Full-time 434 563 Full-time 359 278 All 609 774 All 635 628
UC Part-time 175 71 UC Part-time 21 14 Full-time 1,206 406 Full-time 134 66 All 1,381 477 All 155 80
CSU Part-time 25 54 CSU Part-time 64 180 Full-time 303 635 Full-time 211 351 All 328 689 All 275 531
ICU Part-time 35 29 ICU Part-time 13 49 Full-time 306 822 Full-time 51 124 All 341 851 All 64 173
PCC Part-time 52 61 PCC Part-time 104 127 Full-time 233 246 Full-time 438 329 All 285 307 All 542 456
ALL Part-time 462 426 ALL Part-time 478 720 Full-time 2,482 2,672 Full-time 1,193 1,148 All 2,944 3,098 All 1,671 1,868
ALL UNDERGRADUATESPart-time 940 1,146 Full-time 3,675 3,820 All 4,615 4,966
Source: California Student Aid Commission 86 2003-04 SEARS
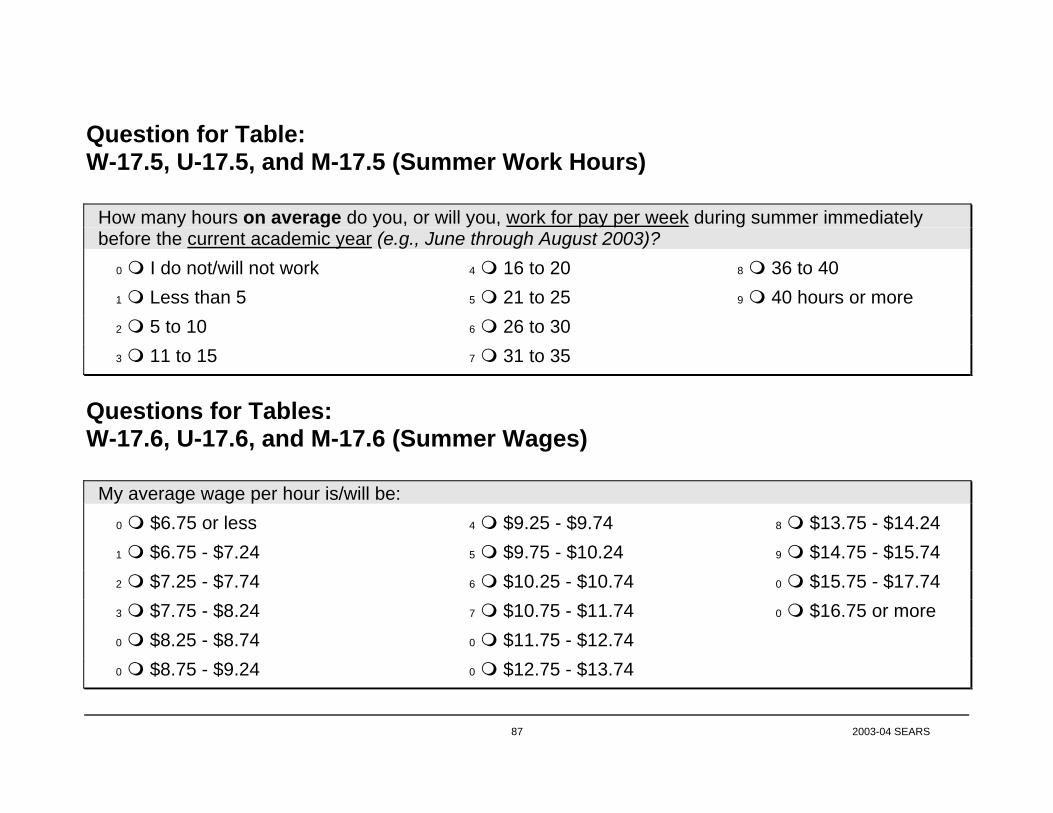
Question for Table: W-17.5, U-17.5, and M-17.5 (Summer Work Hours)
How many hours on average do you, or will you, work for pay per week during summer immediately
before the current academic year (e.g., June through August 2003)? 0 I do not/will not work 4 16 to 20 8 36 to 40 1 Less than 5 5 21 to 25 9 40 hours or more 2 5 to 10 6 26 to 30 3 11 to 15 7 31 to 35
Questions for Tables: W-17.6, U-17.6, and M-17.6 (Summer Wages)
My average wage per hour is/will be: 0 $6.75 or less 4 $9.25 - $9.74 8 $13.75 - $14.24 1 $6.75 - $7.24 5 $9.75 - $10.24 9 $14.75 - $15.74 2 $7.25 - $7.74 6 $10.25 - $10.74 0 $15.75 - $17.74 3 $7.75 - $8.24 7 $10.75 - $11.74 0 $16.75 or more 0 $8.25 - $8.74 0 $11.75 - $12.74 0 $8.75 - $9.24 0 $12.75 - $13.74
87 2003-04 SEARS

TABLE W-17.5: SUMMER WORK HOURS BY SEGMENT, COURSE LOAD, AND DEPENDENCY STATUS
DEPENDENT UNDERGRADUATES
None Less Than 5 Hours 5 to 10 Hours 11 to 15 Hours 16 to 20 Hours 21 to 25 Hours 26 to 30 Hours 31 to 35 Hours 36 to 40 Hours 40 or More Hours All
# % # % # % # % # % # % # % # % # % # % # %CCC Part-time 113,364 29.4 4,649 1.2 7,152 1.9 9,298 2.4 37,192 9.6 32,901 8.5 35,404 9.2 31,113 8.1 52,212 13.5 62,940 16.3 386,225 100
Full-time 82,346 29.9 3,864 1.4 8,694 3.2 13,282 4.8 23,303 8.5 28,254 10.3 25,597 9.3 20,405 7.4 29,703 10.8 40,087 14.5 275,534 100 All 195,710 29.6 8,513 1.3 15,846 2.4 22,580 3.4 60,495 9.1 61,155 9.2 61,001 9.2 51,518 7.8 81,915 12.4 103,027 15.6 661,760 100
UC Part-time 14,919 52.9 301 1.1 1,172 4.2 1,233 4.4 2,180 7.7 1,951 6.9 1,278 4.5 1,023 3.6 1,014 3.6 3,159 11.2 28,229 100 Full-time 50,743 44.8 2,866 2.5 5,583 4.9 5,507 4.9 9,556 8.4 7,104 6.3 6,392 5.6 5,740 5.1 4,692 4.1 15,063 13.3 113,248 100 All 65,662 46.4 3,167 2.2 6,756 4.8 6,740 4.8 11,736 8.3 9,055 6.4 7,670 5.4 6,763 4.8 5,706 4.0 18,222 12.9 141,476 100
CSU Part-time 3,270 16.0 301 1.5 1,413 6.9 994 4.9 1,720 8.4 2,484 12.2 2,033 9.9 2,269 11.1 1,093 5.3 4,861 23.8 20,438 100 Full-time 36,258 23.3 3,144 2.0 5,280 3.4 9,090 5.8 14,967 9.6 15,089 9.7 17,287 11.1 15,214 9.8 11,800 7.6 27,691 17.8 155,821 100 All 39,528 22.4 3,445 2.0 6,693 3.8 10,084 5.7 16,687 9.5 17,573 10.0 19,320 11.0 17,483 9.9 12,893 7.3 32,552 18.5 176,259 100
ICU Part-time 1,636 31.1 54 1.0 149 2.8 149 2.8 468 8.9 420 8.0 361 6.9 541 10.3 146 2.8 1,329 25.3 5,254 100 Full-time 20,761 22.9 3,239 3.6 5,880 6.5 4,490 4.9 8,908 9.8 7,571 8.3 6,094 6.7 6,655 7.3 6,689 7.4 20,420 22.5 90,705 100 All 22,397 23.3 3,293 3.4 6,028 6.3 4,639 4.8 9,376 9.8 7,991 8.3 6,455 6.7 7,196 7.5 6,835 7.1 21,749 22.7 95,959 100
PCC Part-time 1,426 22.0 57 0.9 267 4.1 139 2.1 1,070 16.5 828 12.8 535 8.3 380 5.9 651 10.1 1,127 17.4 6,481 100 Full-time 8,202 34.8 197 0.8 749 3.2 1,258 5.3 2,199 9.3 2,189 9.3 1,622 6.9 1,118 4.7 2,852 12.1 3,190 13.5 23,575 100 All 9,628 32.0 254 0.8 1,016 3.4 1,397 4.6 3,270 10.9 3,017 10.0 2,157 7.2 1,498 5.0 3,503 11.7 4,317 14.4 30,056 100
ALL Part-time 134,616 30.1 5,362 1.2 10,153 2.3 11,813 2.6 42,630 9.5 38,584 8.6 39,611 8.9 35,326 7.9 55,117 12.3 73,415 16.4 446,627 100 Full-time 198,310 30.1 13,310 2.0 26,186 4.0 33,626 5.1 58,933 8.9 60,207 9.1 56,992 8.6 49,132 7.5 55,736 8.5 106,451 16.2 658,883 100 All 332,925 30.1 18,672 1.7 36,339 3.3 45,439 4.1 101,564 9.2 98,791 8.9 96,603 8.7 84,458 7.6 110,852 10.0 179,866 16.3 1,105,510 100
INDEPENDENT UNDERGRADUATES
None Less Than 5 Hours 5 to 10 Hours 11 to 15 Hours 16 to 20 Hours 21 to 25 Hours 26 to 30 Hours 31 to 35 Hours 36 to 40 Hours 40 or More Hours All
# % # % # % # % # % # % # % # % # % # % # %CCC Part-time 160,927 27.5 6,437 1.1 11,444 2.0 10,013 1.7 32,185 5.5 28,252 4.8 31,828 5.4 25,033 4.3 67,232 11.5 212,424 36.3 585,775 100
Full-time 61,699 41.0 2,294 1.5 3,502 2.3 3,260 2.2 12,195 8.1 9,297 6.2 9,176 6.1 7,365 4.9 13,040 8.7 28,495 19.0 150,324 100 All 222,626 30.2 8,731 1.2 14,946 2.0 13,273 1.8 44,380 6.0 37,549 5.1 41,004 5.6 32,398 4.4 80,272 10.9 240,919 32.7 736,099 100
UC Part-time 1,639 42.9 - - 281 7.4 119 3.1 460 12.0 268 7.0 119 3.1 125 3.3 141 3.7 670 17.5 3,820 100 Full-time 5,793 41.9 513 3.7 755 5.5 611 4.4 1,019 7.4 764 5.5 695 5.0 955 6.9 619 4.5 2,097 15.2 13,820 100 All 7,432 42.1 513 2.9 1,036 5.9 730 4.1 1,479 8.4 1,032 5.9 813 4.6 1,080 6.1 759 4.3 2,767 15.7 17,641 100
CSU Part-time 10,017 19.7 434 0.9 1,168 2.3 1,884 3.7 3,195 6.3 1,980 3.9 2,811 5.5 3,579 7.1 2,189 4.3 23,465 46.3 50,721 100 Full-time 24,932 29.9 1,516 1.8 1,514 1.8 3,984 4.8 5,682 6.8 6,592 7.9 5,933 7.1 5,305 6.4 6,385 7.7 21,527 25.8 83,369 100 All 34,949 26.1 1,950 1.5 2,682 2.0 5,869 4.4 8,877 6.6 8,572 6.4 8,743 6.5 8,883 6.6 8,573 6.4 44,992 33.6 134,090 100
ICU Part-time 1,050 10.5 101 1.0 68 0.7 175 1.8 641 6.4 305 3.1 542 5.4 997 10.0 823 8.3 5,254 52.8 9,955 100 Full-time 3,414 19.6 401 2.3 391 2.2 427 2.5 1,504 8.7 827 4.8 1,339 7.7 1,002 5.8 605 3.5 7,476 43.0 17,385 100 All 4,463 16.3 502 1.8 459 1.7 601 2.2 2,146 7.8 1,132 4.1 1,881 6.9 1,999 7.3 1,428 5.2 12,729 46.6 27,340 100
PCC Part-time 5,043 23.1 30 0.1 699 3.2 290 1.3 578 2.7 628 2.9 544 2.5 576 2.6 2,551 11.7 10,854 49.8 21,793 100 Full-time 14,720 28.8 477 0.9 857 1.7 726 1.4 2,505 4.9 2,185 4.3 2,555 5.0 2,086 4.1 4,799 9.4 20,212 39.5 51,122 100 All 19,763 27.1 507 0.7 1,557 2.1 1,016 1.4 3,082 4.2 2,814 3.9 3,098 4.2 2,662 3.7 7,350 10.1 31,066 42.6 72,914 100
ALL Part-time 178,675 26.6 7,001 1.0 13,661 2.0 12,481 1.9 37,059 5.5 31,433 4.7 35,843 5.3 30,309 4.5 72,935 10.9 252,666 37.6 672,064 100 Full-time 110,557 35.0 5,201 1.6 7,018 2.2 9,008 2.9 22,905 7.2 19,666 6.2 19,697 6.2 16,713 5.3 25,447 8.1 79,807 25.3 316,020 100 All 289,233 29.3 12,202 1.2 20,679 2.1 21,489 2.2 59,964 6.1 51,099 5.2 55,540 5.6 47,023 4.8 98,382 10.0 332,473 33.6 988,084 100
ALL UNDERGRADUATESPart-time 313,291 28.0 12,363 1.1 23,814 2.1 24,294 2.2 79,689 7.1 70,018 6.3 75,454 6.7 65,635 5.9 128,052 11.4 326,081 29.1 1,118,691 100 Full-time 308,867 31.7 18,511 1.9 33,204 3.4 42,635 4.4 81,838 8.4 79,873 8.2 76,689 7.9 65,846 6.8 81,182 8.3 186,258 19.1 974,903 100 All 622,158 29.7 30,874 1.5 57,018 2.7 66,928 3.2 161,528 7.7 149,890 7.2 152,143 7.3 131,480 6.3 209,234 10.0 512,340 24.5 2,093,594 100
Source: California Student Aid Commission 88 2003-04 SEARS

TABLE U-17.5: SUMMER WORK HOURS BY SEGMENT, COURSE LOAD, AND DEPENDENCY STATUS
DEPENDENT UNDERGRADUATES
None Less Than 5 Hours 5 to 10 Hours 11 to 15 Hours 16 to 20 Hours 21 to 25 Hours 26 to 30 Hours 31 to 35 Hours 36 to 40 Hours 40 or More Hours All
# % # % # % # % # % # % # % # % # % # % # %CCC Part-time 317 29.4 13 1.2 20 1.9 26 2.4 104 9.6 92 8.5 99 9.2 87 8.1 146 13.5 176 16.3 1,080 100
Full-time 682 29.9 32 1.4 72 3.2 110 4.8 193 8.5 234 10.3 212 9.3 169 7.4 246 10.8 332 14.5 2,282 100 All 999 29.7 45 1.3 92 2.7 136 4.0 297 8.8 326 9.7 311 9.3 256 7.6 392 11.7 508 15.1 3,362 100
UC Part-time 243 53.1 6 1.3 19 4.1 20 4.4 34 7.4 31 6.8 20 4.4 15 3.3 16 3.5 54 11.8 458 100 Full-time 1,338 44.8 79 2.6 149 5.0 145 4.9 255 8.5 190 6.4 169 5.7 150 5.0 122 4.1 389 13.0 2,986 100 All 1,581 45.9 85 2.5 168 4.9 165 4.8 289 8.4 221 6.4 189 5.5 165 4.8 138 4.0 443 12.9 3,444 100
CSU Part-time 39 17.4 3 1.3 15 6.7 10 4.5 18 8.0 27 12.1 24 10.7 23 10.3 11 4.9 54 24.1 224 100 Full-time 447 22.8 43 2.2 77 3.9 106 5.4 197 10.1 173 8.8 199 10.2 180 9.2 148 7.6 387 19.8 1,957 100 All 486 22.3 46 2.1 92 4.2 116 5.3 215 9.9 200 9.2 223 10.2 203 9.3 159 7.3 441 20.2 2,181 100
ICU Part-time 43 27.9 4 2.6 5 3.2 7 4.5 14 9.1 14 9.1 12 7.8 13 8.4 6 3.9 36 23.4 154 100 Full-time 468 23.1 63 3.1 124 6.1 103 5.1 197 9.7 165 8.1 135 6.7 155 7.6 158 7.8 459 22.6 2,027 100 All 511 23.4 67 3.1 129 5.9 110 5.0 211 9.7 179 8.2 147 6.7 168 7.7 164 7.5 495 22.7 2,181 100
PCC Part-time 81 27.4 3 1.0 12 4.1 10 3.4 39 13.2 24 8.1 33 11.1 18 6.1 28 9.5 48 16.2 296 100 Full-time 345 31.6 9 0.8 29 2.7 53 4.9 106 9.7 101 9.3 97 8.9 63 5.8 127 11.6 161 14.8 1,091 100 All 426 30.7 12 0.9 41 3.0 63 4.5 145 10.5 125 9.0 130 9.4 81 5.8 155 11.2 209 15.1 1,387 100
ALL Part-time 723 32.7 29 1.3 71 3.2 73 3.3 209 9.4 188 8.5 188 8.5 156 7.1 207 9.4 368 16.6 2,212 100 Full-time 3,280 31.7 226 2.2 451 4.4 517 5.0 948 9.2 863 8.3 812 7.9 717 6.9 801 7.7 1,728 16.7 10,343 100 All 4,003 31.9 255 2.0 522 4.2 590 4.7 1,157 9.2 1,051 8.4 1,000 8.0 873 7.0 1,008 8.0 2,096 16.7 12,555 100
INDEPENDENT UNDERGRADUATES
None Less Than 5 Hours 5 to 10 Hours 11 to 15 Hours 16 to 20 Hours 21 to 25 Hours 26 to 30 Hours 31 to 35 Hours 36 to 40 Hours 40 or More Hours All
# % # % # % # % # % # % # % # % # % # % # %CCC Part-time 450 27.5 18 1.1 32 2.0 28 1.7 90 5.5 79 4.8 89 5.4 70 4.3 188 11.5 594 36.3 1,638 100
Full-time 511 41.0 19 1.5 29 2.3 27 2.2 101 8.1 77 6.2 76 6.1 61 4.9 108 8.7 236 19.0 1,245 100 All 961 33.3 37 1.3 61 2.1 55 1.9 191 6.6 156 5.4 165 5.7 131 4.5 296 10.3 830 28.8 2,883 100
UC Part-time 28 40.0 - - 4 5.7 2 2.9 9 12.9 5 7.1 2 2.9 3 4.3 2 2.9 15 21.4 70 100 Full-time 150 41.8 13 3.6 19 5.3 16 4.5 27 7.5 20 5.6 19 5.3 24 6.7 16 4.5 55 15.3 359 100 All 178 41.5 13 3.0 23 5.4 18 4.2 36 8.4 25 5.8 21 4.9 27 6.3 18 4.2 70 16.3 429 100
CSU Part-time 126 20.8 8 1.3 17 2.8 17 2.8 37 6.1 26 4.3 34 5.6 41 6.8 24 4.0 275 45.5 605 100 Full-time 323 28.2 18 1.6 28 2.4 49 4.3 83 7.2 93 8.1 88 7.7 73 6.4 88 7.7 304 26.5 1,147 100 All 449 25.6 26 1.5 45 2.6 66 3.8 120 6.8 119 6.8 122 7.0 114 6.5 112 6.4 579 33.0 1,752 100
ICU Part-time 21 12.8 3 1.8 2 1.2 3 1.8 8 4.9 6 3.7 11 6.7 7 4.3 14 8.5 89 54.3 164 100 Full-time 74 20.7 9 2.5 9 2.5 9 2.5 33 9.2 18 5.0 27 7.6 23 6.4 14 3.9 141 39.5 357 100 All 95 18.2 12 2.3 11 2.1 12 2.3 41 7.9 24 4.6 38 7.3 30 5.8 28 5.4 230 44.1 521 100
PCC Part-time 147 24.5 4 0.7 17 2.8 13 2.2 23 3.8 28 4.7 23 3.8 22 3.7 78 13.0 245 40.8 600 100 Full-time 599 34.0 26 1.5 38 2.2 32 1.8 91 5.2 67 3.8 101 5.7 78 4.4 180 10.2 550 31.2 1,762 100 All 746 31.6 30 1.3 55 2.3 45 1.9 114 4.8 95 4.0 124 5.2 100 4.2 258 10.9 795 33.7 2,362 100
ALL Part-time 772 25.1 33 1.1 72 2.3 63 2.0 167 5.4 144 4.7 159 5.2 143 4.6 306 9.9 1,218 39.6 3,077 100 Full-time 1,657 34.0 85 1.7 123 2.5 133 2.7 335 6.9 275 5.6 311 6.4 259 5.3 406 8.3 1,286 26.4 4,870 100 All 2,429 30.6 118 1.5 195 2.5 196 2.5 502 6.3 419 5.3 470 5.9 402 5.1 712 9.0 2,504 31.5 7,947 100
ALL UNDERGRADUATESPart-time 1,495 28.3 62 1.2 143 2.7 136 2.6 376 7.1 332 6.3 347 6.6 299 5.7 513 9.7 1,586 30.0 5,289 100 Full-time 4,937 32.5 311 2.0 574 3.8 650 4.3 1,283 8.4 1,138 7.5 1,123 7.4 976 6.4 1,207 7.9 3,014 19.8 15,213 100 All 6,432 31.4 373 1.8 717 3.5 786 3.8 1,659 8.1 1,470 7.2 1,470 7.2 1,275 6.2 1,720 8.4 4,600 22.4 20,502 100
Source: California Student Aid Commission 89 2003-04 SEARS

DEPENDENT UNDERGRADUATES INDEPENDENT UNDERGRADUATES ALL UNDERGRADUATES
CCC Part-time 763 31 33 CCC Part-time 1,188 35 40 CCC Part-time 1,951 33 38 Full-time 1,600 29 30 Full-time 734 31 34 Full-time 2,334 30 31 All 2,363 30 31 All 1,922 33 40 All 4,285 31 36
UC Part-time 215 27 26 UC Part-time 42 29 25 UC Part-time 257 27 25 Full-time 1,648 26 26 Full-time 209 27 29 Full-time 1,857 27 27 All 1,863 27 26 All 251 27 28 All 2,114 27 26
CSU Part-time 185 29 30 CSU Part-time 479 35 41 CSU Part-time 664 33 40 Full-time 1,510 29 30 Full-time 824 31 35 Full-time 2,334 30 31
All 1,695 29 30 All 1,303 33 38 All 2,998 31 32 ICU Part-time 111 29 33 ICU Part-time 143 37 41 ICU Part-time 254 33 40 Full-time 1,559 29 30 Full-time 283 33 40 Full-time 1,842 29 32
All 1,670 29 30 All 426 34 40 All 2,096 30 33 PCC Part-time 215 29 28 PCC Part-time 453 35 41 PCC Part-time 668 33 40 Full-time 746 29 30 Full-time 1,163 34 40 Full-time 1,909 32 39
All 961 29 29 All 1,616 34 41 All 2,577 32 40 ALL Part-time 1,489 30 32 ALL Part-time 2,305 35 40 ALL Part-time 3,794 33 38
Full-time 7,063 28 29 Full-time 3,213 32 36 Full-time 10,276 30 31 All 8,552 29 30 All 5,518 33 40 All 14,070 30 35
TABLE M-17.5: MEAN AND MEDIAN SUMMER WORK HOURS BY SEGMENT, COURSE LOAD, AND DEPENDENCY STATUS
Number Mean Median Number MedianMean Median Number Mean
Source: California Student Aid Commission 90 2003-04 SEARS

DEPENDENT UNDERGRADUATES
$6.75 to $7.24 $7.25 to $7.74 $7.75 to $8.24 $8.25 to $8.74 $8.75 to $9.24 $9.25 to $9.74 $9.75 to $10.24 $10.25 to $10.74
# % # % # % # % # % # % # % # %CCC Part-time 127,312 39.7 30,397 9.5 30,755 9.6 20,384 6.4 21,099 6.6 10,728 3.3 20,384 6.4 8,225 2.6
Full-time 106,133 46.4 32,600 14.2 21,975 9.6 12,074 5.3 10,746 4.7 4,950 2.2 12,195 5.3 5,433 2.4 All 233,445 42.5 62,997 11.5 52,730 9.6 32,458 5.9 31,845 5.8 15,678 2.9 32,579 5.9 13,659 2.5
UC Part-time 7,399 43.8 2,191 13.0 2,254 13.3 588 3.5 784 4.6 465 2.8 1,240 7.3 167 1.0 Full-time 21,873 30.7 5,326 7.5 7,479 10.5 4,825 6.8 3,785 5.3 2,237 3.1 8,114 11.4 2,479 3.5 All 29,272 33.2 7,517 8.5 9,733 11.0 5,413 6.1 4,568 5.2 2,702 3.1 9,353 10.6 2,646 3.0
CSU Part-time 3,430 18.5 1,474 7.9 1,791 9.6 949 5.1 2,114 11.4 696 3.7 1,803 9.7 710 3.8 Full-time 39,435 29.7 12,870 9.7 13,037 9.8 8,945 6.7 9,491 7.2 4,606 3.5 13,529 10.2 4,066 3.1 All 42,865 28.3 14,344 9.5 14,828 9.8 9,894 6.5 11,605 7.7 5,302 3.5 15,332 10.1 4,776 3.2
ICU Part-time 663 17.2 356 9.2 484 12.6 341 8.9 330 8.6 144 3.8 381 9.9 35 0.9 Full-time 22,358 30.2 7,695 10.4 8,817 11.9 5,048 6.8 5,716 7.7 2,825 3.8 8,009 10.8 2,113 2.9 All 23,020 29.6 8,050 10.3 9,301 11.9 5,389 6.9 6,046 7.8 2,969 3.8 8,390 10.8 2,148 2.8
PCC Part-time 2,114 38.5 653 11.9 815 14.9 229 4.2 394 7.2 249 4.5 193 3.5 136 2.5 Full-time 6,979 37.9 2,210 12.0 1,970 10.7 1,270 6.9 1,238 6.7 775 4.2 1,276 6.9 762 4.1 All 9,093 38.1 2,863 12.0 2,786 11.7 1,499 6.3 1,632 6.8 1,024 4.3 1,469 6.2 897 3.8
ALL Part-time 140,918 38.6 35,071 9.6 36,099 9.9 22,491 6.2 24,720 6.8 12,282 3.4 24,000 6.6 9,273 2.5 Full-time 196,778 37.5 60,701 11.6 53,278 10.1 32,162 6.1 30,976 5.9 15,393 2.9 43,123 8.2 14,853 2.8 All 337,696 37.9 95,772 10.8 89,378 10.0 54,653 6.1 55,696 6.3 27,675 3.1 67,123 7.5 24,126 2.7
$10.75 to $11.74 $11.75 to 12.74 $12.75 to $13.74 $13.75 to $14.74 $14.75 to $15.74 $15.75 to $16.74 More than $16.75 Total
# % # % # % # % # % # % # % # %CCC Part-time 12,874 4.0 11,801 3.7 7,868 2.5 4,291 1.3 3,934 1.2 1,431 0.4 8,940 2.8 320,423 100
Full-time 7,245 3.2 5,675 2.5 2,415 1.1 1,932 0.8 1,932 0.8 483 0.2 3,139 1.4 228,927 100 All 20,119 3.7 17,476 3.2 10,282 1.9 6,223 1.1 5,866 1.1 1,913 0.3 12,080 2.2 549,350 100
UC Part-time 437 2.6 355 2.1 250 1.5 177 1.0 178 1.1 110 0.6 301 1.8 16,895 100 Full-time 3,072 4.3 3,361 4.7 1,988 2.8 1,178 1.7 1,318 1.9 705 1.0 3,490 4.9 71,230 100 All 3,509 4.0 3,716 4.2 2,239 2.5 1,355 1.5 1,495 1.7 814 0.9 3,791 4.3 88,125 100
CSU Part-time 1,051 5.7 587 3.2 1,230 6.6 563 3.0 264 1.4 852 4.6 1,070 5.8 18,584 100 Full-time 5,561 4.2 6,676 5.0 4,490 3.4 2,525 1.9 2,515 1.9 1,299 1.0 3,607 2.7 132,652 100 All 6,612 4.4 7,263 4.8 5,720 3.8 3,088 2.0 2,779 1.8 2,150 1.4 4,677 3.1 151,236 100
ICU Part-time 219 5.7 235 6.1 68 1.8 108 2.8 154 4.0 - - 329 8.6 3,846 100 Full-time 1,917 2.6 3,166 4.3 1,820 2.5 641 0.9 1,117 1.5 391 0.5 2,379 3.2 74,011 100 All 2,137 2.7 3,401 4.4 1,888 2.4 749 1.0 1,271 1.6 391 0.5 2,708 3.5 77,858 100
PCC Part-time 36 0.7 180 3.3 120 2.2 47 0.9 17 0.3 12 0.2 291 5.3 5,486 100 Full-time 394 2.1 540 2.9 366 2.0 191 1.0 94 0.5 24 0.1 311 1.7 18,398 100 All 430 1.8 719 3.0 486 2.0 238 1.0 111 0.5 36 0.2 601 2.5 23,884 100
ALL Part-time 14,618 4.0 13,157 3.6 9,535 2.6 5,187 1.4 4,547 1.2 2,404 0.7 10,931 3.0 365,234 100 Full-time 18,189 3.5 19,418 3.7 11,079 2.1 6,467 1.2 6,975 1.3 2,901 0.6 12,926 2.5 525,218 100 All 32,807 3.7 32,575 3.7 20,615 2.3 11,654 1.3 11,522 1.3 5,305 0.6 23,857 2.7 890,452 100
TABLE W-17.6A: STUDENT SUMMER HOURLY WAGES BY SEGMENT, COURSE LOAD, AND DEPENDENCY STATUS
Source: California Student Aid Commission 91 2003-04 SEARS

INDEPENDENT UNDERGRADUATES
$6.75 to $7.24 $7.25 to $7.74 $7.75 to $8.24 $8.25 to $8.74 $8.75 to $9.24 $9.25 to $9.74 $9.75 to $10.24 $10.25 to $10.74
# % # % # % # % # % # % # % # %CCC Part-time 80,821 16.7 18,238 3.8 21,815 4.5 14,305 3.0 20,384 4.2 11,801 2.4 23,960 4.9 18,596 3.8
Full-time 42,622 37.5 8,694 7.7 8,935 7.9 4,468 3.9 4,709 4.1 4,105 3.6 5,796 5.1 3,019 2.7 All 123,443 20.6 26,932 4.5 30,750 5.1 18,773 3.1 25,093 4.2 15,906 2.7 29,756 5.0 21,615 3.6
UC Part-time 888 33.7 49 1.8 141 5.3 167 6.3 70 2.7 37 1.4 272 10.3 119 4.5 Full-time 2,311 25.3 545 6.0 654 7.2 541 5.9 421 4.6 339 3.7 983 10.8 227 2.5 All 3,199 27.2 593 5.0 794 6.8 708 6.0 492 4.2 376 3.2 1,255 10.7 346 2.9
CSU Part-time 4,371 10.0 1,241 2.8 649 1.5 781 1.8 1,193 2.7 917 2.1 3,513 8.0 1,478 3.4 Full-time 11,703 18.1 2,523 3.9 3,362 5.2 2,676 4.1 3,565 5.5 2,022 3.1 6,481 10.0 3,823 5.9 All 16,074 14.8 3,764 3.5 4,010 3.7 3,457 3.2 4,758 4.4 2,939 2.7 9,994 9.2 5,301 4.9
ICU Part-time 766 8.4 114 1.3 119 1.3 194 2.1 - - - - 450 4.9 286 3.1 Full-time 2,150 15.3 864 6.1 716 5.1 681 4.8 661 4.7 414 2.9 1,368 9.7 294 2.1 All 2,915 12.6 979 4.2 835 3.6 875 3.8 661 2.9 414 1.8 1,818 7.8 580 2.5
PCC Part-time 3,431 18.4 499 2.7 251 1.3 532 2.9 353 1.9 307 1.6 559 3.0 467 2.5 Full-time 7,081 17.3 1,159 2.8 1,731 4.2 1,534 3.7 2,163 5.3 801 2.0 2,338 5.7 1,058 2.6 All 10,512 17.6 1,658 2.8 1,982 3.3 2,066 3.5 2,516 4.2 1,109 1.9 2,897 4.9 1,525 2.6
ALL Part-time 90,277 16.2 20,142 3.6 22,974 4.1 15,979 2.9 22,000 3.9 13,062 2.3 28,754 5.1 20,946 3.8 Full-time 65,866 27.2 13,785 5.7 15,397 6.3 9,898 4.1 11,519 4.7 7,681 3.2 16,965 7.0 8,421 3.5 All 156,143 19.5 33,927 4.2 38,372 4.8 25,878 3.2 33,519 4.2 20,744 2.6 45,719 5.7 29,367 3.7
$10.75 to $11.74 $11.75 to 12.74 $12.75 to $13.74 $13.75 to $14.74 $14.75 to $15.74 $15.75 to $16.74 More than $16.75 Total
# % # % # % # % # % # % # % # %CCC Part-time 23,960 4.9 27,894 5.8 21,099 4.4 23,960 4.9 21,099 4.4 16,808 3.5 139,470 28.8 484,210 100
Full-time 4,105 3.6 4,105 3.6 3,743 3.3 2,777 2.4 2,777 2.4 2,898 2.6 10,867 9.6 113,619 100 All 28,065 4.7 31,999 5.4 24,842 4.2 26,737 4.5 23,876 4.0 19,706 3.3 150,337 25.1 597,829 100
UC Part-time 70 2.7 179 6.8 - - 77 2.9 151 5.7 70 2.7 350 13.3 2,639 100 Full-time 445 4.9 371 4.1 457 5.0 354 3.9 424 4.6 228 2.5 829 9.1 9,127 100 All 515 4.4 549 4.7 457 3.9 431 3.7 574 4.9 298 2.5 1,179 10.0 11,766 100
CSU Part-time 2,761 6.3 2,688 6.1 2,280 5.2 1,661 3.8 1,930 4.4 1,802 4.1 16,532 37.7 43,796 100 Full-time 4,492 6.9 4,467 6.9 3,598 5.6 2,255 3.5 2,936 4.5 1,959 3.0 8,885 13.7 64,746 100 All 7,253 6.7 7,155 6.6 5,878 5.4 3,915 3.6 4,866 4.5 3,761 3.5 25,417 23.4 108,542 100
ICU Part-time 339 3.7 585 6.4 490 5.4 760 8.3 560 6.2 543 6.0 3,897 42.8 9,102 100 Full-time 646 4.6 734 5.2 828 5.9 350 2.5 600 4.3 550 3.9 3,203 22.8 14,058 100 All 985 4.3 1,318 5.7 1,318 5.7 1,110 4.8 1,160 5.0 1,093 4.7 7,099 30.7 23,160 100
PCC Part-time 955 5.1 1,113 6.0 1,113 6.0 1,064 5.7 683 3.7 698 3.7 6,597 35.4 18,623 100 Full-time 1,696 4.1 2,492 6.1 2,867 7.0 1,769 4.3 1,312 3.2 1,149 2.8 11,866 28.9 41,015 100 All 2,651 4.4 3,606 6.0 3,980 6.7 2,833 4.8 1,995 3.3 1,846 3.1 18,463 31.0 59,638 100
ALL Part-time 28,085 5.0 32,458 5.8 24,982 4.5 27,521 4.9 24,422 4.4 19,920 3.6 166,846 29.9 558,369 100 Full-time 11,384 4.7 12,168 5.0 11,493 4.7 7,505 3.1 8,049 3.3 6,783 2.8 35,650 14.7 242,565 100 All 39,469 4.9 44,627 5.6 36,475 4.6 35,026 4.4 32,471 4.1 26,704 3.3 202,496 25.3 800,935 100
TABLE W-17.6B: STUDENT SUMMER HOURLY WAGES BY SEGMENT, COURSE LOAD, AND DEPENDENCY STATUS
Source: California Student Aid Commission 92 2003-04 SEARS

ALL UNDERGRADUATES
$6.75 to $7.24 $7.25 to $7.74 $7.75 to $8.24 $8.25 to $8.74 $8.75 to $9.24 $9.25 to $9.74 $9.75 to $10.24 $10.25 to $10.74
# % # % # % # % # % # % # % # %Part-time 231,194 25.0 55,212 6.0 59,074 6.4 38,470 4.2 46,720 5.1 25,345 2.7 52,754 5.7 30,220 3.3 Full-time 262,644 34.2 74,486 9.7 68,676 8.9 42,060 5.5 42,495 5.5 23,074 3.0 60,088 7.8 23,274 3.0 All 493,838 29.2 129,698 7.7 127,749 7.6 80,530 4.8 89,215 5.3 48,419 2.9 112,842 6.7 53,493 3.2
$10.75 to $11.74 $11.75 to 12.74 $12.75 to $13.74 $13.75 to $14.74 $14.75 to $15.74 $15.75 to $16.74 More than $16.75 Total
# % # % # % # % # % # % # % # %Part-time 42,703 4.6 45,616 4.9 34,517 3.7 32,707 3.5 28,969 3.1 22,325 2.4 177,777 19.2 923,603 100 Full-time 29,573 3.9 31,586 4.1 22,573 2.9 13,973 1.8 15,024 2.0 9,684 1.3 48,575 6.3 767,783 100 All 72,276 4.3 77,201 4.6 57,090 3.4 46,680 2.8 43,993 2.6 32,009 1.9 226,352 13.4 1,691,386 100
TABLE W-17.6C: STUDENT SUMMER HOURLY WAGES BY SEGMENT, COURSE LOAD, AND DEPENDENCY STATUS
Source: California Student Aid Commission 93 2003-04 SEARS
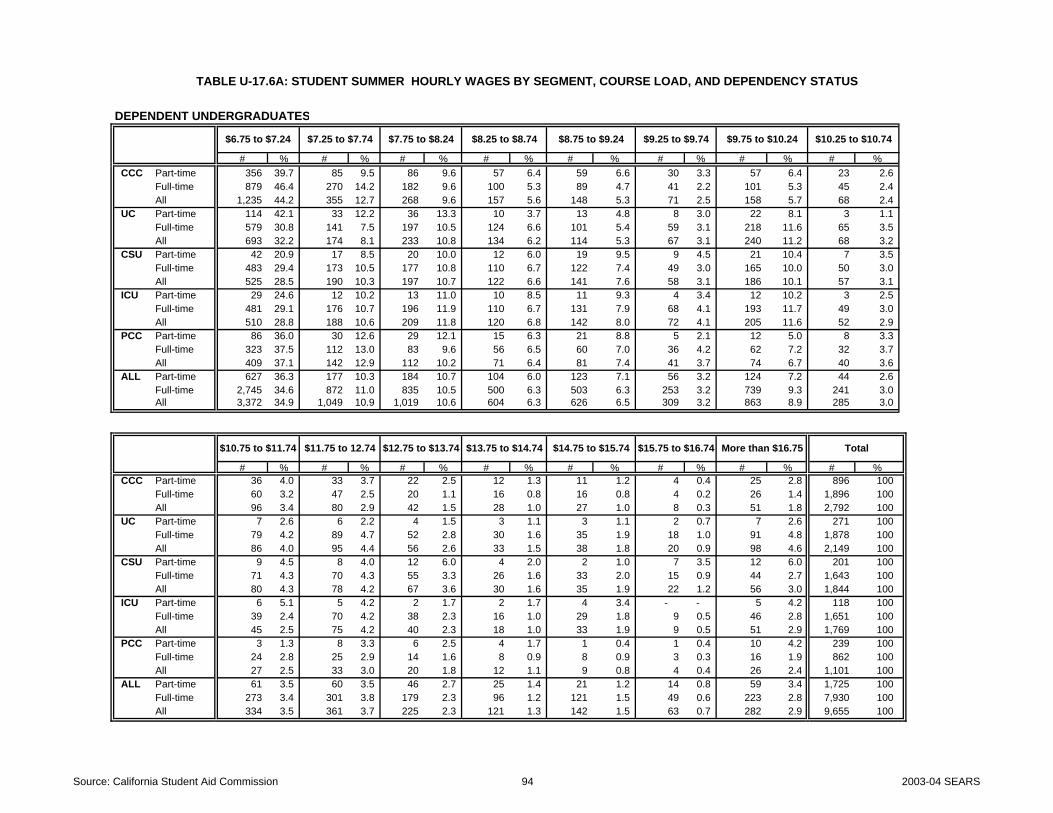
DEPENDENT UNDERGRADUATES
$6.75 to $7.24 $7.25 to $7.74 $7.75 to $8.24 $8.25 to $8.74 $8.75 to $9.24 $9.25 to $9.74 $9.75 to $10.24 $10.25 to $10.74
# % # % # % # % # % # % # % # %CCC Part-time 356 39.7 85 9.5 86 9.6 57 6.4 59 6.6 30 3.3 57 6.4 23 2.6
Full-time 879 46.4 270 14.2 182 9.6 100 5.3 89 4.7 41 2.2 101 5.3 45 2.4 All 1,235 44.2 355 12.7 268 9.6 157 5.6 148 5.3 71 2.5 158 5.7 68 2.4
UC Part-time 114 42.1 33 12.2 36 13.3 10 3.7 13 4.8 8 3.0 22 8.1 3 1.1 Full-time 579 30.8 141 7.5 197 10.5 124 6.6 101 5.4 59 3.1 218 11.6 65 3.5 All 693 32.2 174 8.1 233 10.8 134 6.2 114 5.3 67 3.1 240 11.2 68 3.2
CSU Part-time 42 20.9 17 8.5 20 10.0 12 6.0 19 9.5 9 4.5 21 10.4 7 3.5 Full-time 483 29.4 173 10.5 177 10.8 110 6.7 122 7.4 49 3.0 165 10.0 50 3.0 All 525 28.5 190 10.3 197 10.7 122 6.6 141 7.6 58 3.1 186 10.1 57 3.1
ICU Part-time 29 24.6 12 10.2 13 11.0 10 8.5 11 9.3 4 3.4 12 10.2 3 2.5 Full-time 481 29.1 176 10.7 196 11.9 110 6.7 131 7.9 68 4.1 193 11.7 49 3.0 All 510 28.8 188 10.6 209 11.8 120 6.8 142 8.0 72 4.1 205 11.6 52 2.9
PCC Part-time 86 36.0 30 12.6 29 12.1 15 6.3 21 8.8 5 2.1 12 5.0 8 3.3 Full-time 323 37.5 112 13.0 83 9.6 56 6.5 60 7.0 36 4.2 62 7.2 32 3.7 All 409 37.1 142 12.9 112 10.2 71 6.4 81 7.4 41 3.7 74 6.7 40 3.6
ALL Part-time 627 36.3 177 10.3 184 10.7 104 6.0 123 7.1 56 3.2 124 7.2 44 2.6 Full-time 2,745 34.6 872 11.0 835 10.5 500 6.3 503 6.3 253 3.2 739 9.3 241 3.0 All 3,372 34.9 1,049 10.9 1,019 10.6 604 6.3 626 6.5 309 3.2 863 8.9 285 3.0
$10.75 to $11.74 $11.75 to 12.74 $12.75 to $13.74 $13.75 to $14.74 $14.75 to $15.74 $15.75 to $16.74 More than $16.75 Total
# % # % # % # % # % # % # % # %CCC Part-time 36 4.0 33 3.7 22 2.5 12 1.3 11 1.2 4 0.4 25 2.8 896 100
Full-time 60 3.2 47 2.5 20 1.1 16 0.8 16 0.8 4 0.2 26 1.4 1,896 100 All 96 3.4 80 2.9 42 1.5 28 1.0 27 1.0 8 0.3 51 1.8 2,792 100
UC Part-time 7 2.6 6 2.2 4 1.5 3 1.1 3 1.1 2 0.7 7 2.6 271 100 Full-time 79 4.2 89 4.7 52 2.8 30 1.6 35 1.9 18 1.0 91 4.8 1,878 100 All 86 4.0 95 4.4 56 2.6 33 1.5 38 1.8 20 0.9 98 4.6 2,149 100
CSU Part-time 9 4.5 8 4.0 12 6.0 4 2.0 2 1.0 7 3.5 12 6.0 201 100 Full-time 71 4.3 70 4.3 55 3.3 26 1.6 33 2.0 15 0.9 44 2.7 1,643 100 All 80 4.3 78 4.2 67 3.6 30 1.6 35 1.9 22 1.2 56 3.0 1,844 100
ICU Part-time 6 5.1 5 4.2 2 1.7 2 1.7 4 3.4 - - 5 4.2 118 100 Full-time 39 2.4 70 4.2 38 2.3 16 1.0 29 1.8 9 0.5 46 2.8 1,651 100 All 45 2.5 75 4.2 40 2.3 18 1.0 33 1.9 9 0.5 51 2.9 1,769 100
PCC Part-time 3 1.3 8 3.3 6 2.5 4 1.7 1 0.4 1 0.4 10 4.2 239 100 Full-time 24 2.8 25 2.9 14 1.6 8 0.9 8 0.9 3 0.3 16 1.9 862 100 All 27 2.5 33 3.0 20 1.8 12 1.1 9 0.8 4 0.4 26 2.4 1,101 100
ALL Part-time 61 3.5 60 3.5 46 2.7 25 1.4 21 1.2 14 0.8 59 3.4 1,725 100 Full-time 273 3.4 301 3.8 179 2.3 96 1.2 121 1.5 49 0.6 223 2.8 7,930 100 All 334 3.5 361 3.7 225 2.3 121 1.3 142 1.5 63 0.7 282 2.9 9,655 100
TABLE U-17.6A: STUDENT SUMMER HOURLY WAGES BY SEGMENT, COURSE LOAD, AND DEPENDENCY STATUS
Source: California Student Aid Commission 94 2003-04 SEARS

INDEPENDENT UNDERGRADUATES
$6.75 to $7.24 $7.25 to $7.74 $7.75 to $8.24 $8.25 to $8.74 $8.75 to $9.24 $9.25 to $9.74 $9.75 to $10.24 $10.25 to $10.74
# % # % # % # % # % # % # % # %CCC Part-time 226 16.7 51 3.8 61 4.5 40 3.0 57 4.2 33 2.4 67 4.9 52 3.8
Full-time 353 37.5 72 7.7 74 7.9 37 3.9 39 4.1 34 3.6 48 5.1 25 2.7 All 579 25.2 123 5.4 135 5.9 77 3.4 96 4.2 67 2.9 115 5.0 77 3.4
UC Part-time 15 30.0 1 2.0 2 4.0 3 6.0 1 2.0 1 2.0 5 10.0 2 4.0 Full-time 59 24.8 14 5.9 18 7.6 14 5.9 11 4.6 8 3.4 26 10.9 6 2.5 All 74 25.7 15 5.2 20 6.9 17 5.9 12 4.2 9 3.1 31 10.8 8 2.8
CSU Part-time 59 11.4 11 2.1 12 2.3 10 1.9 16 3.1 12 2.3 37 7.1 20 3.9 Full-time 164 18.2 43 4.8 55 6.1 34 3.8 50 5.5 29 3.2 96 10.7 46 5.1 All 223 15.7 54 3.8 67 4.7 44 3.1 66 4.6 41 2.9 133 9.4 66 4.6
ICU Part-time 12 8.2 2 1.4 3 2.1 4 2.7 - - - - 9 6.2 5 3.4 Full-time 46 16.0 17 5.9 17 5.9 14 4.9 13 4.5 10 3.5 28 9.8 7 2.4 All 58 13.4 19 4.4 20 4.6 18 4.2 13 3.0 10 2.3 37 8.5 12 2.8
PCC Part-time 74 15.2 22 4.5 12 2.5 20 4.1 11 2.3 16 3.3 33 6.8 16 3.3 Full-time 293 21.3 66 4.8 75 5.4 52 3.8 82 6.0 35 2.5 97 7.0 41 3.0 All 367 19.7 88 4.7 87 4.7 72 3.9 93 5.0 51 2.7 130 7.0 57 3.1
ALL Part-time 386 15.1 87 3.4 90 3.5 77 3.0 85 3.3 62 2.4 151 5.9 95 3.7 Full-time 915 24.4 212 5.7 239 6.4 151 4.0 195 5.2 116 3.1 295 7.9 125 3.3 All 1,301 20.6 299 4.7 329 5.2 228 3.6 280 4.4 178 2.8 446 7.1 220 3.5
$10.75 to $11.74 $11.75 to 12.74 $12.75 to $13.74 $13.75 to $14.74 $14.75 to $15.74 $15.75 to $16.74 More than $16.75 Total
# % # % # % # % # % # % # % # %CCC Part-time 67 4.9 78 5.8 59 4.4 67 4.9 59 4.4 47 3.5 390 28.8 1,354 100
Full-time 34 3.6 34 3.6 31 3.3 23 2.4 23 2.4 24 2.6 90 9.6 941 100 All 101 4.4 112 4.9 90 3.9 90 3.9 82 3.6 71 3.1 480 20.9 2,295 100
UC Part-time 1 2.0 3 6.0 - - 2 4.0 4 8.0 1 2.0 9 18.0 50 100 Full-time 11 4.6 10 4.2 12 5.0 10 4.2 11 4.6 6 2.5 22 9.2 238 100 All 12 4.2 13 4.5 12 4.2 12 4.2 15 5.2 7 2.4 31 10.8 288 100
CSU Part-time 29 5.6 28 5.4 34 6.6 24 4.6 22 4.2 21 4.0 184 35.5 519 100 Full-time 58 6.4 61 6.8 50 5.5 32 3.6 41 4.6 26 2.9 116 12.9 901 100 All 87 6.1 89 6.3 84 5.9 56 3.9 63 4.4 47 3.3 300 21.1 1,420 100
ICU Part-time 7 4.8 9 6.2 9 6.2 3 2.1 10 6.8 9 6.2 64 43.8 146 100 Full-time 12 4.2 14 4.9 15 5.2 5 1.7 14 4.9 12 4.2 63 22.0 287 100 All 19 4.4 23 5.3 24 5.5 8 1.8 24 5.5 21 4.8 127 29.3 433 100
PCC Part-time 27 5.5 26 5.3 23 4.7 20 4.1 16 3.3 19 3.9 153 31.4 488 100 Full-time 64 4.6 73 5.3 75 5.4 54 3.9 39 2.8 33 2.4 298 21.6 1,377 100 All 91 4.9 99 5.3 98 5.3 74 4.0 55 2.9 52 2.8 451 24.2 1,865 100
ALL Part-time 131 5.1 144 5.6 125 4.9 116 4.5 111 4.3 97 3.8 800 31.3 2,557 100 Full-time 179 4.8 192 5.1 183 4.9 124 3.3 128 3.4 101 2.7 589 15.7 3,744 100 All 310 4.9 336 5.3 308 4.9 240 3.8 239 3.8 198 3.1 1,389 22.0 6,301 100
TABLE U-17.6B: STUDENT SUMMER HOURLY WAGES BY SEGMENT, COURSE LOAD, AND DEPENDENCY STATUS
Source: California Student Aid Commission 95 2003-04 SEARS

ALL UNDERGRADUATES
$6.75 to $7.24 $7.25 to $7.74 $7.75 to $8.24 $8.25 to $8.74 $8.75 to $9.24 $9.25 to $9.74 $9.75 to $10.24 $10.25 to $10.74
# % # % # % # % # % # % # % # %Part-time 1,013 23.7 264 6.2 274 6.4 181 4.2 208 4.9 118 2.8 275 6.4 139 3.2 Full-time 3,660 31.4 1,084 9.3 1,074 9.2 651 5.6 698 6.0 369 3.2 1,034 8.9 366 3.1 All 4,673 29.3 1,348 8.4 1,348 8.4 832 5.2 906 5.7 487 3.1 1,309 8.2 505 3.2
$10.75 to $11.74 $11.75 to 12.74 $12.75 to $13.74 $13.75 to $14.74 $14.75 to $15.74 $15.75 to $16.74 More than $16.75 Total
# % # % # % # % # % # % # % # %Part-time 192 4.5 204 4.8 171 4.0 141 3.3 132 3.1 111 2.6 859 20.1 4,282 100 Full-time 452 3.9 493 4.2 362 3.1 220 1.9 249 2.1 150 1.3 812 7.0 11,674 100 All 644 4.0 697 4.4 533 3.3 361 2.3 381 2.4 261 1.6 1,671 10.5 15,956 100
TABLE U-17.6C: STUDENT SUMMER HOURLY WAGES BY SEGMENT, COURSE LOAD, AND DEPENDENCY STATUS
Source: California Student Aid Commission 96 2003-04 SEARS
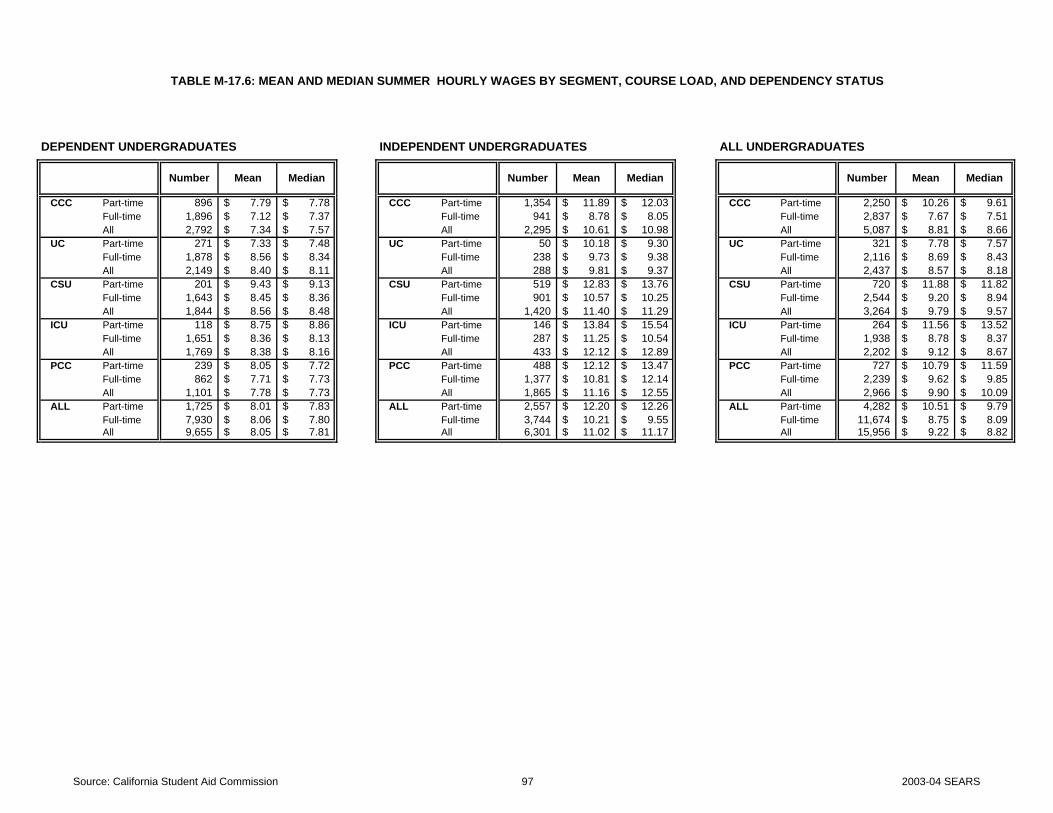
DEPENDENT UNDERGRADUATES INDEPENDENT UNDERGRADUATES ALL UNDERGRADUATES
CCC Part-time 896 7.79$ 7.78$ CCC Part-time 1,354 11.89$ 12.03$ CCC Part-time 2,250 10.26$ 9.61$ Full-time 1,896 7.12$ 7.37$ Full-time 941 8.78$ 8.05$ Full-time 2,837 7.67$ 7.51$ All 2,792 7.34$ 7.57$ All 2,295 10.61$ 10.98$ All 5,087 8.81$ 8.66$
UC Part-time 271 7.33$ 7.48$ UC Part-time 50 10.18$ 9.30$ UC Part-time 321 7.78$ 7.57$ Full-time 1,878 8.56$ 8.34$ Full-time 238 9.73$ 9.38$ Full-time 2,116 8.69$ 8.43$ All 2,149 8.40$ 8.11$ All 288 9.81$ 9.37$ All 2,437 8.57$ 8.18$
CSU Part-time 201 9.43$ 9.13$ CSU Part-time 519 12.83$ 13.76$ CSU Part-time 720 11.88$ 11.82$ Full-time 1,643 8.45$ 8.36$ Full-time 901 10.57$ 10.25$ Full-time 2,544 9.20$ 8.94$
All 1,844 8.56$ 8.48$ All 1,420 11.40$ 11.29$ All 3,264 9.79$ 9.57$ ICU Part-time 118 8.75$ 8.86$ ICU Part-time 146 13.84$ 15.54$ ICU Part-time 264 11.56$ 13.52$ Full-time 1,651 8.36$ 8.13$ Full-time 287 11.25$ 10.54$ Full-time 1,938 8.78$ 8.37$
All 1,769 8.38$ 8.16$ All 433 12.12$ 12.89$ All 2,202 9.12$ 8.67$ PCC Part-time 239 8.05$ 7.72$ PCC Part-time 488 12.12$ 13.47$ PCC Part-time 727 10.79$ 11.59$ Full-time 862 7.71$ 7.73$ Full-time 1,377 10.81$ 12.14$ Full-time 2,239 9.62$ 9.85$
All 1,101 7.78$ 7.73$ All 1,865 11.16$ 12.55$ All 2,966 9.90$ 10.09$ ALL Part-time 1,725 8.01$ 7.83$ ALL Part-time 2,557 12.20$ 12.26$ ALL Part-time 4,282 10.51$ 9.79$
Full-time 7,930 8.06$ 7.80$ Full-time 3,744 10.21$ 9.55$ Full-time 11,674 8.75$ 8.09$ All 9,655 8.05$ 7.81$ All 6,301 11.02$ 11.17$ All 15,956 9.22$ 8.82$
TABLE M-17.6: MEAN AND MEDIAN SUMMER HOURLY WAGES BY SEGMENT, COURSE LOAD, AND DEPENDENCY STATUS
Number Mean Median Number MedianMean Median Number Mean
Source: California Student Aid Commission 97 2003-04 SEARS

W-17.7, U-17.7, and M-17.7 (Summer Hours Volunteered) How many hours on average do you, or will you, volunteer per week during summer immediately before
the current academic year (e.g., June through August 2003)? 0 None, I can not/will not volunteer 4 16 to 20 8 36 to 40 1 Less than 5 5 21 to 25 9 40 hours or more 2 5 to 10 6 26 to 30 3 11 to 15 7 31 to 35
W-17.8, U-17.8, and M-17.8 (Summer Hours Internships) How many hours on average do you, or will you, work in unpaid internships per week during summer
immediately before the current academic year (e.g., June through August 2003)? 0 I do not/will not work 4 16 to 20 8 36 to 40 1 Less than 5 5 21 to 25 9 40 hours or more 2 5 to 10 6 26 to 30 3 11 to 15 7 31 to 35
98 2003-04 SEARS
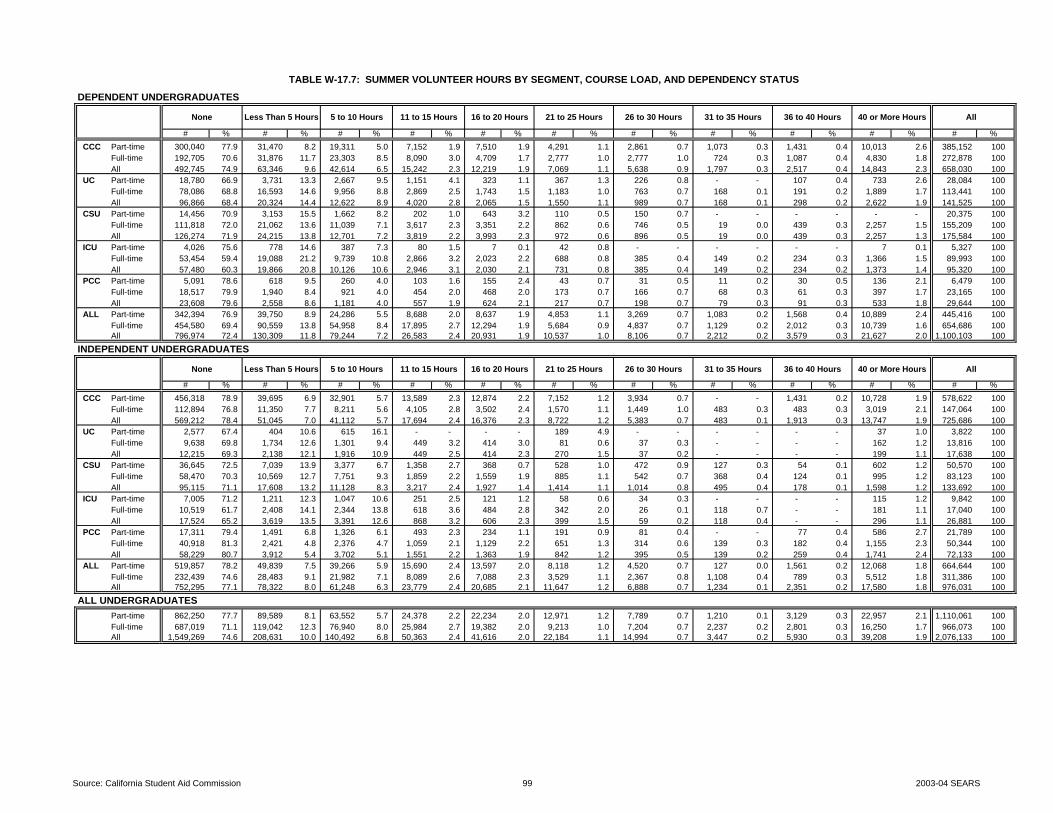
TABLE W-17.7: SUMMER VOLUNTEER HOURS BY SEGMENT, COURSE LOAD, AND DEPENDENCY STATUS
DEPENDENT UNDERGRADUATES
None Less Than 5 Hours 5 to 10 Hours 11 to 15 Hours 16 to 20 Hours 21 to 25 Hours 26 to 30 Hours 31 to 35 Hours 36 to 40 Hours 40 or More Hours All
# % # % # % # % # % # % # % # % # % # % # %CCC Part-time 300,040 77.9 31,470 8.2 19,311 5.0 7,152 1.9 7,510 1.9 4,291 1.1 2,861 0.7 1,073 0.3 1,431 0.4 10,013 2.6 385,152 100
Full-time 192,705 70.6 31,876 11.7 23,303 8.5 8,090 3.0 4,709 1.7 2,777 1.0 2,777 1.0 724 0.3 1,087 0.4 4,830 1.8 272,878 100 All 492,745 74.9 63,346 9.6 42,614 6.5 15,242 2.3 12,219 1.9 7,069 1.1 5,638 0.9 1,797 0.3 2,517 0.4 14,843 2.3 658,030 100
UC Part-time 18,780 66.9 3,731 13.3 2,667 9.5 1,151 4.1 323 1.1 367 1.3 226 0.8 - - 107 0.4 733 2.6 28,084 100 Full-time 78,086 68.8 16,593 14.6 9,956 8.8 2,869 2.5 1,743 1.5 1,183 1.0 763 0.7 168 0.1 191 0.2 1,889 1.7 113,441 100 All 96,866 68.4 20,324 14.4 12,622 8.9 4,020 2.8 2,065 1.5 1,550 1.1 989 0.7 168 0.1 298 0.2 2,622 1.9 141,525 100
CSU Part-time 14,456 70.9 3,153 15.5 1,662 8.2 202 1.0 643 3.2 110 0.5 150 0.7 - - - - - - 20,375 100 Full-time 111,818 72.0 21,062 13.6 11,039 7.1 3,617 2.3 3,351 2.2 862 0.6 746 0.5 19 0.0 439 0.3 2,257 1.5 155,209 100 All 126,274 71.9 24,215 13.8 12,701 7.2 3,819 2.2 3,993 2.3 972 0.6 896 0.5 19 0.0 439 0.3 2,257 1.3 175,584 100
ICU Part-time 4,026 75.6 778 14.6 387 7.3 80 1.5 7 0.1 42 0.8 - - - - - - 7 0.1 5,327 100 Full-time 53,454 59.4 19,088 21.2 9,739 10.8 2,866 3.2 2,023 2.2 688 0.8 385 0.4 149 0.2 234 0.3 1,366 1.5 89,993 100 All 57,480 60.3 19,866 20.8 10,126 10.6 2,946 3.1 2,030 2.1 731 0.8 385 0.4 149 0.2 234 0.2 1,373 1.4 95,320 100
PCC Part-time 5,091 78.6 618 9.5 260 4.0 103 1.6 155 2.4 43 0.7 31 0.5 11 0.2 30 0.5 136 2.1 6,479 100 Full-time 18,517 79.9 1,940 8.4 921 4.0 454 2.0 468 2.0 173 0.7 166 0.7 68 0.3 61 0.3 397 1.7 23,165 100 All 23,608 79.6 2,558 8.6 1,181 4.0 557 1.9 624 2.1 217 0.7 198 0.7 79 0.3 91 0.3 533 1.8 29,644 100
ALL Part-time 342,394 76.9 39,750 8.9 24,286 5.5 8,688 2.0 8,637 1.9 4,853 1.1 3,269 0.7 1,083 0.2 1,568 0.4 10,889 2.4 445,416 100 Full-time 454,580 69.4 90,559 13.8 54,958 8.4 17,895 2.7 12,294 1.9 5,684 0.9 4,837 0.7 1,129 0.2 2,012 0.3 10,739 1.6 654,686 100 All 796,974 72.4 130,309 11.8 79,244 7.2 26,583 2.4 20,931 1.9 10,537 1.0 8,106 0.7 2,212 0.2 3,579 0.3 21,627 2.0 1,100,103 100
INDEPENDENT UNDERGRADUATES
None Less Than 5 Hours 5 to 10 Hours 11 to 15 Hours 16 to 20 Hours 21 to 25 Hours 26 to 30 Hours 31 to 35 Hours 36 to 40 Hours 40 or More Hours All
# % # % # % # % # % # % # % # % # % # % # %CCC Part-time 456,318 78.9 39,695 6.9 32,901 5.7 13,589 2.3 12,874 2.2 7,152 1.2 3,934 0.7 - - 1,431 0.2 10,728 1.9 578,622 100
Full-time 112,894 76.8 11,350 7.7 8,211 5.6 4,105 2.8 3,502 2.4 1,570 1.1 1,449 1.0 483 0.3 483 0.3 3,019 2.1 147,064 100 All 569,212 78.4 51,045 7.0 41,112 5.7 17,694 2.4 16,376 2.3 8,722 1.2 5,383 0.7 483 0.1 1,913 0.3 13,747 1.9 725,686 100
UC Part-time 2,577 67.4 404 10.6 615 16.1 - - - - 189 4.9 - - - - - - 37 1.0 3,822 100 Full-time 9,638 69.8 1,734 12.6 1,301 9.4 449 3.2 414 3.0 81 0.6 37 0.3 - - - - 162 1.2 13,816 100 All 12,215 69.3 2,138 12.1 1,916 10.9 449 2.5 414 2.3 270 1.5 37 0.2 - - - - 199 1.1 17,638 100
CSU Part-time 36,645 72.5 7,039 13.9 3,377 6.7 1,358 2.7 368 0.7 528 1.0 472 0.9 127 0.3 54 0.1 602 1.2 50,570 100 Full-time 58,470 70.3 10,569 12.7 7,751 9.3 1,859 2.2 1,559 1.9 885 1.1 542 0.7 368 0.4 124 0.1 995 1.2 83,123 100 All 95,115 71.1 17,608 13.2 11,128 8.3 3,217 2.4 1,927 1.4 1,414 1.1 1,014 0.8 495 0.4 178 0.1 1,598 1.2 133,692 100
ICU Part-time 7,005 71.2 1,211 12.3 1,047 10.6 251 2.5 121 1.2 58 0.6 34 0.3 - - - - 115 1.2 9,842 100 Full-time 10,519 61.7 2,408 14.1 2,344 13.8 618 3.6 484 2.8 342 2.0 26 0.1 118 0.7 - - 181 1.1 17,040 100 All 17,524 65.2 3,619 13.5 3,391 12.6 868 3.2 606 2.3 399 1.5 59 0.2 118 0.4 - - 296 1.1 26,881 100
PCC Part-time 17,311 79.4 1,491 6.8 1,326 6.1 493 2.3 234 1.1 191 0.9 81 0.4 - - 77 0.4 586 2.7 21,789 100 Full-time 40,918 81.3 2,421 4.8 2,376 4.7 1,059 2.1 1,129 2.2 651 1.3 314 0.6 139 0.3 182 0.4 1,155 2.3 50,344 100 All 58,229 80.7 3,912 5.4 3,702 5.1 1,551 2.2 1,363 1.9 842 1.2 395 0.5 139 0.2 259 0.4 1,741 2.4 72,133 100
ALL Part-time 519,857 78.2 49,839 7.5 39,266 5.9 15,690 2.4 13,597 2.0 8,118 1.2 4,520 0.7 127 0.0 1,561 0.2 12,068 1.8 664,644 100 Full-time 232,439 74.6 28,483 9.1 21,982 7.1 8,089 2.6 7,088 2.3 3,529 1.1 2,367 0.8 1,108 0.4 789 0.3 5,512 1.8 311,386 100 All 752,295 77.1 78,322 8.0 61,248 6.3 23,779 2.4 20,685 2.1 11,647 1.2 6,888 0.7 1,234 0.1 2,351 0.2 17,580 1.8 976,031 100
ALL UNDERGRADUATESPart-time 862,250 77.7 89,589 8.1 63,552 5.7 24,378 2.2 22,234 2.0 12,971 1.2 7,789 0.7 1,210 0.1 3,129 0.3 22,957 2.1 1,110,061 100 Full-time 687,019 71.1 119,042 12.3 76,940 8.0 25,984 2.7 19,382 2.0 9,213 1.0 7,204 0.7 2,237 0.2 2,801 0.3 16,250 1.7 966,073 100 All 1,549,269 74.6 208,631 10.0 140,492 6.8 50,363 2.4 41,616 2.0 22,184 1.1 14,994 0.7 3,447 0.2 5,930 0.3 39,208 1.9 2,076,133 100
Source: California Student Aid Commission 99 2003-04 SEARS

TABLE U-17.7: SUMMER VOLUNTEER HOURS BY SEGMENT, COURSE LOAD, AND DEPENDENCY STATUS
DEPENDENT UNDERGRADUATES
None Less Than 5 Hours 5 to 10 Hours 11 to 15 Hours 16 to 20 Hours 21 to 25 Hours 26 to 30 Hours 31 to 35 Hours 36 to 40 Hours 40 or More Hours All
# % # % # % # % # % # % # % # % # % # % # %CCC Part-time 839 77.9 88 8.2 54 5.0 20 1.9 21 1.9 12 1.1 8 0.7 3 0.3 4 0.4 28 2.6 1,077 100
Full-time 1,596 70.6 264 11.7 193 8.5 67 3.0 39 1.7 23 1.0 23 1.0 6 0.3 9 0.4 40 1.8 2,260 100 All 2,435 73.0 352 10.5 247 7.4 87 2.6 60 1.8 35 1.0 31 0.9 9 0.3 13 0.4 68 2.0 3,337 100
UC Part-time 304 66.8 60 13.2 44 9.7 17 3.7 6 1.3 6 1.3 4 0.9 - - 2 0.4 12 2.6 455 100 Full-time 2,046 68.4 444 14.8 264 8.8 78 2.6 47 1.6 31 1.0 20 0.7 4 0.1 5 0.2 52 1.7 2,991 100 All 2,350 68.2 504 14.6 308 8.9 95 2.8 53 1.5 37 1.1 24 0.7 4 0.1 7 0.2 64 1.9 3,446 100
CSU Part-time 165 73.7 33 14.7 15 6.7 2 0.9 5 2.2 2 0.9 2 0.9 - - - - - - 224 100 Full-time 1,351 69.4 298 15.3 153 7.9 50 2.6 43 2.2 10 0.5 11 0.6 1 0.1 4 0.2 26 1.3 1,947 100 All 1,516 69.8 331 15.2 168 7.7 52 2.4 48 2.2 12 0.6 13 0.6 1 0.0 4 0.2 26 1.2 2,171 100
ICU Part-time 112 72.7 28 18.2 10 6.5 1 0.6 1 0.6 1 0.6 - - - - - - 1 0.6 154 100 Full-time 1,192 59.2 431 21.4 214 10.6 63 3.1 46 2.3 18 0.9 7 0.3 4 0.2 6 0.3 33 1.6 2,014 100 All 1,304 60.1 459 21.2 224 10.3 64 3.0 47 2.2 19 0.9 7 0.3 4 0.2 6 0.3 34 1.6 2,168 100
PCC Part-time 228 77.6 28 9.5 12 4.1 5 1.7 6 2.0 2 0.7 2 0.7 1 0.3 1 0.3 9 3.1 294 100 Full-time 856 79.1 76 7.0 53 4.9 24 2.2 20 1.8 11 1.0 9 0.8 4 0.4 4 0.4 25 2.3 1,082 100 All 1,084 78.8 104 7.6 65 4.7 29 2.1 26 1.9 13 0.9 11 0.8 5 0.4 5 0.4 34 2.5 1,376 100
ALL Part-time 1,648 74.8 237 10.8 135 6.1 45 2.0 39 1.8 23 1.0 16 0.7 4 0.2 7 0.3 50 2.3 2,204 100 Full-time 7,041 68.4 1,513 14.7 877 8.5 282 2.7 195 1.9 93 0.9 70 0.7 19 0.2 28 0.3 176 1.7 10,294 100 All 8,689 69.5 1,750 14.0 1,012 8.1 327 2.6 234 1.9 116 0.9 86 0.7 23 0.2 35 0.3 226 1.8 12,498 100
INDEPENDENT UNDERGRADUATES
None Less Than 5 Hours 5 to 10 Hours 11 to 15 Hours 16 to 20 Hours 21 to 25 Hours 26 to 30 Hours 31 to 35 Hours 36 to 40 Hours 40 or More Hours All
# % # % # % # % # % # % # % # % # % # % # %CCC Part-time 1,276 78.9 111 6.9 92 5.7 38 2.3 36 2.2 20 1.2 11 0.7 - - 4 0.2 30 1.9 1,618 100
Full-time 935 76.8 94 7.7 68 5.6 34 2.8 29 2.4 13 1.1 12 1.0 4 0.3 4 0.3 25 2.1 1,218 100 All 2,211 78.0 205 7.2 160 5.6 72 2.5 65 2.3 33 1.2 23 0.8 4 0.1 8 0.3 55 1.9 2,836 100
UC Part-time 48 68.6 8 11.4 10 14.3 - - - - 3 4.3 - - - - - - 1 1.4 70 100 Full-time 252 70.2 45 12.5 32 8.9 12 3.3 11 3.1 2 0.6 1 0.3 - - - - 4 1.1 359 100 All 300 69.9 53 12.4 42 9.8 12 2.8 11 2.6 5 1.2 1 0.2 - - - - 5 1.2 429 100
CSU Part-time 434 72.1 80 13.3 46 7.6 18 3.0 5 0.8 5 0.8 6 1.0 1 0.2 1 0.2 6 1.0 602 100 Full-time 810 70.9 146 12.8 101 8.8 23 2.0 21 1.8 11 1.0 11 1.0 4 0.3 1 0.1 15 1.3 1,143 100 All 1,244 71.3 226 13.0 147 8.4 41 2.3 26 1.5 16 0.9 17 1.0 5 0.3 2 0.1 21 1.2 1,745 100
ICU Part-time 111 68.5 22 13.6 18 11.1 5 3.1 2 1.2 1 0.6 1 0.6 - - - - 2 1.2 162 100 Full-time 211 60.3 55 15.7 48 13.7 13 3.7 10 2.9 6 1.7 1 0.3 2 0.6 - - 4 1.1 350 100 All 322 62.9 77 15.0 66 12.9 18 3.5 12 2.3 7 1.4 2 0.4 2 0.4 - - 6 1.2 512 100
PCC Part-time 484 80.7 37 6.2 31 5.2 13 2.2 11 1.8 5 0.8 4 0.7 - - 1 0.2 14 2.3 600 100 Full-time 1,430 81.8 87 5.0 73 4.2 38 2.2 38 2.2 16 0.9 15 0.9 7 0.4 4 0.2 40 2.3 1,748 100 All 1,914 81.5 124 5.3 104 4.4 51 2.2 49 2.1 21 0.9 19 0.8 7 0.3 5 0.2 54 2.3 2,348 100
ALL Part-time 2,353 77.1 258 8.5 197 6.5 74 2.4 54 1.8 34 1.1 22 0.7 1 0.0 6 0.2 53 1.7 3,052 100 Full-time 3,638 75.5 427 8.9 322 6.7 120 2.5 109 2.3 48 1.0 40 0.8 17 0.4 9 0.2 88 1.8 4,818 100 All 5,991 76.1 685 8.7 519 6.6 194 2.5 163 2.1 82 1.0 62 0.8 18 0.2 15 0.2 141 1.8 7,870 100
ALL UNDERGRADUATESPart-time 4,001 76.1 495 9.4 332 6.3 119 2.3 93 1.8 57 1.1 38 0.7 5 0.1 13 0.2 103 2.0 5,256 100 Full-time 10,679 70.7 1,940 12.8 1,199 7.9 402 2.7 304 2.0 141 0.9 110 0.7 36 0.2 37 0.2 264 1.7 15,112 100 All 14,680 72.1 2,435 12.0 1,531 7.5 521 2.6 397 1.9 198 1.0 148 0.7 41 0.2 50 0.2 367 1.8 20,368 100
Source: California Student Aid Commission 100 2003-04 SEARS

DEPENDENT UNDERGRADUATES INDEPENDENT UNDERGRADUATES ALL UNDERGRADUATES
CCC Part-time 238 14 8 CCC Part-time 342 13 8 CCC Part-time 580 13 8 Full-time 664 11 7 Full-time 283 13 8 Full-time 947 12 7 All 902 12 7 All 625 13 8 All 1,527 12 8
UC Part-time 151 11 7 UC Part-time 22 10 7 UC Part-time 173 11 7 Full-time 945 10 6 Full-time 107 9 6 Full-time 1,052 9 6 All 1,096 10 6 All 129 9 6 All 1,225 10 6
CSU Part-time 59 7 3 CSU Part-time 168 9 3 CSU Part-time 227 9 3 Full-time 596 9 5 Full-time 333 10 6 Full-time 929 9 6
All 655 9 5 All 501 10 6 All 1,156 9 5 ICU Part-time 42 6 3 ICU Part-time 51 9 6 ICU Part-time 93 7 5 Full-time 822 8 3 Full-time 139 9 7 Full-time 961 9 5
All 864 8 3 All 190 9 7 All 1,054 8 5 PCC Part-time 66 14 6 PCC Part-time 116 14 8 PCC Part-time 182 14 8 Full-time 226 14 7 Full-time 318 15 10 Full-time 544 15 9
All 292 14 7 All 434 15 9 All 726 14 9 ALL Part-time 556 12 7 ALL Part-time 699 12 8 ALL Part-time 1,255 12 8
Full-time 3,253 10 6 Full-time 1,180 12 7 Full-time 4,433 10 6 All 3,809 10 6 All 1,879 12 8 All 5,688 11 7
Note: "None" category was excluded from the means and median calculations.
TABLE M-17.7: MEAN AND MEDIAN SUMMER VOLUNTEER HOURS BY SEGMENT, COURSE LOAD, AND DEPENDENCY STATUS
Number Mean Median Number MedianMean Median Number Mean
Source: California Student Aid Commission 101 2003-04 SEARS
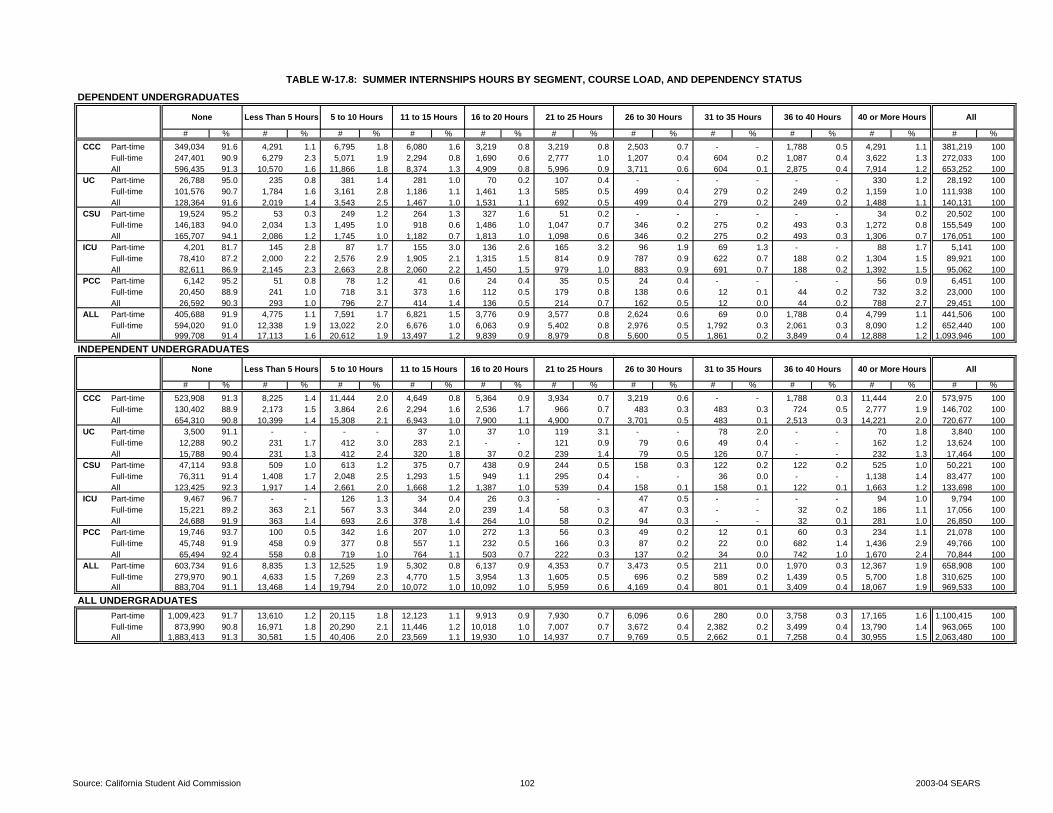
TABLE W-17.8: SUMMER INTERNSHIPS HOURS BY SEGMENT, COURSE LOAD, AND DEPENDENCY STATUS
DEPENDENT UNDERGRADUATES
None Less Than 5 Hours 5 to 10 Hours 11 to 15 Hours 16 to 20 Hours 21 to 25 Hours 26 to 30 Hours 31 to 35 Hours 36 to 40 Hours 40 or More Hours All
# % # % # % # % # % # % # % # % # % # % # %CCC Part-time 349,034 91.6 4,291 1.1 6,795 1.8 6,080 1.6 3,219 0.8 3,219 0.8 2,503 0.7 - - 1,788 0.5 4,291 1.1 381,219 100
Full-time 247,401 90.9 6,279 2.3 5,071 1.9 2,294 0.8 1,690 0.6 2,777 1.0 1,207 0.4 604 0.2 1,087 0.4 3,622 1.3 272,033 100 All 596,435 91.3 10,570 1.6 11,866 1.8 8,374 1.3 4,909 0.8 5,996 0.9 3,711 0.6 604 0.1 2,875 0.4 7,914 1.2 653,252 100
UC Part-time 26,788 95.0 235 0.8 381 1.4 281 1.0 70 0.2 107 0.4 - - - - - - 330 1.2 28,192 100 Full-time 101,576 90.7 1,784 1.6 3,161 2.8 1,186 1.1 1,461 1.3 585 0.5 499 0.4 279 0.2 249 0.2 1,159 1.0 111,938 100 All 128,364 91.6 2,019 1.4 3,543 2.5 1,467 1.0 1,531 1.1 692 0.5 499 0.4 279 0.2 249 0.2 1,488 1.1 140,131 100
CSU Part-time 19,524 95.2 53 0.3 249 1.2 264 1.3 327 1.6 51 0.2 - - - - - - 34 0.2 20,502 100 Full-time 146,183 94.0 2,034 1.3 1,495 1.0 918 0.6 1,486 1.0 1,047 0.7 346 0.2 275 0.2 493 0.3 1,272 0.8 155,549 100 All 165,707 94.1 2,086 1.2 1,745 1.0 1,182 0.7 1,813 1.0 1,098 0.6 346 0.2 275 0.2 493 0.3 1,306 0.7 176,051 100
ICU Part-time 4,201 81.7 145 2.8 87 1.7 155 3.0 136 2.6 165 3.2 96 1.9 69 1.3 - - 88 1.7 5,141 100 Full-time 78,410 87.2 2,000 2.2 2,576 2.9 1,905 2.1 1,315 1.5 814 0.9 787 0.9 622 0.7 188 0.2 1,304 1.5 89,921 100 All 82,611 86.9 2,145 2.3 2,663 2.8 2,060 2.2 1,450 1.5 979 1.0 883 0.9 691 0.7 188 0.2 1,392 1.5 95,062 100
PCC Part-time 6,142 95.2 51 0.8 78 1.2 41 0.6 24 0.4 35 0.5 24 0.4 - - - - 56 0.9 6,451 100 Full-time 20,450 88.9 241 1.0 718 3.1 373 1.6 112 0.5 179 0.8 138 0.6 12 0.1 44 0.2 732 3.2 23,000 100 All 26,592 90.3 293 1.0 796 2.7 414 1.4 136 0.5 214 0.7 162 0.5 12 0.0 44 0.2 788 2.7 29,451 100
ALL Part-time 405,688 91.9 4,775 1.1 7,591 1.7 6,821 1.5 3,776 0.9 3,577 0.8 2,624 0.6 69 0.0 1,788 0.4 4,799 1.1 441,506 100 Full-time 594,020 91.0 12,338 1.9 13,022 2.0 6,676 1.0 6,063 0.9 5,402 0.8 2,976 0.5 1,792 0.3 2,061 0.3 8,090 1.2 652,440 100 All 999,708 91.4 17,113 1.6 20,612 1.9 13,497 1.2 9,839 0.9 8,979 0.8 5,600 0.5 1,861 0.2 3,849 0.4 12,888 1.2 1,093,946 100
INDEPENDENT UNDERGRADUATES
None Less Than 5 Hours 5 to 10 Hours 11 to 15 Hours 16 to 20 Hours 21 to 25 Hours 26 to 30 Hours 31 to 35 Hours 36 to 40 Hours 40 or More Hours All
# % # % # % # % # % # % # % # % # % # % # %CCC Part-time 523,908 91.3 8,225 1.4 11,444 2.0 4,649 0.8 5,364 0.9 3,934 0.7 3,219 0.6 - - 1,788 0.3 11,444 2.0 573,975 100
Full-time 130,402 88.9 2,173 1.5 3,864 2.6 2,294 1.6 2,536 1.7 966 0.7 483 0.3 483 0.3 724 0.5 2,777 1.9 146,702 100 All 654,310 90.8 10,399 1.4 15,308 2.1 6,943 1.0 7,900 1.1 4,900 0.7 3,701 0.5 483 0.1 2,513 0.3 14,221 2.0 720,677 100
UC Part-time 3,500 91.1 - - - - 37 1.0 37 1.0 119 3.1 - - 78 2.0 - - 70 1.8 3,840 100 Full-time 12,288 90.2 231 1.7 412 3.0 283 2.1 - - 121 0.9 79 0.6 49 0.4 - - 162 1.2 13,624 100 All 15,788 90.4 231 1.3 412 2.4 320 1.8 37 0.2 239 1.4 79 0.5 126 0.7 - - 232 1.3 17,464 100
CSU Part-time 47,114 93.8 509 1.0 613 1.2 375 0.7 438 0.9 244 0.5 158 0.3 122 0.2 122 0.2 525 1.0 50,221 100 Full-time 76,311 91.4 1,408 1.7 2,048 2.5 1,293 1.5 949 1.1 295 0.4 - - 36 0.0 - - 1,138 1.4 83,477 100 All 123,425 92.3 1,917 1.4 2,661 2.0 1,668 1.2 1,387 1.0 539 0.4 158 0.1 158 0.1 122 0.1 1,663 1.2 133,698 100
ICU Part-time 9,467 96.7 - - 126 1.3 34 0.4 26 0.3 - - 47 0.5 - - - - 94 1.0 9,794 100 Full-time 15,221 89.2 363 2.1 567 3.3 344 2.0 239 1.4 58 0.3 47 0.3 - - 32 0.2 186 1.1 17,056 100 All 24,688 91.9 363 1.4 693 2.6 378 1.4 264 1.0 58 0.2 94 0.3 - - 32 0.1 281 1.0 26,850 100
PCC Part-time 19,746 93.7 100 0.5 342 1.6 207 1.0 272 1.3 56 0.3 49 0.2 12 0.1 60 0.3 234 1.1 21,078 100 Full-time 45,748 91.9 458 0.9 377 0.8 557 1.1 232 0.5 166 0.3 87 0.2 22 0.0 682 1.4 1,436 2.9 49,766 100 All 65,494 92.4 558 0.8 719 1.0 764 1.1 503 0.7 222 0.3 137 0.2 34 0.0 742 1.0 1,670 2.4 70,844 100
ALL Part-time 603,734 91.6 8,835 1.3 12,525 1.9 5,302 0.8 6,137 0.9 4,353 0.7 3,473 0.5 211 0.0 1,970 0.3 12,367 1.9 658,908 100 Full-time 279,970 90.1 4,633 1.5 7,269 2.3 4,770 1.5 3,954 1.3 1,605 0.5 696 0.2 589 0.2 1,439 0.5 5,700 1.8 310,625 100 All 883,704 91.1 13,468 1.4 19,794 2.0 10,072 1.0 10,092 1.0 5,959 0.6 4,169 0.4 801 0.1 3,409 0.4 18,067 1.9 969,533 100
ALL UNDERGRADUATESPart-time 1,009,423 91.7 13,610 1.2 20,115 1.8 12,123 1.1 9,913 0.9 7,930 0.7 6,096 0.6 280 0.0 3,758 0.3 17,165 1.6 1,100,415 100 Full-time 873,990 90.8 16,971 1.8 20,290 2.1 11,446 1.2 10,018 1.0 7,007 0.7 3,672 0.4 2,382 0.2 3,499 0.4 13,790 1.4 963,065 100 All 1,883,413 91.3 30,581 1.5 40,406 2.0 23,569 1.1 19,930 1.0 14,937 0.7 9,769 0.5 2,662 0.1 7,258 0.4 30,955 1.5 2,063,480 100
Source: California Student Aid Commission 102 2003-04 SEARS
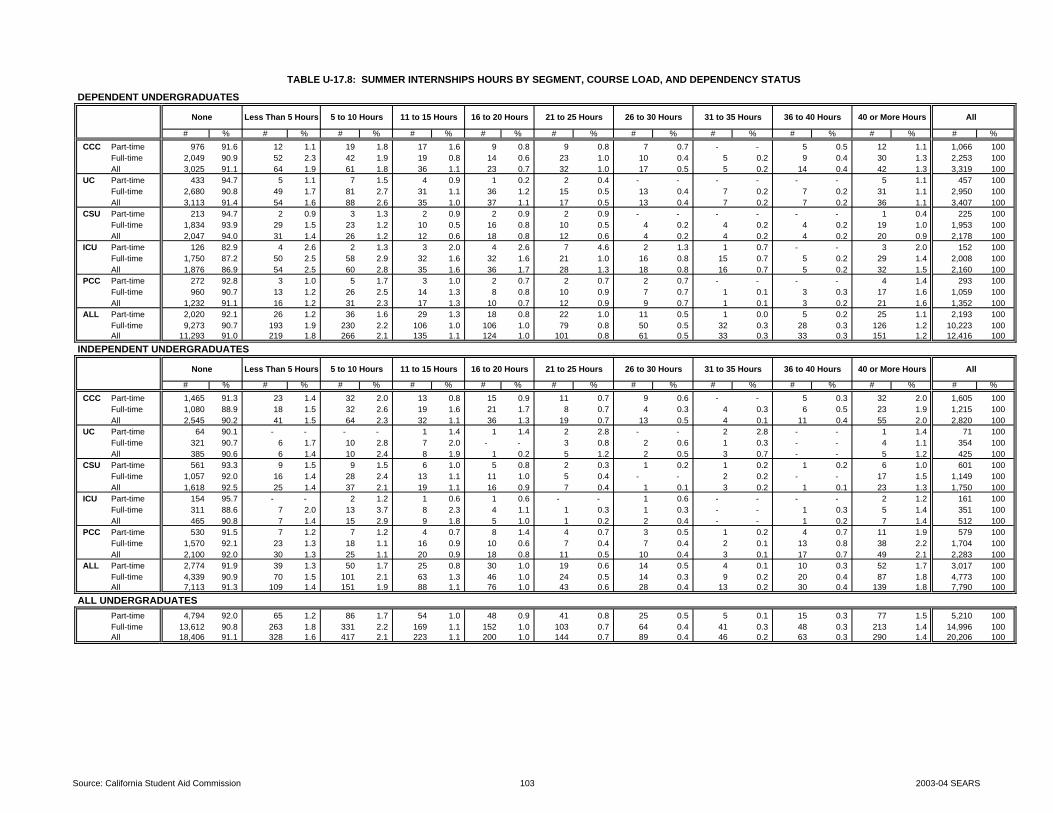
TABLE U-17.8: SUMMER INTERNSHIPS HOURS BY SEGMENT, COURSE LOAD, AND DEPENDENCY STATUS
DEPENDENT UNDERGRADUATES
None Less Than 5 Hours 5 to 10 Hours 11 to 15 Hours 16 to 20 Hours 21 to 25 Hours 26 to 30 Hours 31 to 35 Hours 36 to 40 Hours 40 or More Hours All
# % # % # % # % # % # % # % # % # % # % # %CCC Part-time 976 91.6 12 1.1 19 1.8 17 1.6 9 0.8 9 0.8 7 0.7 - - 5 0.5 12 1.1 1,066 100
Full-time 2,049 90.9 52 2.3 42 1.9 19 0.8 14 0.6 23 1.0 10 0.4 5 0.2 9 0.4 30 1.3 2,253 100 All 3,025 91.1 64 1.9 61 1.8 36 1.1 23 0.7 32 1.0 17 0.5 5 0.2 14 0.4 42 1.3 3,319 100
UC Part-time 433 94.7 5 1.1 7 1.5 4 0.9 1 0.2 2 0.4 - - - - - - 5 1.1 457 100 Full-time 2,680 90.8 49 1.7 81 2.7 31 1.1 36 1.2 15 0.5 13 0.4 7 0.2 7 0.2 31 1.1 2,950 100 All 3,113 91.4 54 1.6 88 2.6 35 1.0 37 1.1 17 0.5 13 0.4 7 0.2 7 0.2 36 1.1 3,407 100
CSU Part-time 213 94.7 2 0.9 3 1.3 2 0.9 2 0.9 2 0.9 - - - - - - 1 0.4 225 100 Full-time 1,834 93.9 29 1.5 23 1.2 10 0.5 16 0.8 10 0.5 4 0.2 4 0.2 4 0.2 19 1.0 1,953 100 All 2,047 94.0 31 1.4 26 1.2 12 0.6 18 0.8 12 0.6 4 0.2 4 0.2 4 0.2 20 0.9 2,178 100
ICU Part-time 126 82.9 4 2.6 2 1.3 3 2.0 4 2.6 7 4.6 2 1.3 1 0.7 - - 3 2.0 152 100 Full-time 1,750 87.2 50 2.5 58 2.9 32 1.6 32 1.6 21 1.0 16 0.8 15 0.7 5 0.2 29 1.4 2,008 100 All 1,876 86.9 54 2.5 60 2.8 35 1.6 36 1.7 28 1.3 18 0.8 16 0.7 5 0.2 32 1.5 2,160 100
PCC Part-time 272 92.8 3 1.0 5 1.7 3 1.0 2 0.7 2 0.7 2 0.7 - - - - 4 1.4 293 100 Full-time 960 90.7 13 1.2 26 2.5 14 1.3 8 0.8 10 0.9 7 0.7 1 0.1 3 0.3 17 1.6 1,059 100 All 1,232 91.1 16 1.2 31 2.3 17 1.3 10 0.7 12 0.9 9 0.7 1 0.1 3 0.2 21 1.6 1,352 100
ALL Part-time 2,020 92.1 26 1.2 36 1.6 29 1.3 18 0.8 22 1.0 11 0.5 1 0.0 5 0.2 25 1.1 2,193 100 Full-time 9,273 90.7 193 1.9 230 2.2 106 1.0 106 1.0 79 0.8 50 0.5 32 0.3 28 0.3 126 1.2 10,223 100 All 11,293 91.0 219 1.8 266 2.1 135 1.1 124 1.0 101 0.8 61 0.5 33 0.3 33 0.3 151 1.2 12,416 100
INDEPENDENT UNDERGRADUATES
None Less Than 5 Hours 5 to 10 Hours 11 to 15 Hours 16 to 20 Hours 21 to 25 Hours 26 to 30 Hours 31 to 35 Hours 36 to 40 Hours 40 or More Hours All
# % # % # % # % # % # % # % # % # % # % # %CCC Part-time 1,465 91.3 23 1.4 32 2.0 13 0.8 15 0.9 11 0.7 9 0.6 - - 5 0.3 32 2.0 1,605 100
Full-time 1,080 88.9 18 1.5 32 2.6 19 1.6 21 1.7 8 0.7 4 0.3 4 0.3 6 0.5 23 1.9 1,215 100 All 2,545 90.2 41 1.5 64 2.3 32 1.1 36 1.3 19 0.7 13 0.5 4 0.1 11 0.4 55 2.0 2,820 100
UC Part-time 64 90.1 - - - - 1 1.4 1 1.4 2 2.8 - - 2 2.8 - - 1 1.4 71 100 Full-time 321 90.7 6 1.7 10 2.8 7 2.0 - - 3 0.8 2 0.6 1 0.3 - - 4 1.1 354 100 All 385 90.6 6 1.4 10 2.4 8 1.9 1 0.2 5 1.2 2 0.5 3 0.7 - - 5 1.2 425 100
CSU Part-time 561 93.3 9 1.5 9 1.5 6 1.0 5 0.8 2 0.3 1 0.2 1 0.2 1 0.2 6 1.0 601 100 Full-time 1,057 92.0 16 1.4 28 2.4 13 1.1 11 1.0 5 0.4 - - 2 0.2 - - 17 1.5 1,149 100 All 1,618 92.5 25 1.4 37 2.1 19 1.1 16 0.9 7 0.4 1 0.1 3 0.2 1 0.1 23 1.3 1,750 100
ICU Part-time 154 95.7 - - 2 1.2 1 0.6 1 0.6 - - 1 0.6 - - - - 2 1.2 161 100 Full-time 311 88.6 7 2.0 13 3.7 8 2.3 4 1.1 1 0.3 1 0.3 - - 1 0.3 5 1.4 351 100 All 465 90.8 7 1.4 15 2.9 9 1.8 5 1.0 1 0.2 2 0.4 - - 1 0.2 7 1.4 512 100
PCC Part-time 530 91.5 7 1.2 7 1.2 4 0.7 8 1.4 4 0.7 3 0.5 1 0.2 4 0.7 11 1.9 579 100 Full-time 1,570 92.1 23 1.3 18 1.1 16 0.9 10 0.6 7 0.4 7 0.4 2 0.1 13 0.8 38 2.2 1,704 100 All 2,100 92.0 30 1.3 25 1.1 20 0.9 18 0.8 11 0.5 10 0.4 3 0.1 17 0.7 49 2.1 2,283 100
ALL Part-time 2,774 91.9 39 1.3 50 1.7 25 0.8 30 1.0 19 0.6 14 0.5 4 0.1 10 0.3 52 1.7 3,017 100 Full-time 4,339 90.9 70 1.5 101 2.1 63 1.3 46 1.0 24 0.5 14 0.3 9 0.2 20 0.4 87 1.8 4,773 100 All 7,113 91.3 109 1.4 151 1.9 88 1.1 76 1.0 43 0.6 28 0.4 13 0.2 30 0.4 139 1.8 7,790 100
ALL UNDERGRADUATESPart-time 4,794 92.0 65 1.2 86 1.7 54 1.0 48 0.9 41 0.8 25 0.5 5 0.1 15 0.3 77 1.5 5,210 100 Full-time 13,612 90.8 263 1.8 331 2.2 169 1.1 152 1.0 103 0.7 64 0.4 41 0.3 48 0.3 213 1.4 14,996 100 All 18,406 91.1 328 1.6 417 2.1 223 1.1 200 1.0 144 0.7 89 0.4 46 0.2 63 0.3 290 1.4 20,206 100
Source: California Student Aid Commission 103 2003-04 SEARS
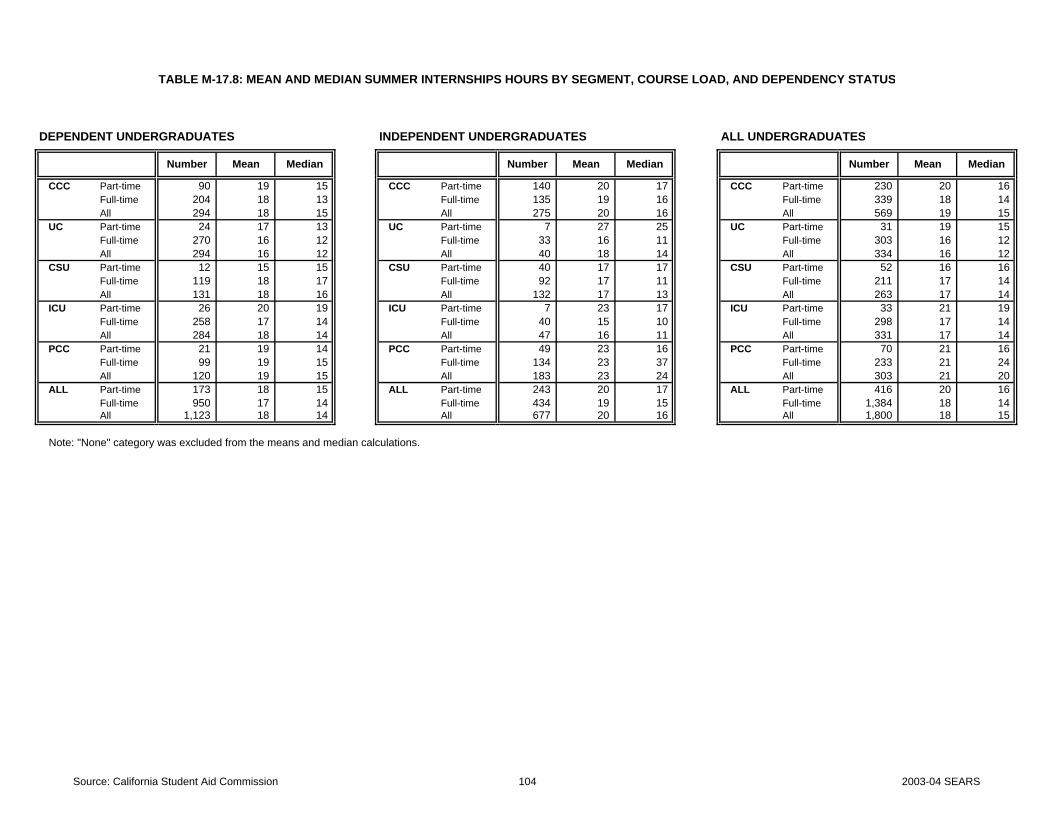
DEPENDENT UNDERGRADUATES INDEPENDENT UNDERGRADUATES ALL UNDERGRADUATES
CCC Part-time 90 19 15 CCC Part-time 140 20 17 CCC Part-time 230 20 16 Full-time 204 18 13 Full-time 135 19 16 Full-time 339 18 14 All 294 18 15 All 275 20 16 All 569 19 15
UC Part-time 24 17 13 UC Part-time 7 27 25 UC Part-time 31 19 15 Full-time 270 16 12 Full-time 33 16 11 Full-time 303 16 12 All 294 16 12 All 40 18 14 All 334 16 12
CSU Part-time 12 15 15 CSU Part-time 40 17 17 CSU Part-time 52 16 16 Full-time 119 18 17 Full-time 92 17 11 Full-time 211 17 14
All 131 18 16 All 132 17 13 All 263 17 14 ICU Part-time 26 20 19 ICU Part-time 7 23 17 ICU Part-time 33 21 19 Full-time 258 17 14 Full-time 40 15 10 Full-time 298 17 14
All 284 18 14 All 47 16 11 All 331 17 14 PCC Part-time 21 19 14 PCC Part-time 49 23 16 PCC Part-time 70 21 16 Full-time 99 19 15 Full-time 134 23 37 Full-time 233 21 24
All 120 19 15 All 183 23 24 All 303 21 20 ALL Part-time 173 18 15 ALL Part-time 243 20 17 ALL Part-time 416 20 16
Full-time 950 17 14 Full-time 434 19 15 Full-time 1,384 18 14 All 1,123 18 14 All 677 20 16 All 1,800 18 15
Note: "None" category was excluded from the means and median calculations.
TABLE M-17.8: MEAN AND MEDIAN SUMMER INTERNSHIPS HOURS BY SEGMENT, COURSE LOAD, AND DEPENDENCY STATUS
Number Mean Median Number MedianMean Median Number Mean
Source: California Student Aid Commission 104 2003-04 SEARS
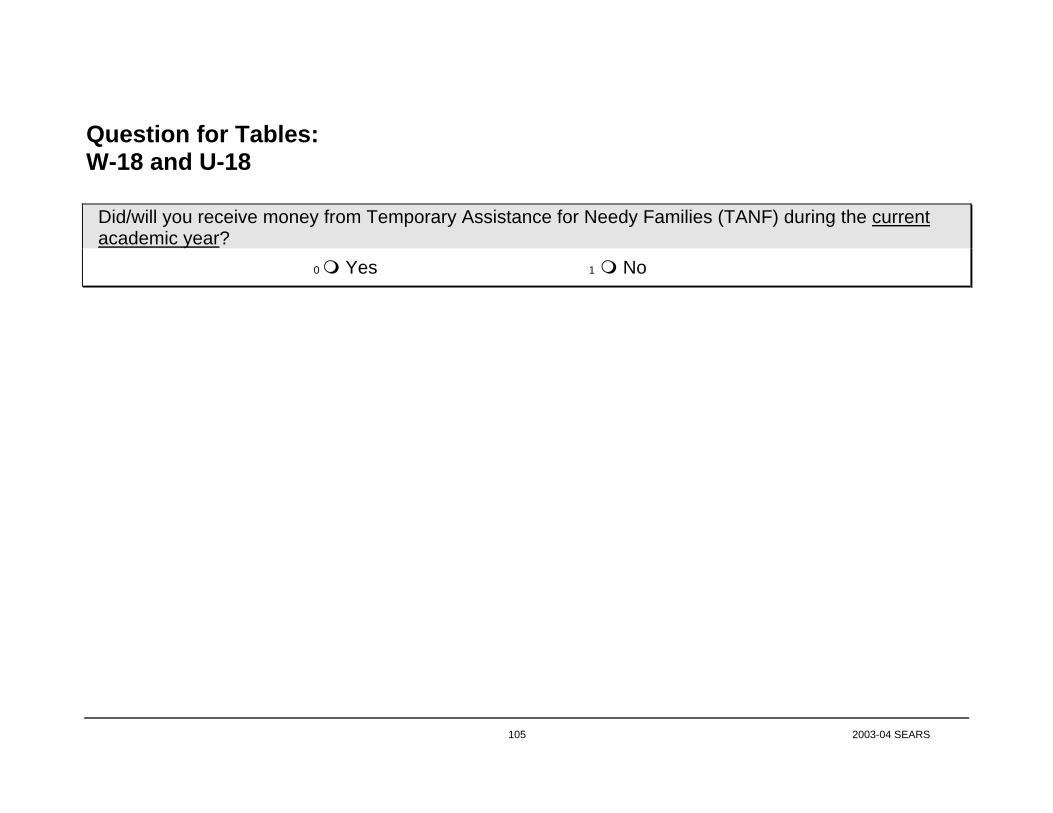
Question for Tables: W-18 and U-18
Did/will you receive money from Temporary Assistance for Needy Families (TANF) during the current
academic year? 0 Yes 1 No
105 2003-04 SEARS

TABLE W-18: WELFARE RECIPIENT STATUS BY SEGMENT, COURSE LOAD, AND DEPENDENCY STATUS
TANF Recipient Non-TANF RecipientDependent Independent All Dependent Independent All# % # % # % # % # % # % # %
CCC Part-time 10,371 1.1 24,318 2.6 34,689 3.8 363,338 39.4 523,193 56.8 886,531 96.2 921,220 100 Full-time 6,279 1.5 16,542 4.0 22,821 5.6 261,408 64.0 124,365 30.4 385,773 94.4 408,594 100 All 16,650 1.3 40,860 3.1 57,510 4.3 624,746 47.0 647,558 48.7 1,272,304 95.7 1,329,814 100
UC Part-time 478 1.5 70 0.2 548 1.7 27,466 86.2 3,840 12.1 31,306 98.3 31,855 100 Full-time 553 0.4 232 0.2 785 0.6 112,762 88.7 13,544 10.7 126,306 99.4 127,091 100 All 1,031 0.6 302 0.2 1,333 0.8 140,228 88.2 17,384 10.9 157,612 99.2 158,945 100
CSU Part-time 137 0.2 961 1.4 1,098 1.6 19,645 28.7 47,679 69.7 67,324 98.4 68,422 100 Full-time 996 0.4 1,810 0.8 2,806 1.2 149,724 65.0 77,895 33.8 227,619 98.8 230,425 100 All 1,133 0.4 2,770 0.9 3,904 1.3 169,369 56.7 125,574 42.0 294,943 98.7 298,847 100
ICU Part-time - - 32 0.3 32 0.3 4,419 35.1 8,155 64.7 12,575 99.7 12,607 100 Full-time 161 0.2 391 0.4 551 0.6 78,280 84.2 14,183 15.2 92,463 99.4 93,014 100 All 161 0.2 423 0.4 583 0.6 82,699 78.3 22,338 21.1 105,038 99.4 105,621 100
PCC Part-time 63 0.2 575 2.3 638 2.5 5,900 23.4 18,719 74.1 24,619 97.5 25,257 100 Full-time 350 0.5 3,102 4.7 3,452 5.2 21,503 32.3 41,720 62.6 63,223 94.8 66,675 100 All 413 0.4 3,677 4.0 4,090 4.4 27,403 29.8 60,439 65.7 87,842 95.6 91,932 100
ALL Part-time 11,049 1.0 25,956 2.5 37,005 3.5 420,768 39.7 601,587 56.8 1,022,355 96.5 1,059,360 100 Full-time 8,338 0.9 22,076 2.4 30,414 3.3 623,677 67.4 271,707 29.3 895,384 96.7 925,798 100 All 19,388 1.0 48,032 2.4 67,420 3.4 1,044,445 52.6 873,294 44.0 1,917,739 96.6 1,985,159 100
Total
Source: California Student Aid Commission 106 2003-04 SEARS

TABLE U-18: WELFARE RECIPIENT STATUS BY SEGMENT, COURSE LOAD, AND DEPENDENCY STATUS
TANF Recipient Non-TANF RecipientDependent Independent All Dependent Independent All# % # % # % # % # % # % # %
CCC Part-time 29 1.1 68 2.6 97 3.8 1,016 39.4 1,463 56.8 2,479 96.2 2,576 100 Full-time 52 1.5 137 4.0 189 5.6 2,165 64.0 1,030 30.4 3,195 94.4 3,384 100 All 81 1.4 205 3.4 286 4.8 3,181 53.4 2,493 41.8 5,674 95.2 5,960 100
UC Part-time 8 1.5 1 0.2 9 1.7 445 84.8 71 13.5 516 98.3 525 100 Full-time 14 0.4 6 0.2 20 0.6 2,972 88.9 352 10.5 3,324 99.4 3,344 100 All 22 0.6 7 0.2 29 0.7 3,417 88.3 423 10.9 3,840 99.3 3,869 100
CSU Part-time 1 0.1 14 1.8 15 1.9 216 27.1 565 71.0 781 98.1 796 100 Full-time 10 0.3 24 0.8 34 1.1 1,884 62.9 1,076 35.9 2,960 98.9 2,994 100 All 11 0.3 38 1.0 49 1.3 2,100 55.4 1,641 43.3 3,741 98.7 3,790 100
ICU Part-time - - 1 0.4 1 0.4 131 49.8 131 49.8 262 99.6 263 100 Full-time 4 0.2 8 0.4 12 0.6 1,749 85.3 290 14.1 2,039 99.4 2,051 100 All 4 0.2 9 0.4 13 0.6 1,880 81.2 421 18.2 2,301 99.4 2,314 100
PCC Part-time 6 0.7 26 3.2 32 4.0 267 33.1 507 62.9 774 96.0 806 100 Full-time 21 0.8 146 5.7 167 6.5 997 38.9 1,401 54.6 2,398 93.5 2,565 100 All 27 0.8 172 5.1 199 5.9 1,264 37.5 1,908 56.6 3,172 94.1 3,371 100
ALL Part-time 44 0.9 110 2.2 154 3.1 2,075 41.8 2,737 55.1 4,812 96.9 4,966 100 Full-time 101 0.7 321 2.2 422 2.9 9,767 68.1 4,149 28.9 13,916 97.1 14,338 100 All 145 0.8 431 2.2 576 3.0 11,842 61.3 6,886 35.7 18,728 97.0 19,304 100
Total
Source: California Student Aid Commission 107 2003-04 SEARS

Question for Tables: W-19, U-19, and M-19
What was your total income, if any, in calendar year 2003? If you are married, include your spouse's income also. Do NOT include any money received through student loans or grants, scholarships or fellowships. Include salaries, wages (including work-study and assistantship earnings), retirement benefits, public assistance, income from investments, child support, and all other income. 00 None 04 $3,000 to $3,999 08 $18,000 to $23,999 12 $60,000 to $71,999 01 Less than $1,000 05 $4,000 to $5,999 09 $24,000 to $35,999 13 $72,000 to $83,999 02 $1,000 to $1,999 06 $6,000 to $11,999 10 $36,000 to $47,999 14 $84,000 to $95,999 03 $2,000 to $2,999 07 $12,000 to $17,999 11 $48,000 to $59,999 15 $96,000 or more
108 2003-04 SEARS

DEPENDENT UNDERGRADUATES
None Less Than $1,000 $1,000 to $1,999 $2,000 to $2,999 $3,000 to $3,999 $4,000 to $5,999 $6,000 to $11,999 $12,000 to $17,999
# % # % # % # % # % # % # % # %CCC Part-time 87,616 23.4 25,748 6.9 23,603 6.3 23,960 6.4 24,676 6.6 27,536 7.3 77,245 20.6 48,636 13.0
Full-time 61,941 23.0 23,666 8.8 21,613 8.0 18,111 6.7 20,405 7.6 31,031 11.5 55,662 20.7 22,337 8.3 All 149,557 23.2 49,414 7.7 45,216 7.0 42,071 6.5 45,081 7.0 58,567 9.1 132,907 20.6 70,973 11.0
UC Part-time 9,678 35.5 3,701 13.6 3,265 12.0 2,004 7.3 1,847 6.8 2,475 9.1 2,687 9.8 849 3.1 Full-time 24,215 21.7 17,159 15.4 15,120 13.6 11,898 10.7 11,594 10.4 12,498 11.2 13,477 12.1 3,868 3.5 All 33,893 24.4 20,860 15.0 18,385 13.3 13,902 10.0 13,441 9.7 14,973 10.8 16,164 11.6 4,717 3.4
CSU Part-time 2,103 10.6 859 4.3 1,423 7.2 1,298 6.6 1,734 8.8 1,188 6.0 4,177 21.1 3,338 16.9 Full-time 24,502 16.0 12,332 8.1 12,603 8.2 13,224 8.7 11,978 7.8 19,371 12.7 33,269 21.8 15,994 10.5 All 26,605 15.4 13,191 7.6 14,026 8.1 14,522 8.4 13,712 7.9 20,559 11.9 37,446 21.7 19,332 11.2
ICU Part-time 897 18.1 581 11.7 604 12.2 505 10.2 355 7.1 963 19.4 335 6.8 342 6.9 Full-time 10,691 12.2 13,671 15.7 11,585 13.3 11,312 13.0 10,079 11.5 13,117 15.0 11,456 13.1 2,774 3.2 All 11,588 12.6 14,252 15.4 12,189 13.2 11,817 12.8 10,434 11.3 14,080 15.3 11,791 12.8 3,116 3.4
PCC Part-time 1,118 18.1 419 6.8 378 6.1 413 6.7 523 8.5 564 9.1 1,055 17.1 838 13.5 Full-time 5,949 26.2 2,033 8.9 1,018 4.5 1,375 6.0 1,847 8.1 2,529 11.1 3,781 16.6 2,415 10.6 All 7,067 24.4 2,452 8.5 1,396 4.8 1,788 6.2 2,370 8.2 3,093 10.7 4,836 16.7 3,253 11.2
ALL Part-time 101,413 23.4 31,308 7.2 29,274 6.8 28,181 6.5 29,136 6.7 32,725 7.6 85,499 19.7 54,003 12.5 Full-time 127,298 19.8 68,861 10.7 61,939 9.6 55,920 8.7 55,903 8.7 78,546 12.2 117,645 18.3 47,388 7.4 All 228,711 21.2 100,169 9.3 91,213 8.5 84,101 7.8 85,038 7.9 111,271 10.3 203,144 18.9 101,390 9.4
$18,000 to $23,999 $24,000 to $35,999 $36,000 to $47,999 $48,000 to $59,999 $60,000 to $71,999 $72,000 to $83,999 $84,000 to $95,999 $96,000 or More Total
# % # % # % # % # % # % # % # % # %CCC Part-time 18,238 4.9 13,589 3.6 2,503 0.7 - - 358 0.1 - - - - 1,431 0.4 375,138 100
Full-time 7,124 2.6 4,830 1.8 1,207 0.4 121 0.0 - - 121 0.0 121 0.0 845 0.3 269,134 100 All 25,362 3.9 18,419 2.9 3,711 0.6 121 0.0 358 0.1 121 0.0 121 0.0 2,276 0.4 644,273 100
UC Part-time 301 1.1 327 1.2 64 0.2 - - - - 27 0.1 70 0.3 - - 27,294 100 Full-time 1,114 1.0 409 0.4 76 0.1 - - 27 0.0 - - - - - - 111,454 100 All 1,415 1.0 736 0.5 140 0.1 - - 27 0.0 27 0.0 70 0.1 - - 138,749 100
CSU Part-time 1,485 7.5 1,723 8.7 333 1.7 137 0.7 - - - - - - - - 19,798 100 Full-time 4,909 3.2 3,406 2.2 793 0.5 211 0.1 159 0.1 - - - - 62 0.0 152,814 100 All 6,394 3.7 5,129 3.0 1,126 0.7 348 0.2 159 0.1 - - - - 62 0.0 172,612 100
ICU Part-time 147 3.0 58 1.2 177 3.6 - - - - - - - - - - 4,965 100 Full-time 1,425 1.6 591 0.7 245 0.3 86 0.1 116 0.1 58 0.1 70 0.1 34 0.0 87,310 100 All 1,571 1.7 649 0.7 422 0.5 86 0.1 116 0.1 58 0.1 70 0.1 34 0.0 92,275 100
PCC Part-time 317 5.1 212 3.4 97 1.6 146 2.4 55 0.9 25 0.4 - - 26 0.4 6,186 100 Full-time 947 4.2 444 2.0 229 1.0 107 0.5 39 0.2 10 0.0 12 0.1 9 0.0 22,745 100 All 1,264 4.4 656 2.3 326 1.1 253 0.9 94 0.3 36 0.1 12 0.0 35 0.1 28,931 100
ALL Part-time 20,487 4.7 15,908 3.7 3,174 0.7 283 0.1 413 0.1 52 0.0 70 0.0 1,456 0.3 433,382 100 Full-time 15,519 2.4 9,680 1.5 2,551 0.4 524 0.1 341 0.1 189 0.0 203 0.0 951 0.1 643,457 100 All 36,006 3.3 25,588 2.4 5,725 0.5 808 0.1 754 0.1 241 0.0 274 0.0 2,407 0.2 1,076,839 100
TABLE W-19A: STUDENT CALENDAR YEAR INCOME BY SEGMENT, COURSE LOAD, AND DEPENDENCY STATUS
Source: California Student Aid Commission 109 2003-04 SEARS

INDEPENDENT UNDERGRADUATES
None Less Than $1,000 $1,000 to $1,999 $2,000 to $2,999 $3,000 to $3,999 $4,000 to $5,999 $6,000 to $11,999 $12,000 to $17,999
# % # % # % # % # % # % # % # %CCC Part-time 51,497 9.0 11,801 2.1 10,728 1.9 9,298 1.6 7,510 1.3 11,801 2.1 64,371 11.3 52,570 9.2
Full-time 25,114 17.2 6,399 4.4 4,468 3.1 6,037 4.1 6,279 4.3 9,297 6.4 28,978 19.8 16,421 11.2 All 76,611 10.7 18,200 2.5 15,196 2.1 15,335 2.1 13,789 1.9 21,098 2.9 93,349 13.0 68,991 9.6
UC Part-time 378 9.8 453 11.7 107 2.8 259 6.7 178 4.6 294 7.6 867 22.4 221 5.7 Full-time 2,193 16.3 1,526 11.3 1,110 8.2 754 5.6 857 6.4 1,301 9.6 2,107 15.6 1,199 8.9 All 2,571 14.8 1,979 11.4 1,218 7.0 1,013 5.8 1,034 6.0 1,595 9.2 2,974 17.1 1,420 8.2
CSU Part-time 2,052 4.1 556 1.1 364 0.7 558 1.1 647 1.3 1,997 4.0 6,051 12.2 4,550 9.1 Full-time 7,385 9.1 2,474 3.1 2,438 3.0 2,561 3.2 2,978 3.7 6,145 7.6 14,187 17.5 10,209 12.6 All 9,438 7.2 3,031 2.3 2,802 2.1 3,118 2.4 3,625 2.8 8,142 6.2 20,238 15.5 14,759 11.3
ICU Part-time 320 3.3 7 0.1 52 0.5 188 1.9 52 0.5 259 2.7 364 3.8 733 7.6 Full-time 1,400 8.4 421 2.5 682 4.1 725 4.4 909 5.5 1,252 7.5 2,000 12.0 2,402 14.4 All 1,720 6.5 427 1.6 734 2.8 914 3.5 962 3.7 1,511 5.7 2,363 9.0 3,135 11.9
PCC Part-time 1,136 5.4 310 1.5 501 2.4 449 2.1 145 0.7 436 2.1 3,383 16.2 1,433 6.9 Full-time 4,785 9.8 1,612 3.3 858 1.8 964 2.0 948 1.9 1,904 3.9 5,046 10.3 5,764 11.8 All 5,921 8.5 1,922 2.8 1,359 2.0 1,413 2.0 1,093 1.6 2,339 3.4 8,428 12.1 7,196 10.3
ALL Part-time 55,383 8.4 13,127 2.0 11,753 1.8 10,752 1.6 8,532 1.3 14,786 2.3 75,035 11.4 59,506 9.1 Full-time 40,877 13.3 12,432 4.1 9,556 3.1 11,041 3.6 11,971 3.9 19,900 6.5 52,318 17.1 35,995 11.8 All 96,261 10.0 25,560 2.7 21,308 2.2 21,793 2.3 20,503 2.1 34,686 3.6 127,353 13.2 95,502 9.9
$18,000 to $23,999 $24,000 to $35,999 $36,000 to $47,999 $48,000 to $59,999 $60,000 to $71,999 $72,000 to $83,999 $84,000 to $95,999 $96,000 or More Total
# % # % # % # % # % # % # % # % # %CCC Part-time 56,146 9.8 84,040 14.7 52,570 9.2 51,854 9.1 29,682 5.2 20,384 3.6 17,166 3.0 40,411 7.1 571,829 100
Full-time 10,746 7.3 12,919 8.8 5,675 3.9 4,950 3.4 2,656 1.8 2,415 1.7 1,087 0.7 2,898 2.0 146,339 100 All 66,892 9.3 96,959 13.5 58,245 8.1 56,804 7.9 32,338 4.5 22,799 3.2 18,253 2.5 43,309 6.0 718,168 100
UC Part-time 286 7.4 389 10.0 264 6.8 - - - - - - 110 2.8 66 1.7 3,871 100 Full-time 1,029 7.6 667 4.9 276 2.0 37 0.3 133 1.0 220 1.6 40 0.3 38 0.3 13,487 100 All 1,315 7.6 1,056 6.1 540 3.1 37 0.2 133 0.8 220 1.3 149 0.9 104 0.6 17,357 100
CSU Part-time 4,686 9.4 6,013 12.1 4,776 9.6 5,496 11.1 3,244 6.5 3,487 7.0 1,540 3.1 3,713 7.5 49,730 100 Full-time 8,499 10.5 8,598 10.6 4,731 5.8 3,115 3.8 2,459 3.0 1,394 1.7 937 1.2 2,975 3.7 81,086 100 All 13,186 10.1 14,611 11.2 9,506 7.3 8,612 6.6 5,703 4.4 4,881 3.7 2,477 1.9 6,687 5.1 130,816 100
ICU Part-time 735 7.6 1,419 14.7 2,026 20.9 1,005 10.4 569 5.9 738 7.6 195 2.0 1,017 10.5 9,680 100 Full-time 1,344 8.1 1,631 9.8 1,381 8.3 594 3.6 596 3.6 189 1.1 393 2.4 708 4.3 16,625 100 All 2,079 7.9 3,050 11.6 3,406 12.9 1,600 6.1 1,165 4.4 927 3.5 588 2.2 1,725 6.6 26,305 100
PCC Part-time 1,462 7.0 3,917 18.7 2,148 10.3 965 4.6 754 3.6 1,041 5.0 499 2.4 2,317 11.1 20,893 100 Full-time 4,444 9.1 7,499 15.4 4,624 9.5 3,575 7.3 1,611 3.3 1,659 3.4 1,137 2.3 2,337 4.8 48,767 100 All 5,906 8.5 11,415 16.4 6,772 9.7 4,540 6.5 2,365 3.4 2,700 3.9 1,636 2.3 4,653 6.7 69,660 100
ALL Part-time 63,314 9.7 95,778 14.6 61,783 9.4 59,321 9.0 34,249 5.2 25,650 3.9 19,509 3.0 47,523 7.2 656,003 100 Full-time 26,063 8.5 31,313 10.2 16,687 5.4 12,272 4.0 7,455 2.4 5,875 1.9 3,594 1.2 8,955 2.9 306,303 100 All 89,377 9.3 127,091 13.2 78,470 8.2 71,593 7.4 41,703 4.3 31,526 3.3 23,103 2.4 56,479 5.9 962,306 100
TABLE W-19B: STUDENT CALENDAR YEAR INCOME BY SEGMENT, COURSE LOAD, AND DEPENDENCY STATUS
Source: California Student Aid Commission 110 2003-04 SEARS

ALL UNDERGRADUATES
None Less Than $1,000 $1,000 to $1,999 $2,000 to $2,999 $3,000 to $3,999 $4,000 to $5,999 $6,000 to $11,999 $12,000 to $17,999
# % # % # % # % # % # % # % # %Part-time 156,796 14.4 44,435 4.1 41,027 3.8 38,933 3.6 37,668 3.5 47,512 4.4 160,534 14.7 113,509 10.4 Full-time 168,175 17.7 81,293 8.6 71,495 7.5 66,961 7.1 67,873 7.1 98,446 10.4 169,962 17.9 83,383 8.8 All 324,972 15.9 125,728 6.2 112,522 5.5 105,894 5.2 105,541 5.2 145,957 7.2 330,496 16.2 196,892 9.7
$18,000 to $23,999 $24,000 to $35,999 $36,000 to $47,999 $48,000 to $59,999 $60,000 to $71,999 $72,000 to $83,999 $84,000 to $95,999 $96,000 or More Total
# % # % # % # % # % # % # % # % # %Part-time 83,802 7.7 111,686 10.3 64,958 6.0 59,604 5.5 34,661 3.2 25,702 2.4 19,579 1.8 48,980 4.5 1,089,385 100 Full-time 41,581 4.4 40,993 4.3 19,237 2.0 12,796 1.3 7,796 0.8 6,064 0.6 3,797 0.4 9,906 1.0 949,760 100 All 125,383 6.1 152,679 7.5 84,195 4.1 72,400 3.6 42,457 2.1 31,766 1.6 23,377 1.1 58,886 2.9 2,039,145 100
TABLE W-19C: STUDENT CALENDAR YEAR INCOME BY SEGMENT, COURSE LOAD, AND DEPENDENCY STATUS
Source: California Student Aid Commission 111 2003-04 SEARS

DEPENDENT UNDERGRADUATES
None Less Than $1,000 $1,000 to $1,999 $2,000 to $2,999 $3,000 to $3,999 $4,000 to $5,999 $6,000 to $11,999 $12,000 to $17,999
# % # % # % # % # % # % # % # %CCC Part-time 245 23.4 72 6.9 66 6.3 67 6.4 69 6.6 77 7.3 216 20.6 136 13.0
Full-time 513 23.0 196 8.8 179 8.0 150 6.7 169 7.6 257 11.5 461 20.7 185 8.3 All 758 23.1 268 8.2 245 7.5 217 6.6 238 7.3 334 10.2 677 20.7 321 9.8
UC Part-time 153 34.5 61 13.8 53 12.0 33 7.4 30 6.8 41 9.3 43 9.7 13 2.9 Full-time 631 21.5 459 15.6 397 13.5 312 10.6 304 10.3 330 11.2 361 12.3 103 3.5 All 784 23.2 520 15.4 450 13.3 345 10.2 334 9.9 371 11.0 404 11.9 116 3.4
CSU Part-time 26 11.9 10 4.6 15 6.8 16 7.3 19 8.7 15 6.8 47 21.5 38 17.4 Full-time 296 15.5 167 8.7 170 8.9 167 8.7 163 8.5 253 13.2 399 20.9 182 9.5 All 322 15.1 177 8.3 185 8.7 183 8.6 182 8.5 268 12.6 446 20.9 220 10.3
ICU Part-time 19 12.9 24 16.3 24 16.3 18 12.2 13 8.8 27 18.4 8 5.4 8 5.4 Full-time 227 11.7 302 15.5 279 14.3 255 13.1 219 11.2 302 15.5 250 12.8 59 3.0 All 246 11.7 326 15.6 303 14.5 273 13.0 232 11.1 329 15.7 258 12.3 67 3.2
PCC Part-time 62 22.1 21 7.5 24 8.6 14 5.0 17 6.1 23 8.2 52 18.6 32 11.4 Full-time 264 25.3 89 8.5 52 5.0 60 5.7 71 6.8 103 9.9 192 18.4 115 11.0 All 326 24.6 110 8.3 76 5.7 74 5.6 88 6.6 126 9.5 244 18.4 147 11.1
ALL Part-time 505 23.6 188 8.8 182 8.5 148 6.9 148 6.9 183 8.6 366 17.1 227 10.6 Full-time 1,931 19.2 1,213 12.0 1,077 10.7 944 9.4 926 9.2 1,245 12.4 1,663 16.5 644 6.4 All 2,436 19.9 1,401 11.5 1,259 10.3 1,092 8.9 1,074 8.8 1,428 11.7 2,029 16.6 871 7.1
$18,000 to $23,999 $24,000 to $35,999 $36,000 to $47,999 $48,000 to $59,999 $60,000 to $71,999 $72,000 to $83,999 $84,000 to $95,999 $96,000 or More Total
# % # % # % # % # % # % # % # % # %CCC Part-time 51 4.9 38 3.6 7 0.7 - - 1 0.1 - - - - 4 0.4 1,049 100
Full-time 59 2.6 40 1.8 10 0.4 1 0.0 - - 1 0.0 1 0.0 7 0.3 2,229 100 All 110 3.4 78 2.4 17 0.5 1 0.0 1 0.0 1 0.0 1 0.0 11 0.3 3,278 100
UC Part-time 6 1.4 6 1.4 2 0.5 - - - - 1 0.2 1 0.2 - - 443 100 Full-time 29 1.0 11 0.4 2 0.1 - - 1 0.0 - - - - - - 2,940 100 All 35 1.0 17 0.5 4 0.1 - - 1 0.0 1 0.0 1 0.0 - - 3,383 100
CSU Part-time 13 5.9 15 6.8 4 1.8 1 0.5 - - - - - - - - 219 100 Full-time 65 3.4 36 1.9 8 0.4 4 0.2 1 0.1 - - - - 1 0.1 1,912 100 All 78 3.7 51 2.4 12 0.6 5 0.2 1 0.0 - - - - 1 0.0 2,131 100
ICU Part-time 3 2.0 1 0.7 2 1.4 - - - - - - - - - - 147 100 Full-time 28 1.4 14 0.7 6 0.3 2 0.1 2 0.1 1 0.1 1 0.1 1 0.1 1,948 100 All 31 1.5 15 0.7 8 0.4 2 0.1 2 0.1 1 0.0 1 0.0 1 0.0 2,095 100
PCC Part-time 12 4.3 12 4.3 5 1.8 2 0.7 1 0.4 1 0.4 - - 2 0.7 280 100 Full-time 50 4.8 25 2.4 11 1.1 7 0.7 2 0.2 1 0.1 1 0.1 1 0.1 1,044 100 All 62 4.7 37 2.8 16 1.2 9 0.7 3 0.2 2 0.2 1 0.1 3 0.2 1,324 100
ALL Part-time 85 4.0 72 3.4 20 0.9 3 0.1 2 0.1 2 0.1 1 0.0 6 0.3 2,138 100 Full-time 231 2.3 126 1.3 37 0.4 14 0.1 6 0.1 3 0.0 3 0.0 10 0.1 10,073 100 All 316 2.6 198 1.6 57 0.5 17 0.1 8 0.1 5 0.0 4 0.0 16 0.1 12,211 100
TABLE U-19A: STUDENT CALENDAR YEAR INCOME BY SEGMENT, COURSE LOAD, AND DEPENDENCY STATUS
Source: California Student Aid Commission 112 2003-04 SEARS

INDEPENDENT UNDERGRADUATES
None Less Than $1,000 $1,000 to $1,999 $2,000 to $2,999 $3,000 to $3,999 $4,000 to $5,999 $6,000 to $11,999 $12,000 to $17,999
# % # % # % # % # % # % # % # %CCC Part-time 144 9.0 33 2.1 30 1.9 26 1.6 21 1.3 33 2.1 180 11.3 147 9.2
Full-time 208 17.2 53 4.4 37 3.1 50 4.1 52 4.3 77 6.4 240 19.8 136 11.2 All 352 12.5 86 3.1 67 2.4 76 2.7 73 2.6 110 3.9 420 14.9 283 10.1
UC Part-time 6 8.5 8 11.3 2 2.8 4 5.6 3 4.2 6 8.5 14 19.7 5 7.0 Full-time 59 16.9 39 11.1 28 8.0 19 5.4 22 6.3 34 9.7 54 15.4 31 8.9 All 65 15.4 47 11.2 30 7.1 23 5.5 25 5.9 40 9.5 68 16.2 36 8.6
CSU Part-time 24 4.0 8 1.3 7 1.2 7 1.2 8 1.3 23 3.9 68 11.4 57 9.6 Full-time 94 8.4 39 3.5 36 3.2 36 3.2 43 3.8 86 7.7 201 18.0 146 13.1 All 118 6.9 47 2.7 43 2.5 43 2.5 51 3.0 109 6.4 269 15.7 203 11.9
ICU Part-time 9 5.7 1 0.6 1 0.6 3 1.9 1 0.6 4 2.5 7 4.4 13 8.2 Full-time 32 9.4 9 2.6 15 4.4 15 4.4 18 5.3 26 7.6 42 12.3 48 14.1 All 41 8.2 10 2.0 16 3.2 18 3.6 19 3.8 30 6.0 49 9.8 61 12.2
PCC Part-time 54 9.4 16 2.8 17 3.0 13 2.3 9 1.6 23 4.0 64 11.2 58 10.1 Full-time 210 12.4 63 3.7 43 2.5 47 2.8 49 2.9 88 5.2 226 13.3 200 11.8 All 264 11.6 79 3.5 60 2.6 60 2.6 58 2.6 111 4.9 290 12.8 258 11.4
ALL Part-time 237 7.9 66 2.2 57 1.9 53 1.8 42 1.4 89 3.0 333 11.1 280 9.3 Full-time 603 12.8 203 4.3 159 3.4 167 3.5 184 3.9 311 6.6 763 16.2 561 11.9 All 840 10.9 269 3.5 216 2.8 220 2.9 226 2.9 400 5.2 1,096 14.2 841 10.9
$18,000 to $23,999 $24,000 to $35,999 $36,000 to $47,999 $48,000 to $59,999 $60,000 to $71,999 $72,000 to $83,999 $84,000 to $95,999 $96,000 or More Total
# % # % # % # % # % # % # % # % # %CCC Part-time 157 9.8 235 14.7 147 9.2 145 9.1 83 5.2 57 3.6 48 3.0 113 7.1 1,599 100
Full-time 89 7.3 107 8.8 47 3.9 41 3.4 22 1.8 20 1.7 9 0.7 24 2.0 1,212 100 All 246 8.8 342 12.2 194 6.9 186 6.6 105 3.7 77 2.7 57 2.0 137 4.9 2,811 100
UC Part-time 5 7.0 8 11.3 5 7.0 - - - - - - 3 4.2 2 2.8 71 100 Full-time 28 8.0 17 4.9 7 2.0 1 0.3 4 1.1 5 1.4 1 0.3 1 0.3 350 100 All 33 7.8 25 5.9 12 2.9 1 0.2 4 1.0 5 1.2 4 1.0 3 0.7 421 100
CSU Part-time 54 9.1 76 12.8 59 9.9 59 9.9 37 6.2 38 6.4 20 3.4 50 8.4 595 100 Full-time 111 9.9 114 10.2 62 5.6 46 4.1 35 3.1 19 1.7 14 1.3 35 3.1 1,117 100 All 165 9.6 190 11.1 121 7.1 105 6.1 72 4.2 57 3.3 34 2.0 85 5.0 1,712 100
ICU Part-time 13 8.2 26 16.4 25 15.7 15 9.4 10 6.3 12 7.5 4 2.5 15 9.4 159 100 Full-time 29 8.5 33 9.7 26 7.6 12 3.5 12 3.5 4 1.2 7 2.1 13 3.8 341 100 All 42 8.4 59 11.8 51 10.2 27 5.4 22 4.4 16 3.2 11 2.2 28 5.6 500 100
PCC Part-time 53 9.2 75 13.1 54 9.4 33 5.8 20 3.5 22 3.8 12 2.1 50 8.7 573 100 Full-time 164 9.7 236 13.9 115 6.8 91 5.4 42 2.5 37 2.2 34 2.0 51 3.0 1,696 100 All 217 9.6 311 13.7 169 7.4 124 5.5 62 2.7 59 2.6 46 2.0 101 4.5 2,269 100
ALL Part-time 282 9.4 420 14.0 290 9.7 252 8.4 150 5.0 129 4.3 87 2.9 230 7.7 2,997 100 Full-time 421 8.9 507 10.8 257 5.4 191 4.1 115 2.4 85 1.8 65 1.4 124 2.6 4,716 100 All 703 9.1 927 12.0 547 7.1 443 5.7 265 3.4 214 2.8 152 2.0 354 4.6 7,713 100
TABLE U-19B: STUDENT CALENDAR YEAR INCOME BY SEGMENT, COURSE LOAD, AND DEPENDENCY STATUS
Source: California Student Aid Commission 113 2003-04 SEARS

ALL UNDERGRADUATES
None Less Than $1,000 $1,000 to $1,999 $2,000 to $2,999 $3,000 to $3,999 $4,000 to $5,999 $6,000 to $11,999 $12,000 to $17,999
# % # % # % # % # % # % # % # %Part-time 742 14.4 254 4.9 239 4.7 201 3.9 190 3.7 272 5.3 699 13.6 507 9.9 Full-time 2,534 17.1 1,416 9.6 1,236 8.4 1,111 7.5 1,110 7.5 1,556 10.5 2,426 16.4 1,205 8.1 All 3,276 16.4 1,670 8.4 1,475 7.4 1,312 6.6 1,300 6.5 1,828 9.2 3,125 15.7 1,712 8.6
$18,000 to $23,999 $24,000 to $35,999 $36,000 to $47,999 $48,000 to $59,999 $60,000 to $71,999 $72,000 to $83,999 $84,000 to $95,999 $96,000 or More Total
# % # % # % # % # % # % # % # % # %Part-time 367 7.1 492 9.6 310 6.0 255 5.0 152 3.0 131 2.6 88 1.7 236 4.6 5,135 100 Full-time 652 4.4 633 4.3 294 2.0 205 1.4 121 0.8 88 0.6 68 0.5 134 0.9 14,789 100 All 1,019 5.1 1,125 5.6 604 3.0 460 2.3 273 1.4 219 1.1 156 0.8 370 1.9 19,924 100
TABLE U-19C: STUDENT CALENDAR YEAR INCOME BY SEGMENT, COURSE LOAD, AND DEPENDENCY STATUS
Source: California Student Aid Commission 114 2003-04 SEARS
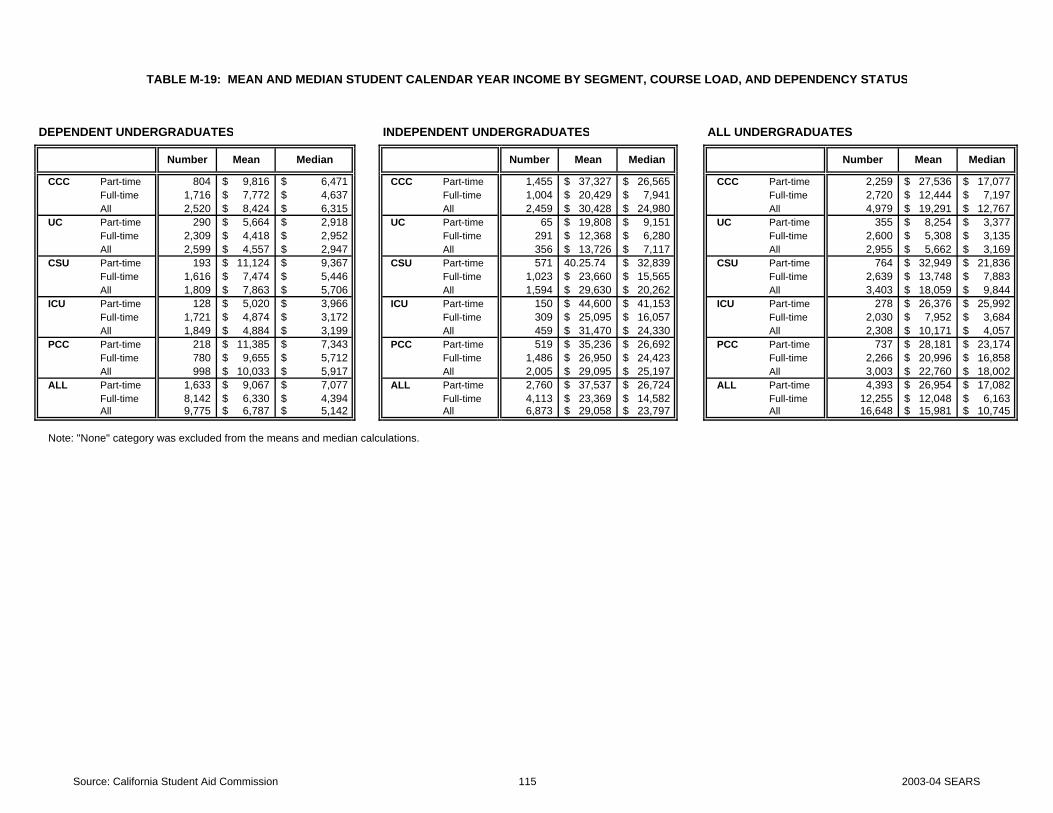
DEPENDENT UNDERGRADUATES INDEPENDENT UNDERGRADUATES ALL UNDERGRADUATES
CCC Part-time 804 9,816$ 6,471$ CCC Part-time 1,455 37,327$ 26,565$ CCC Part-time 2,259 27,536$ 17,077$ Full-time 1,716 7,772$ 4,637$ Full-time 1,004 20,429$ 7,941$ Full-time 2,720 12,444$ 7,197$ All 2,520 8,424$ 6,315$ All 2,459 30,428$ 24,980$ All 4,979 19,291$ 12,767$
UC Part-time 290 5,664$ 2,918$ UC Part-time 65 19,808$ 9,151$ UC Part-time 355 8,254$ 3,377$ Full-time 2,309 4,418$ 2,952$ Full-time 291 12,368$ 6,280$ Full-time 2,600 5,308$ 3,135$ All 2,599 4,557$ 2,947$ All 356 13,726$ 7,117$ All 2,955 5,662$ 3,169$
CSU Part-time 193 11,124$ 9,367$ CSU Part-time 571 40.25.74 32,839$ CSU Part-time 764 32,949$ 21,836$ Full-time 1,616 7,474$ 5,446$ Full-time 1,023 23,660$ 15,565$ Full-time 2,639 13,748$ 7,883$
All 1,809 7,863$ 5,706$ All 1,594 29,630$ 20,262$ All 3,403 18,059$ 9,844$ ICU Part-time 128 5,020$ 3,966$ ICU Part-time 150 44,600$ 41,153$ ICU Part-time 278 26,376$ 25,992$ Full-time 1,721 4,874$ 3,172$ Full-time 309 25,095$ 16,057$ Full-time 2,030 7,952$ 3,684$
All 1,849 4,884$ 3,199$ All 459 31,470$ 24,330$ All 2,308 10,171$ 4,057$ PCC Part-time 218 11,385$ 7,343$ PCC Part-time 519 35,236$ 26,692$ PCC Part-time 737 28,181$ 23,174$ Full-time 780 9,655$ 5,712$ Full-time 1,486 26,950$ 24,423$ Full-time 2,266 20,996$ 16,858$
All 998 10,033$ 5,917$ All 2,005 29,095$ 25,197$ All 3,003 22,760$ 18,002$ ALL Part-time 1,633 9,067$ 7,077$ ALL Part-time 2,760 37,537$ 26,724$ ALL Part-time 4,393 26,954$ 17,082$
Full-time 8,142 6,330$ 4,394$ Full-time 4,113 23,369$ 14,582$ Full-time 12,255 12,048$ 6,163$ All 9,775 6,787$ 5,142$ All 6,873 29,058$ 23,797$ All 16,648 15,981$ 10,745$
Note: "None" category was excluded from the means and median calculations.
TABLE M-19: MEAN AND MEDIAN STUDENT CALENDAR YEAR INCOME BY SEGMENT, COURSE LOAD, AND DEPENDENCY STATUS
Number Mean Median Number MedianMean Median Number Mean
Source: California Student Aid Commission 115 2003-04 SEARS
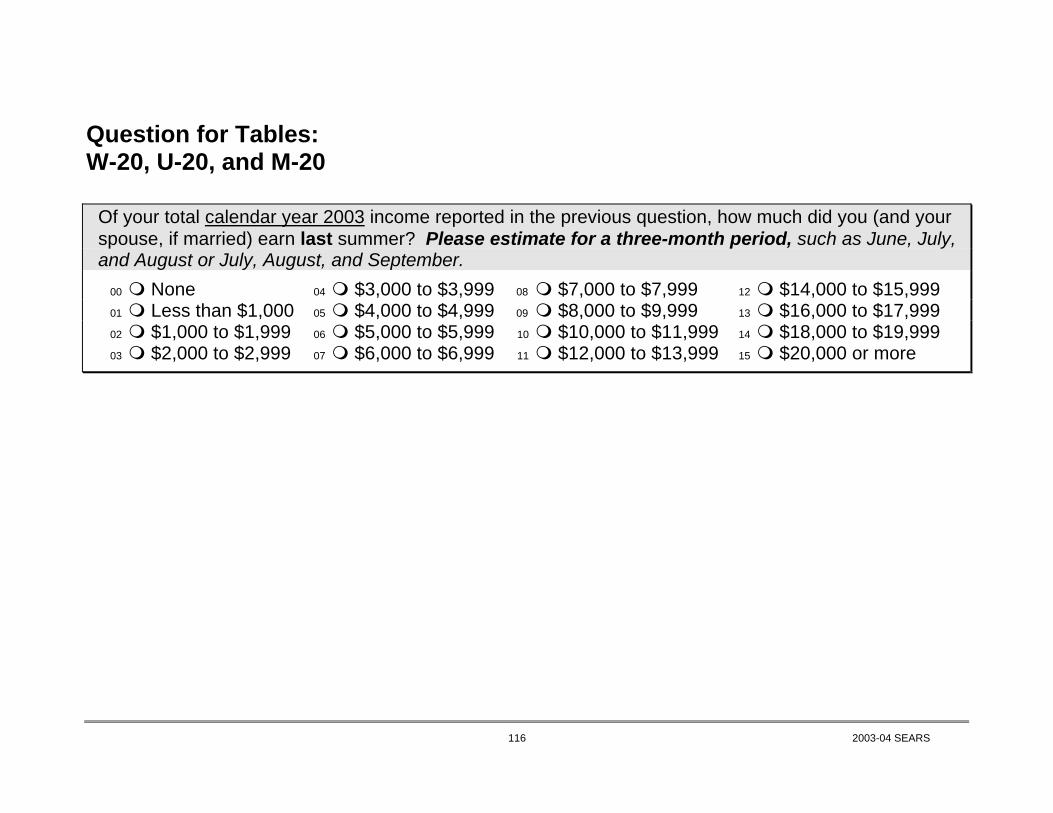
Question for Tables: W-20, U-20, and M-20
Of your total calendar year 2003 income reported in the previous question, how much did you (and your
spouse, if married) earn last summer? Please estimate for a three-month period, such as June, July, and August or July, August, and September.
00 None 04 $3,000 to $3,999 08 $7,000 to $7,999 12 $14,000 to $15,999 01 Less than $1,000 05 $4,000 to $4,999 09 $8,000 to $9,999 13 $16,000 to $17,999 02 $1,000 to $1,999 06 $5,000 to $5,999 10 $10,000 to $11,999 14 $18,000 to $19,999 03 $2,000 to $2,999 07 $6,000 to $6,999 11 $12,000 to $13,999 15 $20,000 or more
116 2003-04 SEARS

DEPENDENT UNDERGRADUATES
None Less Than $1,000 $1,000 to $1,999 $2,000 to $2,999 $3,000 to $3,999 $4,000 to $4,999 $5,000 to $5,999 $6,000 to $6,999
# % # % # % # % # % # % # % # %CCC Part-time 128,742 34.8 37,192 10.1 41,483 11.2 50,782 13.7 47,921 13.0 20,027 5.4 15,020 4.1 7,510 2.0
Full-time 89,832 33.9 37,309 14.1 39,966 15.1 34,412 13.0 28,495 10.7 12,799 4.8 6,762 2.5 5,071 1.9 All 218,574 34.4 74,501 11.7 81,449 12.8 85,194 13.4 76,416 12.0 32,826 5.2 21,782 3.4 12,581 2.0
UC Part-time 12,032 44.6 5,447 20.2 3,413 12.7 3,046 11.3 1,214 4.5 663 2.5 351 1.3 189 0.7 Full-time 35,691 32.7 20,977 19.2 17,986 16.5 14,625 13.4 9,866 9.0 4,056 3.7 2,283 2.1 1,466 1.3 All 47,723 35.1 26,424 19.4 21,399 15.7 17,671 13.0 11,080 8.1 4,719 3.5 2,634 1.9 1,655 1.2
CSU Part-time 3,372 17.1 2,699 13.7 2,311 11.7 3,681 18.7 3,017 15.3 1,785 9.1 678 3.4 832 4.2 Full-time 37,099 24.8 21,961 14.7 24,539 16.4 23,337 15.6 17,805 11.9 8,718 5.8 5,546 3.7 5,288 3.5 All 40,471 23.9 24,660 14.6 26,850 15.9 27,018 16.0 20,822 12.3 10,503 6.2 6,224 3.7 6,120 3.6
ICU Part-time 1,462 29.8 616 12.5 505 10.3 638 13.0 668 13.6 414 8.4 191 3.9 52 1.1 Full-time 19,680 22.8 16,768 19.4 15,552 18.0 13,520 15.7 10,670 12.4 4,267 4.9 2,447 2.8 1,349 1.6 All 21,142 23.2 17,384 19.1 16,057 17.6 14,158 15.5 11,338 12.4 4,681 5.1 2,637 2.9 1,401 1.5
PCC Part-time 1,584 25.8 645 10.5 1,215 19.8 577 9.4 477 7.8 464 7.6 117 1.9 348 5.7 Full-time 8,465 38.8 2,658 12.2 2,496 11.4 3,145 14.4 2,039 9.4 727 3.3 433 2.0 668 3.1 All 10,049 36.0 3,303 11.8 3,710 13.3 3,722 13.3 2,516 9.0 1,191 4.3 550 2.0 1,016 3.6
ALL Part-time 147,192 34.5 46,599 10.9 48,927 11.5 58,723 13.7 53,296 12.5 23,353 5.5 16,357 3.8 8,931 2.1 Full-time 190,767 30.2 99,673 15.8 100,539 15.9 89,039 14.1 68,875 10.9 30,568 4.8 17,470 2.8 13,842 2.2 All 337,959 31.9 146,272 13.8 149,465 14.1 147,763 13.9 122,171 11.5 53,920 5.1 33,827 3.2 22,773 2.1
$7,000 to $7,999 $8,000 to $9,999 $10,000 to $11,999 $12,000 to $13,999 $14,000 to $15,999 $16,000 to17,999 $18,000 to $19,999 $20,000 or More Total
# % # % # % # % # % # % # % # % # %CCC Part-time 7,152 1.9 4,291 1.2 1,788 0.5 2,861 0.8 715 0.2 715 0.2 - - 3,219 0.9 369,419 100
Full-time 1,932 0.7 2,656 1.0 1,690 0.6 1,449 0.5 724 0.3 483 0.2 483 0.2 1,207 0.5 265,271 100All 9,084 1.4 6,948 1.1 3,479 0.5 4,310 0.7 1,440 0.2 1,198 0.2 483 0.1 4,426 0.7 634,690 100
UC Part-time 107 0.4 347 1.3 37 0.1 37 0.1 40 0.1 - - - - 27 0.1 26,949 100Full-time 924 0.8 734 0.7 215 0.2 218 0.2 38 0.0 - - 38 0.0 - - 109,116 100All 1,031 0.8 1,081 0.8 252 0.2 255 0.2 78 0.1 - - 38 0.0 27 0.0 136,066 100
CSU Part-time 689 3.5 158 0.8 62 0.3 185 0.9 53 0.3 137 0.7 - - 19 0.1 19,676 100Full-time 1,975 1.3 1,531 1.0 1,067 0.7 397 0.3 - - 89 0.1 - - 358 0.2 149,709 100All 2,663 1.6 1,690 1.0 1,129 0.7 581 0.3 53 0.0 226 0.1 - - 377 0.2 169,386 100
ICU Part-time 96 2.0 238 4.8 - - - - - - 32 0.7 - - - - 4,912 100Full-time 394 0.5 571 0.7 507 0.6 273 0.3 126 0.1 - - - - 111 0.1 86,236 100All 491 0.5 809 0.9 507 0.6 273 0.3 126 0.1 32 0.0 - - 111 0.1 91,149 100
PCC Part-time 87 1.4 126 2.0 130 2.1 45 0.7 259 4.2 - - - - 71 1.2 6,142 100Full-time 117 0.5 376 1.7 197 0.9 151 0.7 35 0.2 78 0.4 73 0.3 147 0.7 21,805 100All 203 0.7 502 1.8 327 1.2 196 0.7 293 1.0 78 0.3 73 0.3 218 0.8 27,947 100
ALL Part-time 8,131 1.9 5,160 1.2 2,017 0.5 3,127 0.7 1,066 0.2 884 0.2 - - 3,335 0.8 427,099 100Full-time 5,342 0.8 5,869 0.9 3,676 0.6 2,488 0.4 924 0.1 650 0.1 594 0.1 1,823 0.3 632,138 100All 13,473 1.3 11,029 1.0 5,694 0.5 5,616 0.5 1,990 0.2 1,534 0.1 594 0.1 5,158 0.5 1,059,237 100
TABLE W-20A: STUDENT SUMMER INCOME BY SEGMENT, COURSE LOAD, AND DEPENDENCY STATUS
Source: California Student Aid Commission 117 2003-04 SEARS

INDEPENDENT UNDERGRADUATES
None Less Than $1,000 $1,000 to $1,999 $2,000 to $2,999 $3,000 to $3,999 $4,000 to $4,999 $5,000 to $5,999 $6,000 to $6,999
# % # % # % # % # % # % # % # %CCC Part-time 92,265 16.8 21,457 3.9 30,397 5.5 42,199 7.7 43,987 8.0 30,755 5.6 28,967 5.3 33,258 6.1
Full-time 41,898 29.5 13,644 9.6 14,248 10.0 13,523 9.5 14,489 10.2 8,573 6.0 5,554 3.9 7,607 5.4 All 134,163 19.4 35,101 5.1 44,645 6.5 55,722 8.1 58,476 8.5 39,328 5.7 34,521 5.0 40,865 5.9
UC Part-time 672 17.9 577 15.4 722 19.2 538 14.3 112 3.0 222 5.9 248 6.6 - - Full-time 4,029 30.1 1,833 13.7 1,657 12.4 1,347 10.1 1,147 8.6 776 5.8 497 3.7 678 5.1 All 4,701 27.4 2,410 14.1 2,378 13.9 1,885 11.0 1,259 7.3 997 5.8 745 4.3 678 4.0
CSU Part-time 4,983 10.2 1,581 3.3 3,600 7.4 4,767 9.8 3,297 6.8 2,328 4.8 2,819 5.8 2,887 5.9 Full-time 13,781 17.4 6,652 8.4 7,292 9.2 9,075 11.5 9,327 11.8 4,977 6.3 4,753 6.0 2,900 3.7 All 18,764 14.7 8,232 6.4 10,891 8.5 13,842 10.8 12,624 9.9 7,305 5.7 7,571 5.9 5,786 4.5
ICU Part-time 550 5.9 75 0.8 318 3.4 355 3.8 537 5.7 305 3.3 370 4.0 897 9.6 Full-time 1,960 12.2 1,358 8.4 1,191 7.4 1,695 10.5 1,731 10.8 1,297 8.1 816 5.1 1,430 8.9 All 2,510 9.9 1,433 5.6 1,508 5.9 2,050 8.1 2,267 8.9 1,602 6.3 1,186 4.7 2,327 9.2
PCC Part-time 3,988 20.4 1,118 5.7 669 3.4 791 4.1 1,333 6.8 589 3.0 1,190 6.1 1,552 8.0 Full-time 8,103 17.2 2,069 4.4 2,666 5.7 4,522 9.6 3,792 8.1 3,332 7.1 2,044 4.3 3,239 6.9 All 12,091 18.2 3,187 4.8 3,335 5.0 5,313 8.0 5,125 7.7 3,922 5.9 3,234 4.9 4,791 7.2
ALL Part-time 102,458 16.2 24,808 3.9 35,705 5.7 48,650 7.7 49,266 7.8 34,198 5.4 33,593 5.3 38,593 6.1 Full-time 69,771 23.5 25,555 8.6 27,053 9.1 30,162 10.1 30,486 10.2 18,955 6.4 13,664 4.6 15,854 5.3 All 172,229 18.6 50,363 5.4 62,758 6.8 78,812 8.5 79,751 8.6 53,153 5.7 47,257 5.1 54,447 5.9
$7,000 to $7,999 $8,000 to $9,999 $10,000 to $11,999 $12,000 to $13,999 $14,000 to $15,999 $16,000 to17,999 $18,000 to $19,999 $20,000 or More Total
# % # % # % # % # % # % # % # % # %CCC Part-time 22,530 4.1 30,040 5.5 21,099 3.8 35,046 6.4 24,318 4.4 16,093 2.9 11,444 2.1 65,444 11.9 549,299 100
Full-time 2,777 2.0 3,381 2.4 2,536 1.8 4,347 3.1 2,053 1.4 724 0.5 1,690 1.2 4,830 3.4 141,873 100 All 25,307 3.7 33,421 4.8 23,635 3.4 39,393 5.7 26,371 3.8 16,817 2.4 13,134 1.9 70,274 10.2 691,172 100
UC Part-time 107 2.9 113 3.0 266 7.1 - - - - - - - - 176 4.7 3,752 100 Full-time 288 2.2 375 2.8 239 1.8 232 1.7 - - 80 0.6 - - 203 1.5 13,379 100 All 395 2.3 488 2.8 504 2.9 232 1.4 - - 80 0.5 - - 378 2.2 17,131 100
CSU Part-time 2,054 4.2 3,160 6.5 2,202 4.5 3,123 6.4 2,087 4.3 2,120 4.4 1,819 3.7 5,797 11.9 48,622 100 Full-time 2,888 3.7 4,535 5.7 3,153 4.0 1,916 2.4 2,502 3.2 883 1.1 845 1.1 3,606 4.6 79,082 100 All 4,942 3.9 7,695 6.0 5,355 4.2 5,039 3.9 4,589 3.6 3,004 2.4 2,663 2.1 9,403 7.4 127,704 100
ICU Part-time 277 3.0 1,817 19.4 684 7.3 480 5.1 668 7.2 185 2.0 437 4.7 1,386 14.8 9,341 100 Full-time 763 4.7 944 5.9 783 4.9 449 2.8 348 2.2 202 1.3 216 1.3 904 5.6 16,087 100 All 1,040 4.1 2,761 10.9 1,467 5.8 929 3.7 1,017 4.0 387 1.5 653 2.6 2,289 9.0 25,428 100
PCC Part-time 688 3.5 1,080 5.5 784 4.0 714 3.7 589 3.0 325 1.7 539 2.8 3,551 18.2 19,500 100 Full-time 2,157 4.6 2,232 4.7 2,743 5.8 1,787 3.8 1,392 3.0 784 1.7 1,594 3.4 4,555 9.7 47,009 100 All 2,845 4.3 3,311 5.0 3,527 5.3 2,501 3.8 1,980 3.0 1,109 1.7 2,133 3.2 8,106 12.2 66,509 100
ALL Part-time 25,657 4.1 36,210 5.7 25,034 4.0 39,363 6.2 27,662 4.4 18,724 3.0 14,239 2.3 76,353 12.1 630,515 100 Full-time 8,872 3.0 11,466 3.9 9,454 3.2 8,731 2.9 6,294 2.1 2,673 0.9 4,345 1.5 14,096 4.7 297,430 100 All 34,529 3.7 47,676 5.1 34,488 3.7 48,094 5.2 33,956 3.7 21,397 2.3 18,584 2.0 90,450 9.7 927,945 100
TABLE W-20B: STUDENT SUMMER INCOME BY SEGMENT, COURSE LOAD, AND DEPENDENCY STATUS
Source: California Student Aid Commission 118 2003-04 SEARS

ALL UNDERGRADUATES
None Less Than $1,000 $1,000 to $1,999 $2,000 to $2,999 $3,000 to $3,999 $4,000 to $4,999 $5,000 to $5,999 $6,000 to $6,999
# % # % # % # % # % # % # % # %Part-time 249,650 23.6 71,407 6.8 84,632 8.0 107,374 10.2 102,562 9.7 57,551 5.4 49,950 4.7 47,524 4.5 Full-time 260,537 28.0 125,228 13.5 127,592 13.7 119,201 12.8 99,361 10.7 49,523 5.3 31,134 3.3 29,695 3.2 All 510,188 25.7 196,635 9.9 212,223 10.7 226,575 11.4 201,923 10.2 107,074 5.4 81,084 4.1 77,220 3.9
$7,000 to $7,999 $8,000 to $9,999 $10,000 to $11,999 $12,000 to $13,999 $14,000 to $15,999 $16,000 to $17,999 $18,000 to $19,999 $20,000 or More Total
# % # % # % # % # % # % # % # % # %Part-time 33,788 3.2 41,370 3.9 27,052 2.6 42,491 4.0 28,728 2.7 19,608 1.9 14,239 1.3 79,688 7.5 1,057,614 100 Full-time 14,214 1.5 17,335 1.9 13,130 1.4 11,219 1.2 7,218 0.8 3,323 0.4 4,939 0.5 15,919 1.7 929,568 100 All 48,002 2.4 58,705 3.0 40,182 2.0 53,710 2.7 35,946 1.8 22,931 1.2 19,177 1.0 95,607 4.8 1,987,181 100
TABLE W-20C: STUDENT SUMMER INCOME BY SEGMENT, COURSE LOAD, AND DEPENDENCY STATUS
Source: California Student Aid Commission 119 2003-04 SEARS

DEPENDENT UNDERGRADUATES
None Less Than $1,000 $1,000 to $1,999 $2,000 to $2,999 $3,000 to $3,999 $4,000 to $4,999 $5,000 to $5,999 $6,000 to $6,999
# % # % # % # % # % # % # % # %CCC Part-time 360 34.8 104 10.1 116 11.2 142 13.7 134 13.0 56 5.4 42 4.1 21 2.0
Full-time 744 33.9 309 14.1 331 15.1 285 13.0 236 10.7 106 4.8 56 2.5 42 1.9 All 1,104 34.2 413 12.8 447 13.8 427 13.2 370 11.5 162 5.0 98 3.0 63 2.0
UC Part-time 193 44.2 87 19.9 57 13.0 49 11.2 20 4.6 11 2.5 5 1.1 3 0.7 Full-time 942 32.7 558 19.4 476 16.5 381 13.2 258 9.0 110 3.8 58 2.0 40 1.4 All 1,135 34.2 645 19.5 533 16.1 430 13.0 278 8.4 121 3.6 63 1.9 43 1.3
CSU Part-time 39 18.1 30 13.9 26 12.0 40 18.5 34 15.7 18 8.3 6 2.8 8 3.7 Full-time 467 24.9 270 14.4 311 16.6 296 15.8 228 12.2 109 5.8 68 3.6 56 3.0 All 506 24.2 300 14.4 337 16.1 336 16.1 262 12.5 127 6.1 74 3.5 64 3.1
ICU Part-time 39 26.9 24 16.6 21 14.5 21 14.5 18 12.4 11 7.6 4 2.8 1 0.7 Full-time 440 22.9 351 18.3 338 17.6 307 16.0 259 13.5 95 4.9 52 2.7 32 1.7 All 479 23.2 375 18.1 359 17.4 328 15.9 277 13.4 106 5.1 56 2.7 33 1.6
PCC Part-time 87 31.2 34 12.2 45 16.1 30 10.8 26 9.3 16 5.7 6 2.2 12 4.3 Full-time 379 37.6 136 13.5 112 11.1 127 12.6 99 9.8 41 4.1 22 2.2 25 2.5 All 466 36.2 170 13.2 157 12.2 157 12.2 125 9.7 57 4.4 28 2.2 37 2.9
ALL Part-time 718 34.0 279 13.2 265 12.6 282 13.4 232 11.0 112 5.3 63 3.0 45 2.1 Full-time 2,972 30.1 1,624 16.4 1,568 15.9 1,396 14.1 1,080 10.9 461 4.7 256 2.6 195 2.0 All 3,690 30.8 1,903 15.9 1,833 15.3 1,678 14.0 1,312 10.9 573 4.8 319 2.7 240 2.0
$7,000 to $7,999 $8,000 to $9,999 $10,000 to $11,999 $12,000 to $13,999 $14,000 to $15,999 $16,000 to17,999 $18,000 to $19,999 $20,000 or More Total
# % # % # % # % # % # % # % # % # %CCC Part-time 20 1.9 12 1.2 5 0.5 8 0.8 2 0.2 2 0.2 - - 9 0.9 1,033 100
Full-time 16 0.7 22 1.0 14 0.6 12 0.5 6 0.3 4 0.2 4 0.2 10 0.5 2,197 100All 36 1.1 34 1.1 19 0.6 20 0.6 8 0.2 6 0.2 4 0.1 19 0.6 3,230 100
UC Part-time 2 0.5 6 1.4 1 0.2 1 0.2 1 0.2 - - - - 1 0.2 437 100Full-time 23 0.8 19 0.7 6 0.2 6 0.2 1 0.0 - - 1 0.0 - - 2,879 100All 25 0.8 25 0.8 7 0.2 7 0.2 2 0.1 - - 1 0.0 1 0.0 3,316 100
CSU Part-time 7 3.2 1 0.5 1 0.5 2 0.9 2 0.9 1 0.5 - - 1 0.5 216 100Full-time 22 1.2 21 1.1 11 0.6 7 0.4 - - 2 0.1 - - 5 0.3 1,873 100All 29 1.4 22 1.1 12 0.6 9 0.4 2 0.1 3 0.1 - - 6 0.3 2,089 100
ICU Part-time 2 1.4 3 2.1 - - - - - - 1 0.7 - - - - 145 100Full-time 11 0.6 14 0.7 11 0.6 6 0.3 4 0.2 - - - - 3 0.2 1,923 100All 13 0.6 17 0.8 11 0.5 6 0.3 4 0.2 1 0.0 - - 3 0.1 2,068 100
PCC Part-time 6 2.2 4 1.4 4 1.4 2 0.7 3 1.1 - - - - 4 1.4 279 100Full-time 8 0.8 18 1.8 11 1.1 11 1.1 2 0.2 5 0.5 5 0.5 6 0.6 1,007 100All 14 1.1 22 1.7 15 1.2 13 1.0 5 0.4 5 0.4 5 0.4 10 0.8 1,286 100
ALL Part-time 37 1.8 26 1.2 11 0.5 13 0.6 8 0.4 4 0.2 - - 15 0.7 2,110 100Full-time 80 0.8 94 1.0 53 0.5 42 0.4 13 0.1 11 0.1 10 0.1 24 0.2 9,879 100All 117 1.0 120 1.0 64 0.5 55 0.5 21 0.2 15 0.1 10 0.1 39 0.3 11,989 100
TABLE U-20A: STUDENT SUMMER INCOME BY SEGMENT, COURSE LOAD, AND DEPENDENCY STATUS
Source: California Student Aid Commission 120 2003-04 SEARS

INDEPENDENT UNDERGRADUATES
None Less Than $1,000 $1,000 to $1,999 $2,000 to $2,999 $3,000 to $3,999 $4,000 to $4,999 $5,000 to $5,999 $6,000 to $6,999
# % # % # % # % # % # % # % # %CCC Part-time 258 16.8 60 3.9 85 5.5 118 7.7 123 8.0 86 5.6 81 5.3 93 6.1
Full-time 347 29.5 113 9.6 118 10.0 112 9.5 120 10.2 71 6.0 46 3.9 63 5.4 All 605 22.3 173 6.4 203 7.5 230 8.5 243 9.0 157 5.8 127 4.7 156 5.8
UC Part-time 13 18.8 9 13.0 12 17.4 9 13.0 2 2.9 5 7.2 4 5.8 - - Full-time 104 30.0 48 13.8 43 12.4 35 10.1 30 8.6 19 5.5 14 4.0 18 5.2 All 117 28.1 57 13.7 55 13.2 44 10.6 32 7.7 24 5.8 18 4.3 18 4.3
CSU Part-time 59 10.1 25 4.3 38 6.5 51 8.7 40 6.9 36 6.2 30 5.1 40 6.9 Full-time 186 17.0 87 8.0 104 9.5 128 11.7 125 11.4 77 7.0 71 6.5 49 4.5 All 245 14.6 112 6.7 142 8.5 179 10.7 165 9.8 113 6.7 101 6.0 89 5.3
ICU Part-time 11 7.2 2 1.3 6 3.9 7 4.6 10 6.5 6 3.9 6 3.9 16 10.5 Full-time 45 13.6 26 7.9 27 8.2 36 10.9 35 10.6 25 7.6 20 6.0 28 8.5 All 56 11.6 28 5.8 33 6.8 43 8.9 45 9.3 31 6.4 26 5.4 44 9.1
PCC Part-time 114 20.7 23 4.2 31 5.6 33 6.0 41 7.4 28 5.1 34 6.2 40 7.3 Full-time 354 21.8 99 6.1 116 7.2 151 9.3 147 9.1 113 7.0 88 5.4 95 5.9 All 468 21.5 122 5.6 147 6.8 184 8.5 188 8.7 141 6.5 122 5.6 135 6.2
ALL Part-time 455 15.7 119 4.1 172 5.9 218 7.5 216 7.5 161 5.6 155 5.4 189 6.5 Full-time 1,036 22.7 373 8.2 408 8.9 462 10.1 457 10.0 305 6.7 239 5.2 253 5.5 All 1,491 20.0 492 6.6 580 7.8 680 9.1 673 9.0 466 6.2 394 5.3 442 5.9
$7,000 to $7,999 $8,000 to $9,999 $10,000 to $11,999 $12,000 to $13,999 $14,000 to $15,999 $16,000 to17,999 $18,000 to $19,999 $20,000 or More Total
# % # % # % # % # % # % # % # % # %CCC Part-time 63 4.1 84 5.5 59 3.8 98 6.4 68 4.4 45 2.9 32 2.1 183 11.9 1,536 100
Full-time 23 2.0 28 2.4 21 1.8 36 3.1 17 1.4 6 0.5 14 1.2 40 3.4 1,175 100All 86 3.2 112 4.1 80 3.0 134 4.9 85 3.1 51 1.9 46 1.7 223 8.2 2,711 100
UC Part-time 2 2.9 3 4.3 5 7.2 - - - - - - - - 5 7.2 69 100Full-time 7 2.0 9 2.6 6 1.7 7 2.0 - - 2 0.6 - - 5 1.4 347 100All 9 2.2 12 2.9 11 2.6 7 1.7 - - 2 0.5 - - 10 2.4 416 100
CSU Part-time 22 3.8 41 7.0 25 4.3 37 6.3 24 4.1 22 3.8 22 3.8 71 12.2 583 100Full-time 42 3.8 58 5.3 42 3.8 24 2.2 32 2.9 11 1.0 12 1.1 45 4.1 1,093 100All 64 3.8 99 5.9 67 4.0 61 3.6 56 3.3 33 2.0 34 2.0 116 6.9 1,676 100
ICU Part-time 6 3.9 22 14.4 11 7.2 8 5.2 11 7.2 3 2.0 7 4.6 21 13.7 153 100Full-time 15 4.5 16 4.8 15 4.5 9 2.7 8 2.4 4 1.2 4 1.2 18 5.4 331 100All 21 4.3 38 7.9 26 5.4 17 3.5 19 3.9 7 1.4 11 2.3 39 8.1 484 100
PCC Part-time 18 3.3 36 6.5 25 4.5 22 4.0 20 3.6 11 2.0 10 1.8 65 11.8 551 100Full-time 60 3.7 60 3.7 70 4.3 53 3.3 35 2.2 26 1.6 38 2.3 117 7.2 1,622 100All 78 3.6 96 4.4 95 4.4 75 3.5 55 2.5 37 1.7 48 2.2 182 8.4 2,173 100
ALL Part-time 111 3.8 186 6.4 125 4.3 165 5.7 123 4.3 81 2.8 71 2.5 345 11.9 2,892 100Full-time 147 3.2 171 3.7 154 3.4 129 2.8 92 2.0 49 1.1 68 1.5 225 4.9 4,568 100All 258 3.5 357 4.8 279 3.7 294 3.9 215 2.9 130 1.7 139 1.9 570 7.6 7,460 100
TABLE U-20B: STUDENT SUMMER INCOME BY SEGMENT, COURSE LOAD, AND DEPENDENCY STATUS
Source: California Student Aid Commission 121 2003-04 SEARS

ALL UNDERGRADUATES
None Less Than $1,000 $1,000 to $1,999 $2,000 to $2,999 $3,000 to $3,999 $4,000 to $4,999 $5,000 to $5,999 $6,000 to $6,999
# % # % # % # % # % # % # % # %Part-time 1,173 23.5 398 8.0 437 8.7 500 10.0 448 9.0 273 5.5 218 4.4 234 4.7 Full-time 4,008 27.7 1,997 13.8 1,976 13.7 1,858 12.9 1,537 10.6 766 5.3 495 3.4 448 3.1 All 5,181 26.6 2,395 12.3 2,413 12.4 2,358 12.1 1,985 10.2 1,039 5.3 713 3.7 682 3.5
$7,000 to $7,999 $8,000 to $9,999 $10,000 to $11,999 $12,000 to $13,999 $14,000 to $15,999 $16,000 to $17,999 $18,000 to $19,999 $20,000 or More Total
# % # % # % # % # % # % # % # % # %Part-time 148 3.0 212 4.2 136 2.7 178 3.6 131 2.6 85 1.7 71 1.4 360 7.2 5,002 100 Full-time 227 1.6 265 1.8 207 1.4 171 1.2 105 0.7 60 0.4 78 0.5 249 1.7 14,447 100 All 375 1.9 477 2.5 343 1.8 349 1.8 236 1.2 145 0.7 149 0.8 609 3.1 19,449 100
TABLE U-20C: STUDENT SUMMER INCOME BY SEGMENT, COURSE LOAD, AND DEPENDENCY STATUS
Source: California Student Aid Commission 122 2003-04 SEARS

DEPENDENT UNDERGRADUATES INDEPENDENT UNDERGRADUATES ALL UNDERGRADUATES
CCC Part-time 673 3,476$ 2,819$ CCC Part-time 1,278 9,161$ 6,924$ CCC Part-time 1,951 7,200$ 4,657$ Full-time 1,453 2,973$ 2,303$ Full-time 828 5,437$ 3,591$ Full-time 2,281 3,867$ 2,678$ All 2,126 3,132$ 2,611$ All 2,106 7,697$ 6,149$ All 4,232 5,404$ 3,814$
UC Part-time 244 2,242$ 1,588$ UC Part-time 56 5,330$ 2,447$ UC Part-time 300 2,818$ 1,718$ Full-time 1,937 2,294$ 1,874$ Full-time 243 4,074$ 2,879$ Full-time 2,180 2,493$ 1,945$ All 2,181 2,288$ 1,828$ All 299 4,309$ 2,756$ All 2,480 2,532$ 1,905$
CSU Part-time 177 3,421$ 2,853$ CSU Part-time 524 9,269$ 7,263$ CSU Part-time 701 7,792$ 5,258$ Full-time 1,406 2,897$ 2,419$ Full-time 907 6,024$ 4,060$ Full-time 2,313 4,123$ 2,879$
All 1,583 2,955$ 2,478$ All 1,431 7,212$ 5,207$ All 3,014 4,976$ 3,221$ ICU Part-time 106 2,792$ 2,946$ ICU Part-time 142 10,454$ 8,693$ ICU Part-time 248 7,179$ 7,481$ Full-time 1,483 2,568$ 2,070$ Full-time 286 6,472$ 4,839$ Full-time 1,769 3,199$ 2,359$
All 1,589 2,583$ 2,109$ All 428 7,793$ 6,606$ All 2,017 3,689$ 2,621$ PCC Part-time 192 3,716$ 2,726$ PCC Part-time 437 8,968$ 7,714$ PCC Part-time 629 7,365$ 6,433$ Full-time 628 3,487$ 2,472$ Full-time 1,268 7,351$ 6,301$ Full-time 1,896 6,071$ 4,648$
All 820 3,541$ 2,511$ All 1,705 7,765$ 6,633$ All 2,525 6,393$ 5,185$ ALL Part-time 1,392 3,234$ 2,756$ ALL Part-time 2,437 9,137$ 6,978$ ALL Part-time 3,829 6,991$ 4,659$
Full-time 6,907 2,727$ 2,229$ Full-time 3,532 6,265$ 4,025$ Full-time 10,439 3,924$ 2,683$ All 8,299 2,812$ 2,438$ All 5,969 7,437$ 6,103$ All 14,268 4,747$ 3,509$
Note: "None" category was excluded from the means and median calculations.
TABLE M-20: MEAN AND MEDIAN STUDENT SUMMER INCOME BY SEGMENT, COURSE LOAD, AND DEPENDENCY STATUS
Number Mean Median Number MedianMean Median Number Mean
Source: California Student Aid Commission 123 2003-04 SEARS

Question for Tables: W-21, U-21, and M-21 What will be your total income for the current academic year? Please estimate for the nine-month period while you are attending school (e.g., September through May or October through June). As previously noted, DO NOT include any money received through student loans or grants, scholarships or fellowships. Include college work-study and assistantship earnings. If you are married, include your spouse's earnings. 00 None 04 $3,000 to $3,999 08 $18,000 to $23,999 12 $60,000 to $71,999 01 Less than $1,000 05 $4,000 to $5,999 09 $24,000 to $35,999 13 $72,000 to $83,999 02 $1,000 to $1,999 06 $6,000 to $11,999 10 $36,000 to $47,999 14 $84,000 to $95,999 03 $2,000 to $2,999 07 $12,000 to $17,999 11 $48,000 to $59,999 15 $96,000 or more
124 2003-04 SEARS
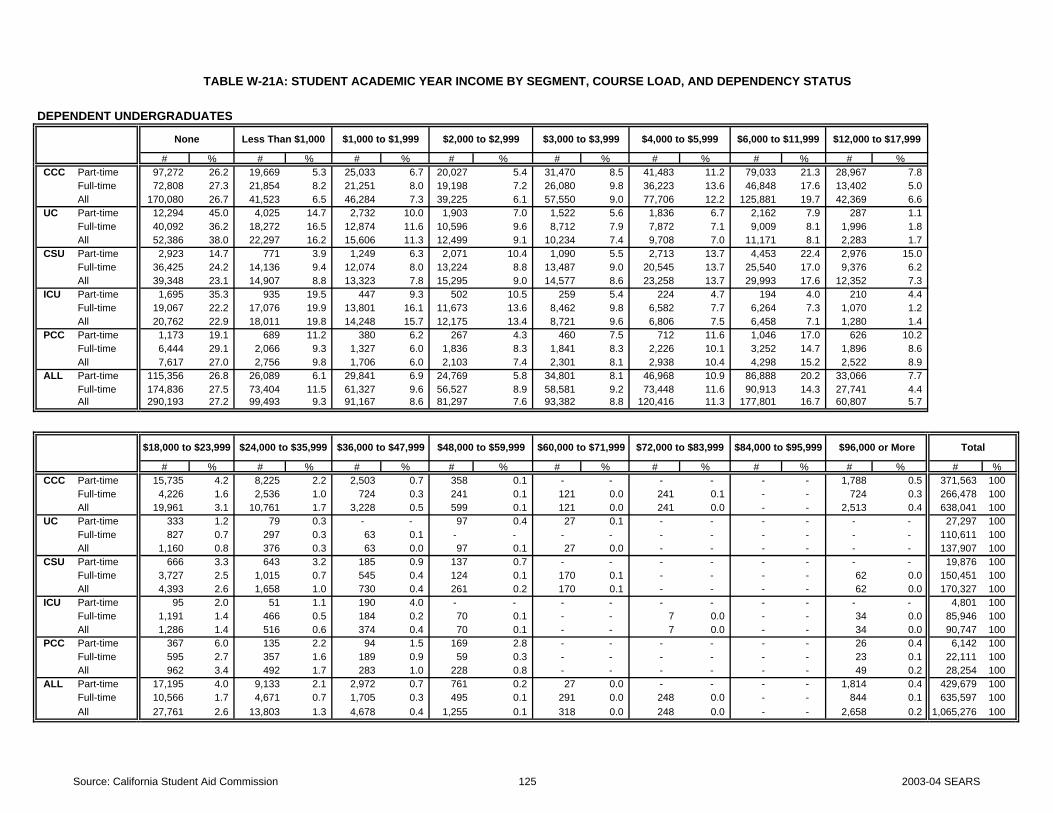
DEPENDENT UNDERGRADUATES
None Less Than $1,000 $1,000 to $1,999 $2,000 to $2,999 $3,000 to $3,999 $4,000 to $5,999 $6,000 to $11,999 $12,000 to $17,999
# % # % # % # % # % # % # % # %CCC Part-time 97,272 26.2 19,669 5.3 25,033 6.7 20,027 5.4 31,470 8.5 41,483 11.2 79,033 21.3 28,967 7.8
Full-time 72,808 27.3 21,854 8.2 21,251 8.0 19,198 7.2 26,080 9.8 36,223 13.6 46,848 17.6 13,402 5.0 All 170,080 26.7 41,523 6.5 46,284 7.3 39,225 6.1 57,550 9.0 77,706 12.2 125,881 19.7 42,369 6.6
UC Part-time 12,294 45.0 4,025 14.7 2,732 10.0 1,903 7.0 1,522 5.6 1,836 6.7 2,162 7.9 287 1.1 Full-time 40,092 36.2 18,272 16.5 12,874 11.6 10,596 9.6 8,712 7.9 7,872 7.1 9,009 8.1 1,996 1.8 All 52,386 38.0 22,297 16.2 15,606 11.3 12,499 9.1 10,234 7.4 9,708 7.0 11,171 8.1 2,283 1.7
CSU Part-time 2,923 14.7 771 3.9 1,249 6.3 2,071 10.4 1,090 5.5 2,713 13.7 4,453 22.4 2,976 15.0 Full-time 36,425 24.2 14,136 9.4 12,074 8.0 13,224 8.8 13,487 9.0 20,545 13.7 25,540 17.0 9,376 6.2 All 39,348 23.1 14,907 8.8 13,323 7.8 15,295 9.0 14,577 8.6 23,258 13.7 29,993 17.6 12,352 7.3
ICU Part-time 1,695 35.3 935 19.5 447 9.3 502 10.5 259 5.4 224 4.7 194 4.0 210 4.4 Full-time 19,067 22.2 17,076 19.9 13,801 16.1 11,673 13.6 8,462 9.8 6,582 7.7 6,264 7.3 1,070 1.2 All 20,762 22.9 18,011 19.8 14,248 15.7 12,175 13.4 8,721 9.6 6,806 7.5 6,458 7.1 1,280 1.4
PCC Part-time 1,173 19.1 689 11.2 380 6.2 267 4.3 460 7.5 712 11.6 1,046 17.0 626 10.2 Full-time 6,444 29.1 2,066 9.3 1,327 6.0 1,836 8.3 1,841 8.3 2,226 10.1 3,252 14.7 1,896 8.6 All 7,617 27.0 2,756 9.8 1,706 6.0 2,103 7.4 2,301 8.1 2,938 10.4 4,298 15.2 2,522 8.9
ALL Part-time 115,356 26.8 26,089 6.1 29,841 6.9 24,769 5.8 34,801 8.1 46,968 10.9 86,888 20.2 33,066 7.7 Full-time 174,836 27.5 73,404 11.5 61,327 9.6 56,527 8.9 58,581 9.2 73,448 11.6 90,913 14.3 27,741 4.4 All 290,193 27.2 99,493 9.3 91,167 8.6 81,297 7.6 93,382 8.8 120,416 11.3 177,801 16.7 60,807 5.7
$18,000 to $23,999 $24,000 to $35,999 $36,000 to $47,999 $48,000 to $59,999 $60,000 to $71,999 $72,000 to $83,999 $84,000 to $95,999 $96,000 or More Total
# % # % # % # % # % # % # % # % # %CCC Part-time 15,735 4.2 8,225 2.2 2,503 0.7 358 0.1 - - - - - - 1,788 0.5 371,563 100
Full-time 4,226 1.6 2,536 1.0 724 0.3 241 0.1 121 0.0 241 0.1 - - 724 0.3 266,478 100 All 19,961 3.1 10,761 1.7 3,228 0.5 599 0.1 121 0.0 241 0.0 - - 2,513 0.4 638,041 100
UC Part-time 333 1.2 79 0.3 - - 97 0.4 27 0.1 - - - - - - 27,297 100 Full-time 827 0.7 297 0.3 63 0.1 - - - - - - - - - - 110,611 100 All 1,160 0.8 376 0.3 63 0.0 97 0.1 27 0.0 - - - - - - 137,907 100
CSU Part-time 666 3.3 643 3.2 185 0.9 137 0.7 - - - - - - - - 19,876 100 Full-time 3,727 2.5 1,015 0.7 545 0.4 124 0.1 170 0.1 - - - - 62 0.0 150,451 100 All 4,393 2.6 1,658 1.0 730 0.4 261 0.2 170 0.1 - - - - 62 0.0 170,327 100
ICU Part-time 95 2.0 51 1.1 190 4.0 - - - - - - - - - - 4,801 100 Full-time 1,191 1.4 466 0.5 184 0.2 70 0.1 - - 7 0.0 - - 34 0.0 85,946 100 All 1,286 1.4 516 0.6 374 0.4 70 0.1 - - 7 0.0 - - 34 0.0 90,747 100
PCC Part-time 367 6.0 135 2.2 94 1.5 169 2.8 - - - - - - 26 0.4 6,142 100 Full-time 595 2.7 357 1.6 189 0.9 59 0.3 - - - - - - 23 0.1 22,111 100 All 962 3.4 492 1.7 283 1.0 228 0.8 - - - - - - 49 0.2 28,254 100
ALL Part-time 17,195 4.0 9,133 2.1 2,972 0.7 761 0.2 27 0.0 - - - - 1,814 0.4 429,679 100 Full-time 10,566 1.7 4,671 0.7 1,705 0.3 495 0.1 291 0.0 248 0.0 - - 844 0.1 635,597 100 All 27,761 2.6 13,803 1.3 4,678 0.4 1,255 0.1 318 0.0 248 0.0 - - 2,658 0.2 1,065,276 100
TABLE W-21A: STUDENT ACADEMIC YEAR INCOME BY SEGMENT, COURSE LOAD, AND DEPENDENCY STATUS
Source: California Student Aid Commission 125 2003-04 SEARS

INDEPENDENT UNDERGRADUATES
None Less Than $1,000 $1,000 to $1,999 $2,000 to $2,999 $3,000 to $3,999 $4,000 to $5,999 $6,000 to $11,999 $12,000 to $17,999
# % # % # % # % # % # % # % # %CCC Part-time 64,729 11.7 13,589 2.4 15,735 2.8 11,444 2.1 16,093 2.9 28,967 5.2 75,457 13.6 59,364 10.7
Full-time 33,083 23.2 6,882 4.8 7,365 5.2 5,675 4.0 8,331 5.8 12,678 8.9 27,650 19.4 13,161 9.2 All 97,812 14.0 20,471 2.9 23,100 3.3 17,119 2.5 24,424 3.5 41,645 6.0 103,107 14.8 72,525 10.4
UC Part-time 863 22.3 108 2.8 248 6.4 234 6.1 318 8.2 211 5.4 700 18.1 360 9.3 Full-time 3,782 28.1 1,096 8.2 1,068 8.0 1,223 9.1 711 5.3 1,128 8.4 1,713 12.8 1,233 9.2 All 4,645 26.8 1,204 7.0 1,316 7.6 1,457 8.4 1,029 5.9 1,339 7.7 2,413 13.9 1,593 9.2
CSU Part-time 2,291 4.6 849 1.7 705 1.4 1,260 2.6 1,661 3.4 2,796 5.7 6,539 13.2 4,484 9.1 Full-time 12,318 15.5 3,773 4.7 3,085 3.9 4,030 5.1 3,816 4.8 6,650 8.4 13,165 16.6 10,506 13.2 All 14,609 11.3 4,622 3.6 3,790 2.9 5,289 4.1 5,477 4.2 9,446 7.3 19,704 15.3 14,990 11.6
ICU Part-time 421 4.5 77 0.8 54 0.6 94 1.0 58 0.6 163 1.7 911 9.7 719 7.6 Full-time 2,463 15.2 807 5.0 802 5.0 1,177 7.3 536 3.3 1,349 8.3 2,667 16.5 1,313 8.1 All 2,883 11.3 884 3.5 856 3.3 1,271 5.0 593 2.3 1,512 5.9 3,578 14.0 2,032 7.9
PCC Part-time 2,049 10.2 465 2.3 272 1.4 252 1.3 532 2.7 639 3.2 3,837 19.2 1,726 8.6 Full-time 6,019 12.8 2,150 4.6 1,223 2.6 1,395 3.0 1,713 3.6 2,620 5.6 5,936 12.6 4,371 9.3 All 8,068 12.0 2,615 3.9 1,494 2.2 1,647 2.5 2,245 3.3 3,259 4.9 9,773 14.6 6,097 9.1
ALL Part-time 70,353 11.0 15,088 2.4 17,013 2.7 13,284 2.1 18,662 2.9 32,776 5.1 87,444 13.7 66,653 10.5 Full-time 57,664 19.3 14,708 4.9 13,544 4.5 13,500 4.5 15,106 5.1 24,424 8.2 51,132 17.1 30,583 10.2 All 128,018 13.7 29,797 3.2 30,557 3.3 26,784 2.9 33,768 3.6 57,200 6.1 138,576 14.8 97,236 10.4
$18,000 to $23,999 $24,000 to $35,999 $36,000 to $47,999 $48,000 to $59,999 $60,000 to $71,999 $72,000 to $83,999 $84,000 to $95,999 $96,000 or More Total
# % # % # % # % # % # % # % # % # %CCC Part-time 55,431 10.0 63,298 11.4 47,921 8.6 30,397 5.5 19,311 3.5 15,378 2.8 12,874 2.3 24,676 4.4 554,664 100
Full-time 8,694 6.1 7,124 5.0 3,502 2.5 2,777 1.9 1,570 1.1 1,207 0.8 845 0.6 2,173 1.5 142,717 100 All 64,125 9.2 70,422 10.1 51,423 7.4 33,174 4.8 20,881 3.0 16,585 2.4 13,719 2.0 26,849 3.9 697,381 100
UC Part-time 173 4.5 371 9.6 38 1.0 70 1.8 66 1.7 - - 83 2.1 27 0.7 3,871 100 Full-time 370 2.8 467 3.5 197 1.5 244 1.8 88 0.7 80 0.6 - - 38 0.3 13,436 100 All 543 3.1 839 4.8 235 1.4 314 1.8 154 0.9 80 0.5 83 0.5 65 0.4 17,307 100
CSU Part-time 5,071 10.3 6,089 12.3 5,842 11.8 3,905 7.9 2,360 4.8 1,711 3.5 1,613 3.3 2,190 4.4 49,366 100 Full-time 6,952 8.7 4,952 6.2 3,561 4.5 2,185 2.7 926 1.2 1,178 1.5 854 1.1 1,595 2.0 79,545 100 All 12,023 9.3 11,041 8.6 9,403 7.3 6,090 4.7 3,286 2.5 2,889 2.2 2,466 1.9 3,785 2.9 128,911 100
ICU Part-time 1,044 11.1 1,359 14.4 1,914 20.3 591 6.3 534 5.7 661 7.0 307 3.3 510 5.4 9,416 100 Full-time 972 6.0 1,457 9.0 1,001 6.2 562 3.5 224 1.4 397 2.5 155 1.0 278 1.7 16,158 100 All 2,016 7.9 2,815 11.0 2,915 11.4 1,153 4.5 758 3.0 1,059 4.1 461 1.8 788 3.1 25,574 100
PCC Part-time 971 4.9 3,176 15.9 1,522 7.6 535 2.7 541 2.7 1,068 5.3 126 0.6 2,296 11.5 20,006 100 Full-time 3,434 7.3 5,576 11.8 4,042 8.6 2,337 5.0 1,045 2.2 1,959 4.2 1,404 3.0 1,934 4.1 47,158 100 All 4,405 6.6 8,752 13.0 5,564 8.3 2,871 4.3 1,586 2.4 3,027 4.5 1,530 2.3 4,230 6.3 67,163 100
ALL Part-time 62,690 9.8 74,293 11.7 57,237 9.0 35,498 5.6 22,812 3.6 18,818 3.0 15,002 2.4 29,698 4.7 637,322 100 Full-time 20,421 6.8 19,576 6.5 12,302 4.1 8,104 2.7 3,853 1.3 4,822 1.6 3,257 1.1 6,019 2.0 299,014 100 All 83,111 8.9 93,869 10.0 69,539 7.4 43,602 4.7 26,665 2.8 23,639 2.5 18,260 2.0 35,717 3.8 936,337 100
TABLE W-21B: STUDENT ACADEMIC YEAR INCOME BY SEGMENT, COURSE LOAD, AND DEPENDENCY STATUS
Source: California Student Aid Commission 126 2003-04 SEARS

ALL UNDERGRADUATES
None Less Than $1,000 $1,000 to $1,999 $2,000 to $2,999 $3,000 to $3,999 $4,000 to $5,999 $6,000 to $11,999 $12,000 to $17,999
# % # % # % # % # % # % # % # %Part-time 185,710 17.4 41,177 3.9 46,854 4.4 38,053 3.6 53,463 5.0 79,744 7.5 174,332 16.3 99,719 9.3 Full-time 232,501 24.9 88,113 9.4 74,870 8.0 70,027 7.5 73,687 7.9 97,872 10.5 142,045 15.2 58,324 6.2 All 418,210 20.9 129,290 6.5 121,724 6.1 108,080 5.4 127,150 6.4 177,615 8.9 316,377 15.8 158,042 7.9
$18,000 to $23,999 $24,000 to $35,999 $36,000 to $47,999 $48,000 to $59,999 $60,000 to $71,999 $72,000 to $83,999 $84,000 to $95,999 $96,000 or More Total
# % # % # % # % # % # % # % # % # %Part-time 79,885 7.5 83,426 7.8 60,209 5.6 36,258 3.4 22,839 2.1 18,818 1.8 15,002 1.4 31,512 3.0 1,067,002 100 Full-time 30,987 3.3 24,247 2.6 14,007 1.5 8,599 0.9 4,144 0.4 5,070 0.5 3,257 0.3 6,863 0.7 934,612 100 All 110,873 5.5 107,672 5.4 74,217 3.7 44,857 2.2 26,983 1.3 23,888 1.2 18,260 0.9 38,375 1.9 2,001,613 100
TABLE W-21C: STUDENT ACADEMIC YEAR INCOME BY SEGMENT, COURSE LOAD, AND DEPENDENCY STATUS
Source: California Student Aid Commission 127 2003-04 SEARS

DEPENDENT UNDERGRADUATES
None Less Than $1,000 $1,000 to $1,999 $2,000 to $2,999 $3,000 to $3,999 $4,000 to $5,999 $6,000 to $11,999 $12,000 to $17,999
# % # % # % # % # % # % # % # %CCC Part-time 272 26.2 55 5.3 70 6.7 56 5.4 88 8.5 116 11.2 221 21.3 81 7.8
Full-time 603 27.3 181 8.2 176 8.0 159 7.2 216 9.8 300 13.6 388 17.6 111 5.0 All 875 27.0 236 7.3 246 7.6 215 6.6 304 9.4 416 12.8 609 18.8 192 5.9
UC Part-time 199 44.9 63 14.2 44 9.9 31 7.0 24 5.4 32 7.2 34 7.7 5 1.1 Full-time 1,041 35.7 488 16.7 333 11.4 278 9.5 237 8.1 215 7.4 239 8.2 55 1.9 All 1,240 36.9 551 16.4 377 11.2 309 9.2 261 7.8 247 7.3 273 8.1 60 1.8
CSU Part-time 35 15.9 11 5.0 15 6.8 19 8.6 14 6.4 28 12.7 51 23.2 31 14.1 Full-time 456 24.2 212 11.3 154 8.2 178 9.5 176 9.4 234 12.4 301 16.0 106 5.6 All 491 23.4 223 10.6 169 8.0 197 9.4 190 9.0 262 12.5 352 16.7 137 6.5
ICU Part-time 47 32.9 36 25.2 21 14.7 12 8.4 8 5.6 6 4.2 4 2.8 4 2.8 Full-time 424 22.1 414 21.6 316 16.5 261 13.6 171 8.9 146 7.6 128 6.7 22 1.1 All 471 22.8 450 21.8 337 16.3 273 13.2 179 8.7 152 7.4 132 6.4 26 1.3
PCC Part-time 71 25.8 26 9.5 19 6.9 17 6.2 17 6.2 30 10.9 45 16.4 19 6.9 Full-time 300 29.5 73 7.2 62 6.1 81 8.0 67 6.6 102 10.0 168 16.5 88 8.6 All 371 28.7 99 7.7 81 6.3 98 7.6 84 6.5 132 10.2 213 16.5 107 8.3
ALL Part-time 624 29.4 191 9.0 169 8.0 135 6.4 151 7.1 212 10.0 355 16.7 140 6.6 Full-time 2,824 28.4 1,368 13.8 1,041 10.5 957 9.6 867 8.7 997 10.0 1,224 12.3 382 3.8 All 3,448 28.6 1,559 12.9 1,210 10.0 1,092 9.1 1,018 8.4 1,209 10.0 1,579 13.1 522 4.3
$18,000 to $23,999 $24,000 to $35,999 $36,000 to $47,999 $48,000 to $59,999 $60,000 to $71,999 $72,000 to $83,999 $84,000 to $95,999 $96,000 or More Total
# % # % # % # % # % # % # % # % # %CCC Part-time 44 4.2 23 2.2 7 0.7 1 0.1 - - - - - - 5 0.5 1,039 100
Full-time 35 1.6 21 1.0 6 0.3 2 0.1 1 0.0 2 0.1 - - 6 0.3 2,207 100 All 79 2.4 44 1.4 13 0.4 3 0.1 1 0.0 2 0.1 - - 11 0.3 3,246 100
UC Part-time 6 1.4 2 0.5 - - 2 0.5 1 0.2 - - - - - - 443 100 Full-time 22 0.8 8 0.3 2 0.1 - - - - - - - - - - 2,918 100 All 28 0.8 10 0.3 2 0.1 2 0.1 1 0.0 - - - - - - 3,361 100
CSU Part-time 7 3.2 6 2.7 2 0.9 1 0.5 - - - - - - - - 220 100 Full-time 45 2.4 11 0.6 5 0.3 1 0.1 2 0.1 - - - - 1 0.1 1,882 100 All 52 2.5 17 0.8 7 0.3 2 0.1 2 0.1 - - - - 1 0.0 2,102 100
ICU Part-time 2 1.4 1 0.7 2 1.4 - - - - - - - - - - 143 100 Full-time 22 1.1 8 0.4 4 0.2 1 0.1 - - 1 0.1 - - 1 0.1 1,919 100 All 24 1.2 9 0.4 6 0.3 1 0.0 - - 1 0.0 - - 1 0.0 2,062 100
PCC Part-time 13 4.7 7 2.5 5 1.8 4 1.5 - - - - - - 2 0.7 275 100 Full-time 40 3.9 21 2.1 10 1.0 4 0.4 - - - - - 2 0.2 1,018 100 All 53 4.1 28 2.2 15 1.2 8 0.6 - - - - - - 4 0.3 1,293 100
ALL Part-time 72 3.4 39 1.8 16 0.8 8 0.4 1 0.0 - - - - 7 0.3 2,120 100 Full-time 164 1.6 69 0.7 27 0.3 8 0.1 3 0.0 3 0.0 - - 10 0.1 9,944 100 All 236 2.0 108 0.9 43 0.4 16 0.1 4 0.0 3 0.0 - - 17 0.1 12,064 100
TABLE U-21A: STUDENT ACADEMIC YEAR INCOME BY SEGMENT, COURSE LOAD, AND DEPENDENCY STATUS
Source: California Student Aid Commission 128 2003-04 SEARS

INDEPENDENT UNDERGRADUATES
None Less Than $1,000 $1,000 to $1,999 $2,000 to $2,999 $3,000 to $3,999 $4,000 to $5,999 $6,000 to $11,999 $12,000 to $17,999
# % # % # % # % # % # % # % # %CCC Part-time 181 11.7 38 2.5 44 2.8 32 2.1 45 2.9 81 5.2 211 13.6 166 10.7
Full-time 274 23.2 57 4.8 61 5.2 47 4.0 69 5.8 105 8.9 229 19.4 109 9.2 All 455 16.6 95 3.5 105 3.8 79 2.9 114 4.2 186 6.8 440 16.1 275 10.1
UC Part-time 14 19.7 2 2.8 4 5.6 5 7.0 5 7.0 3 4.2 13 18.3 7 9.9 Full-time 100 28.7 28 8.0 27 7.7 31 8.9 18 5.2 30 8.6 44 12.6 33 9.5 All 114 27.1 30 7.1 31 7.4 36 8.6 23 5.5 33 7.9 57 13.6 40 9.5
CSU Part-time 28 4.7 12 2.0 12 2.0 14 2.4 21 3.6 31 5.3 72 12.2 56 9.5 Full-time 160 14.6 62 5.7 49 4.5 51 4.6 58 5.3 96 8.8 184 16.8 141 12.9 All 188 11.1 74 4.4 61 3.6 65 3.9 79 4.7 127 7.5 256 15.2 197 11.7
ICU Part-time 8 5.2 3 1.9 1 0.6 2 1.3 1 0.6 3 1.9 18 11.7 13 8.4 Full-time 56 16.9 17 5.1 17 5.1 26 7.8 12 3.6 27 8.1 55 16.6 26 7.8 All 64 13.2 20 4.1 18 3.7 28 5.8 13 2.7 30 6.2 73 15.0 39 8.0
PCC Part-time 83 15.0 17 3.1 15 2.7 13 2.3 20 3.6 28 5.1 66 11.9 46 8.3 Full-time 293 17.9 64 3.9 51 3.1 57 3.5 72 4.4 97 5.9 246 15.1 172 10.5 All 376 17.2 81 3.7 66 3.0 70 3.2 92 4.2 125 5.7 312 14.3 218 10.0
ALL Part-time 314 10.8 72 2.5 76 2.6 66 2.3 92 3.2 146 5.0 380 13.0 288 9.9 Full-time 883 19.2 228 5.0 205 4.5 212 4.6 229 5.0 355 7.7 758 16.5 481 10.5 All 1,197 15.9 300 4.0 281 3.7 278 3.7 321 4.3 501 6.7 1,138 15.1 769 10.2
$18,000 to $23,999 $24,000 to $35,999 $36,000 to $47,999 $48,000 to $59,999 $60,000 to $71,999 $72,000 to $83,999 $84,000 to $95,999 $96,000 or More Total
# % # % # % # % # % # % # % # % # %CCC Part-time 155 10.0 177 11.4 134 8.6 85 5.5 54 3.5 43 2.8 36 2.3 69 4.4 1,551 100
Full-time 72 6.1 59 5.0 29 2.5 23 1.9 13 1.1 10 0.8 7 0.6 18 1.5 1,182 100 All 227 8.3 236 8.6 163 6.0 108 4.0 67 2.5 53 1.9 43 1.6 87 3.2 2,733 100
UC Part-time 4 5.6 7 9.9 1 1.4 1 1.4 2 2.8 - - 2 2.8 1 1.4 71 100 Full-time 10 2.9 12 3.4 5 1.4 6 1.7 2 0.6 2 0.6 - - 1 0.3 349 100 All 14 3.3 19 4.5 6 1.4 7 1.7 4 1.0 2 0.5 2 0.5 2 0.5 420 100
CSU Part-time 59 10.0 75 12.7 66 11.2 47 8.0 29 4.9 19 3.2 20 3.4 29 4.9 590 100 Full-time 89 8.1 68 6.2 50 4.6 33 3.0 12 1.1 15 1.4 9 0.8 20 1.8 1,097 100 All 148 8.8 143 8.5 116 6.9 80 4.7 41 2.4 34 2.0 29 1.7 49 2.9 1,687 100
ICU Part-time 18 11.7 23 14.9 23 14.9 10 6.5 9 5.8 8 5.2 5 3.2 9 5.8 154 100 Full-time 20 6.0 27 8.1 19 5.7 11 3.3 4 1.2 7 2.1 3 0.9 5 1.5 332 100 All 38 7.8 50 10.3 42 8.6 21 4.3 13 2.7 15 3.1 8 1.6 14 2.9 486 100
PCC Part-time 39 7.0 71 12.8 44 7.9 20 3.6 18 3.2 21 3.8 6 1.1 47 8.5 554 100 Full-time 121 7.4 160 9.8 100 6.1 57 3.5 25 1.5 41 2.5 32 2.0 45 2.8 1,633 100 All 160 7.3 231 10.6 144 6.6 77 3.5 43 2.0 62 2.8 38 1.7 92 4.2 2,187 100
ALL Part-time 275 9.4 353 12.1 268 9.2 163 5.6 112 3.8 91 3.1 69 2.4 155 5.3 2,920 100 Full-time 312 6.8 326 7.1 203 4.4 130 2.8 56 1.2 75 1.6 51 1.1 89 1.9 4,593 100 All 587 7.8 679 9.0 471 6.3 293 3.9 168 2.2 166 2.2 120 1.6 244 3.2 7,513 100
TABLE U-21B: STUDENT ACADEMIC YEAR INCOME BY SEGMENT, COURSE LOAD, AND DEPENDENCY STATUS
Source: California Student Aid Commission 129 2003-04 SEARS

ALL UNDERGRADUATES
None Less Than $1,000 $1,000 to $1,999 $2,000 to $2,999 $3,000 to $3,999 $4,000 to $5,999 $6,000 to $11,999 $12,000 to $17,999
# % # % # % # % # % # % # % # %Part-time 938 18.6 263 5.2 245 4.9 201 4.0 243 4.8 358 7.1 735 14.6 428 8.5 Full-time 3,707 25.5 1,596 11.0 1,246 8.6 1,169 8.0 1,096 7.5 1,352 9.3 1,982 13.6 863 5.9 All 4,645 23.7 1,859 9.5 1,491 7.6 1,370 7.0 1,339 6.8 1,710 8.7 2,717 13.9 1,291 6.6
$18,000 to $23,999 $24,000 to $35,999 $36,000 to $47,999 $48,000 to $59,999 $60,000 to $71,999 $72,000 to $83,999 $84,000 to $95,999 $96,000 or More Total
# % # % # % # % # % # % # % # % # %Part-time 347 6.9 392 7.8 284 5.6 171 3.4 113 2.2 91 1.8 69 1.4 162 3.2 5,040 100 Full-time 476 3.3 395 2.7 230 1.6 138 0.9 59 0.4 78 0.5 51 0.4 99 0.7 14,537 100 All 823 4.2 787 4.0 514 2.6 309 1.6 172 0.9 169 0.9 120 0.6 261 1.3 19,577 100
TABLE U-21C: STUDENT ACADEMIC YEAR INCOME BY SEGMENT, COURSE LOAD, AND DEPENDENCY STATUS
Source: California Student Aid Commission 130 2003-04 SEARS

DEPENDENT UNDERGRADUATES INDEPENDENT UNDERGRADUATES ALL UNDERGRADUATES
CCC Part-time 767 8,913$ 5,973$ CCC Part-time 1,370 29,997$ 20,631$ CCC Part-time 2,137 22,430$ 12,278$ Full-time 1,604 6,686$ 4,466$ Full-time 908 16,020$ 9,012$ Full-time 2,512 10,060$ 5,431$ All 2,371 7,406$ 5,270$ All 2,278 24,426$ 17,783$ All 4,649 15,746$ 9,791$
UC Part-time 244 4,754$ 2,390$ UC Part-time 57 18,912$ 9,297$ UC Part-time 301 7,435$ 2,884$ Full-time 1,877 3,785$ 2,387$ Full-time 249 10,964$ 5,293$ Full-time 2,126 4,626$ 2,572$ All 2,121 3,897$ 2,388$ All 306 12,444$ 5,979$ All 2,427 4,974$ 2,620$
CSU Part-time 185 8,938$ 6,785$ CSU Part-time 562 33,325$ 24,338$ CSU Part-time 747 27,285$ 16,710$ Full-time 1,426 6,059$ 4,397$ Full-time 937 18,451$ 11,587$ Full-time 2,363 10,973$ 5,691$
All 1,611 6,390$ 4,634$ All 1,499 24,028$ 15,530$ All 3,110 14,891$ 7,527$ ICU Part-time 96 4,057$ 2,339$ ICU Part-time 146 37,969$ 36,119$ ICU Part-time 242 24,517$ 24,558$ Full-time 1,495 3,510$ 2,219$ Full-time 276 19,467$ 10,898$ Full-time 1,771 5,997$ 2,606$
All 1,591 3,543$ 2,224$ All 422 25,868$ 19,841$ All 2,013 8,224$ 2,917$ PCC Part-time 204 10,277$ 5,935$ PCC Part-time 471 33,109$ 24,971$ PCC Part-time 675 26,209$ 16,809$ Full-time 718 8,661$ 4,696$ Full-time 1,340 24,417$ 19,885$ Full-time 2,058 18,920$ 12,744$
All 922 9,018$ 4,996$ All 1,811 26,678$ 21,167$ All 2,733 20,720$ 13,854$ ALL Part-time 1,496 8,112$ 5,773$ ALL Part-time 2,606 31,481$ 21,113$ ALL Part-time 4,102 22,959$ 12,420$
Full-time 7,120 5,328$ 3,667$ Full-time 3,710 19,584$ 10,609$ Full-time 10,830 10,212$ 4,903$ All 8,616 5,811$ 4,368$ All 6,316 24,493$ 17,388$ All 14,932 13,713$ 8,422$
Note: "None" category was excluded from the means and median calculations.
TABLE M-21: MEAN AND MEDIAN STUDENT ACADEMIC YEAR INCOME BY SEGMENT, COURSE LOAD, AND DEPENDENCY STATUS
MedianMean Median Number MeanNumber Mean Median Number
Source: California Student Aid Commission 131 2003-04 SEARS

Question for Tables: W-22 and U-22
For this current nine-month academic year (2003-04) did you apply for financial aid? 0 Yes 1 No
132 2003-04 SEARS

Applied for Aid Did Not Apply for AidDependent Independent All Dependent Independent All# % # % # % # % # % # % # %
CCC Part-time 146,265 15.1 199,908 20.6 346,173 35.7 239,961 24.7 384,795 39.6 624,756 64.3 970,929 100 Full-time 137,163 32.2 98,405 23.1 235,568 55.3 138,009 32.4 52,523 12.3 190,532 44.7 426,100 100 All 283,428 20.3 298,313 21.4 581,741 41.6 377,970 27.1 437,318 31.3 815,288 58.4 1,397,029 100
UC Part-time 21,646 68.3 3,124 9.9 24,770 78.2 6,153 19.4 747 2.4 6,901 21.8 31,670 100 Full-time 74,838 59.3 11,272 8.9 86,110 68.2 37,843 30.0 2,335 1.8 40,178 31.8 126,288 100 All 96,484 61.1 14,396 9.1 110,880 70.2 43,996 27.9 3,082 2.0 47,079 29.8 157,958 100
CSU Part-time 10,480 15.1 22,790 32.8 33,270 47.8 9,579 13.8 26,709 38.4 36,288 52.2 69,558 100 Full-time 94,023 40.6 61,418 26.5 155,441 67.0 57,317 24.7 19,101 8.2 76,418 33.0 231,859 100 All 104,503 34.7 84,208 27.9 188,711 62.6 66,896 22.2 45,810 15.2 112,706 37.4 301,417 100
ICU Part-time 3,487 23.3 6,710 44.9 10,197 68.2 1,646 11.0 3,113 20.8 4,759 31.8 14,956 100 Full-time 70,952 66.9 15,684 14.8 86,636 81.7 18,012 17.0 1,445 1.4 19,457 18.3 106,093 100 All 74,439 61.5 22,394 18.5 96,833 80.0 19,658 16.2 4,558 3.8 24,216 20.0 121,049 100
PCC Part-time 5,176 19.3 15,764 58.8 20,940 78.1 1,164 4.3 4,714 17.6 5,878 21.9 26,818 100 Full-time 19,656 27.2 39,974 55.4 59,630 82.6 3,569 4.9 9,000 12.5 12,569 17.4 72,199 100 All 24,832 25.1 55,738 56.3 80,570 81.4 4,732 4.8 13,714 13.9 18,447 18.6 99,017 100
ALL Part-time 187,055 16.8 248,295 22.3 435,350 39.1 258,503 23.2 420,078 37.7 678,581 60.9 1,113,931 100 Full-time 396,632 41.2 226,753 23.6 623,385 64.8 254,750 26.5 84,404 8.8 339,154 35.2 962,539 100 All 583,687 28.1 475,048 22.9 1,058,735 51.0 513,252 24.7 504,482 24.3 1,017,735 49.0 2,076,470 100
Total
TABLE W-22: STUDENTS WHO DID OR DID NOT APPLY FOR FINANCIAL AID BY SEGMENT, COURSE LOAD, AND DEPENDENCY STATUS
Source: California Student Aid Commission 133 2003-04 SEARS

Applied for Aid Did Not Apply for AidDependent Independent All Dependent Independent All# % # % # % # % # % # % # %
CCC Part-time 409 15.1 559 20.6 968 35.7 671 24.7 1,076 39.6 1,747 64.3 2,715 100 Full-time 1,136 32.2 815 23.1 1,951 55.3 1,143 32.4 435 12.3 1,578 44.7 3,529 100 All 1,545 24.7 1,374 22.0 2,919 46.7 1,814 29.1 1,511 24.2 3,325 53.3 6,244 100
UC Part-time 343 65.8 55 10.6 398 76.4 107 20.5 16 3.1 123 23.6 521 100 Full-time 1,972 59.3 293 8.8 2,265 68.1 1,000 30.1 60 1.8 1,060 31.9 3,325 100 All 2,315 60.2 348 9.0 2,663 69.2 1,107 28.8 76 2.0 1,183 30.8 3,846 100
CSU Part-time 116 14.3 287 35.3 403 49.6 106 13.1 303 37.3 409 50.4 812 100 Full-time 1,178 39.5 866 29.0 2,044 68.5 706 23.7 232 7.8 938 31.5 2,982 100 All 1,294 34.1 1,153 30.4 2,447 64.5 812 21.4 535 14.1 1,347 35.5 3,794 100
ICU Part-time 102 32.8 112 36.0 214 68.8 48 15.4 49 15.8 97 31.2 311 100 Full-time 1,559 66.8 321 13.8 1,880 80.5 424 18.2 30 1.3 454 19.5 2,334 100 All 1,661 62.8 433 16.4 2,094 79.2 472 17.8 79 3.0 551 20.8 2,645 100
PCC Part-time 231 26.7 450 52.1 681 78.8 55 6.4 128 14.8 183 21.2 864 100 Full-time 886 31.8 1,432 51.4 2,318 83.2 181 6.5 287 10.3 468 16.8 2,786 100 All 1,117 30.6 1,882 51.6 2,999 82.2 236 6.5 415 11.4 651 17.8 3,650 100
ALL Part-time 1,201 23.0 1,463 28.0 2,664 51.0 987 18.9 1,572 30.1 2,559 49.0 5,223 100 Full-time 6,731 45.0 3,727 24.9 10,458 69.9 3,454 23.1 1,044 7.0 4,498 30.1 14,956 100 All 7,932 39.3 5,190 25.7 13,122 65.0 4,441 22.0 2,616 13.0 7,057 35.0 20,179 100
Total
TABLE U-22: STUDENTS WHO DID OR DID NOT APPLY FOR FINANCIAL AID BY SEGMENT, COURSE LOAD, AND DEPENDENCY STATUS
Source: California Student Aid Commission 134 2003-04 SEARS

Question for Tables: W-23, U-23, and M-23
What will be the total amount of scholarships, fellowships, and grant assistance awarded to you for the
current nine-month academic year? Include Pell Grants, Cal Grants, SEOG, or EOPS grants, and any other gift aid (money you do not have to repay) you received or will have received. If an employer is paying for education expenses, include this amount.
00 Nothing 04 $1,000 to $1,999 08 $6,000 to $7,999 12 $14,000 to $15,999 01 Under $200 05 $2,000 to $2,999 09 $8,000 to $9,999 13 $16,000 to $17,999 02 $200 to $499 06 $3,000 to $3,999 10 $10,000 to $11,999 14 $18,000 to $19,999 03 $500 to $999 07 $4,000 to $5,999 11 $12,000 to $13,999 15 $20,000 or more
135 2003-04 SEARS

DEPENDENT UNDERGRADUATES
Nothing Under $200 $200 to $499 $500 to $999 $1,000 to $1,999 $2,000 to $2,999 $3,000 to $3,999 $4,000 to $5,999
# % # % # % # % # % # % # % # %CCC Part-time 281,086 74.9 9,656 2.6 11,086 3.0 11,801 3.1 23,960 6.4 13,232 3.5 11,086 3.0 6,437 1.7
Full-time 163,485 60.4 5,433 2.0 11,229 4.1 13,402 4.9 25,718 9.5 18,232 6.7 12,195 4.5 14,127 5.2 All 444,571 68.8 15,089 2.3 22,315 3.5 25,203 3.9 49,678 7.7 31,464 4.9 23,281 3.6 20,564 3.2
UC Part-time 9,123 34.1 281 1.1 216 0.8 1,027 3.8 1,665 6.2 1,651 6.2 2,588 9.7 2,449 9.2 Full-time 40,923 37.1 1,150 1.0 1,578 1.4 4,653 4.2 7,836 7.1 6,582 6.0 6,357 5.8 9,608 8.7 All 50,046 36.5 1,431 1.0 1,793 1.3 5,680 4.1 9,501 6.9 8,233 6.0 8,945 6.5 12,058 8.8
CSU Part-time 12,802 66.0 78 0.4 153 0.8 580 3.0 1,150 5.9 1,495 7.7 689 3.6 1,423 7.3 Full-time 73,434 49.0 1,116 0.7 2,431 1.6 4,179 2.8 14,280 9.5 15,682 10.5 8,898 5.9 11,699 7.8 All 86,236 51.0 1,193 0.7 2,584 1.5 4,759 2.8 15,430 9.1 17,177 10.2 9,587 5.7 13,122 7.8
ICU Part-time 1,926 39.1 38 0.8 14 0.3 38 0.8 81 1.7 228 4.6 102 2.1 196 4.0 Full-time 16,528 19.3 240 0.3 301 0.4 746 0.9 2,536 3.0 2,768 3.2 2,372 2.8 4,251 5.0 All 18,454 20.4 278 0.3 315 0.3 784 0.9 2,617 2.9 2,996 3.3 2,474 2.7 4,448 4.9
PCC Part-time 2,700 43.4 54 0.9 372 6.0 43 0.7 246 3.9 353 5.7 343 5.5 615 9.9 Full-time 10,512 47.1 547 2.5 503 2.3 498 2.2 924 4.1 1,279 5.7 1,161 5.2 2,170 9.7 All 13,212 46.3 601 2.1 874 3.1 541 1.9 1,170 4.1 1,632 5.7 1,504 5.3 2,785 9.8
ALL Part-time 307,637 71.1 10,106 2.3 11,840 2.7 13,489 3.1 27,103 6.3 16,959 3.9 14,807 3.4 11,121 2.6 Full-time 304,882 47.7 8,486 1.3 16,042 2.5 23,478 3.7 51,293 8.0 44,543 7.0 30,983 4.9 41,856 6.6 All 612,519 57.2 18,592 1.7 27,881 2.6 36,967 3.4 78,395 7.3 61,502 5.7 45,791 4.3 52,977 4.9
$6,000 to $7,999 $8,000 to $9,999 $10,000 to $11,999 $12,000 to $13,999 $14,000 to $15,999 $16,000 to $17,999 $18,000 to $19,999 $20,000 or More Total
# % # % # % # % # % # % # % # % # %CCC Part-time 2,503 0.7 1,431 0.4 715 0.2 715 0.2 358 0.1 358 0.1 358 0.1 715 0.2 375,496 100
Full-time 3,985 1.5 1,207 0.4 362 0.1 604 0.2 241 0.1 121 0.0 121 0.0 362 0.1 270,824 100 All 6,488 1.0 2,638 0.4 1,077 0.2 1,319 0.2 599 0.1 478 0.1 478 0.1 1,077 0.2 646,320 100
UC Part-time 1,415 5.3 1,643 6.1 1,348 5.0 659 2.5 757 2.8 1,106 4.1 599 2.2 211 0.8 26,738 100 Full-time 7,510 6.8 6,295 5.7 5,939 5.4 4,302 3.9 3,040 2.8 2,161 2.0 1,596 1.4 781 0.7 110,309 100 All 8,924 6.5 7,938 5.8 7,287 5.3 4,960 3.6 3,797 2.8 3,267 2.4 2,195 1.6 992 0.7 137,046 100
CSU Part-time 623 3.2 239 1.2 - - 158 0.8 - - - - - - - - 19,390 100 Full-time 7,791 5.2 4,633 3.1 2,450 1.6 1,286 0.9 1,001 0.7 380 0.3 149 0.1 321 0.2 149,728 100 All 8,414 5.0 4,871 2.9 2,450 1.4 1,444 0.9 1,001 0.6 380 0.2 149 0.1 321 0.2 169,118 100
ICU Part-time 258 5.2 125 2.5 175 3.6 94 1.9 315 6.4 83 1.7 178 3.6 1,074 21.8 4,925 100 Full-time 4,725 5.5 5,730 6.7 5,984 7.0 6,626 7.7 5,420 6.3 4,260 5.0 5,543 6.5 17,578 20.5 85,608 100 All 4,983 5.5 5,855 6.5 6,159 6.8 6,720 7.4 5,735 6.3 4,343 4.8 5,721 6.3 18,652 20.6 90,532 100
PCC Part-time 266 4.3 272 4.4 508 8.2 206 3.3 74 1.2 9 0.1 60 1.0 107 1.7 6,228 100 Full-time 706 3.2 596 2.7 1,266 5.7 701 3.1 369 1.7 438 2.0 162 0.7 475 2.1 22,307 100 All 972 3.4 868 3.0 1,773 6.2 907 3.2 443 1.6 447 1.6 222 0.8 582 2.0 28,535 100
ALL Part-time 5,065 1.2 3,710 0.9 2,747 0.6 1,832 0.4 1,504 0.3 1,555 0.4 1,194 0.3 2,107 0.5 432,776 100 Full-time 24,716 3.9 18,461 2.9 16,000 2.5 13,519 2.1 10,071 1.6 7,360 1.2 7,570 1.2 19,518 3.1 638,776 100 All 29,781 2.8 22,171 2.1 18,747 1.7 15,351 1.4 11,575 1.1 8,915 0.8 8,764 0.8 21,625 2.0 1,071,552 100
TABLE W-23A: TOTAL ACADEMIC YEAR GRANT AWARD AMOUNT BY SEGMENT, COURSE LOAD, AND DEPENDENCY STATUS
Source: California Student Aid Commission 136 2003-04 SEARS

INDEPENDENT UNDERGRADUATE
Nothing Under $200 $200 to $499 $500 to $999 $1,000 to $1,999 $2,000 to $2,999 $3,000 to $3,999 $4,000 to $5,999
# % # % # % # % # % # % # % # %CCC Part-time 425,206 74.4 17,166 3.0 22,530 3.9 22,172 3.9 30,397 5.3 17,523 3.1 14,662 2.6 10,013 1.8
Full-time 71,117 48.2 2,777 1.9 5,313 3.6 8,211 5.6 19,077 12.9 13,040 8.8 11,712 7.9 8,331 5.6 All 496,323 69.0 19,943 2.8 27,843 3.9 30,383 4.2 49,474 6.9 30,563 4.3 26,374 3.7 18,344 2.6
UC Part-time 766 20.5 - - 211 5.6 179 4.8 64 1.7 281 7.5 416 11.2 527 14.1 Full-time 2,642 20.0 80 0.6 75 0.6 202 1.5 640 4.9 621 4.7 879 6.7 1,798 13.6 All 3,408 20.1 80 0.5 286 1.7 381 2.2 703 4.2 902 5.3 1,295 7.7 2,325 13.7
CSU Part-time 31,979 64.8 511 1.0 870 1.8 1,821 3.7 3,391 6.9 2,304 4.7 2,469 5.0 2,954 6.0 Full-time 28,933 36.3 572 0.7 847 1.1 1,790 2.2 7,197 9.0 8,861 11.1 6,953 8.7 9,577 12.0 All 60,912 47.2 1,083 0.8 1,716 1.3 3,611 2.8 10,588 8.2 11,165 8.6 9,422 7.3 12,530 9.7
ICU Part-time 4,236 45.0 34 0.4 44 0.5 461 4.9 748 7.9 394 4.2 371 3.9 802 8.5 Full-time 3,289 20.2 44 0.3 - - 137 0.8 531 3.3 810 5.0 837 5.1 1,330 8.2 All 7,525 29.3 79 0.3 44 0.2 598 2.3 1,278 5.0 1,205 4.7 1,208 4.7 2,132 8.3
PCC Part-time 10,504 52.3 79 0.4 318 1.6 495 2.5 863 4.3 741 3.7 1,515 7.5 1,675 8.3 Full-time 23,449 49.2 263 0.6 826 1.7 625 1.3 3,220 6.8 2,644 5.6 1,805 3.8 5,546 11.6 All 33,953 50.1 342 0.5 1,144 1.7 1,121 1.7 4,084 6.0 3,385 5.0 3,320 4.9 7,222 10.7
ALL Part-time 472,691 72.3 17,790 2.7 23,973 3.7 25,128 3.8 35,463 5.4 21,243 3.2 19,432 3.0 15,971 2.4 Full-time 129,430 42.5 3,736 1.2 7,060 2.3 10,966 3.6 30,665 10.1 25,976 8.5 22,187 7.3 26,582 8.7 All 602,121 62.8 21,526 2.2 31,034 3.2 36,093 3.8 66,128 6.9 47,219 4.9 41,619 4.3 42,553 4.4
$6,000 to $7,999 $8,000 to $9,999 $10,000 to $11,999 $12,000 to $13,999 $14,000 to $15,999 $16,000 to $17,999 $18,000 to $19,999 $20,000 or More Total
# % # % # % # % # % # % # % # % # %CCC Part-time 3,576 0.6 2,861 0.5 1,788 0.3 1,073 0.2 358 0.1 358 0.1 358 0.1 1,431 0.3 571,470 100
Full-time 2,898 2.0 2,053 1.4 1,449 1.0 483 0.3 241 0.2 121 0.1 121 0.1 604 0.4 147,546 100 All 6,474 0.9 4,914 0.7 3,237 0.5 1,556 0.2 599 0.1 478 0.1 478 0.1 2,034 0.3 719,017 100
UC Part-time 141 3.8 313 8.4 290 7.8 281 7.5 156 4.2 107 2.9 - - - - 3,730 100 Full-time 1,465 11.1 1,232 9.3 1,646 12.5 753 5.7 510 3.9 219 1.7 309 2.3 119 0.9 13,189 100 All 1,606 9.5 1,544 9.1 1,936 11.4 1,034 6.1 666 3.9 327 1.9 309 1.8 119 0.7 16,919 100
CSU Part-time 1,149 2.3 953 1.9 268 0.5 158 0.3 42 0.1 304 0.6 - - 158 0.3 49,330 100 Full-time 5,984 7.5 3,528 4.4 2,236 2.8 1,775 2.2 1,028 1.3 216 0.3 42 0.1 248 0.3 79,788 100 All 7,133 5.5 4,481 3.5 2,505 1.9 1,933 1.5 1,070 0.8 519 0.4 42 0.0 407 0.3 129,118 100
ICU Part-time 661 7.0 118 1.3 983 10.4 237 2.5 - - 47 0.5 - - 276 2.9 9,414 100 Full-time 1,199 7.4 1,123 6.9 1,435 8.8 1,205 7.4 574 3.5 613 3.8 776 4.8 2,381 14.6 16,284 100 All 1,860 7.2 1,241 4.8 2,418 9.4 1,442 5.6 574 2.2 660 2.6 776 3.0 2,657 10.3 25,698 100
PCC Part-time 712 3.5 467 2.3 1,368 6.8 342 1.7 485 2.4 203 1.0 164 0.8 169 0.8 20,103 100 Full-time 2,870 6.0 1,089 2.3 2,221 4.7 646 1.4 606 1.3 191 0.4 210 0.4 1,402 2.9 47,614 100 All 3,582 5.3 1,557 2.3 3,589 5.3 988 1.5 1,091 1.6 394 0.6 374 0.6 1,571 2.3 67,717 100
ALL Part-time 6,239 1.0 4,712 0.7 4,697 0.7 2,092 0.3 1,041 0.2 1,018 0.2 522 0.1 2,034 0.3 654,047 100 Full-time 14,416 4.7 9,025 3.0 8,987 3.0 4,861 1.6 2,959 1.0 1,360 0.4 1,458 0.5 4,754 1.6 304,421 100 All 20,655 2.2 13,737 1.4 13,684 1.4 6,953 0.7 4,000 0.4 2,378 0.2 1,980 0.2 6,788 0.7 958,468 100
TABLE W-23B: TOTAL ACADEMIC YEAR GRANT AWARD AMOUNT BY SEGMENT, COURSE LOAD, AND DEPENDENCY STATUS
Source: California Student Aid Commission 137 2003-04 SEARS

ALL UNDERGRADUATES
Nothing Under $200 $200 to $499 $500 to $999 $1,000 to $1,999 $2,000 to $2,999 $3,000 to $3,999 $4,000 to $5,999
# % # % # % # % # % # % # % # %Part-time 780,329 71.8 27,896 2.6 35,813 3.3 38,616 3.6 62,566 5.8 38,202 3.5 34,240 3.2 27,092 2.5 Full-time 434,312 46.0 12,222 1.3 23,102 2.4 34,443 3.7 81,958 8.7 70,518 7.5 53,170 5.6 68,438 7.3 All 1,214,640 59.8 40,118 2.0 58,915 2.9 73,060 3.6 144,523 7.1 108,721 5.4 87,410 4.3 95,530 4.7
$6,000 to $7,999 $8,000 to $9,999 $10,000 to $11,999 $12,000 to $13,999 $14,000 to $15,999 $16,000 to $17,999 $18,000 to $19,999 $20,000 or More Total
# % # % # % # % # % # % # % # % # %Part-time 11,304 1.0 8,422 0.8 7,444 0.7 3,924 0.4 2,544 0.2 2,574 0.2 1,716 0.2 4,141 0.4 1,086,823 100 Full-time 39,132 4.1 27,486 2.9 24,987 2.6 18,379 1.9 13,030 1.4 8,720 0.9 9,028 1.0 24,271 2.6 943,197 100 All 50,436 2.5 35,908 1.8 32,431 1.6 22,303 1.1 15,574 0.8 11,293 0.6 10,744 0.5 28,413 1.4 2,030,020 100
TABLE W-23C: TOTAL ACADEMIC YEAR GRANT AWARD AMOUNT BY SEGMENT, COURSE LOAD, AND DEPENDENCY STATUS
Source: California Student Aid Commission 138 2003-04 SEARS

DEPENDENT UNDERGRADUATES
Nothing Under $200 $200 to $499 $500 to $999 $1,000 to $1,999 $2,000 to $2,999 $3,000 to $3,999 $4,000 to $5,999
# % # % # % # % # % # % # % # %CCC Part-time 786 74.9 27 2.6 31 3.0 33 3.1 67 6.4 37 3.5 31 3.0 18 1.7
Full-time 1,354 60.4 45 2.0 93 4.1 111 4.9 213 9.5 151 6.7 101 4.5 117 5.2 All 2,140 65.0 72 2.2 124 3.8 144 4.4 280 8.5 188 5.7 132 4.0 135 4.1
UC Part-time 153 35.3 4 0.9 4 0.9 16 3.7 27 6.2 26 6.0 41 9.5 38 8.8 Full-time 1,083 37.2 28 1.0 40 1.4 120 4.1 203 7.0 172 5.9 168 5.8 260 8.9 All 1,236 37.0 32 1.0 44 1.3 136 4.1 230 6.9 198 5.9 209 6.3 298 8.9
CSU Part-time 135 62.8 1 0.5 2 0.9 6 2.8 16 7.4 17 7.9 10 4.7 16 7.4 Full-time 903 48.3 17 0.9 32 1.7 59 3.2 190 10.2 180 9.6 104 5.6 141 7.5 All 1,038 49.8 18 0.9 34 1.6 65 3.1 206 9.9 197 9.5 114 5.5 157 7.5
ICU Part-time 52 35.9 1 0.7 2 1.4 1 0.7 4 2.8 4 2.8 2 1.4 7 4.8 Full-time 364 19.1 7 0.4 9 0.5 15 0.8 62 3.2 61 3.2 51 2.7 98 5.1 All 416 20.3 8 0.4 11 0.5 16 0.8 66 3.2 65 3.2 53 2.6 105 5.1
PCC Part-time 138 49.8 4 1.4 8 2.9 3 1.1 16 5.8 18 6.5 15 5.4 23 8.3 Full-time 496 48.0 13 1.3 29 2.8 32 3.1 51 4.9 67 6.5 65 6.3 92 8.9 All 634 48.4 17 1.3 37 2.8 35 2.7 67 5.1 85 6.5 80 6.1 115 8.8
ALL Part-time 1,264 59.6 37 1.7 47 2.2 59 2.8 130 6.1 102 4.8 99 4.7 102 4.8 Full-time 4,200 42.2 110 1.1 203 2.0 337 3.4 719 7.2 631 6.3 489 4.9 708 7.1 All 5,464 45.2 147 1.2 250 2.1 396 3.3 849 7.0 733 6.1 588 4.9 810 6.7
$6,000 to $7,999 $8,000 to $9,999 $10,000 to $11,999 $12,000 to $13,999 $14,000 to $15,999 $16,000 to $17,999 $18,000 to $19,999 $20,000 or More Total
# % # % # % # % # % # % # % # % # %CCC Part-time 7 0.7 4 0.4 2 0.2 2 0.2 1 0.1 1 0.1 1 0.1 2 0.2 1,050 100
Full-time 33 1.5 10 0.4 3 0.1 5 0.2 2 0.1 1 0.0 1 0.0 3 0.1 2,243 100 All 40 1.2 14 0.4 5 0.2 7 0.2 3 0.1 2 0.1 2 0.1 5 0.2 3,293 100
UC Part-time 22 5.1 29 6.7 22 5.1 10 2.3 12 2.8 17 3.9 9 2.1 3 0.7 433 100 Full-time 197 6.8 168 5.8 157 5.4 114 3.9 80 2.8 56 1.9 42 1.4 20 0.7 2,908 100 All 219 6.6 197 5.9 179 5.4 124 3.7 92 2.8 73 2.2 51 1.5 23 0.7 3,341 100
CSU Part-time 7 3.3 4 1.9 - - 1 0.5 - - - - - - - - 215 100 Full-time 97 5.2 64 3.4 35 1.9 20 1.1 14 0.7 7 0.4 2 0.1 4 0.2 1,869 100 All 104 5.0 68 3.3 35 1.7 21 1.0 14 0.7 7 0.3 2 0.1 4 0.2 2,084 100
ICU Part-time 7 4.8 5 3.4 6 4.1 4 2.8 9 6.2 4 2.8 5 3.4 32 22.1 145 100 Full-time 98 5.1 125 6.6 125 6.6 124 6.5 124 6.5 104 5.5 120 6.3 421 22.1 1,908 100 All 105 5.1 130 6.3 131 6.4 128 6.2 133 6.5 108 5.3 125 6.1 453 22.1 2,053 100
PCC Part-time 15 5.4 5 1.8 11 4.0 6 2.2 5 1.8 1 0.4 3 1.1 6 2.2 277 100 Full-time 38 3.7 31 3.0 33 3.2 35 3.4 15 1.5 12 1.2 9 0.9 16 1.5 1,034 100 All 53 4.0 36 2.7 44 3.4 41 3.1 20 1.5 13 1.0 12 0.9 22 1.7 1,311 100
ALL Part-time 58 2.7 47 2.2 41 1.9 23 1.1 27 1.3 23 1.1 18 0.8 43 2.0 2,120 100 Full-time 463 4.6 398 4.0 353 3.5 298 3.0 235 2.4 180 1.8 174 1.7 464 4.7 9,962 100 All 521 4.3 445 3.7 394 3.3 321 2.7 262 2.2 203 1.7 192 1.6 507 4.2 12,082 100
TABLE U-23A: TOTAL ACADEMIC YEAR GRANT AWARD AMOUNT BY SEGMENT, COURSE LOAD, AND DEPENDENCY STATUS
Source: California Student Aid Commission 139 2003-04 SEARS

INDEPENDENT UNDERGRADUATE
Nothing Under $200 $200 to $499 $500 to $999 $1,000 to $1,999 $2,000 to $2,999 $3,000 to $3,999 $4,000 to $5,999
# % # % # % # % # % # % # % # %CCC Part-time 1,189 74.4 48 3.0 63 3.9 62 3.9 85 5.3 49 3.1 41 2.6 28 1.8
Full-time 589 48.2 23 1.9 44 3.6 68 5.6 158 12.9 108 8.8 97 7.9 69 5.6 All 1,778 63.0 71 2.5 107 3.8 130 4.6 243 8.6 157 5.6 138 4.9 97 3.4
UC Part-time 16 23.2 - - 3 4.3 3 4.3 2 2.9 4 5.8 7 10.1 11 15.9 Full-time 70 20.5 2 0.6 2 0.6 5 1.5 17 5.0 16 4.7 22 6.4 45 13.2 All 86 20.9 2 0.5 5 1.2 8 1.9 19 4.6 20 4.9 29 7.1 56 13.6
CSU Part-time 362 61.8 4 0.7 13 2.2 19 3.2 44 7.5 36 6.1 34 5.8 37 6.3 Full-time 373 34.1 7 0.6 11 1.0 24 2.2 91 8.3 127 11.6 100 9.1 152 13.9 All 735 43.7 11 0.7 24 1.4 43 2.6 135 8.0 163 9.7 134 8.0 189 11.2
ICU Part-time 69 44.8 1 0.6 1 0.6 8 5.2 14 9.1 7 4.5 7 4.5 12 7.8 Full-time 68 20.2 1 0.3 - - 2 0.6 12 3.6 16 4.8 14 4.2 30 8.9 All 137 28.0 2 0.4 1 0.2 10 2.0 26 5.3 23 4.7 21 4.3 42 8.6
PCC Part-time 291 52.1 5 0.9 10 1.8 12 2.1 33 5.9 34 6.1 35 6.3 47 8.4 Full-time 760 45.5 15 0.9 31 1.9 23 1.4 84 5.0 95 5.7 104 6.2 237 14.2 All 1,051 47.2 20 0.9 41 1.8 35 1.6 117 5.2 129 5.8 139 6.2 284 12.7
ALL Part-time 1,927 65.0 58 2.0 90 3.0 104 3.5 178 6.0 130 4.4 124 4.2 135 4.6 Full-time 1,860 39.9 48 1.0 88 1.9 122 2.6 362 7.8 362 7.8 337 7.2 533 11.4 All 3,787 49.6 106 1.4 178 2.3 226 3.0 540 7.1 492 6.4 461 6.0 668 8.8
$6,000 to $7,999 $8,000 to $9,999 $10,000 to $11,999 $12,000 to $13,999 $14,000 to $15,999 $16,000 to $17,999 $18,000 to $19,999 $20,000 or More Total
# % # % # % # % # % # % # % # % # %CCC Part-time 10 0.6 8 0.5 5 0.3 3 0.2 1 0.1 1 0.1 1 0.1 4 0.3 1,598 100
Full-time 24 2.0 17 1.4 12 1.0 4 0.3 2 0.2 1 0.1 1 0.1 5 0.4 1,222 100 All 34 1.2 25 0.9 17 0.6 7 0.2 3 0.1 2 0.1 2 0.1 9 0.3 2,820 100
UC Part-time 2 2.9 7 10.1 5 7.2 4 5.8 3 4.3 2 2.9 - - - - 69 100 Full-time 38 11.1 32 9.4 43 12.6 20 5.8 13 3.8 6 1.8 8 2.3 3 0.9 342 100 All 40 9.7 39 9.5 48 11.7 24 5.8 16 3.9 8 1.9 8 1.9 3 0.7 411 100
CSU Part-time 14 2.4 9 1.5 5 0.9 1 0.2 1 0.2 3 0.5 - - 4 0.7 586 100 Full-time 81 7.4 49 4.5 32 2.9 27 2.5 13 1.2 4 0.4 1 0.1 3 0.3 1,095 100 All 95 5.7 58 3.5 37 2.2 28 1.7 14 0.8 7 0.4 1 0.1 7 0.4 1,681 100
ICU Part-time 12 7.8 3 1.9 8 5.2 5 3.2 - - 1 0.6 - - 6 3.9 154 100 Full-time 24 7.1 25 7.4 30 8.9 23 6.8 13 3.9 13 3.9 16 4.8 49 14.6 336 100 All 36 7.3 28 5.7 38 7.8 28 5.7 13 2.7 14 2.9 16 3.3 55 11.2 490 100
PCC Part-time 21 3.8 19 3.4 25 4.5 7 1.3 7 1.3 5 0.9 4 0.7 4 0.7 559 100 Full-time 100 6.0 53 3.2 72 4.3 25 1.5 18 1.1 13 0.8 7 0.4 33 2.0 1,670 100 All 121 5.4 72 3.2 97 4.4 32 1.4 25 1.1 18 0.8 11 0.5 37 1.7 2,229 100
ALL Part-time 59 2.0 46 1.6 48 1.6 20 0.7 12 0.4 12 0.4 5 0.2 18 0.6 2,966 100 Full-time 267 5.7 176 3.8 189 4.1 99 2.1 59 1.3 37 0.8 33 0.7 93 2.0 4,665 100 All 326 4.3 222 2.9 237 3.1 119 1.6 71 0.9 49 0.6 38 0.5 111 1.5 7,631 100
TABLE U-23B: TOTAL ACADEMIC YEAR GRANT AWARD AMOUNT BY SEGMENT, COURSE LOAD, AND DEPENDENCY STATUS
Source: California Student Aid Commission 140 2003-04 SEARS

ALL UNDERGRADUATES
Nothing Under $200 $200 to $499 $500 to $999 $1,000 to $1,999 $2,000 to $2,999 $3,000 to $3,999 $4,000 to $5,999
# % # % # % # % # % # % # % # %Part-time 3,191 62.7 95 1.9 137 2.7 163 3.2 308 6.1 232 4.6 223 4.4 237 4.7 Full-time 6,060 41.4 158 1.1 291 2.0 459 3.1 1,081 7.4 993 6.8 826 5.6 1,241 8.5 All 9,251 46.9 253 1.3 428 2.2 622 3.2 1,389 7.0 1,225 6.2 1,049 5.3 1,478 7.5
$6,000 to $7,999 $8,000 to $9,999 $10,000 to $11,999 $12,000 to $13,999 $14,000 to $15,999 $16,000 to $17,999 $18,000 to $19,999 $20,000 or More Total
# % # % # % # % # % # % # % # % # %Part-time 117 2.3 93 1.8 89 1.7 43 0.8 39 0.8 35 0.7 23 0.5 61 1.2 5,086 100 Full-time 730 5.0 574 3.9 542 3.7 397 2.7 294 2.0 217 1.5 207 1.4 557 3.8 14,627 100 All 847 4.3 667 3.4 631 3.2 440 2.2 333 1.7 252 1.3 230 1.2 618 3.1 19,713 100
TABLE U-23C: TOTAL ACADEMIC YEAR GRANT AWARD AMOUNT BY SEGMENT, COURSE LOAD, AND DEPENDENCY STATUS
Source: California Student Aid Commission 141 2003-04 SEARS

DEPENDENT UNDERGRADUATES INDEPENDENT UNDERGRADUATES ALL UNDERGRADUATES
CCC Part-time 264 2,484$ 1,611$ CCC Part-time 409 2,391$ 1,370$ CCC Part-time 673 2,427$ 1,476$ Full-time 889 2,591$ 1,917$ Full-time 633 3,059$ 2,217$ Full-time 1,522 2,786$ 2,022$ All 1,153 2,567$ 1,769$ All 1,042 2,797$ 1,670$ All 2,195 2,676$ 1,720$
UC Part-time 280 6,939$ 5,126$ UC Part-time 53 6,770$ 5,259$ UC Part-time 333 6,912$ 5,150$ Full-time 1,825 6,685$ 5,360$ Full-time 272 7,982$ 7,335$ Full-time 2,097 6,853$ 5,632$ All 2,105 6,718$ 5,312$ All 325 7,784$ 6,975$ All 2,430 6,861$ 5,532$
CSU Part-time 80 3,560$ 2,891$ CSU Part-time 224 3,912$ 2,903$ CSU Part-time 304 3,819$ 2,899$ Full-time 966 4,360$ 3,051$ Full-time 722 5,045$ 7,368$ Full-time 1,688 4,653$ 3,417$
All 1,046 4,299$ 3,030$ All 946 4,777$ 3,629$ All 1,992 4,526$ 3,327$ ICU Part-time 93 13,350$ 14,951$ ICU Part-time 85 6,311$ 5,337$ ICU Part-time 178 9,989$ 7,166$ Full-time 1,544 13,262$ 13,474$ Full-time 268 11,304$ 10,676$ Full-time 1,812 12,972$ 13,005$
All 1,637 13,267$ 13,526$ All 353 10,102$ 9,098$ All 1,990 12,705$ 12,527$ PCC Part-time 139 6,230$ 5,149$ PCC Part-time 268 5,743$ 4,971$ PCC Part-time 407 5,909$ 5,019$ Full-time 538 6,071$ 4,907$ Full-time 910 6,102$ 4,961$ Full-time 1,448 6,091$ 4,946$
All 677 6,103$ 4,961$ All 1,178 6,020$ 4,964$ All 1,855 6,051$ 4,963$ ALL Part-time 856 5,830$ 2,001$ ALL Part-time 1,039 4,127$ 1,671$ ALL Part-time 1,895 4,897$ 1,813$
Full-time 5,762 7,369$ 3,744$ Full-time 2,805 5,823$ 3,406$ Full-time 8,567 6,862$ 3,603$ All 6,618 7,170$ 3,133$ All 3,844 5,364$ 2,494$ All 10,462 6,506$ 2,836$
Note: "Nothing" category was excluded from the means and median calculations.
TABLE M-23: MEAN AND MEDIAN TOTAL ACADEMIC YEAR GRANT AWARD AMOUNT BY SEGMENT, COURSE LOAD, AND DEPENDENCY STATUS
Number Mean Median Number MedianMean Median Number Mean
Source: California Student Aid Commission 142 2003-04 SEARS

Question for Tables: W-24, U-24, and M-24
What will be the total amount you will borrow to help pay for your educational and living expenses for
the current nine-month academic year? Include loans from this school, banks, credit cards, friends or family. Do NOT include grants, scholarships or fellowships, or income from a job. If your spouse borrowed money for his/her educational expenses, do NOT include his/her loans in this amount.
00 Nothing 04 $2,000 to $2,999 08 $8,000 to $9,999 12 $16,000 to $17,999 01 Under $500 05 $3,000 to $3,999 09 $10,000 to $11,999 13 $18,000 to $19,999 02 $500 to $999 06 $4,000 to $5,999 10 $12,000 to $13,999 14 $20,000 or more 03 $1,000 to $1,999 07 $6,000 to $7,999 11 $14,000 to $15,999
143 2003-04 SEARS

DEPENDENT UNDERGRADUATES
Nothing Under $500 $500 to $999 $1,000 to $1,999 $2,000 to $2,999 $3,000 to $3,999 $4,000 to $5,999 $6,000 to $7,999
# % # % # % # % # % # % # % # %CCC Part-time 262,133 69.5 46,848 12.4 15,735 4.2 11,444 3.0 13,232 3.5 5,007 1.3 8,583 2.3 2,503 0.7
Full-time 194,758 72.2 23,666 8.8 13,644 5.1 9,901 3.7 6,399 2.4 4,830 1.8 4,347 1.6 2,777 1.0 All 456,891 70.7 70,514 10.9 29,379 4.5 21,345 3.3 19,631 3.0 9,836 1.5 12,930 2.0 5,280 0.8
UC Part-time 9,552 35.9 751 2.8 1,048 3.9 1,056 4.0 2,550 9.6 2,022 7.6 2,469 9.3 2,191 8.2 Full-time 48,412 44.0 2,169 2.0 2,407 2.2 3,955 3.6 6,030 5.5 6,469 5.9 12,547 11.4 7,116 6.5 All 57,964 42.4 2,920 2.1 3,455 2.5 5,011 3.7 8,580 6.3 8,491 6.2 15,016 11.0 9,307 6.8
CSU Part-time 9,087 46.6 1,159 5.9 875 4.5 1,827 9.4 1,955 10.0 920 4.7 2,179 11.2 309 1.6 Full-time 79,954 53.4 5,837 3.9 4,856 3.2 8,735 5.8 11,360 7.6 6,396 4.3 14,212 9.5 5,968 4.0 All 89,041 52.6 6,996 4.1 5,731 3.4 10,561 6.2 13,315 7.9 7,316 4.3 16,391 9.7 6,277 3.7
ICU Part-time 1,915 38.3 183 3.7 34 0.7 148 3.0 67 1.3 344 6.9 361 7.2 373 7.5 Full-time 26,120 30.5 795 0.9 727 0.8 2,404 2.8 5,729 6.7 6,795 7.9 9,143 10.7 6,137 7.2 All 28,035 30.9 978 1.1 760 0.8 2,552 2.8 5,795 6.4 7,139 7.9 9,505 10.5 6,509 7.2
PCC Part-time 1,463 23.9 43 0.7 134 2.2 78 1.3 335 5.5 284 4.6 373 6.1 500 8.2 Full-time 4,816 21.5 143 0.6 203 0.9 345 1.5 1,022 4.6 877 3.9 1,006 4.5 2,382 10.7All 6,279 22.0 187 0.7 337 1.2 423 1.5 1,357 4.8 1,161 4.1 1,379 4.8 2,882 10.1
ALL Part-time 284,150 65.4 48,984 11.3 17,825 4.1 14,552 3.4 18,139 4.2 8,577 2.0 13,965 3.2 5,876 1.4 Full-time 354,060 55.6 32,611 5.1 21,836 3.4 25,340 4.0 30,539 4.8 25,367 4.0 41,255 6.5 24,380 3.8 All 638,210 59.6 81,595 7.6 39,662 3.7 39,892 3.7 48,679 4.5 33,944 3.2 55,220 5.2 30,256 2.8
$8,000 to $9,999 $10,000 to $11,999 $12,000 to $13,999 $14,000 to $15,999 $16,000 to $17,999 $18,000 to $19,999 $20,000 or More Total
# % # % # % # % # % # % # % # %CCC Part-time 2,146 0.6 1,431 0.4 2,503 0.7 358 0.1 715 0.2 715 0.2 3,576 0.9 376,928 100
Full-time 1,328 0.5 1,570 0.6 1,328 0.5 966 0.4 241 0.1 - - 3,864 1.4 269,619 100All 3,474 0.5 3,000 0.5 3,832 0.6 1,324 0.2 957 0.1 715 0.1 7,440 1.2 646,548 100
UC Part-time 1,446 5.4 858 3.2 311 1.2 607 2.3 529 2.0 530 2.0 722 2.7 26,641 100Full-time 4,403 4.0 4,327 3.9 2,539 2.3 3,120 2.8 2,343 2.1 1,166 1.1 3,035 2.8 110,038 100All 5,848 4.3 5,186 3.8 2,850 2.1 3,727 2.7 2,872 2.1 1,696 1.2 3,756 2.7 136,678 100
CSU Part-time 386 2.0 347 1.8 221 1.1 221 1.1 19 0.1 - - - - 19,505 100Full-time 2,947 2.0 3,354 2.2 2,131 1.4 1,042 0.7 1,080 0.7 150 0.1 1,622 1.1 149,645 100All 3,333 2.0 3,701 2.2 2,352 1.4 1,263 0.7 1,099 0.6 150 0.1 1,622 1.0 169,149 100
ICU Part-time 320 6.4 339 6.8 50 1.0 86 1.7 - - 54 1.1 724 14.5 4,998 100Full-time 5,577 6.5 4,422 5.2 2,580 3.0 2,838 3.3 2,142 2.5 1,637 1.9 8,541 10.0 85,587 100All 5,897 6.5 4,760 5.3 2,630 2.9 2,924 3.2 2,142 2.4 1,692 1.9 9,265 10.2 90,585 100
PCC Part-time 336 5.5 679 11.1 343 5.6 220 3.6 132 2.2 324 5.3 877 14.3 6,118 100Full-time 1,506 6.7 1,726 7.7 925 4.1 1,148 5.1 1,066 4.8 1,171 5.2 4,023 18.0 22,360 100All 1,841 6.5 2,405 8.4 1,268 4.5 1,368 4.8 1,199 4.2 1,494 5.2 4,900 17.2 28,478 100
ALL Part-time 4,633 1.1 3,654 0.8 3,427 0.8 1,491 0.3 1,395 0.3 1,623 0.4 5,899 1.4 434,190 100Full-time 15,760 2.5 15,399 2.4 9,504 1.5 9,114 1.4 6,873 1.1 4,125 0.6 21,085 3.3 637,248 100All 20,393 1.9 19,053 1.8 12,931 1.2 10,604 1.0 8,268 0.8 5,748 0.5 26,984 2.5 1,071,438 100
TABLE W-24A: TOTAL ACADEMIC YEAR BORROWING BY SEGMENT, COURSE LOAD, AND DEPENDENCY STATUS
Source: California Student Aid Commission 144 2003-04 SEARS

INDEPENDENT UNDERGRADUATES
Nothing Under $500 $500 to $999 $1,000 to $1,999 $2,000 to $2,999 $3,000 to $3,999 $4,000 to $5,999 $6,000 to $7,999
# % # % # % # % # % # % # % # %CCC Part-time 406,252 71.2 45,060 7.9 18,954 3.3 20,742 3.6 16,808 2.9 14,662 2.6 13,947 2.4 6,437 1.1
Full-time 86,935 58.3 10,867 7.3 7,969 5.3 7,124 4.8 7,486 5.0 6,037 4.0 6,641 4.5 5,675 3.8 All 493,187 68.5 55,927 7.8 26,923 3.7 27,866 3.9 24,294 3.4 20,699 2.9 20,588 2.9 12,112 1.7
UC Part-time 897 24.0 70 1.9 259 6.9 37 1.0 351 9.4 211 5.6 559 15.0 419 11.2Full-time 3,369 25.5 268 2.0 250 1.9 399 3.0 583 4.4 676 5.1 1,899 14.3 1,701 12.9All 4,266 25.1 339 2.0 509 3.0 436 2.6 934 5.5 886 5.2 2,458 14.5 2,121 12.5
CSU Part-time 23,097 46.9 1,134 2.3 1,413 2.9 3,284 6.7 3,436 7.0 2,860 5.8 5,841 11.9 1,462 3.0 Full-time 25,635 32.1 1,958 2.5 1,828 2.3 4,349 5.4 4,333 5.4 6,478 8.1 13,726 17.2 6,251 7.8 All 48,732 37.7 3,092 2.4 3,241 2.5 7,633 5.9 7,769 6.0 9,339 7.2 19,567 15.2 7,713 6.0
ICU Part-time 2,578 27.1 113 1.2 - - 130 1.4 280 2.9 454 4.8 513 5.4 891 9.4 Full-time 2,649 16.2 118 0.7 184 1.1 137 0.8 326 2.0 874 5.3 1,896 11.6 1,642 10.0All 5,226 20.2 231 0.9 184 0.7 267 1.0 606 2.3 1,328 5.1 2,409 9.3 2,533 9.8
PCC Part-time 5,575 27.7 100 0.5 86 0.4 395 2.0 520 2.6 823 4.1 1,699 8.4 2,298 11.4Full-time 10,415 21.8 296 0.6 743 1.6 659 1.4 1,296 2.7 1,774 3.7 3,581 7.5 5,078 10.6All 15,990 23.6 396 0.6 829 1.2 1,054 1.6 1,816 2.7 2,598 3.8 5,280 7.8 7,376 10.9
ALL Part-time 438,398 67.1 46,477 7.1 20,712 3.2 24,588 3.8 21,396 3.3 19,010 2.9 22,560 3.5 11,507 1.8 Full-time 129,002 42.1 13,508 4.4 10,973 3.6 12,668 4.1 14,025 4.6 15,840 5.2 27,743 9.1 20,347 6.6 All 567,401 59.1 59,985 6.3 31,686 3.3 37,256 3.9 35,420 3.7 34,850 3.6 50,302 5.2 31,854 3.3
$8,000 to $9,999 $10,000 to $11,999 $12,000 to $13,999 $14,000 to $15,999 $16,000 to $17,999 $18,000 to $19,999 $20,000 or More Total
# % # % # % # % # % # % # % # %CCC Part-time 5,007 0.9 8,940 1.6 3,576 0.6 1,431 0.3 715 0.1 1,073 0.2 6,795 1.2 570,399 100
Full-time 2,173 1.5 1,570 1.1 1,690 1.1 724 0.5 362 0.2 483 0.3 3,381 2.3 149,118 100All 7,180 1.0 10,510 1.5 5,267 0.7 2,155 0.3 1,077 0.1 1,556 0.2 10,176 1.4 719,516 100
UC Part-time 465 12.5 49 1.3 178 4.8 199 5.3 - - - - 37 1.0 3,730 100Full-time 943 7.1 1,326 10.0 643 4.9 527 4.0 230 1.7 76 0.6 345 2.6 13,235 100All 1,408 8.3 1,375 8.1 821 4.8 725 4.3 230 1.4 76 0.4 382 2.3 16,966 100
CSU Part-time 1,695 3.4 2,231 4.5 777 1.6 530 1.1 139 0.3 354 0.7 1,018 2.1 49,271 100Full-time 3,296 4.1 6,154 7.7 1,734 2.2 1,892 2.4 313 0.4 356 0.4 1,555 1.9 79,860 100All 4,991 3.9 8,385 6.5 2,510 1.9 2,423 1.9 452 0.4 711 0.6 2,573 2.0 129,132 100
ICU Part-time 859 9.0 1,721 18.1 381 4.0 641 6.7 70 0.7 133 1.4 740 7.8 9,503 100Full-time 765 4.7 2,332 14.3 1,470 9.0 969 5.9 363 2.2 297 1.8 2,332 14.3 16,352 100All 1,624 6.3 4,053 15.7 1,851 7.2 1,610 6.2 433 1.7 430 1.7 3,072 11.9 25,856 100
PCC Part-time 1,283 6.4 2,844 14.1 1,002 5.0 683 3.4 320 1.6 404 2.0 2,089 10.4 20,122 100Full-time 3,331 7.0 5,826 12.2 3,113 6.5 1,940 4.1 1,578 3.3 1,416 3.0 6,720 14.1 47,765 100All 4,614 6.8 8,670 12.8 4,114 6.1 2,623 3.9 1,898 2.8 1,821 2.7 8,809 13.0 67,888 100
ALL Part-time 9,308 1.4 15,785 2.4 5,913 0.9 3,484 0.5 1,244 0.2 1,964 0.3 10,678 1.6 653,026 100Full-time 10,508 3.4 17,208 5.6 8,650 2.8 6,052 2.0 2,846 0.9 2,630 0.9 14,334 4.7 306,331 100All 19,816 2.1 32,993 3.4 14,563 1.5 9,536 1.0 4,090 0.4 4,594 0.5 25,012 2.6 959,357 100
TABLE W-24B TOTAL ACADEMIC YEAR BORROWING BY SEGMENT, COURSE LOAD, AND DEPENDENCY STATUS
Source: California Student Aid Commission 145 2003-04 SEARS

ALL UNDERGRADUATES
Nothing Under $500 $500 to $999 $1,000 to $1,999 $2,000 to $2,999 $3,000 to $3,999 $4,000 to $5,999 $6,000 to $7,999
# % # % # % # % # % # % # % # %Part-time 722,549 66.5 95,461 8.8 38,537 3.5 39,140 3.6 39,535 3.6 27,587 2.5 36,525 3.4 17,383 1.6 Full-time 483,062 51.2 46,118 4.9 32,810 3.5 38,008 4.0 44,564 4.7 41,207 4.4 68,998 7.3 44,727 4.7 All 1,205,611 59.4 141,579 7.0 71,347 3.5 77,148 3.8 84,099 4.1 68,794 3.4 105,522 5.2 62,110 3.1
$8,000 to $9,999 $10,000 to $11,999 $12,000 to $13,999 $14,000 to $15,999 $16,000 to $17,999 $18,000 to $19,999 $20,000 or More Total
# % # % # % # % # % # % # % # %Part-time 13,942 1.3 19,439 1.8 9,340 0.9 4,975 0.5 2,639 0.2 3,587 0.3 16,577 1.5 1,087,216 100 Full-time 26,268 2.8 32,607 3.5 18,154 1.9 15,165 1.6 9,719 1.0 6,754 0.7 35,419 3.8 943,579 100 All 40,210 2.0 52,046 2.6 27,494 1.4 20,140 1.0 12,358 0.6 10,342 0.5 51,996 2.6 2,030,795 100
TABLE W-24C: TOTAL ACADEMIC YEAR BORROWING BY SEGMENT, COURSE LOAD, AND DEPENDENCY STATUS
Source: California Student Aid Commission 146 2003-04 SEARS

DEPENDENT UNDERGRADUATES
Nothing Under $500 $500 to $999 $1,000 to $1,999 $2,000 to $2,999 $3,000 to $3,999 $4,000 to $5,999 $6,000 to $7,999
# % # % # % # % # % # % # % # %CCC Part-time 733 69.5 131 12.4 44 4.2 32 3.0 37 3.5 14 1.3 24 2.3 7 0.7
Full-time 1,613 72.2 196 8.8 113 5.1 82 3.7 53 2.4 40 1.8 36 1.6 23 1.0 All 2,346 71.4 327 9.9 157 4.8 114 3.5 90 2.7 54 1.6 60 1.8 30 0.9
UC Part-time 159 36.9 11 2.6 17 3.9 18 4.2 38 8.8 32 7.4 39 9.0 36 8.4 Full-time 1,273 43.9 58 2.0 64 2.2 101 3.5 164 5.7 169 5.8 329 11.3 192 6.6 All 1,432 43.0 69 2.1 81 2.4 119 3.6 202 6.1 201 6.0 368 11.0 228 6.8
CSU Part-time 102 47.2 10 4.6 10 4.6 17 7.9 22 10.2 13 6.0 24 11.1 4 1.9 Full-time 976 52.3 75 4.0 61 3.3 115 6.2 133 7.1 88 4.7 179 9.6 73 3.9 All 1,078 51.8 85 4.1 71 3.4 132 6.3 155 7.4 101 4.8 203 9.7 77 3.7
ICU Part-time 56 38.6 4 2.8 1 0.7 6 4.1 4 2.8 14 9.7 11 7.6 10 6.9 Full-time 607 31.8 18 0.9 16 0.8 55 2.9 125 6.6 144 7.5 216 11.3 142 7.4 All 663 32.3 22 1.1 17 0.8 61 3.0 129 6.3 158 7.7 227 11.1 152 7.4
PCC Part-time 75 27.4 4 1.5 7 2.6 5 1.8 11 4.0 9 3.3 19 6.9 18 6.6 Full-time 238 23.0 12 1.2 9 0.9 20 1.9 47 4.5 44 4.3 58 5.6 114 11.0All 313 23.9 16 1.2 16 1.2 25 1.9 58 4.4 53 4.1 77 5.9 132 10.1
ALL Part-time 1,125 53.1 160 7.5 79 3.7 78 3.7 112 5.3 82 3.9 117 5.5 75 3.5 Full-time 4,707 47.3 359 3.6 263 2.6 373 3.8 522 5.3 485 4.9 818 8.2 544 5.5 All 5,832 48.4 519 4.3 342 2.8 451 3.7 634 5.3 567 4.7 935 7.8 619 5.1
$8,000 to $9,999 $10,000 to $11,999 $12,000 to $13,999 $14,000 to $15,999 $16,000 to $17,999 $18,000 to $19,999 $20,000 or More Total
# % # % # % # % # % # % # % # %CCC Part-time 6 0.6 4 0.4 7 0.7 1 0.1 2 0.2 2 0.2 10 0.9 1,054 100
Full-time 11 0.5 13 0.6 11 0.5 8 0.4 2 0.1 - - 32 1.4 2,233 100All 17 0.5 17 0.5 18 0.5 9 0.3 4 0.1 2 0.1 42 1.3 3,287 100
UC Part-time 24 5.6 13 3.0 6 1.4 10 2.3 8 1.9 8 1.9 12 2.8 431 100Full-time 117 4.0 112 3.9 66 2.3 82 2.8 60 2.1 32 1.1 82 2.8 2,901 100All 141 4.2 125 3.8 72 2.2 92 2.8 68 2.0 40 1.2 94 2.8 3,332 100
CSU Part-time 6 2.8 3 1.4 2 0.9 2 0.9 1 0.5 - - - - 216 100Full-time 40 2.1 44 2.4 31 1.7 14 0.7 12 0.6 2 0.1 24 1.3 1,867 100All 46 2.2 47 2.3 33 1.6 16 0.8 13 0.6 2 0.1 24 1.2 2,083 100
ICU Part-time 8 5.5 9 6.2 3 2.1 2 1.4 - - 2 1.4 15 10.3 145 100Full-time 109 5.7 100 5.2 57 3.0 59 3.1 46 2.4 37 1.9 177 9.3 1,908 100All 117 5.7 109 5.3 60 2.9 61 3.0 46 2.2 39 1.9 192 9.4 2,053 100
PCC Part-time 15 5.5 19 6.9 17 6.2 9 3.3 9 3.3 16 5.8 41 15.0 274 100Full-time 68 6.6 64 6.2 50 4.8 50 4.8 53 5.1 44 4.3 162 15.7 1,033 100All 83 6.4 83 6.4 67 5.1 59 4.5 62 4.7 60 4.6 203 15.5 1,307 100
ALL Part-time 59 2.8 48 2.3 35 1.7 24 1.1 20 0.9 28 1.3 78 3.7 2,120 100Full-time 345 3.5 333 3.3 215 2.2 213 2.1 173 1.7 115 1.2 477 4.8 9,942 100All 404 3.3 381 3.2 250 2.1 237 2.0 193 1.6 143 1.2 555 4.6 12,062 100
TABLE U-24A: TOTAL ACADEMIC YEAR BORROWING BY SEGMENT, COURSE LOAD, AND DEPENDENCY STATUS
Source: California Student Aid Commission 147 2003-04 SEARS

INDEPENDENT UNDERGRADUATES
Nothing Under $500 $500 to $999 $1,000 to $1,999 $2,000 to $2,999 $3,000 to $3,999 $4,000 to $5,999 $6,000 to $7,999
# % # % # % # % # % # % # % # %CCC Part-time 1,136 71.2 126 7.9 53 3.3 58 3.6 47 2.9 41 2.6 39 2.4 18 1.1
Full-time 720 58.3 90 7.3 66 5.3 59 4.8 62 5.0 50 4.0 55 4.5 47 3.8 All 1,856 65.6 216 7.6 119 4.2 117 4.1 109 3.9 91 3.2 94 3.3 65 2.3
UC Part-time 19 27.5 1 1.4 4 5.8 1 1.4 5 7.2 3 4.3 11 15.9 7 10.1Full-time 86 25.1 7 2.0 7 2.0 10 2.9 16 4.7 17 5.0 50 14.6 43 12.5All 105 25.5 8 1.9 11 2.7 11 2.7 21 5.1 20 4.9 61 14.8 50 12.1
CSU Part-time 280 47.8 13 2.2 18 3.1 42 7.2 39 6.7 37 6.3 68 11.6 21 3.6 Full-time 323 29.5 29 2.6 27 2.5 61 5.6 64 5.8 102 9.3 191 17.4 89 8.1 All 603 35.9 42 2.5 45 2.7 103 6.1 103 6.1 139 8.3 259 15.4 110 6.5
ICU Part-time 45 29.0 2 1.3 - - 2 1.3 4 2.6 7 4.5 10 6.5 15 9.7 Full-time 52 15.4 2 0.6 4 1.2 4 1.2 8 2.4 17 5.0 37 11.0 32 9.5 All 97 19.7 4 0.8 4 0.8 6 1.2 12 2.4 24 4.9 47 9.6 47 9.6
PCC Part-time 156 27.8 7 1.2 5 0.9 15 2.7 17 3.0 26 4.6 38 6.8 49 8.7 Full-time 404 24.2 15 0.9 16 1.0 28 1.7 65 3.9 78 4.7 143 8.6 189 11.3All 560 25.1 22 1.0 21 0.9 43 1.9 82 3.7 104 4.7 181 8.1 238 10.7
ALL Part-time 1,636 55.2 149 5.0 80 2.7 118 4.0 112 3.8 114 3.8 166 5.6 110 3.7 Full-time 1,585 33.8 143 3.1 120 2.6 162 3.5 215 4.6 264 5.6 476 10.2 400 8.5 All 3,221 42.1 292 3.8 200 2.6 280 3.7 327 4.3 378 4.9 642 8.4 510 6.7
$8,000 to $9,999 $10,000 to $11,999 $12,000 to $13,999 $14,000 to $15,999 $16,000 to $17,999 $18,000 to $19,999 $20,000 or More Total
# % # % # % # % # % # % # % # %CCC Part-time 14 0.9 25 1.6 10 0.6 4 0.3 2 0.1 3 0.2 19 1.2 1,595 100
Full-time 18 1.5 13 1.1 14 1.1 6 0.5 3 0.2 4 0.3 28 2.3 1,235 100All 32 1.1 38 1.3 24 0.8 10 0.4 5 0.2 7 0.2 47 1.7 2,830 100
UC Part-time 8 11.6 1 1.4 3 4.3 5 7.2 - - - - 1 1.4 69 100Full-time 25 7.3 34 9.9 17 5.0 14 4.1 6 1.7 2 0.6 9 2.6 343 100All 33 8.0 35 8.5 20 4.9 19 4.6 6 1.5 2 0.5 10 2.4 412 100
CSU Part-time 14 2.4 26 4.4 7 1.2 5 0.9 2 0.3 3 0.5 11 1.9 586 100Full-time 53 4.8 76 6.9 29 2.6 22 2.0 6 0.5 4 0.4 20 1.8 1,096 100All 67 4.0 102 6.1 36 2.1 27 1.6 8 0.5 7 0.4 31 1.8 1,682 100
ICU Part-time 14 9.0 21 13.5 8 5.2 10 6.5 1 0.6 1 0.6 15 9.7 155 100Full-time 16 4.7 48 14.2 27 8.0 20 5.9 9 2.7 6 1.8 55 16.3 337 100All 30 6.1 69 14.0 35 7.1 30 6.1 10 2.0 7 1.4 70 14.2 492 100
PCC Part-time 36 6.4 62 11.1 32 5.7 28 5.0 12 2.1 16 2.9 62 11.1 561 100Full-time 98 5.9 170 10.2 105 6.3 67 4.0 54 3.2 40 2.4 200 12.0 1,672 100All 134 6.0 232 10.4 137 6.1 95 4.3 66 3.0 56 2.5 262 11.7 2,233 100
ALL Part-time 86 2.9 135 4.6 60 2.0 52 1.8 17 0.6 23 0.8 108 3.6 2,966 100Full-time 210 4.5 341 7.3 192 4.1 129 2.8 78 1.7 56 1.2 312 6.7 4,683 100All 296 3.9 476 6.2 252 3.3 181 2.4 95 1.2 79 1.0 420 5.5 7,649 100
TABLE U-24B: TOTAL ACADEMIC YEAR BORROWING BY SEGMENT, COURSE LOAD, AND DEPENDENCY STATUS
Source: California Student Aid Commission 148 2003-04 SEARS

ALL UNDERGRADUATES
Nothing Under $500 $500 to $999 $1,000 to $1,999 $2,000 to $2,999 $3,000 to $3,999 $4,000 to $5,999 $6,000 to $7,999
# % # % # % # % # % # % # % # %Part-time 2,761 54.3 309 6.1 159 3.1 196 3.9 224 4.4 196 3.9 283 5.6 185 3.6 Full-time 6,292 43.0 502 3.4 383 2.6 535 3.7 737 5.0 749 5.1 1,294 8.8 944 6.5 All 9,053 45.9 811 4.1 542 2.7 731 3.7 961 4.9 945 4.8 1,577 8.0 1,129 5.7
$8,000 to $9,999 $10,000 to $11,999 $12,000 to $13,999 $14,000 to $15,999 $16,000 to $17,999 $18,000 to $19,999 $20,000 or More Total
# % # % # % # % # % # % # % # %Part-time 145 2.9 183 3.6 95 1.9 76 1.5 37 0.7 51 1.0 186 3.7 5,086 100 Full-time 555 3.8 674 4.6 407 2.8 342 2.3 251 1.7 171 1.2 789 5.4 14,625 100 All 700 3.6 857 4.3 502 2.5 418 2.1 288 1.5 222 1.1 975 4.9 19,711 100
TABLE U-24C: TOTAL ACADEMIC YEAR BORROWING BY SEGMENT, COURSE LOAD, AND DEPENDENCY STATUS
Source: California Student Aid Commission 149 2003-04 SEARS

DEPENDENT UNDERGRADUATES INDEPENDENT UNDERGRADUATES ALL UNDERGRADUATES
CCC Part-time 321 2,836$ 834$ CCC Part-time 459 3,968$ 1,870$ CCC Part-time 780 3,502$ 1,399$ Full-time 620 3,357$ 1,011$ Full-time 515 4,634$ 2,684$ Full-time 1,135 3,936$ 1,726$ All 941 3,179$ 913$ All 974 4,320$ 2,100$ All 1,915 3,759$ 1,512$
UC Part-time 272 6,704$ 4,905$ UC Part-time 50 6,995$ 1$ UC Part-time 322 6,749$ 5,060$ Full-time 1,628 7,326$ 5,558$ Full-time 257 7,905$ 7,008$ Full-time 1,885 7,405$ 5,735$ All 1,900 7,237$ 5,451$ All 307 7,757$ 6,742$ All 2,207 7,310$ 5,618$
CSU Part-time 114 3,895$ 2,688$ CSU Part-time 306 5,535$ 4,328$ CSU Part-time 420 5,090$ 3,849$ Full-time 891 5,035$ 3,633$ Full-time 773 6,251$ 5,189$ Full-time 1,664 5,600$ 4,416$
All 1,005 4,906$ 3,471$ All 1,079 6,048$ 4,932$ All 2,084 5,497$ 4,292$ ICU Part-time 89 8,851$ 8,195$ ICU Part-time 110 10,500$ 10,257$ ICU Part-time 199 9,763$ 9,886$ Full-time 1,301 9,146$ 7,349$ Full-time 285 11,379$ 10,781$ Full-time 1,586 9,547$ 7,917$
All 1,390 9,127$ 7,395$ All 395 11,134$ 10,559$ All 1,785 9,571$ 8,210$ PCC Part-time 199 11,617$ 10,724$ PCC Part-time 405 10,732$ 1,870$ PCC Part-time 604 11,024$ 10,032$ Full-time 795 11,641$ 11,558$ Full-time 1,268 10,671$ 2,684$ Full-time 2,063 11,045$ 10,662$
All 994 11,636$ 11,323$ All 1,673 10,686$ 2,100$ All 2,667 11,040$ 2,489$ ALL Part-time 995 6,309$ 1,281$ ALL Part-time 1,330 7,042$ 2,163$ ALL Part-time 2,325 6,728$ 1,996$
Full-time 5,235 7,574$ 4,143$ Full-time 3,098 8,400$ 3,967$ Full-time 8,333 7,881$ 4,146$ All 6,230 7,372$ 3,199$ All 4,428 7,992$ 2,791$ All 10,658 7,630$ 2,949$
Note: "Nothing" category was excluded from the means and median calculations.
TABLE M-24: TOTAL ACADEMIC YEAR BORROWING BY SEGMENT, COURSE LOAD, AND DEPENDENCY STATUS
Number Mean Median Number MedianMean Median Number Mean
Source: California Student Aid Commission 150 2003-04 SEARS

Question for Tables: W-25, U-25, and M-25 (Borrowing from Family or Friends) W-26, U-26 and M-26 (Credit Card Loans)
Of the total amount of borrowing reported in question 42, how much will come from the following
sources? Family or friends Credit Cards Nothing 00 00 Under $200 01 01 $200 to $499 02 02 $500 to $999 03 03 $1,000 to $1,999 04 04 $2,000 to $2,999 05 05 $3,000 to $3,999 06 06 $4,000 to $5,999 07 07 $6,000 to $7,999 08 08 $8,000 to $9,999 09 09 $10,000 or more 10 10
151 2003-04 SEARS

DEPENDENT UNDERGRADUATES
Nothing Under $200 $200 to $499 $500 to $999 $1,000 to $1,999 $2,000 to $2,999 $3,000 to $3,999
# % # % # % # % # % # % # %CCC Part-time 219,934 68.3 30,397 9.4 30,040 9.3 16,808 5.2 7,152 2.2 6,080 1.9 2,503 0.8
Full-time 166,625 73.0 15,214 6.7 16,059 7.0 11,108 4.9 7,969 3.5 3,743 1.6 1,690 0.7 All 386,559 70.3 45,611 8.3 46,099 8.4 27,916 5.1 15,121 2.7 9,823 1.8 4,194 0.8
UC Part-time 15,001 64.5 946 4.1 814 3.5 1,139 4.9 1,236 5.3 955 4.1 392 1.7 Full-time 58,432 67.9 3,317 3.9 2,546 3.0 3,163 3.7 3,255 3.8 2,083 2.4 1,624 1.9 All 73,433 67.2 4,263 3.9 3,361 3.1 4,302 3.9 4,491 4.1 3,038 2.8 2,016 1.8
CSU Part-time 10,371 65.1 586 3.7 1,322 8.3 951 6.0 966 6.1 709 4.5 548 3.4 Full-time 88,728 72.2 6,968 5.7 5,057 4.1 5,476 4.5 5,524 4.5 2,380 1.9 1,812 1.5 All 99,099 71.4 7,553 5.4 6,378 4.6 6,427 4.6 6,490 4.7 3,088 2.2 2,360 1.7
ICU Part-time 3,139 70.4 207 4.6 56 1.3 71 1.6 161 3.6 149 3.3 76 1.7 Full-time 53,827 71.0 2,468 3.3 2,294 3.0 2,214 2.9 2,145 2.8 2,076 2.7 944 1.2 All 56,966 71.0 2,675 3.3 2,350 2.9 2,285 2.8 2,306 2.9 2,225 2.8 1,019 1.3
PCC Part-time 2,611 52.9 234 4.7 143 2.9 170 3.4 230 4.7 394 8.0 305 6.2 Full-time 11,765 61.1 559 2.9 666 3.5 622 3.2 694 3.6 838 4.3 550 2.9 All 14,376 59.4 793 3.3 809 3.3 792 3.3 924 3.8 1,231 5.1 855 3.5
ALL Part-time 251,056 67.8 32,370 8.7 32,375 8.7 19,140 5.2 9,746 2.6 8,286 2.2 3,824 1.0 Full-time 379,377 71.3 28,525 5.4 26,622 5.0 22,583 4.2 19,586 3.7 11,119 2.1 6,620 1.2 All 630,433 69.8 60,895 6.7 58,997 6.5 41,723 4.6 29,333 3.2 19,405 2.1 10,444 1.2
$4,000 to $5,999 $6,000 to $7,999 $8,000 to $9,999 $10,000 or More
# % # % # % # % # %CCC Part-time 3,576 1.1 358 0.1 1,073 0.3 3,934 1.2 321,855 100
Full-time 1,449 0.6 1,087 0.5 483 0.2 2,898 1.3 228,325 100 All 5,025 0.9 1,444 0.3 1,556 0.3 6,832 1.2 550,179 100
UC Part-time 595 2.6 475 2.0 281 1.2 1,424 6.1 23,259 100 Full-time 2,428 2.8 1,457 1.7 1,329 1.5 6,369 7.4 86,003 100 All 3,023 2.8 1,932 1.8 1,610 1.5 7,793 7.1 109,261 100
CSU Part-time 53 0.3 26 0.2 187 1.2 208 1.3 15,926 100 Full-time 2,571 2.1 1,125 0.9 595 0.5 2,678 2.2 122,911 100 All 2,623 1.9 1,151 0.8 782 0.6 2,886 2.1 138,838 100
ICU Part-time 170 3.8 54 1.2 34 0.8 343 7.7 4,461 100 Full-time 2,224 2.9 1,164 1.5 736 1.0 5,689 7.5 75,780 100 All 2,394 3.0 1,218 1.5 770 1.0 6,032 7.5 80,241 100
PCC Part-time 225 4.5 98 2.0 194 3.9 335 6.8 4,938 100 Full-time 496 2.6 417 2.2 337 1.7 2,317 12.0 19,260 100 All 721 3.0 514 2.1 531 2.2 2,652 11.0 24,198 100
ALL Part-time 4,619 1.2 1,011 0.3 1,769 0.5 6,244 1.7 370,439 100 Full-time 9,167 1.7 5,249 1.0 3,479 0.7 19,952 3.7 532,279 100 All 13,786 1.5 6,260 0.7 5,248 0.6 26,195 2.9 902,718 100
TABLE W-25A: ACADEMIC YEAR BORROWING FROM FAMILY OR FRIENDS
Total
BY SEGMENT, COURSE LOAD, AND DEPENDENCY STATUS
Source: California Student Aid Commission 152 2003-04 SEARS

INDEPENDENT UNDERGRADUATES
Nothing Under $200 $200 to $499 $500 to $999 $1,000 to $1,999 $2,000 to $2,999 $3,000 to $3,999
# % # % # % # % # % # % # %CCC Part-time 364,769 82.2 20,742 4.7 16,808 3.8 13,589 3.1 9,656 2.2 7,152 1.6 1,431 0.3
Full-time 90,195 73.8 6,520 5.3 7,486 6.1 6,762 5.5 3,864 3.2 2,294 1.9 1,207 1.0 All 454,964 80.4 27,262 4.8 24,294 4.3 20,351 3.6 13,519 2.4 9,446 1.7 2,638 0.5
UC Part-time 1,993 66.4 226 7.5 - - 330 11.0 141 4.7 145 4.8 - - Full-time 7,147 68.6 239 2.3 406 3.9 466 4.5 513 4.9 446 4.3 76 0.7 All 9,141 68.1 465 3.5 406 3.0 796 5.9 654 4.9 591 4.4 76 0.6
CSU Part-time 32,491 83.7 836 2.2 751 1.9 1,064 2.7 1,681 4.3 525 1.4 253 0.7 Full-time 52,177 78.8 2,199 3.3 2,745 4.1 2,454 3.7 1,703 2.6 1,232 1.9 969 1.5 All 84,668 80.6 3,035 2.9 3,496 3.3 3,517 3.3 3,383 3.2 1,757 1.7 1,222 1.2
ICU Part-time 8,008 93.4 47 0.5 47 0.5 163 1.9 69 0.8 64 0.7 80 0.9 Full-time 11,665 80.3 264 1.8 458 3.1 429 3.0 355 2.4 180 1.2 139 1.0 All 19,673 85.1 311 1.3 504 2.2 592 2.6 424 1.8 244 1.1 219 0.9
PCC Part-time 14,777 87.6 395 2.3 143 0.8 378 2.2 155 0.9 297 1.8 184 1.1 Full-time 33,316 80.7 1,090 2.6 963 2.3 1,397 3.4 1,132 2.7 480 1.2 353 0.9 All 48,093 82.7 1,485 2.6 1,107 1.9 1,774 3.1 1,287 2.2 777 1.3 537 0.9
ALL Part-time 422,038 82.6 22,246 4.4 17,749 3.5 15,522 3.0 11,701 2.3 8,184 1.6 1,948 0.4 Full-time 194,500 76.4 10,312 4.1 12,058 4.7 11,507 4.5 7,567 3.0 4,632 1.8 2,745 1.1 All 616,538 80.5 32,558 4.3 29,807 3.9 27,029 3.5 19,267 2.5 12,816 1.7 4,693 0.6
$4,000 to $5,999 $6,000 to $7,999 $8,000 to $9,999 $10,000 or More
# % # % # % # % # %CCC Part-time 2,146 0.5 1,788 0.4 1,431 0.3 4,291 1.0 443,802 100
Full-time 1,207 1.0 845 0.7 241 0.2 1,570 1.3 122,192 100 All 3,353 0.6 2,633 0.5 1,672 0.3 5,861 1.0 565,994 100
UC Part-time 49 1.6 - - - - 119 4.0 3,002 100 Full-time 165 1.6 203 1.9 285 2.7 468 4.5 10,415 100 All 213 1.6 203 1.5 285 2.1 587 4.4 13,417 100
CSU Part-time 416 1.1 212 0.5 122 0.3 460 1.2 38,811 100 Full-time 584 0.9 432 0.7 373 0.6 1,356 2.0 66,223 100 All 1,000 1.0 644 0.6 495 0.5 1,816 1.7 105,034 100
ICU Part-time - - 47 0.5 - - 54 0.6 8,577 100 Full-time 229 1.6 166 1.1 48 0.3 599 4.1 14,533 100 All 229 1.0 213 0.9 48 0.2 653 2.8 23,110 100
PCC Part-time 60 0.4 88 0.5 140 0.8 245 1.5 16,862 100 Full-time 494 1.2 358 0.9 293 0.7 1,384 3.4 41,259 100 All 554 1.0 446 0.8 433 0.7 1,628 2.8 58,121 100
ALL Part-time 2,670 0.5 2,135 0.4 1,693 0.3 5,169 1.0 511,055 100 Full-time 2,679 1.1 2,004 0.8 1,241 0.5 5,376 2.1 254,621 100 All 5,350 0.7 4,139 0.5 2,934 0.4 10,545 1.4 765,676 100
TABLE W-25B: ACADEMIC YEAR BORROWING FROM FAMILY OR FRIENDS
Total
BY SEGMENT, COURSE LOAD, AND DEPENDENCY STATUS
Source: California Student Aid Commission 153 2003-04 SEARS

ALL UNDERGRADUATES
Nothing Under $200 $200 to $499 $500 to $999 $1,000 to $1,999 $2,000 to $2,999 $3,000 to $3,999
# % # % # % # % # % # % #Part-time 673,094 76.4 54,615 6.2 50,124 5.7 34,662 3.9 21,447 2.4 16,470 1.9 5,772 0.7 Full-time 573,877 72.9 38,837 4.9 38,679 4.9 34,090 4.3 27,153 3.5 15,751 2.0 9,365 1.2 All 1,246,971 74.7 93,453 5.6 88,804 5.3 68,752 4.1 48,600 2.9 32,221 1.9 15,137 0.9
$4,000 to $5,999 $6,000 to $7,999 $8,000 to $9,999 $10,000 or More
# % # % # % # % # %Part-time 7,289 0.8 3,145 0.4 3,462 0.4 11,413 1.3 881,494 100 Full-time 11,846 1.5 7,253 0.9 4,720 0.6 25,328 3.2 786,900 100 All 19,135 1.1 10,399 0.6 8,182 0.5 36,741 2.2 1,668,394 100
Total
TABLE W-25C: ACADEMIC YEAR BORROWING FROM FAMILY OR FRIENDS BY SEGMENT, COURSE LOAD, AND DEPENDENCY STATUS
Source: California Student Aid Commission 154 2003-04 SEARS

DEPENDENT UNDERGRADUATES
Nothing Under $200 $200 to $499 $500 to $999 $1,000 to $1,999 $2,000 to $2,999 $3,000 to $3,999
# % # % # % # % # % # % # %CCC Part-time 615 68.3 85 9.4 84 9.3 47 5.2 20 2.2 17 1.9 7 0.8
Full-time 1,380 73.0 126 6.7 133 7.0 92 4.9 66 3.5 31 1.6 14 0.7 All 1,995 71.5 211 7.6 217 7.8 139 5.0 86 3.1 48 1.7 21 0.8
UC Part-time 241 65.0 15 4.0 12 3.2 17 4.6 21 5.7 14 3.8 7 1.9 Full-time 1,534 67.8 87 3.8 65 2.9 83 3.7 86 3.8 55 2.4 42 1.9 All 1,775 67.4 102 3.9 77 2.9 100 3.8 107 4.1 69 2.6 49 1.9
CSU Part-time 115 63.5 8 4.4 16 8.8 11 6.1 9 5.0 6 3.3 8 4.4 Full-time 1,092 71.1 85 5.5 64 4.2 71 4.6 68 4.4 31 2.0 26 1.7 All 1,207 70.3 93 5.4 80 4.7 82 4.8 77 4.5 37 2.2 34 2.0
ICU Part-time 95 73.1 5 3.8 3 2.3 2 1.5 4 3.1 3 2.3 3 2.3 Full-time 1,195 70.8 53 3.1 54 3.2 48 2.8 48 2.8 44 2.6 23 1.4 All 1,290 71.0 58 3.2 57 3.1 50 2.8 52 2.9 47 2.6 26 1.4
PCC Part-time 138 59.0 7 3.0 7 3.0 11 4.7 13 5.6 16 6.8 6 2.6 Full-time 513 57.6 33 3.7 28 3.1 33 3.7 33 3.7 35 3.9 26 2.9 All 651 57.9 40 3.6 35 3.1 44 3.9 46 4.1 51 4.5 32 2.8
ALL Part-time 1,204 66.3 120 6.6 122 6.7 88 4.8 67 3.7 56 3.1 31 1.7 Full-time 5,714 69.1 384 4.6 344 4.2 327 4.0 301 3.6 196 2.4 131 1.6 All 6,918 68.6 504 5.0 466 4.6 415 4.1 368 3.7 252 2.5 162 1.6
$4,000 to $5,999 $6,000 to $7,999 $8,000 to $9,999 $10,000 or More
# % # % # % # % # %CCC Part-time 10 1.1 1 0.1 3 0.3 11 1.2 900 100
Full-time 12 0.6 9 0.5 4 0.2 24 1.3 1,891 100 All 22 0.8 10 0.4 7 0.3 35 1.3 2,791 100
UC Part-time 10 2.7 8 2.2 4 1.1 22 5.9 371 100 Full-time 62 2.7 39 1.7 37 1.6 171 7.6 2,261 100 All 72 2.7 47 1.8 41 1.6 193 7.3 2,632 100
CSU Part-time 2 1.1 1 0.6 2 1.1 3 1.7 181 100 Full-time 30 2.0 15 1.0 12 0.8 41 2.7 1,535 100 All 32 1.9 16 0.9 14 0.8 44 2.6 1,716 100
ICU Part-time 3 2.3 2 1.5 1 0.8 9 6.9 130 100 Full-time 51 3.0 26 1.5 16 0.9 130 7.7 1,688 100 All 54 3.0 28 1.5 17 0.9 139 7.6 1,818 100
PCC Part-time 3 1.3 6 2.6 8 3.4 19 8.1 234 100 Full-time 24 2.7 27 3.0 22 2.5 117 13.1 891 100 All 27 2.4 33 2.9 30 2.7 136 12.1 1,125 100
ALL Part-time 28 1.5 18 1.0 18 1.0 64 3.5 1,816 100 Full-time 179 2.2 116 1.4 91 1.1 483 5.8 8,266 100 All 207 2.1 134 1.3 109 1.1 547 5.4 10,082 100
TABLE U-25A: ACADEMIC YEAR BORROWING FROM FAMILY OR FRIENDS
Total
BY SEGMENT, COURSE LOAD, AND DEPENDENCY STATUS
Source: California Student Aid Commission 155 2003-04 SEARS

INDEPENDENT UNDERGRADUATES
Nothing Under $200 $200 to $499 $500 to $999 $1,000 to $1,999 $2,000 to $2,999 $3,000 to $3,999
# % # % # % # % # % # % # %CCC Part-time 1,020 82.2 58 4.7 47 3.8 38 3.1 27 2.2 20 1.6 4 0.3
Full-time 747 73.8 54 5.3 62 6.1 56 5.5 32 3.2 19 1.9 10 1.0 All 1,767 78.4 112 5.0 109 4.8 94 4.2 59 2.6 39 1.7 14 0.6
UC Part-time 38 69.1 4 7.3 - - 5 9.1 2 3.6 3 5.5 - - Full-time 188 69.4 6 2.2 11 4.1 12 4.4 13 4.8 11 4.1 2 0.7 All 226 69.3 10 3.1 11 3.4 17 5.2 15 4.6 14 4.3 2 0.6
CSU Part-time 391 84.4 10 2.2 10 2.2 13 2.8 18 3.9 7 1.5 2 0.4 Full-time 711 78.2 34 3.7 37 4.1 32 3.5 27 3.0 22 2.4 14 1.5 All 1,102 80.3 44 3.2 47 3.4 45 3.3 45 3.3 29 2.1 16 1.2
ICU Part-time 130 92.2 1 0.7 1 0.7 3 2.1 1 0.7 2 1.4 1 0.7 Full-time 235 79.4 5 1.7 9 3.0 9 3.0 9 3.0 4 1.4 3 1.0 All 365 83.5 6 1.4 10 2.3 12 2.7 10 2.3 6 1.4 4 0.9
PCC Part-time 390 80.6 10 2.1 9 1.9 14 2.9 10 2.1 10 2.1 12 2.5 Full-time 1,161 78.6 37 2.5 27 1.8 45 3.0 50 3.4 26 1.8 25 1.7 All 1,551 79.1 47 2.4 36 1.8 59 3.0 60 3.1 36 1.8 37 1.9
ALL Part-time 1,969 82.6 83 3.5 67 2.8 73 3.1 58 2.4 42 1.8 19 0.8 Full-time 3,042 76.7 136 3.4 146 3.7 154 3.9 131 3.3 82 2.1 54 1.4 All 5,011 78.9 219 3.4 213 3.4 227 3.6 189 3.0 124 2.0 73 1.1
$4,000 to $5,999 $6,000 to $7,999 $8,000 to $9,999 $10,000 or More
# % # % # % # % # %CCC Part-time 6 0.5 5 0.4 4 0.3 12 1.0 1,241 100
Full-time 10 1.0 7 0.7 2 0.2 13 1.3 1,012 100 All 16 0.7 12 0.5 6 0.3 25 1.1 2,253 100
UC Part-time 1 1.8 - - - - 2 3.6 55 100 Full-time 4 1.5 5 1.8 7 2.6 12 4.4 271 100 All 5 1.5 5 1.5 7 2.1 14 4.3 326 100
CSU Part-time 5 1.1 2 0.4 1 0.2 4 0.9 463 100 Full-time 6 0.7 6 0.7 4 0.4 16 1.8 909 100 All 11 0.8 8 0.6 5 0.4 20 1.5 1,372 100
ICU Part-time - - 1 0.7 - - 1 0.7 141 100 Full-time 6 2.0 4 1.4 1 0.3 11 3.7 296 100 All 6 1.4 5 1.1 1 0.2 12 2.7 437 100
PCC Part-time 4 0.8 5 1.0 7 1.4 13 2.7 484 100 Full-time 24 1.6 16 1.1 12 0.8 55 3.7 1,478 100 All 28 1.4 21 1.1 19 1.0 68 3.5 1,962 100
ALL Part-time 16 0.7 13 0.5 12 0.5 32 1.3 2,384 100 Full-time 50 1.3 38 1.0 26 0.7 107 2.7 3,966 100 All 66 1.0 51 0.8 38 0.6 139 2.2 6,350 100
TABLE U-25B: ACADEMIC YEAR BORROWING FROM FAMILY OR FRIENDS
Total
BY SEGMENT, COURSE LOAD, AND DEPENDENCY STATUS
Source: California Student Aid Commission 156 2003-04 SEARS

ALL UNDERGRADUATES
Nothing Under $200 $200 to $499 $500 to $999 $1,000 to $1,999 $2,000 to $2,999 $3,000 to $3,999
# % # % # % # % # % # % #Part-time 3,173 75.5 203 4.8 189 4.5 161 3.8 125 3.0 98 2.3 50 1.2 Full-time 8,756 71.6 520 4.3 490 4.0 481 3.9 432 3.5 278 2.3 185 1.5 All 11,929 72.6 723 4.4 679 4.1 642 3.9 557 3.4 376 2.3 235 1.4
$4,000 to $5,999 $6,000 to $7,999 $8,000 to $9,999 $10,000 or More
# % # % # % # % # %Part-time 44 1.0 31 0.7 30 0.7 96 2.3 4,200 100 Full-time 229 1.9 154 1.3 117 1.0 590 4.8 12,232 100 All 273 1.7 185 1.1 147 0.9 686 4.2 16,432 100
Total
TABLE U-25C: ACADEMIC YEAR BORROWING FROM FAMILY OR FRIENDS BY SEGMENT, COURSE LOAD, AND DEPENDENCY STATUS
Source: California Student Aid Commission 157 2003-04 SEARS

DEPENDENT UNDERGRADUATES INDEPENDENT UNDERGRADUATES ALL UNDERGRADUATES
CCC Part-time 285 1,316$ 404$ CCC Part-time 221 1,757$ 571$ CCC Part-time 506 1,509$ 451$ Full-time 511 1,520$ 491$ Full-time 265 1,734$ 646$ Full-time 776 1,593$ 543$ All 796 1,447$ 435$ All 486 1,745$ 596$ All 1,282 1,560$ 474$
UC Part-time 130 3,796$ 1,993$ UC Part-time 17 2,450$ 921$ UC Part-time 147 3,640$ 1,855$ Full-time 727 4,545$ 2,721$ Full-time 83 3,825$ 2,020$ Full-time 810 4,471$ 2,597$ All 857 4,431$ 2,492$ All 100 3,591$ 1,202$ All 957 4,344$ 2,361$
CSU Part-time 66 2,108$ 957$ CSU Part-time 72 2,191$ 1,117$ CSU Part-time 138 2,151$ 1,161$ Full-time 443 2,638$ 962$ Full-time 198 2,368$ 640$ Full-time 641 2,555$ 950$
All 509 2,569$ 961$ All 270 2,321$ 1,009$ All 779 2,483$ 981$ ICU Part-time 35 4,687$ 1,645$ ICU Part-time 11 2,791$ 3,455$ ICU Part-time 46 4,234$ 4,072$ Full-time 493 4,734$ 3,529$ Full-time 61 3,810$ 2,121$ Full-time 554 4,632$ 3,537$
All 528 4,731$ 3,699$ All 72 3,654$ 3,140$ All 600 4,601$ 3,663$ PCC Part-time 96 4,478$ 2,980$ PCC Part-time 94 3,805$ 1,818$ PCC Part-time 190 4,145$ 2,517$ Full-time 378 5,449$ 3,723$ Full-time 317 3,847$ 1,456$ Full-time 695 4,718$ 2,470$
All 474 5,253$ 3,456$ All 411 3,837$ 1,499$ All 885 4,595$ 2,486$ ALL Part-time 612 2,617$ 449$ ALL Part-time 415 2,352$ 642$ ALL Part-time 1,027 2,510$ 493$
Full-time 2,552 3,779$ 898$ Full-time 924 2,920$ 818$ Full-time 3,476 3,550$ 870$ All 3,164 3,554$ 640$ All 1,339 2,744$ 716$ All 4,503 3,313$ 670$
Note: "Nothing" category was excluded from the means and median calculations.
TABLE M-25: ACADEMIC YEAR BORROWING FROM FAMILY OR FRIENDS
Number Mean Median Number MedianMean Median Number Mean
BY SEGMENT, COURSE LOAD, AND DEPENDENCY STATUS
Source: California Student Aid Commission 158 2003-04 SEARS

DEPENDENT UNDERGRADUATES
Nothing Under $200 $200 to $499 $500 to $999 $1,000 to $1,999 $2,000 to $2,999 $3,000 to $3,999
# % # % # % # % # % # % # %CCC Part-time 223,153 79.0 15,378 5.4 15,735 5.6 9,298 3.3 8,225 2.9 3,576 1.3 1,431 0.5
Full-time 168,919 80.9 8,935 4.3 9,539 4.6 9,297 4.5 4,347 2.1 2,536 1.2 1,570 0.8 All 392,072 79.8 24,313 4.9 25,274 5.1 18,595 3.8 12,572 2.6 6,112 1.2 3,000 0.6
UC Part-time 15,770 73.9 1,151 5.4 1,565 7.3 900 4.2 942 4.4 359 1.7 211 1.0 Full-time 58,495 75.2 3,282 4.2 3,399 4.4 4,269 5.5 3,428 4.4 1,790 2.3 882 1.1 All 74,265 74.9 4,432 4.5 4,963 5.0 5,169 5.2 4,369 4.4 2,149 2.2 1,092 1.1
CSU Part-time 9,872 59.8 684 4.1 2,023 12.3 650 3.9 955 5.8 1,291 7.8 308 1.9 Full-time 81,026 68.7 5,745 4.9 8,549 7.2 6,794 5.8 6,279 5.3 4,522 3.8 2,176 1.8 All 90,898 67.6 6,429 4.8 10,573 7.9 7,445 5.5 7,235 5.4 5,813 4.3 2,484 1.8
ICU Part-time 3,575 88.4 68 1.7 108 2.7 118 2.9 32 0.8 - - 28 0.7 Full-time 55,055 78.4 1,714 2.4 3,066 4.4 2,833 4.0 2,785 4.0 1,103 1.6 865 1.2 All 58,630 78.9 1,782 2.4 3,174 4.3 2,951 4.0 2,816 3.8 1,103 1.5 894 1.2
PCC Part-time 2,989 79.6 73 1.9 73 2.0 53 1.4 147 3.9 8 0.2 22 0.6 Full-time 12,367 76.8 515 3.2 522 3.2 668 4.1 262 1.6 228 1.4 127 0.8 All 15,356 77.3 587 3.0 596 3.0 721 3.6 409 2.1 236 1.2 149 0.7
ALL Part-time 255,360 77.8 17,354 5.3 19,504 5.9 11,019 3.4 10,301 3.1 5,234 1.6 2,000 0.6 Full-time 375,862 76.6 20,190 4.1 25,075 5.1 23,862 4.9 17,100 3.5 10,179 2.1 5,619 1.1 All 631,222 77.1 37,544 4.6 44,579 5.4 34,881 4.3 27,401 3.3 15,413 1.9 7,618 0.9
$4,000 to $5,999 $6,000 to $7,999 $8,000 to $9,999 $10,000 or More
# % # % # % # % # %CCC Part-time 1,788 0.6 715 0.3 358 0.1 2,861 1.0 282,518 100
Full-time 845 0.4 241 0.1 724 0.3 1,932 0.9 208,885 100 All 2,633 0.5 957 0.2 1,082 0.2 4,793 1.0 491,403 100
UC Part-time 107 0.5 134 0.6 - - 211 1.0 21,349 100 Full-time 1,093 1.4 390 0.5 212 0.3 513 0.7 77,752 100 All 1,200 1.2 524 0.5 212 0.2 724 0.7 99,101 100
CSU Part-time 573 3.5 - - 158 1.0 - - 16,516 100 Full-time 906 0.8 773 0.7 358 0.3 853 0.7 117,983 100 All 1,479 1.1 773 0.6 516 0.4 853 0.6 134,498 100
ICU Part-time 22 0.5 - - 7 0.2 89 2.2 4,046 100 Full-time 804 1.1 476 0.7 251 0.4 1,276 1.8 70,227 100 All 826 1.1 476 0.6 258 0.3 1,365 1.8 74,274 100
PCC Part-time 13 0.4 79 2.1 30 0.8 268 7.1 3,755 100 Full-time 125 0.8 43 0.3 103 0.6 1,141 7.1 16,099 100 All 138 0.7 122 0.6 133 0.7 1,409 7.1 19,854 100
ALL Part-time 2,503 0.8 928 0.3 552 0.2 3,429 1.0 328,184 100 Full-time 3,773 0.8 1,923 0.4 1,649 0.3 5,715 1.2 490,946 100 All 6,277 0.8 2,851 0.3 2,201 0.3 9,144 1.1 819,129 100
TABLE W-26A: ACADEMIC YEAR BORROWING FROM CREDIT CARDS
Total
BY SEGMENT, COURSE LOAD, AND DEPENDENCY STATUS
Source: California Student Aid Commission 159 2003-04 SEARS

INDEPENDENT UNDERGRADUATES
Nothing Under $200 $200 to $499 $500 to $999 $1,000 to $1,999 $2,000 to $2,999 $3,000 to $3,999
# % # % # % # % # % # % # %CCC Part-time 282,517 70.3 22,530 5.6 30,040 7.5 21,815 5.4 12,874 3.2 6,080 1.5 6,437 1.6
Full-time 74,740 69.1 4,588 4.2 5,796 5.4 5,554 5.1 5,796 5.4 3,743 3.5 2,173 2.0 All 357,257 70.1 27,118 5.3 35,836 7.0 27,369 5.4 18,670 3.7 9,823 1.9 8,611 1.7
UC Part-time 1,499 47.8 259 8.3 182 5.8 242 7.7 112 3.6 178 5.7 167 5.3 Full-time 5,940 55.3 235 2.2 588 5.5 605 5.6 1,246 11.6 719 6.7 367 3.4 All 7,438 53.6 495 3.6 770 5.6 848 6.1 1,358 9.8 896 6.5 534 3.9
CSU Part-time 22,164 51.6 809 1.9 3,795 8.8 3,896 9.1 4,150 9.7 3,729 8.7 1,479 3.4 Full-time 38,707 55.9 2,383 3.4 4,259 6.1 6,258 9.0 6,184 8.9 3,333 4.8 3,604 5.2 All 60,871 54.2 3,192 2.8 8,053 7.2 10,154 9.0 10,334 9.2 7,062 6.3 5,083 4.5
ICU Part-time 6,576 73.0 292 3.2 261 2.9 241 2.7 662 7.4 504 5.6 206 2.3 Full-time 9,566 66.6 481 3.3 909 6.3 815 5.7 964 6.7 169 1.2 420 2.9 All 16,142 69.1 772 3.3 1,171 5.0 1,056 4.5 1,626 7.0 673 2.9 626 2.7
PCC Part-time 12,522 76.0 632 3.8 312 1.9 346 2.1 627 3.8 218 1.3 61 0.4 Full-time 28,535 74.6 1,301 3.4 973 2.5 1,364 3.6 1,468 3.8 896 2.3 779 2.0 All 41,057 75.0 1,933 3.5 1,284 2.3 1,710 3.1 2,095 3.8 1,113 2.0 840 1.5
ALL Part-time 325,278 68.7 24,522 5.2 34,590 7.3 26,539 5.6 18,425 3.9 10,708 2.3 8,350 1.8 Full-time 157,487 65.4 8,988 3.7 12,524 5.2 14,597 6.1 15,658 6.5 8,859 3.7 7,343 3.0 All 482,765 67.6 33,510 4.7 47,114 6.6 41,136 5.8 34,083 4.8 19,567 2.7 15,694 2.2
$4,000 to $5,999 $6,000 to $7,999 $8,000 to $9,999 $10,000 or More
# % # % # % # % # %CCC Part-time 4,291 1.1 2,503 0.6 2,861 0.7 9,656 2.4 401,604 100
Full-time 1,328 1.2 604 0.6 604 0.6 3,260 3.0 108,186 100 All 5,620 1.1 3,107 0.6 3,465 0.7 12,916 2.5 509,789 100
UC Part-time 351 11.2 75 2.4 70 2.2 - - 3,136 100 Full-time 511 4.8 160 1.5 80 0.7 286 2.7 10,737 100 All 862 6.2 235 1.7 150 1.1 286 2.1 13,872 100
CSU Part-time 1,270 3.0 650 1.5 257 0.6 761 1.8 42,959 100 Full-time 2,797 4.0 485 0.7 224 0.3 1,041 1.5 69,274 100 All 4,066 3.6 1,135 1.0 481 0.4 1,803 1.6 112,233 100
ICU Part-time 52 0.6 69 0.8 50 0.6 89 1.0 9,003 100 Full-time 666 4.6 98 0.7 - - 272 1.9 14,360 100 All 718 3.1 167 0.7 50 0.2 361 1.5 23,362 100
PCC Part-time 143 0.9 702 4.3 94 0.6 814 4.9 16,470 100 Full-time 484 1.3 661 1.7 365 1.0 1,412 3.7 38,236 100 All 627 1.1 1,363 2.5 459 0.8 2,226 4.1 54,707 100
ALL Part-time 6,108 1.3 3,999 0.8 3,333 0.7 11,320 2.4 473,171 100 Full-time 5,785 2.4 2,007 0.8 1,272 0.5 6,271 2.6 240,792 100 All 11,893 1.7 6,006 0.8 4,605 0.6 17,591 2.5 713,963 100
TABLE W-26B: ACADEMIC YEAR BORROWING FROM CREDIT CARDS
Total
BY SEGMENT, COURSE LOAD, AND DEPENDENCY STATUS
Source: California Student Aid Commission 160 2003-04 SEARS

ALL UNDERGRADUATES
Nothing Under $200 $200 to $499 $500 to $999 $1,000 to $1,999 $2,000 to $2,999 $3,000 to $3,999
# % # % # % # % # % # % #Part-time 580,637 72.5 41,875 5.2 54,094 6.8 37,558 4.7 28,726 3.6 15,942 2.0 10,350 1.3 Full-time 533,349 72.9 29,178 4.0 37,599 5.1 38,459 5.3 32,758 4.5 19,038 2.6 12,962 1.8 All 1,113,987 72.7 71,053 4.6 91,693 6.0 76,017 5.0 61,484 4.0 34,980 2.3 23,312 1.5
$4,000 to $5,999 $6,000 to $7,999 $8,000 to $9,999 $10,000 or More
# % # % # % # % # %Part-time 8,611 1.1 4,927 0.6 3,885 0.5 14,749 1.8 801,355 100 Full-time 9,559 1.3 3,930 0.5 2,921 0.4 11,986 1.6 731,738 100 All 18,170 1.2 8,857 0.6 6,806 0.4 26,735 1.7 1,533,093 100
Total
TABLE W-26C: ACADEMIC YEAR BORROWING FROM CREDIT CARDS BY SEGMENT, COURSE LOAD, AND DEPENDENCY STATUS
Source: California Student Aid Commission 161 2003-04 SEARS
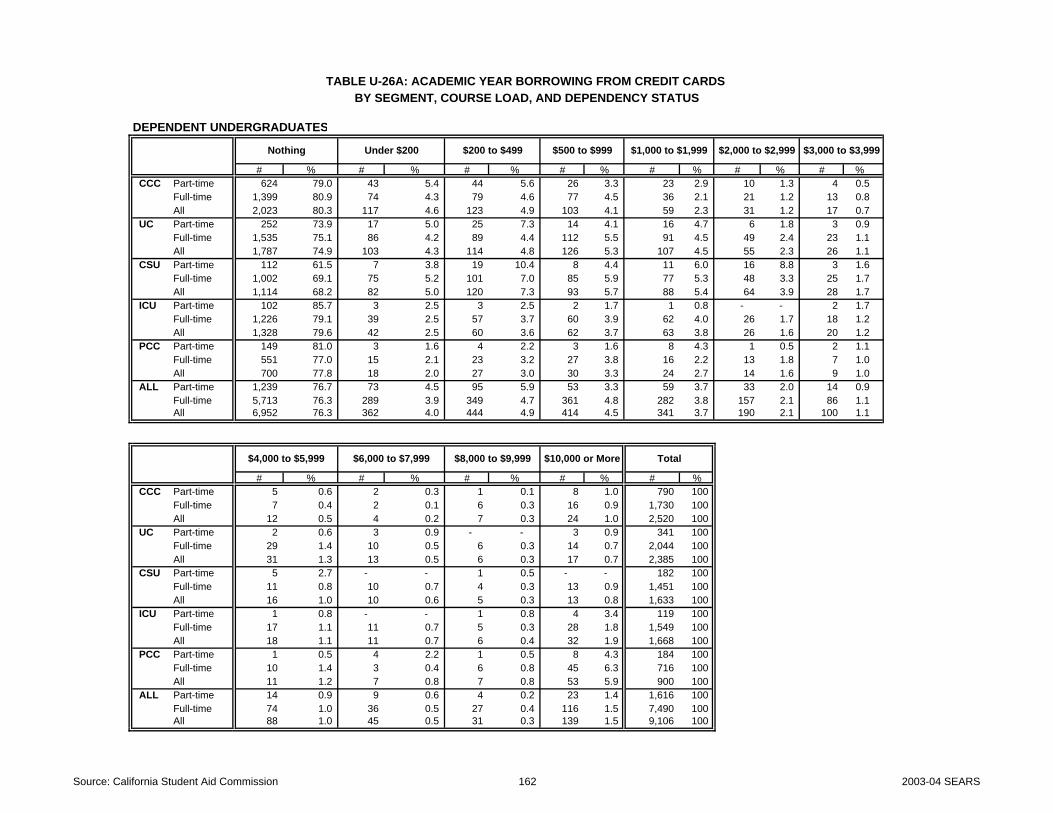
DEPENDENT UNDERGRADUATES
Nothing Under $200 $200 to $499 $500 to $999 $1,000 to $1,999 $2,000 to $2,999 $3,000 to $3,999
# % # % # % # % # % # % # %CCC Part-time 624 79.0 43 5.4 44 5.6 26 3.3 23 2.9 10 1.3 4 0.5
Full-time 1,399 80.9 74 4.3 79 4.6 77 4.5 36 2.1 21 1.2 13 0.8 All 2,023 80.3 117 4.6 123 4.9 103 4.1 59 2.3 31 1.2 17 0.7
UC Part-time 252 73.9 17 5.0 25 7.3 14 4.1 16 4.7 6 1.8 3 0.9 Full-time 1,535 75.1 86 4.2 89 4.4 112 5.5 91 4.5 49 2.4 23 1.1 All 1,787 74.9 103 4.3 114 4.8 126 5.3 107 4.5 55 2.3 26 1.1
CSU Part-time 112 61.5 7 3.8 19 10.4 8 4.4 11 6.0 16 8.8 3 1.6 Full-time 1,002 69.1 75 5.2 101 7.0 85 5.9 77 5.3 48 3.3 25 1.7 All 1,114 68.2 82 5.0 120 7.3 93 5.7 88 5.4 64 3.9 28 1.7
ICU Part-time 102 85.7 3 2.5 3 2.5 2 1.7 1 0.8 - - 2 1.7 Full-time 1,226 79.1 39 2.5 57 3.7 60 3.9 62 4.0 26 1.7 18 1.2 All 1,328 79.6 42 2.5 60 3.6 62 3.7 63 3.8 26 1.6 20 1.2
PCC Part-time 149 81.0 3 1.6 4 2.2 3 1.6 8 4.3 1 0.5 2 1.1 Full-time 551 77.0 15 2.1 23 3.2 27 3.8 16 2.2 13 1.8 7 1.0 All 700 77.8 18 2.0 27 3.0 30 3.3 24 2.7 14 1.6 9 1.0
ALL Part-time 1,239 76.7 73 4.5 95 5.9 53 3.3 59 3.7 33 2.0 14 0.9 Full-time 5,713 76.3 289 3.9 349 4.7 361 4.8 282 3.8 157 2.1 86 1.1 All 6,952 76.3 362 4.0 444 4.9 414 4.5 341 3.7 190 2.1 100 1.1
$4,000 to $5,999 $6,000 to $7,999 $8,000 to $9,999 $10,000 or More
# % # % # % # % # %CCC Part-time 5 0.6 2 0.3 1 0.1 8 1.0 790 100
Full-time 7 0.4 2 0.1 6 0.3 16 0.9 1,730 100 All 12 0.5 4 0.2 7 0.3 24 1.0 2,520 100
UC Part-time 2 0.6 3 0.9 - - 3 0.9 341 100 Full-time 29 1.4 10 0.5 6 0.3 14 0.7 2,044 100 All 31 1.3 13 0.5 6 0.3 17 0.7 2,385 100
CSU Part-time 5 2.7 - - 1 0.5 - - 182 100 Full-time 11 0.8 10 0.7 4 0.3 13 0.9 1,451 100 All 16 1.0 10 0.6 5 0.3 13 0.8 1,633 100
ICU Part-time 1 0.8 - - 1 0.8 4 3.4 119 100 Full-time 17 1.1 11 0.7 5 0.3 28 1.8 1,549 100 All 18 1.1 11 0.7 6 0.4 32 1.9 1,668 100
PCC Part-time 1 0.5 4 2.2 1 0.5 8 4.3 184 100 Full-time 10 1.4 3 0.4 6 0.8 45 6.3 716 100 All 11 1.2 7 0.8 7 0.8 53 5.9 900 100
ALL Part-time 14 0.9 9 0.6 4 0.2 23 1.4 1,616 100 Full-time 74 1.0 36 0.5 27 0.4 116 1.5 7,490 100 All 88 1.0 45 0.5 31 0.3 139 1.5 9,106 100
TABLE U-26A: ACADEMIC YEAR BORROWING FROM CREDIT CARDS
Total
BY SEGMENT, COURSE LOAD, AND DEPENDENCY STATUS
Source: California Student Aid Commission 162 2003-04 SEARS
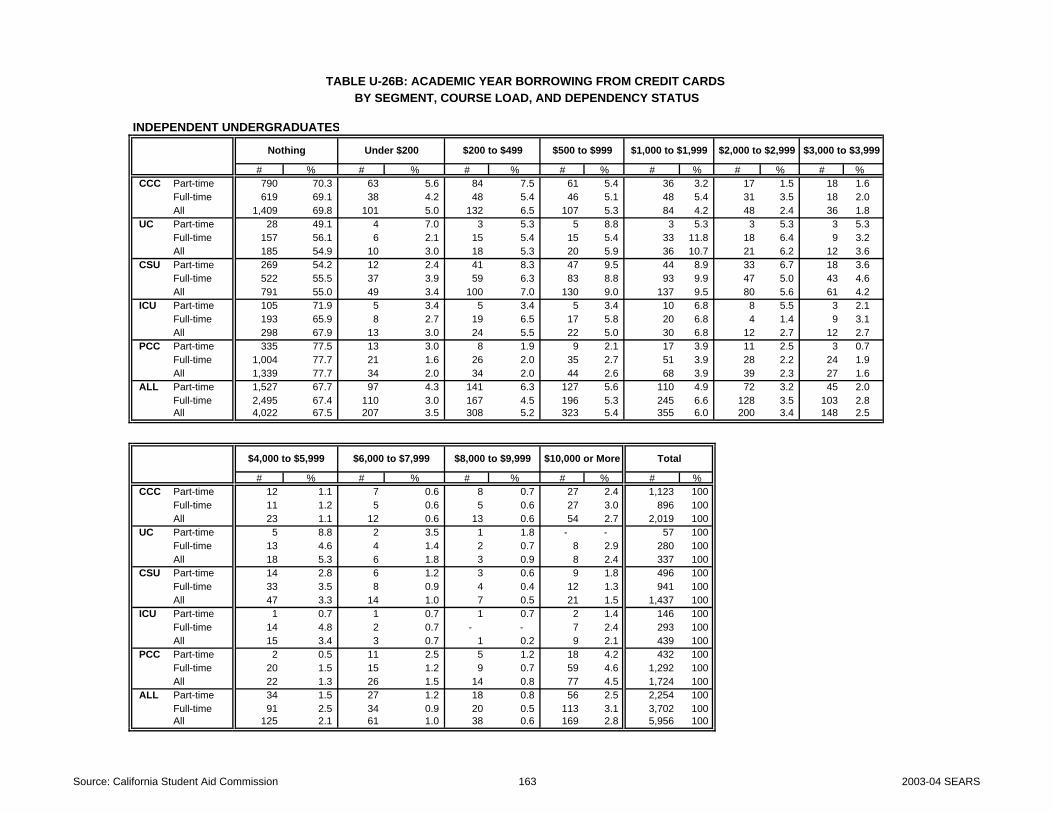
INDEPENDENT UNDERGRADUATES
Nothing Under $200 $200 to $499 $500 to $999 $1,000 to $1,999 $2,000 to $2,999 $3,000 to $3,999
# % # % # % # % # % # % # %CCC Part-time 790 70.3 63 5.6 84 7.5 61 5.4 36 3.2 17 1.5 18 1.6
Full-time 619 69.1 38 4.2 48 5.4 46 5.1 48 5.4 31 3.5 18 2.0 All 1,409 69.8 101 5.0 132 6.5 107 5.3 84 4.2 48 2.4 36 1.8
UC Part-time 28 49.1 4 7.0 3 5.3 5 8.8 3 5.3 3 5.3 3 5.3 Full-time 157 56.1 6 2.1 15 5.4 15 5.4 33 11.8 18 6.4 9 3.2 All 185 54.9 10 3.0 18 5.3 20 5.9 36 10.7 21 6.2 12 3.6
CSU Part-time 269 54.2 12 2.4 41 8.3 47 9.5 44 8.9 33 6.7 18 3.6 Full-time 522 55.5 37 3.9 59 6.3 83 8.8 93 9.9 47 5.0 43 4.6 All 791 55.0 49 3.4 100 7.0 130 9.0 137 9.5 80 5.6 61 4.2
ICU Part-time 105 71.9 5 3.4 5 3.4 5 3.4 10 6.8 8 5.5 3 2.1 Full-time 193 65.9 8 2.7 19 6.5 17 5.8 20 6.8 4 1.4 9 3.1 All 298 67.9 13 3.0 24 5.5 22 5.0 30 6.8 12 2.7 12 2.7
PCC Part-time 335 77.5 13 3.0 8 1.9 9 2.1 17 3.9 11 2.5 3 0.7 Full-time 1,004 77.7 21 1.6 26 2.0 35 2.7 51 3.9 28 2.2 24 1.9 All 1,339 77.7 34 2.0 34 2.0 44 2.6 68 3.9 39 2.3 27 1.6
ALL Part-time 1,527 67.7 97 4.3 141 6.3 127 5.6 110 4.9 72 3.2 45 2.0 Full-time 2,495 67.4 110 3.0 167 4.5 196 5.3 245 6.6 128 3.5 103 2.8 All 4,022 67.5 207 3.5 308 5.2 323 5.4 355 6.0 200 3.4 148 2.5
$4,000 to $5,999 $6,000 to $7,999 $8,000 to $9,999 $10,000 or More
# % # % # % # % # %CCC Part-time 12 1.1 7 0.6 8 0.7 27 2.4 1,123 100
Full-time 11 1.2 5 0.6 5 0.6 27 3.0 896 100 All 23 1.1 12 0.6 13 0.6 54 2.7 2,019 100
UC Part-time 5 8.8 2 3.5 1 1.8 - - 57 100 Full-time 13 4.6 4 1.4 2 0.7 8 2.9 280 100 All 18 5.3 6 1.8 3 0.9 8 2.4 337 100
CSU Part-time 14 2.8 6 1.2 3 0.6 9 1.8 496 100 Full-time 33 3.5 8 0.9 4 0.4 12 1.3 941 100 All 47 3.3 14 1.0 7 0.5 21 1.5 1,437 100
ICU Part-time 1 0.7 1 0.7 1 0.7 2 1.4 146 100 Full-time 14 4.8 2 0.7 - - 7 2.4 293 100 All 15 3.4 3 0.7 1 0.2 9 2.1 439 100
PCC Part-time 2 0.5 11 2.5 5 1.2 18 4.2 432 100 Full-time 20 1.5 15 1.2 9 0.7 59 4.6 1,292 100 All 22 1.3 26 1.5 14 0.8 77 4.5 1,724 100
ALL Part-time 34 1.5 27 1.2 18 0.8 56 2.5 2,254 100 Full-time 91 2.5 34 0.9 20 0.5 113 3.1 3,702 100 All 125 2.1 61 1.0 38 0.6 169 2.8 5,956 100
TABLE U-26B: ACADEMIC YEAR BORROWING FROM CREDIT CARDS
Total
BY SEGMENT, COURSE LOAD, AND DEPENDENCY STATUS
Source: California Student Aid Commission 163 2003-04 SEARS
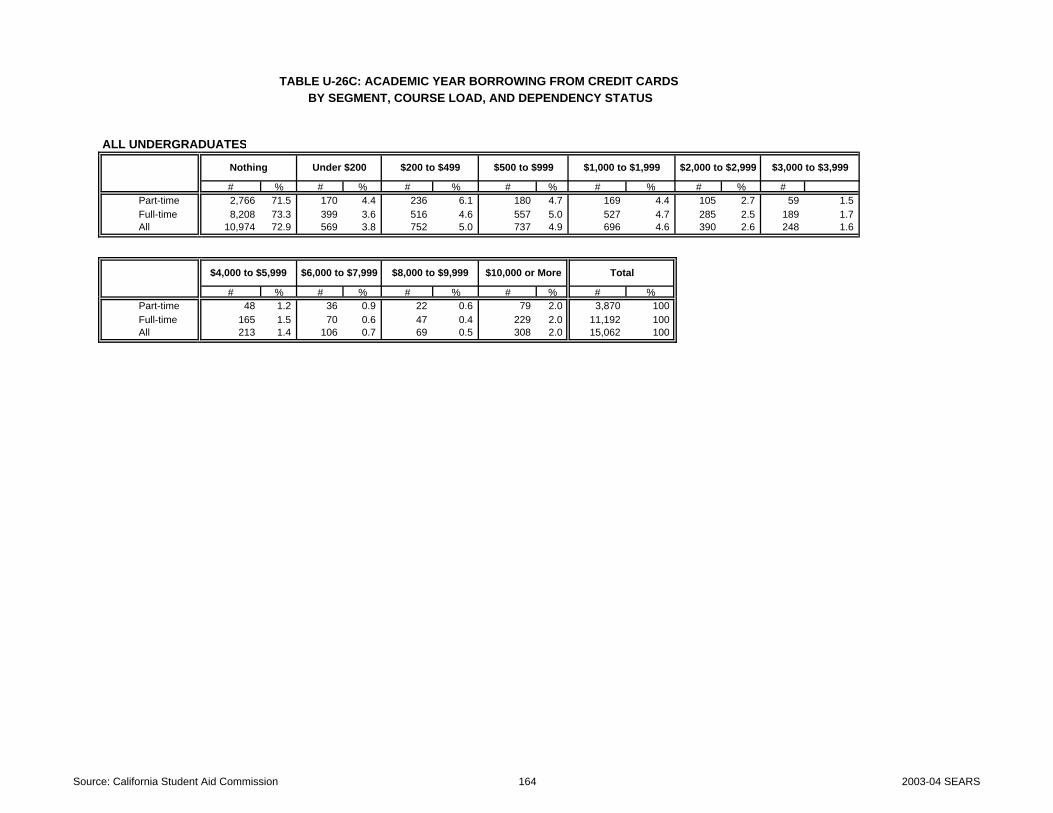
ALL UNDERGRADUATES
Nothing Under $200 $200 to $499 $500 to $999 $1,000 to $1,999 $2,000 to $2,999 $3,000 to $3,999
# % # % # % # % # % # % #Part-time 2,766 71.5 170 4.4 236 6.1 180 4.7 169 4.4 105 2.7 59 1.5 Full-time 8,208 73.3 399 3.6 516 4.6 557 5.0 527 4.7 285 2.5 189 1.7 All 10,974 72.9 569 3.8 752 5.0 737 4.9 696 4.6 390 2.6 248 1.6
$4,000 to $5,999 $6,000 to $7,999 $8,000 to $9,999 $10,000 or More
# % # % # % # % # %Part-time 48 1.2 36 0.9 22 0.6 79 2.0 3,870 100 Full-time 165 1.5 70 0.6 47 0.4 229 2.0 11,192 100 All 213 1.4 106 0.7 69 0.5 308 2.0 15,062 100
Total
TABLE U-26C: ACADEMIC YEAR BORROWING FROM CREDIT CARDS BY SEGMENT, COURSE LOAD, AND DEPENDENCY STATUS
Source: California Student Aid Commission 164 2003-04 SEARS

DEPENDENT UNDERGRADUATES INDEPENDENT UNDERGRADUATES ALL UNDERGRADUATES
CCC Part-time 166 1,498$ 472$ CCC Part-time 333 2,159$ 659$ CCC Part-time 499 1,939$ 588$ Full-time 331 1,582$ 580$ Full-time 277 2,526$ 1,134$ Full-time 608 2,012$ 763$ All 497 1,554$ 501$ All 610 2,325$ 742$ All 1,107 1,979$ 645$
UC Part-time 89 1,511$ 240$ UC Part-time 29 2,610$ 2,128$ UC Part-time 118 1,781$ 697$ Full-time 509 1,741$ 544$ Full-time 123 2,781$ 1,777$ Full-time 632 1,944$ 963$ All 598 1,707$ 491$ All 152 2,749$ 1,812$ All 750 1,918$ 912$
CSU Part-time 70 1,634$ 671$ CSU Part-time 227 2,204$ 1,456$ CSU Part-time 297 2,070$ 1,364$ Full-time 449 1,634$ 507$ Full-time 419 2,108$ 1,385$ Full-time 868 1,863$ 990$
All 519 1,634$ 521$ All 646 2,141$ 1,413$ All 1,165 1,915$ 1,092$ ICU Part-time 17 4,079$ 544$ ICU Part-time 41 2,305$ 2,219$ ICU Part-time 58 2,825$ 1,858$ Full-time 323 2,492$ 887$ Full-time 100 2,527$ 1,110$ Full-time 423 2,500$ 940$
All 340 2,571$ 854$ All 141 2,462$ 1,393$ All 481 2,539$ 997$ PCC Part-time 35 4,441$ 5,078$ PCC Part-time 97 4,169$ 2,289$ PCC Part-time 132 4,241$ 1,555$ Full-time 165 4,429$ 1,616$ Full-time 288 4,177$ 1,819$ Full-time 453 4,269$ 1,788$
All 200 4,431$ 1,845$ All 385 4,175$ 1,902$ All 585 4,262$ 1,893$ ALL Part-time 377 1,916$ 491$ ALL Part-time 727 2,467$ 772$ ALL Part-time 1,104 2,279$ 685$
Full-time 1,777 2,071$ 730$ Full-time 1,207 2,801$ 1,355$ Full-time 2,984 2,366$ 911$ All 2,154 2,043$ 645$ All 1,934 2,675$ 918$ All 4,088 2,342$ 796$
Note: "Nothing" category was excluded from the means and median calculations.
TABLE M-26: ACADEMIC YEAR BORROWING FROM CREDIT CARDS
Number Mean Median Number MedianMean Median Number Mean
BY SEGMENT, COURSE LOAD, AND DEPENDENCY STATUS
Source: California Student Aid Commission 165 2003-04 SEARS

Question for Tables: W-27, U-27, and M-27 (Previous educational debt) W-28, U-28 and M-28 (Spouse’s previous educational debt)
Excluding borrowing for the current academic year, what is your outstanding total debt for education
and living expenses in previous academic years? Include loans from educational institutions, banks, or from friends or family, as well as credit card charges that have not been repaid. If you are married, please report how much your spouse has already borrowed.
Your Educational Your Spouse’s Debt Educational Debt Nothing 00 00 Under $1000 01 01 $1000 to $1,999 02 02 $2000 to $3,999 03 03 $4,000 to $5,999 04 04 $6,000 to $9,999 05 05 $10,000 to $13,999 06 06 $14,000 to $17,999 07 07 $18,000 to $21,999 08 08 $22,000 to $25,999 09 09 $26,000 to $29,999 10 10 $30,000 to $33,999 11 11 $34,000 to $37,999 12 12 $38,000 to $41,999 13 13 $42,000 to $45,999 14 14 $46,000 to $49,999 15 15 $50,000 or more 16 16
166 2003-04 SEARS

DEPENDENT UNDERGRADUATES
Nothing Under $1,000 $1,000 to $1,999 $2,000 to $3,999 $4,000 to $5,999 $6,000 to $9,999 $10,000 to $13,999 $14,000 to $17,999 $18,000 to $21,999
# % # % # % # % # % # % # % # % # %CCC Part-time 256,769 70.8 37,550 10.4 15,735 4.3 17,523 4.8 10,371 2.9 7,868 2.2 5,722 1.6 5,007 1.4 1,788 0.5
Full-time 195,241 74.6 23,062 8.8 14,006 5.3 10,746 4.1 5,313 2.0 5,313 2.0 3,260 1.2 1,328 0.5 966 0.4 All 452,010 72.4 60,612 9.7 29,741 4.8 28,269 4.5 15,684 2.5 13,180 2.1 8,982 1.4 6,335 1.0 2,754 0.4
UC Part-time 13,512 52.3 900 3.5 826 3.2 1,971 7.6 1,571 6.1 2,184 8.5 1,705 6.6 1,495 5.8 459 1.8 Full-time 61,277 58.1 3,124 3.0 2,890 2.7 4,850 4.6 5,628 5.3 7,963 7.5 6,687 6.3 4,857 4.6 2,670 2.5 All 74,789 56.9 4,024 3.1 3,716 2.8 6,821 5.2 7,198 5.5 10,147 7.7 8,392 6.4 6,352 4.8 3,128 2.4
CSU Part-time 8,760 45.9 1,268 6.6 1,366 7.2 2,839 14.9 1,359 7.1 1,474 7.7 985 5.2 420 2.2 301 1.6 Full-time 86,717 60.2 6,841 4.7 5,231 3.6 11,061 7.7 8,535 5.9 8,706 6.0 7,164 5.0 4,529 3.1 2,109 1.5 All 95,477 58.5 8,109 5.0 6,597 4.0 13,900 8.5 9,894 6.1 10,179 6.2 8,150 5.0 4,949 3.0 2,410 1.5
ICU Part-time 2,462 51.6 215 4.5 45 0.9 197 4.1 207 4.3 265 5.5 255 5.3 221 4.6 204 4.3 Full-time 36,085 43.9 1,260 1.5 1,693 2.1 5,077 6.2 4,073 5.0 7,320 8.9 6,652 8.1 4,162 5.1 3,590 4.4 All 38,547 44.3 1,474 1.7 1,738 2.0 5,274 6.1 4,279 4.9 7,584 8.7 6,907 7.9 4,383 5.0 3,794 4.4
PCC Part-time 2,601 47.0 111 2.0 169 3.1 166 3.0 395 7.1 241 4.4 341 6.2 161 2.9 333 6.0 Full-time 9,265 43.2 841 3.9 439 2.1 716 3.3 842 3.9 1,676 7.8 1,113 5.2 1,084 5.1 1,394 6.5 All 11,866 44.0 952 3.5 609 2.3 883 3.3 1,237 4.6 1,917 7.1 1,455 5.4 1,244 4.6 1,727 6.4
ALL Part-time 284,104 68.0 40,043 9.6 18,142 4.3 22,697 5.4 13,903 3.3 12,031 2.9 9,008 2.2 7,303 1.7 3,085 0.7 Full-time 388,585 63.2 35,128 5.7 24,259 3.9 32,450 5.3 24,390 4.0 30,976 5.0 24,876 4.0 15,960 2.6 10,729 1.7 All 672,689 65.1 75,170 7.3 42,401 4.1 55,146 5.3 38,292 3.7 43,007 4.2 33,884 3.3 23,263 2.3 13,813 1.3
$22,000 to $25,999 $26,000 to $29,999 $30,000 to $33,999 $34,000 to $37,999 $38,000 to $41,999 $42,000 to $45,999 $46,000 to $49,999 $50,000 or More Total
# % # % # % # % # % # % # % # % # %CCC Part-time 715 0.2 1,073 0.3 715 0.2 - - - - - - 358 0.1 1,431 0.4 362,624 100
Full-time 604 0.2 604 0.2 483 0.2 121 0.0 121 0.0 - - - - 724 0.3 261,891 100 All 1,319 0.2 1,677 0.3 1,198 0.2 121 0.0 121 0.0 - - 358 0.1 2,155 0.3 624,514 100
UC Part-time 388 1.5 248 1.0 182 0.7 37 0.1 70 0.3 144 0.6 - - 144 0.6 25,836 100 Full-time 2,254 2.1 836 0.8 936 0.9 569 0.5 379 0.4 155 0.1 149 0.1 320 0.3 105,541 100 All 2,642 2.0 1,084 0.8 1,118 0.9 606 0.5 449 0.3 300 0.2 149 0.1 464 0.4 131,377 100
CSU Part-time 62 0.3 125 0.7 141 0.7 - - - - - - - - - - 19,100 100 Full-time 1,453 1.0 662 0.5 224 0.2 109 0.1 355 0.2 25 0.0 62 0.0 382 0.3 144,166 100 All 1,515 0.9 787 0.5 365 0.2 109 0.1 355 0.2 25 0.0 62 0.0 382 0.2 163,266 100
ICU Part-time 144 3.0 75 1.6 187 3.9 - - 80 1.7 102 2.1 - - 118 2.5 4,775 100 Full-time 3,208 3.9 2,045 2.5 1,853 2.3 827 1.0 948 1.2 373 0.5 645 0.8 2,369 2.9 82,180 100 All 3,352 3.9 2,120 2.4 2,040 2.3 827 1.0 1,029 1.2 475 0.5 645 0.7 2,486 2.9 86,955 100
PCC Part-time 170 3.1 170 3.1 356 6.4 37 0.7 30 0.5 17 0.3 88 1.6 147 2.7 5,534 100 Full-time 584 2.7 777 3.6 695 3.2 344 1.6 246 1.1 257 1.2 110 0.5 1,043 4.9 21,425 100 All 754 2.8 947 3.5 1,051 3.9 381 1.4 276 1.0 275 1.0 198 0.7 1,190 4.4 26,959 100
ALL Part-time 1,480 0.4 1,691 0.4 1,581 0.4 74 0.0 180 0.0 264 0.1 446 0.1 1,839 0.4 417,868 100 Full-time 8,102 1.3 4,924 0.8 4,192 0.7 1,970 0.3 2,048 0.3 810 0.1 966 0.2 4,838 0.8 615,202 100 All 9,582 0.9 6,615 0.6 5,773 0.6 2,043 0.2 2,229 0.2 1,074 0.1 1,411 0.1 6,677 0.6 1,033,071 100
TABLE W-27A: STUDENT CUMULATIVE BORROWING IN PREVIOUS ACADEMIC YEARS BY SEGMENT, COURSE LOAD, AND DEPENDENCY STATUS
Source: California Student Aid Commission 167 2003-04 SEARS

INDEPENDENT UNDERGRADUATES
Nothing Under $1,000 $1,000 to $1,999 $2,000 to $3,999 $4,000 to $5,999 $6,000 to $9,999 $10,000 to $13,999 $14,000 to $17,999 $18,000 to $21,999
# % # % # % # % # % # % # % # % # %CCC Part-time 321,497 58.5 54,358 9.9 33,616 6.1 31,828 5.8 20,742 3.8 22,887 4.2 18,596 3.4 12,874 2.3 6,437 1.2
Full-time 81,139 56.9 13,402 9.4 9,056 6.3 10,625 7.4 7,728 5.4 6,520 4.6 5,313 3.7 2,415 1.7 1,811 1.3 All 402,636 58.2 67,760 9.8 42,672 6.2 42,453 6.1 28,470 4.1 29,407 4.2 23,909 3.5 15,289 2.2 8,248 1.2
UC Part-time 1,012 28.6 70 2.0 141 4.0 75 2.1 323 9.1 578 16.3 619 17.5 167 4.7 179 5.0 Full-time 3,986 31.3 285 2.2 140 1.1 1,084 8.5 806 6.3 1,357 10.6 1,839 14.4 870 6.8 641 5.0 All 4,998 30.7 355 2.2 280 1.7 1,159 7.1 1,129 6.9 1,934 11.9 2,458 15.1 1,037 6.4 820 5.0
CSU Part-time 17,004 35.6 2,893 6.1 2,763 5.8 3,215 6.7 4,383 9.2 4,687 9.8 3,657 7.7 2,140 4.5 1,834 3.8 Full-time 24,845 32.0 3,166 4.1 3,455 4.5 6,224 8.0 8,829 11.4 7,476 9.6 7,178 9.2 5,189 6.7 3,603 4.6 All 41,849 33.4 6,059 4.8 6,217 5.0 9,438 7.5 13,212 10.5 12,163 9.7 10,836 8.6 7,329 5.8 5,437 4.3
ICU Part-time 3,150 33.3 321 3.4 206 2.2 513 5.4 363 3.8 974 10.3 711 7.5 609 6.4 545 5.8 Full-time 4,241 26.7 210 1.3 132 0.8 828 5.2 660 4.1 1,657 10.4 2,216 13.9 1,274 8.0 958 6.0 All 7,391 29.1 531 2.1 337 1.3 1,341 5.3 1,023 4.0 2,631 10.4 2,926 11.5 1,883 7.4 1,503 5.9
PCC Part-time 6,925 37.1 366 2.0 255 1.4 501 2.7 744 4.0 1,652 8.9 2,470 13.3 2,174 11.7 1,071 5.7 Full-time 15,881 34.8 1,414 3.1 728 1.6 2,171 4.7 2,030 4.4 4,643 10.2 3,799 8.3 2,279 5.0 2,663 5.8 All 22,806 35.4 1,780 2.8 983 1.5 2,671 4.2 2,774 4.3 6,295 9.8 6,270 9.7 4,453 6.9 3,734 5.8
ALL Part-time 349,587 55.6 58,009 9.2 36,980 5.9 36,131 5.7 26,555 4.2 30,777 4.9 26,053 4.1 17,964 2.9 10,065 1.6 Full-time 130,093 44.1 18,476 6.3 13,510 4.6 20,930 7.1 20,053 6.8 21,653 7.3 20,345 6.9 12,027 4.1 9,676 3.3 All 479,680 51.9 76,485 8.3 50,490 5.5 57,062 6.2 46,608 5.0 52,430 5.7 46,398 5.0 29,991 3.2 19,741 2.1
$22,000 to $25,999 $26,000 to $29,999 $30,000 to $33,999 $34,000 to $37,999 $38,000 to $41,999 $42,000 to $45,999 $46,000 to $49,999 $50,000 or More Total
# % # % # % # % # % # % # % # % # %CCC Part-time 6,080 1.1 3,576 0.7 3,934 0.7 1,788 0.3 1,073 0.2 1,431 0.3 1,073 0.2 7,510 1.4 549,299 100
Full-time 1,932 1.4 483 0.3 724 0.5 483 0.3 - - 241 0.2 - - 845 0.6 142,717 100 All 8,011 1.2 4,059 0.6 4,658 0.7 2,271 0.3 1,073 0.2 1,672 0.2 1,073 0.2 8,355 1.2 692,016 100
UC Part-time 37 1.0 112 3.2 70 2.0 70 2.0 37 1.0 - - - - 49 1.4 3,538 100 Full-time 498 3.9 297 2.3 306 2.4 166 1.3 138 1.1 76 0.6 - - 259 2.0 12,747 100 All 535 3.3 409 2.5 376 2.3 237 1.5 176 1.1 76 0.5 - - 307 1.9 16,285 100
CSU Part-time 1,972 4.1 871 1.8 614 1.3 243 0.5 400 0.8 430 0.9 341 0.7 288 0.6 47,733 100 Full-time 2,029 2.6 1,470 1.9 990 1.3 828 1.1 811 1.0 452 0.6 89 0.1 978 1.3 77,611 100 All 4,001 3.2 2,340 1.9 1,604 1.3 1,071 0.9 1,210 1.0 882 0.7 429 0.3 1,265 1.0 125,344 100
ICU Part-time 489 5.2 401 4.2 306 3.2 104 1.1 226 2.4 116 1.2 - - 426 4.5 9,459 100 Full-time 932 5.9 467 2.9 288 1.8 265 1.7 578 3.6 246 1.5 112 0.7 842 5.3 15,905 100 All 1,421 5.6 867 3.4 594 2.3 370 1.5 804 3.2 362 1.4 112 0.4 1,267 5.0 25,364 100
PCC Part-time 800 4.3 595 3.2 190 1.0 357 1.9 197 1.1 98 0.5 70 0.4 179 1.0 18,644 100 Full-time 2,295 5.0 2,166 4.7 1,864 4.1 785 1.7 457 1.0 313 0.7 577 1.3 1,634 3.6 45,698 100 All 3,095 4.8 2,760 4.3 2,054 3.2 1,142 1.8 653 1.0 411 0.6 648 1.0 1,812 2.8 64,342 100
ALL Part-time 9,378 1.5 5,554 0.9 5,114 0.8 2,563 0.4 1,932 0.3 2,075 0.3 1,484 0.2 8,451 1.3 628,673 100 Full-time 7,686 2.6 4,881 1.7 4,173 1.4 2,528 0.9 1,984 0.7 1,329 0.5 778 0.3 4,557 1.5 294,678 100 All 17,064 1.8 10,436 1.1 9,287 1.0 5,090 0.6 3,916 0.4 3,404 0.4 2,262 0.2 13,008 1.4 923,350 100
TABLE W-27B: STUDENT CUMULATIVE BORROWING IN PREVIOUS ACADEMIC YEARS BY SEGMENT, COURSE LOAD, AND DEPENDENCY STATUS
Source: California Student Aid Commission 168 2003-04 SEARS

ALL UNDERGRADUATES
Nothing Under $1,000 $1,000 to $1,999 $2,000 to $3,999 $4,000 to $5,999 $6,000 to $9,999 $10,000 to $13,999 $14,000 to $17,999 $18,000 to $21,999
# % # % # % # % # % # % # % # % # %Part-time 633,691 60.6 98,052 9.4 55,122 5.3 58,828 5.6 40,458 3.9 42,808 4.1 35,062 3.4 25,267 2.4 13,150 1.3 Full-time 518,678 57.0 53,604 5.9 37,769 4.2 53,380 5.9 44,442 4.9 52,629 5.8 45,221 5.0 27,987 3.1 20,405 2.2 All 1,152,368 58.9 151,655 7.8 92,890 4.7 112,208 5.7 84,900 4.3 95,437 4.9 80,282 4.1 53,254 2.7 33,554 1.7
$22,000 to $25,999 $26,000 to $29,999 $30,000 to $33,999 $34,000 to $37,999 $38,000 to $41,999 $42,000 to $45,999 $46,000 to $49,999 $50,000 or More Total
# % # % # % # % # % # % # % # % # %Part-time 10,858 1.0 7,245 0.7 6,695 0.6 2,637 0.3 2,112 0.2 2,339 0.2 1,930 0.2 10,290 1.0 1,046,541 100 Full-time 15,788 1.7 9,805 1.1 8,364 0.9 4,497 0.5 4,033 0.4 2,140 0.2 1,743 0.2 9,395 1.0 909,880 100 All 26,646 1.4 17,050 0.9 15,060 0.8 7,134 0.4 6,145 0.3 4,478 0.2 3,673 0.2 19,685 1.0 1,956,421 100
TABLE W-27C: STUDENT CUMULATIVE BORROWING IN PREVIOUS ACADEMIC YEARS BY SEGMENT, COURSE LOAD, AND DEPENDENCY STATUS
Source: California Student Aid Commission 169 2003-04 SEARS

DEPENDENT UNDERGRADUATES
Nothing Under $1,000 $1,000 to $1,999 $2,000 to $3,999 $4,000 to $5,999 $6,000 to $9,999 $10,000 to $13,999 $14,000 to $17,999 $18,000 to $21,999
# % # % # % # % # % # % # % # % # %CCC Part-time 718 70.8 105 10.4 44 4.3 49 4.8 29 2.9 22 2.2 16 1.6 14 1.4 5 0.5
Full-time 1,617 74.6 191 8.8 116 5.3 89 4.1 44 2.0 44 2.0 27 1.2 11 0.5 8 0.4 All 2,335 73.4 296 9.3 160 5.0 138 4.3 73 2.3 66 2.1 43 1.4 25 0.8 13 0.4
UC Part-time 222 53.2 15 3.6 13 3.1 29 7.0 27 6.5 35 8.4 26 6.2 22 5.3 7 1.7 Full-time 1,616 58.1 83 3.0 75 2.7 126 4.5 148 5.3 211 7.6 174 6.3 129 4.6 71 2.6 All 1,838 57.5 98 3.1 88 2.8 155 4.8 175 5.5 246 7.7 200 6.3 151 4.7 78 2.4
CSU Part-time 102 48.1 18 8.5 12 5.7 29 13.7 11 5.2 16 7.5 9 4.2 7 3.3 3 1.4 Full-time 1,090 60.8 89 5.0 60 3.3 135 7.5 97 5.4 107 6.0 83 4.6 50 2.8 29 1.6 All 1,192 59.5 107 5.3 72 3.6 164 8.2 108 5.4 123 6.1 92 4.6 57 2.8 32 1.6
ICU Part-time 81 57.4 4 2.8 2 1.4 8 5.7 8 5.7 8 5.7 8 5.7 4 2.8 5 3.5 Full-time 824 45.0 29 1.6 38 2.1 112 6.1 95 5.2 163 8.9 157 8.6 94 5.1 80 4.4 All 905 45.9 33 1.7 40 2.0 120 6.1 103 5.2 171 8.7 165 8.4 98 5.0 85 4.3
PCC Part-time 124 47.9 8 3.1 7 2.7 6 2.3 9 3.5 11 4.2 22 8.5 11 4.2 16 6.2 Full-time 426 44.1 38 3.9 22 2.3 37 3.8 42 4.3 69 7.1 61 6.3 53 5.5 59 6.1 All 550 44.9 46 3.8 29 2.4 43 3.5 51 4.2 80 6.5 83 6.8 64 5.2 75 6.1
ALL Part-time 1,247 61.0 150 7.3 78 3.8 121 5.9 84 4.1 92 4.5 81 4.0 58 2.8 36 1.8 Full-time 5,573 58.4 430 4.5 311 3.3 499 5.2 426 4.5 594 6.2 502 5.3 337 3.5 247 2.6 All 6,820 58.9 580 5.0 389 3.4 620 5.4 510 4.4 686 5.9 583 5.0 395 3.4 283 2.4
$22,000 to $25,999 $26,000 to $29,999 $30,000 to $33,999 $34,000 to $37,999 $38,000 to $41,999 $42,000 to $45,999 $46,000 to $49,999 $50,000 or More Total
# % # % # % # % # % # % # % # % # %CCC Part-time 2 0.2 3 0.3 2 0.2 - - - - - - 1 0.1 4 0.4 1,014 100
Full-time 5 0.2 5 0.2 4 0.2 1 0.0 1 0.0 - - - - 6 0.3 2,169 100 All 7 0.2 8 0.3 6 0.2 1 0.0 1 0.0 - - 1 0.0 10 0.3 3,183 100
UC Part-time 6 1.4 4 1.0 3 0.7 1 0.2 1 0.2 3 0.7 - - 3 0.7 417 100 Full-time 58 2.1 22 0.8 26 0.9 15 0.5 10 0.4 4 0.1 4 0.1 9 0.3 2,781 100 All 64 2.0 26 0.8 29 0.9 16 0.5 11 0.3 7 0.2 4 0.1 12 0.4 3,198 100
CSU Part-time 1 0.5 2 0.9 2 0.9 - - - - - - - - - - 212 100 Full-time 20 1.1 11 0.6 3 0.2 2 0.1 8 0.4 1 0.1 1 0.1 6 0.3 1,792 100 All 21 1.0 13 0.6 5 0.2 2 0.1 8 0.4 1 0.0 1 0.0 6 0.3 2,004 100
ICU Part-time 3 2.1 2 1.4 3 2.1 - - 1 0.7 2 1.4 - - 2 1.4 141 100 Full-time 56 3.1 28 1.5 39 2.1 20 1.1 22 1.2 8 0.4 15 0.8 52 2.8 1,832 100 All 59 3.0 30 1.5 42 2.1 20 1.0 23 1.2 10 0.5 15 0.8 54 2.7 1,973 100
PCC Part-time 8 3.1 9 3.5 12 4.6 2 0.8 1 0.4 1 0.4 4 1.5 8 3.1 259 100 Full-time 35 3.6 19 2.0 28 2.9 19 2.0 12 1.2 10 1.0 7 0.7 30 3.1 967 100 All 43 3.5 28 2.3 40 3.3 21 1.7 13 1.1 11 0.9 11 0.9 38 3.1 1,226 100
ALL Part-time 20 1.0 20 1.0 22 1.1 3 0.1 3 0.1 6 0.3 5 0.2 17 0.8 2,043 100 Full-time 174 1.8 85 0.9 100 1.0 57 0.6 53 0.6 23 0.2 27 0.3 103 1.1 9,541 100 All 194 1.7 105 0.9 122 1.1 60 0.5 56 0.5 29 0.3 32 0.3 120 1.0 11,584 100
TABLE U-27A: STUDENT CUMULATIVE BORROWING IN PREVIOUS ACADEMIC YEARS BY SEGMENT, COURSE LOAD, AND DEPENDENCY STATUS
Source: California Student Aid Commission 170 2003-04 SEARS

INDEPENDENT UNDERGRADUATES
Nothing Under $1,000 $1,000 to $1,999 $2,000 to $3,999 $4,000 to $5,999 $6,000 to $9,999 $10,000 to $13,999 $14,000 to $17,999 $18,000 to $21,999
# % # % # % # % # % # % # % # % # %CCC Part-time 899 58.5 152 9.9 94 6.1 89 5.8 58 3.8 64 4.2 52 3.4 36 2.3 18 1.2
Full-time 672 56.9 111 9.4 75 6.3 88 7.4 64 5.4 54 4.6 44 3.7 20 1.7 15 1.3 All 1,571 57.8 263 9.7 169 6.2 177 6.5 122 4.5 118 4.3 96 3.5 56 2.1 33 1.2
UC Part-time 20 30.8 1 1.5 2 3.1 2 3.1 6 9.2 10 15.4 10 15.4 3 4.6 3 4.6 Full-time 105 31.7 7 2.1 4 1.2 28 8.5 21 6.3 35 10.6 47 14.2 22 6.6 17 5.1 All 125 31.6 8 2.0 6 1.5 30 7.6 27 6.8 45 11.4 57 14.4 25 6.3 20 5.1
CSU Part-time 210 36.8 37 6.5 33 5.8 38 6.7 53 9.3 55 9.6 43 7.5 24 4.2 20 3.5 Full-time 332 31.2 43 4.0 46 4.3 86 8.1 123 11.5 101 9.5 113 10.6 72 6.8 49 4.6 All 542 33.1 80 4.9 79 4.8 124 7.6 176 10.8 156 9.5 156 9.5 96 5.9 69 4.2
ICU Part-time 45 29.0 5 3.2 3 1.9 9 5.8 7 4.5 17 11.0 11 7.1 10 6.5 11 7.1 Full-time 91 27.9 5 1.5 3 0.9 16 4.9 14 4.3 33 10.1 41 12.6 26 8.0 19 5.8 All 136 28.3 10 2.1 6 1.2 25 5.2 21 4.4 50 10.4 52 10.8 36 7.5 30 6.2
PCC Part-time 206 39.0 14 2.7 11 2.1 14 2.7 29 5.5 47 8.9 57 10.8 36 6.8 26 4.9 Full-time 616 38.6 51 3.2 33 2.1 78 4.9 88 5.5 146 9.2 145 9.1 87 5.5 76 4.8 All 822 38.7 65 3.1 44 2.1 92 4.3 117 5.5 193 9.1 202 9.5 123 5.8 102 4.8
ALL Part-time 1,380 48.4 209 7.3 143 5.0 152 5.3 153 5.4 193 6.8 173 6.1 109 3.8 78 2.7 Full-time 1,816 40.4 217 4.8 161 3.6 296 6.6 310 6.9 369 8.2 390 8.7 227 5.0 176 3.9 All 3,196 43.5 426 5.8 304 4.1 448 6.1 463 6.3 562 7.6 563 7.7 336 4.6 254 3.5
$22,000 to $25,999 $26,000 to $29,999 $30,000 to $33,999 $34,000 to $37,999 $38,000 to $41,999 $42,000 to $45,999 $46,000 to $49,999 $50,000 or More Total
# % # % # % # % # % # % # % # % # %CCC Part-time 17 1.1 10 0.7 11 0.7 5 0.3 3 0.2 4 0.3 3 0.2 21 1.4 1,536 100
Full-time 16 1.4 4 0.3 6 0.5 4 0.3 - - 2 0.2 - - 7 0.6 1,182 100 All 33 1.2 14 0.5 17 0.6 9 0.3 3 0.1 6 0.2 3 0.1 28 1.0 2,718 100
UC Part-time 1 1.5 3 4.6 1 1.5 1 1.5 1 1.5 - - - - 1 1.5 65 100 Full-time 14 4.2 7 2.1 8 2.4 4 1.2 3 0.9 2 0.6 - - 7 2.1 331 100 All 15 3.8 10 2.5 9 2.3 5 1.3 4 1.0 2 0.5 - - 8 2.0 396 100
CSU Part-time 22 3.9 10 1.8 8 1.4 2 0.4 4 0.7 5 0.9 3 0.5 3 0.5 570 100 Full-time 29 2.7 24 2.3 12 1.1 10 0.9 7 0.7 6 0.6 2 0.2 10 0.9 1,065 100 All 51 3.1 34 2.1 20 1.2 12 0.7 11 0.7 11 0.7 5 0.3 13 0.8 1,635 100
ICU Part-time 10 6.5 7 4.5 6 3.9 2 1.3 3 1.9 2 1.3 - - 7 4.5 155 100 Full-time 18 5.5 10 3.1 6 1.8 6 1.8 11 3.4 5 1.5 3 0.9 19 5.8 326 100 All 28 5.8 17 3.5 12 2.5 8 1.7 14 2.9 7 1.5 3 0.6 26 5.4 481 100
PCC Part-time 25 4.7 19 3.6 10 1.9 4 0.8 10 1.9 5 0.9 4 0.8 11 2.1 528 100 Full-time 61 3.8 55 3.5 54 3.4 24 1.5 12 0.8 12 0.8 17 1.1 39 2.4 1,594 100 All 86 4.1 74 3.5 64 3.0 28 1.3 22 1.0 17 0.8 21 1.0 50 2.4 2,122 100
ALL Part-time 75 2.6 49 1.7 36 1.3 14 0.5 21 0.7 16 0.6 10 0.4 43 1.5 2,854 100 Full-time 138 3.1 100 2.2 86 1.9 48 1.1 33 0.7 27 0.6 22 0.5 82 1.8 4,498 100 All 213 2.9 149 2.0 122 1.7 62 0.8 54 0.7 43 0.6 32 0.4 125 1.7 7,352 100
TABLE U-27B: STUDENT CUMULATIVE BORROWING IN PREVIOUS ACADEMIC YEARS BY SEGMENT, COURSE LOAD, AND DEPENDENCY STATUS
Source: California Student Aid Commission 171 2003-04 SEARS

ALL UNDERGRADUATES
Nothing Under $1,000 $1,000 to $1,999 $2,000 to $3,999 $4,000 to $5,999 $6,000 to $9,999 $10,000 to $13,999 $14,000 to $17,999 $18,000 to $21,999
# % # % # % # % # % # % # % # % # %Part-time 2,627 53.6 359 7.3 221 4.5 273 5.6 237 4.8 285 5.8 254 5.2 167 3.4 114 2.3 Full-time 7,389 52.6 647 4.6 472 3.4 795 5.7 736 5.2 963 6.9 892 6.4 564 4.0 423 3.0 All 10,016 52.9 1,006 5.3 693 3.7 1,068 5.6 973 5.1 1,248 6.6 1,146 6.1 731 3.9 537 2.8
$22,000 to $25,999 $26,000 to $29,999 $30,000 to $33,999 $34,000 to $37,999 $38,000 to $41,999 $42,000 to $45,999 $46,000 to $49,999 $50,000 or More Total
# % # % # % # % # % # % # % # % # %Part-time 95 1.9 69 1.4 58 1.2 17 0.3 24 0.5 22 0.4 15 0.3 60 1.2 4,897 100 Full-time 312 2.2 185 1.3 186 1.3 105 0.7 86 0.6 50 0.4 49 0.3 185 1.3 14,039 100 All 407 2.1 254 1.3 244 1.3 122 0.6 110 0.6 72 0.4 64 0.3 245 1.3 18,936 100
TABLE U-27C: STUDENT CUMULATIVE BORROWING IN PREVIOUS ACADEMIC YEARS BY SEGMENT, COURSE LOAD, AND DEPENDENCY STATUS
Source: California Student Aid Commission 172 2003-04 SEARS

DEPENDENT UNDERGRADUATES INDEPENDENT UNDERGRADUATES ALL UNDERGRADUATES
CCC Part-time 296 5,252$ 1,976$ CCC Part-time 637 8,788$ 3,628$ CCC Part-time 933 7,666$ 3,035$ Full-time 552 4,610$ 1,732$ Full-time 510 7,090$ 3,567$ Full-time 1,062 5,801$ 2,428$ All 848 4,834$ 1,861$ All 1,147 8,033$ 3,613$ All 1,995 6,673$ 2,852$
UC Part-time 195 10,508$ 7,637$ UC Part-time 45 13,678$ 10,494$ UC Part-time 240 11,102$ 8,242$ Full-time 1,165 11,286$ 8,833$ Full-time 226 14,330$ 11,542$ Full-time 1,391 11,780$ 9,307$ All 1,360 11,174$ 8,576$ All 271 14,221$ 11,278$ All 1,631 11,681$ 9,064$
CSU Part-time 110 6,555$ 3,786$ CSU Part-time 360 11,119$ 7,801$ CSU Part-time 470 10,051$ 6,291$ Full-time 702 8,457$ 5,309$ Full-time 733 11,639$ 8,519$ Full-time 1,435 10,082$ 6,435$
All 812 8,199$ 5,068$ All 1,093 11,468$ 8,242$ All 1,905 10,075$ 6,395$ ICU Part-time 60 14,150$ 15,844$ ICU Part-time 110 18,082$ 12,836$ ICU Part-time 170 16,694$ 14,075$ Full-time 1,008 15,800$ 12,188$ Full-time 235 19,528$ 13,516$ Full-time 1,243 16,505$ 12,726$
All 1,068 15,707$ 12,435$ All 345 19,067$ 13,417$ All 1,413 16,528$ 12,856$ PCC Part-time 135 18,648$ 15,045$ PCC Part-time 322 16,604$ 13,754$ PCC Part-time 457 17,208$ 13,844$ Full-time 541 17,473$ 15,375$ Full-time 978 16,377$ 14,190$ Full-time 1,519 16,768$ 14,393$
All 676 17,708$ 15,333$ All 1,300 16,433$ 13,972$ All 1,976 16,869$ 14,261$ ALL Part-time 796 9,662$ 2,725$ ALL Part-time 1,474 11,908$ 4,533$ ALL Part-time 2,270 11,120$ 3,748$
Full-time 3,968 11,847$ 5,035$ Full-time 2,682 13,420$ 7,344$ Full-time 6,650 12,481$ 5,826$ All 4,764 11,482$ 3,881$ All 4,156 12,884$ 5,458$ All 8,920 12,135$ 4,747$
Note: "Nothing" category was excluded from the means and median calculations.
Median Number
M-27: MEAN AND MEDIAN STUDENT CUMULATIVE BORROWING IN PREVIOUS ACADEMIC YEARS BY SEGMENT, COURSE LOAD, AND DEPENDENCY STATUS
MeanNumber Mean Median Number MedianMean
Source: California Student Aid Commission 173 2003-04 SEARS

By definition, a dependent student does not have a spouse.
TABLE W-28A: SPOUSE'S BORROWING IN PREVIOUS ACADEMIC YEARS BY SEGMENT, COURSE LOAD, AND DEPENDENCY STATUS
Source: California Student Aid Commission 174 2003-04 SEARS

INDEPENDENT UNDERGRADUATES
Nothing Under $1,000 $1,000 to $1,999 $2,000 to $3,999 $4,000 to $5,999 $6,000 to $9,999 $10,000 to $13,999 $14,000 to $17,999 $18,000 to $21,999
# % # % # % # % # % # % # % # % # %CCC Part-time 264,994 83.0 7,510 2.4 8,583 2.7 5,007 1.6 8,225 2.6 6,437 2.0 4,649 1.5 1,788 0.6 1,431 0.4
Full-time 70,755 83.5 3,139 3.7 1,570 1.9 966 1.1 1,932 2.3 1,328 1.6 1,087 1.3 724 0.9 362 0.4 All 335,749 83.1 10,649 2.6 10,153 2.5 5,973 1.5 10,157 2.5 7,765 1.9 5,736 1.4 2,513 0.6 1,793 0.4
UC Part-time 277 56.8 70 14.4 - - - - - - - - 70 14.4 - - 70 14.4 Full-time 1,150 55.3 74 3.5 86 4.1 37 1.8 49 2.3 86 4.1 74 3.6 88 4.2 66 3.2 All 1,427 55.6 144 5.6 86 3.3 37 1.4 49 1.9 86 3.3 144 5.6 88 3.4 136 5.3
CSU Part-time 18,768 80.0 658 2.8 506 2.2 301 1.3 353 1.5 500 2.1 442 1.9 343 1.5 545 2.3 Full-time 30,024 78.9 1,126 3.0 407 1.1 512 1.3 737 1.9 714 1.9 1,437 3.8 1,105 2.9 371 1.0 All 48,792 79.3 1,784 2.9 913 1.5 813 1.3 1,090 1.8 1,215 2.0 1,879 3.1 1,448 2.4 916 1.5
ICU Part-time 4,436 83.2 52 1.0 - - 34 0.6 - - 108 2.0 122 2.3 91 1.7 54 1.0 Full-time 5,343 70.3 116 1.5 44 0.6 138 1.8 153 2.0 599 7.9 246 3.2 210 2.8 102 1.3 All 9,780 75.7 169 1.3 44 0.3 172 1.3 153 1.2 708 5.5 369 2.9 301 2.3 156 1.2
PCC Part-time 7,775 84.1 90 1.0 64 0.7 125 1.4 182 2.0 158 1.7 185 2.0 92 1.0 - - Full-time 18,189 76.8 413 1.7 198 0.8 681 2.9 986 4.2 397 1.7 744 3.1 94 0.4 254 1.1 All 25,964 78.9 503 1.5 262 0.8 806 2.4 1,168 3.5 555 1.7 929 2.8 186 0.6 254 0.8
ALL Part-time 296,250 82.8 8,381 2.3 9,153 2.6 5,466 1.5 8,761 2.4 7,204 2.0 5,468 1.5 2,315 0.6 2,100 0.6 Full-time 125,461 80.3 4,868 3.1 2,305 1.5 2,334 1.5 3,857 2.5 3,125 2.0 3,587 2.3 2,221 1.4 1,156 0.7 All 421,711 82.0 13,249 2.6 11,458 2.2 7,800 1.5 12,617 2.5 10,328 2.0 9,056 1.8 4,536 0.9 3,255 0.6
$22,000 to $25,999 $26,000 to $29,999 $30,000 to $33,999 $34,000 to $37,999 $38,000 to $41,999 $42,000 to $45,999 $46,000 to $49,999 $50,000 or More Total
# % # % # % # % # % # % # % # % # %CCC Part-time 2,146 0.7 715 0.2 2,146 0.7 358 0.1 1,431 0.4 715 0.2 - 3,219 1.0 319,352 100
Full-time 1,328 1.6 241 0.3 - - 483 0.6 - - - - - 845 1.0 84,761 100 All 3,474 0.9 957 0.2 2,146 0.5 841 0.2 1,431 0.4 715 0.2 - - 4,064 1.0 404,113 100
UC Part-time - - - - - - - - - - - - - - - - 488 100 Full-time 79 3.8 - - - - 49 2.3 103 5.0 - - 66 3.2 75 3.6 2,081 100 All 79 3.1 - - - - 49 1.9 103 4.0 - - 66 2.6 75 2.9 2,568 100
CSU Part-time 318 1.4 152 0.6 178 0.8 - - 42 0.2 - - - - 355 1.5 23,461 100 Full-time 188 0.5 179 0.5 349 0.9 190 0.5 308 0.8 25 0.1 255 0.7 137 0.4 38,064 100 All 505 0.8 330 0.5 527 0.9 190 0.3 350 0.6 25 0.0 255 0.4 492 0.8 61,524 100
ICU Part-time 251 4.7 - - - - - - - - - - - - 180 3.4 5,329 100 Full-time 346 4.6 - - 80 1.0 58 0.8 48 0.6 - - - - 112 1.5 7,596 100 All 597 4.6 - - 80 0.6 58 0.4 48 0.4 - - - - 291 2.3 12,925 100
PCC Part-time 57 0.6 131 1.4 - - 131 1.4 9 0.1 62 0.7 11 0.1 169 1.8 9,241 100 Full-time 382 1.6 377 1.6 176 0.7 31 0.1 75 0.3 20 0.1 75 0.3 578 2.4 23,669 100 All 439 1.3 508 1.5 176 0.5 162 0.5 85 0.3 82 0.2 85 0.3 748 2.3 32,910 100
ALL Part-time 2,771 0.8 998 0.3 2,324 0.6 488 0.1 1,482 0.4 777 0.2 11 0.0 3,922 1.1 357,871 100 Full-time 2,323 1.5 797 0.5 605 0.4 810 0.5 534 0.3 44 0.0 396 0.3 1,747 1.1 156,170 100 All 5,094 1.0 1,795 0.3 2,928 0.6 1,298 0.3 2,016 0.4 822 0.2 406 0.1 5,670 1.1 514,041 100
TABLE W-28B: SPOUSE'S BORROWING IN PREVIOUS ACADEMIC YEARS BY SEGMENT, COURSE LOAD, AND DEPENDENCY STATUS
Source: California Student Aid Commission 175 2003-04 SEARS

By definition, a dependent student does not have a spouse.
TABLE U-28A: SPOUSE'S BORROWING IN PREVIOUS ACADEMIC YEARS BY SEGMENT, COURSE LOAD, AND DEPENDENCY STATUS
Source: California Student Aid Commission 176 2003-04 SEARS

INDEPENDENT UNDERGRADUATES
Nothing Under $1,000 $1,000 to $1,999 $2,000 to $3,999 $4,000 to $5,999 $6,000 to $9,999 $10,000 to $13,999 $14,000 to $17,999 $18,000 to $21,999
# % # % # % # % # % # % # % # % # %CCC Part-time 741 83.0 21 2.4 24 2.7 14 1.6 23 2.6 18 2.0 13 1.5 5 0.6 4 0.4
Full-time 586 83.5 26 3.7 13 1.9 8 1.1 16 2.3 11 1.6 9 1.3 6 0.9 3 0.4 All 1,327 83.2 47 2.9 37 2.3 22 1.4 39 2.4 29 1.8 22 1.4 11 0.7 7 0.4
UC Part-time 7 70.0 1 10.0 - - - - - - - - 1 10.0 - - 1 10.0 Full-time 30 55.6 2 3.7 2 3.7 1 1.9 1 1.9 2 3.7 2 3.7 2 3.7 2 3.7 All 37 57.8 3 4.7 2 3.1 1 1.6 1 1.6 2 3.1 3 4.7 2 3.1 3 4.7
CSU Part-time 228 80.3 9 3.2 6 2.1 4 1.4 6 2.1 5 1.8 4 1.4 4 1.4 5 1.8 Full-time 404 78.6 12 2.3 6 1.2 7 1.4 14 2.7 14 2.7 18 3.5 14 2.7 4 0.8 All 632 79.2 21 2.6 12 1.5 11 1.4 20 2.5 19 2.4 22 2.8 18 2.3 9 1.1
ICU Part-time 65 80.2 1 1.2 - - 1 1.2 - - 2 2.5 2 2.5 2 2.5 1 1.2 Full-time 115 73.2 2 1.3 1 0.6 2 1.3 3 1.9 10 6.4 5 3.2 4 2.5 2 1.3 All 180 75.6 3 1.3 1 0.4 3 1.3 3 1.3 12 5.0 7 2.9 6 2.5 3 1.3
PCC Part-time 228 82.3 2 0.7 3 1.1 5 1.8 4 1.4 8 2.9 3 1.1 6 2.2 - - Full-time 682 81.9 18 2.2 9 1.1 17 2.0 17 2.0 15 1.8 12 1.4 3 0.4 6 0.7 All 910 82.0 20 1.8 12 1.1 22 2.0 21 1.9 23 2.1 15 1.4 9 0.8 6 0.5
ALL Part-time 1,269 82.1 34 2.2 33 2.1 24 1.6 33 2.1 33 2.1 23 1.5 17 1.1 11 0.7 Full-time 1,817 80.4 60 2.7 31 1.4 35 1.5 51 2.3 52 2.3 46 2.0 29 1.3 17 0.8 All 3,086 81.1 94 2.5 64 1.7 59 1.6 84 2.2 85 2.2 69 1.8 46 1.2 28 0.7
$22,000 to $25,999 $26,000 to $29,999 $30,000 to $33,999 $34,000 to $37,999 $38,000 to $41,999 $42,000 to $45,999 $46,000 to $49,999 $50,000 or More Total
# % # % # % # % # % # % # % # % # %CCC Part-time 6 0.7 2 0.2 6 0.7 1 0.1 4 0.4 2 0.2 - - 9 1.0 893 100
Full-time 11 1.6 2 0.3 - - 4 0.6 - - - - - - 7 1.0 702 100 All 17 1.1 4 0.3 6 0.4 5 0.3 4 0.3 2 0.1 - - 16 1.0 1,595 100
UC Part-time - - - - - - - - - - - - - - - - 10 100 Full-time 2 3.7 - - - - 1 1.9 3 5.6 - - 2 3.7 2 3.7 54 100 All 2 3.1 - - - - 1 1.6 3 4.7 - - 2 3.1 2 3.1 64 100
CSU Part-time 3 1.1 2 0.7 3 1.1 - - 1 0.4 - - - - 4 1.4 284 100 Full-time 3 0.6 3 0.6 5 1.0 2 0.4 3 0.6 1 0.2 3 0.6 1 0.2 514 100 All 6 0.8 5 0.6 8 1.0 2 0.3 4 0.5 1 0.1 3 0.4 5 0.6 798 100
ICU Part-time 4 4.9 - - - - - - - - - - - - 3 3.7 81 100 Full-time 6 3.8 - - 2 1.3 1 0.6 1 0.6 - - - - 3 1.9 157 100 All 10 4.2 - - 2 0.8 1 0.4 1 0.4 - - - - 6 2.5 238 100
PCC Part-time 3 1.1 1 0.4 - - 1 0.4 1 0.4 3 1.1 1 0.4 8 2.9 277 100 Full-time 9 1.1 7 0.8 5 0.6 3 0.4 4 0.5 2 0.2 3 0.4 21 2.5 833 100 All 12 1.1 8 0.7 5 0.5 4 0.4 5 0.5 5 0.5 4 0.4 29 2.6 1,110 100
ALL Part-time 16 1.0 5 0.3 9 0.6 2 0.1 6 0.4 5 0.3 1 0.1 24 1.6 1,545 100 Full-time 31 1.4 12 0.5 12 0.5 11 0.5 11 0.5 3 0.1 8 0.4 34 1.5 2,260 100 All 47 1.2 17 0.4 21 0.6 13 0.3 17 0.4 8 0.2 9 0.2 58 1.5 3,805 100
TABLE U-28B: SPOUSE'S BORROWING IN PREVIOUS ACADEMIC YEARS BY SEGMENT, COURSE LOAD, AND DEPENDENCY STATUS
Source: California Student Aid Commission 177 2003-04 SEARS

INDEPENDENT UNDERGRADUATES
CCC Part-time 152 11,891$ 5,477$ Full-time 116 11,349$ 5,374$ All 268 11,657$ 5,458$
UC Part-time 3 10,833$ 11,999$ Full-time 24 22,000$ 16,765$ All 27 20,759$ 15,169$
CSU Part-time 56 13,920$ 10,252$ Full-time 110 13,509$ 11,455$
All 166 13,648$ 11,172$ ICU Part-time 16 21,719$ 20,259$ Full-time 42 16,845$ 9,393$
All 58 18,190$ 14,450$ PCC Part-time 49 20,582$ 11,865$ Full-time 151 18,242$ 10,310$
All 200 18,815$ 10,619$ ALL Part-time 276 14,404$ 5,725$
Full-time 443 15,333$ 8,195$ All 719 14,976$ 6,132$
Note: "Nothing" category was excluded from the means and median calculations.
spouse had previous educational debt, the numbers are small and are not reported here.
By definition, a dependent student is notmarried. Although some dependent
students with a marital status of separated,divorced, or widowed reported that their
Mean MedianNumber
TABLE M-28: MEAN AND MEDIAN SPOUSE'S BORROWING IN PREVIOUS ACADEMIC YEARS BY SEGMENT, COURSE LOAD, AND DEPENDENCY STATUS
Source: California Student Aid Commission 178 2003-04 SEARS
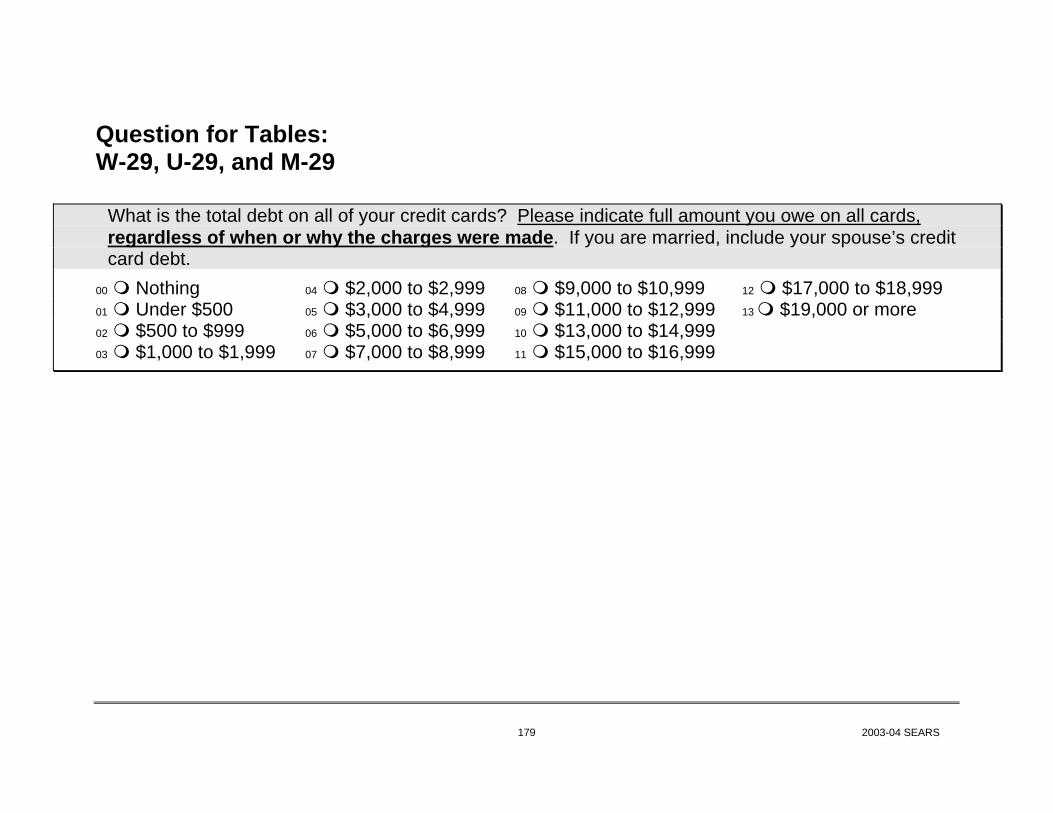
Question for Tables: W-29, U-29, and M-29
What is the total debt on all of your credit cards? Please indicate full amount you owe on all cards,
regardless of when or why the charges were made. If you are married, include your spouse’s credit card debt.
00 Nothing 04 $2,000 to $2,999 08 $9,000 to $10,999 12 $17,000 to $18,999 01 Under $500 05 $3,000 to $4,999 09 $11,000 to $12,999 13 $19,000 or more 02 $500 to $999 06 $5,000 to $6,999 10 $13,000 to $14,999 03 $1,000 to $1,999 07 $7,000 to $8,999 11 $15,000 to $16,999
179 2003-04 SEARS

DEPENDENT UNDERGRADUATES
Nothing Under $500 $500 to $999 $1,000 to $1,999 $2,000 to $2,999 $3,000 to $4,999 $5,000 to $6,999 $7,000 to $8,999
# % # % # % # % # % # % # % # %CCC Part-time 235,669 62.3 54,000 14.3 25,033 6.6 16,450 4.3 12,159 3.2 13,589 3.6 7,868 2.1 3,219 0.9
Full-time 183,166 67.8 33,929 12.6 17,145 6.3 13,161 4.9 5,313 2.0 6,158 2.3 3,985 1.5 2,656 1.0 All 418,835 64.6 87,929 13.6 42,178 6.5 29,611 4.6 17,472 2.7 19,747 3.0 11,852 1.8 5,875 0.9
UC Part-time 14,783 56.2 4,715 17.9 1,839 7.0 1,912 7.3 987 3.8 920 3.5 625 2.4 226 0.9 Full-time 68,176 62.9 17,126 15.8 7,888 7.3 5,291 4.9 2,955 2.7 2,926 2.7 1,516 1.4 763 0.7 All 82,959 61.6 21,841 16.2 9,727 7.2 7,203 5.3 3,942 2.9 3,846 2.9 2,141 1.6 989 0.7
CSU Part-time 6,908 35.2 2,931 15.0 2,167 11.1 794 4.0 2,022 10.3 1,712 8.7 1,608 8.2 723 3.7 Full-time 74,182 49.9 25,369 17.1 12,499 8.4 10,957 7.4 7,682 5.2 7,295 4.9 4,588 3.1 1,955 1.3 All 81,090 48.2 28,300 16.8 14,666 8.7 11,751 7.0 9,705 5.8 9,007 5.4 6,196 3.7 2,679 1.6
ICU Part-time 3,107 61.7 420 8.3 559 11.1 558 11.1 79 1.6 103 2.0 72 1.4 46 0.9 Full-time 51,855 62.1 13,289 15.9 5,297 6.3 4,342 5.2 2,727 3.3 2,461 2.9 1,163 1.4 703 0.8 All 54,962 62.0 13,709 15.5 5,856 6.6 4,900 5.5 2,806 3.2 2,564 2.9 1,235 1.4 749 0.8
PCC Part-time 3,643 58.1 426 6.8 369 5.9 318 5.1 356 5.7 478 7.6 115 1.8 234 3.7 Full-time 12,999 58.1 2,543 11.4 1,205 5.4 1,736 7.8 1,183 5.3 1,202 5.4 666 3.0 158 0.7 All 16,642 58.1 2,969 10.4 1,575 5.5 2,054 7.2 1,539 5.4 1,679 5.9 782 2.7 392 1.4
ALL Part-time 264,110 60.6 62,491 14.3 29,968 6.9 20,032 4.6 15,604 3.6 16,801 3.9 10,288 2.4 4,448 1.0 Full-time 390,378 61.6 92,256 14.6 44,035 7.0 35,486 5.6 19,860 3.1 20,042 3.2 11,918 1.9 6,235 1.0 All 654,488 61.2 154,747 14.5 74,002 6.9 55,518 5.2 35,464 3.3 36,843 3.4 22,206 2.1 10,684 1.0
$9,000 to 10,999 $11,000 to 12,999 $13,000 to $14,999 $15,000 to $16,999 $17,000 to $18,999 $19,000 or More Total
# % # % # % # % # % # % # %CCC Part-time 3,934 1.0 1,073 0.3 1,788 0.5 358 0.1 1,073 0.3 2,146 0.6 378,357 100
Full-time 1,328 0.5 966 0.4 604 0.2 - - 121 0.0 1,811 0.7 270,342 100 All 5,262 0.8 2,039 0.3 2,392 0.4 358 0.1 1,194 0.2 3,957 0.6 648,699 100
UC Part-time 112 0.4 - - - - - - 70 0.3 137 0.5 26,326 100 Full-time 657 0.6 450 0.4 187 0.2 37 0.0 49 0.0 298 0.3 108,319 100 All 769 0.6 450 0.3 187 0.1 37 0.0 119 0.1 436 0.3 134,645 100
CSU Part-time 265 1.3 - - 333 1.7 - - 137 0.7 - - 19,600 100 Full-time 1,294 0.9 1,039 0.7 683 0.5 289 0.2 289 0.2 555 0.4 148,676 100 All 1,558 0.9 1,039 0.6 1,016 0.6 289 0.2 426 0.3 555 0.3 168,275 100
ICU Part-time - - 44 0.9 - - 48 0.9 - - - - 5,037 100 Full-time 473 0.6 145 0.2 242 0.3 406 0.5 101 0.1 353 0.4 83,556 100 All 473 0.5 189 0.2 242 0.3 453 0.5 101 0.1 353 0.4 88,593 100
PCC Part-time 272 4.3 11 0.2 - - - - 19 0.3 26 0.4 6,266 100 Full-time 296 1.3 134 0.6 47 0.2 14 0.1 4 0.0 198 0.9 22,384 100 All 568 2.0 145 0.5 47 0.2 14 0.0 23 0.1 223 0.8 28,651 100
ALL Part-time 4,583 1.1 1,128 0.3 2,121 0.5 405 0.1 1,299 0.3 2,309 0.5 435,587 100 Full-time 4,048 0.6 2,733 0.4 1,763 0.3 745 0.1 563 0.1 3,214 0.5 633,277 100 All 8,630 0.8 3,861 0.4 3,884 0.4 1,150 0.1 1,862 0.2 5,523 0.5 1,068,864 100
TABLE W-29A: TOTAL CONSUMER CREDIT CARD DEBT BY SEGMENT, COURSE LOAD, AND DEPENDENCY STATUS
Source: California Student Aid Commission 180 2003-04 SEARS

INDEPENDENT UNDERGRADUATES
Nothing Under $500 $500 to $999 $1,000 to $1,999 $2,000 to $2,999 $3,000 to $4,999 $5,000 to $6,999 $7,000 to $8,999
# % # % # % # % # % # % # % # %CCC Part-time 174,159 30.8 62,940 11.1 39,338 7.0 48,278 8.5 42,199 7.5 43,272 7.7 34,689 6.1 26,106 4.6
Full-time 65,563 44.6 14,127 9.6 8,331 5.7 10,988 7.5 8,814 6.0 12,074 8.2 6,641 4.5 4,709 3.2 All 239,722 33.7 77,067 10.8 47,669 6.7 59,266 8.3 51,013 7.2 55,346 7.8 41,330 5.8 30,815 4.3
UC Part-time 1,063 28.5 351 9.4 112 3.0 408 10.9 386 10.3 301 8.1 345 9.2 291 7.8 Full-time 3,829 29.3 1,696 13.0 800 6.1 1,196 9.2 1,098 8.4 1,125 8.6 876 6.7 802 6.1 All 4,891 29.1 2,047 12.2 912 5.4 1,604 9.6 1,484 8.8 1,426 8.5 1,220 7.3 1,092 6.5
CSU Part-time 8,116 16.7 3,566 7.3 2,246 4.6 4,504 9.3 4,260 8.7 4,483 9.2 4,333 8.9 3,404 7.0 Full-time 19,227 24.3 6,163 7.8 5,190 6.6 8,895 11.2 6,827 8.6 8,299 10.5 7,493 9.5 4,698 5.9 All 27,343 21.4 9,729 7.6 7,437 5.8 13,399 10.5 11,087 8.7 12,783 10.0 11,825 9.2 8,103 6.3
ICU Part-time 1,700 18.1 988 10.5 933 9.9 793 8.5 519 5.5 776 8.3 770 8.2 637 6.8 Full-time 4,266 26.3 1,849 11.4 1,290 8.0 1,741 10.7 1,039 6.4 1,249 7.7 1,627 10.0 804 5.0 All 5,967 23.3 2,837 11.1 2,223 8.7 2,533 9.9 1,559 6.1 2,025 7.9 2,397 9.4 1,441 5.6
PCC Part-time 6,125 30.5 1,645 8.2 722 3.6 1,083 5.4 2,649 13.2 2,060 10.3 1,991 9.9 772 3.8 Full-time 14,636 30.3 4,071 8.4 3,262 6.7 3,274 6.8 3,826 7.9 3,560 7.4 3,827 7.9 2,181 4.5 All 20,761 30.4 5,716 8.4 3,983 5.8 4,357 6.4 6,475 9.5 5,620 8.2 5,818 8.5 2,952 4.3
ALL Part-time 191,163 29.6 69,490 10.7 43,351 6.7 55,066 8.5 50,013 7.7 50,892 7.9 42,127 6.5 31,210 4.8 Full-time 107,521 35.4 27,906 9.2 18,874 6.2 26,092 8.6 21,604 7.1 26,307 8.7 20,463 6.7 13,194 4.3 All 298,684 31.4 97,396 10.2 62,225 6.5 81,159 8.5 71,617 7.5 77,200 8.1 62,590 6.6 44,403 4.7
$9,000 to 10,999 $11,000 to 12,999 $13,000 to $14,999 $15,000 to $16,999 $17,000 to $18,999 $19,000 or More Total
# % # % # % # % # % # % # %CCC Part-time 26,821 4.7 17,166 3.0 8,940 1.6 8,225 1.5 3,934 0.7 28,967 5.1 565,034 100
Full-time 4,468 3.0 3,743 2.5 966 0.7 1,811 1.2 966 0.7 3,743 2.5 146,944 100 All 31,289 4.4 20,909 2.9 9,906 1.4 10,036 1.4 4,900 0.7 32,710 4.6 711,978 100
UC Part-time 211 5.6 188 5.0 37 1.0 - - - - 38 1.0 3,730 100 Full-time 297 2.3 287 2.2 115 0.9 288 2.2 68 0.5 588 4.5 13,063 100 All 507 3.0 475 2.8 152 0.9 288 1.7 68 0.4 626 3.7 16,793 100
CSU Part-time 2,867 5.9 2,379 4.9 1,379 2.8 1,676 3.4 734 1.5 4,739 9.7 48,686 100 Full-time 3,708 4.7 1,525 1.9 1,376 1.7 1,303 1.6 482 0.6 3,980 5.0 79,165 100 All 6,574 5.1 3,904 3.1 2,755 2.2 2,978 2.3 1,216 1.0 8,719 6.8 127,852 100
ICU Part-time 719 7.7 217 2.3 298 3.2 122 1.3 114 1.2 790 8.4 9,377 100 Full-time 301 1.9 371 2.3 292 1.8 324 2.0 67 0.4 991 6.1 16,212 100 All 1,021 4.0 588 2.3 590 2.3 446 1.7 181 0.7 1,781 7.0 25,589 100
PCC Part-time 549 2.7 496 2.5 257 1.3 278 1.4 188 0.9 1,255 6.3 20,068 100 Full-time 2,081 4.3 1,390 2.9 928 1.9 958 2.0 633 1.3 3,710 7.7 48,335 100 All 2,630 3.8 1,886 2.8 1,184 1.7 1,236 1.8 820 1.2 4,964 7.3 68,403 100
ALL Part-time 31,166 4.8 20,446 3.2 10,911 1.7 10,301 1.6 4,970 0.8 35,789 5.5 646,896 100 Full-time 10,855 3.6 7,316 2.4 3,676 1.2 4,684 1.5 2,215 0.7 13,012 4.3 303,718 100 All 42,021 4.4 27,762 2.9 14,587 1.5 14,985 1.6 7,185 0.8 48,800 5.1 950,614 100
TABLE U-29B: TOTAL CONSUMER CREDIT CARD DEBT BY SEGMENT, COURSE LOAD, AND DEPENDENCY STATUS
Source: California Student Aid Commission 181 2003-04 SEARS
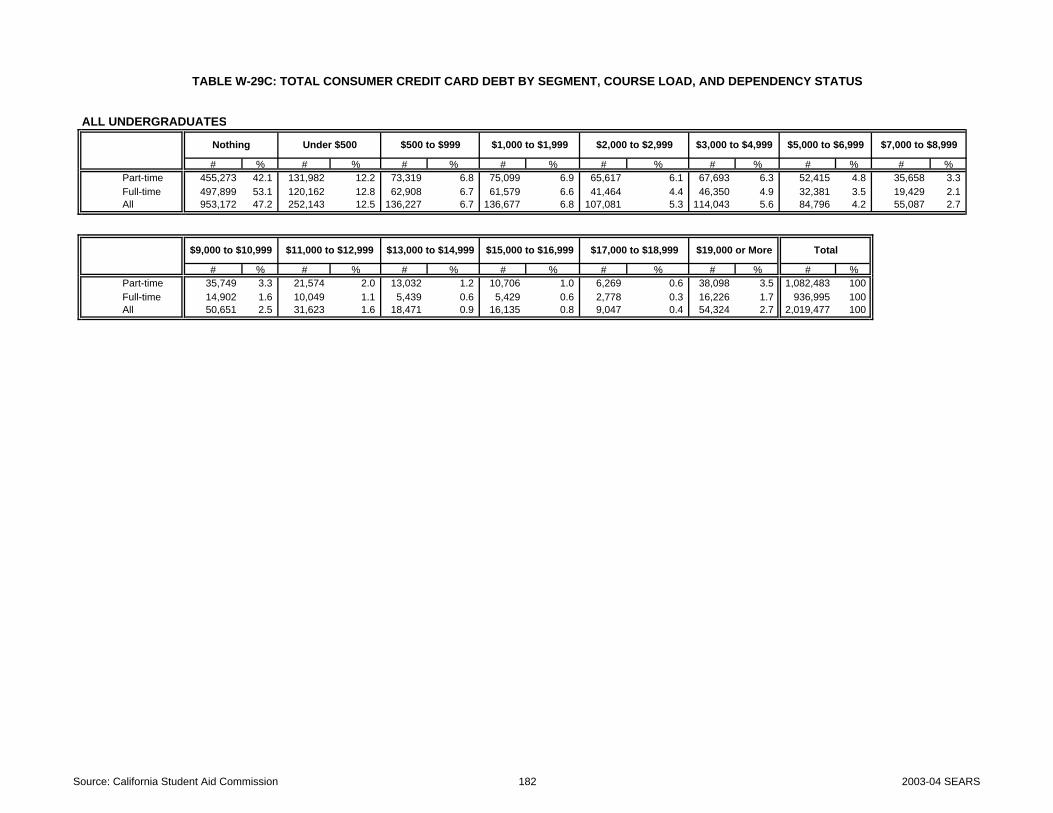
ALL UNDERGRADUATES
Nothing Under $500 $500 to $999 $1,000 to $1,999 $2,000 to $2,999 $3,000 to $4,999 $5,000 to $6,999 $7,000 to $8,999
# % # % # % # % # % # % # % # %Part-time 455,273 42.1 131,982 12.2 73,319 6.8 75,099 6.9 65,617 6.1 67,693 6.3 52,415 4.8 35,658 3.3 Full-time 497,899 53.1 120,162 12.8 62,908 6.7 61,579 6.6 41,464 4.4 46,350 4.9 32,381 3.5 19,429 2.1 All 953,172 47.2 252,143 12.5 136,227 6.7 136,677 6.8 107,081 5.3 114,043 5.6 84,796 4.2 55,087 2.7
$9,000 to $10,999 $11,000 to $12,999 $13,000 to $14,999 $15,000 to $16,999 $17,000 to $18,999 $19,000 or More Total
# % # % # % # % # % # % # %Part-time 35,749 3.3 21,574 2.0 13,032 1.2 10,706 1.0 6,269 0.6 38,098 3.5 1,082,483 100 Full-time 14,902 1.6 10,049 1.1 5,439 0.6 5,429 0.6 2,778 0.3 16,226 1.7 936,995 100 All 50,651 2.5 31,623 1.6 18,471 0.9 16,135 0.8 9,047 0.4 54,324 2.7 2,019,477 100
TABLE W-29C: TOTAL CONSUMER CREDIT CARD DEBT BY SEGMENT, COURSE LOAD, AND DEPENDENCY STATUS
Source: California Student Aid Commission 182 2003-04 SEARS

DEPENDENT UNDERGRADUATES
Nothing Under $500 $500 to $999 $1,000 to $1,999 $2,000 to $2,999 $3,000 to $4,999 $5,000 to $6,999 $7,000 to $8,999
# % # % # % # % # % # % # % # %CCC Part-time 659 62.3 151 14.3 70 6.6 46 4.3 34 3.2 38 3.6 22 2.1 9 0.9
Full-time 1,517 67.8 281 12.6 142 6.3 109 4.9 44 2.0 51 2.3 33 1.5 22 1.0 All 2,176 66.0 432 13.1 212 6.4 155 4.7 78 2.4 89 2.7 55 1.7 31 0.9
UC Part-time 243 56.9 75 17.6 29 6.8 29 6.8 15 3.5 14 3.3 11 2.6 4 0.9 Full-time 1,794 62.8 450 15.8 210 7.4 141 4.9 78 2.7 76 2.7 41 1.4 20 0.7 All 2,037 62.1 525 16.0 239 7.3 170 5.2 93 2.8 90 2.7 52 1.6 24 0.7
CSU Part-time 73 33.8 38 17.6 25 11.6 12 5.6 23 10.6 17 7.9 15 6.9 5 2.3 Full-time 956 51.6 317 17.1 162 8.7 131 7.1 90 4.9 76 4.1 47 2.5 27 1.5 All 1,029 49.7 355 17.1 187 9.0 143 6.9 113 5.5 93 4.5 62 3.0 32 1.5
ICU Part-time 102 69.9 12 8.2 12 8.2 11 7.5 2 1.4 2 1.4 2 1.4 1 0.7 Full-time 1,180 63.3 302 16.2 111 6.0 90 4.8 57 3.1 51 2.7 24 1.3 14 0.8 All 1,282 63.7 314 15.6 123 6.1 101 5.0 59 2.9 53 2.6 26 1.3 15 0.7
PCC Part-time 163 58.0 32 11.4 18 6.4 17 6.0 14 5.0 19 6.8 6 2.1 3 1.1 Full-time 603 58.0 134 12.9 59 5.7 67 6.4 57 5.5 50 4.8 26 2.5 10 1.0 All 766 58.0 166 12.6 77 5.8 84 6.4 71 5.4 69 5.2 32 2.4 13 1.0
ALL Part-time 1,240 58.3 308 14.5 154 7.2 115 5.4 88 4.1 90 4.2 56 2.6 22 1.0 Full-time 6,050 61.4 1,484 15.1 684 6.9 538 5.5 326 3.3 304 3.1 171 1.7 93 0.9 All 7,290 60.9 1,792 15.0 838 7.0 653 5.5 414 3.5 394 3.3 227 1.9 115 1.0
$9,000 to 10,999 $11,000 to 12,999 $13,000 to $14,999 $15,000 to $16,999 $17,000 to $18,999 $19,000 or More Total
# % # % # % # % # % # % # %CCC Part-time 11 1.0 3 0.3 5 0.5 1 0.1 3 0.3 6 0.6 1,058 100
Full-time 11 0.5 8 0.4 5 0.2 - - 1 0.0 15 0.7 2,239 100 All 22 0.7 11 0.3 10 0.3 1 0.0 4 0.1 21 0.6 3,297 100
UC Part-time 2 0.5 - - - - - - 1 0.2 4 0.9 427 100 Full-time 17 0.6 12 0.4 5 0.2 1 0.0 1 0.0 9 0.3 2,855 100 All 19 0.6 12 0.4 5 0.2 1 0.0 2 0.1 13 0.4 3,282 100
CSU Part-time 3 1.4 - - 4 1.9 - - 1 0.5 - - 216 100 Full-time 15 0.8 10 0.5 7 0.4 4 0.2 4 0.2 8 0.4 1,854 100 All 18 0.9 10 0.5 11 0.5 4 0.2 5 0.2 8 0.4 2,070 100
ICU Part-time - - 1 0.7 - - 1 0.7 - - - - 146 100 Full-time 10 0.5 3 0.2 6 0.3 8 0.4 2 0.1 7 0.4 1,865 100 All 10 0.5 4 0.2 6 0.3 9 0.4 2 0.1 7 0.3 2,011 100
PCC Part-time 5 1.8 1 0.4 - - - - 1 0.4 2 0.7 281 100 Full-time 11 1.1 7 0.7 3 0.3 1 0.1 1 0.1 10 1.0 1,039 100 All 16 1.2 8 0.6 3 0.2 1 0.1 2 0.2 12 0.9 1,320 100
ALL Part-time 21 1.0 5 0.2 9 0.4 2 0.1 6 0.3 12 0.6 2,128 100 Full-time 64 0.6 40 0.4 26 0.3 14 0.1 9 0.1 49 0.5 9,852 100 All 85 0.7 45 0.4 35 0.3 16 0.1 15 0.1 61 0.5 11,980 100
TABLE U-29A: TOTAL CONSUMER CREDIT CARD DEBT BY SEGMENT, COURSE LOAD, AND DEPENDENCY STATUS
Source: California Student Aid Commission 183 2003-04 SEARS

INDEPENDENT UNDERGRADUATES
Nothing Under $500 $500 to $999 $1,000 to $1,999 $2,000 to $2,999 $3,000 to $4,999 $5,000 to $6,999 $7,000 to $8,999
# % # % # % # % # % # % # % # %CCC Part-time 487 30.8 176 11.1 110 7.0 135 8.5 118 7.5 121 7.7 97 6.1 73 4.6
Full-time 543 44.6 117 9.6 69 5.7 91 7.5 73 6.0 100 8.2 55 4.5 39 3.2 All 1,030 36.8 293 10.5 179 6.4 226 8.1 191 6.8 221 7.9 152 5.4 112 4.0
UC Part-time 20 29.0 5 7.2 2 2.9 8 11.6 7 10.1 6 8.7 6 8.7 6 8.7 Full-time 100 29.5 44 13.0 20 5.9 33 9.7 27 8.0 29 8.6 23 6.8 20 5.9 All 120 29.4 49 12.0 22 5.4 41 10.0 34 8.3 35 8.6 29 7.1 26 6.4
CSU Part-time 106 18.3 48 8.3 36 6.2 49 8.5 48 8.3 53 9.2 50 8.6 34 5.9 Full-time 265 24.4 93 8.6 77 7.1 124 11.4 87 8.0 106 9.8 97 8.9 63 5.8 All 371 22.3 141 8.5 113 6.8 173 10.4 135 8.1 159 9.5 147 8.8 97 5.8
ICU Part-time 32 20.9 18 11.8 6 3.9 14 9.2 10 6.5 14 9.2 13 8.5 10 6.5 Full-time 91 27.3 36 10.8 26 7.8 34 10.2 23 6.9 27 8.1 31 9.3 17 5.1 All 123 25.3 54 11.1 32 6.6 48 9.9 33 6.8 41 8.4 44 9.1 27 5.6
PCC Part-time 186 32.9 57 10.1 31 5.5 38 6.7 52 9.2 40 7.1 46 8.1 25 4.4 Full-time 618 36.5 132 7.8 122 7.2 113 6.7 115 6.8 120 7.1 115 6.8 55 3.3 All 804 35.6 189 8.4 153 6.8 151 6.7 167 7.4 160 7.1 161 7.1 80 3.5
ALL Part-time 831 28.2 304 10.3 185 6.3 244 8.3 235 8.0 234 7.9 212 7.2 148 5.0 Full-time 1,617 34.6 422 9.0 314 6.7 395 8.5 325 7.0 382 8.2 321 6.9 194 4.2 All 2,448 32.2 726 9.5 499 6.6 639 8.4 560 7.4 616 8.1 533 7.0 342 4.5
$9,000 to 10,999 $11,000 to 12,999 $13,000 to $14,999 $15,000 to $16,999 $17,000 to $18,999 $19,000 or More Total
# % # % # % # % # % # % # %CCC Part-time 75 4.7 48 3.0 25 1.6 23 1.5 11 0.7 81 5.1 1,580 100
Full-time 37 3.0 31 2.5 8 0.7 15 1.2 8 0.7 31 2.5 1,217 100 All 112 4.0 79 2.8 33 1.2 38 1.4 19 0.7 112 4.0 2,797 100
UC Part-time 3 4.3 4 5.8 1 1.4 - - - - 1 1.4 69 100 Full-time 7 2.1 8 2.4 3 0.9 8 2.4 2 0.6 15 4.4 339 100 All 10 2.5 12 2.9 4 1.0 8 2.0 2 0.5 16 3.9 408 100
CSU Part-time 41 7.1 25 4.3 20 3.5 16 2.8 7 1.2 46 7.9 579 100 Full-time 50 4.6 24 2.2 21 1.9 21 1.9 10 0.9 49 4.5 1,087 100 All 91 5.5 49 2.9 41 2.5 37 2.2 17 1.0 95 5.7 1,666 100
ICU Part-time 12 7.8 4 2.6 5 3.3 2 1.3 2 1.3 11 7.2 153 100 Full-time 7 2.1 7 2.1 5 1.5 6 1.8 3 0.9 20 6.0 333 100 All 19 3.9 11 2.3 10 2.1 8 1.6 5 1.0 31 6.4 486 100
PCC Part-time 19 3.4 15 2.7 6 1.1 7 1.2 8 1.4 35 6.2 565 100 Full-time 66 3.9 57 3.4 23 1.4 25 1.5 17 1.0 113 6.7 1,691 100 All 85 3.8 72 3.2 29 1.3 32 1.4 25 1.1 148 6.6 2,256 100
ALL Part-time 150 5.1 96 3.3 57 1.9 48 1.6 28 1.0 174 5.9 2,946 100 Full-time 167 3.6 127 2.7 60 1.3 75 1.6 40 0.9 228 4.9 4,667 100 All 317 4.2 223 2.9 117 1.5 123 1.6 68 0.9 402 5.3 7,613 100
TABLE U-29B: TOTAL CONSUMER CREDIT CARD DEBT BY SEGMENT, COURSE LOAD, AND DEPENDENCY STATUS
Source: California Student Aid Commission 184 2003-04 SEARS

ALL UNDERGRADUATES
Nothing Under $500 $500 to $999 $1,000 to $1,999 $2,000 to $2,999 $3,000 to $4,999 $5,000 to $6,999 $7,000 to $8,999
# % # % # % # % # % # % # % # %Part-time 2,071 40.8 612 12.1 339 6.7 359 7.1 323 6.4 324 6.4 268 5.3 170 3.4 Full-time 7,667 52.8 1,906 13.1 998 6.9 933 6.4 651 4.5 686 4.7 492 3.4 287 2.0 All 9,738 49.7 2,518 12.9 1,337 6.8 1,292 6.6 974 5.0 1,010 5.2 760 3.9 457 2.3
$9,000 to $10,999 $11,000 to $12,999 $13,000 to $14,999 $15,000 to $16,999 $17,000 to $18,999 $19,000 or More Total
# % # % # % # % # % # % # %Part-time 171 3.4 101 2.0 66 1.3 50 1.0 34 0.7 186 3.7 5,074 100 Full-time 231 1.6 167 1.2 86 0.6 89 0.6 49 0.3 277 1.9 14,519 100 All 402 2.1 268 1.4 152 0.8 139 0.7 83 0.4 463 2.4 19,593 100
TABLE U-29C: TOTAL CONSUMER CREDIT CARD DEBT BY SEGMENT, COURSE LOAD, AND DEPENDENCY STATUS
Source: California Student Aid Commission 185 2003-04 SEARS

DEPENDENT UNDERGRADUATES INDEPENDENT UNDERGRADUATES ALL UNDERGRADUATES
CCC Part-time 399 2,522$ 845$ CCC Part-time 1,093 5,614$ 3,123$ CCC Part-time 1,492 4,787$ 2,381$ Full-time 722 2,247$ 781$ Full-time 674 4,896$ 2,821$ Full-time 1,396 3,526$ 1,444$ All 1,121 2,345$ 819$ All 1,767 5,340$ 3,039$ All 2,888 4,177$ 2,106$
UC Part-time 184 2,139$ 786$ UC Part-time 49 5,148$ 3,507$ UC Part-time 233 2,771$ 1,037$ Full-time 1,061 1,870$ 686$ Full-time 239 5,142$ 2,842$ Full-time 1,300 2,472$ 837$ All 1,245 1,910$ 705$ All 288 5,143$ 2,934$ All 1,533 2,517$ 871$
CSU Part-time 143 2,837$ 2,224$ CSU Part-time 473 6,995$ 5,565$ CSU Part-time 616 6,030$ 4,336$ Full-time 898 2,325$ 974$ Full-time 822 5,563$ 3,696$ Full-time 1,720 3,873$ 1,905$
All 1,041 2,396$ 1,052$ All 1,295 6,086$ 4,345$ All 2,336 4,441$ 2,411$ ICU Part-time 44 2,034$ 986$ ICU Part-time 121 6,570$ 4,559$ ICU Part-time 165 5,361$ 2,921$ Full-time 685 2,073$ 741$ Full-time 242 5,541$ 3,085$ Full-time 927 2,979$ 1,006$
All 729 2,071$ 764$ All 363 5,884$ 3,650$ All 1,092 3,339$ 1,268$ PCC Part-time 118 2,864$ 2,558$ PCC Part-time 379 5,991$ 3,815$ PCC Part-time 497 5,248$ 3,537$ Full-time 436 2,814$ 1,566$ Full-time 1,073 6,359$ 4,323$ Full-time 1,509 5,335$ 3,169$
All 554 2,824$ 1,730$ All 1,452 6,263$ 4,136$ All 2,006 5,313$ 3,297$ ALL Part-time 888 2,515$ 887$ ALL Part-time 2,115 6,034$ 3,389$ ALL Part-time 3,003 4,993$ 2,441$
Full-time 3,802 2,194$ 831$ Full-time 3,050 5,661$ 3,269$ Full-time 6,852 3,737$ 1,591$ All 4,690 2,255$ 854$ All 5,165 5,814$ 3,348$ All 9,855 4,120$ 2,074$
Note: "Nothing" category was excluded from the means and median calculations.
TABLE M-29: MEAN AND MEDIAN TOTAL CONSUMER CREDIT CARD DEBT BY SEGMENT, COURSE LOAD, AND DEPENDENCY STATUS
Number Mean Median Number MedianMean Median Number Mean
Source: California Student Aid Commission 186 2003-04 SEARS

Question for Tables: W-30, U-30, and M-30
How much money will your parent(s) contribute to support your education and living expenses during
the current nine-month academic year? Include any monetary support for educational expenses, such as tuition and fees, food, housing, clothing, transportation, or books.
00 Nothing 05 $200 to $399 10 $1,200 to $1,399 01 Less than $50 06 $400 to $599 11 $1,400 to $1,599 02 $50 to $99 07 $600 to $799 12 $1,600 to $1,799 03 $100 to $149 08 $800 to $999 13 $1,800 to $1,999 04 $150 to $199 09 $1,000 to $1,199 14 $2,000 or more
187 2003-04 SEARS

BY SEGMENT, COURSE LOAD, AND DEPENDENCY STATUS
DEPENDENT UNDERGRADUATES
Nothing Less Than $450 $450 to $899 $900 to $1,349 $1,350 to $1,799 $1,800 to $3,599 $3,600 to $5,399 $5,400 to $7,199
# % # % # % # % # % # % # % # %CCC Part-time 129,457 34.2 26,106 6.9 34,331 9.1 26,464 7.0 22,887 6.0 38,980 10.3 36,834 9.7 15,020 4.0
Full-time 65,442 24.4 16,904 6.3 23,545 8.8 23,062 8.6 13,282 5.0 32,842 12.2 30,306 11.3 16,662 6.2All 194,899 30.1 43,010 6.6 57,876 8.9 49,526 7.7 36,169 5.6 71,822 11.1 67,140 10.4 31,682 4.9
UC Part-time 4,243 16.1 1,591 6.0 1,354 5.1 1,843 7.0 1,116 4.2 1,975 7.5 2,325 8.8 1,305 5.0Full-time 16,283 14.9 5,575 5.1 4,966 4.5 5,833 5.3 4,749 4.3 9,077 8.3 9,818 9.0 8,533 7.8All 20,526 15.1 7,166 5.3 6,320 4.7 7,676 5.7 5,865 4.3 11,053 8.1 12,143 8.9 9,838 7.2
CSU Part-time 6,327 32.2 532 2.7 591 3.0 1,025 5.2 1,343 6.8 2,664 13.6 1,375 7.0 1,365 7.0Full-time 33,752 22.7 7,530 5.1 6,415 4.3 10,695 7.2 8,701 5.8 16,643 11.2 13,481 9.1 10,884 7.3All 40,079 23.8 8,062 4.8 7,006 4.2 11,720 7.0 10,044 6.0 19,307 11.5 14,856 8.8 12,249 7.3
ICU Part-time 693 13.8 109 2.2 205 4.1 91 1.8 45 0.9 224 4.5 263 5.3 162 3.2Full-time 11,695 13.8 3,565 4.2 2,901 3.4 3,132 3.7 2,025 2.4 4,128 4.9 4,949 5.8 3,444 4.1All 12,388 13.8 3,674 4.1 3,106 3.5 3,222 3.6 2,070 2.3 4,352 4.8 5,212 5.8 3,605 4.0
PCC Part-time 1,831 29.3 325 5.2 411 6.6 525 8.4 381 6.1 453 7.3 497 8.0 233 3.7Full-time 5,950 26.8 1,165 5.2 1,968 8.8 1,271 5.7 1,196 5.4 2,825 12.7 1,926 8.7 979 4.4All 7,782 27.3 1,489 5.2 2,379 8.4 1,796 6.3 1,577 5.5 3,278 11.5 2,423 8.5 1,212 4.3
ALL Part-time 142,552 32.7 28,663 6.6 36,892 8.5 29,948 6.9 25,771 5.9 44,296 10.2 41,294 9.5 18,085 4.1Full-time 133,122 21.0 34,739 5.5 39,795 6.3 43,992 6.9 29,953 4.7 65,515 10.3 60,480 9.5 40,501 6.4All 275,674 25.8 63,402 5.9 76,687 7.2 73,940 6.9 55,724 5.2 109,812 10.3 101,774 9.5 58,586 5.5
$7,200 to $8,999 $9,000 to $10,799 $10,800 to $12,599 $12,600 to $14,399 $14,400 to $16,199 $16,200 to $17,999 $18,000 or More Total
# % # % # % # % # % # % # % # %CCC Part-time 7,152 1.9 14,662 3.9 3,934 1.0 3,934 1.0 715 0.2 1,431 0.4 17,166 4.5 379,073 100
Full-time 8,331 3.1 13,885 5.2 2,415 0.9 2,415 0.9 1,207 0.5 966 0.4 16,904 6.3 268,168 100All 15,484 2.4 28,547 4.4 6,349 1.0 6,349 1.0 1,923 0.3 2,396 0.4 34,070 5.3 647,241 100
UC Part-time 1,705 6.5 2,366 9.0 737 2.8 1,083 4.1 566 2.1 445 1.7 3,699 14.0 26,353 100Full-time 7,117 6.5 9,468 8.6 4,618 4.2 4,151 3.8 2,718 2.5 1,255 1.1 15,303 14.0 109,463 100All 8,822 6.5 11,834 8.7 5,354 3.9 5,234 3.9 3,284 2.4 1,700 1.3 19,002 14.0 135,816 100
CSU Part-time 584 3.0 1,081 5.5 398 2.0 693 3.5 185 0.9 - - 1,471 7.5 19,634 100Full-time 6,834 4.6 10,133 6.8 4,519 3.0 3,326 2.2 1,097 0.7 890 0.6 13,848 9.3 148,747 100All 7,418 4.4 11,214 6.7 4,917 2.9 4,018 2.4 1,282 0.8 890 0.5 15,319 9.1 168,381 100
ICU Part-time 209 4.2 355 7.1 177 3.5 130 2.6 60 1.2 - - 2,284 45.6 5,005 100Full-time 3,088 3.6 4,574 5.4 2,068 2.4 1,467 1.7 824 1.0 1,295 1.5 35,793 42.1 84,946 100All 3,297 3.7 4,928 5.5 2,245 2.5 1,597 1.8 884 1.0 1,295 1.4 38,077 42.3 89,951 100
PCC Part-time 243 3.9 173 2.8 163 2.6 - - 165 2.6 73 1.2 771 12.3 6,244 100Full-time 673 3.0 1,204 5.4 346 1.6 251 1.1 408 1.8 156 0.7 1,921 8.6 22,238 100All 916 3.2 1,376 4.8 508 1.8 251 0.9 573 2.0 230 0.8 2,692 9.5 28,482 100
ALL Part-time 9,894 2.3 18,636 4.3 5,408 1.2 5,840 1.3 1,690 0.4 1,949 0.4 25,391 5.8 436,308 100Full-time 26,043 4.1 39,263 6.2 13,965 2.2 11,609 1.8 6,255 1.0 4,561 0.7 83,769 13.2 633,562 100All 35,936 3.4 57,899 5.4 19,373 1.8 17,449 1.6 7,945 0.7 6,510 0.6 109,160 10.2 1,069,870 100
TABLE W-30A: PARENT(S)’ ACADEMIC YEAR CONTRIBUTION TOWARDS COLLEGE EXPENSES
Source: California Student Aid Commission 188 2003-04 SEARS

BY SEGMENT, COURSE LOAD, AND DEPENDENCY STATUS
INDEPENDENT UNDERGRADUATES
Nothing Less Than $450 $450 to $899 $900 to $1,349 $1,350 to $1,799 $1,800 to $3,599 $3,600 to $5,399 $5,400 to $7,199
# % # % # % # % # % # % # % # %CCC Part-time 460,252 80.4 16,093 2.8 11,801 2.1 14,305 2.5 11,086 1.9 17,523 3.1 10,728 1.9 7,868 1.4
Full-time 104,925 71.1 3,864 2.6 3,622 2.5 4,950 3.4 3,864 2.6 6,158 4.2 4,950 3.4 3,019 2.0All 565,177 78.5 19,957 2.8 15,423 2.1 19,255 2.7 14,950 2.1 23,681 3.3 15,678 2.2 10,886 1.5
UC Part-time 2,088 57.0 226 6.2 211 5.8 70 1.9 - - 197 5.4 108 3.0 70 1.9Full-time 7,472 56.9 444 3.4 426 3.2 542 4.1 372 2.8 598 4.6 626 4.8 358 2.7All 9,560 57.0 670 4.0 636 3.8 613 3.7 372 2.2 795 4.7 734 4.4 429 2.6
CSU Part-time 39,567 80.1 373 0.8 1,004 2.0 1,056 2.1 608 1.2 1,977 4.0 865 1.8 - -Full-time 56,673 71.7 2,382 3.0 2,211 2.8 1,912 2.4 1,055 1.3 4,062 5.1 3,020 3.8 1,513 1.9All 96,240 74.9 2,755 2.1 3,215 2.5 2,968 2.3 1,663 1.3 6,039 4.7 3,885 3.0 1,513 1.2
ICU Part-time 8,033 85.0 133 1.4 - - - - - - - - 142 1.5 69 0.7Full-time 10,373 63.9 430 2.7 348 2.1 265 1.6 180 1.1 427 2.6 612 3.8 286 1.8All 18,406 71.7 563 2.2 348 1.4 265 1.0 180 0.7 427 1.7 754 2.9 355 1.4
PCC Part-time 16,485 83.2 153 0.8 135 0.7 208 1.0 193 1.0 509 2.6 217 1.1 311 1.6Full-time 37,807 78.3 840 1.7 865 1.8 1,061 2.2 470 1.0 1,261 2.6 1,880 3.9 951 2.0All 54,292 79.7 993 1.5 1,000 1.5 1,268 1.9 663 1.0 1,769 2.6 2,097 3.1 1,261 1.9
ALL Part-time 526,425 80.4 16,977 2.6 13,150 2.0 15,639 2.4 11,887 1.8 20,206 3.1 12,061 1.8 8,317 1.3Full-time 217,250 71.4 7,960 2.6 7,472 2.5 8,730 2.9 5,940 2.0 12,506 4.1 11,088 3.6 6,127 2.0All 743,675 77.5 24,938 2.6 20,622 2.1 24,369 2.5 17,827 1.9 32,711 3.4 23,149 2.4 14,444 1.5
$7,200 to $8,999 $9,000 to $10,799 $10,800 to $12,599 $12,600 to $14,399 $14,400 to $16,199 $16,200 to $17,999 $18,000 or More Total
# % # % # % # % # % # % # % # %CCC Part-time 2,503 0.4 6,080 1.1 2,861 0.5 1,788 0.3 1,073 0.2 2,146 0.4 6,437 1.1 572,543 100
Full-time 3,019 2.0 2,898 2.0 1,932 1.3 604 0.4 241 0.2 121 0.1 3,502 2.4 147,668 100All 5,522 0.8 8,977 1.2 4,793 0.7 2,392 0.3 1,314 0.2 2,266 0.3 9,939 1.4 720,211 100
UC Part-time 37 1.0 156 4.3 97 2.7 70 1.9 49 1.3 70 1.9 211 5.8 3,660 100Full-time 337 2.6 570 4.3 221 1.7 250 1.9 65 0.5 113 0.9 729 5.6 13,122 100All 374 2.2 725 4.3 318 1.9 320 1.9 113 0.7 183 1.1 939 5.6 16,782 100
CSU Part-time 515 1.0 812 1.6 581 1.2 262 0.5 375 0.8 153 0.3 1,265 2.6 49,411 100Full-time 1,009 1.3 1,300 1.6 110 0.1 813 1.0 - - 69 0.1 2,901 3.7 79,029 100All 1,523 1.2 2,111 1.6 691 0.5 1,075 0.8 375 0.3 223 0.2 4,166 3.2 128,440 100
ICU Part-time 69 0.7 208 2.2 34 0.4 34 0.4 - - - - 727 7.7 9,449 100Full-time 252 1.6 500 3.1 214 1.3 202 1.2 54 0.3 223 1.4 1,865 11.5 16,233 100All 320 1.2 708 2.8 249 1.0 236 0.9 54 0.2 223 0.9 2,592 10.1 25,682 100
PCC Part-time 80 0.4 793 4.0 105 0.5 171 0.9 45 0.2 - - 418 2.1 19,822 100Full-time 500 1.0 550 1.1 347 0.7 138 0.3 56 0.1 86 0.2 1,445 3.0 48,256 100All 581 0.9 1,343 2.0 452 0.7 309 0.5 100 0.1 86 0.1 1,863 2.7 68,078 100
ALL Part-time 3,204 0.5 8,048 1.2 3,677 0.6 2,326 0.4 1,541 0.2 2,369 0.4 9,057 1.4 654,886 100Full-time 5,117 1.7 5,817 1.9 2,824 0.9 2,006 0.7 416 0.1 612 0.2 10,441 3.4 304,308 100All 8,321 0.9 13,865 1.4 6,501 0.7 4,332 0.5 1,957 0.2 2,982 0.3 19,498 2.0 959,194 100
TABLE W-30B: PARENT(S)’ ACADEMIC YEAR CONTRIBUTION TOWARDS COLLEGE EXPENSES
F:\03-04 SEARS backup\2003-04_ug_casebook_Q1-Q35.xls 189 2003-04 SEARS

BY SEGMENT, COURSE LOAD, AND DEPENDENCY STATUS
ALL UNDERGRADUATES
Nothing Less Than $450 $450 to $899 $900 to $1,349 $1,350 to $1,799 $1,800 to $3,599 $3,600 to $5,399 $5,400 to $7,199
# % # % # % # % # % # % # % # %Part-time 668,977 61.3 45,640 4.2 50,042 4.6 45,586 4.2 37,659 3.5 64,502 5.9 53,355 4.9 26,402 2.4 Full-time 350,372 37.4 42,699 4.6 47,267 5.0 52,723 5.6 35,893 3.8 78,021 8.3 71,568 7.6 46,628 5.0 All 1,019,349 50.2 88,339 4.4 97,309 4.8 98,309 4.8 73,551 3.6 142,523 7.0 124,923 6.2 73,031 3.6
$7,200 to $8,999 $9,000 to $10,799 $10,800 to $12,599 $12,600 to $14,399 $14,400 to $16,199 $16,200 to $17,999 $18,000 or More Total
# % # % # % # % # % # % # % # %Part-time 13,097 1.2 26,684 2.4 9,085 0.8 8,166 0.7 3,231 0.3 4,318 0.4 34,448 3.2 1,091,194 100 Full-time 31,159 3.3 45,081 4.8 16,789 1.8 13,615 1.5 6,671 0.7 5,174 0.6 94,209 10.0 937,870 100 All 44,257 2.2 71,765 3.5 25,875 1.3 21,782 1.1 9,902 0.5 9,492 0.5 128,658 6.3 2,029,063 100
TABLE W-30C: PARENT(S)’ ACADEMIC YEAR CONTRIBUTION TOWARDS COLLEGE EXPENSES
Source: California Student Aid Commission 190 2003-04 SEARS

BY SEGMENT, COURSE LOAD, AND DEPENDENCY STATUS
DEPENDENT UNDERGRADUATES
Nothing Less Than $450 $450 to $899 $900 to $1,349 $1,350 to $1,799 $1,800 to $3,599 $3,600 to $5,399 $5,400 to $7,199
# % # % # % # % # % # % # % # %CCC Part-time 362 34.2 73 6.9 96 9.1 74 7.0 64 6.0 109 10.3 103 9.7 42 4.0
Full-time 542 24.4 140 6.3 195 8.8 191 8.6 110 5.0 272 12.2 251 11.3 138 6.2All 904 27.6 213 6.5 291 8.9 265 8.1 174 5.3 381 11.6 354 10.8 180 5.5
UC Part-time 70 16.4 25 5.8 21 4.9 29 6.8 18 4.2 32 7.5 37 8.6 20 4.7Full-time 431 14.9 148 5.1 132 4.6 153 5.3 125 4.3 238 8.2 258 8.9 223 7.7All 501 15.1 173 5.2 153 4.6 182 5.5 143 4.3 270 8.1 295 8.9 243 7.3
CSU Part-time 66 30.4 8 3.7 6 2.8 11 5.1 13 6.0 30 13.8 20 9.2 15 6.9Full-time 410 22.1 96 5.2 89 4.8 128 6.9 109 5.9 202 10.9 167 9.0 136 7.3All 476 23.0 104 5.0 95 4.6 139 6.7 122 5.9 232 11.2 187 9.0 151 7.3
ICU Part-time 16 11.0 3 2.1 4 2.7 5 3.4 2 1.4 4 2.7 10 6.8 5 3.4Full-time 238 12.6 64 3.4 65 3.4 67 3.5 48 2.5 92 4.9 114 6.0 78 4.1All 254 12.5 67 3.3 69 3.4 72 3.5 50 2.5 96 4.7 124 6.1 83 4.1
PCC Part-time 77 27.6 13 4.7 14 5.0 28 10.0 18 6.5 27 9.7 24 8.6 11 3.9Full-time 264 25.7 42 4.1 84 8.2 66 6.4 58 5.6 117 11.4 84 8.2 43 4.2All 341 26.1 55 4.2 98 7.5 94 7.2 76 5.8 144 11.0 108 8.3 54 4.1
ALL Part-time 591 27.7 122 5.7 141 6.6 147 6.9 115 5.4 202 9.5 194 9.1 93 4.4Full-time 1,885 19.1 490 5.0 565 5.7 605 6.1 450 4.6 921 9.3 874 8.8 618 6.3All 2,476 20.6 612 5.1 706 5.9 752 6.3 565 4.7 1,123 9.3 1,068 8.9 711 5.9
$7,200 to $8,999 $9,000 to $10,799 $10,800 to $12,599 $12,600 to $14,399 $14,400 to $16,199 $16,200 to $17,999 $18,000 or More Total
# % # % # % # % # % # % # % # %CCC Part-time 20 1.9 41 3.9 11 1.0 11 1.0 2 0.2 4 0.4 48 4.5 1,060 100
Full-time 69 3.1 115 5.2 20 0.9 20 0.9 10 0.5 8 0.4 140 6.3 2,221 100All 89 2.7 156 4.8 31 0.9 31 0.9 12 0.4 12 0.4 188 5.7 3,281 100
UC Part-time 29 6.8 37 8.6 13 3.0 20 4.7 9 2.1 8 1.9 60 14.0 428 100Full-time 187 6.5 253 8.8 121 4.2 109 3.8 72 2.5 32 1.1 405 14.0 2,887 100All 216 6.5 290 8.7 134 4.0 129 3.9 81 2.4 40 1.2 465 14.0 3,315 100
CSU Part-time 8 3.7 12 5.5 5 2.3 7 3.2 2 0.9 - - 14 6.5 217 100Full-time 92 5.0 122 6.6 56 3.0 38 2.1 18 1.0 10 0.5 179 9.7 1,852 100All 100 4.8 134 6.5 61 2.9 45 2.2 20 1.0 10 0.5 193 9.3 2,069 100
ICU Part-time 6 4.1 11 7.5 5 3.4 5 3.4 2 1.4 - - 68 46.6 146 100Full-time 70 3.7 109 5.8 50 2.6 37 2.0 20 1.1 35 1.8 806 42.6 1,893 100All 76 3.7 120 5.9 55 2.7 42 2.1 22 1.1 35 1.7 874 42.9 2,039 100
PCC Part-time 15 5.4 10 3.6 8 2.9 - - 4 1.4 3 1.1 27 9.7 279 100Full-time 39 3.8 64 6.2 16 1.6 18 1.7 16 1.6 8 0.8 110 10.7 1,029 100All 54 4.1 74 5.7 24 1.8 18 1.4 20 1.5 11 0.8 137 10.5 1,308 100
ALL Part-time 78 3.7 111 5.2 42 2.0 43 2.0 19 0.9 15 0.7 217 10.2 2,130 100Full-time 457 4.6 663 6.7 263 2.7 222 2.2 136 1.4 93 0.9 1,640 16.6 9,882 100All 535 4.5 774 6.4 305 2.5 265 2.2 155 1.3 108 0.9 1,857 15.5 12,012 100
TABLE U-30A: PARENT(S)’ ACADEMIC YEAR CONTRIBUTION TOWARDS COLLEGE EXPENSES
Source: California Student Aid Commission 191 2003-04 SEARS

BY SEGMENT, COURSE LOAD, AND DEPENDENCY STATUS
INDEPENDENT UNDERGRADUATES
Nothing Less Than $450 $450 to $899 $900 to $1,349 $1,350 to $1,799 $1,800 to $3,599 $3,600 to $5,399 $5,400 to $7,199
# % # % # % # % # % # % # % # %CCC Part-time 1,287 80.4 45 2.8 33 2.1 40 2.5 31 1.9 49 3.1 30 1.9 22 1.4
Full-time 869 71.1 32 2.6 30 2.5 41 3.4 32 2.6 51 4.2 41 3.4 25 2.0All 2,156 76.3 77 2.7 63 2.2 81 2.9 63 2.2 100 3.5 71 2.5 47 1.7
UC Part-time 41 60.3 4 5.9 3 4.4 1 1.5 - - 4 5.9 2 2.9 1 1.5Full-time 192 56.5 12 3.5 11 3.2 14 4.1 10 2.9 15 4.4 17 5.0 10 2.9All 233 57.1 16 3.9 14 3.4 15 3.7 10 2.5 19 4.7 19 4.7 11 2.7
CSU Part-time 474 80.6 6 1.0 12 2.0 12 2.0 6 1.0 22 3.7 11 1.9 - -Full-time 792 72.9 29 2.7 29 2.7 32 2.9 16 1.5 50 4.6 38 3.5 22 2.0All 1,266 75.6 35 2.1 41 2.4 44 2.6 22 1.3 72 4.3 49 2.9 22 1.3
ICU Part-time 127 81.9 1 0.6 - - - - - - - - 3 1.9 1 0.6Full-time 211 63.0 8 2.4 9 2.7 5 1.5 5 1.5 9 2.7 13 3.9 6 1.8All 338 69.0 9 1.8 9 1.8 5 1.0 5 1.0 9 1.8 16 3.3 7 1.4
PCC Part-time 432 76.6 6 1.1 7 1.2 13 2.3 9 1.6 20 3.5 13 2.3 8 1.4Full-time 1,252 74.8 30 1.8 42 2.5 35 2.1 29 1.7 57 3.4 60 3.6 24 1.4All 1,684 75.3 36 1.6 49 2.2 48 2.1 38 1.7 77 3.4 73 3.3 32 1.4
ALL Part-time 2,361 79.3 62 2.1 55 1.8 66 2.2 46 1.5 95 3.2 59 2.0 32 1.1Full-time 3,316 71.2 111 2.4 121 2.6 127 2.7 92 2.0 182 3.9 169 3.6 87 1.9All 5,677 74.4 173 2.3 176 2.3 193 2.5 138 1.8 277 3.6 228 3.0 119 1.6
$7,200 to $8,999 $9,000 to $10,799 $10,800 to $12,599 $12,600 to $14,399 $14,400 to $16,199 $16,200 to $17,999 $18,000 or More Total
# % # % # % # % # % # % # % # %CCC Part-time 7 0.4 17 1.1 8 0.5 5 0.3 3 0.2 6 0.4 18 1.1 1,601 100
Full-time 25 2.0 24 2.0 16 1.3 5 0.4 2 0.2 1 0.1 29 2.4 1,223 100All 32 1.1 41 1.5 24 0.8 10 0.4 5 0.2 7 0.2 47 1.7 2,824 100
UC Part-time 1 1.5 3 4.4 2 2.9 1 1.5 1 1.5 1 1.5 3 4.4 68 100Full-time 9 2.6 14 4.1 6 1.8 7 2.1 2 0.6 3 0.9 18 5.3 340 100All 10 2.5 17 4.2 8 2.0 8 2.0 3 0.7 4 1.0 21 5.1 408 100
CSU Part-time 7 1.2 7 1.2 7 1.2 4 0.7 3 0.5 2 0.3 15 2.6 588 100Full-time 12 1.1 22 2.0 3 0.3 9 0.8 - - 1 0.1 31 2.9 1,086 100All 19 1.1 29 1.7 10 0.6 13 0.8 3 0.2 3 0.2 46 2.7 1,674 100
ICU Part-time 1 0.6 4 2.6 1 0.6 1 0.6 - - - - 16 10.3 155 100Full-time 6 1.8 10 3.0 3 0.9 4 1.2 1 0.3 4 1.2 41 12.2 335 100All 7 1.4 14 2.9 4 0.8 5 1.0 1 0.2 4 0.8 57 11.6 490 100
PCC Part-time 6 1.1 17 3.0 5 0.9 3 0.5 2 0.4 - - 23 4.1 564 100Full-time 24 1.4 24 1.4 17 1.0 8 0.5 3 0.2 6 0.4 62 3.7 1,673 100All 30 1.3 41 1.8 22 1.0 11 0.5 5 0.2 6 0.3 85 3.8 2,237 100
ALL Part-time 22 0.7 48 1.6 23 0.8 14 0.5 9 0.3 9 0.3 75 2.5 2,976 100Full-time 76 1.6 94 2.0 45 1.0 33 0.7 8 0.2 15 0.3 181 3.9 4,657 100All 98 1.3 142 1.9 68 0.9 47 0.6 17 0.2 24 0.3 256 3.4 7,633 100
TABLE U-30B: PARENT(S)’ ACADEMIC YEAR CONTRIBUTION TOWARDS COLLEGE EXPENSES
Source: California Student Aid Commission 192 2003-04 SEARS

BY SEGMENT, COURSE LOAD, AND DEPENDENCY STATUS
ALL UNDERGRADUATES
Nothing Less Than $450 $450 to $899 $900 to $1,349 $1,350 to $1,799 $1,800 to $3,599 $3,600 to $5,399 $5,400 to $7,199
# % # % # % # % # % # % # % # %Part-time 2,952 57.8 184 3.6 196 3.8 213 4.2 161 3.2 297 5.8 253 5.0 125 2.4 Full-time 5,201 35.8 601 4.1 686 4.7 732 5.0 542 3.7 1,103 7.6 1,043 7.2 705 4.8 All 8,153 41.5 785 4.0 882 4.5 945 4.8 703 3.6 1,400 7.1 1,296 6.6 830 4.2
$7,200 to $8,999 $9,000 to $10,799 $10,800 to $12,599 $12,600 to $14,399 $14,400 to $16,199 $16,200 to $17,999 $18,000 or More Total
# % # % # % # % # % # % # % # %Part-time 100 2.0 159 3.1 65 1.3 57 1.1 28 0.5 24 0.5 292 5.7 5,106 100 Full-time 533 3.7 757 5.2 308 2.1 255 1.8 144 1.0 108 0.7 1,821 12.5 14,539 100 All 633 3.2 916 4.7 373 1.9 312 1.6 172 0.9 132 0.7 2,113 10.8 19,645 100
TABLE U-30C: PARENT(S)’ ACADEMIC YEAR CONTRIBUTION TOWARDS COLLEGE EXPENSES
Source: California Student Aid Commission 193 2003-04 SEARS

BY SEGMENT, COURSE LOAD, AND DEPENDENCY STATUS
DEPENDENT UNDERGRADUATES INDEPENDENT UNDERGRADUATES ALL UNDERGRADUATES
CCC Part-time 698 4,497$ 2,493$ CCC Part-time 314 4,481$ 2,093$ CCC Part-time 1,012 4,492$ 2,369$ Full-time 1,679 5,016$ 3,146$ Full-time 354 5,351$ 3,281$ Full-time 2,033 5,074$ 3,167$ All 2,377 4,864$ 2,791$ All 668 4,942$ 2,402$ All 3,045 4,881$ 2,695$
UC Part-time 358 8,077$ 6,572$ UC Part-time 27 7,183$ 37,362$ UC Part-time 385 8,014$ 6,478$ Full-time 2,456 8,107$ 6,785$ Full-time 148 6,891$ 37,273$ Full-time 2,604 8,038$ 6,692$ All 2,814 8,103$ 6,757$ All 175 6,936$ 37,287$ All 2,989 8,035$ 6,664$
CSU Part-time 151 6,199$ 4,251$ CSU Part-time 114 6,726$ 3,513$ CSU Part-time 265 6,426$ 3,923$ Full-time 1,442 6,589$ 4,602$ Full-time 294 5,464$ 3,403$ Full-time 1,736 6,399$ 4,370$
All 1,593 6,552$ 4,570$ All 408 5,817$ 3,439$ All 2,001 6,402$ 4,317$ ICU Part-time 130 13,067$ 17,900$ ICU Part-time 28 14,119$ 14,493$ ICU Part-time 158 13,254$ 17,174$ Full-time 1,655 12,284$ 16,842$ Full-time 124 9,978$ 9,462$ Full-time 1,779 12,124$ 15,421$
All 1,785 12,341$ 17,019$ All 152 10,741$ 10,077$ All 1,937 12,216$ 15,752$ PCC Part-time 202 6,234$ 4,002$ PCC Part-time 132 7,416$ 6,841$ PCC Part-time 334 6,702$ 5,055$ Full-time 765 6,584$ 3,465$ Full-time 421 6,543$ 4,306$ Full-time 1,186 6,569$ 3,847$
All 967 6,511$ 3,544$ All 553 6,751$ 4,635$ All 1,520 6,598$ 4,039$ ALL Part-time 1,539 6,449$ 2,839$ ALL Part-time 615 6,085$ 2,384$ ALL Part-time 2,154 6,345$ 2,697$
Full-time 7,997 7,903$ 4,679$ Full-time 1,341 6,348$ 3,750$ Full-time 9,338 7,680$ 4,535$ All 9,536 7,668$ 3,910$ All 1,956 6,265$ 2,900$ All 11,492 7,429$ 3,670$
Note: "Nothing" category was excluded from the means and median calculations.
TABLE M-30: PARENT(S)’ ACADEMIC YEAR CONTRIBUTION TOWARDS COLLEGE EXPENSES
Number Mean Median Number MedianMean Median Number Mean
Source: California Student Aid Commission 194 2003-04 SEARS

Question for Tables: W-31, U-31, and M-31
How much of your own money will (and your spouse’s, if married) will you have spent during the
current nine-month academic year on your education and living expenses (and your spouse’s, if married)? Include money spent from savings, earnings, work-study, or other assets to pay for any educational expenses or living expenses. Do NOT include money you spent from loans, grants, scholarships, fellowships, or credit card charges that you have not yet repaid.
00 Nothing 05 $200 to $399 10 $1,200 to $1,399 01 Less than $50 06 $400 to $599 11 $1,400 to $1,599 02 $50 to $99 07 $600 to $799 12 $1,600 to $1,799 03 $100 to $149 08 $800 to $999 13 $1,800 to $1,999 04 $150 to $199 09 $1,000 to $1,199 14 $2,000 or more
195 2003-04 SEARS

BY SEGMENT, COURSE LOAD, AND DEPENDENCY STATUS
DEPENDENT UNDERGRADUATES
Nothing Less Than $450 $450 to $899 $900 to $1,349 $1,350 to $1,799 $1,800 to $3,599 $3,600 to $5,399 $5,400 to $7,199
# % # % # % # % # % # % # % # %CCC Part-time 68,305 18.0 26,106 6.9 28,967 7.6 45,775 12.1 27,536 7.3 60,437 15.9 45,060 11.9 30,040 7.9
Full-time 51,799 19.2 18,594 6.9 21,734 8.1 27,892 10.3 24,269 9.0 43,830 16.2 32,118 11.9 19,802 7.3All 120,104 18.5 44,700 6.9 50,701 7.8 73,667 11.3 51,805 8.0 104,267 16.1 77,178 11.9 49,842 7.7
UC Part-time 6,115 23.0 1,706 6.4 2,769 10.4 2,047 7.7 1,797 6.8 3,071 11.6 2,998 11.3 1,495 5.6Full-time 17,856 16.4 6,209 5.7 8,996 8.2 10,165 9.3 9,569 8.8 16,896 15.5 11,207 10.3 6,940 6.4All 23,971 17.7 7,914 5.8 11,764 8.7 12,212 9.0 11,366 8.4 19,967 14.7 14,205 10.5 8,434 6.2
CSU Part-time 1,381 7.0 352 1.8 1,536 7.8 1,599 8.1 1,260 6.4 3,209 16.3 2,121 10.8 2,149 10.9Full-time 19,112 12.8 7,028 4.7 10,671 7.1 11,139 7.4 12,540 8.4 21,423 14.3 19,176 12.8 11,785 7.9All 20,493 12.1 7,380 4.4 12,207 7.2 12,738 7.5 13,800 8.2 24,632 14.6 21,297 12.6 13,934 8.2
ICU Part-time 593 11.8 277 5.5 122 2.4 381 7.6 281 5.6 616 12.3 330 6.6 296 5.9Full-time 12,480 14.7 2,791 3.3 3,922 4.6 4,264 5.0 5,365 6.3 9,572 11.2 6,593 7.7 4,350 5.1All 13,073 14.5 3,068 3.4 4,045 4.5 4,645 5.2 5,647 6.3 10,188 11.3 6,923 7.7 4,646 5.2
PCC Part-time 1,169 18.8 109 1.7 193 3.1 539 8.7 264 4.2 713 11.5 719 11.6 328 5.3Full-time 4,665 20.8 746 3.3 1,435 6.4 1,009 4.5 1,013 4.5 3,015 13.4 1,878 8.4 1,803 8.0All 5,835 20.3 855 3.0 1,627 5.7 1,548 5.4 1,278 4.5 3,728 13.0 2,597 9.1 2,131 7.4
ALL Part-time 77,563 17.8 28,549 6.5 33,586 7.7 50,341 11.5 31,139 7.1 68,046 15.6 51,228 11.7 34,306 7.9Full-time 105,912 16.7 35,368 5.6 46,758 7.4 54,469 8.6 52,757 8.3 94,736 14.9 70,972 11.2 44,680 7.0All 183,475 17.1 63,916 6.0 80,344 7.5 104,810 9.8 83,896 7.8 162,783 15.2 122,200 11.4 78,987 7.4
$7,200 to $8,999 $9,000 to $10,799 $10,800 to $12,599 $12,600 to $14,399 $14,400 to $16,199 $16,200 to $17,999 $18,000 or More Total
# % # % # % # % # % # % # % # %CCC Part-time 12,517 3.3 16,450 4.3 4,291 1.1 6,080 1.6 715 0.2 715 0.2 6,437 1.7 379,431 100
Full-time 10,746 4.0 8,452 3.1 2,898 1.1 1,570 0.6 483 0.2 966 0.4 4,588 1.7 269,741 100All 23,263 3.6 24,902 3.8 7,189 1.1 7,649 1.2 1,198 0.2 1,681 0.3 11,025 1.7 649,172 100
UC Part-time 856 3.2 892 3.4 727 2.7 338 1.3 141 0.5 296 1.1 1,301 4.9 26,548 100Full-time 5,962 5.5 5,642 5.2 2,210 2.0 1,215 1.1 1,077 1.0 495 0.5 4,694 4.3 109,133 100All 6,819 5.0 6,534 4.8 2,937 2.2 1,553 1.1 1,218 0.9 792 0.6 5,995 4.4 135,680 100
CSU Part-time 883 4.5 1,393 7.1 420 2.1 395 2.0 474 2.4 221 1.1 2,270 11.5 19,662 100Full-time 8,689 5.8 7,912 5.3 3,672 2.5 2,622 1.8 1,703 1.1 1,152 0.8 10,995 7.3 149,618 100All 9,573 5.7 9,304 5.5 4,092 2.4 3,016 1.8 2,177 1.3 1,372 0.8 13,265 7.8 169,280 100
ICU Part-time 112 2.2 517 10.3 174 3.5 110 2.2 49 1.0 38 0.8 1,109 22.2 5,005 100Full-time 4,224 5.0 7,358 8.6 2,975 3.5 1,901 2.2 1,296 1.5 1,635 1.9 16,419 19.3 85,145 100All 4,335 4.8 7,875 8.7 3,149 3.5 2,011 2.2 1,345 1.5 1,673 1.9 17,528 19.4 90,150 100
PCC Part-time 662 10.6 444 7.1 153 2.5 102 1.6 55 0.9 30 0.5 743 11.9 6,223 100Full-time 1,458 6.5 1,334 5.9 626 2.8 380 1.7 222 1.0 270 1.2 2,596 11.6 22,452 100All 2,121 7.4 1,779 6.2 778 2.7 482 1.7 278 1.0 300 1.0 3,339 11.6 28,675 100
ALL Part-time 15,031 3.4 19,697 4.5 5,765 1.3 7,024 1.6 1,434 0.3 1,300 0.3 11,860 2.7 436,869 100Full-time 31,079 4.9 30,698 4.8 12,381 1.9 7,688 1.2 4,781 0.8 4,517 0.7 39,292 6.2 636,088 100All 46,110 4.3 50,394 4.7 18,146 1.7 14,711 1.4 6,216 0.6 5,818 0.5 51,153 4.8 1,072,958 100
TABLE W-31A: STUDENT ACADEMIC YEAR CONTRIBUTION TOWARDS COLLEGE EXPENSES
Source: California Student Aid Commission 196 2003-04 SEARS
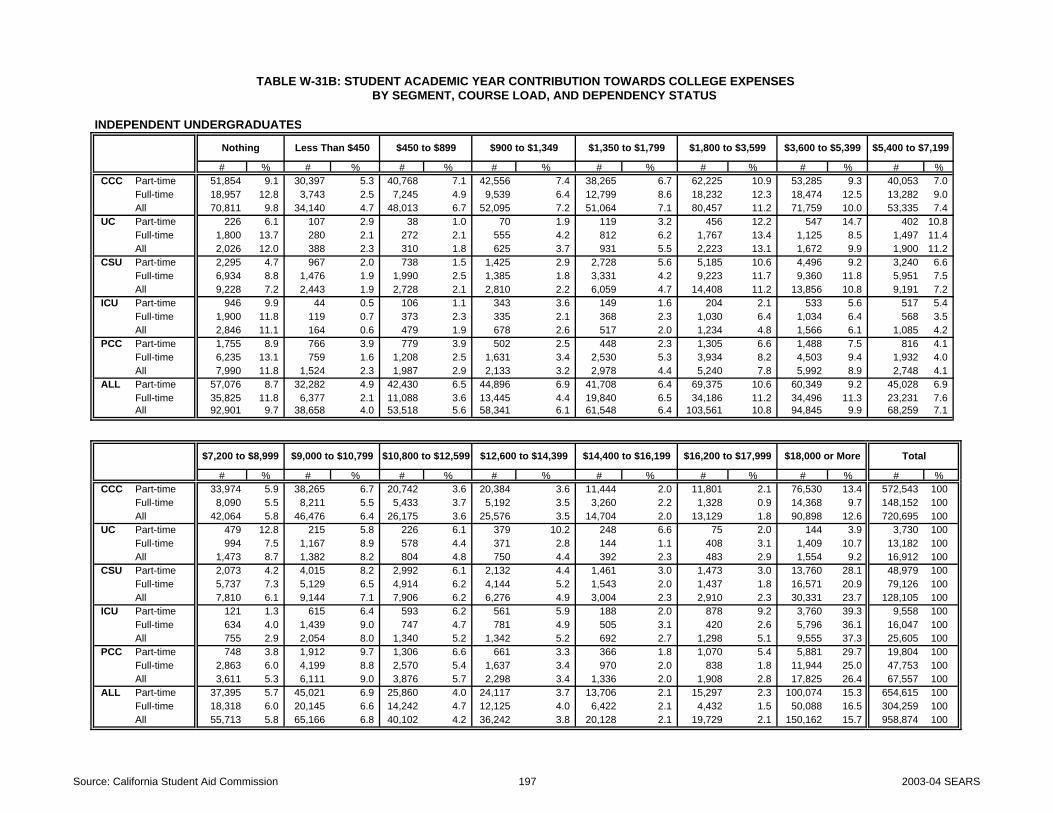
BY SEGMENT, COURSE LOAD, AND DEPENDENCY STATUS
INDEPENDENT UNDERGRADUATES
Nothing Less Than $450 $450 to $899 $900 to $1,349 $1,350 to $1,799 $1,800 to $3,599 $3,600 to $5,399 $5,400 to $7,199
# % # % # % # % # % # % # % # %CCC Part-time 51,854 9.1 30,397 5.3 40,768 7.1 42,556 7.4 38,265 6.7 62,225 10.9 53,285 9.3 40,053 7.0
Full-time 18,957 12.8 3,743 2.5 7,245 4.9 9,539 6.4 12,799 8.6 18,232 12.3 18,474 12.5 13,282 9.0All 70,811 9.8 34,140 4.7 48,013 6.7 52,095 7.2 51,064 7.1 80,457 11.2 71,759 10.0 53,335 7.4
UC Part-time 226 6.1 107 2.9 38 1.0 70 1.9 119 3.2 456 12.2 547 14.7 402 10.8Full-time 1,800 13.7 280 2.1 272 2.1 555 4.2 812 6.2 1,767 13.4 1,125 8.5 1,497 11.4All 2,026 12.0 388 2.3 310 1.8 625 3.7 931 5.5 2,223 13.1 1,672 9.9 1,900 11.2
CSU Part-time 2,295 4.7 967 2.0 738 1.5 1,425 2.9 2,728 5.6 5,185 10.6 4,496 9.2 3,240 6.6Full-time 6,934 8.8 1,476 1.9 1,990 2.5 1,385 1.8 3,331 4.2 9,223 11.7 9,360 11.8 5,951 7.5All 9,228 7.2 2,443 1.9 2,728 2.1 2,810 2.2 6,059 4.7 14,408 11.2 13,856 10.8 9,191 7.2
ICU Part-time 946 9.9 44 0.5 106 1.1 343 3.6 149 1.6 204 2.1 533 5.6 517 5.4Full-time 1,900 11.8 119 0.7 373 2.3 335 2.1 368 2.3 1,030 6.4 1,034 6.4 568 3.5All 2,846 11.1 164 0.6 479 1.9 678 2.6 517 2.0 1,234 4.8 1,566 6.1 1,085 4.2
PCC Part-time 1,755 8.9 766 3.9 779 3.9 502 2.5 448 2.3 1,305 6.6 1,488 7.5 816 4.1Full-time 6,235 13.1 759 1.6 1,208 2.5 1,631 3.4 2,530 5.3 3,934 8.2 4,503 9.4 1,932 4.0All 7,990 11.8 1,524 2.3 1,987 2.9 2,133 3.2 2,978 4.4 5,240 7.8 5,992 8.9 2,748 4.1
ALL Part-time 57,076 8.7 32,282 4.9 42,430 6.5 44,896 6.9 41,708 6.4 69,375 10.6 60,349 9.2 45,028 6.9Full-time 35,825 11.8 6,377 2.1 11,088 3.6 13,445 4.4 19,840 6.5 34,186 11.2 34,496 11.3 23,231 7.6All 92,901 9.7 38,658 4.0 53,518 5.6 58,341 6.1 61,548 6.4 103,561 10.8 94,845 9.9 68,259 7.1
$7,200 to $8,999 $9,000 to $10,799 $10,800 to $12,599 $12,600 to $14,399 $14,400 to $16,199 $16,200 to $17,999 $18,000 or More Total
# % # % # % # % # % # % # % # %CCC Part-time 33,974 5.9 38,265 6.7 20,742 3.6 20,384 3.6 11,444 2.0 11,801 2.1 76,530 13.4 572,543 100
Full-time 8,090 5.5 8,211 5.5 5,433 3.7 5,192 3.5 3,260 2.2 1,328 0.9 14,368 9.7 148,152 100All 42,064 5.8 46,476 6.4 26,175 3.6 25,576 3.5 14,704 2.0 13,129 1.8 90,898 12.6 720,695 100
UC Part-time 479 12.8 215 5.8 226 6.1 379 10.2 248 6.6 75 2.0 144 3.9 3,730 100Full-time 994 7.5 1,167 8.9 578 4.4 371 2.8 144 1.1 408 3.1 1,409 10.7 13,182 100All 1,473 8.7 1,382 8.2 804 4.8 750 4.4 392 2.3 483 2.9 1,554 9.2 16,912 100
CSU Part-time 2,073 4.2 4,015 8.2 2,992 6.1 2,132 4.4 1,461 3.0 1,473 3.0 13,760 28.1 48,979 100Full-time 5,737 7.3 5,129 6.5 4,914 6.2 4,144 5.2 1,543 2.0 1,437 1.8 16,571 20.9 79,126 100All 7,810 6.1 9,144 7.1 7,906 6.2 6,276 4.9 3,004 2.3 2,910 2.3 30,331 23.7 128,105 100
ICU Part-time 121 1.3 615 6.4 593 6.2 561 5.9 188 2.0 878 9.2 3,760 39.3 9,558 100Full-time 634 4.0 1,439 9.0 747 4.7 781 4.9 505 3.1 420 2.6 5,796 36.1 16,047 100All 755 2.9 2,054 8.0 1,340 5.2 1,342 5.2 692 2.7 1,298 5.1 9,555 37.3 25,605 100
PCC Part-time 748 3.8 1,912 9.7 1,306 6.6 661 3.3 366 1.8 1,070 5.4 5,881 29.7 19,804 100Full-time 2,863 6.0 4,199 8.8 2,570 5.4 1,637 3.4 970 2.0 838 1.8 11,944 25.0 47,753 100All 3,611 5.3 6,111 9.0 3,876 5.7 2,298 3.4 1,336 2.0 1,908 2.8 17,825 26.4 67,557 100
ALL Part-time 37,395 5.7 45,021 6.9 25,860 4.0 24,117 3.7 13,706 2.1 15,297 2.3 100,074 15.3 654,615 100Full-time 18,318 6.0 20,145 6.6 14,242 4.7 12,125 4.0 6,422 2.1 4,432 1.5 50,088 16.5 304,259 100All 55,713 5.8 65,166 6.8 40,102 4.2 36,242 3.8 20,128 2.1 19,729 2.1 150,162 15.7 958,874 100
TABLE W-31B: STUDENT ACADEMIC YEAR CONTRIBUTION TOWARDS COLLEGE EXPENSES
Source: California Student Aid Commission 197 2003-04 SEARS

BY SEGMENT, COURSE LOAD, AND DEPENDENCY STATUS
ALL UNDERGRADUATES
Nothing Less Than $450 $450 to $899 $900 to $1,349 $1,350 to $1,799 $1,800 to $3,599 $3,600 to $5,399 $5,400 to $7,199
# % # % # % # % # % # % # % # %Part-time 134,639 12.3 60,830 5.6 76,016 7.0 95,237 8.7 72,848 6.7 137,422 12.6 111,577 10.2 79,335 7.3 Full-time 141,738 15.1 41,744 4.4 57,846 6.2 67,914 7.2 72,596 7.7 128,923 13.7 105,469 11.2 67,911 7.2 All 276,376 13.6 102,575 5.0 133,861 6.6 163,151 8.0 145,444 7.2 266,344 13.1 217,045 10.7 147,245 7.2
$7,200 to $8,999 $9,000 to $10,799 $10,800 to $12,599 $12,600 to $14,399 $14,400 to $16,199 $16,200 to $17,999 $18,000 or More Total
# % # % # % # % # % # % # % # %Part-time 52,426 4.8 64,718 5.9 31,625 2.9 31,141 2.9 15,141 1.4 16,597 1.5 111,935 10.3 1,091,484 100 Full-time 49,397 5.3 50,842 5.4 26,623 2.8 19,812 2.1 11,203 1.2 8,949 1.0 89,380 9.5 940,347 100 All 101,823 5.0 115,560 5.7 58,247 2.9 50,953 2.5 26,344 1.3 25,547 1.3 201,315 9.9 2,031,831 100
TABLE W-31C: STUDENT ACADEMIC YEAR CONTRIBUTION TOWARDS COLLEGE EXPENSES
Source: California Student Aid Commission 198 2003-04 SEARS
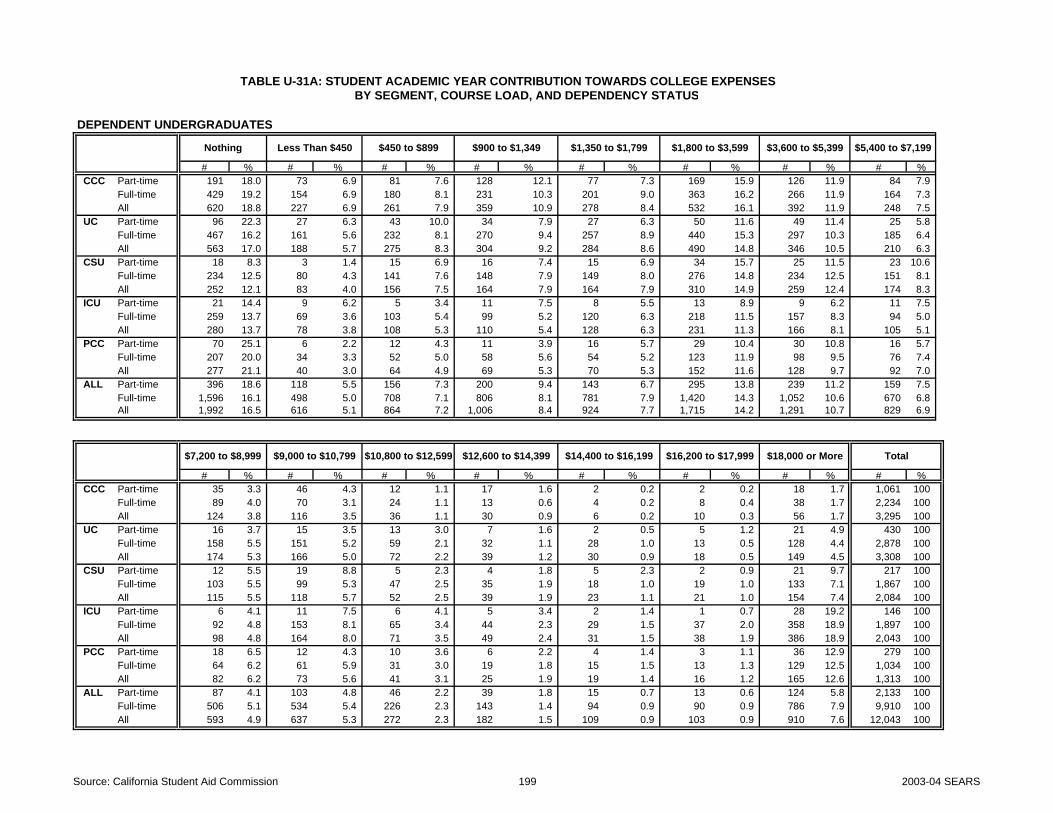
BY SEGMENT, COURSE LOAD, AND DEPENDENCY STATUS
DEPENDENT UNDERGRADUATES
Nothing Less Than $450 $450 to $899 $900 to $1,349 $1,350 to $1,799 $1,800 to $3,599 $3,600 to $5,399 $5,400 to $7,199
# % # % # % # % # % # % # % # %CCC Part-time 191 18.0 73 6.9 81 7.6 128 12.1 77 7.3 169 15.9 126 11.9 84 7.9
Full-time 429 19.2 154 6.9 180 8.1 231 10.3 201 9.0 363 16.2 266 11.9 164 7.3All 620 18.8 227 6.9 261 7.9 359 10.9 278 8.4 532 16.1 392 11.9 248 7.5
UC Part-time 96 22.3 27 6.3 43 10.0 34 7.9 27 6.3 50 11.6 49 11.4 25 5.8Full-time 467 16.2 161 5.6 232 8.1 270 9.4 257 8.9 440 15.3 297 10.3 185 6.4All 563 17.0 188 5.7 275 8.3 304 9.2 284 8.6 490 14.8 346 10.5 210 6.3
CSU Part-time 18 8.3 3 1.4 15 6.9 16 7.4 15 6.9 34 15.7 25 11.5 23 10.6Full-time 234 12.5 80 4.3 141 7.6 148 7.9 149 8.0 276 14.8 234 12.5 151 8.1All 252 12.1 83 4.0 156 7.5 164 7.9 164 7.9 310 14.9 259 12.4 174 8.3
ICU Part-time 21 14.4 9 6.2 5 3.4 11 7.5 8 5.5 13 8.9 9 6.2 11 7.5Full-time 259 13.7 69 3.6 103 5.4 99 5.2 120 6.3 218 11.5 157 8.3 94 5.0All 280 13.7 78 3.8 108 5.3 110 5.4 128 6.3 231 11.3 166 8.1 105 5.1
PCC Part-time 70 25.1 6 2.2 12 4.3 11 3.9 16 5.7 29 10.4 30 10.8 16 5.7Full-time 207 20.0 34 3.3 52 5.0 58 5.6 54 5.2 123 11.9 98 9.5 76 7.4All 277 21.1 40 3.0 64 4.9 69 5.3 70 5.3 152 11.6 128 9.7 92 7.0
ALL Part-time 396 18.6 118 5.5 156 7.3 200 9.4 143 6.7 295 13.8 239 11.2 159 7.5Full-time 1,596 16.1 498 5.0 708 7.1 806 8.1 781 7.9 1,420 14.3 1,052 10.6 670 6.8All 1,992 16.5 616 5.1 864 7.2 1,006 8.4 924 7.7 1,715 14.2 1,291 10.7 829 6.9
$7,200 to $8,999 $9,000 to $10,799 $10,800 to $12,599 $12,600 to $14,399 $14,400 to $16,199 $16,200 to $17,999 $18,000 or More Total
# % # % # % # % # % # % # % # %CCC Part-time 35 3.3 46 4.3 12 1.1 17 1.6 2 0.2 2 0.2 18 1.7 1,061 100
Full-time 89 4.0 70 3.1 24 1.1 13 0.6 4 0.2 8 0.4 38 1.7 2,234 100All 124 3.8 116 3.5 36 1.1 30 0.9 6 0.2 10 0.3 56 1.7 3,295 100
UC Part-time 16 3.7 15 3.5 13 3.0 7 1.6 2 0.5 5 1.2 21 4.9 430 100Full-time 158 5.5 151 5.2 59 2.1 32 1.1 28 1.0 13 0.5 128 4.4 2,878 100All 174 5.3 166 5.0 72 2.2 39 1.2 30 0.9 18 0.5 149 4.5 3,308 100
CSU Part-time 12 5.5 19 8.8 5 2.3 4 1.8 5 2.3 2 0.9 21 9.7 217 100Full-time 103 5.5 99 5.3 47 2.5 35 1.9 18 1.0 19 1.0 133 7.1 1,867 100All 115 5.5 118 5.7 52 2.5 39 1.9 23 1.1 21 1.0 154 7.4 2,084 100
ICU Part-time 6 4.1 11 7.5 6 4.1 5 3.4 2 1.4 1 0.7 28 19.2 146 100Full-time 92 4.8 153 8.1 65 3.4 44 2.3 29 1.5 37 2.0 358 18.9 1,897 100All 98 4.8 164 8.0 71 3.5 49 2.4 31 1.5 38 1.9 386 18.9 2,043 100
PCC Part-time 18 6.5 12 4.3 10 3.6 6 2.2 4 1.4 3 1.1 36 12.9 279 100Full-time 64 6.2 61 5.9 31 3.0 19 1.8 15 1.5 13 1.3 129 12.5 1,034 100All 82 6.2 73 5.6 41 3.1 25 1.9 19 1.4 16 1.2 165 12.6 1,313 100
ALL Part-time 87 4.1 103 4.8 46 2.2 39 1.8 15 0.7 13 0.6 124 5.8 2,133 100Full-time 506 5.1 534 5.4 226 2.3 143 1.4 94 0.9 90 0.9 786 7.9 9,910 100All 593 4.9 637 5.3 272 2.3 182 1.5 109 0.9 103 0.9 910 7.6 12,043 100
TABLE U-31A: STUDENT ACADEMIC YEAR CONTRIBUTION TOWARDS COLLEGE EXPENSES
Source: California Student Aid Commission 199 2003-04 SEARS

BY SEGMENT, COURSE LOAD, AND DEPENDENCY STATUS
INDEPENDENT UNDERGRADUATES
Nothing Less Than $450 $450 to $899 $900 to $1,349 $1,350 to $1,799 $1,800 to $3,599 $3,600 to $5,399 $5,400 to $7,199
# % # % # % # % # % # % # % # %CCC Part-time 145 9.1 85 5.3 114 7.1 119 7.4 107 6.7 174 10.9 149 9.3 112 7.0
Full-time 157 12.8 31 2.5 60 4.9 79 6.4 106 8.6 151 12.3 153 12.5 110 9.0All 302 10.7 116 4.1 174 6.2 198 7.0 213 7.5 325 11.5 302 10.7 222 7.9
UC Part-time 4 5.8 2 2.9 1 1.4 1 1.4 2 2.9 8 11.6 9 13.0 8 11.6Full-time 48 14.0 8 2.3 7 2.0 15 4.4 21 6.1 43 12.6 29 8.5 40 11.7All 52 12.7 10 2.4 8 1.9 16 3.9 23 5.6 51 12.4 38 9.2 48 11.7
CSU Part-time 33 5.7 13 2.2 12 2.1 17 2.9 32 5.5 60 10.3 48 8.3 37 6.4Full-time 102 9.4 16 1.5 26 2.4 27 2.5 48 4.4 120 11.0 134 12.3 87 8.0All 135 8.1 29 1.7 38 2.3 44 2.6 80 4.8 180 10.8 182 10.9 124 7.4
ICU Part-time 18 11.5 1 0.6 2 1.3 6 3.8 3 1.9 4 2.5 8 5.1 10 6.4Full-time 39 11.7 1 0.3 8 2.4 7 2.1 7 2.1 21 6.3 19 5.7 13 3.9All 57 11.7 2 0.4 10 2.0 13 2.7 10 2.0 25 5.1 27 5.5 23 4.7
PCC Part-time 65 11.6 12 2.1 18 3.2 9 1.6 20 3.6 42 7.5 43 7.7 33 5.9Full-time 237 14.2 32 1.9 40 2.4 64 3.8 65 3.9 138 8.3 147 8.8 98 5.9All 302 13.6 44 2.0 58 2.6 73 3.3 85 3.8 180 8.1 190 8.5 131 5.9
ALL Part-time 265 8.9 113 3.8 147 5.0 152 5.1 164 5.5 288 9.7 257 8.7 200 6.7Full-time 583 12.5 88 1.9 141 3.0 192 4.1 247 5.3 473 10.2 482 10.4 348 7.5All 848 11.1 201 2.6 288 3.8 344 4.5 411 5.4 761 10.0 739 9.7 548 7.2
$7,200 to $8,999 $9,000 to $10,799 $10,800 to $12,599 $12,600 to $14,399 $14,400 to $16,199 $16,200 to $17,999 $18,000 or More Total
# % # % # % # % # % # % # % # %CCC Part-time 95 5.9 107 6.7 58 3.6 57 3.6 32 2.0 33 2.1 214 13.4 1,601 100
Full-time 67 5.5 68 5.5 45 3.7 43 3.5 27 2.2 11 0.9 119 9.7 1,227 100All 162 5.7 175 6.2 103 3.6 100 3.5 59 2.1 44 1.6 333 11.8 2,828 100
UC Part-time 9 13.0 4 5.8 4 5.8 8 11.6 4 5.8 2 2.9 3 4.3 69 100Full-time 25 7.3 29 8.5 15 4.4 10 2.9 4 1.2 11 3.2 37 10.8 342 100All 34 8.3 33 8.0 19 4.6 18 4.4 8 1.9 13 3.2 40 9.7 411 100
CSU Part-time 27 4.6 47 8.1 40 6.9 25 4.3 19 3.3 20 3.4 151 26.0 581 100Full-time 82 7.5 76 7.0 63 5.8 57 5.2 25 2.3 16 1.5 208 19.1 1,087 100All 109 6.5 123 7.4 103 6.2 82 4.9 44 2.6 36 2.2 359 21.5 1,668 100
ICU Part-time 2 1.3 9 5.7 8 5.1 10 6.4 3 1.9 5 3.2 68 43.3 157 100Full-time 14 4.2 30 9.0 17 5.1 15 4.5 9 2.7 9 2.7 123 37.0 332 100All 16 3.3 39 8.0 25 5.1 25 5.1 12 2.5 14 2.9 191 39.1 489 100
PCC Part-time 38 6.8 47 8.4 37 6.6 13 2.3 17 3.0 14 2.5 152 27.1 560 100Full-time 106 6.4 131 7.9 72 4.3 52 3.1 36 2.2 35 2.1 414 24.8 1,667 100All 144 6.5 178 8.0 109 4.9 65 2.9 53 2.4 49 2.2 566 25.4 2,227 100
ALL Part-time 171 5.8 214 7.2 147 5.0 113 3.8 75 2.5 74 2.5 588 19.8 2,968 100Full-time 294 6.3 334 7.2 212 4.6 177 3.8 101 2.2 82 1.8 901 19.4 4,655 100All 465 6.1 548 7.2 359 4.7 290 3.8 176 2.3 156 2.0 1,489 19.5 7,623 100
TABLE U-31B: STUDENT ACADEMIC YEAR CONTRIBUTION TOWARDS COLLEGE EXPENSES
Source: California Student Aid Commission 200 2003-04 SEARS

BY SEGMENT, COURSE LOAD, AND DEPENDENCY STATUS
ALL UNDERGRADUATES
Nothing Less Than $450 $450 to $899 $900 to $1,349 $1,350 to $1,799 $1,800 to $3,599 $3,600 to $5,399 $5,400 to $7,199
# % # % # % # % # % # % # % # %Part-time 661 13.0 231 4.5 303 5.9 352 6.9 307 6.0 583 11.4 496 9.7 359 7.0 Full-time 2,179 15.0 586 4.0 849 5.8 998 6.9 1,028 7.1 1,893 13.0 1,534 10.5 1,018 7.0 All 2,840 14.4 817 4.2 1,152 5.9 1,350 6.9 1,335 6.8 2,476 12.6 2,030 10.3 1,377 7.0
$7,200 to $8,999 $9,000 to $10,799 $10,800 to $12,599 $12,600 to $14,399 $14,400 to $16,199 $16,200 to $17,999 $18,000 or More Total
# % # % # % # % # % # % # % # %Part-time 258 5.1 317 6.2 193 3.8 152 3.0 90 1.8 87 1.7 712 14.0 5,101 100 Full-time 800 5.5 868 6.0 438 3.0 320 2.2 195 1.3 172 1.2 1,687 11.6 14,565 100 All 1,058 5.4 1,185 6.0 631 3.2 472 2.4 285 1.4 259 1.3 2,399 12.2 19,666 100
TABLE U-31C: STUDENT ACADEMIC YEAR CONTRIBUTION TOWARDS COLLEGE EXPENSES
Source: California Student Aid Commission 201 2003-04 SEARS

BY SEGMENT, COURSE LOAD, AND DEPENDENCY STATUS
DEPENDENT UNDERGRADUATES INDEPENDENT UNDERGRADUATES ALL UNDERGRADUATES
CCC Part-time 870 3,911$ 2,608$ CCC Part-time 1,456 7,294$ 5,157$ CCC Part-time 2,326 6,029$ 3,835$ Full-time 1,805 3,728$ 2,476$ Full-time 1,070 6,790$ 4,870$ Full-time 2,875 4,868$ 3,184$ All 2,675 3,788$ 2,553$ All 2,526 7,081$ 5,083$ All 5,201 5,387$ 3,585$
UC Part-time 334 4,990$ 2,912$ UC Part-time 65 8,266$ 7,247$ UC Part-time 399 5,524$ 3,491$ Full-time 2,411 4,794$ 2,939$ Full-time 294 7,836$ 6,455$ Full-time 2,705 5,125$ 3,195$ All 2,745 4,818$ 2,935$ All 359 7,914$ 6,625$ All 3,104 5,176$ 3,242$
CSU Part-time 199 6,568$ 4,604$ CSU Part-time 548 10,343$ 10,116$ CSU Part-time 747 9,337$ 8,099$ Full-time 1,633 5,643$ 3,829$ Full-time 985 9,252$ 8,259$ Full-time 2,618 7,001$ 4,933$
All 1,832 5,743$ 3,906$ All 1,533 9,642$ 9,025$ All 3,365 7,519$ 5,372$ ICU Part-time 125 8,379$ 6,606$ ICU Part-time 139 13,477$ 16,879$ ICU Part-time 264 11,063$ 13,083$ Full-time 1,638 8,382$ 6,981$ Full-time 293 12,549$ 13,584$ Full-time 1,931 9,014$ 8,207$
All 1,763 8,382$ 6,958$ All 432 12,847$ 14,829$ All 2,195 9,261$ 8,979$ PCC Part-time 209 7,735$ 5,375$ PCC Part-time 495 10,758$ 11,139$ PCC Part-time 704 9,860$ 9,873$ Full-time 827 7,347$ 5,271$ Full-time 1,430 10,164$ 9,619$ Full-time 2,257 9,132$ 8,159$
All 1,036 7,426$ 5,300$ All 1,925 10,316$ 10,066$ All 2,961 9,305$ 8,728$ ALL Part-time 1,737 5,205$ 2,752$ ALL Part-time 2,703 888$ 5,707$ ALL Part-time 4,440 7,447$ 4,180$
Full-time 8,314 5,690$ 3,239$ Full-time 4,072 9,060$ 6,541$ Full-time 12,386 6,798$ 4,116$ All 10,051 5,606$ 3,035$ All 6,775 8,991$ 5,991$ All 16,826 6,969$ 4,149$
Note: "Nothing" category was excluded from the means and median calculations.
TABLE M-31: MEAN AND MEDIAN STUDENT ACADEMIC YEAR CONTRIBUTION TOWARDS COLLEGE EXPENSES
Number Mean Median Number MedianMean Median Number Mean
Source: California Student Aid Commission 202 2003-04 SEARS

Questions for Tables: W-32 and U-32 (Claiming Educational Tax Credits) W-33 and U-33 (Reasons for Not Claiming Educational Tax Credits)
a. Do you plan to claim, or have someone claim on your behalf, one of the following federal tuition/fee tax
credits for the 2003 tax year? The Hope Scholarship tax credit 00 Yes 02 No The Lifetime Learning tax credit 01 Yes 03 No b. If you answered no to either option above, please choose the reason that best explains why. 0 I do not qualify 01 I do not know if I qualify 02 I do not know what the credits are
203 2003-04 SEARS
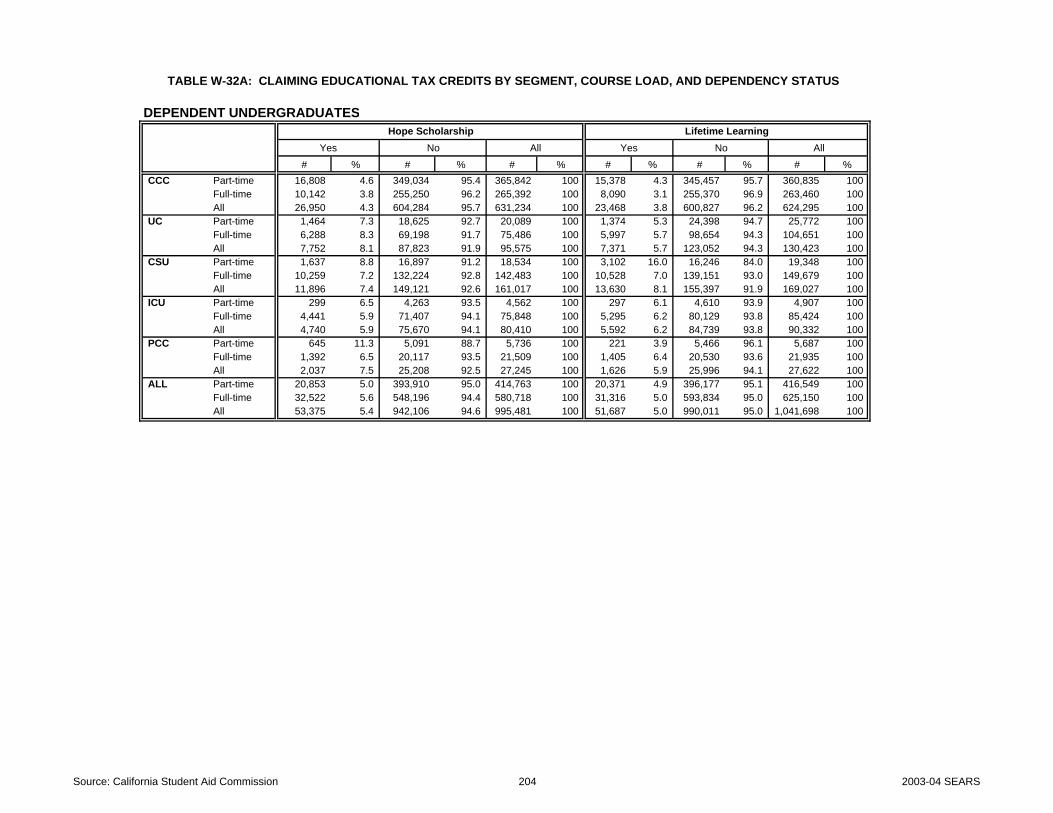
DEPENDENT UNDERGRADUATESHope Scholarship Lifetime Learning
Yes No All Yes No All
# % # % # % # % # % # %CCC Part-time 16,808 4.6 349,034 95.4 365,842 100 15,378 4.3 345,457 95.7 360,835 100
Full-time 10,142 3.8 255,250 96.2 265,392 100 8,090 3.1 255,370 96.9 263,460 100 All 26,950 4.3 604,284 95.7 631,234 100 23,468 3.8 600,827 96.2 624,295 100
UC Part-time 1,464 7.3 18,625 92.7 20,089 100 1,374 5.3 24,398 94.7 25,772 100 Full-time 6,288 8.3 69,198 91.7 75,486 100 5,997 5.7 98,654 94.3 104,651 100 All 7,752 8.1 87,823 91.9 95,575 100 7,371 5.7 123,052 94.3 130,423 100
CSU Part-time 1,637 8.8 16,897 91.2 18,534 100 3,102 16.0 16,246 84.0 19,348 100 Full-time 10,259 7.2 132,224 92.8 142,483 100 10,528 7.0 139,151 93.0 149,679 100 All 11,896 7.4 149,121 92.6 161,017 100 13,630 8.1 155,397 91.9 169,027 100
ICU Part-time 299 6.5 4,263 93.5 4,562 100 297 6.1 4,610 93.9 4,907 100 Full-time 4,441 5.9 71,407 94.1 75,848 100 5,295 6.2 80,129 93.8 85,424 100 All 4,740 5.9 75,670 94.1 80,410 100 5,592 6.2 84,739 93.8 90,332 100
PCC Part-time 645 11.3 5,091 88.7 5,736 100 221 3.9 5,466 96.1 5,687 100 Full-time 1,392 6.5 20,117 93.5 21,509 100 1,405 6.4 20,530 93.6 21,935 100 All 2,037 7.5 25,208 92.5 27,245 100 1,626 5.9 25,996 94.1 27,622 100
ALL Part-time 20,853 5.0 393,910 95.0 414,763 100 20,371 4.9 396,177 95.1 416,549 100 Full-time 32,522 5.6 548,196 94.4 580,718 100 31,316 5.0 593,834 95.0 625,150 100 All 53,375 5.4 942,106 94.6 995,481 100 51,687 5.0 990,011 95.0 1,041,698 100
TABLE W-32A: CLAIMING EDUCATIONAL TAX CREDITS BY SEGMENT, COURSE LOAD, AND DEPENDENCY STATUS
Source: California Student Aid Commission 204 2003-04 SEARS
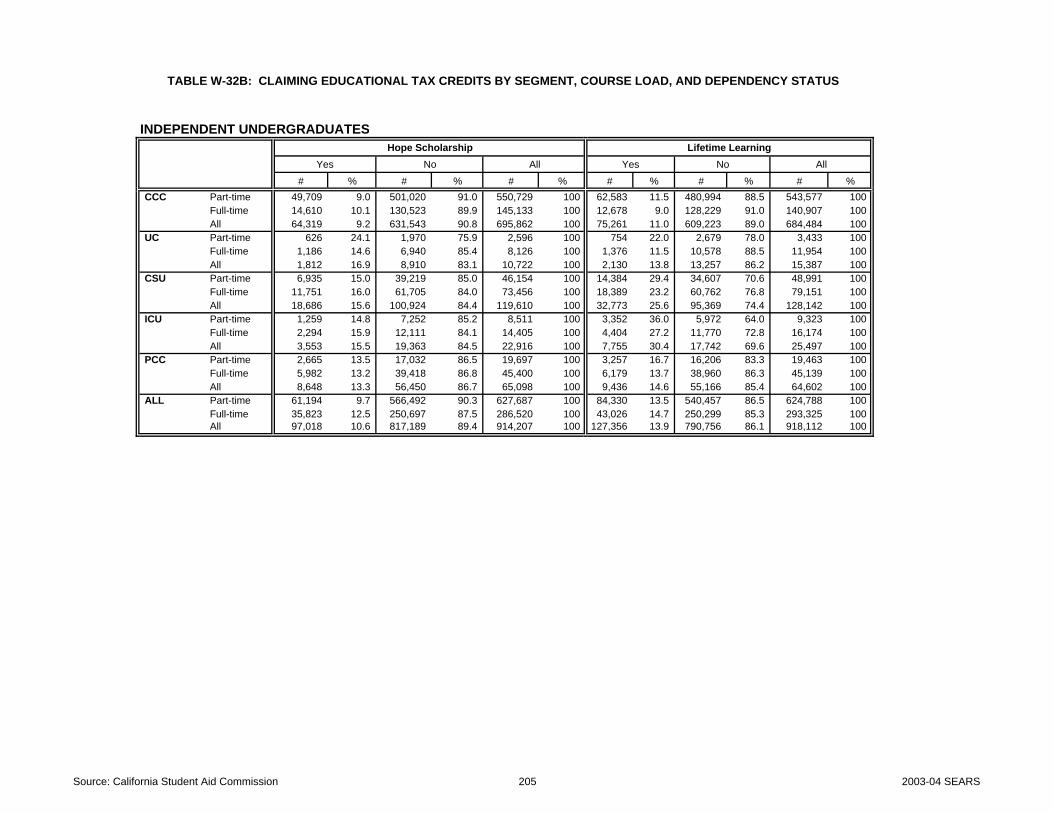
INDEPENDENT UNDERGRADUATESHope Scholarship Lifetime Learning
Yes No All Yes No All
# % # % # % # % # % # %CCC Part-time 49,709 9.0 501,020 91.0 550,729 100 62,583 11.5 480,994 88.5 543,577 100
Full-time 14,610 10.1 130,523 89.9 145,133 100 12,678 9.0 128,229 91.0 140,907 100 All 64,319 9.2 631,543 90.8 695,862 100 75,261 11.0 609,223 89.0 684,484 100
UC Part-time 626 24.1 1,970 75.9 2,596 100 754 22.0 2,679 78.0 3,433 100 Full-time 1,186 14.6 6,940 85.4 8,126 100 1,376 11.5 10,578 88.5 11,954 100 All 1,812 16.9 8,910 83.1 10,722 100 2,130 13.8 13,257 86.2 15,387 100
CSU Part-time 6,935 15.0 39,219 85.0 46,154 100 14,384 29.4 34,607 70.6 48,991 100 Full-time 11,751 16.0 61,705 84.0 73,456 100 18,389 23.2 60,762 76.8 79,151 100 All 18,686 15.6 100,924 84.4 119,610 100 32,773 25.6 95,369 74.4 128,142 100
ICU Part-time 1,259 14.8 7,252 85.2 8,511 100 3,352 36.0 5,972 64.0 9,323 100 Full-time 2,294 15.9 12,111 84.1 14,405 100 4,404 27.2 11,770 72.8 16,174 100 All 3,553 15.5 19,363 84.5 22,916 100 7,755 30.4 17,742 69.6 25,497 100
PCC Part-time 2,665 13.5 17,032 86.5 19,697 100 3,257 16.7 16,206 83.3 19,463 100 Full-time 5,982 13.2 39,418 86.8 45,400 100 6,179 13.7 38,960 86.3 45,139 100 All 8,648 13.3 56,450 86.7 65,098 100 9,436 14.6 55,166 85.4 64,602 100
ALL Part-time 61,194 9.7 566,492 90.3 627,687 100 84,330 13.5 540,457 86.5 624,788 100 Full-time 35,823 12.5 250,697 87.5 286,520 100 43,026 14.7 250,299 85.3 293,325 100 All 97,018 10.6 817,189 89.4 914,207 100 127,356 13.9 790,756 86.1 918,112 100
TABLE W-32B: CLAIMING EDUCATIONAL TAX CREDITS BY SEGMENT, COURSE LOAD, AND DEPENDENCY STATUS
Source: California Student Aid Commission 205 2003-04 SEARS

ALL UNDERGRADUATESHope Scholarship Lifetime Learning
Yes No All Yes No All
# % # % # % # % # % # %Part-time 82,047 7.9 960,403 92.1 1,042,450 100 104,702 10.1 936,635 89.9 1,041,336 100 Full-time 68,346 7.9 798,893 92.1 867,238 100 74,341 8.1 844,133 91.9 918,474 100 All 150,393 7.9 1,759,295 92.1 1,909,688 100 179,043 9.1 1,780,768 90.9 1,959,810 100
TABLE W-32C: CLAIMING EDUCATIONAL TAX CREDITS BY SEGMENT, COURSE LOAD, AND DEPENDENCY STATUS
Source: California Student Aid Commission 206 2003-04 SEARS
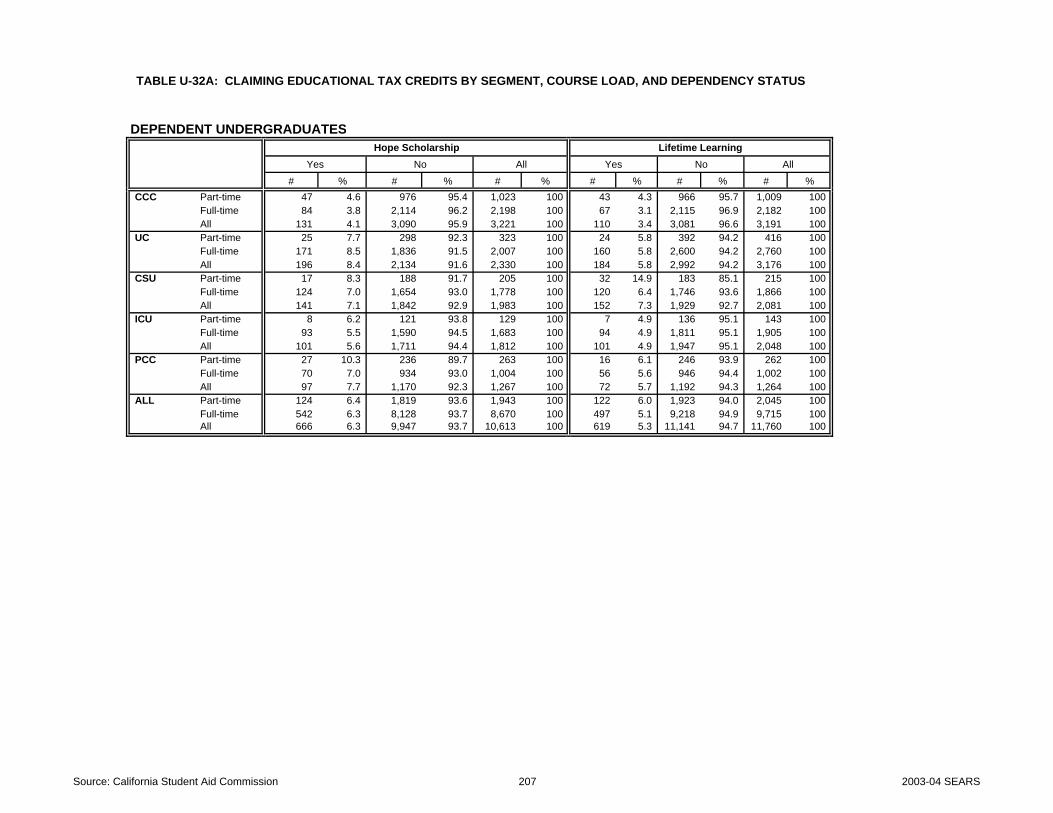
DEPENDENT UNDERGRADUATESHope Scholarship Lifetime Learning
Yes No All Yes No All
# % # % # % # % # % # %CCC Part-time 47 4.6 976 95.4 1,023 100 43 4.3 966 95.7 1,009 100
Full-time 84 3.8 2,114 96.2 2,198 100 67 3.1 2,115 96.9 2,182 100 All 131 4.1 3,090 95.9 3,221 100 110 3.4 3,081 96.6 3,191 100
UC Part-time 25 7.7 298 92.3 323 100 24 5.8 392 94.2 416 100 Full-time 171 8.5 1,836 91.5 2,007 100 160 5.8 2,600 94.2 2,760 100 All 196 8.4 2,134 91.6 2,330 100 184 5.8 2,992 94.2 3,176 100
CSU Part-time 17 8.3 188 91.7 205 100 32 14.9 183 85.1 215 100 Full-time 124 7.0 1,654 93.0 1,778 100 120 6.4 1,746 93.6 1,866 100 All 141 7.1 1,842 92.9 1,983 100 152 7.3 1,929 92.7 2,081 100
ICU Part-time 8 6.2 121 93.8 129 100 7 4.9 136 95.1 143 100 Full-time 93 5.5 1,590 94.5 1,683 100 94 4.9 1,811 95.1 1,905 100 All 101 5.6 1,711 94.4 1,812 100 101 4.9 1,947 95.1 2,048 100
PCC Part-time 27 10.3 236 89.7 263 100 16 6.1 246 93.9 262 100 Full-time 70 7.0 934 93.0 1,004 100 56 5.6 946 94.4 1,002 100 All 97 7.7 1,170 92.3 1,267 100 72 5.7 1,192 94.3 1,264 100
ALL Part-time 124 6.4 1,819 93.6 1,943 100 122 6.0 1,923 94.0 2,045 100 Full-time 542 6.3 8,128 93.7 8,670 100 497 5.1 9,218 94.9 9,715 100 All 666 6.3 9,947 93.7 10,613 100 619 5.3 11,141 94.7 11,760 100
TABLE U-32A: CLAIMING EDUCATIONAL TAX CREDITS BY SEGMENT, COURSE LOAD, AND DEPENDENCY STATUS
Source: California Student Aid Commission 207 2003-04 SEARS

INDEPENDENT UNDERGRADUATESHope Scholarship Lifetime Learning
Yes No All Yes No All
# % # % # % # % # % # %CCC Part-time 139 9.0 1,401 91.0 1,540 100 175 11.5 1,345 88.5 1,520 100
Full-time 121 10.1 1,081 89.9 1,202 100 105 9.0 1,062 91.0 1,167 100 All 260 9.5 2,482 90.5 2,742 100 280 10.4 2,407 89.6 2,687 100
UC Part-time 12 26.7 33 73.3 45 100 14 22.6 48 77.4 62 100 Full-time 31 14.6 182 85.4 213 100 35 11.2 277 88.8 312 100 All 43 16.7 215 83.3 258 100 49 13.1 325 86.9 374 100
CSU Part-time 78 14.2 473 85.8 551 100 164 28.2 417 71.8 581 100 Full-time 148 14.7 858 85.3 1,006 100 248 22.9 836 77.1 1,084 100 All 226 14.5 1,331 85.5 1,557 100 412 24.7 1,253 75.3 1,665 100
ICU Part-time 23 16.5 116 83.5 139 100 60 39.5 92 60.5 152 100 Full-time 47 16.0 247 84.0 294 100 88 26.4 245 73.6 333 100 All 70 16.2 363 83.8 433 100 148 30.5 337 69.5 485 100
PCC Part-time 85 15.5 465 84.5 550 100 87 16.0 456 84.0 543 100 Full-time 209 13.2 1,379 86.8 1,588 100 189 12.1 1,378 87.9 1,567 100 All 294 13.8 1,844 86.2 2,138 100 276 13.1 1,834 86.9 2,110 100
ALL Part-time 337 11.9 2,488 88.1 2,825 100 500 17.5 2,358 82.5 2,858 100 Full-time 556 12.9 3,747 87.1 4,303 100 665 14.9 3,798 85.1 4,463 100 All 893 12.5 6,235 87.5 7,128 100 1,165 15.9 6,156 84.1 7,321 100
TABLE U-32B: CLAIMING EDUCATIONAL TAX CREDITS BY SEGMENT, COURSE LOAD, AND DEPENDENCY STATUS
Source: California Student Aid Commission 208 2003-04 SEARS

ALL UNDERGRADUATESHope Scholarship Lifetime Learning
Yes No All Yes All All
# % # % # % # % # % # %Part-time 461 9.7 4,307 90.3 4,768 100 622 12.7 4,281 87.3 4,903 100 Full-time 1,098 8.5 11,875 91.5 12,973 100 1,162 8.2 13,016 91.8 14,178 100 All 1,559 8.8 16,182 91.2 17,741 100 1,784 9.3 17,297 90.7 19,081 100
TABLE U-32C: CLAIMING EDUCATIONAL TAX CREDITS BY SEGMENT, COURSE LOAD, AND DEPENDENCY STATUS
Source: California Student Aid Commission 209 2003-04 SEARS

TABLE W-33: REASONS FOR NOT CLAIMING HOPE EDUCATIONAL TAX CREDITS BY SEGMENT, COURSE LOAD, AND DEPENDENCY STATUS
DEPENDENT UNDERGRADUATES INDEPENDENT UNDERGRADUATES
# % # % # % # % # % # % # % # %CCC Part-time 41,841 11.9 115,152 32.7 194,901 55.4 351,894 100 CCC Part-time 107,285 20.9 144,477 28.2 260,345 50.8 512,107 100
Full-time 29,826 11.7 84,640 33.1 141,510 55.3 255,976 100 Full-time 21,975 16.4 40,811 30.5 70,997 53.1 133,783 100 All 71,667 11.8 199,792 32.9 336,411 55.3 607,870 100 All 129,260 20.0 185,288 28.7 331,342 51.3 645,890 100
UC Part-time 3,744 16.0 8,738 37.3 10,935 46.7 23,417 100 UC Part-time 751 27.1 879 31.8 1,138 41.1 2,768 100 Full-time 14,047 15.7 27,898 31.2 47,540 53.1 89,485 100 Full-time 2,450 24.3 3,817 37.8 3,832 37.9 10,099 100 All 17,791 15.8 36,636 32.4 58,475 51.8 112,902 100 All 3,200 24.9 4,697 36.5 4,969 38.6 12,866 100
CSU Part-time 3,438 20.1 5,377 31.5 8,283 48.4 17,098 100 CSU Part-time 13,747 34.6 11,745 29.5 14,289 35.9 39,781 100 Full-time 23,818 18.0 33,611 25.3 75,207 56.7 132,636 100 Full-time 18,541 29.3 17,503 27.7 27,235 43.0 63,279 100 All 27,256 18.2 38,988 26.0 83,490 55.8 149,734 100 All 32,288 31.3 29,248 28.4 41,524 40.3 103,060 100
ICU Part-time 633 14.8 1,176 27.5 2,461 57.6 4,270 100 ICU Part-time 2,294 31.3 2,296 31.4 2,735 37.3 7,325 100 Full-time 11,650 16.1 18,271 25.3 42,382 58.6 72,303 100 Full-time 2,334 18.8 3,480 28.0 6,620 53.2 12,434 100 All 12,283 16.0 19,447 25.4 44,843 58.6 76,573 100 All 4,628 23.4 5,776 29.2 9,355 47.3 19,759 100
PCC Part-time 553 10.5 1,868 35.3 2,872 54.3 5,293 100 PCC Part-time 3,109 18.9 4,438 26.9 8,926 54.2 16,474 100 Full-time 2,210 11.6 6,619 34.8 10,207 53.6 19,035 100 Full-time 7,137 18.1 12,986 32.9 19,405 49.1 39,528 100 All 2,763 11.4 8,487 34.9 13,079 53.8 24,328 100 All 10,246 18.3 17,424 31.1 28,331 50.6 56,001 100
ALL Part-time 50,209 12.5 132,311 32.9 219,452 54.6 401,972 100 ALL Part-time 127,186 22.0 163,836 28.3 287,432 49.7 578,454 100 Full-time 81,551 14.3 171,039 30.0 316,846 55.6 569,435 100 Full-time 52,436 20.2 78,597 30.3 128,089 49.4 259,123 100 All 131,760 13.6 303,350 31.2 536,298 55.2 971,407 100 All 179,622 21.4 242,433 28.9 415,522 49.6 837,577 100
ALL UNDERGRADUATESPart-time 177,395 18.1 296,147 30.2 506,884 51.7 980,426 100 Full-time 133,987 16.2 249,636 30.1 444,935 53.7 828,558 100 All 311,381 17.2 545,783 30.2 951,819 52.6 1,808,984 100
TotalTotal I do not qualifyI do not know if
I qualifyI do not qualifyI do not know if
I qualify
I do not know what the credits
are
I do not know what the credits
are
Source: California Student Aid Commission 210 2003-04 SEARS
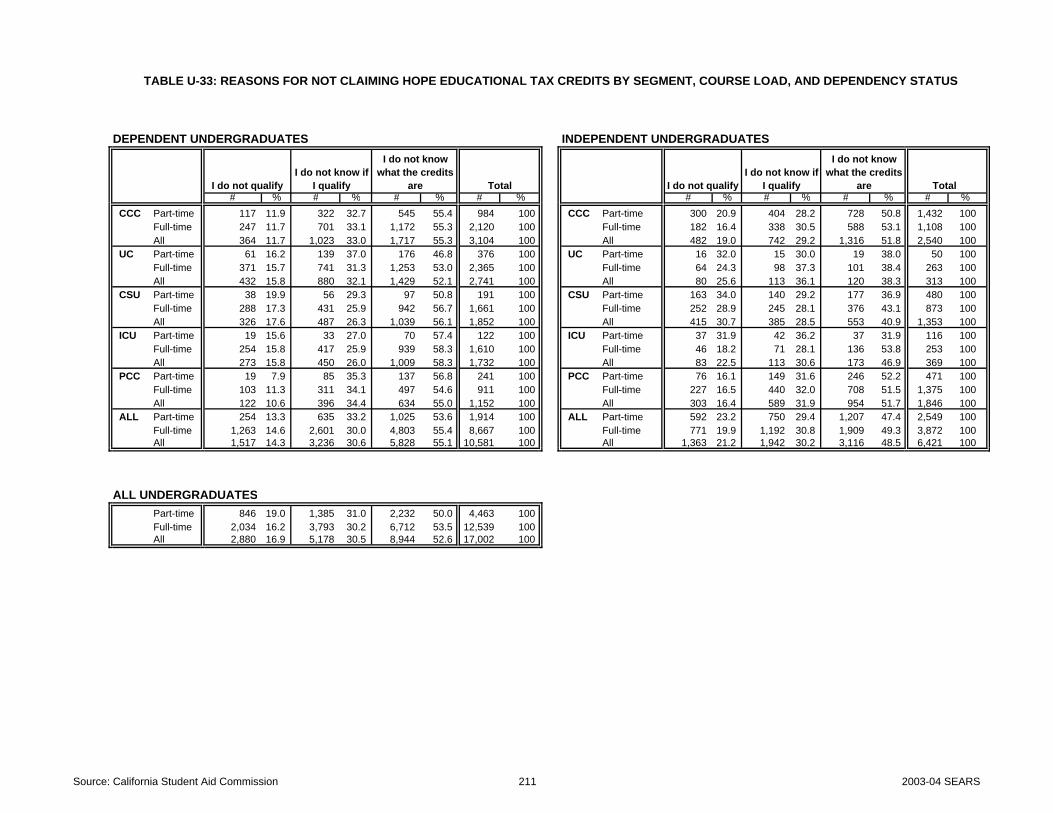
TABLE U-33: REASONS FOR NOT CLAIMING HOPE EDUCATIONAL TAX CREDITS BY SEGMENT, COURSE LOAD, AND DEPENDENCY STATUS
DEPENDENT UNDERGRADUATES INDEPENDENT UNDERGRADUATES
# % # % # % # % # % # % # % # %CCC Part-time 117 11.9 322 32.7 545 55.4 984 100 CCC Part-time 300 20.9 404 28.2 728 50.8 1,432 100
Full-time 247 11.7 701 33.1 1,172 55.3 2,120 100 Full-time 182 16.4 338 30.5 588 53.1 1,108 100 All 364 11.7 1,023 33.0 1,717 55.3 3,104 100 All 482 19.0 742 29.2 1,316 51.8 2,540 100
UC Part-time 61 16.2 139 37.0 176 46.8 376 100 UC Part-time 16 32.0 15 30.0 19 38.0 50 100 Full-time 371 15.7 741 31.3 1,253 53.0 2,365 100 Full-time 64 24.3 98 37.3 101 38.4 263 100 All 432 15.8 880 32.1 1,429 52.1 2,741 100 All 80 25.6 113 36.1 120 38.3 313 100
CSU Part-time 38 19.9 56 29.3 97 50.8 191 100 CSU Part-time 163 34.0 140 29.2 177 36.9 480 100 Full-time 288 17.3 431 25.9 942 56.7 1,661 100 Full-time 252 28.9 245 28.1 376 43.1 873 100 All 326 17.6 487 26.3 1,039 56.1 1,852 100 All 415 30.7 385 28.5 553 40.9 1,353 100
ICU Part-time 19 15.6 33 27.0 70 57.4 122 100 ICU Part-time 37 31.9 42 36.2 37 31.9 116 100 Full-time 254 15.8 417 25.9 939 58.3 1,610 100 Full-time 46 18.2 71 28.1 136 53.8 253 100 All 273 15.8 450 26.0 1,009 58.3 1,732 100 All 83 22.5 113 30.6 173 46.9 369 100
PCC Part-time 19 7.9 85 35.3 137 56.8 241 100 PCC Part-time 76 16.1 149 31.6 246 52.2 471 100 Full-time 103 11.3 311 34.1 497 54.6 911 100 Full-time 227 16.5 440 32.0 708 51.5 1,375 100 All 122 10.6 396 34.4 634 55.0 1,152 100 All 303 16.4 589 31.9 954 51.7 1,846 100
ALL Part-time 254 13.3 635 33.2 1,025 53.6 1,914 100 ALL Part-time 592 23.2 750 29.4 1,207 47.4 2,549 100 Full-time 1,263 14.6 2,601 30.0 4,803 55.4 8,667 100 Full-time 771 19.9 1,192 30.8 1,909 49.3 3,872 100 All 1,517 14.3 3,236 30.6 5,828 55.1 10,581 100 All 1,363 21.2 1,942 30.2 3,116 48.5 6,421 100
ALL UNDERGRADUATESPart-time 846 19.0 1,385 31.0 2,232 50.0 4,463 100 Full-time 2,034 16.2 3,793 30.2 6,712 53.5 12,539 100 All 2,880 16.9 5,178 30.5 8,944 52.6 17,002 100
I do not qualifyI do not know if
I qualify
I do not know what the credits
are TotalI do not qualifyI do not know if
I qualify
I do not know what the credits
are Total
Source: California Student Aid Commission 211 2003-04 SEARS

TABLE W-33.1: REASONS FOR NOT CLAIMING LIFETIME EDUCATIONAL TAX CREDITS BY SEGMENT, COURSE LOAD, AND DEPENDENCY STATUS
DEPENDENT UNDERGRADUATES INDEPENDENT UNDERGRADUATES
# % # % # % # % # % # % # % # %CCC Part-time 40,768 11.6 115,868 33.0 194,186 55.4 350,822 100 CCC Part-time 91,907 18.9 138,755 28.5 256,053 52.6 486,715 100
Full-time 28,616 11.2 85,848 33.6 141,389 55.3 255,853 100 Full-time 20,405 15.8 39,121 30.3 69,789 54.0 129,315 100 All 69,384 11.4 201,716 33.2 335,575 55.3 606,675 100 All 112,312 18.2 177,876 28.9 325,842 52.9 616,030 100
UC Part-time 3,291 14.4 8,571 37.6 10,917 47.9 22,779 100 UC Part-time 542 22.2 760 31.1 1,138 46.6 2,439 100 Full-time 12,812 14.6 27,761 31.6 47,315 53.8 87,888 100 Full-time 1,709 18.8 3,520 38.7 3,871 42.5 9,100 100 All 16,103 14.6 36,332 32.8 58,232 52.6 110,667 100 All 2,252 19.5 4,280 37.1 5,008 43.4 11,540 100
CSU Part-time 2,348 14.7 5,252 33.0 8,324 52.3 15,924 100 CSU Part-time 9,340 27.9 10,175 30.4 13,978 41.7 33,493 100 Full-time 21,430 16.4 33,902 25.9 75,714 57.8 131,046 100 Full-time 12,085 21.6 17,208 30.8 26,546 47.5 55,839 100 All 23,778 16.2 39,154 26.6 84,038 57.2 146,970 100 All 21,425 24.0 27,383 30.7 40,524 45.4 89,332 100
ICU Part-time 729 16.0 1,336 29.3 2,503 54.8 4,568 100 ICU Part-time 1,415 23.1 2,042 33.3 2,678 43.7 6,135 100 Full-time 11,515 14.4 20,484 25.6 48,036 60.0 80,035 100 Full-time 1,727 13.9 3,571 28.7 7,126 57.4 12,424 100 All 12,244 14.5 21,820 25.8 50,539 59.7 84,603 100 All 3,142 16.9 5,613 30.2 9,805 52.8 18,559 100
PCC Part-time 610 11.4 1,753 32.7 2,997 55.9 5,360 100 PCC Part-time 2,627 16.5 4,376 27.4 8,956 56.1 15,959 100 Full-time 2,104 11.0 6,644 34.8 10,338 54.2 19,086 100 Full-time 6,088 15.9 12,497 32.6 19,729 51.5 38,314 100 All 2,713 11.1 8,397 34.4 13,335 54.5 24,445 100 All 8,715 16.1 16,873 31.1 28,685 52.9 54,273 100
ALL Part-time 47,746 12.0 132,780 33.2 218,927 54.8 399,453 100 ALL Part-time 105,831 19.4 156,107 28.7 282,803 51.9 544,742 100 Full-time 76,477 13.3 174,639 30.4 322,792 56.2 573,908 100 Full-time 42,014 17.1 75,918 31.0 127,061 51.9 244,993 100 All 124,223 12.8 307,419 31.6 541,719 55.7 973,360 100 All 147,846 18.7 232,025 29.4 409,864 51.9 789,734 100
ALL UNDERGRADUATESPart-time 153,578 16.3 288,887 30.6 501,730 53.1 944,194 100 Full-time 118,491 14.5 250,556 30.6 449,853 54.9 818,901 100 All 272,069 15.4 539,444 30.6 951,583 54.0 1,763,095 100
TotalTotal I do not qualifyI do not know if
I qualifyI do not qualifyI do not know if
I qualify
I do not know what the credits
are
I do not know what the credits
are
Source: California Student Aid Commission 212 2003-04 SEARS

TABLE U-33.1: REASONS FOR NOT CLAIMING LIFETIME EDUCATIONAL TAX CREDITS BY SEGMENT, COURSE LOAD, AND DEPENDENCY STATUS
DEPENDENT UNDERGRADUATES INDEPENDENT UNDERGRADUATES
# % # % # % # % # % # % # % # %CCC Part-time 114 11.6 324 33.0 543 55.4 981 100 CCC Part-time 257 18.9 388 28.5 716 52.6 1,361 100
Full-time 237 11.2 711 33.6 1,171 55.3 2,119 100 Full-time 169 15.8 324 30.3 578 54.0 1,071 100 All 351 11.3 1,035 33.4 1,714 55.3 3,100 100 All 426 17.5 712 29.3 1,294 53.2 2,432 100
UC Part-time 54 14.8 136 37.3 175 47.9 365 100 UC Part-time 11 25.6 13 30.2 19 44.2 43 100 Full-time 339 14.6 737 31.7 1,246 53.7 2,322 100 Full-time 46 19.2 91 38.1 102 42.7 239 100 All 393 14.6 873 32.5 1,421 52.9 2,687 100 All 57 20.2 104 36.9 121 42.9 282 100
CSU Part-time 26 14.5 55 30.7 98 54.7 179 100 CSU Part-time 107 26.4 125 30.8 174 42.9 406 100 Full-time 257 15.7 434 26.5 948 57.8 1,639 100 Full-time 167 21.7 238 30.9 365 47.4 770 100 All 283 15.6 489 26.9 1,046 57.5 1,818 100 All 274 23.3 363 30.9 539 45.8 1,176 100
ICU Part-time 26 19.3 35 25.9 74 54.8 135 100 ICU Part-time 22 23.2 38 40.0 35 36.8 95 100 Full-time 266 14.7 473 26.1 1,075 59.3 1,814 100 Full-time 35 13.7 73 28.5 148 57.8 256 100 All 292 15.0 508 26.1 1,149 59.0 1,949 100 All 57 16.2 111 31.6 183 52.1 351 100
PCC Part-time 20 8.2 85 35.0 138 56.8 243 100 PCC Part-time 68 14.6 154 33.0 245 52.5 467 100 Full-time 98 10.7 315 34.4 502 54.9 915 100 Full-time 208 15.4 432 32.0 709 52.6 1,349 100 All 118 10.2 400 34.5 640 55.3 1,158 100 All 276 15.2 586 32.3 954 52.5 1,816 100
ALL Part-time 240 12.6 635 33.4 1,028 54.0 1,903 100 ALL Part-time 465 19.6 718 30.3 1,189 50.1 2,372 100 Full-time 1,197 13.6 2,670 30.3 4,942 56.1 8,809 100 Full-time 625 17.0 1,158 31.4 1,902 51.6 3,685 100 All 1,437 13.4 3,305 30.9 5,970 55.7 10,712 100 All 1,090 18.0 1,876 31.0 3,091 51.0 6,057 100
ALL UNDERGRADUATESPart-time 705 16.5 1,353 31.6 2,217 51.9 4,275 100 Full-time 1,822 14.6 3,828 30.6 6,844 54.8 12,494 100 All 2,527 15.1 5,181 30.9 9,061 54.0 16,769 100
I do not qualifyI do not know if
I qualify
I do not know what the credits
are TotalI do not qualifyI do not know if
I qualify
I do not know what the credits
are Total
Source: California Student Aid Commission 213 2003-04 SEARS
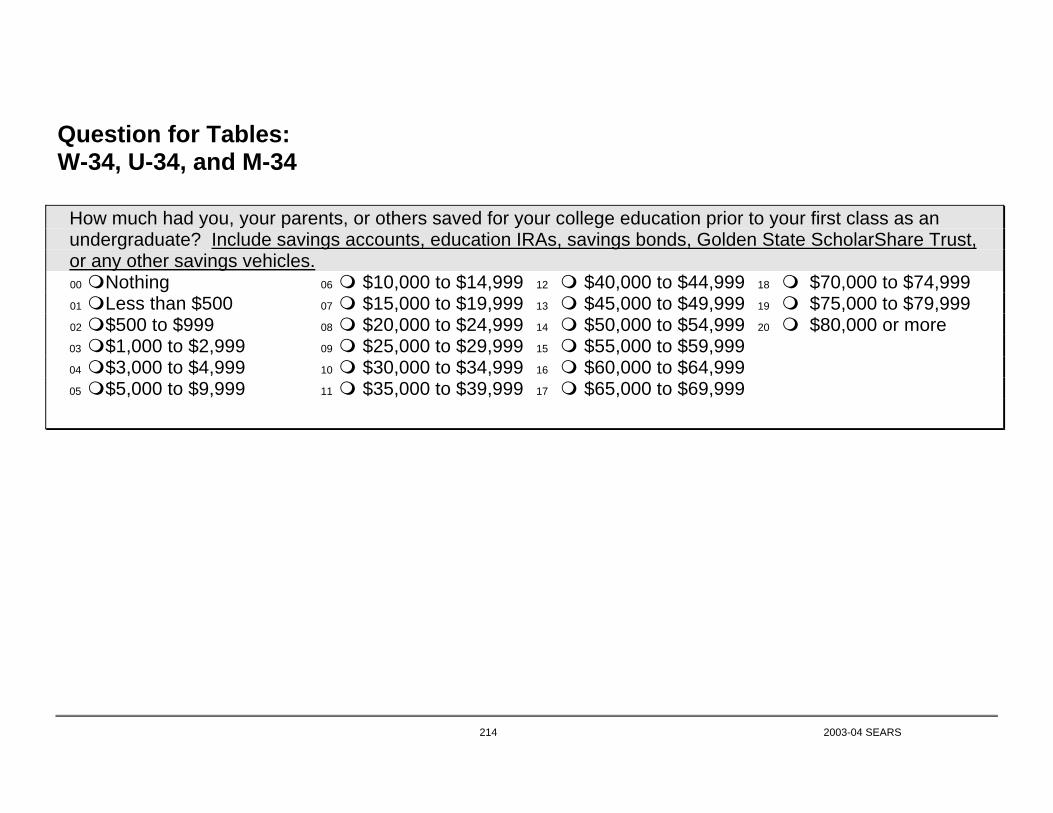
Question for Tables: W-34, U-34, and M-34
How much had you, your parents, or others saved for your college education prior to your first class as an
undergraduate? Include savings accounts, education IRAs, savings bonds, Golden State ScholarShare Trust, or any other savings vehicles.
00 Nothing 06 $10,000 to $14,999 12 $40,000 to $44,999 18 $70,000 to $74,999 01 Less than $500 07 $15,000 to $19,999 13 $45,000 to $49,999 19 $75,000 to $79,999 02 $500 to $999 08 $20,000 to $24,999 14 $50,000 to $54,999 20 $80,000 or more 03 $1,000 to $2,999 09 $25,000 to $29,999 15 $55,000 to $59,999 04 $3,000 to $4,999 10 $30,000 to $34,999 16 $60,000 to $64,999 05 $5,000 to $9,999 11 $35,000 to $39,999 17 $65,000 to $69,999
214 2003-04 SEARS

DEPENDENT UNDERGRADUATES
Nothing $1,000 to $2,999 $3,000 to $4,999 $5,000 to $9,999 $10,000 to $14,999 $15,000 to $19,999 $20,000 to $24,999 $30,000 to $34,999
# % # % # % # % # % # % # % # % # % # % # %CCC Part-time 250,689 66.8 30,397 8.1 18,596 5.0 18,596 5.0 9,656 2.6 12,159 3.2 10,013 2.7 3,934 1.0 4,649 1.2 2,861 0.8 358 0.1
Full-time 158,052 59.6 19,560 7.4 12,919 4.9 20,405 7.7 12,919 4.9 12,074 4.6 8,452 3.2 2,898 1.1 3,139 1.2 2,173 0.8 2,536 1.0 All 408,741 63.8 49,957 7.8 31,515 4.9 39,001 6.1 22,575 3.5 24,233 3.8 18,465 2.9 6,832 1.1 7,788 1.2 5,034 0.8 2,893 0.5
UC Part-time 8,799 46.5 1,381 7.3 1,284 6.8 1,969 10.4 1,305 6.9 1,504 7.9 788 4.2 211 1.1 215 1.1 281 1.5 351 1.9 Full-time 24,133 33.0 3,894 5.3 3,598 4.9 8,578 11.7 6,240 8.5 6,277 8.6 4,483 6.1 2,170 3.0 2,209 3.0 1,463 2.0 2,132 2.9 All 32,932 35.8 5,275 5.7 4,882 5.3 10,547 11.5 7,545 8.2 7,781 8.5 5,271 5.7 2,380 2.6 2,423 2.6 1,744 1.9 2,484 2.7
CSU Part-time 7,562 52.9 726 5.1 1,278 8.9 1,265 8.9 654 4.6 1,351 9.5 422 3.0 319 2.2 247 1.7 26 0.2 149 1.0 Full-time 52,555 47.5 7,364 6.7 7,561 6.8 10,901 9.9 5,885 5.3 7,729 7.0 5,645 5.1 2,640 2.4 1,904 1.7 1,895 1.7 1,818 1.6 All 60,117 48.1 8,089 6.5 8,838 7.1 12,166 9.7 6,539 5.2 9,079 7.3 6,067 4.9 2,960 2.4 2,151 1.7 1,922 1.5 1,967 1.6
ICU Part-time 1,269 47.1 169 6.3 81 3.0 182 6.8 56 2.1 217 8.0 124 4.6 14 0.5 112 4.2 - - - - Full-time 23,363 40.9 3,125 5.5 2,568 4.5 4,788 8.4 3,554 6.2 3,777 6.6 2,812 4.9 1,019 1.8 1,978 3.5 684 1.2 1,056 1.8 All 24,632 41.2 3,293 5.5 2,649 4.4 4,970 8.3 3,610 6.0 3,994 6.7 2,936 4.9 1,033 1.7 2,090 3.5 684 1.1 1,056 1.8
PCC Part-time 3,617 58.0 470 7.5 173 2.8 619 9.9 381 6.1 128 2.0 173 2.8 71 1.1 63 1.0 69 1.1 126 2.0 Full-time 13,159 57.5 1,910 8.3 1,528 6.7 1,643 7.2 579 2.5 823 3.6 810 3.5 300 1.3 555 2.4 99 0.4 217 0.9 All 16,776 57.6 2,380 8.2 1,701 5.8 2,262 7.8 960 3.3 951 3.3 983 3.4 371 1.3 618 2.1 168 0.6 343 1.2
ALL Part-time 271,935 65.1 33,142 7.9 21,411 5.1 22,632 5.4 12,052 2.9 15,358 3.7 11,521 2.8 4,549 1.1 5,286 1.3 3,237 0.8 984 0.2 Full-time 271,262 51.3 35,853 6.8 28,175 5.3 46,315 8.8 29,177 5.5 30,680 5.8 22,202 4.2 9,027 1.7 9,785 1.9 6,315 1.2 7,759 1.5 All 543,197 57.4 68,995 7.3 49,585 5.2 68,947 7.3 41,229 4.4 46,037 4.9 33,723 3.6 13,576 1.4 15,071 1.6 9,553 1.0 8,743 0.9
$35,000 to $39,999 $40,000 to $44,999 $45,000 to $49,999 $50,000 to $54,999 $55,000 to $59,999 $60,000 to $64,999 $65,000 to $69,999 $70,000 to $74,999 $75,000 to $79,999 Total
# % # % # % # % # % # % # % # % # % # % # %CCC Part-time 1,788 0.5 1,073 0.3 1,431 0.4 2,503 0.7 - - 1,788 0.5 715 0.2 - - - 4,291 1.1 375,496 100
Full-time 1,570 0.6 2,053 0.8 362 0.1 724 0.3 241 0.1 604 0.2 121 0.0 241 0.1 - - 3,985 1.5 265,028 100 All 3,358 0.5 3,125 0.5 1,793 0.3 3,228 0.5 241 0.0 2,392 0.4 836 0.1 241 0.0 - - 8,276 1.3 640,524 100
UC Part-time 108 0.6 141 0.7 37 0.2 141 0.7 - - 87 0.5 - - 70 0.4 - - 256 1.4 18,926 100 Full-time 979 1.3 1,338 1.8 507 0.7 980 1.3 231 0.3 819 1.1 225 0.3 279 0.4 323 0.4 2,200 3.0 73,060 100 All 1,087 1.2 1,479 1.6 544 0.6 1,121 1.2 231 0.3 906 1.0 225 0.2 350 0.4 323 0.4 2,457 2.7 91,987 100
CSU Part-time - - 62 0.4 54 0.4 - - - - - - - - - - 169 1.2 - - 14,285 100 Full-time 1,054 1.0 381 0.3 656 0.6 976 0.9 153 0.1 178 0.2 62 0.1 - - 104 0.1 1,118 1.0 110,578 100 All 1,054 0.8 443 0.4 710 0.6 976 0.8 153 0.1 178 0.1 62 0.1 - - 273 0.2 1,118 0.9 124,863 100
ICU Part-time 87 3.2 - - - - 38 1.4 - - 22 0.8 - - - - 85 3.1 240 8.9 2,694 100 Full-time 645 1.1 906 1.6 365 0.6 689 1.2 220 0.4 294 0.5 267 0.5 116 0.2 319 0.6 4,539 8.0 57,084 100 All 732 1.2 906 1.5 365 0.6 727 1.2 220 0.4 315 0.5 267 0.4 116 0.2 404 0.7 4,779 8.0 59,778 100
PCC Part-time 45 0.7 9 0.1 - - 149 2.4 - - - - 30 0.5 24 0.4 13 0.2 74 1.2 6,235 100 Full-time 97 0.4 214 0.9 28 0.1 20 0.1 19 0.1 273 1.2 27 0.1 - - 103 0.4 485 2.1 22,888 100 All 142 0.5 223 0.8 28 0.1 168 0.6 19 0.1 273 0.9 56 0.2 24 0.1 116 0.4 559 1.9 29,123 100
ALL Part-time 2,028 0.5 1,285 0.3 1,522 0.4 2,830 0.7 - - 1,896 0.5 745 0.2 94 0.0 267 0.1 4,862 1.2 417,636 100 Full-time 4,345 0.8 4,892 0.9 1,918 0.4 3,389 0.6 865 0.2 2,167 0.4 702 0.1 636 0.1 849 0.2 12,326 2.3 528,639 100 All 6,373 0.7 6,177 0.7 3,440 0.4 6,219 0.7 865 0.1 4,063 0.4 1,447 0.2 731 0.1 1,116 0.1 17,189 1.8 946,275 100
$80,000 or more
TABLE W-34A: TOTAL AMOUNT SAVED FOR COLLEGE BY SEGMENT, COURSE LOAD, AND DEPENDENCY STATUS
Less than $500 $500 to $999 $25,000 to $29,999
Source: California Student Aid Commission 215 2003-04 SEARS

INDEPENDENT UNDERGRADUATES
Nothing $1,000 to $2,999 $3,000 to $4,999 $5,000 to $9,999 $10,000 to $14,999 $15,000 to $19,999 $20,000 to $24,999 $30,000 to $34,999
# % # % # % # % # % # % # % # % # % # % # %CCC Part-time 451,312 79.5 21,457 3.8 11,801 2.1 21,099 3.7 11,086 2.0 13,589 2.4 7,152 1.3 5,364 0.9 5,007 0.9 4,291 0.8 1,431 0.3
Full-time 108,668 73.6 9,418 6.4 5,675 3.8 5,313 3.6 3,139 2.1 4,468 3.0 3,381 2.3 724 0.5 1,449 1.0 604 0.4 966 0.2 All 559,980 78.3 30,875 4.3 17,476 2.4 26,412 3.7 14,225 2.0 18,057 2.5 10,533 1.5 6,089 0.9 6,456 0.9 4,895 0.7 2,396 0.3
UC Part-time 1,707 55.8 226 7.4 194 6.3 345 11.3 112 3.7 326 10.7 70 2.3 37 1.2 - - 41 1.4 - - Full-time 5,969 55.0 626 5.8 636 5.9 867 8.0 512 4.7 645 5.9 491 4.5 166 1.5 349 3.2 138 1.3 74 0.7 All 7,676 55.2 852 6.1 830 6.0 1,212 8.7 624 4.5 972 7.0 562 4.0 203 1.5 349 2.5 180 1.3 74 0.5
CSU Part-time 28,433 65.7 2,878 6.6 2,279 5.3 3,168 7.3 1,856 4.3 1,553 3.6 698 1.6 615 1.4 388 0.9 282 0.7 329 0.8 Full-time 47,124 67.8 3,741 5.4 3,346 4.8 4,911 7.1 2,359 3.4 3,888 5.6 1,638 2.4 370 0.5 549 0.8 269 0.4 202 0.3 All 75,557 67.0 6,619 5.9 5,625 5.0 8,079 7.2 4,215 3.7 5,441 4.8 2,337 2.1 984 0.9 937 0.8 551 0.5 531 0.5
ICU Part-time 5,878 69.7 345 4.1 327 3.9 488 5.8 269 3.2 68 0.8 708 8.4 - - 126 1.5 138 1.6 - - Full-time 8,958 64.4 990 7.1 325 2.3 1,121 8.1 441 3.2 632 4.5 497 3.6 104 0.7 261 1.9 122 0.9 48 0.3 All 14,836 66.4 1,335 6.0 653 2.9 1,609 7.2 709 3.2 699 3.1 1,205 5.4 104 0.5 387 1.7 259 1.2 48 0.2
PCC Part-time 16,994 82.2 600 2.9 408 2.0 382 1.8 340 1.6 609 2.9 166 0.8 201 1.0 322 1.6 249 1.2 66 0.3 Full-time 39,049 80.8 1,474 3.0 1,164 2.4 1,592 3.3 1,092 2.3 910 1.9 951 2.0 374 0.8 332 0.7 237 0.5 344 0.7 All 56,043 81.2 2,074 3.0 1,572 2.3 1,975 2.9 1,432 2.1 1,519 2.2 1,117 1.6 575 0.8 654 0.9 486 0.7 410 0.6
ALL Part-time 504,324 78.4 25,507 4.0 15,009 2.3 25,482 4.0 13,662 2.1 16,145 2.5 8,795 1.4 6,216 1.0 5,843 0.9 5,002 0.8 1,825 0.3 Full-time 209,768 72.3 16,249 5.6 11,146 3.8 13,804 4.8 7,543 2.6 10,542 3.6 6,959 2.4 1,738 0.6 2,940 1.0 1,370 0.5 1,633 0.6 All 714,091 76.5 41,756 4.5 26,155 2.8 39,286 4.2 21,205 2.3 26,687 2.9 15,754 1.7 7,955 0.9 8,782 0.9 6,372 0.7 3,459 0.4
$35,000 to $39,999 $40,000 to $44,999 $45,000 to $49,999 $50,000 to $54,999 $55,000 to $59,999 $60,000 to $64,999 $65,000 to $69,999 $70,000 to $74,999 $75,000 to $79,999 Total
# % # % # % # % # % # % # % # % # % # % # %CCC Part-time 715 0.1 3,219 0.6 715 0.1 1,788 0.3 358 0.1 715 0.1 - - 715 0.1 - - 6,080 1.1 567,894 100
Full-time 724 0.5 483 0.3 121 0.1 121 0.1 - - 241 0.2 362 0.2 121 0.1 - - 1,570 1.1 147,547 100 All 1,440 0.2 3,701 0.5 836 0.1 1,909 0.3 358 0.0 957 0.1 362 0.1 836 0.1 - - 7,649 1.1 715,441 100
UC Part-time - - - - - - - - - - - - - - - - - - - - 3,058 100 Full-time 37 0.3 76 0.7 - - - - - - - - - - 40 0.4 - - 232 2.1 10,859 100 All 37 0.3 76 0.5 - - - - - - - - - - 40 0.3 - - 232 1.7 13,917 100
CSU Part-time 83 0.2 169 0.4 - - 26 0.1 54 0.1 153 0.4 - - 159 0.4 - - 158 0.4 43,283 100 Full-time 152 0.2 131 0.2 - - 365 0.5 - - 45 0.1 - - 42 0.1 - - 377 0.5 69,508 100 All 235 0.2 299 0.3 - - 392 0.3 54 0.0 198 0.2 - - 202 0.2 - - 535 0.5 112,791 100
ICU Part-time - - 48 0.6 - - - - - - - - - - - - - - 42 0.5 8,437 100 Full-time 76 0.5 - - - - - - - - 118 0.8 - - 47 0.3 - - 169 1.2 13,907 100 All 76 0.3 48 0.2 - - - - - - 118 0.5 - - 47 0.2 - - 211 0.9 22,344 100
PCC Part-time 62 0.3 29 0.1 39 0.2 20 0.1 - - 30 0.1 - - - - 25 0.1 144 0.7 20,686 100 Full-time 115 0.2 188 0.4 102 0.2 67 0.1 11 0.0 111 0.2 - - 18 0.0 - - 217 0.4 48,350 100 All 177 0.3 217 0.3 141 0.2 87 0.1 11 0.0 141 0.2 - - 18 0.0 25 0.0 361 0.5 69,035 100
ALL Part-time 860 0.1 3,464 0.5 754 0.1 1,834 0.3 412 0.1 898 0.1 - - 875 0.1 25 0.0 6,424 1.0 643,357 100 Full-time 1,104 0.4 878 0.3 223 0.1 554 0.2 11 0.0 516 0.2 362 0.1 268 0.1 - - 2,564 0.9 290,171 100 All 1,964 0.2 4,342 0.5 977 0.1 2,387 0.3 422 0.0 1,414 0.2 362 0.0 1,142 0.1 25 0.0 8,988 1.0 933,528 100
$80,000 or more
TABLE W-34B: TOTAL AMOUNT SAVED FOR COLLEGE BY SEGMENT, COURSE LOAD, AND DEPENDENCY STATUS
Less than $500 $25,000 to $29,999$500 to $999
Source: California Student Aid Commission 216 2003-04 SEARS

ALL UNDERGRADUATES
Nothing Less than $500 $500 to $999 $1,000 to #2,999 $3,000 to $4,999 $5,000 to $9,999 $10,000 to $14,999 $15,000 to $19,999 $20,000 to $24,999 $25,000 to $29,999 $30,000 to $34,999
# % # % # % # % # % # % # % # % # % # % # %Part-time 776,259 73.2 58,649 5.5 36,420 3.4 48,114 4.5 25,714 2.4 31,503 3.0 20,316 1.9 10,765 1.0 11,129 1.0 8,240 0.8 2,810 0.3 Full-time 481,030 58.7 52,102 6.4 39,321 4.8 60,119 7.3 36,720 4.5 41,222 5.0 29,161 3.6 10,765 1.3 12,724 1.6 7,685 0.9 9,392 1.1 All 1,257,288 66.9 110,751 5.9 75,741 4.0 108,233 5.8 62,434 3.3 72,725 3.9 49,477 2.6 21,530 1.1 23,853 1.3 15,925 0.8 12,202 0.6
$35,000 to $39,999 $40,000 to $44,999 $45,000 to $49,999 $50,000 to $54,999 $55,000 to $59,999 $60,000 to $64,999 $65,000 to $69,999 $70,000 to $74,999 $75,000 to $79,999 $80,000 or more Total
# % # % # % # % # % # % # % # % # % # % # %Part-time 2,889 0.3 4,749 0.4 2,276 0.2 4,664 0.4 412 0.0 2,794 0.3 745 0.1 969 0.1 292 0.0 11,286 1.1 1,060,993 100 Full-time 5,449 0.7 5,770 0.7 2,141 0.3 3,942 0.5 875 0.1 2,683 0.3 1,064 0.1 904 0.1 849 0.1 14,891 1.8 818,810 100 All 8,337 0.4 10,519 0.6 4,417 0.2 8,607 0.5 1,287 0.1 5,477 0.3 1,809 0.1 1,873 0.1 1,142 0.1 26,177 1.4 1,879,803 100
TABLE W-34C: TOTAL AMOUNT SAVED FOR COLLEGE BY SEGMENT, COURSE LOAD, AND DEPENDENCY STATUS
Source: California Student Aid Commission 217 2003-04 SEARS

DEPENDENT UNDERGRADUATES
Nothing $1,000 to $2,999 $3,000 to $4,999 $5,000 to $9,999 $10,000 to $14,999 $15,000 to $19,999 $20,000 to $24,999 $30,000 to $34,999
# % # % # % # % # % # % # % # % # % # % # %CCC Part-time 701 66.8 85 8.1 52 5.0 52 5.0 27 2.6 34 3.2 28 2.7 11 1.0 13 1.2 8 0.8 1 0.1
Full-time 1,309 59.6 162 7.4 107 4.9 169 7.7 107 4.9 100 4.6 70 3.2 24 1.1 26 1.2 18 0.8 21 1.0 All 2,010 61.9 247 7.6 159 4.9 221 6.8 134 4.1 134 4.1 98 3.0 35 1.1 39 1.2 26 0.8 22 0.7
UC Part-time 142 46.6 23 7.5 20 6.6 31 10.2 20 6.6 25 8.2 12 3.9 3 1.0 4 1.3 4 1.3 5 1.6 Full-time 638 32.9 106 5.5 94 4.9 224 11.6 165 8.5 163 8.4 122 6.3 59 3.0 61 3.1 39 2.0 58 3.0 All 780 34.8 129 5.8 114 5.1 255 11.4 185 8.3 188 8.4 134 6.0 62 2.8 65 2.9 43 1.9 63 2.8
CSU Part-time 81 51.3 7 4.4 12 7.6 15 9.5 8 5.1 14 8.9 8 5.1 3 1.9 3 1.9 1 0.6 3 1.9 Full-time 650 47.0 91 6.6 86 6.2 142 10.3 79 5.7 99 7.2 67 4.8 32 2.3 27 2.0 23 1.7 20 1.4 All 731 47.4 98 6.4 98 6.4 157 10.2 87 5.6 113 7.3 75 4.9 35 2.3 30 1.9 24 1.6 23 1.5
ICU Part-time 30 39.5 4 5.3 2 2.6 7 9.2 3 3.9 6 7.9 4 5.3 2 2.6 2 2.6 - - - - Full-time 469 37.6 75 6.0 59 4.7 106 8.5 68 5.5 99 7.9 69 5.5 23 1.8 46 3.7 16 1.3 22 1.8 All 499 37.7 79 6.0 61 4.6 113 8.5 71 5.4 105 7.9 73 5.5 25 1.9 48 3.6 16 1.2 22 1.7
PCC Part-time 166 59.7 18 6.5 10 3.6 21 7.6 15 5.4 7 2.5 12 4.3 4 1.4 4 1.4 4 1.4 5 1.8 Full-time 627 60.0 79 7.6 57 5.5 66 6.3 32 3.1 40 3.8 36 3.4 16 1.5 30 2.9 7 0.7 10 1.0 All 793 59.9 97 7.3 67 5.1 87 6.6 47 3.6 47 3.6 48 3.6 20 1.5 34 2.6 11 0.8 15 1.1
ALL Part-time 1,120 60.0 137 7.3 96 5.1 126 6.7 73 3.9 86 4.6 64 3.4 23 1.2 26 1.4 17 0.9 14 0.7 Full-time 3,693 47.3 513 6.6 403 5.2 707 9.1 451 5.8 501 6.4 364 4.7 154 2.0 190 2.4 103 1.3 131 1.7 All 4,813 49.8 650 6.7 499 5.2 833 8.6 524 5.4 587 6.1 428 4.4 177 1.8 216 2.2 120 1.2 145 1.5
$35,000 to $39,999 $40,000 to $44,999 $45,000 to $49,999 $50,000 to $54,999 $55,000 to $59,999 $60,000 to $64,999 $65,000 to $69,999 $70,000 to $74,999 $75,000 to $79,999 Total
# % # % # % # % # % # % # % # % # % # % # %CCC Part-time 5 0.5 3 0.3 4 0.4 7 0.7 - - 5 0.5 2 0.2 - - - - 12 1.1 1,050 100
Full-time 13 0.6 17 0.8 3 0.1 6 0.3 2 0.1 5 0.2 1 0.0 2 0.1 - - 33 1.5 2,195 100 All 18 0.6 20 0.6 7 0.2 13 0.4 2 0.1 10 0.3 3 0.1 2 0.1 - - 45 1.4 3,245 100
UC Part-time 2 0.7 2 0.7 1 0.3 2 0.7 - - 2 0.7 - - 1 0.3 - - 6 2.0 305 100 Full-time 25 1.3 36 1.9 14 0.7 27 1.4 6 0.3 22 1.1 5 0.3 7 0.4 9 0.5 57 2.9 1,937 100 All 27 1.2 38 1.7 15 0.7 29 1.3 6 0.3 24 1.1 5 0.2 8 0.4 9 0.4 63 2.8 2,242 100
CSU Part-time - - 1 0.6 1 0.6 - - - - - - - - - - 1 0.6 - - 158 100 Full-time 15 1.1 7 0.5 9 0.7 12 0.9 3 0.2 4 0.3 1 0.1 - - 2 0.1 14 1.0 1,383 100 All 15 1.0 8 0.5 10 0.6 12 0.8 3 0.2 4 0.3 1 0.1 - - 3 0.2 14 0.9 1,541 100
ICU Part-time 2 2.6 - - - - 1 1.3 - - 1 1.3 - - - - 2 2.6 10 13.2 76 100 Full-time 15 1.2 25 2.0 8 0.6 14 1.1 5 0.4 7 0.6 7 0.6 4 0.3 9 0.7 100 8.0 1,246 100 All 17 1.3 25 1.9 8 0.6 15 1.1 5 0.4 8 0.6 7 0.5 4 0.3 11 0.8 110 8.3 1,322 100
PCC Part-time 2 0.7 1 0.4 - - 2 0.7 - - - - 1 0.4 1 0.4 1 0.4 4 1.4 278 100 Full-time 6 0.6 5 0.5 2 0.2 2 0.2 1 0.1 6 0.6 2 0.2 - - 5 0.5 16 1.5 1,045 100 All 8 0.6 6 0.5 2 0.2 4 0.3 1 0.1 6 0.5 3 0.2 1 0.1 6 0.5 20 1.5 1,323 100
ALL Part-time 11 0.6 7 0.4 6 0.3 12 0.6 - - 8 0.4 3 0.2 2 0.1 4 0.2 32 1.7 1,867 100 Full-time 74 0.9 90 1.2 36 0.5 61 0.8 17 0.2 44 0.6 16 0.2 13 0.2 25 0.3 220 2.8 7,806 100 All 85 0.9 97 1.0 42 0.4 73 0.8 17 0.2 52 0.5 19 0.2 15 0.2 29 0.3 252 2.6 9,673 100
$80,000 or more
TABLE U-34A: TOTAL AMOUNT SAVED FOR COLLEGE BY SEGMENT, COURSE LOAD, AND DEPENDENCY STATUS
Less than $500 $500 to $999 $25,000 to $29,999
Source: California Student Aid Commission 218 2003-04 SEARS

INDEPENDENT UNDERGRADUATES
Nothing $1,000 to $2,999 $3,000 to $4,999 $5,000 to $9,999 $10,000 to $14,999 $15,000 to $19,999 $20,000 to $24,999 $30,000 to $34,999
# % # % # % # % # % # % # % # % # % # % # %CCC Part-time 1,262 79.5 60 3.8 33 2.1 59 3.7 31 2.0 38 2.4 20 1.3 15 0.9 14 0.9 12 0.8 4 0.3
Full-time 900 73.6 78 6.4 47 3.8 44 3.6 26 2.1 37 3.0 28 2.3 6 0.5 12 1.0 5 0.4 8 0.7 All 2,162 76.9 138 4.9 80 2.8 103 3.7 57 2.0 75 2.7 48 1.7 21 0.7 26 0.9 17 0.6 12 0.4
UC Part-time 32 56.1 4 7.0 4 7.0 6 10.5 2 3.5 6 10.5 1 1.8 1 1.8 - - 1 1.8 - - Full-time 155 55.4 16 5.7 16 5.7 23 8.2 14 5.0 16 5.7 12 4.3 4 1.4 9 3.2 3 1.1 2 0.7 All 187 55.5 20 5.9 20 5.9 29 8.6 16 4.7 22 6.5 13 3.9 5 1.5 9 2.7 4 1.2 2 0.6
CSU Part-time 350 67.8 35 6.8 22 4.3 38 7.4 19 3.7 19 3.7 9 1.7 7 1.4 4 0.8 2 0.4 3 0.6 Full-time 636 66.6 58 6.1 45 4.7 64 6.7 33 3.5 50 5.2 24 2.5 10 1.0 10 1.0 4 0.4 4 0.4 All 986 67.0 93 6.3 67 4.6 102 6.9 52 3.5 69 4.7 33 2.2 17 1.2 14 1.0 6 0.4 7 0.5
ICU Part-time 99 73.3 6 4.4 4 3.0 9 6.7 6 4.4 2 1.5 2 1.5 - - 2 1.5 3 2.2 - - Full-time 179 63.3 23 8.1 6 2.1 21 7.4 9 3.2 15 5.3 11 3.9 2 0.7 4 1.4 3 1.1 1 0.4 All 278 66.5 29 6.9 10 2.4 30 7.2 15 3.6 17 4.1 13 3.1 2 0.5 6 1.4 6 1.4 1 0.2
PCC Part-time 447 78.0 19 3.3 12 2.1 19 3.3 10 1.7 18 3.1 11 1.9 7 1.2 6 1.0 7 1.2 2 0.3 Full-time 1,331 78.8 62 3.7 43 2.5 56 3.3 34 2.0 39 2.3 39 2.3 12 0.7 15 0.9 10 0.6 12 0.7 All 1,778 78.6 81 3.6 55 2.4 75 3.3 44 1.9 57 2.5 50 2.2 19 0.8 21 0.9 17 0.8 14 0.6
ALL Part-time 2,190 76.3 124 4.3 75 2.6 131 4.6 68 2.4 83 2.9 43 1.5 30 1.0 26 0.9 25 0.9 9 0.3 Full-time 3,201 72.3 237 5.3 157 3.5 208 4.7 116 2.6 157 3.5 114 2.6 34 0.8 50 1.1 25 0.6 27 0.6 All 5,391 73.9 361 4.9 232 3.2 339 4.6 184 2.5 240 3.3 157 2.2 64 0.9 76 1.0 50 0.7 36 0.5
$35,000 to $39,999 $40,000 to $44,999 $45,000 to $49,999 $50,000 to $54,999 $55,000 to $59,999 $60,000 to $64,999 $65,000 to $69,999 $70,000 to $74,999 $75,000 to $79,999 Total
# % # % # % # % # % # % # % # % # % % # %CCC Part-time 2 0.1 9 0.6 2 0.1 5 0.3 1 0.1 2 0.1 - - 2 0.1 - - 17 1.1 1,588 100
Full-time 6 0.5 4 0.3 1 0.1 1 0.1 - - 2 0.2 3 0.2 1 0.1 - - 13 1.1 1,222 100 All 8 0.3 13 0.5 3 0.1 6 0.2 1 0.0 4 0.1 3 0.1 3 0.1 - - 30 1.1 2,810 100
UC Part-time - - - - - - - - - - - - - - - - - - - - 57 100 Full-time 1 0.4 2 0.7 - - - - - - - - - - 1 0.4 - - 6 2.1 280 100 All 1 0.3 2 0.6 - - - - - - - - - - 1 0.3 - - 6 1.8 337 100
CSU Part-time 1 0.2 1 0.2 - - 1 0.2 1 0.2 2 0.4 - - 1 0.2 - - 1 0.2 516 100 Full-time 2 0.2 3 0.3 - - 4 0.4 - - 2 0.2 - - 1 0.1 - - 5 0.5 955 100 All 3 0.2 4 0.3 - - 5 0.3 1 0.1 4 0.3 - - 2 0.1 - - 6 0.4 1,471 100
ICU Part-time - - 1 0.7 - - - - - - - - - - - - - - 1 0.7 135 100 Full-time 2 0.7 - - - - - - - - 2 0.7 - - 1 0.4 - - 4 1.4 283 100 All 2 0.5 1 0.2 - - - - - - 2 0.5 - - 1 0.2 - - 5 1.2 418 100
PCC Part-time 3 0.5 1 0.2 2 0.3 1 0.2 - - 1 0.2 - - - - 1 0.2 6 1.0 573 100 Full-time 7 0.4 5 0.3 3 0.2 4 0.2 1 0.1 4 0.2 - - 1 0.1 - - 12 0.7 1,690 100 All 10 0.4 6 0.3 5 0.2 5 0.2 1 0.0 5 0.2 - - 1 0.0 1 0.0 18 0.8 2,263 100
ALL Part-time 6 0.2 12 0.4 4 0.1 7 0.2 2 0.1 5 0.2 - - 3 0.1 1 0.0 25 0.9 2,869 100 Full-time 18 0.4 14 0.3 4 0.1 9 0.2 1 0.0 10 0.2 3 0.1 5 0.1 - - 40 0.9 4,430 100 All 24 0.3 26 0.4 8 0.1 16 0.2 3 0.0 15 0.2 3 0.0 8 0.1 1 0.0 65 0.9 7,299 100
$80,000 or more
TABLE U-34B: TOTAL AMOUNT SAVED FOR COLLEGE BY SEGMENT, COURSE LOAD, AND DEPENDENCY STATUS
Less than $500 $25,000 to $29,999$500 to $999
Source: California Student Aid Commission 219 2003-04 SEARS
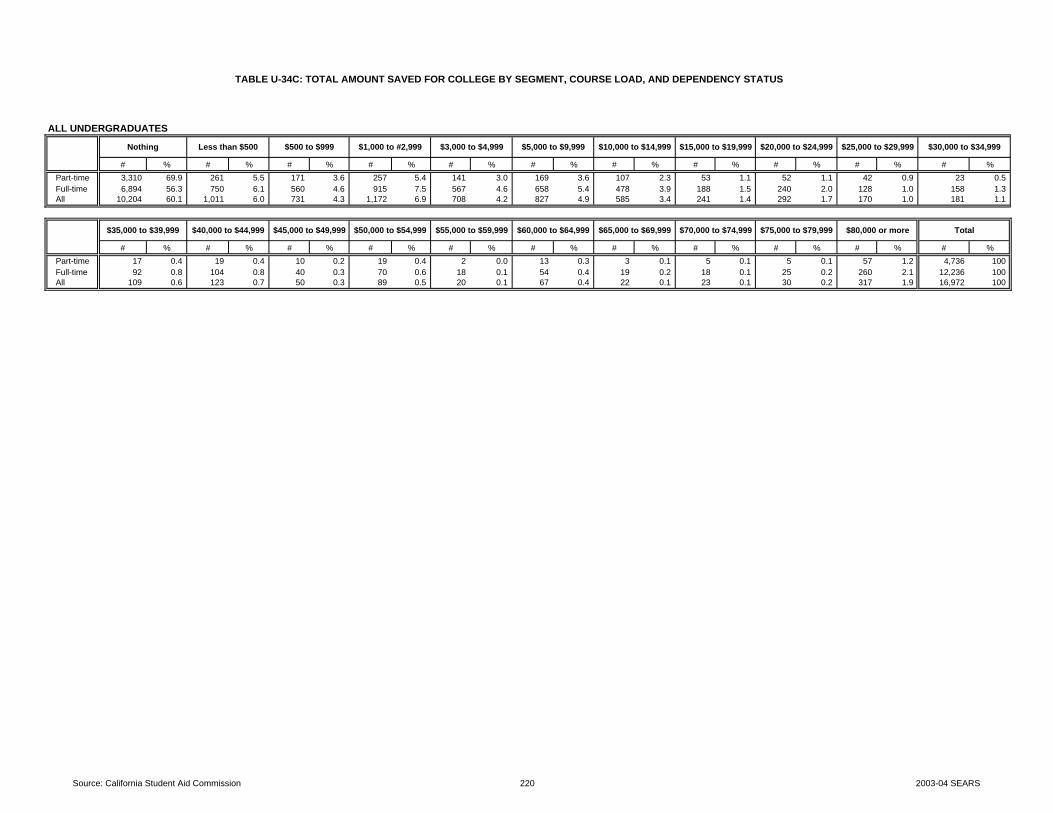
ALL UNDERGRADUATES
Nothing Less than $500 $500 to $999 $1,000 to #2,999 $3,000 to $4,999 $5,000 to $9,999 $10,000 to $14,999 $15,000 to $19,999 $20,000 to $24,999 $25,000 to $29,999 $30,000 to $34,999
# % # % # % # % # % # % # % # % # % # % # %Part-time 3,310 69.9 261 5.5 171 3.6 257 5.4 141 3.0 169 3.6 107 2.3 53 1.1 52 1.1 42 0.9 23 0.5 Full-time 6,894 56.3 750 6.1 560 4.6 915 7.5 567 4.6 658 5.4 478 3.9 188 1.5 240 2.0 128 1.0 158 1.3 All 10,204 60.1 1,011 6.0 731 4.3 1,172 6.9 708 4.2 827 4.9 585 3.4 241 1.4 292 1.7 170 1.0 181 1.1
$35,000 to $39,999 $40,000 to $44,999 $45,000 to $49,999 $50,000 to $54,999 $55,000 to $59,999 $60,000 to $64,999 $65,000 to $69,999 $70,000 to $74,999 $75,000 to $79,999 $80,000 or more Total
# % # % # % # % # % # % # % # % # % # % # %Part-time 17 0.4 19 0.4 10 0.2 19 0.4 2 0.0 13 0.3 3 0.1 5 0.1 5 0.1 57 1.2 4,736 100 Full-time 92 0.8 104 0.8 40 0.3 70 0.6 18 0.1 54 0.4 19 0.2 18 0.1 25 0.2 260 2.1 12,236 100 All 109 0.6 123 0.7 50 0.3 89 0.5 20 0.1 67 0.4 22 0.1 23 0.1 30 0.2 317 1.9 16,972 100
TABLE U-34C: TOTAL AMOUNT SAVED FOR COLLEGE BY SEGMENT, COURSE LOAD, AND DEPENDENCY STATUS
Source: California Student Aid Commission 220 2003-04 SEARS

DEPENDENT UNDERGRADUATES INDEPENDENT UNDERGRADUATES ALL UNDERGRADUATES
CCC Part-time 349 11,246$ 1,720$ CCC Part-time 326 13,495$ 3,709$ CCC Part-time 675 12,332$ 2,936$ Full-time 886 10,975$ 3,092$ Full-time 322 11,224$ 2,635$ Full-time 1,208 11,042$ 2,971$ All 1,235 11,052$ 1,882$ All 648 12,367$ 3,416$ All 1,883 11,504$ 2,950$
UC Part-time 163 11,781$ 3,658$ UC Part-time 25 5,060$ 2,482$ UC Part-time 188 10,887$ 3,481$ Full-time 1,299 16,805$ 6,714$ Full-time 125 11,984$ 4,233$ Full-time 1,424 16,382$ 6,412$ All 1,462 16,245$ 5,820$ All 150 10,830$ 3,726$ All 1,612 15,741$ 5,502$
CSU Part-time 77 8,964$ 3,026$ CSU Part-time 166 7,634$ 2,430$ CSU Part-time 243 8,056$ 2,597$ Full-time 733 11,507$ 4,082$ Full-time 319 8,294$ 2,671$ Full-time 1,052 10,533$ 3,577$
All 810 11,265$ 3,976$ All 485 8,068$ 2,577$ All 1,295 10,068$ 3,276$ ICU Part-time 46 29,859$ 10,350$ ICU Part-time 36 9,417$ 3,885$ ICU Part-time 82 20,884$ 6,332$ Full-time 777 23,062$ 8,740$ Full-time 104 11,353$ 3,172$ Full-time 881 21,680$ 7,747$
All 823 23,442$ 8,819$ All 140 10,855$ 3,442$ All 963 21,612$ 7,661$ PCC Part-time 112 13,563$ 3,247$ PCC Part-time 126 14,419$ 5,946$ PCC Part-time 238 14,016$ 4,393$ Full-time 418 13,056$ 2,699$ Full-time 359 12,495$ 3,788$ Full-time 777 12,797$ 3,220$
All 530 13,163$ 2,823$ All 485 12,995$ 4,237$ All 1,015 13,083$ 3,574$ ALL Part-time 747 12,621$ 2,609$ ALL Part-time 679 11,707$ 3,514$ ALL Part-time 1,426 12,185$ 2,962$
Full-time 4,113 15,406$ 4,255$ Full-time 1,229 10,923$ 2,856$ Full-time 5,342 14,375$ 3,943$ All 4,860 14,978$ 3,673$ All 1,908 11,202$ 3,238$ All 6,768 13,914$ 3,525$
Note: "Nothing" category was excluded from the means and median calculations.
TABLE M-34: MEAN AND MEDIAN TOTAL AMOUNT SAVED FOR COLLEGE BY SEGMENT, COURSE LOAD, AND DEPENDENCY STATUS
Number Mean Median Number MedianMean Median Number Mean
Source: California Student Aid Commission 221 2003-04 SEARS

Question for Tables: W-35 and U-35
If you, your parents, or others saved for you college education, which savings vehicles were used? Check all
that apply. 00 Personal Savings accounts 05 Certificate of Deposit 10 Other Qualified Tuition Savings Program 01 Custodial Savings Account 06 Roth IRA 11 Coverdell Education Savings Account 02 Savings Bonds 07 Trust Fund / Inheritance 12 I do not know 03 Money Market Account 08 A 529 Savings Program 04 Mutual Funds/Stocks 09 Golden State ScholarShare
222 2003-04 SEARS

TABLE W-35A : COLLEGE SAVINGS METHODS BY SEGMENT, COURSE LOAD, AND DEPENDENCY STATUS
DEPENDENT UNDERGRADUATES
PERSONAL SAVINGS ACCOUNT
CUSTODIAL SAVINGS ACCOUNT
SAVINGS BONDS MONEY MARKET ACCOUNT MUTUAL FUNDS CERTIFICATE OF
DEPOSIT (CD) ROTH IRA
# % % # % # % # % # % # %CCC Part-time 78,318 26.2 3,934 1.3 13,589 4.6 2,146 0.7 11,086 3.7 4,649 1.6 3,576 1.2
Full-time 71,359 30.3 3,019 1.3 15,576 6.6 3,502 1.5 10,263 4.4 3,985 1.7 2,173 0.9 All 149,677 28.0 6,952 1.3 29,165 5.5 5,647 1.1 21,349 4.0 8,634 1.6 5,750 1.1
UC Part-time 9,900 30.9 397 1.2 2,991 9.3 908 2.8 2,457 7.7 1,308 4.1 502 1.6 Full-time 50,958 31.9 2,811 1.8 14,981 9.4 6,290 3.9 20,199 12.7 6,633 4.2 3,312 2.1 All 60,858 31.8 3,208 1.7 17,972 9.4 7,198 3.8 22,656 11.8 7,941 4.1 3,814 2.0
CSU Part-time 6,829 36.5 470 2.5 1,140 6.1 783 4.2 1,403 7.5 504 2.7 115 0.6 Full-time 52,865 30.9 4,477 2.6 14,090 8.2 7,679 4.5 15,316 9.0 7,843 4.6 1,564 0.9 All 59,694 31.4 4,947 2.6 15,230 8.0 8,463 4.5 16,719 8.8 8,347 4.4 1,680 0.9
ICU Part-time 1,696 25.7 155 2.4 229 3.5 368 5.6 953 14.5 243 3.7 136 2.1 Full-time 31,904 28.5 1,647 1.5 9,868 8.8 4,489 4.0 12,902 11.5 4,341 3.9 1,679 1.5 All 33,600 28.3 1,802 1.5 10,097 8.5 4,857 4.1 13,855 11.7 4,584 3.9 1,814 1.5
PCC Part-time 1,579 33.1 67 1.4 247 5.2 62 1.3 248 5.2 28 0.6 - - Full-time 5,912 34.3 334 1.9 499 2.9 233 1.4 443 2.6 400 2.3 39 0.2 All 7,492 34.1 401 1.8 747 3.4 295 1.3 691 3.1 428 1.9 39 0.2
ALL Part-time 98,322 27.3 5,023 1.4 18,197 5.0 4,267 1.2 16,147 4.5 6,732 1.9 4,329 1.2 Full-time 212,998 30.6 12,288 1.8 55,014 7.9 22,192 3.2 59,123 8.5 23,200 3.3 8,767 1.3 All 311,321 29.5 17,310 1.6 73,211 6.9 26,460 2.5 75,270 7.1 29,933 2.8 13,096 1.2
TRUST FUND OR INHERITANCE
529 SAVINGS PLAN
GOLDEN STATE SCHOLARSHARE
TRUST
QUALIFIED TUITION SAVINGS
PROGRAMS
COVERDELL EDUCATION
SAVINGS ACCOUNT
I DO NOT KNOW Total
# % # % # % # % # % # % # %CCC Part-time 9,298 3.1 715 0.2 4,291 1.4 1,073 0.4 - - 165,934 55.6 298,609 100
Full-time 5,433 2.3 966 0.4 6,279 2.7 604 0.3 483 0.2 111,687 47.5 235,328 100 All 14,731 2.8 1,681 0.3 10,570 2.0 1,677 0.3 483 0.1 277,621 52.0 533,937 100
UC Part-time 874 2.7 70 0.2 1,287 4.0 421 1.3 - - 10,968 34.2 32,083 100 Full-time 5,232 3.3 453 0.3 9,447 5.9 619 0.4 180 0.1 38,385 24.1 159,499 100 All 6,105 3.2 524 0.3 10,734 5.6 1,040 0.5 180 0.1 49,353 25.8 191,583 100
CSU Part-time 269 1.4 - - 115 0.6 - - - - 7,104 37.9 18,733 100 Full-time 4,616 2.7 215 0.1 4,287 2.5 682 0.4 112 0.1 57,358 33.5 171,103 100 All 4,884 2.6 215 0.1 4,402 2.3 682 0.4 112 0.1 64,462 34.0 189,836 100
ICU Part-time 414 6.3 - - 71 1.1 7 0.1 - - 2,324 35.2 6,595 100 Full-time 4,382 3.9 392 0.4 2,507 2.2 720 0.6 110 0.1 37,113 33.1 112,053 100 All 4,795 4.0 392 0.3 2,577 2.2 727 0.6 110 0.1 39,437 33.2 118,648 100
PCC Part-time 117 2.5 - - 223 4.7 20 0.4 - - 2,176 45.6 4,767 100 Full-time 456 2.6 28 0.2 62 0.4 106 0.6 36 0.2 8,676 50.4 17,224 100 All 574 2.6 28 0.1 285 1.3 126 0.6 36 0.2 10,852 49.3 21,991 100
ALL Part-time 10,971 3.0 785 0.2 5,988 1.7 1,521 0.4 - - 188,505 52.2 360,787 100 Full-time 20,119 2.9 2,055 0.3 22,581 3.2 2,731 0.4 920 0.1 253,219 36.4 695,207 100 All 31,090 2.9 2,840 0.3 28,569 2.7 4,252 0.4 920 0.1 441,724 41.8 1,055,994 100
Source: California Student Aid Commission 223 2003-04 SEARS

TABLE W-35B : COLLEGE SAVINGS METHODS BY SEGMENT, COURSE LOAD, AND DEPENDENCY STATUS
INDEPENDENT UNDERGRADUATES
PERSONAL SAVINGS ACCOUNT
CUSTODIAL SAVINGS ACCOUNT
SAVINGS BONDS MONEY MARKET ACCOUNT MUTUAL FUNDS CERTIFICATE OF
DEPOSIT (CD) ROTH IRA
# % % # % # % # % # % # %CCC Part-time 103,351 28.2 2,146 0.6 8,583 2.3 5,007 1.4 9,298 2.5 7,510 2.0 4,649 1.3
Full-time 32,238 31.7 1,087 1.1 3,139 3.1 966 1.0 1,932 1.9 1,690 1.7 1,811 1.8 All 135,589 28.9 3,232 0.7 11,722 2.5 5,973 1.3 11,230 2.4 9,200 2.0 6,460 1.4
UC Part-time 1,398 54.2 - - 107 4.2 37 1.4 70 2.7 74 2.9 37 1.4 Full-time 4,231 35.3 86 0.7 801 6.7 455 3.8 1,160 9.7 774 6.5 172 1.4 All 5,629 38.7 86 0.6 908 6.2 492 3.4 1,230 8.5 848 5.8 209 1.4
CSU Part-time 15,665 43.7 25 0.1 1,024 2.9 1,049 2.9 1,787 5.0 541 1.5 471 1.3 Full-time 19,343 35.5 384 0.7 2,198 4.0 1,403 2.6 2,143 3.9 1,688 3.1 404 0.7 All 35,008 38.8 409 0.5 3,222 3.6 2,452 2.7 3,930 4.4 2,229 2.5 875 1.0
ICU Part-time 2,937 32.1 645 7.1 928 10.2 58 0.6 319 3.5 863 9.4 115 1.3 Full-time 3,799 29.6 70 0.5 660 5.1 588 4.6 814 6.3 164 1.3 185 1.4 All 6,735 30.6 715 3.3 1,588 7.2 646 2.9 1,134 5.2 1,027 4.7 301 1.4
PCC Part-time 3,639 27.5 11 0.1 557 4.2 517 3.9 708 5.3 417 3.1 300 2.3 Full-time 7,292 27.7 104 0.4 701 2.7 316 1.2 704 2.7 501 1.9 379 1.4 All 10,931 27.6 115 0.3 1,258 3.2 832 2.1 1,412 3.6 918 2.3 679 1.7
ALL Part-time 126,989 29.7 2,826 0.7 11,199 2.6 6,667 1.6 12,182 2.8 9,405 2.2 5,572 1.3 Full-time 66,902 32.3 1,731 0.8 7,499 3.6 3,728 1.8 6,753 3.3 4,818 2.3 2,951 1.4 All 193,891 30.5 4,557 0.7 18,698 2.9 10,395 1.6 18,936 3.0 14,223 2.2 8,523 1.3
TRUST FUND OR INHERITANCE
529 SAVINGS PLAN
GOLDEN STATE SCHOLARSHARE
TRUST
QUALIFIED TUITION SAVINGS
PROGRAMS
COVERDELL EDUCATION
SAVINGS ACCOUNT
I DO NOT KNOW Total
# % # % # % # % # % # % # %CCC Part-time 4,291 1.2 1,431 0.4 715 0.2 1,431 0.4 715 0.2 217,788 59.4 366,914 100
Full-time 1,087 1.1 241 0.2 604 0.6 362 0.4 121 0.1 56,266 55.4 101,544 100 All 5,378 1.1 1,672 0.4 1,319 0.3 1,793 0.4 836 0.2 274,054 58.5 468,458 100
UC Part-time - - - - 37 1.4 - - - - 817 31.7 2,577 100 Full-time 543 4.5 - - 303 2.5 124 1.0 - - 3,323 27.8 11,971 100 All 543 3.7 - - 340 2.3 124 0.8 - - 4,140 28.5 14,548 100
CSU Part-time 1,109 3.1 - - 127 0.4 577 1.6 111 0.3 13,320 37.2 35,806 100 Full-time 995 1.8 - - 26 0.0 606 1.1 26 0.0 25,210 46.3 54,426 100 All 2,104 2.3 - - 153 0.2 1,183 1.3 137 0.2 38,530 42.7 90,232 100
ICU Part-time 158 1.7 - - - - 185 2.0 - - 2,928 32.0 9,136 100 Full-time 505 3.9 70 0.5 185 1.4 139 1.1 70 0.5 5,589 43.5 12,838 100 All 662 3.0 70 0.3 185 0.8 324 1.5 70 0.3 8,517 38.8 21,974 100
PCC Part-time 77 0.6 9 0.1 225 1.7 424 3.2 131 1.0 6,237 47.1 13,251 100 Full-time 302 1.1 331 1.3 107 0.4 177 0.7 108 0.4 15,333 58.2 26,354 100 All 379 1.0 339 0.9 332 0.8 601 1.5 239 0.6 21,570 54.5 39,605 100
ALL Part-time 5,635 1.3 1,439 0.3 1,104 0.3 2,617 0.6 957 0.2 241,091 56.4 427,683 100 Full-time 3,431 1.7 642 0.3 1,224 0.6 1,407 0.7 325 0.2 105,721 51.0 207,134 100 All 9,066 1.4 2,081 0.3 2,328 0.4 4,024 0.6 1,282 0.2 346,812 54.6 634,817 100
Source: California Student Aid Commission 224 2003-04 SEARS

TABLE W-35C : ALL COLLEGE SAVINGS METHODS BY SEGMENT, COURSE LOAD, AND DEPENDENCY STATUS
ALL UNDERGRADUATES
PERSONAL SAVINGS ACCOUNT
CUSTODIAL SAVINGS ACCOUNT
SAVINGS BONDS MONEY MARKET ACCOUNT MUTUAL FUNDS CERTIFICATE OF
DEPOSIT (CD) ROTH IRA
# % % # % # % # % # % # %ALL Part-time 225,311 28.6 7,849 1.0 29,396 3.7 10,934 1.4 28,329 3.6 16,138 2.0 9,901 1.3
Full-time 279,901 31.0 14,018 1.6 62,513 6.9 25,921 2.9 65,876 7.3 28,018 3.1 11,718 1.3 All 505,212 29.9 21,867 1.3 91,909 5.4 36,854 2.2 94,205 5.6 44,156 2.6 21,619 1.3
TRUST FUND OR INHERITANCE
529 SAVINGS PLAN
GOLDEN STATE SCHOLARSHARE
TRUST
QUALIFIED TUITION SAVINGS
PROGRAMS
COVERDELL EDUCATION
SAVINGS ACCOUNT
I DO NOT KNOW Total
# % # % # % # % # % # % # %ALL Part-time 16,606 2.1 2,225 0.3 7,091 0.9 4,138 0.5 957 0.1 429,596 54.5 788,470 100
Full-time 23,550 2.6 2,697 0.3 23,806 2.6 4,138 0.5 1,245 0.1 358,940 39.8 902,341 100 All 40,156 2.4 4,922 0.3 30,897 1.8 8,276 0.5 2,202 0.1 788,536 46.6 1,690,812 100
Source: California Student Aid Commission 225 2003-04 SEARS

TABLE U-35A : COLLEGE SAVINGS METHODS BY SEGMENT, COURSE LOAD, AND DEPENDENCY STATUS
DEPENDENT UNDERGRADUATES
PERSONAL SAVINGS ACCOUNT
CUSTODIAL SAVINGS ACCOUNT
SAVINGS BONDS MONEY MARKET ACCOUNT MUTUAL FUNDS CERTIFICATE OF
DEPOSIT (CD) ROTH IRA
# % % # % # % # % # % # %CCC Part-time 219 26.2 11 1.3 38 4.6 6 0.7 31 3.7 13 1.6 10 1.2
Full-time 591 30.3 25 1.3 129 6.6 29 1.5 85 4.4 33 1.7 18 0.9 All 810 29.1 36 1.3 167 6.0 35 1.3 116 4.2 46 1.7 28 1.0
UC Part-time 165 31.3 7 1.3 47 8.9 16 3.0 44 8.3 22 4.2 9 1.7 Full-time 1,342 31.9 74 1.8 392 9.3 166 3.9 533 12.7 176 4.2 87 2.1 All 1,507 31.8 81 1.7 439 9.3 182 3.8 577 12.2 198 4.2 96 2.0
CSU Part-time 78 36.1 4 1.9 14 6.5 10 4.6 17 7.9 7 3.2 3 1.4 Full-time 674 31.4 52 2.4 178 8.3 88 4.1 198 9.2 100 4.7 18 0.8 All 752 31.8 56 2.4 192 8.1 98 4.1 215 9.1 107 4.5 21 0.9
ICU Part-time 57 27.1 5 2.4 10 4.8 10 4.8 34 16.2 7 3.3 4 1.9 Full-time 763 29.2 40 1.5 233 8.9 108 4.1 319 12.2 103 3.9 44 1.7 All 820 29.1 45 1.6 243 8.6 118 4.2 353 12.5 110 3.9 48 1.7
PCC Part-time 61 29.5 3 1.4 12 5.8 3 1.4 12 5.8 2 1.0 - - Full-time 248 31.4 11 1.4 32 4.1 15 1.9 29 3.7 18 2.3 2 0.3 All 309 31.0 14 1.4 44 4.4 18 1.8 41 4.1 20 2.0 2 0.2
ALL Part-time 580 29.1 30 1.5 121 6.1 45 2.3 138 6.9 51 2.6 26 1.3 Full-time 3,618 30.9 202 1.7 964 8.2 406 3.5 1,164 9.9 430 3.7 169 1.4 All 4,198 30.6 232 1.7 1,085 7.9 451 3.3 1,302 9.5 481 3.5 195 1.4
TRUST FUND OR INHERITANCE
529 SAVINGS PLAN
GOLDEN STATE SCHOLARSHARE
TRUST
QUALIFIED TUITION SAVINGS
PROGRAMS
COVERDELL EDUCATION
SAVINGS ACCOUNT
I DO NOT KNOW Total
# % # % # % # % # % # % # %CCC Part-time 26 3.1 2 0.2 12 1.4 3 0.4 - - 464 55.6 835 100
Full-time 45 2.3 8 0.4 52 2.7 5 0.3 4 0.2 925 47.5 1,949 100 All 71 2.6 10 0.4 64 2.3 8 0.3 4 0.1 1,389 49.9 2,784 100
UC Part-time 14 2.7 1 0.2 21 4.0 6 1.1 - - 176 33.3 528 100 Full-time 139 3.3 12 0.3 256 6.1 16 0.4 5 0.1 1,012 24.0 4,210 100 All 153 3.2 13 0.3 277 5.8 22 0.5 5 0.1 1,188 25.1 4,738 100
CSU Part-time 3 1.4 - - 3 1.4 - - - - 77 35.6 216 100 Full-time 61 2.8 3 0.1 54 2.5 7 0.3 2 0.1 714 33.2 2,149 100 All 64 2.7 3 0.1 57 2.4 7 0.3 2 0.1 791 33.4 2,365 100
ICU Part-time 12 5.7 - - 3 1.4 1 0.5 - - 67 31.9 210 100 Full-time 112 4.3 8 0.3 63 2.4 18 0.7 2 0.1 797 30.5 2,610 100 All 124 4.4 8 0.3 66 2.3 19 0.7 2 0.1 864 30.6 2,820 100
PCC Part-time 4 1.9 - - 2 1.0 2 1.0 - - 106 51.2 207 100 Full-time 22 2.8 2 0.3 4 0.5 6 0.8 2 0.3 399 50.5 790 100 All 26 2.6 2 0.2 6 0.6 8 0.8 2 0.2 505 50.7 997 100
ALL Part-time 59 3.0 3 0.2 41 2.1 12 0.6 - - 890 44.6 1,996 100 Full-time 379 3.2 33 0.3 429 3.7 52 0.4 15 0.1 3,847 32.9 11,708 100 All 438 3.2 36 0.3 470 3.4 64 0.5 15 0.1 4,737 34.6 13,704 100
Source: California Student Aid Commission 226 2003-04 SEARS

TABLE U-35B : COLLEGE SAVINGS METHODS BY SEGMENT, COURSE LOAD, AND DEPENDENCY STATUS
INDEPENDENT UNDERGRADUATES
PERSONAL SAVINGS ACCOUNT
CUSTODIAL SAVINGS ACCOUNT
SAVINGS BONDS MONEY MARKET ACCOUNT MUTUAL FUNDS CERTIFICATE OF
DEPOSIT (CD) ROTH IRA
# % % # % # % # % # % # %CCC Part-time 289 28.1 6 0.6 24 2.3 14 1.4 26 2.5 21 2.0 13 1.3
Full-time 267 31.8 9 1.1 26 3.1 8 1.0 16 1.9 14 1.7 15 1.8 All 556 29.8 15 0.8 50 2.7 22 1.2 42 2.2 35 1.9 28 1.5
UC Part-time 26 53.1 - - 2 4.1 1 2.0 1 2.0 2 4.1 1 2.0 Full-time 106 34.5 2 0.7 20 6.5 12 3.9 30 9.8 20 6.5 4 1.3 All 132 37.1 2 0.6 22 6.2 13 3.7 31 8.7 22 6.2 5 1.4
CSU Part-time 174 42.1 1 0.2 15 3.6 10 2.4 21 5.1 7 1.7 5 1.2 Full-time 266 36.3 6 0.8 32 4.4 18 2.5 29 4.0 27 3.7 7 1.0 All 440 38.4 7 0.6 47 4.1 28 2.4 50 4.4 34 3.0 12 1.0
ICU Part-time 41 33.6 2 1.6 7 5.7 1 0.8 6 4.9 5 4.1 2 1.6 Full-time 82 31.2 1 0.4 13 4.9 13 4.9 18 6.8 3 1.1 3 1.1 All 123 31.9 3 0.8 20 5.2 14 3.6 24 6.2 8 2.1 5 1.3
PCC Part-time 101 27.5 1 0.3 10 2.7 13 3.5 17 4.6 8 2.2 9 2.5 Full-time 246 25.2 3 0.3 22 2.3 16 1.6 28 2.9 22 2.3 13 1.3 All 347 25.8 4 0.3 32 2.4 29 2.2 45 3.4 30 2.2 22 1.6
ALL Part-time 631 31.9 10 0.5 58 2.9 39 2.0 71 3.6 43 2.2 30 1.5 Full-time 967 31.0 21 0.7 113 3.6 67 2.1 121 3.9 86 2.8 42 1.3 All 1,598 31.4 31 0.6 171 3.4 106 2.1 192 3.8 129 2.5 72 1.4
TRUST FUND OR INHERITANCE
529 SAVINGS PLAN
GOLDEN STATE SCHOLARSHARE
TRUST
QUALIFIED TUITION SAVINGS
PROGRAMS
COVERDELL EDUCATION
SAVINGS ACCOUNT
I DO NOT KNOW Total
# % # % # % # % # % # % # %CCC Part-time 12 1.2 4 0.4 4 0.4 4 0.4 2 0.2 609 59.2 1,028 100
Full-time 9 1.1 2 0.2 3 0.4 3 0.4 1 0.1 466 55.5 839 100 All 21 1.1 6 0.3 7 0.4 7 0.4 3 0.2 1,075 57.6 1,867 100
UC Part-time - - - - 1 2.0 - - - - 15 30.6 49 100 Full-time 13 4.2 - - 8 2.6 3 1.0 - - 89 29.0 307 100 All 13 3.7 - - 9 2.5 3 0.8 - - 104 29.2 356 100
CSU Part-time 12 2.9 - - 1 0.2 9 2.2 2 0.5 156 37.8 413 100 Full-time 14 1.9 - - 1 0.1 7 1.0 1 0.1 324 44.3 732 100 All 26 2.3 - - 2 0.2 16 1.4 3 0.3 480 41.9 1,145 100
ICU Part-time 3 2.5 - - - - 3 2.5 - - 52 42.6 122 100 Full-time 10 3.8 1 0.4 3 1.1 2 0.8 1 0.4 113 43.0 263 100 All 13 3.4 1 0.3 3 0.8 5 1.3 1 0.3 165 42.9 385 100
PCC Part-time 5 1.4 1 0.3 3 0.8 8 2.2 1 0.3 190 51.8 367 100 Full-time 14 1.4 7 0.7 4 0.4 6 0.6 5 0.5 590 60.5 976 100 All 19 1.4 8 0.6 7 0.5 14 1.0 6 0.4 780 58.1 1,343 100
ALL Part-time 32 1.6 5 0.3 9 0.5 24 1.2 5 0.3 1,022 51.6 1,979 100 Full-time 60 1.9 10 0.3 19 0.6 21 0.7 8 0.3 1,582 50.8 3,117 100 All 92 1.8 15 0.3 28 0.5 45 0.9 13 0.3 2,604 51.1 5,096 100
Source: California Student Aid Commission 227 2003-04 SEARS

TABLE U-35C : ALL COLLEGE SAVINGS METHODS BY SEGMENT, COURSE LOAD, AND DEPENDENCY STATUS
ALL UNDERGRADUATES
PERSONAL SAVINGS ACCOUNT
CUSTODIAL SAVINGS ACCOUNT
SAVINGS BONDS MONEY MARKET ACCOUNT MUTUAL FUNDS CERTIFICATE OF
DEPOSIT (CD) ROTH IRA
# % % # % # % # % # % # %ALL Part-time 1,211 30.5 40 1.0 179 4.5 84 2.1 209 5.3 94 2.4 56 1.4
Full-time 4,585 30.9 223 1.5 1,077 7.3 473 3.2 1,285 8.7 516 3.5 211 1.4 All 5,796 30.8 263 1.4 1,256 6.7 557 3.0 1,494 7.9 610 3.2 267 1.4
TRUST FUND OR INHERITANCE
529 SAVINGS PLAN
GOLDEN STATE SCHOLARSHARE
TRUST
QUALIFIED TUITION SAVINGS
PROGRAMS
COVERDELL EDUCATION
SAVINGS ACCOUNT
I DO NOT KNOW Total
# % # % # % # % # % # % # %ALL Part-time 91 2.3 8 0.2 50 1.3 36 0.9 5 0.1 1,912 48.1 3,975 100
Full-time 439 3.0 43 0.3 448 3.0 73 0.5 23 0.2 5,429 36.6 14,825 100 All 530 2.8 51 0.3 498 2.6 109 0.6 28 0.1 7,341 39.0 18,800 100
Source: California Student Aid Commission 228 2003-04 SEARS

Question for Tables: W-36 and U-36
Which of the following statements best describes your current housing arrangement? 0 I have a campus-owned housing contract which includes both room and food (meal and/or points plan).
1 I have a campus-owned housing contract which does not include food (meal and/or points plan).
2 I do not have a campus-owned housing contract.
NOTE: This question was not asked on CCC or PCC questionnaires. 229 2003-04 SEARS

TABLE W-36: CURRENT CAMPUS HOUSING ARRANGEMENT BY SEGMENT, COURSE LOAD, AND DEPENDENCY STATUS
Room and Board Contract Room Contract Only No Housing ContractDependent Independent All Dependent Independent All Dependent Independent All# % # % # % # % # % # % # % # % # % # %
UC Part-time 9,257 28.9 405 1.3 9,662 30.2 8,309 26.0 1,447 4.5 9,756 30.5 10,519 32.9 2,059 6.4 12,578 39.3 31,996 100 Full-time 38,718 30.4 1,634 1.3 40,352 31.7 47,768 37.5 4,925 3.9 52,693 41.4 27,077 21.3 7,266 5.7 34,343 27.0 127,388 100 All 47,975 30.1 2,039 1.3 50,014 31.4 56,077 35.2 6,372 4.0 62,449 39.2 37,596 23.6 9,325 5.9 46,921 29.4 159,384 100
CSU Part-time - - 158 0.2 158 0.2 429 0.6 352 0.5 781 1.1 19,049 27.9 48,271 70.7 67,320 98.6 68,259 100 Full-time 14,592 6.3 955 0.4 15,547 6.7 8,610 3.7 1,139 0.5 9,749 4.2 127,231 55.2 77,884 33.8 205,115 89.0 230,411 100 All 14,592 4.9 1,113 0.4 15,705 5.3 9,038 3.0 1,491 0.5 10,530 3.5 146,280 49.0 126,155 42.2 272,435 91.2 298,670 100
ICU Part-time 2,368 15.7 155 1.0 2,523 16.7 390 2.6 58 0.4 448 3.0 2,518 16.7 9,593 63.6 12,111 80.3 15,082 100 Full-time 47,091 43.3 2,326 2.1 49,417 45.4 11,178 10.3 966 0.9 12,144 11.2 33,056 30.4 14,180 13.0 47,236 43.4 108,797 100 All 49,459 39.9 2,481 2.0 51,940 41.9 11,568 9.3 1,023 0.8 12,592 10.2 35,574 28.7 23,773 19.2 59,347 47.9 123,878 100
ALL Part-time 11,625 10.1 718 0.6 12,342 10.7 9,128 7.9 1,857 1.6 10,985 9.5 32,086 27.8 59,923 52.0 92,009 79.8 115,336 100 Full-time 100,401 21.5 4,915 1.1 105,316 22.6 67,556 14.5 7,030 1.5 74,585 16.0 187,364 40.2 99,330 21.3 286,694 61.4 466,596 100 All 112,026 19.3 5,633 1.0 117,659 20.2 76,684 13.2 8,886 1.5 85,570 14.7 219,450 37.7 159,254 27.4 378,703 65.1 581,932 100
Total
Source: California Student Aid Commission 230 2003-04 SEARS

TABLE U-36: CURRENT CAMPUS HOUSING ARRANGEMENT BY SEGMENT, COURSE LOAD, AND DEPENDENCY STATUS
Room and Board Contract Room Contract Only No Housing ContractDependent Independent All Dependent Independent All Dependent Independent All# % # % # % # % # % # % # % # % # % # %
UC Part-time 149 28.3 7 1.3 156 29.6 138 26.2 26 4.9 164 31.1 168 31.9 39 7.4 207 39.3 527 100 Full-time 1,041 31.0 44 1.3 1,085 32.4 1,214 36.2 125 3.7 1,339 39.9 739 22.0 190 5.7 929 27.7 3,353 100 All 1,190 30.7 51 1.3 1,241 32.0 1,352 34.8 151 3.9 1,503 38.7 907 23.4 229 5.9 1,136 29.3 3,880 100
CSU Part-time - - 3 0.4 3 0.4 8 1.0 5 0.6 13 1.6 207 25.9 575 72.1 782 98.0 798 100 Full-time 249 8.4 21 0.7 270 9.1 133 4.5 24 0.8 157 5.3 1,502 50.4 1,052 35.3 2,554 85.7 2,981 100 All 249 6.6 24 0.6 273 7.2 141 3.7 29 0.8 170 4.5 1,709 45.2 1,627 43.1 3,336 88.3 3,779 100
ICU Part-time 99 31.2 6 1.9 105 33.1 7 2.2 2 0.6 9 2.8 49 15.5 154 48.6 203 64.0 317 100 Full-time 1,102 45.9 49 2.0 1,151 48.0 240 10.0 21 0.9 261 10.9 700 29.2 288 12.0 988 41.2 2,400 100 All 1,201 44.2 55 2.0 1,256 46.2 247 9.1 23 0.8 270 9.9 749 27.6 442 16.3 1,191 43.8 2,717 100
ALL Part-time 248 15.1 16 1.0 264 16.1 153 9.3 33 2.0 186 11.3 424 25.8 768 46.8 1,192 72.6 1,642 100 Full-time 2,392 27.4 114 1.3 2,506 28.7 1,587 18.2 170 1.9 1,757 20.1 2,941 33.7 1,530 17.5 4,471 51.2 8,734 100 All 2,640 25.4 130 1.3 2,770 26.7 1,740 16.8 203 2.0 1,943 18.7 3,365 32.4 2,298 22.1 5,663 54.6 10,376 100
Total
Source: California Student Aid Commission 231 2003-04 SEARS

Question for Tables: W-37, U-37, and M-37
What is the cost of your room and food contract? Monthly Average OR Current Academic Year 0 Under $300 Under $2,700 1 $300 to $399 $2,700 to $3,599 2 $400 to $499 $3,600 to $4,499 3 $500 to $599 $4,500 to $5,399 4 $600 to $699 $5,400 to $6,299 5 $700 to $799 $6,300 to $7,199 6 $800 to $899 $7,200 to $8,099 7 $900 to $999 $8,100 to $8,999 8 $1,000 or more $9,000 or more
NOTE: This question was not asked on CCC or PCC questionnaires. This question was answered only by students who have a campus owned housing and food contract. 232 2003-04 SEARS
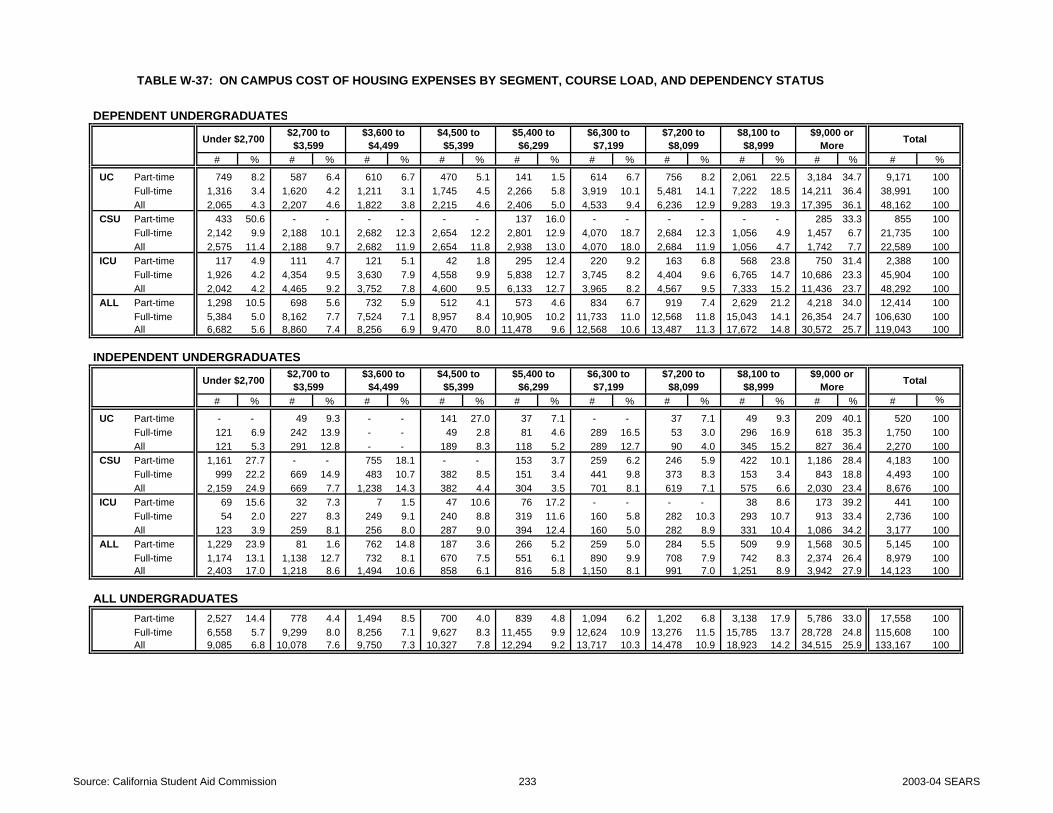
TABLE W-37: ON CAMPUS COST OF HOUSING EXPENSES BY SEGMENT, COURSE LOAD, AND DEPENDENCY STATUS
DEPENDENT UNDERGRADUATES
Under $2,700 $2,700 to $3,599
$3,600 to $4,499
$4,500 to $5,399
$5,400 to $6,299
$6,300 to $7,199
$7,200 to $8,099
$8,100 to $8,999
$9,000 or More
# % # % # % # % # % # % # % # % # % #
UC Part-time 749 8.2 587 6.4 610 6.7 470 5.1 141 1.5 614 6.7 756 8.2 2,061 22.5 3,184 34.7 9,171 100 Full-time 1,316 3.4 1,620 4.2 1,211 3.1 1,745 4.5 2,266 5.8 3,919 10.1 5,481 14.1 7,222 18.5 14,211 36.4 38,991 100 All 2,065 4.3 2,207 4.6 1,822 3.8 2,215 4.6 2,406 5.0 4,533 9.4 6,236 12.9 9,283 19.3 17,395 36.1 48,162 100
CSU Part-time 433 50.6 - - - - - - 137 16.0 - - - - - - 285 33.3 855 100 Full-time 2,142 9.9 2,188 10.1 2,682 12.3 2,654 12.2 2,801 12.9 4,070 18.7 2,684 12.3 1,056 4.9 1,457 6.7 21,735 100 All 2,575 11.4 2,188 9.7 2,682 11.9 2,654 11.8 2,938 13.0 4,070 18.0 2,684 11.9 1,056 4.7 1,742 7.7 22,589 100
ICU Part-time 117 4.9 111 4.7 121 5.1 42 1.8 295 12.4 220 9.2 163 6.8 568 23.8 750 31.4 2,388 100 Full-time 1,926 4.2 4,354 9.5 3,630 7.9 4,558 9.9 5,838 12.7 3,745 8.2 4,404 9.6 6,765 14.7 10,686 23.3 45,904 100 All 2,042 4.2 4,465 9.2 3,752 7.8 4,600 9.5 6,133 12.7 3,965 8.2 4,567 9.5 7,333 15.2 11,436 23.7 48,292 100
ALL Part-time 1,298 10.5 698 5.6 732 5.9 512 4.1 573 4.6 834 6.7 919 7.4 2,629 21.2 4,218 34.0 12,414 100 Full-time 5,384 5.0 8,162 7.7 7,524 7.1 8,957 8.4 10,905 10.2 11,733 11.0 12,568 11.8 15,043 14.1 26,354 24.7 106,630 100 All 6,682 5.6 8,860 7.4 8,256 6.9 9,470 8.0 11,478 9.6 12,568 10.6 13,487 11.3 17,672 14.8 30,572 25.7 119,043 100
INDEPENDENT UNDERGRADUATES
Under $2,700 $2,700 to $3,599
$3,600 to $4,499
$4,500 to $5,399
$5,400 to $6,299
$6,300 to $7,199
$7,200 to $8,099
$8,100 to $8,999
$9,000 or More
# % # % # % # % # % # % # % # % # % #
UC Part-time - - 49 9.3 - - 141 27.0 37 7.1 - - 37 7.1 49 9.3 209 40.1 520 100 Full-time 121 6.9 242 13.9 - - 49 2.8 81 4.6 289 16.5 53 3.0 296 16.9 618 35.3 1,750 100 All 121 5.3 291 12.8 - - 189 8.3 118 5.2 289 12.7 90 4.0 345 15.2 827 36.4 2,270 100
CSU Part-time 1,161 27.7 - - 755 18.1 - - 153 3.7 259 6.2 246 5.9 422 10.1 1,186 28.4 4,183 100 Full-time 999 22.2 669 14.9 483 10.7 382 8.5 151 3.4 441 9.8 373 8.3 153 3.4 843 18.8 4,493 100 All 2,159 24.9 669 7.7 1,238 14.3 382 4.4 304 3.5 701 8.1 619 7.1 575 6.6 2,030 23.4 8,676 100
ICU Part-time 69 15.6 32 7.3 7 1.5 47 10.6 76 17.2 - - - - 38 8.6 173 39.2 441 100 Full-time 54 2.0 227 8.3 249 9.1 240 8.8 319 11.6 160 5.8 282 10.3 293 10.7 913 33.4 2,736 100 All 123 3.9 259 8.1 256 8.0 287 9.0 394 12.4 160 5.0 282 8.9 331 10.4 1,086 34.2 3,177 100
ALL Part-time 1,229 23.9 81 1.6 762 14.8 187 3.6 266 5.2 259 5.0 284 5.5 509 9.9 1,568 30.5 5,145 100 Full-time 1,174 13.1 1,138 12.7 732 8.1 670 7.5 551 6.1 890 9.9 708 7.9 742 8.3 2,374 26.4 8,979 100 All 2,403 17.0 1,218 8.6 1,494 10.6 858 6.1 816 5.8 1,150 8.1 991 7.0 1,251 8.9 3,942 27.9 14,123 100
ALL UNDERGRADUATESPart-time 2,527 14.4 778 4.4 1,494 8.5 700 4.0 839 4.8 1,094 6.2 1,202 6.8 3,138 17.9 5,786 33.0 17,558 100 Full-time 6,558 5.7 9,299 8.0 8,256 7.1 9,627 8.3 11,455 9.9 12,624 10.9 13,276 11.5 15,785 13.7 28,728 24.8 115,608 100 All 9,085 6.8 10,078 7.6 9,750 7.3 10,327 7.8 12,294 9.2 13,717 10.3 14,478 10.9 18,923 14.2 34,515 25.9 133,167 100
Total
Total
%
%
Source: California Student Aid Commission 233 2003-04 SEARS

TABLE U-37: ON CAMPUS COST OF HOUSING EXPENSES BY SEGMENT, COURSE LOAD, AND DEPENDENCY STATUS
DEPENDENT UNDERGRADUATES
Under $2,700 $2,700 to $3,599
$3,600 to $4,499
$4,500 to $5,399
$5,400 to $6,299
$6,300 to $7,199
$7,200 to $8,099
$8,100 to $8,999
$9,000 or More
# % # % # % # % # % # % # % # % # % #
UC Part-time 12 8.2 10 6.8 9 6.1 7 4.8 2 1.4 10 6.8 12 8.2 32 21.8 53 36.1 147 100 Full-time 36 3.4 40 3.8 33 3.2 46 4.4 59 5.6 114 10.9 156 14.9 193 18.5 368 35.2 1,045 100 All 48 4.0 50 4.2 42 3.5 53 4.4 61 5.1 124 10.4 168 14.1 225 18.9 421 35.3 1,192 100
CSU Part-time 2 40.0 - - - - - - 1 20.0 - - - - - - 2 40.0 5 100 Full-time 27 8.6 37 11.8 45 14.4 36 11.5 44 14.1 51 16.3 38 12.1 15 4.8 20 6.4 313 100 All 29 9.1 37 11.6 45 14.2 36 11.3 45 14.2 51 16.0 38 11.9 15 4.7 22 6.9 318 100
ICU Part-time 3 3.2 6 6.4 7 7.4 5 5.3 8 8.5 9 9.6 8 8.5 26 27.7 22 23.4 94 100 Full-time 47 4.5 88 8.4 85 8.2 115 11.0 98 9.4 87 8.3 110 10.6 163 15.6 249 23.9 1,042 100 All 50 4.4 94 8.3 92 8.1 120 10.6 106 9.3 96 8.5 118 10.4 189 16.6 271 23.9 1,136 100
ALL Part-time 17 6.9 16 6.5 16 6.5 12 4.9 11 4.5 19 7.7 20 8.1 58 23.6 77 31.3 246 100 Full-time 110 4.6 165 6.9 163 6.8 197 8.2 201 8.4 252 10.5 304 12.7 371 15.5 637 26.5 2,400 100 All 127 4.8 181 6.8 179 6.8 209 7.9 212 8.0 271 10.2 324 12.2 429 16.2 714 27.0 2,646 100
INDEPENDENT UNDERGRADUATES
Under $2,700 $2,700 to $3,599
$3,600 to $4,499
$4,500 to $5,399
$5,400 to $6,299
$6,300 to $7,199
$7,200 to $8,099
$8,100 to $8,999
$9,000 or More
# % # % # % # % # % # % # % # % # % #
UC Part-time - - 1 10.0 - - 2 20.0 1 10.0 - - 1 10.0 1 10.0 4 40.0 10 100 Full-time 3 6.4 6 12.8 - - 1 2.1 2 4.3 9 19.1 2 4.3 8 17.0 16 34.0 47 100 All 3 5.3 7 12.3 - - 3 5.3 3 5.3 9 15.8 3 5.3 9 15.8 20 35.1 57 100
CSU Part-time 9 25.7 - - 8 22.9 - - 2 5.7 3 8.6 1 2.9 3 8.6 9 25.7 35 100 Full-time 9 16.7 7 13.0 8 14.8 6 11.1 4 7.4 2 3.7 5 9.3 2 3.7 11 20.4 54 100 All 18 20.2 7 7.9 16 18.0 6 6.7 6 6.7 5 5.6 6 6.7 5 5.6 20 22.5 89 100
ICU Part-time - - 1 11.1 1 11.1 1 11.1 2 22.2 - - - - 1 11.1 3 33.3 9 100 Full-time 2 3.8 5 9.6 4 7.7 6 11.5 2 3.8 3 5.8 4 7.7 7 13.5 19 36.5 52 100 All 2 3.3 6 9.8 5 8.2 7 11.5 4 6.6 3 4.9 4 6.6 8 13.1 22 36.1 61 100
ALL Part-time 9 16.7 2 3.7 9 16.7 3 5.6 5 9.3 3 5.6 2 3.7 5 9.3 16 29.6 54 100 Full-time 14 9.2 18 11.8 12 7.8 13 8.5 8 5.2 14 9.2 11 7.2 17 11.1 46 30.1 153 100 All 23 11.1 20 9.7 21 10.1 16 7.7 13 6.3 17 8.2 13 6.3 22 10.6 62 30.0 207 100
ALL UNDERGRADUATESPart-time 26 8.7 18 6.0 25 8.3 15 5.0 16 5.3 22 7.3 22 7.3 63 21.0 93 31.0 300 100 Full-time 124 4.9 183 7.2 175 6.9 210 8.2 209 8.2 266 10.4 315 12.3 388 15.2 683 26.8 2,553 100 All 150 5.3 201 7.0 200 7.0 225 7.9 225 7.9 288 10.1 337 11.8 451 15.8 776 27.2 2,853 100
Total
%
Total
%
Source: California Student Aid Commission 234 2003-04 SEARS

DEPENDENT UNDERGRADUATES INDEPENDENT UNDERGRADUATES ALL UNDERGRADUATES
UC Part-time 147 7,240$ 8,387$ UC Part-time 10 7,290$ 2,701$ UC Part-time 157 7,243$ 8,376$ Full-time 1,045 7,628$ 8,340$ Full-time 47 7,133$ 8,219$ Full-time 1,092 7,607$ 8,336$ All 1,192 7,581$ 8,351$ All 57 7,161$ 8,148$ All 1,249 7,561$ 8,344$
CSU Part-time 5 5,490$ 3,588$ CSU Part-time 35 5,567$ 6,378$ CSU Part-time 40 5,558$ 4,702$ Full-time 313 5,505$ 5,785$ Full-time 54 5,417$ 4,725$ Full-time 367 5,492$ 5,678$
All 318 5,505$ 5,765$ All 89 5,476$ 5,139$ All 407 5,498$ 5,700$ ICU Part-time 94 7,181$ 8,295$ ICU Part-time 9 6,750$ 6,186$ ICU Part-time 103 7,143$ 8,269$ Full-time 1,042 6,721$ 6,935$ Full-time 52 7,044$ 7,582$ Full-time 1,094 6,736$ 6,974$
All 1,136 6,759$ 7,015$ All 61 7,001$ 7,552$ All 1,197 6,771$ 7,046$ ALL Part-time 246 7,182$ 8,318$ ALL Part-time 54 6,083$ 6,283$ ALL Part-time 300 6,984$ 8,135$
Full-time 2,400 6,957$ 7,246$ Full-time 153 6,497$ 6,527$ Full-time 2,553 6,930$ 7,198$ All 2,646 6,978$ 7,346$ All 207 6,389$ 6,472$ All 2,853 6,935$ 7,279$
TABLE M-37: MEAN AND MEDIAN ON CAMPUS COST OF HOUSING EXPENSES BY SEGMENT, COURSE LOAD, AND DEPENDENCY STATUS
Number Mean Median Number MedianMean Median Number Mean
Source: California Student Aid Commission 235 2003-04 SEARS

Question for Tables: W-38, U-38, and M-38
What are your monthly expenses for food that you buy in addition to that provided in your housing
contract (e.g., restaurant meals, buying snacks or groceries)? 00 Nothing 04 $75 to $99 08 $200 to $249 01 Under $25 05 $100 to $124 09 $250 to $299 02 $25 to $49 06 $125 to $149 10 $300 or more 03 $50 to $74 07 $150 to $199
NOTE: This question was not asked on CCC or PCC questionnaires. 236 2003-04 SEARS

TABLE W-38: MONTHLY FOOD EXPENSES NOT INCLUDED IN HOUSING CONTRACT BY SEGMENT, COURSE LOAD, AND DEPENDENCY STATUS
DEPENDENT UNDERGRADUATES
Nothing Under $25 $25 to $49 $50 to $74 $75 to $99 $100 to $124 $125 to $149 $150 to $199 $200 to $249 $250 to $299 $300 or More Total
# % # % # % # % # % # % # % # % # % # % # % #
UC Part-time 560 6.1 944 10.2 1,481 16.0 1,747 18.9 1,218 13.2 1,263 13.7 582 6.3 555 6.0 400 4.3 - - 492 5.3 9,242 100 Full-time 605 1.5 4,899 12.4 8,259 20.9 7,845 19.8 4,402 11.1 5,252 13.3 2,824 7.1 1,492 3.8 2,097 5.3 289 0.7 1,580 4.0 39,543 100 All 1,165 2.4 5,842 12.0 9,741 20.0 9,592 19.7 5,621 11.5 6,514 13.4 3,406 7.0 2,047 4.2 2,496 5.1 289 0.6 2,072 4.2 48,785 100
CSU Part-time 28 3.3 - - - - 433 50.1 - - - - - - 137 15.9 - - 26 3.1 239 27.6 863 100 Full-time 1,253 5.4 1,822 7.8 4,584 19.7 4,224 18.2 1,935 8.3 3,105 13.4 1,460 6.3 770 3.3 1,775 7.6 614 2.6 1,713 7.4 23,254 100 All 1,281 5.3 1,822 7.6 4,584 19.0 4,657 19.3 1,935 8.0 3,105 12.9 1,460 6.1 907 3.8 1,775 7.4 641 2.7 1,952 8.1 24,117 100
ICU Part-time - - 294 12.1 626 25.6 603 24.7 132 5.4 198 8.1 172 7.0 160 6.5 113 4.6 - - 144 5.9 2,442 100 Full-time 869 1.9 5,290 11.5 9,395 20.4 7,735 16.8 5,119 11.1 7,120 15.4 2,348 5.1 2,532 5.5 3,042 6.6 622 1.3 2,053 4.5 46,123 100 All 869 1.8 5,584 11.5 10,022 20.6 8,337 17.2 5,250 10.8 7,318 15.1 2,520 5.2 2,691 5.5 3,155 6.5 622 1.3 2,197 4.5 48,565 100
ALL Part-time 588 4.7 1,238 9.9 2,107 16.8 2,783 22.2 1,350 10.8 1,461 11.6 754 6.0 852 6.8 513 4.1 26 0.2 874 7.0 12,547 100 Full-time 2,726 2.5 12,010 11.0 22,239 20.4 19,804 18.2 11,456 10.5 15,477 14.2 6,632 6.1 4,793 4.4 6,913 6.3 1,525 1.4 5,346 4.9 108,920 100 All 3,314 2.7 13,248 10.9 24,346 20.0 22,586 18.6 12,805 10.5 16,938 13.9 7,385 6.1 5,645 4.6 7,426 6.1 1,552 1.3 6,220 5.1 121,467 100
INDEPENDENT UNDERGRADUATES
Nothing Under $25 $25 to $49 $50 to $74 $75 to $99 $100 to $124 $125 to $149 $150 to $199 $200 to $249 $250 to $299 $300 or More Total
# % # % # % # % # % # % # % # % # % # % # % # %
UC Part-time 49 10.1 - - 70 14.7 49 10.1 - - 49 10.1 37 7.7 49 10.1 - - 107 22.4 70 14.7 479 100 Full-time 49 2.7 168 9.4 306 17.1 306 17.1 132 7.4 275 15.4 165 9.2 81 4.5 155 8.6 64 3.6 91 5.1 1,791 100 All 97 4.3 168 7.4 376 16.6 355 15.6 132 5.8 324 14.3 202 8.9 130 5.7 155 6.8 171 7.5 161 7.1 2,270 100
CSU Part-time 190 3.9 - - 78 1.6 758 15.4 344 7.0 324 6.6 190 3.9 690 14.0 1,021 20.7 169 3.4 1,171 23.7 4,934 100 Full-time 398 7.5 38 0.7 390 7.4 606 11.4 244 4.6 760 14.3 166 3.1 652 12.3 554 10.5 74 1.4 1,415 26.7 5,296 100 All 588 5.7 38 0.4 467 4.6 1,364 13.3 589 5.8 1,084 10.6 356 3.5 1,342 13.1 1,575 15.4 243 2.4 2,585 25.3 10,230 100
ICU Part-time - - 7 1.7 22 5.4 69 17.2 38 9.5 54 13.6 70 17.5 7 1.7 52 13.2 47 11.7 34 8.4 399 100 Full-time 55 1.9 178 6.2 677 23.4 210 7.3 410 14.2 284 9.8 371 12.8 121 4.2 266 9.2 - - 319 11.0 2,892 100 All 55 1.7 185 5.6 698 21.2 279 8.5 448 13.6 339 10.3 441 13.4 128 3.9 318 9.7 47 1.4 352 10.7 3,290 100
ALL Part-time 239 4.1 7 0.1 169 2.9 875 15.1 382 6.6 427 7.3 297 5.1 745 12.8 1,073 18.5 323 5.6 1,274 21.9 5,812 100 Full-time 501 5.0 384 3.8 1,373 13.8 1,122 11.2 786 7.9 1,319 13.2 701 7.0 854 8.6 975 9.8 138 1.4 1,825 18.3 9,978 100 All 740 4.7 390 2.5 1,542 9.8 1,997 12.6 1,169 7.4 1,746 11.1 999 6.3 1,599 10.1 2,048 13.0 461 2.9 3,099 19.6 15,790 100
ALL UNDERGRADUATESPart-time 827 4.5 1,245 6.8 2,277 12.4 3,658 19.9 1,732 9.4 1,887 10.3 1,051 5.7 1,598 8.7 1,586 8.6 349 1.9 2,148 11.7 18,358 100 Full-time 3,227 2.7 12,393 10.4 23,612 19.9 20,926 17.6 12,242 10.3 16,796 14.1 7,333 6.2 5,647 4.7 7,888 6.6 1,663 1.4 7,171 6.0 118,899 100 All 4,054 3.0 13,638 9.9 25,889 18.9 24,584 17.9 13,974 10.2 18,684 13.6 8,384 6.1 7,245 5.3 9,474 6.9 2,012 1.5 9,319 6.8 137,257 100
%
Source: California Student Aid Commission 237 2003-04 SEARS

TABLE U-38: MONTHLY FOOD EXPENSES NOT INCLUDED IN HOUSING CONTRACT BY SEGMENT, COURSE LOAD, AND DEPENDENCY STATUS
DEPENDENT UNDERGRADUATES
Nothing Under $25 $25 to $49 $50 to $74 $75 to $99 $100 to $124 $125 to $149 $150 to $199 $200 to $249 $250 to $299 $300 or More Total
# % # % # % # % # % # % # % # % # % # % # % #
UC Part-time 9 6.1 15 10.1 25 16.9 28 18.9 20 13.5 20 13.5 9 6.1 9 6.1 6 4.1 - - 7 4.7 148 100 Full-time 16 1.5 128 12.1 224 21.2 211 19.9 115 10.9 142 13.4 75 7.1 40 3.8 57 5.4 8 0.8 43 4.1 1,059 100 All 25 2.1 143 11.8 249 20.6 239 19.8 135 11.2 162 13.4 84 7.0 49 4.1 63 5.2 8 0.7 50 4.1 1,207 100
CSU Part-time 1 11.1 - - - - 3 33.3 - - - - - - 1 11.1 - - 1 11.1 3 33.3 9 100 Full-time 14 4.1 31 9.0 73 21.3 55 16.0 33 9.6 45 13.1 19 5.5 13 3.8 20 5.8 11 3.2 29 8.5 343 100 All 15 4.3 31 8.8 73 20.7 58 16.5 33 9.4 45 12.8 19 5.4 14 4.0 20 5.7 12 3.4 32 9.1 352 100
ICU Part-time - - 16 16.5 23 23.7 22 22.7 7 7.2 7 7.2 6 6.2 6 6.2 4 4.1 - - 6 6.2 97 100 Full-time 26 2.4 158 14.7 215 20.0 177 16.4 121 11.2 151 14.0 53 4.9 61 5.7 56 5.2 14 1.3 45 4.2 1,077 100 All 26 2.2 174 14.8 238 20.3 199 17.0 128 10.9 158 13.5 59 5.0 67 5.7 60 5.1 14 1.2 51 4.3 1,174 100
ALL Part-time 10 3.9 31 12.2 48 18.9 53 20.9 27 10.6 27 10.6 15 5.9 16 6.3 10 3.9 1 0.4 16 6.3 254 100 Full-time 56 2.3 317 12.8 512 20.7 443 17.9 269 10.9 338 13.6 147 5.9 114 4.6 133 5.4 33 1.3 117 4.7 2,479 100 All 66 2.4 348 12.7 560 20.5 496 18.1 296 10.8 365 13.4 162 5.9 130 4.8 143 5.2 34 1.2 133 4.9 2,733 100
INDEPENDENT UNDERGRADUATES
Nothing Under $25 $25 to $49 $50 to $74 $75 to $99 $100 to $124 $125 to $149 $150 to $199 $200 to $249 $250 to $299 $300 or More Total
# % # % # % # % # % # % # % # % # % # % # % # %
UC Part-time 1 11.1 - - 1 11.1 1 11.1 - - 1 11.1 1 11.1 1 11.1 - - 2 22.2 1 11.1 9 100 Full-time 1 2.0 5 10.2 8 16.3 9 18.4 4 8.2 7 14.3 4 8.2 2 4.1 4 8.2 2 4.1 3 6.1 49 100 All 2 3.4 5 8.6 9 15.5 10 17.2 4 6.9 8 13.8 5 8.6 3 5.2 4 6.9 4 6.9 4 6.9 58 100
CSU Part-time 3 6.1 - - 1 2.0 6 12.2 4 8.2 3 6.1 2 4.1 7 14.3 12 24.5 1 2.0 10 20.4 49 100 Full-time 6 8.1 2 2.7 6 8.1 9 12.2 4 5.4 10 13.5 3 4.1 12 16.2 6 8.1 2 2.7 14 18.9 74 100 All 9 7.3 2 1.6 7 5.7 15 12.2 8 6.5 13 10.6 5 4.1 19 15.4 18 14.6 3 2.4 24 19.5 123 100
ICU Part-time - - 1 10.0 1 10.0 1 10.0 1 10.0 1 10.0 1 10.0 1 10.0 1 10.0 1 10.0 1 10.0 10 100 Full-time 3 4.8 4 6.5 13 21.0 5 8.1 9 14.5 5 8.1 8 12.9 2 3.2 5 8.1 - - 8 12.9 62 100 All 3 4.2 5 6.9 14 19.4 6 8.3 10 13.9 6 8.3 9 12.5 3 4.2 6 8.3 1 1.4 9 12.5 72 100
ALL Part-time 4 5.9 1 1.5 3 4.4 8 11.8 5 7.4 5 7.4 4 5.9 9 13.2 13 19.1 4 5.9 12 17.6 68 100 Full-time 10 5.4 11 5.9 27 14.6 23 12.4 17 9.2 22 11.9 15 8.1 16 8.6 15 8.1 4 2.2 25 13.5 185 100 All 14 5.5 12 4.7 30 11.9 31 12.3 22 8.7 27 10.7 19 7.5 25 9.9 28 11.1 8 3.2 37 14.6 253 100
ALL UNDERGRADUATESPart-time 14 4.3 32 9.9 51 15.8 61 18.9 32 9.9 32 9.9 19 5.9 25 7.8 23 7.1 5 1.6 28 8.7 322 100 Full-time 66 2.5 328 12.3 539 20.2 466 17.5 286 10.7 360 13.5 162 6.1 130 4.9 148 5.6 37 1.4 142 5.3 2,664 100 All 80 2.7 360 12.1 590 19.8 527 17.6 318 10.6 392 13.1 181 6.1 155 5.2 171 5.7 42 1.4 170 5.7 2,986 100
%
Source: California Student Aid Commission 238 2003-04 SEARS

DEPENDENT UNDERGRADUATES INDEPENDENT UNDERGRADUATES ALL UNDERGRADUATES
UC Part-time 139 96$ 77$ UC Part-time 8 175$ 160$ UC Part-time 147 100$ 79$ Full-time 1,043 92$ 69$ Full-time 48 112$ 91$ Full-time 1,091 93$ 70$ All 1,182 92$ 70$ All 56 121$ 103$ All 1,238 93$ 71$
CSU Part-time 8 202$ 73$ CSU Part-time 46 192$ 198$ CSU Part-time 54 193$ 189$ Full-time 329 110$ 79$ Full-time 68 165$ 168$ Full-time 397 120$ 94$
All 337 113$ 79$ All 114 176$ 183$ All 451 129$ 104$ ICU Part-time 97 88$ 44$ ICU Part-time 10 145$ 128$ ICU Part-time 107 94$ 51$ Full-time 1,051 93$ 75$ Full-time 59 125$ 96$ Full-time 1,110 95$ 77$
All 1,148 93$ 74$ All 69 128$ 100$ All 1,217 95$ 76$ ALL Part-time 244 96$ 73$ ALL Part-time 64 182$ 191$ ALL Part-time 308 114$ 96$
Full-time 2,423 95$ 73$ Full-time 175 137$ 119$ Full-time 2,598 98$ 76$ All 2,667 95$ 73$ All 239 149$ 141$ All 2,906 99$ 78$
Note: "Nothing" category was excluded from the means and median calculations.
TABLE M-38: MEAN AND MEDIAN MONTHLY FOOD EXPENSES NOT INCLUDED IN HOUSING CONTRACT BY SEGMENT, COURSE LOAD, AND DEPENDENCY STATUS
Number Mean Median Number MedianMean Median Number Mean
Source: California Student Aid Commission 239 2003-04 SEARS

Questions for Tables: W-39, U-39, and M-39
What is your share of monthly housing costs for your residence during the current academic year?
Include rent, mortgage and property taxes, payments to your parents or other relatives, etc. Taking seasonal variations into account, include your share of utilities for water, gas, electricity, garbage, and telephone, excluding long distance charges.
00 Nothing 04 $300 to $399 08 $700 to $799 12 $1,200 to $1,349 01 Under $100 05 $400 to $499 09 $800 to $899 13 $1,350 to $1,499 02 $100 to $199 06 $500 to $599 10 $900 to $1,049 14 $1,500 or more 03 $200 to $299 07 $600 to $699 11 $1,050 to $1,199
Note: Answered only by students who do not have a room and food contract. 240 2003-04 SEARS

DEPENDENT UNDERGRADUATES
Nothing Under $100 $100 to $199 $200 to $299 $300 to $399 $400 to $499 $500 to $599 $600 to $699
# % # % # % # % # % # % # % # %CCC Part-time 160,927 42.8 34,331 9.1 44,344 11.8 32,185 8.6 22,887 6.1 16,808 4.5 17,881 4.8 13,589 3.6
Full-time 120,863 45.0 30,306 11.3 25,235 9.4 22,941 8.5 20,164 7.5 11,229 4.2 10,625 4.0 7,969 3.0 All 281,790 43.7 64,637 10.0 69,579 10.8 55,126 8.5 43,051 6.7 28,037 4.3 28,506 4.4 21,558 3.3
UC Part-time 5,506 30.7 669 3.7 568 3.2 884 4.9 2,101 11.7 2,196 12.2 1,924 10.7 1,219 6.8 Full-time 8,537 11.9 2,095 2.9 1,226 1.7 2,238 3.1 4,328 6.0 9,369 13.0 13,127 18.3 12,061 16.8 All 14,043 15.6 2,764 3.1 1,794 2.0 3,122 3.5 6,429 7.2 11,565 12.9 15,051 16.8 13,280 14.8
CSU Part-time 6,790 37.1 1,130 6.2 1,227 6.7 1,446 7.9 1,104 6.0 1,325 7.2 1,150 6.3 1,486 8.1 Full-time 39,121 30.4 10,098 7.8 7,239 5.6 7,668 6.0 9,680 7.5 12,855 10.0 13,891 10.8 9,389 7.3 All 45,911 31.2 11,228 7.6 8,466 5.8 9,114 6.2 10,784 7.3 14,180 9.6 15,041 10.2 10,875 7.4
ICU Part-time 900 32.8 126 4.6 - - 72 2.6 176 6.4 146 5.3 90 3.3 265 9.7 Full-time 11,815 26.9 2,733 6.2 1,384 3.2 1,523 3.5 2,191 5.0 2,884 6.6 4,710 10.7 5,246 12.0 All 12,715 27.3 2,859 6.1 1,384 3.0 1,595 3.4 2,367 5.1 3,030 6.5 4,800 10.3 5,511 11.8
PCC Part-time 2,096 33.5 203 3.2 260 4.2 638 10.2 306 4.9 477 7.6 271 4.3 246 3.9 Full-time 8,027 35.6 1,588 7.0 1,248 5.5 1,420 6.3 1,440 6.4 1,073 4.8 1,683 7.5 1,248 5.5 All 10,123 35.1 1,790 6.2 1,508 5.2 2,057 7.1 1,746 6.1 1,549 5.4 1,953 6.8 1,494 5.2
ALL Part-time 176,218 41.8 36,459 8.7 46,400 11.0 35,224 8.4 26,574 6.3 20,952 5.0 21,314 5.1 16,804 4.0 Full-time 188,363 35.2 46,819 8.7 36,332 6.8 35,789 6.7 37,804 7.1 37,410 7.0 44,036 8.2 35,913 6.7 All 364,581 38.1 83,278 8.7 82,732 8.6 71,013 7.4 64,378 6.7 58,362 6.1 65,350 6.8 52,717 5.5
$700 to $799 $800 to $899 $900 to $1,049 $1,050 to $1,199 $1,200 to $1,349 $1,350 to $1,499 $1,500 or More Total
# % # % # % # % # % # % # % # %CCC Part-time 5,722 1.5 7,152 1.9 5,007 1.3 5,007 1.3 2,146 0.6 2,503 0.7 5,722 1.5 376,211 100
Full-time 4,105 1.5 3,622 1.3 3,502 1.3 1,932 0.7 2,173 0.8 966 0.4 3,019 1.1 268,651 100 All 9,827 1.5 10,775 1.7 8,508 1.3 6,939 1.1 4,319 0.7 3,469 0.5 8,741 1.4 644,861 100
UC Part-time 1,194 6.6 889 4.9 181 1.0 149 0.8 70 0.4 111 0.6 301 1.7 17,962 100 Full-time 8,133 11.3 4,478 6.2 2,979 4.1 933 1.3 563 0.8 299 0.4 1,520 2.1 71,886 100 All 9,327 10.4 5,367 6.0 3,160 3.5 1,082 1.2 634 0.7 411 0.5 1,820 2.0 89,848 100
CSU Part-time 604 3.3 623 3.4 465 2.5 122 0.7 563 3.1 19 0.1 269 1.5 18,321 100 Full-time 4,910 3.8 3,890 3.0 3,097 2.4 2,571 2.0 813 0.6 1,105 0.9 2,401 1.9 128,728 100 All 5,514 3.7 4,512 3.1 3,561 2.4 2,693 1.8 1,376 0.9 1,124 0.8 2,670 1.8 147,049 100
ICU Part-time 197 7.2 443 16.2 95 3.5 47 1.7 47 1.7 - - 141 5.2 2,745 100 Full-time 3,678 8.4 2,185 5.0 1,699 3.9 1,108 2.5 796 1.8 122 0.3 1,792 4.1 43,865 100 All 3,874 8.3 2,629 5.6 1,794 3.8 1,154 2.5 843 1.8 122 0.3 1,933 4.1 46,610 100
PCC Part-time 391 6.3 223 3.6 551 8.8 76 1.2 148 2.4 101 1.6 264 4.2 6,251 100 Full-time 1,293 5.7 860 3.8 906 4.0 413 1.8 354 1.6 167 0.7 855 3.8 22,572 100 All 1,684 5.8 1,083 3.8 1,457 5.1 489 1.7 503 1.7 268 0.9 1,119 3.9 28,822 100
ALL Part-time 8,108 1.9 9,330 2.2 6,299 1.5 5,401 1.3 2,974 0.7 2,734 0.6 6,697 1.6 421,490 100 Full-time 22,119 4.1 15,035 2.8 12,182 2.3 6,955 1.3 4,699 0.9 2,659 0.5 9,586 1.8 535,701 100 All 30,226 3.2 24,366 2.5 18,481 1.9 12,356 1.3 7,674 0.8 5,394 0.6 16,283 1.7 957,191 100
TABLE W-39A: MONTHLY OFF-CAMPUS HOUSING EXPENSES BY SEGMENT, COURSE LOAD, AND DEPENDENCY STATUS
Source: California Student Aid Commission 241 2003-04 SEARS

INDEPENDENT UNDERGRADUATES
Nothing Under $100 $100 to $199 $200 to $299 $300 to $399 $400 to $499 $500 to $599 $600 to $699
# % # % # % # % # % # % # % # %CCC Part-time 69,378 12.2 12,517 2.2 21,815 3.8 26,106 4.6 27,894 4.9 30,040 5.3 35,404 6.2 30,040 5.3
Full-time 22,941 15.5 5,916 4.0 8,090 5.5 10,384 7.0 12,316 8.3 10,505 7.1 12,436 8.4 10,505 7.1 All 92,319 12.9 18,433 2.6 29,905 4.2 36,490 5.1 40,210 5.6 40,545 5.7 47,840 6.7 40,545 5.7
UC Part-time 332 9.8 156 4.6 37 1.1 141 4.2 351 10.4 127 3.8 281 8.3 333 9.9 Full-time 1,220 10.7 234 2.1 192 1.7 112 1.0 369 3.2 1,109 9.7 1,352 11.9 1,500 13.2 All 1,551 10.5 390 2.6 229 1.5 252 1.7 720 4.9 1,236 8.4 1,633 11.1 1,833 12.4
CSU Part-time 8,928 20.0 885 2.0 826 1.8 1,520 3.4 2,481 5.6 2,292 5.1 2,188 4.9 2,235 5.0 Full-time 13,190 17.3 2,471 3.2 1,952 2.6 4,238 5.6 5,226 6.9 5,594 7.3 5,386 7.1 6,583 8.6 All 22,118 18.3 3,356 2.8 2,777 2.3 5,758 4.8 7,706 6.4 7,886 6.5 7,574 6.3 8,818 7.3
ICU Part-time 2,151 24.1 157 1.8 90 1.0 171 1.9 135 1.5 139 1.6 437 4.9 108 1.2 Full-time 2,291 16.3 407 2.9 188 1.3 517 3.7 720 5.1 549 3.9 1,193 8.5 931 6.6 All 4,442 19.3 564 2.5 278 1.2 687 3.0 855 3.7 688 3.0 1,631 7.1 1,040 4.5
PCC Part-time 2,234 11.0 248 1.2 295 1.5 755 3.7 1,197 5.9 1,033 5.1 1,698 8.4 1,038 5.1 Full-time 4,792 10.0 562 1.2 1,528 3.2 2,031 4.2 3,056 6.4 3,153 6.6 3,058 6.4 2,981 6.2 All 7,026 10.3 810 1.2 1,824 2.7 2,786 4.1 4,253 6.2 4,186 6.1 4,756 7.0 4,019 5.9
ALL Part-time 83,022 12.8 13,962 2.2 23,063 3.6 28,692 4.4 32,058 5.0 33,630 5.2 40,009 6.2 33,754 5.2 Full-time 44,434 15.0 9,591 3.2 11,949 4.0 17,281 5.8 21,687 7.3 20,910 7.0 23,425 7.9 22,499 7.6 All 127,456 13.5 23,553 2.5 35,012 3.7 45,974 4.9 53,745 5.7 54,541 5.8 63,434 6.7 56,254 6.0
$700 to $799 $800 to $899 $900 to $1,049 $1,050 to $1,199 $1,200 to $1,349 $1,350 to $1,499 $1,500 or More Total
# % # % # % # % # % # % # % # %CCC Part-time 27,179 4.8 30,040 5.3 35,404 6.2 35,404 6.2 32,901 5.8 22,530 4.0 132,676 23.3 569,328 100
Full-time 7,365 5.0 7,486 5.1 7,848 5.3 6,037 4.1 4,950 3.4 4,226 2.9 16,662 11.3 147,668 100 All 34,544 4.8 37,526 5.2 43,252 6.0 41,441 5.8 37,851 5.3 26,756 3.7 149,338 20.8 716,996 100
UC Part-time 352 10.4 226 6.7 301 8.9 290 8.6 135 4.0 - - 309 9.2 3,370 100 Full-time 822 7.2 1,201 10.5 1,400 12.3 527 4.6 601 5.3 158 1.4 597 5.2 11,393 100 All 1,174 8.0 1,427 9.7 1,700 11.5 817 5.5 735 5.0 158 1.1 906 6.1 14,763 100
CSU Part-time 2,841 6.4 2,510 5.6 2,943 6.6 1,956 4.4 1,869 4.2 1,826 4.1 9,362 21.0 44,661 100 Full-time 4,170 5.5 4,117 5.4 5,530 7.3 3,094 4.1 2,897 3.8 1,748 2.3 9,970 13.1 76,164 100 All 7,011 5.8 6,627 5.5 8,473 7.0 5,050 4.2 4,766 3.9 3,574 3.0 19,333 16.0 120,825 100
ICU Part-time 483 5.4 269 3.0 507 5.7 519 5.8 569 6.4 259 2.9 2,942 32.9 8,937 100 Full-time 682 4.9 819 5.8 1,121 8.0 974 6.9 604 4.3 572 4.1 2,461 17.5 14,028 100 All 1,165 5.1 1,087 4.7 1,628 7.1 1,493 6.5 1,173 5.1 831 3.6 5,403 23.5 22,965 100
PCC Part-time 1,083 5.4 819 4.0 1,096 5.4 1,020 5.0 1,261 6.2 985 4.9 5,472 27.0 20,233 100 Full-time 3,063 6.4 3,232 6.8 3,782 7.9 2,933 6.1 3,083 6.4 1,378 2.9 9,200 19.2 47,831 100 All 4,146 6.1 4,051 6.0 4,878 7.2 3,953 5.8 4,343 6.4 2,363 3.5 14,672 21.6 68,065 100
ALL Part-time 31,938 4.9 33,864 5.2 40,250 6.2 39,190 6.1 36,735 5.7 25,600 4.0 150,762 23.3 646,530 100 Full-time 16,103 5.4 16,854 5.7 19,681 6.6 13,564 4.6 12,134 4.1 8,082 2.7 38,890 13.1 297,084 100 All 48,041 5.1 50,718 5.4 59,931 6.4 52,755 5.6 48,869 5.2 33,682 3.6 189,651 20.1 943,614 100
TABLE W-39B: MONTHLY OFF-CAMPUS HOUSING EXPENSES BY SEGMENT, COURSE LOAD, AND DEPENDENCY STATUS
Source: California Student Aid Commission 242 2003-04 SEARS

ALL UNDERGRADUATES
Nothing Under $100 $100 to $199 $200 to $299 $300 to $399 $400 to $499 $500 to $599 $600 to $699
# % # % # % # % # % # % # % # %Part-time 259,240 24.3 50,421 4.7 69,463 6.5 63,917 6.0 58,632 5.5 54,582 5.1 61,323 5.7 50,559 4.7 Full-time 232,798 28.0 56,410 6.8 48,281 5.8 53,070 6.4 59,490 7.1 58,320 7.0 67,461 8.1 58,412 7.0 All 492,037 25.9 106,831 5.6 117,744 6.2 116,987 6.2 118,122 6.2 112,903 5.9 128,784 6.8 108,971 5.7
$700 to $799 $800 to $899 $900 to $1,049 $1,050 to $1,199 $1,200 to $1,349 $1,350 to $1,499 $1,500 or More Total
# % # % # % # % # % # % # % # %Part-time 40,046 3.7 43,194 4.0 46,549 4.4 44,591 4.2 39,709 3.7 28,335 2.7 157,459 14.7 1,068,020 100 Full-time 38,221 4.6 31,889 3.8 31,863 3.8 20,520 2.5 16,833 2.0 10,741 1.3 48,475 5.8 832,785 100 All 78,267 4.1 75,084 4.0 78,412 4.1 65,111 3.4 56,543 3.0 39,076 2.1 205,935 10.8 1,900,805 100
TABLE W-39C: MONTHLY OFF-CAMPUS HOUSING EXPENSES BY SEGMENT, COURSE LOAD, AND DEPENDENCY STATUS
Source: California Student Aid Commission 243 2003-04 SEARS

DEPENDENT UNDERGRADUATES
Nothing Under $100 $100 to $199 $200 to $299 $300 to $399 $400 to $499 $500 to $599 $600 to $699
# % # % # % # % # % # % # % # %CCC Part-time 450 42.8 96 9.1 124 11.8 90 8.6 64 6.1 47 4.5 50 4.8 38 3.6
Full-time 1,001 45.0 251 11.3 209 9.4 190 8.5 167 7.5 93 4.2 88 4.0 66 3.0 All 1,451 44.3 347 10.6 333 10.2 280 8.5 231 7.0 140 4.3 138 4.2 104 3.2
UC Part-time 81 27.9 10 3.4 9 3.1 14 4.8 31 10.7 34 11.7 36 12.4 23 7.9 Full-time 227 12.1 55 2.9 35 1.9 57 3.0 109 5.8 245 13.1 336 17.9 320 17.1 All 308 14.2 65 3.0 44 2.0 71 3.3 140 6.5 279 12.9 372 17.2 343 15.8
CSU Part-time 75 36.2 13 6.3 14 6.8 12 5.8 15 7.2 17 8.2 14 6.8 15 7.2 Full-time 472 30.3 107 6.9 93 6.0 84 5.4 138 8.9 170 10.9 172 11.0 113 7.3 All 547 31.0 120 6.8 107 6.1 96 5.4 153 8.7 187 10.6 186 10.5 128 7.3
ICU Part-time 16 30.8 2 3.8 - - 2 3.8 3 5.8 4 7.7 2 3.8 4 7.7 Full-time 248 26.7 55 5.9 28 3.0 34 3.7 47 5.1 61 6.6 105 11.3 110 11.9 All 264 26.9 57 5.8 28 2.9 36 3.7 50 5.1 65 6.6 107 10.9 114 11.6
PCC Part-time 100 35.7 17 6.1 16 5.7 19 6.8 17 6.1 17 6.1 14 5.0 14 5.0 Full-time 374 35.8 77 7.4 72 6.9 61 5.8 70 6.7 54 5.2 64 6.1 48 4.6 All 474 35.8 94 7.1 88 6.6 80 6.0 87 6.6 71 5.4 78 5.9 62 4.7
ALL Part-time 722 38.4 138 7.3 163 8.7 137 7.3 130 6.9 119 6.3 116 6.2 94 5.0 Full-time 2,322 30.4 545 7.1 437 5.7 426 5.6 531 7.0 623 8.2 765 10.0 657 8.6 All 3,044 32.0 683 7.2 600 6.3 563 5.9 661 6.9 742 7.8 881 9.3 751 7.9
$700 to $799 $800 to $899 $900 to $1,049 $1,050 to $1,199 $1,200 to $1,349 $1,350 to $1,499 $1,500 or More Total
# % # % # % # % # % # % # % # %CCC Part-time 16 1.5 20 1.9 14 1.3 14 1.3 6 0.6 7 0.7 16 1.5 1,052 100
Full-time 34 1.5 30 1.3 29 1.3 16 0.7 18 0.8 8 0.4 25 1.1 2,225 100 All 50 1.5 50 1.5 43 1.3 30 0.9 24 0.7 15 0.5 41 1.3 3,277 100
UC Part-time 19 6.6 16 5.5 4 1.4 3 1.0 1 0.3 3 1.0 6 2.1 290 100 Full-time 209 11.1 118 6.3 77 4.1 25 1.3 15 0.8 8 0.4 40 2.1 1,876 100 All 228 10.5 134 6.2 81 3.7 28 1.3 16 0.7 11 0.5 46 2.1 2,166 100
CSU Part-time 9 4.3 7 3.4 6 2.9 1 0.5 5 2.4 1 0.5 3 1.4 207 100 Full-time 54 3.5 45 2.9 34 2.2 24 1.5 12 0.8 11 0.7 28 1.8 1,557 100 All 63 3.6 52 2.9 40 2.3 25 1.4 17 1.0 12 0.7 31 1.8 1,764 100
ICU Part-time 4 7.7 8 15.4 2 3.8 1 1.9 1 1.9 - - 3 5.8 52 100 Full-time 79 8.5 46 5.0 37 4.0 23 2.5 15 1.6 3 0.3 37 4.0 928 100 All 83 8.5 54 5.5 39 4.0 24 2.4 16 1.6 3 0.3 40 4.1 980 100
PCC Part-time 21 7.5 9 3.2 12 4.3 4 1.4 3 1.1 4 1.4 13 4.6 280 100 Full-time 59 5.6 35 3.3 39 3.7 23 2.2 21 2.0 10 1.0 38 3.6 1,045 100 All 80 6.0 44 3.3 51 3.8 27 2.0 24 1.8 14 1.1 51 3.8 1,325 100
ALL Part-time 69 3.7 60 3.2 38 2.0 23 1.2 16 0.9 15 0.8 41 2.2 1,881 100 Full-time 435 5.7 274 3.6 216 2.8 111 1.5 81 1.1 40 0.5 168 2.2 7,631 100 All 504 5.3 334 3.5 254 2.7 134 1.4 97 1.0 55 0.6 209 2.2 9,512 100
TABLE U-39A: MONTHLY OFF-CAMPUS HOUSING EXPENSES BY SEGMENT, COURSE LOAD, AND DEPENDENCY STATUS
Source: California Student Aid Commission 244 2003-04 SEARS

INDEPENDENT UNDERGRADUATES
Nothing Under $100 $100 to $199 $200 to $299 $300 to $399 $400 to $499 $500 to $599 $600 to $699
# % # % # % # % # % # % # % # %CCC Part-time 194 12.2 35 2.2 61 3.8 73 4.6 78 4.9 84 5.3 99 6.2 84 5.3
Full-time 190 15.5 49 4.0 67 5.5 86 7.0 102 8.3 87 7.1 103 8.4 87 7.1 All 384 13.6 84 3.0 128 4.5 159 5.6 180 6.4 171 6.1 202 7.2 171 6.1
UC Part-time 7 11.3 3 4.8 1 1.6 2 3.2 5 8.1 3 4.8 4 6.5 6 9.7 Full-time 32 10.9 6 2.0 5 1.7 3 1.0 9 3.1 29 9.9 34 11.6 38 13.0 All 39 11.0 9 2.5 6 1.7 5 1.4 14 3.9 32 9.0 38 10.7 44 12.4
CSU Part-time 108 20.2 8 1.5 15 2.8 22 4.1 31 5.8 24 4.5 33 6.2 27 5.1 Full-time 185 17.8 28 2.7 26 2.5 54 5.2 81 7.8 85 8.2 84 8.1 85 8.2 All 293 18.6 36 2.3 41 2.6 76 4.8 112 7.1 109 6.9 117 7.4 112 7.1
ICU Part-time 34 23.8 3 2.1 2 1.4 3 2.1 3 2.1 3 2.1 8 5.6 2 1.4 Full-time 45 15.8 8 2.8 4 1.4 10 3.5 15 5.3 12 4.2 22 7.7 21 7.4 All 79 18.5 11 2.6 6 1.4 13 3.0 18 4.2 15 3.5 30 7.0 23 5.4
PCC Part-time 78 13.8 13 2.3 16 2.8 22 3.9 26 4.6 31 5.5 35 6.2 40 7.1 Full-time 213 12.6 30 1.8 55 3.3 79 4.7 124 7.3 116 6.9 121 7.2 112 6.6 All 291 12.9 43 1.9 71 3.1 101 4.5 150 6.7 147 6.5 156 6.9 152 6.7
ALL Part-time 421 14.5 62 2.1 95 3.3 122 4.2 143 4.9 145 5.0 179 6.2 159 5.5 Full-time 665 14.7 121 2.7 157 3.5 232 5.1 331 7.3 329 7.3 364 8.0 343 7.6 All 1,086 14.6 183 2.5 252 3.4 354 4.8 474 6.4 474 6.4 543 7.3 502 6.8
$700 to $799 $800 to $899 $900 to $1,049 $1,050 to $1,199 $1,200 to $1,349 $1,350 to $1,499 $1,500 or More Total
# % # % # % # % # % # % # % # %CCC Part-time 76 4.8 84 5.3 99 6.2 99 6.2 92 5.8 63 4.0 371 23.3 1,592 100
Full-time 61 5.0 62 5.1 65 5.3 50 4.1 41 3.4 35 2.9 138 11.3 1,223 100 All 137 4.9 146 5.2 164 5.8 149 5.3 133 4.7 98 3.5 509 18.1 2,815 100
UC Part-time 7 11.3 4 6.5 5 8.1 5 8.1 3 4.8 - - 7 11.3 62 100 Full-time 23 7.8 31 10.6 35 11.9 13 4.4 16 5.5 4 1.4 15 5.1 293 100 All 30 8.5 35 9.9 40 11.3 18 5.1 19 5.4 4 1.1 22 6.2 355 100
CSU Part-time 33 6.2 31 5.8 30 5.6 21 3.9 23 4.3 25 4.7 103 19.3 534 100 Full-time 56 5.4 56 5.4 72 6.9 42 4.0 38 3.6 24 2.3 126 12.1 1,042 100 All 89 5.6 87 5.5 102 6.5 63 4.0 61 3.9 49 3.1 229 14.5 1,576 100
ICU Part-time 11 7.7 5 3.5 9 6.3 9 6.3 10 7.0 4 2.8 37 25.9 143 100 Full-time 14 4.9 18 6.3 23 8.1 20 7.0 12 4.2 11 3.9 49 17.3 284 100 All 25 5.9 23 5.4 32 7.5 29 6.8 22 5.2 15 3.5 86 20.1 427 100
PCC Part-time 32 5.7 26 4.6 37 6.5 27 4.8 35 6.2 19 3.4 129 22.8 566 100 Full-time 105 6.2 87 5.2 125 7.4 87 5.2 98 5.8 48 2.8 288 17.1 1,688 100 All 137 6.1 113 5.0 162 7.2 114 5.1 133 5.9 67 3.0 417 18.5 2,254 100
ALL Part-time 159 5.5 150 5.2 180 6.2 161 5.6 163 5.6 111 3.8 647 22.3 2,897 100 Full-time 259 5.7 254 5.6 320 7.1 212 4.7 205 4.5 122 2.7 616 13.6 4,530 100 All 418 5.6 404 5.4 500 6.7 373 5.0 368 5.0 233 3.1 1,263 17.0 7,427 100
TABLE U-39B: MONTHLY OFF-CAMPUS HOUSING EXPENSES BY SEGMENT, COURSE LOAD, AND DEPENDENCY STATUS
Source: California Student Aid Commission 245 2003-04 SEARS

ALL UNDERGRADUATES
Nothing Under $100 $100 to $199 $200 to $299 $300 to $399 $400 to $499 $500 to $599 $600 to $699
# % # % # % # % # % # % # % # %Part-time 1,143 23.9 200 4.2 258 5.4 259 5.4 273 5.7 264 5.5 295 6.2 253 5.3 Full-time 2,987 24.6 666 5.5 594 4.9 658 5.4 862 7.1 952 7.8 1,129 9.3 1,000 8.2 All 4,130 24.4 866 5.1 852 5.0 917 5.4 1,135 6.7 1,216 7.2 1,424 8.4 1,253 7.4
$700 to $799 $800 to $899 $900 to $1,049 $1,050 to $1,199 $1,200 to $1,349 $1,350 to $1,499 $1,500 or More Total
# % # % # % # % # % # % # % # %Part-time 228 4.8 210 4.4 218 4.6 184 3.9 179 3.7 126 2.6 688 14.4 4,778 100 Full-time 694 5.7 528 4.3 536 4.4 323 2.7 286 2.4 162 1.3 784 6.4 12,161 100 All 922 5.4 738 4.4 754 4.5 507 3.0 465 2.7 288 1.7 1,472 8.7 16,939 100
TABLE U-39C: MONTHLY OFF-CAMPUS HOUSING EXPENSES BY SEGMENT, COURSE LOAD, AND DEPENDENCY STATUS
Source: California Student Aid Commission 246 2003-04 SEARS

DEPENDENT UNDERGRADUATES INDEPENDENT UNDERGRADUATES ALL UNDERGRADUATES
CCC Part-time 602 403$ 289$ CCC Part-time 1,398 952$ 937$ CCC Part-time 2,000 790$ 680$ Full-time 1,224 371$ 279$ Full-time 1,033 735$ 625$ Full-time 2,257 538$ 403$ All 1,826 382$ 285$ All 2,431 860$ 862$ All 4,257 655$ 588$
UC Part-time 209 557$ 490$ UC Part-time 55 800$ 726$ UC Part-time 264 607$ 523$ Full-time 1,649 617$ 594$ Full-time 261 780$ 726$ Full-time 1,910 639$ 606$ All 1,858 610$ 580$ All 316 783$ 726$ All 2,174 635$ 595$
CSU Part-time 132 517$ 464$ CSU Part-time 426 931$ 904$ CSU Part-time 558 833$ 767$ Full-time 1,085 504$ 478$ Full-time 857 788$ 700$ Full-time 1,942 629$ 547$
All 1,217 506$ 476$ All 1,283 835$ 777$ All 2,500 675$ 582$ ICU Part-time 36 723$ 723$ ICU Part-time 109 1,077$ 1,299$ ICU Part-time 145 989$ 1,105$ Full-time 680 633$ 610$ Full-time 239 915$ 882$ Full-time 919 707$ 646$
All 716 638$ 616$ All 348 966$ 1,016$ All 1,064 745$ 683$ PCC Part-time 180 600$ 571$ PCC Part-time 488 951$ 1,010$ PCC Part-time 668 857$ 887$ Full-time 671 572$ 528$ Full-time 1,475 870$ 864$ Full-time 2,146 777$ 762$
All 851 578$ 534$ All 1,963 891$ 892$ All 2,814 796$ 787$ ALL Part-time 1,159 485$ 316$ ALL Part-time 2,476 950$ 939$ ALL Part-time 3,635 802$ 690$
Full-time 5,309 534$ 444$ Full-time 3,865 813$ 695$ Full-time 9,174 651$ 535$ All 6,468 525$ 391$ All 6,341 866$ 853$ All 12,809 694$ 602$
Note: "Nothing" category was excluded from the means and median calculations.
TABLE M-39: MEAN AND MEDIAN MONTHLY OFF-CAMPUS HOUSING EXPENSES BY SEGMENT, COURSE LOAD, AND DEPENDENCY STATUS
Number Mean Median Number MedianMean Median Number Mean
Source: California Student Aid Commission 247 2003-04 SEARS
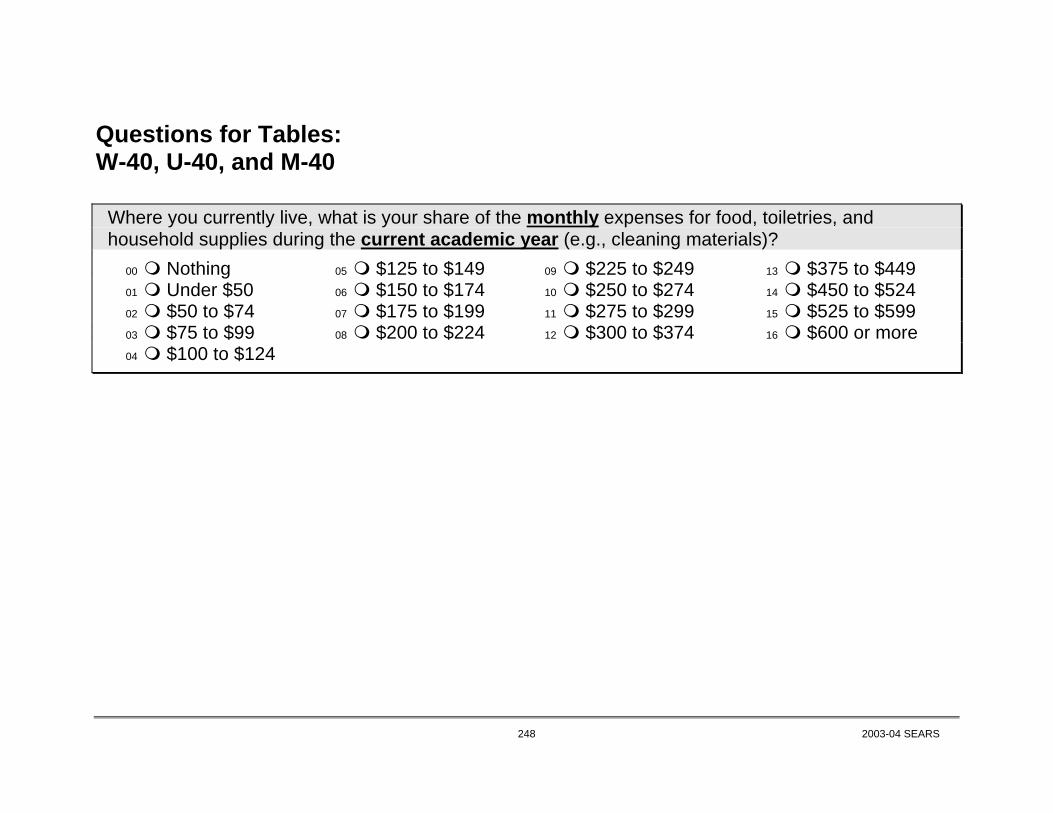
Questions for Tables: W-40, U-40, and M-40
Where you currently live, what is your share of the monthly expenses for food, toiletries, and
household supplies during the current academic year (e.g., cleaning materials)? 00 Nothing 05 $125 to $149 09 $225 to $249 13 $375 to $449 01 Under $50 06 $150 to $174 10 $250 to $274 14 $450 to $524 02 $50 to $74 07 $175 to $199 11 $275 to $299 15 $525 to $599 03 $75 to $99 08 $200 to $224 12 $300 to $374 16 $600 or more 04 $100 to $124
248 2003-04 SEARS

DEPENDENT UNDERGRADUATES
Nothing Under $50 $50 to $74 $75 to $99 $100 to $124 $125 to $149 $150 to $174 $175 to $199 $200 to $224
# % # % # % # % # % # % # % # % # %CCC Part-time 129,099 34.3 51,139 13.6 46,133 12.3 25,748 6.8 40,411 10.7 19,669 5.2 13,589 3.6 6,437 1.7 14,305 3.8
Full-time 96,111 35.7 40,569 15.1 28,616 10.6 19,440 7.2 27,409 10.2 12,074 4.5 8,211 3.0 6,882 2.6 9,056 3.4 All 225,210 34.9 91,708 14.2 74,749 11.6 45,188 7.0 67,820 10.5 31,743 4.9 21,800 3.4 13,319 2.1 23,361 3.6
UC Part-time 3,420 19.0 2,386 13.3 1,420 7.9 2,006 11.1 3,015 16.7 1,121 6.2 989 5.5 380 2.1 1,357 7.5 Full-time 6,798 9.5 7,876 11.0 6,350 8.8 7,786 10.8 9,889 13.8 6,750 9.4 5,211 7.3 3,739 5.2 5,867 8.2 All 10,218 11.4 10,262 11.4 7,770 8.6 9,792 10.9 12,904 14.4 7,871 8.8 6,199 6.9 4,119 4.6 7,224 8.0
CSU Part-time 5,206 28.1 1,468 7.9 1,301 7.0 1,806 9.7 2,103 11.3 1,564 8.4 1,153 6.2 741 4.0 1,021 5.5 Full-time 28,735 22.1 15,823 12.2 12,975 10.0 11,871 9.1 15,379 11.8 10,054 7.7 5,020 3.9 5,316 4.1 7,616 5.9 All 33,941 22.9 17,291 11.6 14,276 9.6 13,677 9.2 17,482 11.8 11,618 7.8 6,174 4.2 6,058 4.1 8,637 5.8
ICU Part-time 815 30.1 90 3.3 249 9.2 140 5.2 191 7.0 54 2.0 34 1.2 105 3.9 209 7.7 Full-time 8,476 19.4 4,461 10.2 4,510 10.3 3,100 7.1 4,774 10.9 3,186 7.3 2,588 5.9 1,865 4.3 3,246 7.4 All 9,291 20.0 4,551 9.8 4,759 10.2 3,240 7.0 4,964 10.7 3,240 7.0 2,621 5.6 1,971 4.2 3,455 7.4
PCC Part-time 1,660 26.9 527 8.5 368 6.0 469 7.6 577 9.4 360 5.8 524 8.5 143 2.3 686 11.1 Full-time 7,112 31.5 1,865 8.3 2,021 9.0 1,337 5.9 2,730 12.1 1,698 7.5 970 4.3 712 3.2 1,248 5.5 All 8,771 30.5 2,392 8.3 2,389 8.3 1,805 6.3 3,307 11.5 2,058 7.2 1,494 5.2 855 3.0 1,935 6.7
ALL Part-time 140,199 33.2 55,609 13.2 49,472 11.7 30,169 7.1 46,296 11.0 22,768 5.4 16,289 3.9 7,806 1.8 17,579 4.2 Full-time 147,232 27.4 70,595 13.1 54,472 10.1 43,533 8.1 60,181 11.2 33,762 6.3 21,999 4.1 18,515 3.4 27,032 5.0 All 287,431 30.0 126,204 13.2 103,944 10.8 73,703 7.7 106,477 11.1 56,530 5.9 38,288 4.0 26,322 2.7 44,612 4.6
$225 to $249 $250 to $274 $275 to $299 $300 to $374 $375 to $449 $450 to $524 $525 to $599 $600 or More Total
# % # % # % # % # % # % # % # % # %CCC Part-time 4,649 1.2 2,146 0.6 2,503 0.7 7,152 1.9 3,576 0.9 3,219 0.9 2,146 0.6 4,649 1.2 376,570 100
Full-time 2,294 0.9 2,656 1.0 2,173 0.8 5,192 1.9 1,932 0.7 2,898 1.1 1,087 0.4 2,777 1.0 269,377 100 All 6,943 1.1 4,802 0.7 4,677 0.7 12,344 1.9 5,508 0.9 6,116 0.9 3,232 0.5 7,426 1.1 645,947 100
UC Part-time 221 1.2 300 1.7 292 1.6 542 3.0 178 1.0 178 1.0 97 0.5 101 0.6 18,002 100 Full-time 2,322 3.2 1,755 2.4 1,159 1.6 2,600 3.6 1,251 1.7 922 1.3 474 0.7 1,115 1.6 71,863 100 All 2,543 2.8 2,055 2.3 1,451 1.6 3,142 3.5 1,428 1.6 1,099 1.2 571 0.6 1,216 1.4 89,864 100
CSU Part-time 200 1.1 126 0.7 162 0.9 332 1.8 502 2.7 90 0.5 307 1.7 456 2.5 18,536 100 Full-time 3,239 2.5 2,016 1.6 1,916 1.5 3,842 3.0 1,661 1.3 1,298 1.0 216 0.2 2,908 2.2 129,886 100 All 3,439 2.3 2,142 1.4 2,078 1.4 4,174 2.8 2,163 1.5 1,387 0.9 522 0.4 3,364 2.3 148,422 100
ICU Part-time 184 6.8 42 1.6 131 4.8 213 7.9 - - 48 1.8 48 1.8 158 5.8 2,711 100 Full-time 993 2.3 986 2.3 866 2.0 1,775 4.1 840 1.9 548 1.3 161 0.4 1,410 3.2 43,784 100 All 1,177 2.5 1,028 2.2 996 2.1 1,988 4.3 840 1.8 595 1.3 209 0.4 1,569 3.4 46,495 100
PCC Part-time 64 1.0 129 2.1 75 1.2 75 1.2 40 0.7 88 1.4 185 3.0 196 3.2 6,166 100 Full-time 314 1.4 454 2.0 253 1.1 842 3.7 215 1.0 164 0.7 145 0.6 496 2.2 22,575 100 All 378 1.3 584 2.0 328 1.1 916 3.2 255 0.9 252 0.9 330 1.1 692 2.4 28,741 100
ALL Part-time 5,317 1.3 2,743 0.6 3,162 0.7 8,314 2.0 4,296 1.0 3,621 0.9 2,782 0.7 5,560 1.3 421,984 100 Full-time 9,162 1.7 7,868 1.5 6,367 1.2 14,251 2.7 5,897 1.1 5,829 1.1 2,082 0.4 8,707 1.6 537,484 100 All 14,480 1.5 10,611 1.1 9,530 1.0 22,564 2.4 10,194 1.1 9,450 1.0 4,864 0.5 14,267 1.5 959,468 100
TABLE W-40A: MONTHLY OFF-CAMPUS HOUSEHOLD FOOD EXPENSES BY SEGMENT, COURSE LOAD, AND DEPENDENCY STATUS
Source: California Student Aid Commission 249 2003-04 SEARS

INDEPENDENT UNDERGRADUATES
Nothing Under $50 $50 to $74 $75 to $99 $100 to $124 $125 to $149 $150 to $174 $175 to $199 $200 to $224
# % # % # % # % # % # % # % # % # %CCC Part-time 65,086 11.5 14,662 2.6 19,311 3.4 20,027 3.5 33,616 5.9 35,762 6.3 22,887 4.1 23,960 4.2 45,417 8.0
Full-time 18,232 12.4 8,090 5.5 7,124 4.8 7,486 5.1 12,919 8.8 9,901 6.7 9,056 6.1 7,124 4.8 10,505 7.1 All 83,318 11.7 22,752 3.2 26,435 3.7 27,513 3.9 46,535 6.5 45,663 6.4 31,943 4.5 31,084 4.4 55,922 7.8
UC Part-time 362 10.6 107 3.1 204 6.0 227 6.7 355 10.4 - - 107 3.1 331 9.7 878 25.8 Full-time 1,239 10.8 405 3.5 340 3.0 548 4.8 1,289 11.2 800 7.0 613 5.3 652 5.7 1,315 11.5 All 1,601 10.8 512 3.4 545 3.7 775 5.2 1,644 11.0 800 5.4 721 4.8 984 6.6 2,193 14.7
CSU Part-time 8,325 18.3 2,513 5.5 1,105 2.4 952 2.1 1,870 4.1 2,078 4.6 2,353 5.2 1,863 4.1 2,951 6.5 Full-time 11,191 14.7 3,834 5.0 3,292 4.3 4,416 5.8 6,311 8.3 4,523 5.9 4,744 6.2 4,058 5.3 5,909 7.7 All 19,516 16.0 6,347 5.2 4,397 3.6 5,368 4.4 8,181 6.7 6,601 5.4 7,097 5.8 5,921 4.9 8,860 7.3
ICU Part-time 1,916 21.4 191 2.1 97 1.1 209 2.3 214 2.4 312 3.5 230 2.6 194 2.2 689 7.7 Full-time 1,584 11.3 794 5.7 292 2.1 665 4.7 1,192 8.5 955 6.8 571 4.1 689 4.9 1,421 10.1 All 3,500 15.2 985 4.3 389 1.7 874 3.8 1,406 6.1 1,268 5.5 801 3.5 883 3.8 2,110 9.2
PCC Part-time 2,235 11.2 251 1.3 711 3.6 398 2.0 2,239 11.2 1,168 5.8 1,462 7.3 367 1.8 1,753 8.8 Full-time 4,711 9.9 1,076 2.3 1,872 3.9 2,022 4.3 3,064 6.5 2,483 5.2 2,662 5.6 1,670 3.5 3,869 8.1 All 6,946 10.3 1,327 2.0 2,583 3.8 2,420 3.6 5,304 7.9 3,651 5.4 4,124 6.1 2,037 3.0 5,622 8.3
ALL Part-time 77,923 12.1 17,723 2.8 21,428 3.3 21,814 3.4 38,294 6.0 39,321 6.1 27,039 4.2 26,715 4.2 51,688 8.0 Full-time 36,957 12.5 14,198 4.8 12,920 4.4 15,137 5.1 24,775 8.3 18,662 6.3 17,646 5.9 14,193 4.8 23,019 7.8 All 114,881 12.2 31,922 3.4 34,348 3.7 36,951 3.9 63,069 6.7 57,983 6.2 44,685 4.8 40,908 4.4 74,707 8.0
$225 to $249 $250 to $274 $275 to $299 $300 to $374 $375 to $449 $450 to $524 $525 to $599 $600 or More Total
# % # % # % # % # % # % # % # % # %CCC Part-time 22,172 3.9 22,530 4.0 16,093 2.8 36,477 6.5 27,536 4.9 32,543 5.8 20,384 3.6 106,570 18.9 565,033 100
Full-time 5,313 3.6 5,192 3.5 3,985 2.7 10,263 7.0 5,192 3.5 6,882 4.7 3,743 2.5 16,421 11.1 147,426 100 All 27,485 3.9 27,722 3.9 20,078 2.8 46,740 6.6 32,728 4.6 39,425 5.5 24,127 3.4 122,991 17.3 712,459 100
UC Part-time 41 1.2 78 2.3 - - 172 5.0 70 2.1 226 6.6 - - 247 7.2 3,407 100 Full-time 631 5.5 151 1.3 297 2.6 1,094 9.5 586 5.1 450 3.9 147 1.3 911 7.9 11,469 100 All 673 4.5 230 1.5 297 2.0 1,266 8.5 657 4.4 676 4.5 147 1.0 1,157 7.8 14,876 100
CSU Part-time 1,126 2.5 1,325 2.9 1,294 2.9 3,750 8.3 2,939 6.5 2,507 5.5 1,160 2.6 7,283 16.0 45,392 100 Full-time 3,603 4.7 3,346 4.4 1,640 2.1 5,038 6.6 3,867 5.1 2,487 3.3 1,357 1.8 6,700 8.8 76,316 100 All 4,729 3.9 4,671 3.8 2,934 2.4 8,788 7.2 6,806 5.6 4,993 4.1 2,517 2.1 13,983 11.5 121,708 100
ICU Part-time 313 3.5 59 0.7 219 2.4 739 8.2 366 4.1 598 6.7 126 1.4 2,497 27.8 8,971 100 Full-time 527 3.8 444 3.2 291 2.1 1,446 10.3 602 4.3 653 4.7 34 0.2 1,851 13.2 14,010 100 All 840 3.7 503 2.2 509 2.2 2,185 9.5 968 4.2 1,251 5.4 160 0.7 4,348 18.9 22,981 100
PCC Part-time 462 2.3 774 3.9 198 1.0 1,211 6.1 961 4.8 1,446 7.2 779 3.9 3,565 17.8 19,978 100 Full-time 1,390 2.9 1,733 3.6 1,571 3.3 3,577 7.5 2,253 4.7 3,030 6.4 2,090 4.4 8,424 17.7 47,496 100 All 1,852 2.7 2,507 3.7 1,769 2.6 4,788 7.1 3,214 4.8 4,475 6.6 2,869 4.3 11,989 17.8 67,474 100
ALL Part-time 24,114 3.8 24,766 3.9 17,803 2.8 42,349 6.6 31,872 5.0 37,319 5.8 22,449 3.5 120,162 18.7 642,781 100 Full-time 11,463 3.9 10,867 3.7 7,783 2.6 21,418 7.2 12,500 4.2 13,501 4.6 7,370 2.5 34,306 11.6 296,717 100 All 35,577 3.8 35,633 3.8 25,587 2.7 63,767 6.8 44,372 4.7 50,821 5.4 29,819 3.2 154,468 16.4 939,498 100
TABLE W-40B: MONTHLY OFF-CAMPUS HOUSEHOLD FOOD EXPENSES BY SEGMENT, COURSE LOAD, AND DEPENDENCY STATUS
Source: California Student Aid Commission 250 2003-04 SEARS

ALL UNDERGRADUATES
Nothing Under $50 $50 to $74 $75 to $99 $100 to $124 $125 to $149 $150 to $174 $175 to $199 $200 to $224
# % # % # % # % # % # % # % # % # %Part-time 218,123 20.5 73,333 6.9 70,900 6.7 51,983 4.9 84,590 7.9 62,089 5.8 43,327 4.1 34,522 3.2 69,267 6.5 Full-time 184,189 22.1 84,793 10.2 67,392 8.1 58,670 7.0 84,956 10.2 52,424 6.3 39,645 4.8 32,709 3.9 50,051 6.0 All 402,312 21.2 158,126 8.3 138,292 7.3 110,653 5.8 169,546 8.9 114,513 6.0 82,973 4.4 67,230 3.5 119,319 6.3
$225 to $249 $250 to $274 $275 to $299 $300 to $374 $375 to $449 $450 to $524 $525 to $599 $600 or More Total
# % # % # % # % # % # % # % # % # %Part-time 29,432 2.8 27,509 2.6 20,966 2.0 50,663 4.8 36,168 3.4 40,940 3.8 25,231 2.4 125,722 11.8 1,064,766 100 Full-time 20,625 2.5 18,734 2.2 14,151 1.7 35,668 4.3 18,397 2.2 19,330 2.3 9,453 1.1 43,013 5.2 834,201 100 All 50,057 2.6 46,244 2.4 35,117 1.8 86,331 4.5 54,566 2.9 60,271 3.2 34,683 1.8 168,735 8.9 1,898,967 100
TABLE W-40C: MONTHLY OFF-CAMPUS HOUSEHOLD FOOD EXPENSES BY SEGMENT, COURSE LOAD, AND DEPENDENCY STATUS
Source: California Student Aid Commission 251 2003-04 SEARS

DEPENDENT UNDERGRADUATES
Nothing Under $50 $50 to $74 $75 to $99 $100 to $124 $125 to $149 $150 to $174 $175 to $199 $200 to $224
# % # % # % # % # % # % # % # % # %CCC Part-time 361 34.3 143 13.6 129 12.3 72 6.8 113 10.7 55 5.2 38 3.6 18 1.7 40 3.8
Full-time 796 35.7 336 15.1 237 10.6 161 7.2 227 10.2 100 4.5 68 3.0 57 2.6 75 3.4 All 1,157 35.2 479 14.6 366 11.1 233 7.1 340 10.4 155 4.7 106 3.2 75 2.3 115 3.5
UC Part-time 51 17.5 37 12.7 21 7.2 32 11.0 48 16.5 18 6.2 17 5.8 8 2.7 22 7.6 Full-time 180 9.6 202 10.8 165 8.8 203 10.8 257 13.7 175 9.3 134 7.1 97 5.2 155 8.3 All 231 10.7 239 11.0 186 8.6 235 10.8 305 14.1 193 8.9 151 7.0 105 4.8 177 8.2
CSU Part-time 56 26.8 15 7.2 15 7.2 23 11.0 28 13.4 16 7.7 10 4.8 8 3.8 13 6.2 Full-time 345 22.0 183 11.7 157 10.0 135 8.6 188 12.0 126 8.0 66 4.2 65 4.1 94 6.0 All 401 22.6 198 11.1 172 9.7 158 8.9 216 12.1 142 8.0 76 4.3 73 4.1 107 6.0
ICU Part-time 14 27.5 2 3.9 5 9.8 3 5.9 4 7.8 1 2.0 1 2.0 2 3.9 5 9.8 Full-time 177 19.1 94 10.2 91 9.8 65 7.0 102 11.0 71 7.7 56 6.0 37 4.0 68 7.3 All 191 19.5 96 9.8 96 9.8 68 7.0 106 10.8 72 7.4 57 5.8 39 4.0 73 7.5
PCC Part-time 86 30.7 23 8.2 18 6.4 21 7.5 27 9.6 17 6.1 20 7.1 9 3.2 23 8.2 Full-time 325 31.0 95 9.1 88 8.4 71 6.8 110 10.5 69 6.6 41 3.9 38 3.6 54 5.2 All 411 31.0 118 8.9 106 8.0 92 6.9 137 10.3 86 6.5 61 4.6 47 3.5 77 5.8
ALL Part-time 568 30.1 220 11.7 188 10.0 151 8.0 220 11.7 107 5.7 86 4.6 45 2.4 103 5.5 Full-time 1,823 23.8 910 11.9 738 9.6 635 8.3 884 11.6 541 7.1 365 4.8 294 3.8 446 5.8 All 2,391 25.1 1,130 11.9 926 9.7 786 8.2 1,104 11.6 648 6.8 451 4.7 339 3.6 549 5.8
$225 to $249 $250 to $274 $275 to $299 $300 to $374 $375 to $449 $450 to $524 $525 to $599 $600 or More Total
# % # % # % # % # % # % # % # % # %CCC Part-time 13 1.2 6 0.6 7 0.7 20 1.9 10 0.9 9 0.9 6 0.6 13 1.2 1,053 100
Full-time 19 0.9 22 1.0 18 0.8 43 1.9 16 0.7 24 1.1 9 0.4 23 1.0 2,231 100 All 32 1.0 28 0.9 25 0.8 63 1.9 26 0.8 33 1.0 15 0.5 36 1.1 3,284 100
UC Part-time 5 1.7 6 2.1 5 1.7 10 3.4 3 1.0 3 1.0 2 0.7 3 1.0 291 100 Full-time 61 3.3 47 2.5 30 1.6 68 3.6 34 1.8 25 1.3 12 0.6 30 1.6 1,875 100 All 66 3.0 53 2.4 35 1.6 78 3.6 37 1.7 28 1.3 14 0.6 33 1.5 2,166 100
CSU Part-time 2 1.0 2 1.0 2 1.0 5 2.4 4 1.9 2 1.0 3 1.4 5 2.4 209 100 Full-time 38 2.4 23 1.5 25 1.6 50 3.2 18 1.1 16 1.0 3 0.2 37 2.4 1,569 100 All 40 2.2 25 1.4 27 1.5 55 3.1 22 1.2 18 1.0 6 0.3 42 2.4 1,778 100
ICU Part-time 4 7.8 1 2.0 2 3.9 2 3.9 - - 1 2.0 1 2.0 3 5.9 51 100 Full-time 21 2.3 23 2.5 18 1.9 38 4.1 18 1.9 11 1.2 4 0.4 32 3.5 926 100 All 25 2.6 24 2.5 20 2.0 40 4.1 18 1.8 12 1.2 5 0.5 35 3.6 977 100
PCC Part-time 3 1.1 6 2.1 3 1.1 4 1.4 3 1.1 4 1.4 5 1.8 8 2.9 280 100 Full-time 19 1.8 27 2.6 14 1.3 39 3.7 10 1.0 14 1.3 6 0.6 27 2.6 1,047 100 All 22 1.7 33 2.5 17 1.3 43 3.2 13 1.0 18 1.4 11 0.8 35 2.6 1,327 100
ALL Part-time 27 1.4 21 1.1 19 1.0 41 2.2 20 1.1 19 1.0 17 0.9 32 1.7 1,884 100 Full-time 158 2.1 142 1.9 105 1.4 238 3.1 96 1.3 90 1.2 34 0.4 149 1.9 7,648 100 All 185 1.9 163 1.7 124 1.3 279 2.9 116 1.2 109 1.1 51 0.5 181 1.9 9,532 100
TABLE U-40A: MONTHLY OFF-CAMPUS HOUSEHOLD FOOD EXPENSES BY SEGMENT, COURSE LOAD, AND DEPENDENCY STATUS
Source: California Student Aid Commission 252 2003-04 SEARS

INDEPENDENT UNDERGRADUATES
Nothing Under $50 $50 to $74 $75 to $99 $100 to $124 $125 to $149 $150 to $174 $175 to $199 $200 to $224
# % # % # % # % # % # % # % # % # %CCC Part-time 182 11.5 41 2.6 54 3.4 56 3.5 94 5.9 100 6.3 64 4.1 67 4.2 127 8.0
Full-time 151 12.4 67 5.5 59 4.8 62 5.1 107 8.8 82 6.7 75 6.1 59 4.8 87 7.1 All 333 11.9 108 3.9 113 4.0 118 4.2 201 7.2 182 6.5 139 5.0 126 4.5 214 7.6
UC Part-time 7 11.1 2 3.2 4 6.3 4 6.3 6 9.5 - - 2 3.2 6 9.5 14 22.2 Full-time 32 10.8 11 3.7 9 3.1 14 4.7 33 11.2 20 6.8 16 5.4 16 5.4 36 12.2 All 39 10.9 13 3.6 13 3.6 18 5.0 39 10.9 20 5.6 18 5.0 22 6.1 50 14.0
CSU Part-time 100 18.4 24 4.4 13 2.4 13 2.4 24 4.4 23 4.2 25 4.6 20 3.7 38 7.0 Full-time 157 15.1 47 4.5 45 4.3 62 5.9 87 8.3 66 6.3 65 6.2 47 4.5 88 8.4 All 257 16.2 71 4.5 58 3.7 75 4.7 111 7.0 89 5.6 90 5.7 67 4.2 126 7.9
ICU Part-time 30 20.8 4 2.8 2 1.4 4 2.8 4 2.8 5 3.5 4 2.8 4 2.8 13 9.0 Full-time 31 10.9 16 5.6 6 2.1 14 4.9 26 9.2 20 7.0 11 3.9 13 4.6 29 10.2 All 61 14.3 20 4.7 8 1.9 18 4.2 30 7.0 25 5.8 15 3.5 17 4.0 42 9.8
PCC Part-time 75 13.4 15 2.7 23 4.1 19 3.4 37 6.6 29 5.2 27 4.8 13 2.3 42 7.5 Full-time 201 12.0 60 3.6 72 4.3 71 4.2 118 7.0 86 5.1 91 5.4 66 3.9 134 8.0 All 276 12.3 75 3.3 95 4.2 90 4.0 155 6.9 115 5.1 118 5.3 79 3.5 176 7.9
ALL Part-time 394 13.6 86 3.0 96 3.3 96 3.3 165 5.7 157 5.4 122 4.2 110 3.8 234 8.1 Full-time 572 12.6 201 4.4 191 4.2 223 4.9 371 8.2 274 6.1 258 5.7 201 4.4 374 8.3 All 966 13.0 287 3.9 287 3.9 319 4.3 536 7.2 431 5.8 380 5.1 311 4.2 608 8.2
$225 to $249 $250 to $274 $275 to $299 $300 to $374 $375 to $449 $450 to $524 $525 to $599 $600 or More Total
# % # % # % # % # % # % # % # % # %CCC Part-time 62 3.9 63 4.0 45 2.8 102 6.5 77 4.9 91 5.8 57 3.6 298 18.9 1,580 100
Full-time 44 3.6 43 3.5 33 2.7 85 7.0 43 3.5 57 4.7 31 2.5 136 11.1 1,221 100 All 106 3.8 106 3.8 78 2.8 187 6.7 120 4.3 148 5.3 88 3.1 434 15.5 2,801 100
UC Part-time 1 1.6 2 3.2 - - 4 6.3 1 1.6 4 6.3 - - 6 9.5 63 100 Full-time 15 5.1 4 1.4 8 2.7 28 9.5 15 5.1 11 3.7 4 1.4 23 7.8 295 100 All 16 4.5 6 1.7 8 2.2 32 8.9 16 4.5 15 4.2 4 1.1 29 8.1 358 100
CSU Part-time 18 3.3 18 3.3 16 2.9 46 8.5 31 5.7 27 5.0 17 3.1 90 16.6 543 100 Full-time 46 4.4 44 4.2 25 2.4 66 6.3 51 4.9 33 3.2 19 1.8 95 9.1 1,043 100 All 64 4.0 62 3.9 41 2.6 112 7.1 82 5.2 60 3.8 36 2.3 185 11.7 1,586 100
ICU Part-time 5 3.5 2 1.4 5 3.5 14 9.7 7 4.9 10 6.9 2 1.4 29 20.1 144 100 Full-time 11 3.9 10 3.5 5 1.8 26 9.2 16 5.6 12 4.2 1 0.4 37 13.0 284 100 All 16 3.7 12 2.8 10 2.3 40 9.3 23 5.4 22 5.1 3 0.7 66 15.4 428 100
PCC Part-time 24 4.3 22 3.9 11 2.0 43 7.7 27 4.8 35 6.2 17 3.0 102 18.2 561 100 Full-time 58 3.5 76 4.5 50 3.0 124 7.4 80 4.8 105 6.3 46 2.7 241 14.4 1,679 100 All 82 3.7 98 4.4 61 2.7 167 7.5 107 4.8 140 6.3 63 2.8 343 15.3 2,240 100
ALL Part-time 110 3.8 107 3.7 77 2.7 209 7.2 143 4.9 167 5.8 93 3.2 525 18.2 2,891 100 Full-time 174 3.8 177 3.9 121 2.7 329 7.3 205 4.5 218 4.8 101 2.2 532 11.8 4,522 100 All 284 3.8 284 3.8 198 2.7 538 7.3 348 4.7 385 5.2 194 2.6 1,057 14.3 7,413 100
TABLE U-40B: MONTHLY OFF-CAMPUS HOUSEHOLD FOOD EXPENSES BY SEGMENT, COURSE LOAD, AND DEPENDENCY STATUS
Source: California Student Aid Commission 253 2003-04 SEARS
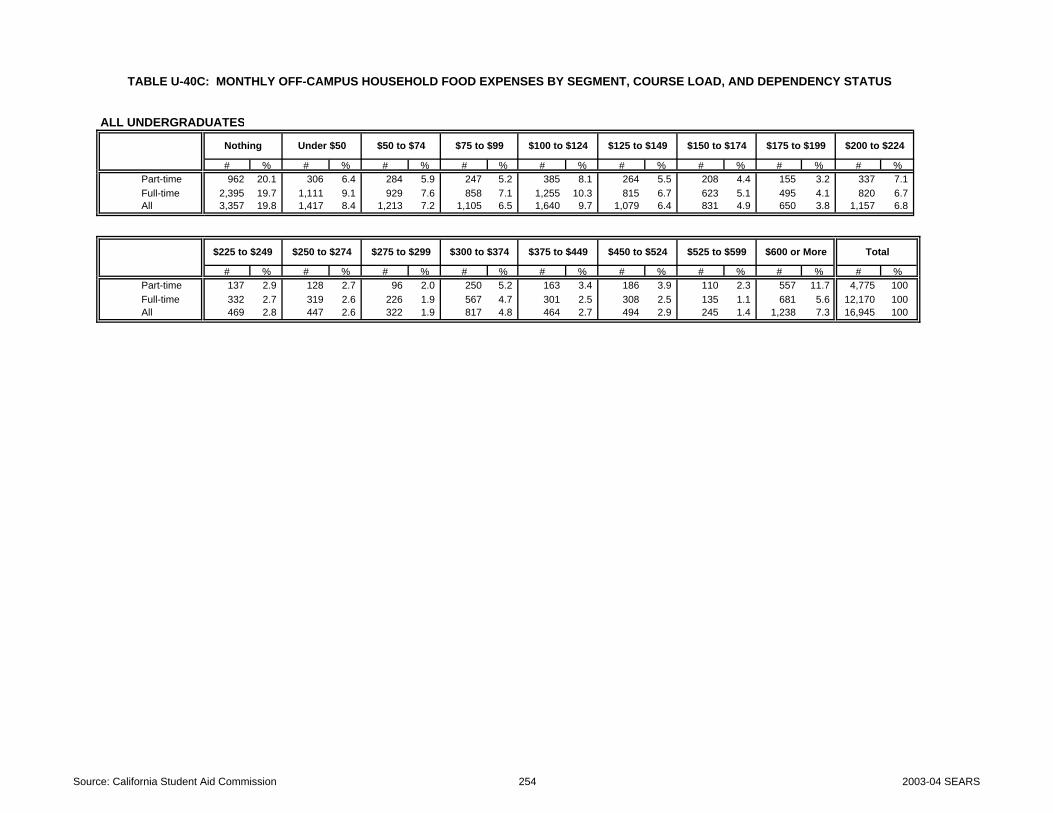
ALL UNDERGRADUATES
Nothing Under $50 $50 to $74 $75 to $99 $100 to $124 $125 to $149 $150 to $174 $175 to $199 $200 to $224
# % # % # % # % # % # % # % # % # %Part-time 962 20.1 306 6.4 284 5.9 247 5.2 385 8.1 264 5.5 208 4.4 155 3.2 337 7.1 Full-time 2,395 19.7 1,111 9.1 929 7.6 858 7.1 1,255 10.3 815 6.7 623 5.1 495 4.1 820 6.7 All 3,357 19.8 1,417 8.4 1,213 7.2 1,105 6.5 1,640 9.7 1,079 6.4 831 4.9 650 3.8 1,157 6.8
$225 to $249 $250 to $274 $275 to $299 $300 to $374 $375 to $449 $450 to $524 $525 to $599 $600 or More Total
# % # % # % # % # % # % # % # % # %Part-time 137 2.9 128 2.7 96 2.0 250 5.2 163 3.4 186 3.9 110 2.3 557 11.7 4,775 100 Full-time 332 2.7 319 2.6 226 1.9 567 4.7 301 2.5 308 2.5 135 1.1 681 5.6 12,170 100 All 469 2.8 447 2.6 322 1.9 817 4.8 464 2.7 494 2.9 245 1.4 1,238 7.3 16,945 100
TABLE U-40C: MONTHLY OFF-CAMPUS HOUSEHOLD FOOD EXPENSES BY SEGMENT, COURSE LOAD, AND DEPENDENCY STATUS
Source: California Student Aid Commission 254 2003-04 SEARS

DEPENDENT UNDERGRADUATES INDEPENDENT UNDERGRADUATES ALL UNDERGRADUATES
CCC Part-time 692 130$ 99$ CCC Part-time 1,398 329$ 262$ CCC Part-time 2,090 263$ 199$ Full-time 1,435 127$ 96$ Full-time 1,070 267$ 206$ Full-time 2,505 187$ 124$ All 2,127 128$ 98$ All 2,468 302$ 248$ All 4,595 222$ 170$
UC Part-time 240 147$ 111$ UC Part-time 56 251$ 204$ UC Part-time 296 166$ 117$ Full-time 1,695 159$ 126$ Full-time 263 253$ 208$ Full-time 1,958 172$ 134$ All 1,935 157$ 122$ All 319 253$ 207$ All 2,254 171$ 131$
CSU Part-time 153 166$ 124$ CSU Part-time 443 330$ 282$ CSU Part-time 596 288$ 214$ Full-time 1,224 153$ 115$ Full-time 886 256$ 205$ Full-time 2,110 196$ 140$
All 1,377 154$ 116$ All 1,329 281$ 219$ All 2,706 216$ 155$ ICU Part-time 37 223$ 209$ ICU Part-time 114 361$ 386$ ICU Part-time 151 327$ 324$ Full-time 749 173$ 130$ Full-time 253 277$ 218$ Full-time 1,002 200$ 149$
All 786 176$ 132$ All 367 303$ 258$ All 1,153 216$ 168$ PCC Part-time 194 177$ 146$ PCC Part-time 486 328$ 250$ PCC Part-time 680 285$ 215$ Full-time 722 168$ 123$ Full-time 1,478 302$ 268$ Full-time 2,200 258$ 214$
All 916 170$ 126$ All 1,964 309$ 262$ All 2,880 265$ 214$ ALL Part-time 1,316 147$ 102$ ALL Part-time 2,497 329$ 263$ ALL Part-time 3,813 266$ 200$
Full-time 5,825 153$ 110$ Full-time 3,950 277$ 212$ Full-time 9,775 203$ 138$ All 7,141 152$ 107$ All 6,447 297$ 243$ All 13,588 221$ 166$
Note: "Nothing" category was excluded from the means and median calculations.
TABLE M-40: MEAN AND MEDIAN MONTHLY OFF-CAMPUS HOUSEHOLD FOOD EXPENSES BY SEGMENT, COURSE LOAD, AND DEPENDENCY STATUS
Number Mean Median Number MedianMean Median Number Mean
Source: California Student Aid Commission 255 2003-04 SEARS

Questions for Tables: W-41, U-41, and M-41
What are your monthly average expenses for food or meals eaten away from your local residence,
such as dining out or snacks (e.g., lunches bought on campus) during the current academic year? 00 Nothing 03 $50 to $74 06 $125 to $149 09 $250 to $299 01 Under $25 04 $75 to $99 07 $150 to $199 10 $300 or more 02 $25 to $49 05 $100 to $124 08 $200 to $249
256 2003-04 SEARS

TABLE W-41: MONTHLY FOOD EXPENSES FOR MEALS AWAY FROM HOME BY SEGMENT, COURSE LOAD, AND DEPENDENCY STATUS
DEPENDENT UNDERGRADUATESNothing Under $25 $25 to $49 $50 to $74 $75 to $99 $100 to $124 $125 to $149 $150 to $199 $200 to $249 $250 to $299 $300 or More Total# % # % # % # % # % # % # % # % # % # % # % #
CCC Part-time 42,199 11.2 35,762 9.5 58,291 15.5 71,523 19.0 46,490 12.3 51,139 13.6 19,669 5.2 15,378 4.1 18,238 4.8 6,437 1.7 11,444 3.0 376,570 100 Full-time 24,752 9.2 27,046 10.0 47,210 17.5 47,090 17.5 34,653 12.9 37,068 13.8 13,765 5.1 11,954 4.4 15,093 5.6 2,777 1.0 8,090 3.0 269,498 100 All 66,951 10.4 62,808 9.7 105,501 16.3 118,613 18.4 81,143 12.6 88,207 13.7 33,434 5.2 27,332 4.2 33,331 5.2 9,214 1.4 19,534 3.0 646,068 100
UC Part-time 2,222 12.4 1,273 7.1 2,605 14.5 2,797 15.6 2,026 11.3 3,099 17.3 1,069 6.0 910 5.1 602 3.4 367 2.0 962 5.4 17,932 100 Full-time 4,226 5.9 4,708 6.5 12,385 17.2 12,365 17.2 10,168 14.1 10,320 14.4 5,097 7.1 4,760 6.6 4,060 5.6 1,419 2.0 2,406 3.3 71,912 100 All 6,448 7.2 5,981 6.7 14,990 16.7 15,162 16.9 12,194 13.6 13,419 14.9 6,166 6.9 5,670 6.3 4,661 5.2 1,785 2.0 3,368 3.7 89,844 100
CSU Part-time 1,782 9.6 1,197 6.4 1,879 10.1 2,867 15.4 2,271 12.2 3,308 17.8 1,474 7.9 1,575 8.5 1,109 6.0 185 1.0 950 5.1 18,596 100 Full-time 10,369 8.0 9,034 7.0 18,332 14.1 23,527 18.1 16,936 13.0 18,971 14.6 8,469 6.5 7,498 5.8 9,056 7.0 2,809 2.2 4,890 3.8 129,891 100
All 12,151 8.2 10,231 6.9 20,211 13.6 26,394 17.8 19,207 12.9 22,279 15.0 9,942 6.7 9,073 6.1 10,165 6.8 2,994 2.0 5,840 3.9 148,487 100 ICU Part-time 407 14.8 72 2.6 212 7.7 468 17.0 155 5.6 483 17.6 184 6.7 158 5.8 391 14.2 - - 217 7.9 2,745 100 Full-time 3,228 7.4 2,448 5.6 5,473 12.5 6,662 15.2 5,431 12.4 7,250 16.5 3,406 7.8 2,793 6.4 3,349 7.6 810 1.8 2,987 6.8 43,836 100
All 3,634 7.8 2,520 5.4 5,685 12.2 7,130 15.3 5,586 12.0 7,733 16.6 3,590 7.7 2,951 6.3 3,740 8.0 810 1.7 3,203 6.9 46,582 100 PCC Part-time 371 6.1 511 8.4 539 8.9 998 16.5 700 11.6 1,076 17.8 341 5.6 215 3.6 600 9.9 333 5.5 364 6.0 6,047 100 Full-time 925 4.1 2,179 9.6 3,036 13.4 3,645 16.1 2,387 10.6 3,813 16.9 1,256 5.6 1,210 5.4 1,987 8.8 473 2.1 1,676 7.4 22,587 100
All 1,295 4.5 2,689 9.4 3,575 12.5 4,643 16.2 3,087 10.8 4,889 17.1 1,597 5.6 1,425 5.0 2,587 9.0 807 2.8 2,040 7.1 28,634 100 ALL Part-time 46,980 11.1 38,816 9.2 63,526 15.1 78,653 18.6 51,641 12.2 59,104 14.0 22,737 5.4 18,236 4.3 20,939 5.0 7,321 1.7 13,937 3.3 421,889 100
Full-time 43,500 8.1 45,414 8.4 86,436 16.1 93,290 17.3 69,575 12.9 77,422 14.4 31,992 5.9 28,215 5.2 33,545 6.2 8,289 1.5 20,048 3.7 537,725 100 All 90,480 9.4 84,230 8.8 149,962 15.6 171,943 17.9 121,216 12.6 136,526 14.2 54,728 5.7 46,450 4.8 54,484 5.7 15,610 1.6 33,985 3.5 959,614 100
INDEPENDENT UNDERGRADUATESNothing Under $25 $25 to $49 $50 to $74 $75 to $99 $100 to $124 $125 to $149 $150 to $199 $200 to $249 $250 to $299 $300 or More Total# % # % # % # % # % # % # % # % # % # % # % #
CCC Part-time 31,470 5.5 42,199 7.4 57,934 10.2 72,596 12.8 55,073 9.7 77,960 13.7 38,980 6.9 51,854 9.1 48,993 8.6 16,808 3.0 74,384 13.1 568,251 100 Full-time 10,625 7.2 11,471 7.8 19,077 12.9 22,096 15.0 12,557 8.5 21,854 14.8 10,022 6.8 10,746 7.3 10,988 7.4 4,830 3.3 13,282 9.0 147,548 100 All 42,095 5.9 53,670 7.5 77,011 10.8 94,692 13.2 67,630 9.4 99,814 13.9 49,002 6.8 62,600 8.7 59,981 8.4 21,638 3.0 87,666 12.2 715,799 100
UC Part-time 292 8.6 301 8.8 219 6.4 388 11.4 747 21.9 376 11.0 362 10.6 134 3.9 382 11.2 27 0.8 180 5.3 3,407 100 Full-time 849 7.4 515 4.5 1,018 8.9 1,366 11.9 1,720 15.0 2,086 18.2 960 8.4 1,016 8.9 473 4.1 582 5.1 885 7.7 11,469 100 All 1,141 7.7 815 5.5 1,237 8.3 1,754 11.8 2,467 16.6 2,462 16.5 1,322 8.9 1,150 7.7 855 5.7 608 4.1 1,065 7.2 14,876 100
CSU Part-time 6,799 15.0 1,405 3.1 3,293 7.3 5,192 11.4 4,376 9.6 6,745 14.9 3,709 8.2 3,624 8.0 3,587 7.9 508 1.1 6,154 13.6 45,393 100 Full-time 7,361 9.6 3,664 4.8 8,930 11.7 9,311 12.2 8,178 10.7 12,542 16.4 6,533 8.6 7,097 9.3 4,936 6.5 2,419 3.2 5,427 7.1 76,397 100
All 14,160 11.6 5,069 4.2 12,223 10.0 14,503 11.9 12,554 10.3 19,287 15.8 10,242 8.4 10,721 8.8 8,523 7.0 2,927 2.4 11,581 9.5 121,790 100 ICU Part-time 1,793 20.0 160 1.8 777 8.7 334 3.7 390 4.3 1,438 16.0 661 7.4 549 6.1 355 4.0 299 3.3 2,216 24.7 8,971 100 Full-time 1,236 8.8 725 5.2 1,193 8.5 1,109 7.9 1,037 7.4 2,213 15.8 1,497 10.7 1,194 8.5 1,868 13.3 503 3.6 1,436 10.2 14,010 100
All 3,028 13.2 885 3.9 1,970 8.6 1,443 6.3 1,427 6.2 3,651 15.9 2,158 9.4 1,743 7.6 2,223 9.7 801 3.5 3,652 15.9 22,981 100 PCC Part-time 450 2.3 1,671 8.4 3,113 15.7 2,807 14.1 1,689 8.5 2,533 12.7 1,098 5.5 1,808 9.1 1,295 6.5 682 3.4 2,746 13.8 19,890 100 Full-time 1,772 3.8 3,498 7.4 5,066 10.8 6,014 12.8 4,830 10.3 6,589 14.0 2,865 6.1 4,112 8.7 5,776 12.3 875 1.9 5,624 12.0 47,020 100
All 2,222 3.3 5,169 7.7 8,179 12.2 8,820 13.2 6,518 9.7 9,122 13.6 3,963 5.9 5,920 8.8 7,072 10.6 1,557 2.3 8,370 12.5 66,910 100 ALL Part-time 40,804 6.3 45,736 7.1 65,337 10.1 81,317 12.6 62,273 9.6 89,051 13.8 44,810 6.9 57,969 9.0 54,612 8.5 18,323 2.8 85,680 13.3 645,912 100
Full-time 21,842 7.4 19,872 6.7 35,284 11.9 39,895 13.5 28,322 9.6 45,284 15.3 21,876 7.4 24,165 8.2 24,041 8.1 9,208 3.1 26,654 9.0 296,444 100 All 62,646 6.6 65,608 7.0 100,620 10.7 121,212 12.9 90,595 9.6 134,335 14.3 66,687 7.1 82,134 8.7 78,653 8.3 27,531 2.9 112,334 11.9 942,356 100
ALL UNDERGRADUATESPart-time 87,784 8.2 84,552 7.9 128,863 12.1 159,970 15.0 113,914 10.7 148,155 13.9 67,547 6.3 76,205 7.1 75,551 7.1 25,645 2.4 99,617 9.3 1,067,801 100 Full-time 65,342 7.8 65,287 7.8 121,720 14.6 133,185 16.0 97,897 11.7 122,706 14.7 53,868 6.5 52,380 6.3 57,586 6.9 17,496 2.1 46,701 5.6 834,169 100 All 153,126 8.1 149,838 7.9 250,583 13.2 293,155 15.4 211,811 11.1 270,861 14.2 121,415 6.4 128,585 6.8 133,137 7.0 43,141 2.3 146,318 7.7 1,901,969 100
%
%
Source: California Student Aid Commission 257 2003-04 SEARS

TABLE U-41: MONTHLY FOOD EXPENSES FOR MEALS AWAY FROM HOME BY SEGMENT, COURSE LOAD, AND DEPENDENCY STATUS
DEPENDENT UNDERGRADUATESNothing Under $25 $25 to $49 $50 to $74 $75 to $99 $100 to $124 $125 to $149 $150 to $199 $200 to $249 $250 to $299 $300 or More Total# % # % # % # % # % # % # % # % # % # % # % #
CCC Part-time 118 11.2 100 9.5 163 15.5 200 19.0 130 12.3 143 13.6 55 5.2 43 4.1 51 4.8 18 1.7 32 3.0 1,053 100 Full-time 205 9.2 224 10.0 391 17.5 390 17.5 287 12.9 307 13.8 114 5.1 99 4.4 125 5.6 23 1.0 67 3.0 2,232 100 All 323 9.8 324 9.9 554 16.9 590 18.0 417 12.7 450 13.7 169 5.1 142 4.3 176 5.4 41 1.2 99 3.0 3,285 100
UC Part-time 33 11.4 20 6.9 42 14.5 47 16.2 32 11.0 52 17.9 16 5.5 17 5.9 9 3.1 6 2.1 16 5.5 290 100 Full-time 112 6.0 122 6.5 311 16.6 323 17.2 266 14.2 273 14.6 135 7.2 124 6.6 107 5.7 38 2.0 65 3.5 1,876 100 All 145 6.7 142 6.6 353 16.3 370 17.1 298 13.8 325 15.0 151 7.0 141 6.5 116 5.4 44 2.0 81 3.7 2,166 100
CSU Part-time 22 10.5 12 5.7 21 10.0 33 15.8 24 11.5 39 18.7 18 8.6 16 7.7 14 6.7 2 1.0 8 3.8 209 100 Full-time 132 8.4 109 6.9 224 14.3 288 18.3 208 13.2 229 14.6 97 6.2 94 6.0 97 6.2 30 1.9 62 3.9 1,570 100
All 154 8.7 121 6.8 245 13.8 321 18.0 232 13.0 268 15.1 115 6.5 110 6.2 111 6.2 32 1.8 70 3.9 1,779 100 ICU Part-time 7 13.5 2 3.8 5 9.6 9 17.3 4 7.7 7 13.5 4 7.7 3 5.8 7 13.5 - - 4 7.7 52 100 Full-time 68 7.4 52 5.6 120 13.0 140 15.1 110 11.9 152 16.4 73 7.9 57 6.2 71 7.7 17 1.8 65 7.0 925 100
All 75 7.7 54 5.5 125 12.8 149 15.3 114 11.7 159 16.3 77 7.9 60 6.1 78 8.0 17 1.7 69 7.1 977 100 PCC Part-time 23 8.3 22 7.9 31 11.2 57 20.6 35 12.6 35 12.6 18 6.5 11 4.0 22 7.9 5 1.8 18 6.5 277 100 Full-time 46 4.4 93 8.9 135 13.0 177 17.0 102 9.8 167 16.0 51 4.9 70 6.7 95 9.1 19 1.8 86 8.3 1,041 100
All 69 5.2 115 8.7 166 12.6 234 17.8 137 10.4 202 15.3 69 5.2 81 6.1 117 8.9 24 1.8 104 7.9 1,318 100 ALL Part-time 203 10.8 156 8.3 262 13.9 346 18.4 225 12.0 276 14.7 111 5.9 90 4.8 103 5.5 31 1.6 78 4.1 1,881 100
Full-time 563 7.4 600 7.8 1,181 15.5 1,318 17.2 973 12.7 1,128 14.8 470 6.1 444 5.8 495 6.5 127 1.7 345 4.5 7,644 100 All 766 8.0 756 7.9 1,443 15.1 1,664 17.5 1,198 12.6 1,404 14.7 581 6.1 534 5.6 598 6.3 158 1.7 423 4.4 9,525 100
INDEPENDENT UNDERGRADUATESNothing Under $25 $25 to $49 $50 to $74 $75 to $99 $100 to $124 $125 to $149 $150 to $199 $200 to $249 $250 to $299 $300 or More Total# % # % # % # % # % # % # % # % # % # % # % #
CCC Part-time 88 5.5 118 7.4 162 10.2 203 12.8 154 9.7 218 13.7 109 6.9 145 9.1 137 8.6 47 3.0 208 13.1 1,589 100 Full-time 88 7.2 95 7.8 158 12.9 183 15.0 104 8.5 181 14.8 83 6.8 89 7.3 91 7.4 40 3.3 110 9.0 1,222 100 All 176 6.3 213 7.6 320 11.4 386 13.7 258 9.2 399 14.2 192 6.8 234 8.3 228 8.1 87 3.1 318 11.3 2,811 100
UC Part-time 6 9.5 5 7.9 5 7.9 6 9.5 13 20.6 7 11.1 7 11.1 3 4.8 7 11.1 1 1.6 3 4.8 63 100 Full-time 22 7.5 14 4.7 26 8.8 35 11.9 43 14.6 54 18.3 24 8.1 27 9.2 13 4.4 14 4.7 23 7.8 295 100 All 28 7.8 19 5.3 31 8.7 41 11.5 56 15.6 61 17.0 31 8.7 30 8.4 20 5.6 15 4.2 26 7.3 358 100
CSU Part-time 82 15.1 19 3.5 43 7.9 67 12.3 48 8.8 77 14.2 44 8.1 45 8.3 44 8.1 7 1.3 67 12.3 543 100 Full-time 110 10.5 52 5.0 121 11.6 129 12.4 119 11.4 170 16.3 87 8.3 83 8.0 68 6.5 33 3.2 71 6.8 1,043 100
All 192 12.1 71 4.5 164 10.3 196 12.4 167 10.5 247 15.6 131 8.3 128 8.1 112 7.1 40 2.5 138 8.7 1,586 100 ICU Part-time 29 20.1 3 2.1 12 8.3 6 4.2 8 5.6 25 17.4 12 8.3 10 6.9 7 4.9 5 3.5 27 18.8 144 100 Full-time 24 8.5 16 5.6 25 8.8 22 7.7 23 8.1 45 15.8 28 9.9 25 8.8 36 12.7 11 3.9 29 10.2 284 100
All 53 12.4 19 4.4 37 8.6 28 6.5 31 7.2 70 16.4 40 9.3 35 8.2 43 10.0 16 3.7 56 13.1 428 100 PCC Part-time 21 3.8 41 7.4 73 13.1 66 11.8 54 9.7 77 13.8 29 5.2 55 9.9 49 8.8 17 3.1 75 13.5 557 100 Full-time 91 5.5 150 9.0 190 11.4 210 12.6 175 10.5 230 13.8 87 5.2 143 8.6 181 10.9 37 2.2 172 10.3 1,666 100
All 112 5.0 191 8.6 263 11.8 276 12.4 229 10.3 307 13.8 116 5.2 198 8.9 230 10.3 54 2.4 247 11.1 2,223 100 ALL Part-time 226 7.8 186 6.4 295 10.2 348 12.0 277 9.6 404 14.0 201 6.9 258 8.9 244 8.4 77 2.7 380 13.1 2,896 100
Full-time 335 7.4 327 7.3 520 11.5 579 12.8 464 10.3 680 15.1 309 6.9 367 8.1 389 8.6 135 3.0 405 9.0 4,510 100 All 561 7.6 513 6.9 815 11.0 927 12.5 741 10.0 1,084 14.6 510 6.9 625 8.4 633 8.5 212 2.9 785 10.6 7,406 100
ALL UNDERGRADUATESPart-time 429 9.0 342 7.2 557 11.7 694 14.5 502 10.5 680 14.2 312 6.5 348 7.3 347 7.3 108 2.3 458 9.6 4,777 100 Full-time 898 7.4 927 7.6 1,701 14.0 1,897 15.6 1,437 11.8 1,808 14.9 779 6.4 811 6.7 884 7.3 262 2.2 750 6.2 12,154 100 All 1,327 7.8 1,269 7.5 2,258 13.3 2,591 15.3 1,939 11.5 2,488 14.7 1,091 6.4 1,159 6.8 1,231 7.3 370 2.2 1,208 7.1 16,931 100
%
%
Source: California Student Aid Commission 258 2003-04 SEARS

DEPENDENT UNDERGRADUATES INDEPENDENT UNDERGRADUATES ALL UNDERGRADUATES
CCC Part-time 935 95$ 75$ CCC Part-time 1,501 140$ 112$ CCC Part-time 2,436 123$ 98$ Full-time 2,027 94$ 75$ Full-time 1,134 125$ 103$ Full-time 3,161 105$ 83$ All 2,962 94$ 75$ All 2,635 133$ 110$ All 5,597 113$ 93$
UC Part-time 257 107$ 89$ UC Part-time 57 120$ 96$ UC Part-time 314 109$ 90$ Full-time 1,764 104$ 85$ Full-time 273 130$ 107$ Full-time 2,037 107$ 88$ All 2,021 104$ 85$ All 330 128$ 105$ All 2,351 108$ 89$
CSU Part-time 187 113$ 104$ CSU Part-time 461 144$ 118$ CSU Part-time 648 135$ 112$ Full-time 1,438 105$ 97$ Full-time 933 125$ 108$ Full-time 2,371 113$ 95$
All 1,625 106$ 89$ All 1,394 131$ 111$ All 3,019 118$ 100$ ICU Part-time 45 130$ 113$ ICU Part-time 115 169$ 143$ ICU Part-time 160 158$ 132$ Full-time 857 119$ 100$ Full-time 260 147$ 126$ Full-time 1,117 126$ 106$
All 902 120$ 101$ All 375 154$ 131$ All 1,277 130$ 110$ PCC Part-time 254 113$ 101$ PCC Part-time 536 139$ 103$ PCC Part-time 790 130$ 103$ Full-time 995 119$ 94$ Full-time 1,575 131$ 111$ Full-time 2,570 127$ 106$
All 1,249 118$ 96$ All 2,111 133$ 109$ All 3,360 128$ 105$ ALL Part-time 1,678 103$ 78$ ALL Part-time 2,670 141$ 112$ ALL Part-time 4,348 126$ 100$
Full-time 7,081 105$ 86$ Full-time 4,175 129$ 107$ Full-time 11,256 114$ 93$ All 8,759 105$ 83$ All 6,845 134$ 111$ All 15,604 118$ 97$
Note: "Nothing" category was excluded from the means and median calculations.
TABLE M-41: MEAN AND MEDIAN MONTHLY FOOD EXPENSES FOR MEALS AWAY FROM HOME BY SEGMENT, COURSE LOAD, AND DEPENDENCY STATUS
Number Mean Median Number MedianMean Median Number Mean
Source: California Student Aid Commission 259 2003-04 SEARS
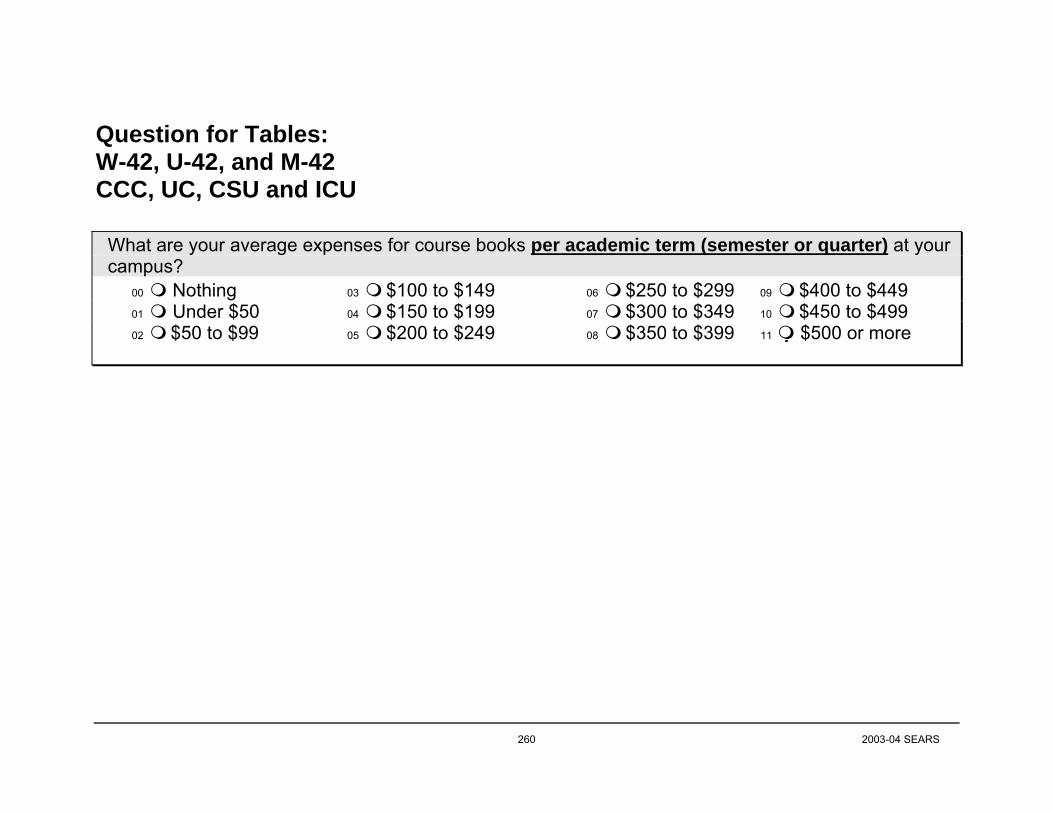
Question for Tables: W-42, U-42, and M-42 CCC, UC, CSU and ICU
What are your average expenses for course books per academic term (semester or quarter) at your
campus? 00 Nothing 03 $100 to $149 06 $250 to $299 09 $400 to $449 01 Under $50 04 $150 to $199 07 $300 to $349 10 $450 to $499
02 $50 to $99 05 $200 to $249 08 $350 to $399 11 $500 or more
260 2003-04 SEARS

DEPENDENT UNDERGRADUATESNothing Less than $100# % # % # % # % # % # % # % # % # % # % # % #
CCC Part-time 20,027 5.3 23,245 6.1 25,391 6.7 40,768 10.8 78,318 20.7 57,576 15.2 54,000 14.3 31,828 8.4 18,596 4.9 10,371 2.7 17,881 4.7 378,001 100 Full-time 10,746 4.0 5,554 2.0 7,969 2.9 13,523 5.0 36,947 13.6 41,415 15.2 53,972 19.8 36,947 13.6 28,374 10.4 11,712 4.3 24,752 9.1 271,911 100 All 30,773 4.7 28,799 4.4 33,360 5.1 54,291 8.4 115,265 17.7 98,991 15.2 107,972 16.6 68,775 10.6 46,970 7.2 22,083 3.4 42,633 6.6 649,912 100
UC Part-time 456 1.7 634 2.3 938 3.5 3,542 13.0 4,646 17.1 5,300 19.5 4,338 16.0 3,341 12.3 1,852 6.8 884 3.3 1,247 4.6 27,177 100 Full-time 508 0.5 1,958 1.8 5,763 5.3 13,560 12.4 21,470 19.6 21,974 20.0 19,524 17.8 11,213 10.2 6,172 5.6 2,759 2.5 4,816 4.4 109,717 100 All 964 0.7 2,592 1.9 6,700 4.9 17,102 12.5 26,116 19.1 27,274 19.9 23,862 17.4 14,554 10.6 8,024 5.9 3,643 2.7 6,062 4.4 136,893 100
CSU Part-time 111 0.6 479 2.4 1,025 5.2 939 4.8 2,607 13.3 4,363 22.2 2,795 14.2 2,505 12.7 1,670 8.5 921 4.7 2,247 11.4 19,663 100 Full-time 1,147 0.8 965 0.6 2,712 1.8 9,160 6.1 19,850 13.2 22,913 15.3 25,880 17.2 22,947 15.3 17,678 11.8 10,659 7.1 16,327 10.9 150,238 100
All 1,258 0.7 1,445 0.9 3,737 2.2 10,099 5.9 22,457 13.2 27,276 16.1 28,675 16.9 25,452 15.0 19,348 11.4 11,580 6.8 18,574 10.9 169,901 100 ICU Part-time 49 1.0 - - 96 1.9 67 1.3 279 5.5 365 7.3 521 10.4 933 18.5 927 18.4 532 10.6 1,262 25.1 5,028 100 Full-time 862 1.0 204 0.2 771 0.9 1,550 1.8 3,928 4.5 7,193 8.2 9,680 11.0 15,516 17.7 12,074 13.7 11,207 12.8 24,904 28.3 87,888 100
All 911 1.0 204 0.2 867 0.9 1,616 1.7 4,206 4.5 7,557 8.1 10,201 11.0 16,449 17.7 13,001 14.0 11,739 12.6 26,166 28.2 92,917 100 ALL Part-time 20,643 4.8 24,358 5.7 27,450 6.4 45,316 10.5 85,850 20.0 67,604 15.7 61,654 14.3 38,606 9.0 23,045 5.4 12,708 3.0 22,636 5.3 429,869 100
Full-time 13,262 2.1 8,682 1.4 17,214 2.8 37,792 6.1 82,195 13.3 93,495 15.1 109,056 17.6 86,623 14.0 64,298 10.4 36,337 5.9 70,799 11.4 619,753 100 All 33,906 3.2 33,040 3.1 44,664 4.3 83,108 7.9 168,044 16.0 161,099 15.3 170,710 16.3 125,229 11.9 87,343 8.3 49,045 4.7 93,434 8.9 1,049,623 100
INDEPENDENT UNDERGRADUATESNothing Less than $100
# % # % # % # % # % # % # % # % # % # % # % #CCC Part-time 21,099 3.7 61,153 10.7 75,099 13.1 86,543 15.1 101,921 17.8 69,378 12.1 55,788 9.7 45,417 7.9 20,742 3.6 10,371 1.8 24,676 4.3 572,187 100
Full-time 8,211 5.5 4,588 3.1 5,071 3.4 8,090 5.5 17,991 12.1 17,508 11.8 23,062 15.6 20,405 13.8 15,093 10.2 8,331 5.6 19,923 13.4 148,273 100 All 29,310 4.1 65,741 9.1 80,170 11.1 94,633 13.1 119,912 16.6 86,886 12.1 78,850 10.9 65,822 9.1 35,835 5.0 18,702 2.6 44,599 6.2 720,460 100
UC Part-time - - - - 292 7.7 257 6.8 809 21.3 532 14.0 740 19.5 287 7.6 301 7.9 189 5.0 395 10.4 3,801 100 Full-time 76 0.6 75 0.6 804 6.1 1,045 7.9 2,312 17.5 2,424 18.3 2,451 18.5 1,617 12.2 757 5.7 432 3.3 1,225 9.3 13,218 100 All 76 0.4 75 0.4 1,096 6.4 1,302 7.7 3,121 18.3 2,956 17.4 3,191 18.7 1,904 11.2 1,058 6.2 621 3.7 1,620 9.5 17,018 100
CSU Part-time 851 1.7 1,762 3.6 3,150 6.4 5,954 12.1 7,185 14.6 7,256 14.7 8,026 16.3 5,597 11.4 4,067 8.3 1,995 4.0 3,424 7.0 49,266 100 Full-time 492 0.6 793 1.0 1,805 2.2 3,473 4.3 7,455 9.3 10,657 13.3 13,367 16.6 10,662 13.3 8,792 10.9 5,925 7.4 16,998 21.1 80,419 100
All 1,343 1.0 2,556 2.0 4,954 3.8 9,427 7.3 14,640 11.3 17,913 13.8 21,393 16.5 16,259 12.5 12,859 9.9 7,920 6.1 20,422 15.7 129,685 100 ICU Part-time 876 9.1 42 0.4 457 4.7 899 9.3 1,498 15.5 1,124 11.7 867 9.0 934 9.7 607 6.3 730 7.6 1,602 16.6 9,637 100 Full-time 198 1.2 282 1.7 382 2.3 838 5.0 933 5.6 1,200 7.2 1,875 11.2 1,733 10.4 1,982 11.9 1,900 11.4 5,352 32.1 16,675 100
All 1,074 4.1 324 1.2 839 3.2 1,737 6.6 2,431 9.2 2,324 8.8 2,743 10.4 2,668 10.1 2,589 9.8 2,630 10.0 6,954 26.4 26,312 100 ALL Part-time 22,826 3.6 62,957 9.9 78,998 12.4 93,653 14.8 111,413 17.5 78,289 12.3 65,421 10.3 52,235 8.2 25,717 4.1 13,285 2.1 30,097 4.7 634,891 100
Full-time 8,976 3.5 5,738 2.2 8,062 3.1 13,446 5.2 28,691 11.1 31,789 12.3 40,756 15.8 34,417 13.3 26,624 10.3 16,588 6.4 43,498 16.8 258,584 100 All 31,803 3.6 68,696 7.7 87,060 9.7 107,099 12.0 140,104 15.7 110,078 12.3 106,177 11.9 86,652 9.7 52,340 5.9 29,873 3.3 73,595 8.2 893,476 100
ALL UNDERGRADUATESPart-time 43,470 4.1 87,316 8.2 106,447 10.0 138,969 13.1 197,262 18.5 145,893 13.7 127,075 11.9 90,841 8.5 48,762 4.6 25,993 2.4 52,733 5.0 1,064,760 100 Full-time 22,239 2.5 14,420 1.6 25,277 2.9 51,238 5.8 110,886 12.6 125,284 14.3 149,811 17.1 121,040 13.8 90,922 10.4 52,925 6.0 114,296 13.0 878,338 100 All 65,708 3.4 101,736 5.2 131,724 6.8 190,207 9.8 308,148 15.9 271,177 14.0 276,886 14.2 211,881 10.9 139,683 7.2 78,918 4.1 167,029 8.6 1,943,098 100
%Total
Total%
$100 to $149 $150 to $199 $200 to $249 $250 to $299
$300 to $349
$400 to $449 $450 to $499
$350 to $399 $400 to $449
TABLE W-42: BOOK EXPENSES PER ACADEMIC TERM BY SEGMENT, COURSE LOAD, AND DEPENDENCY STATUS
$250 to $299$200 to $249$150 to $199$100 to $149
$300 to $349 $350 to $399 $500 or More
$500 or More $450 to $499
Source: California Student Aid Commission 261 2003-04 SEARS

DEPENDENT UNDERGRADUATESNothing Under $100# % # % # % # % # % # % # % # % # % # % # % #
CCC Part-time 56 5.3 65 6.1 71 6.7 114 10.8 219 20.7 161 15.2 151 14.3 89 8.4 52 4.9 29 2.7 50 4.7 1,057 100 Full-time 89 4.0 46 2.0 66 2.9 112 5.0 306 13.6 343 15.2 447 19.8 306 13.6 235 10.4 97 4.3 205 9.1 2,252 100 All 145 4.4 111 3.4 137 4.1 226 6.8 525 15.9 504 15.2 598 18.1 395 11.9 287 8.7 126 3.8 255 7.7 3,309 100
UC Part-time 8 1.8 11 2.5 15 3.4 58 13.2 79 18.0 84 19.1 68 15.5 54 12.3 29 6.6 14 3.2 19 4.3 439 100 Full-time 14 0.5 53 1.8 154 5.3 360 12.5 562 19.4 573 19.8 512 17.7 290 10.0 170 5.9 76 2.6 127 4.4 2,891 100 All 22 0.7 64 1.9 169 5.1 418 12.6 641 19.2 657 19.7 580 17.4 344 10.3 199 6.0 90 2.7 146 4.4 3,330 100
CSU Part-time 2 0.9 6 2.8 9 4.1 9 4.1 30 13.8 52 24.0 33 15.2 27 12.4 18 8.3 10 4.6 21 9.7 217 100 Full-time 11 0.6 12 0.6 44 2.3 128 6.8 262 14.0 294 15.7 331 17.6 268 14.3 211 11.2 115 6.1 202 10.8 1,878 100
All 13 0.6 18 0.9 53 2.5 137 6.5 292 13.9 346 16.5 364 17.4 295 14.1 229 10.9 125 6.0 223 10.6 2,095 100 ICU Part-time 2 1.4 - - 2 1.4 4 2.7 6 4.1 8 5.5 19 13.0 24 16.4 23 15.8 18 12.3 40 27.4 146 100 Full-time 19 1.0 7 0.4 19 1.0 39 2.0 93 4.7 171 8.7 221 11.3 339 17.3 272 13.9 248 12.7 531 27.1 1,959 100
All 21 1.0 7 0.3 21 1.0 43 2.0 99 4.7 179 8.5 240 11.4 363 17.2 295 14.0 266 12.6 571 27.1 2,105 100 ALL Part-time 68 3.7 82 4.4 97 5.2 185 10.0 334 18.0 305 16.4 271 14.6 194 10.4 122 6.6 71 3.8 130 7.0 1,859 100
Full-time 133 1.5 118 1.3 283 3.2 639 7.1 1,223 13.6 1,381 15.4 1,511 16.8 1,203 13.4 888 9.9 536 6.0 1,065 11.9 8,980 100 All 201 1.9 200 1.8 380 3.5 824 7.6 1,557 14.4 1,686 15.6 1,782 16.4 1,397 12.9 1,010 9.3 607 5.6 1,195 11.0 10,839 100
INDEPENDENT UNDERGRADUATES
Nothing
# % # % # % # % # % # % # % # % # % # % # % #CCC Part-time 59 3.7 171 10.7 210 13.1 242 15.1 285 17.8 194 12.1 156 9.8 127 7.9 58 3.6 29 1.8 69 4.3 1,600 100
Full-time 68 5.5 38 3.1 42 3.4 67 5.5 149 12.1 145 11.8 191 15.6 169 13.8 125 10.2 69 5.6 165 13.4 1,228 100 All 127 4.5 209 7.4 252 8.9 309 10.9 434 15.3 339 12.0 347 12.3 296 10.5 183 6.5 98 3.5 234 8.3 2,828 100
UC Part-time - - - - 8 11.4 5 7.1 16 22.9 10 14.3 11 15.7 5 7.1 5 7.1 3 4.3 7 10.0 70 100 Full-time 2 0.6 2 0.6 20 5.8 27 7.9 61 17.8 61 17.8 65 19.0 42 12.2 20 5.8 11 3.2 32 9.3 343 100 All 2 0.5 2 0.5 28 6.8 32 7.7 77 18.6 71 17.2 76 18.4 47 11.4 25 6.1 14 3.4 39 9.4 413 100
CSU Part-time 11 1.9 22 3.8 40 6.8 69 11.8 87 14.8 86 14.7 96 16.4 68 11.6 47 8.0 23 3.9 37 6.3 586 100 Full-time 6 0.5 12 1.1 26 2.4 60 5.4 109 9.9 151 13.7 191 17.3 150 13.6 117 10.6 86 7.8 196 17.8 1,104 100
All 17 1.0 34 2.0 66 3.9 129 7.6 196 11.6 237 14.0 287 17.0 218 12.9 164 9.7 109 6.4 233 13.8 1,690 100 ICU Part-time 6 3.8 1 0.6 8 5.1 16 10.1 23 14.6 18 11.4 14 8.9 18 11.4 11 7.0 13 8.2 30 19.0 158 100 Full-time 5 1.5 7 2.0 8 2.3 17 5.0 18 5.3 24 7.0 39 11.4 35 10.2 43 12.6 41 12.0 105 30.7 342 100
All 11 2.2 8 1.6 16 3.2 33 6.6 41 8.2 42 8.4 53 10.6 53 10.6 54 10.8 54 10.8 135 27.0 500 100 ALL Part-time 76 3.1 194 8.0 266 11.0 332 13.8 411 17.0 308 12.8 277 11.5 218 9.0 121 5.0 68 2.8 143 5.9 2,414 100
Full-time 81 2.7 59 2.0 96 3.2 171 5.7 337 11.2 381 12.6 486 16.1 396 13.1 305 10.1 207 6.9 498 16.5 3,017 100 All 157 2.9 253 4.7 362 6.7 503 9.3 748 13.8 689 12.7 763 14.0 614 11.3 426 7.8 275 5.1 641 11.8 5,431 100
ALL UNDERGRADUATESPart-time 144 3.4 276 6.5 363 8.5 517 12.1 745 17.4 613 14.3 548 12.8 412 9.6 243 5.7 139 3.3 273 6.4 4,273 100 Full-time 214 1.8 177 1.5 379 3.2 810 6.8 1,560 13.0 1,762 14.7 1,997 16.6 1,599 13.3 1,193 9.9 743 6.2 1,563 13.0 11,997 100 All 358 2.2 453 2.8 742 4.6 1,327 8.2 2,305 14.2 2,375 14.6 2,545 15.6 2,011 12.4 1,436 8.8 882 5.4 1,836 11.3 16,270 100
$100 to $149 $150 to $199 $250 to $299 $350 to $399$300 to $349 $450 to $499 $500 or More
$400 to $449 $500 or More$450 to $499%
%Total
Total
TABLE U-42: BOOK EXPENSES PER ACADEMIC TERM BY SEGMENT, COURSE LOAD, AND DEPENDENCY STATUS
$250 to $299
$200 to $249
$300 to $349 $350 to $399Under $100 $100 to $149 $150 to $199 $200 to $249
$400 to $449
Source: California Student Aid Commission 262 2003-04 SEARS

DEPENDENT UNDERGRADUATES INDEPENDENT UNDERGRADUATES ALL UNDERGRADUATES
CCC Part-time 1,001 262$ 259$ CCC Part-time 1,541 233$ 225$ CCC Part-time 2,542 244$ 238$ Full-time 2,163 315$ 322$ Full-time 1,160 326$ 335$ Full-time 3,323 319$ 326$ All 3,164 298$ 288$ All 2,701 271$ 243$ All 5,865 285$ 266$
UC Part-time 431 290$ 283$ UC Part-time 70 299$ 300$ UC Part-time 501 291$ 285$ Full-time 2,877 285$ 276$ Full-time 341 309$ 297$ Full-time 3,218 287$ 278$ All 3,308 286$ 277$ All 411 307$ 298$ All 3,719 288$ 279$
CSU Part-time 215 308$ 305$ CSU Part-time 575 282$ 291$ CSU Part-time 790 289$ 296$ Full-time 1,867 324$ 336$ Full-time 1,098 349$ 360$ Full-time 2,965 334$ 343$
All 2,082 323$ 333$ All 1,673 326$ 333$ All 3,755 324$ 333$ ICU Part-time 144 368$ 361$ ICU Part-time 152 298$ 270$ ICU Part-time 296 332$ 317$ Full-time 1,940 365$ 368$ Full-time 337 359$ 374$ Full-time 2,277 364$ 369$
All 2,084 365$ 368$ All 489 340$ 341$ All 2,573 360$ 363$ ALL Part-time 1,791 283$ 265$ ALL Part-time 2,338 251$ 230$ ALL Part-time 4,129 265$ 244$
Full-time 8,847 318$ 323$ Full-time 2,936 336$ 342$ Full-time 11,783 323$ 328$ All 10,638 312$ 301$ All 5,274 298$ 261$ All 15,912 307$ 285$
Note: "Nothing" category was excluded from the means and median calculations.
TABLE M-42: MEAN AND MEDIAN BOOK EXPENSES PER ACADEMIC TERM BY SEGMENT, COURSE LOAD, AND DEPENDENCY STATUS
Number Mean Median Number MedianMean Median Number Mean
Source: California Student Aid Commission 263 2003-04 SEARS

Question for Tables: W-42.1, U-42.1, and M-42.1 PCC
Based on the length of time you indicated you would be attending school (question 17), what are your
expenses for course books between July 1, 2003 and June 30, 2004? Some schools include books in your tuition costs. These costs should be included here. If you have questions about actual charges, please check with your school.”
00 Nothing 07 $350to $399 14 $700 to $749 21 $1,100 to $1,199 01 Less than $100 08 $400 to $449 15 $750 to $799 22 $1,200 to $1,299
02 $100 to $149 09 $450 to $499 16 $800 to $849 23 $1,300 to $1,399 03 $150 to $199 10 $500 to $549 17 $850 to $899 24 $1400 to $1499 04 $200 to $249 11 $550 to $599 18 $900 to $949 25 $1,500 or more
05 $250 to $299 12 $600 to $649 19 $950 to $999
06 $300 to $349 13 $650 to $699 20 $1,000 to $1,099
264 2003-04 SEARS

DEPENDENT UNDERGRADUATESNothing Under $100
# % # % # % # % # % # % # % # % # % # % #PCC Part-time 989 17.4 147 2.6 1,172 20.6 1,050 18.5 775 13.6 159 2.8 477 8.4 26 0.5 146 2.6 739 13.0 5,680 100 Full-time 4,338 20.9 625 3.0 3,049 14.7 2,461 11.8 1,764 8.5 950 4.6 2,567 12.3 336 1.6 436 2.1 4,273 20.5 20,798 100
All 5,326 20.1 772 2.9 4,221 15.9 3,511 13.3 2,538 9.6 1,109 4.2 3,045 11.5 362 1.4 582 2.2 5,012 18.9 26,478 100
INDEPENDENT UNDERGRADUATESNothing Under $100
# % # % # % # % # % # % # % # % # % # % #PCC Part-time 2,756 15.3 355 2.0 2,402 13.4 2,892 16.1 2,887 16.0 1,033 5.7 2,648 14.7 523 2.9 182 1.0 2,312 12.9 17,988 100 Full-time 7,344 16.8 1,061 2.4 5,663 13.0 7,553 17.3 5,718 13.1 2,914 6.7 5,619 12.9 1,175 2.7 779 1.8 5,805 13.3 43,632 100
All 10,100 16.4 1,416 2.3 8,065 13.1 10,445 17.0 8,604 14.0 3,947 6.4 8,267 13.4 1,698 2.8 961 1.6 8,117 13.2 61,620 100
ALL UNDERGRADUATESPart-time 3,745 15.8 501 2.1 3,574 15.1 3,942 16.7 3,661 15.5 1,192 5.0 3,125 13.2 549 2.3 328 1.4 3,051 12.9 23,668 100 Full-time 11,682 18.1 1,686 2.6 8,712 13.5 10,013 15.5 7,482 11.6 3,864 6.0 8,187 12.7 1,511 2.3 1,215 1.9 10,078 15.6 64,430 100 All 15,426 17.5 2,188 2.5 12,286 13.9 13,956 15.8 11,143 12.6 5,056 5.7 11,312 12.8 2,060 2.3 1,543 1.8 13,129 14.9 88,098 100
Total%
Total%
$1,500 or More
$100 to $299 $300 to $499 $700 to $899 $1,100 to $1,299$900 to $1,099$500 to $699
TABLE W-42.1: BOOK EXPENSES PER ACADEMIC YEAR BY SEGMENT, COURSE LOAD, AND DEPENDENCY STATUS
$900 to $1,099 $1,100 to $1,299$100 to $299 $300 to $499 $500 to $699 $700 to $899
$1,300 to $1,499 $1,500 or More
$1,300 to $1,499
Source: California Student Aid Commission 265 2003-04 SEARS

DEPENDENT UNDERGRADUATESNothing Under $100# % # % # % # % # % # % # % # % # % # % #
PCC Part-time 61 24.3 10 4.0 39 15.5 43 17.1 25 10.0 11 4.4 26 10.4 1 0.4 6 2.4 29 11.6 251 100 Full-time 209 21.5 25 2.6 149 15.4 132 13.6 95 9.8 51 5.3 102 10.5 9 0.9 13 1.3 185 19.1 970 100
All 270 22.1 35 2.9 188 15.4 175 14.3 120 9.8 62 5.1 128 10.5 10 0.8 19 1.6 214 17.5 1,221 100
INDEPENDENT UNDERGRADUATESNothing Under $100# % # % # % # % # % # % # % # % # % # % #
PCC Part-time 97 18.9 13 2.5 72 14.0 72 14.0 69 13.5 30 5.8 66 12.9 11 2.1 10 1.9 73 14.2 513 100 Full-time 337 21.7 42 2.7 231 14.9 255 16.4 185 11.9 90 5.8 169 10.9 32 2.1 23 1.5 189 12.2 1,553 100
All 434 21.0 55 2.7 303 14.7 327 15.8 254 12.3 120 5.8 235 11.4 43 2.1 33 1.6 262 12.7 2,066 100
ALL UNDERGRADUATESPart-time 158 20.7 23 3.0 111 14.5 115 15.1 94 12.3 41 5.4 92 12.0 12 1.6 16 2.1 102 13.4 764 100 Full-time 546 21.6 67 2.7 380 15.1 387 15.3 280 11.1 141 5.6 271 10.7 41 1.6 36 1.4 374 14.8 2,523 100 All 704 21.4 90 2.7 491 14.9 502 15.3 374 11.4 182 5.5 363 11.0 53 1.6 52 1.6 476 14.5 3,287 100
$700 to $899 $900 to $1,199
$700 to $899
$100 to $299 $300 to $499 $500 to $699
$500 to $699
%
%Total
Total
TABLE U-42.1: BOOK EXPENSES PER ACADEMIC YEAR BY SEGMENT, COURSE LOAD, AND DEPENDENCY STATUS
$1,500 or More
$1,200 to $1,299 $1,500 or More $1,300 to $1,499
$1,200 to $1,299 $1,300 to $1,499 $100 to $299 $300 to $499 $900 to $1,199
Source: California Student Aid Commission 266 2003-04 SEARS
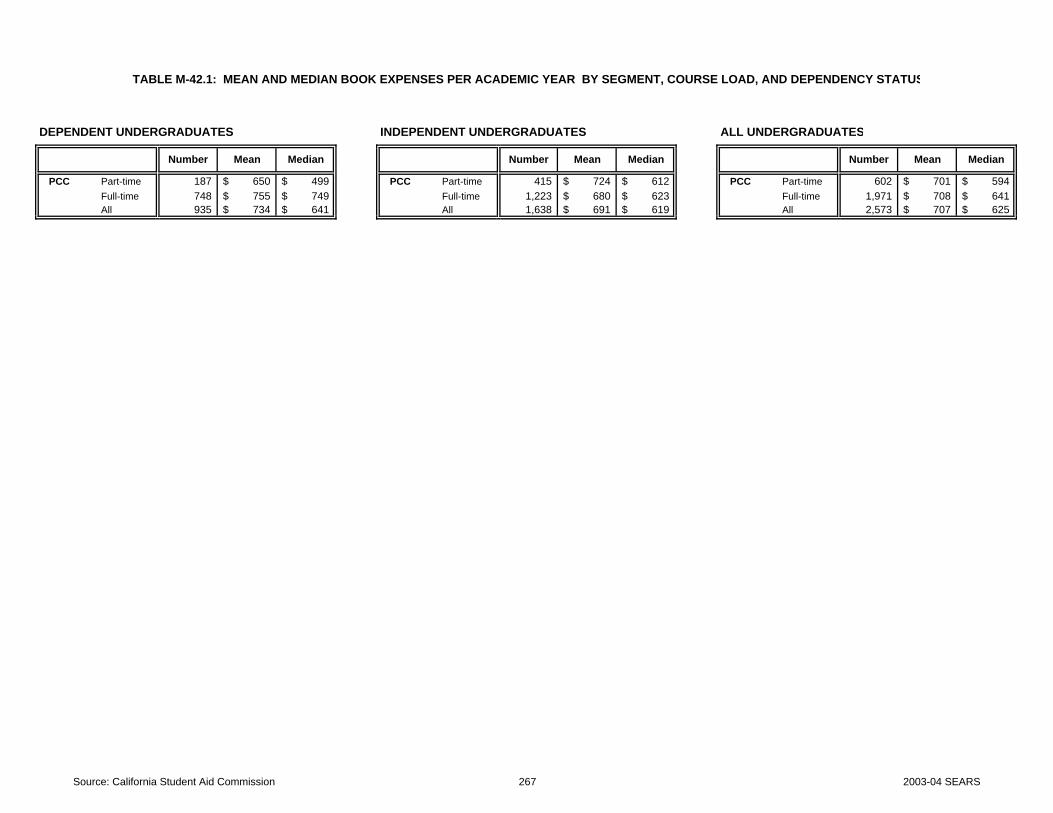
DEPENDENT UNDERGRADUATES INDEPENDENT UNDERGRADUATES ALL UNDERGRADUATES
PCC Part-time 187 650$ 499$ PCC Part-time 415 724$ 612$ PCC Part-time 602 701$ 594$ Full-time 748 755$ 749$ Full-time 1,223 680$ 623$ Full-time 1,971 708$ 641$ All 935 734$ 641$ All 1,638 691$ 619$ All 2,573 707$ 625$
TABLE M-42.1: MEAN AND MEDIAN BOOK EXPENSES PER ACADEMIC YEAR BY SEGMENT, COURSE LOAD, AND DEPENDENCY STATUS
Number Mean Median Number MedianMean Median Number Mean
Source: California Student Aid Commission 267 2003-04 SEARS
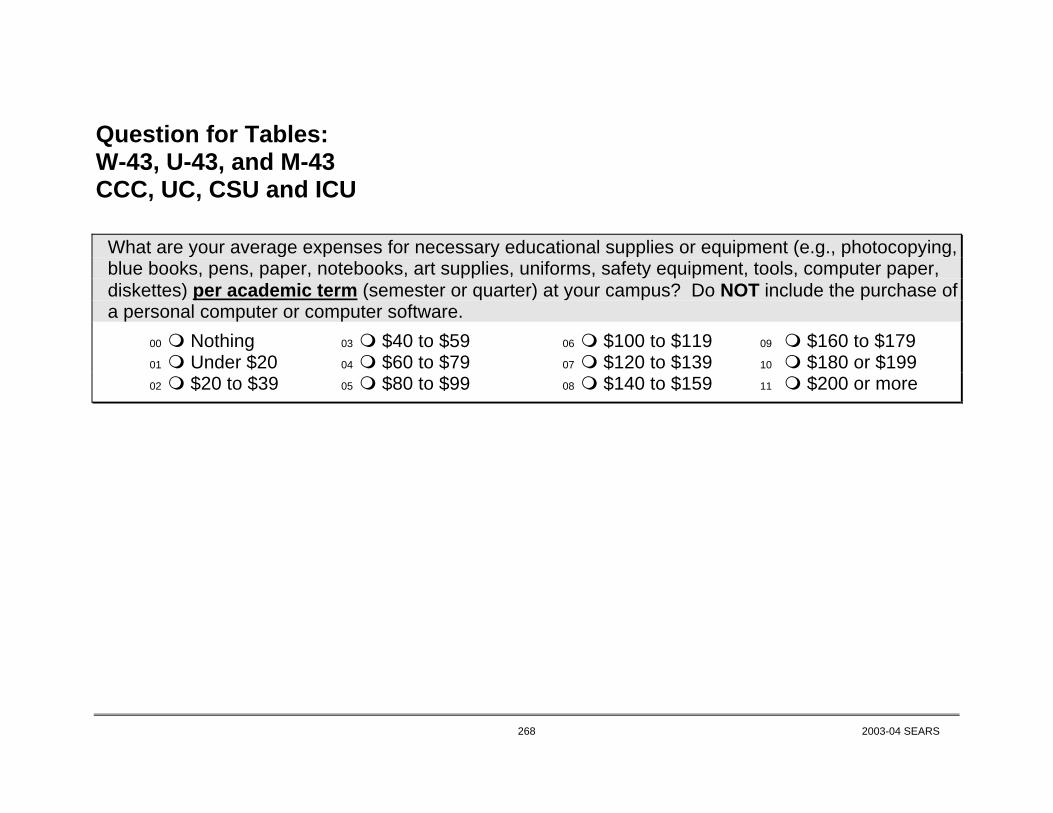
Question for Tables: W-43, U-43, and M-43 CCC, UC, CSU and ICU
What are your average expenses for necessary educational supplies or equipment (e.g., photocopying,
blue books, pens, paper, notebooks, art supplies, uniforms, safety equipment, tools, computer paper, diskettes) per academic term (semester or quarter) at your campus? Do NOT include the purchase of a personal computer or computer software.
00 Nothing 03 $40 to $59 06 $100 to $119 09 $160 to $179 01 Under $20 04 $60 to $79 07 $120 to $139 10 $180 or $199 02 $20 to $39 05 $80 to $99 08 $140 to $159 11 $200 or more
268 2003-04 SEARS
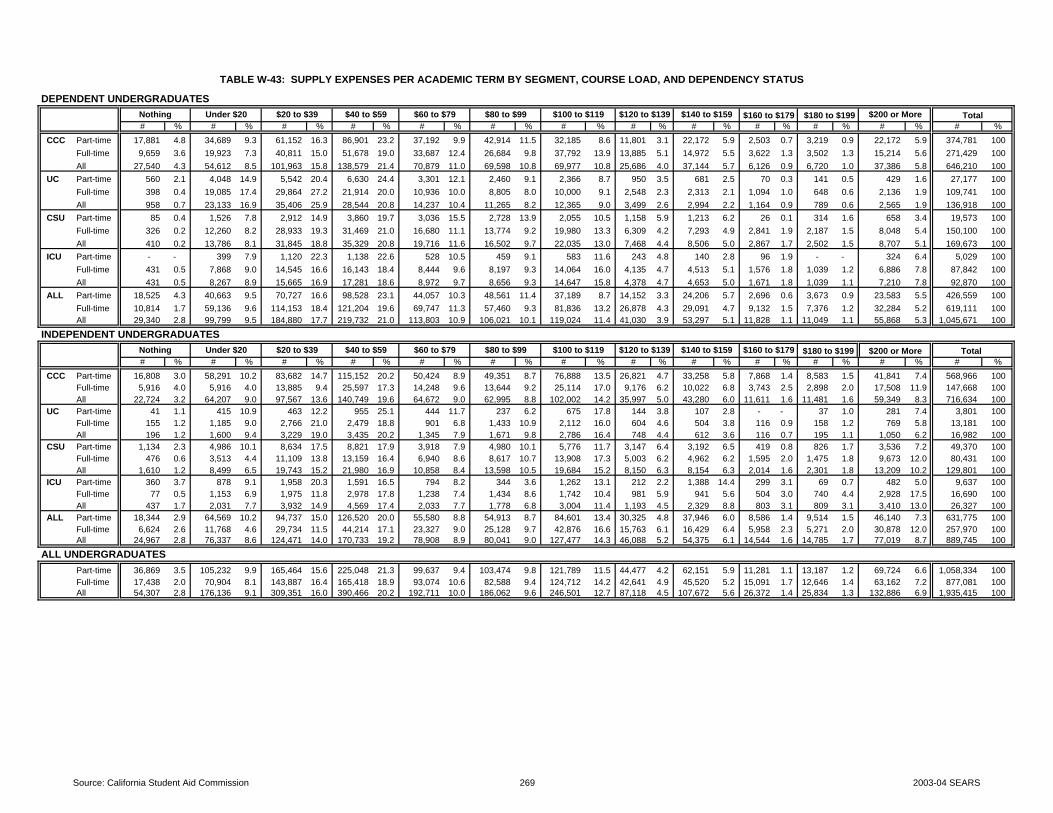
DEPENDENT UNDERGRADUATESNothing Under $20 $20 to $39 $40 to $59 $60 to $79 $80 to $99 $100 to $119 $120 to $139 $140 to $159 $200 or More# % # % # % # % # % # % # % # % # % # % # % # % #
CCC Part-time 17,881 4.8 34,689 9.3 61,152 16.3 86,901 23.2 37,192 9.9 42,914 11.5 32,185 8.6 11,801 3.1 22,172 5.9 2,503 0.7 3,219 0.9 22,172 5.9 374,781 100 Full-time 9,659 3.6 19,923 7.3 40,811 15.0 51,678 19.0 33,687 12.4 26,684 9.8 37,792 13.9 13,885 5.1 14,972 5.5 3,622 1.3 3,502 1.3 15,214 5.6 271,429 100 All 27,540 4.3 54,612 8.5 101,963 15.8 138,579 21.4 70,879 11.0 69,598 10.8 69,977 10.8 25,686 4.0 37,144 5.7 6,126 0.9 6,720 1.0 37,386 5.8 646,210 100
UC Part-time 560 2.1 4,048 14.9 5,542 20.4 6,630 24.4 3,301 12.1 2,460 9.1 2,366 8.7 950 3.5 681 2.5 70 0.3 141 0.5 429 1.6 27,177 100 Full-time 398 0.4 19,085 17.4 29,864 27.2 21,914 20.0 10,936 10.0 8,805 8.0 10,000 9.1 2,548 2.3 2,313 2.1 1,094 1.0 648 0.6 2,136 1.9 109,741 100 All 958 0.7 23,133 16.9 35,406 25.9 28,544 20.8 14,237 10.4 11,265 8.2 12,365 9.0 3,499 2.6 2,994 2.2 1,164 0.9 789 0.6 2,565 1.9 136,918 100
CSU Part-time 85 0.4 1,526 7.8 2,912 14.9 3,860 19.7 3,036 15.5 2,728 13.9 2,055 10.5 1,158 5.9 1,213 6.2 26 0.1 314 1.6 658 3.4 19,573 100 Full-time 326 0.2 12,260 8.2 28,933 19.3 31,469 21.0 16,680 11.1 13,774 9.2 19,980 13.3 6,309 4.2 7,293 4.9 2,841 1.9 2,187 1.5 8,048 5.4 150,100 100
All 410 0.2 13,786 8.1 31,845 18.8 35,329 20.8 19,716 11.6 16,502 9.7 22,035 13.0 7,468 4.4 8,506 5.0 2,867 1.7 2,502 1.5 8,707 5.1 169,673 100 ICU Part-time - - 399 7.9 1,120 22.3 1,138 22.6 528 10.5 459 9.1 583 11.6 243 4.8 140 2.8 96 1.9 - - 324 6.4 5,029 100 Full-time 431 0.5 7,868 9.0 14,545 16.6 16,143 18.4 8,444 9.6 8,197 9.3 14,064 16.0 4,135 4.7 4,513 5.1 1,576 1.8 1,039 1.2 6,886 7.8 87,842 100
All 431 0.5 8,267 8.9 15,665 16.9 17,281 18.6 8,972 9.7 8,656 9.3 14,647 15.8 4,378 4.7 4,653 5.0 1,671 1.8 1,039 1.1 7,210 7.8 92,870 100 ALL Part-time 18,525 4.3 40,663 9.5 70,727 16.6 98,528 23.1 44,057 10.3 48,561 11.4 37,189 8.7 14,152 3.3 24,206 5.7 2,696 0.6 3,673 0.9 23,583 5.5 426,559 100
Full-time 10,814 1.7 59,136 9.6 114,153 18.4 121,204 19.6 69,747 11.3 57,460 9.3 81,836 13.2 26,878 4.3 29,091 4.7 9,132 1.5 7,376 1.2 32,284 5.2 619,111 100 All 29,340 2.8 99,799 9.5 184,880 17.7 219,732 21.0 113,803 10.9 106,021 10.1 119,024 11.4 41,030 3.9 53,297 5.1 11,828 1.1 11,049 1.1 55,868 5.3 1,045,671 100
INDEPENDENT UNDERGRADUATESNothing Under $20 $20 to $39 $40 to $59 $60 to $79 $80 to $99 $100 to $119 $120 to $139 $140 to $159 $160 to $179# % # % # % # % # % # % # % # % # % # % # % # % #
CCC Part-time 16,808 3.0 58,291 10.2 83,682 14.7 115,152 20.2 50,424 8.9 49,351 8.7 76,888 13.5 26,821 4.7 33,258 5.8 7,868 1.4 8,583 1.5 41,841 7.4 568,966 100 Full-time 5,916 4.0 5,916 4.0 13,885 9.4 25,597 17.3 14,248 9.6 13,644 9.2 25,114 17.0 9,176 6.2 10,022 6.8 3,743 2.5 2,898 2.0 17,508 11.9 147,668 100 All 22,724 3.2 64,207 9.0 97,567 13.6 140,749 19.6 64,672 9.0 62,995 8.8 102,002 14.2 35,997 5.0 43,280 6.0 11,611 1.6 11,481 1.6 59,349 8.3 716,634 100
UC Part-time 41 1.1 415 10.9 463 12.2 955 25.1 444 11.7 237 6.2 675 17.8 144 3.8 107 2.8 - - 37 1.0 281 7.4 3,801 100 Full-time 155 1.2 1,185 9.0 2,766 21.0 2,479 18.8 901 6.8 1,433 10.9 2,112 16.0 604 4.6 504 3.8 116 0.9 158 1.2 769 5.8 13,181 100 All 196 1.2 1,600 9.4 3,229 19.0 3,435 20.2 1,345 7.9 1,671 9.8 2,786 16.4 748 4.4 612 3.6 116 0.7 195 1.1 1,050 6.2 16,982 100
CSU Part-time 1,134 2.3 4,986 10.1 8,634 17.5 8,821 17.9 3,918 7.9 4,980 10.1 5,776 11.7 3,147 6.4 3,192 6.5 419 0.8 826 1.7 3,536 7.2 49,370 100 Full-time 476 0.6 3,513 4.4 11,109 13.8 13,159 16.4 6,940 8.6 8,617 10.7 13,908 17.3 5,003 6.2 4,962 6.2 1,595 2.0 1,475 1.8 9,673 12.0 80,431 100
All 1,610 1.2 8,499 6.5 19,743 15.2 21,980 16.9 10,858 8.4 13,598 10.5 19,684 15.2 8,150 6.3 8,154 6.3 2,014 1.6 2,301 1.8 13,209 10.2 129,801 100 ICU Part-time 360 3.7 878 9.1 1,958 20.3 1,591 16.5 794 8.2 344 3.6 1,262 13.1 212 2.2 1,388 14.4 299 3.1 69 0.7 482 5.0 9,637 100 Full-time 77 0.5 1,153 6.9 1,975 11.8 2,978 17.8 1,238 7.4 1,434 8.6 1,742 10.4 981 5.9 941 5.6 504 3.0 740 4.4 2,928 17.5 16,690 100
All 437 1.7 2,031 7.7 3,932 14.9 4,569 17.4 2,033 7.7 1,778 6.8 3,004 11.4 1,193 4.5 2,329 8.8 803 3.1 809 3.1 3,410 13.0 26,327 100 ALL Part-time 18,344 2.9 64,569 10.2 94,737 15.0 126,520 20.0 55,580 8.8 54,913 8.7 84,601 13.4 30,325 4.8 37,946 6.0 8,586 1.4 9,514 1.5 46,140 7.3 631,775 100
Full-time 6,624 2.6 11,768 4.6 29,734 11.5 44,214 17.1 23,327 9.0 25,128 9.7 42,876 16.6 15,763 6.1 16,429 6.4 5,958 2.3 5,271 2.0 30,878 12.0 257,970 100 All 24,967 2.8 76,337 8.6 124,471 14.0 170,733 19.2 78,908 8.9 80,041 9.0 127,477 14.3 46,088 5.2 54,375 6.1 14,544 1.6 14,785 1.7 77,019 8.7 889,745 100
ALL UNDERGRADUATESPart-time 36,869 3.5 105,232 9.9 165,464 15.6 225,048 21.3 99,637 9.4 103,474 9.8 121,789 11.5 44,477 4.2 62,151 5.9 11,281 1.1 13,187 1.2 69,724 6.6 1,058,334 100 Full-time 17,438 2.0 70,904 8.1 143,887 16.4 165,418 18.9 93,074 10.6 82,588 9.4 124,712 14.2 42,641 4.9 45,520 5.2 15,091 1.7 12,646 1.4 63,162 7.2 877,081 100 All 54,307 2.8 176,136 9.1 309,351 16.0 390,466 20.2 192,711 10.0 186,062 9.6 246,501 12.7 87,118 4.5 107,672 5.6 26,372 1.4 25,834 1.3 132,886 6.9 1,935,415 100
%
TABLE W-43: SUPPLY EXPENSES PER ACADEMIC TERM BY SEGMENT, COURSE LOAD, AND DEPENDENCY STATUS
Total%
$160 to $179 $180 to $199
$180 to $199 Total$200 or More
Source: California Student Aid Commission 269 2003-04 SEARS

DEPENDENT UNDERGRADUATESNothing Under $20 $20 to $39 $40 to $59 $60 to $79 $80 to $99 $100 to $119 $120 to $139 $140 to $159 $200 or More# % # % # % # % # % # % # % # % # % # % # % # % #
CCC Part-time 50 4.8 97 9.3 171 16.3 243 23.2 104 9.9 120 11.5 90 8.6 33 3.1 62 5.9 7 0.7 9 0.9 62 5.9 1,048 100 Full-time 80 3.6 165 7.3 338 15.0 428 19.0 279 12.4 221 9.8 313 13.9 115 5.1 124 5.5 30 1.3 29 1.3 126 5.6 2,248 100 All 130 3.9 262 7.9 509 15.4 671 20.4 383 11.6 341 10.3 403 12.2 148 4.5 186 5.6 37 1.1 38 1.2 188 5.7 3,296 100
UC Part-time 9 2.1 67 15.3 88 20.0 111 25.3 52 11.8 39 8.9 38 8.7 14 3.2 10 2.3 1 0.2 2 0.5 8 1.8 439 100 Full-time 10 0.3 499 17.3 790 27.3 578 20.0 287 9.9 233 8.1 265 9.2 67 2.3 60 2.1 28 1.0 19 0.7 56 1.9 2,892 100 All 19 0.6 566 17.0 878 26.4 689 20.7 339 10.2 272 8.2 303 9.1 81 2.4 70 2.1 29 0.9 21 0.6 64 1.9 3,331 100
CSU Part-time 1 0.5 20 9.2 36 16.6 40 18.4 31 14.3 30 13.8 23 10.6 13 6.0 12 5.5 1 0.5 4 1.8 6 2.8 217 100 Full-time 4 0.2 164 8.7 358 19.1 392 20.9 205 10.9 180 9.6 248 13.2 76 4.0 85 4.5 38 2.0 25 1.3 102 5.4 1,877 100
All 5 0.2 184 8.8 394 18.8 432 20.6 236 11.3 210 10.0 271 12.9 89 4.3 97 4.6 39 1.9 29 1.4 108 5.2 2,094 100 ICU Part-time - - 14 9.6 32 21.9 31 21.2 12 8.2 17 11.6 13 8.9 5 3.4 8 5.5 3 2.1 - - 11 7.5 146 100 Full-time 11 0.6 177 9.0 343 17.5 360 18.4 187 9.6 194 9.9 311 15.9 97 5.0 88 4.5 33 1.7 23 1.2 134 6.8 1,958 100
All 11 0.5 191 9.1 375 17.8 391 18.6 199 9.5 211 10.0 324 15.4 102 4.8 96 4.6 36 1.7 23 1.1 145 6.9 2,104 100 ALL Part-time 60 3.2 198 10.7 327 17.7 425 23.0 199 10.8 206 11.1 164 8.9 65 3.5 92 5.0 12 0.6 15 0.8 87 4.7 1,850 100
Full-time 105 1.2 1,005 11.2 1,829 20.4 1,758 19.6 958 10.7 828 9.2 1,137 12.7 355 4.0 357 4.0 129 1.4 96 1.1 418 4.7 8,975 100 All 165 1.5 1,203 11.1 2,156 19.9 2,183 20.2 1,157 10.7 1,034 9.6 1,301 12.0 420 3.9 449 4.1 141 1.3 111 1.0 505 4.7 10,825 100
INDEPENDENT UNDERGRADUATESNothing Under $20 $20 to $39 $40 to $59 $60 to $79 $80 to $99 $100 to $119 $120 to $139 $140 to $159 $160 to $179# % # % # % # % # % # % # % # % # % # % # % # % #
CCC Part-time 47 3.0 163 10.2 234 14.7 322 20.2 141 8.9 138 8.7 215 13.5 75 4.7 93 5.8 22 1.4 24 1.5 117 7.4 1,591 100 Full-time 49 4.0 49 4.0 115 9.4 212 17.3 118 9.6 113 9.2 208 17.0 76 6.2 83 6.8 31 2.5 24 2.0 145 11.9 1,223 100 All 96 3.4 212 7.5 349 12.4 534 19.0 259 9.2 251 8.9 423 15.0 151 5.4 176 6.3 53 1.9 48 1.7 262 9.3 2,814 100
UC Part-time 1 1.4 9 12.9 8 11.4 18 25.7 8 11.4 4 5.7 12 17.1 3 4.3 2 2.9 - - 1 1.4 4 5.7 70 100 Full-time 4 1.2 30 8.8 73 21.3 64 18.7 23 6.7 36 10.5 56 16.4 16 4.7 13 3.8 3 0.9 4 1.2 20 5.8 342 100 All 5 1.2 39 9.5 81 19.7 82 19.9 31 7.5 40 9.7 68 16.5 19 4.6 15 3.6 3 0.7 5 1.2 24 5.8 412 100
CSU Part-time 12 2.0 61 10.4 98 16.7 108 18.4 51 8.7 59 10.0 68 11.6 34 5.8 38 6.5 5 0.9 11 1.9 43 7.3 588 100 Full-time 7 0.6 55 5.0 153 13.9 183 16.6 102 9.2 111 10.1 187 17.0 70 6.3 70 6.3 22 2.0 17 1.5 126 11.4 1,103 100
All 19 1.1 116 6.9 251 14.8 291 17.2 153 9.0 170 10.1 255 15.1 104 6.2 108 6.4 27 1.6 28 1.7 169 10.0 1,691 100 ICU Part-time 7 4.4 15 9.5 33 20.9 26 16.5 12 7.6 7 4.4 24 15.2 4 2.5 14 8.9 5 3.2 1 0.6 10 6.3 158 100 Full-time 3 0.9 23 6.7 40 11.7 56 16.3 24 7.0 30 8.7 35 10.2 19 5.5 20 5.8 10 2.9 15 4.4 68 19.8 343 100
All 10 2.0 38 7.6 73 14.6 82 16.4 36 7.2 37 7.4 59 11.8 23 4.6 34 6.8 15 3.0 16 3.2 78 15.6 501 100 ALL Part-time 67 2.8 248 10.3 373 15.5 474 19.7 212 8.8 208 8.6 319 13.3 116 4.8 147 6.1 32 1.3 37 1.5 174 7.2 2,407 100
Full-time 63 2.1 157 5.2 381 12.7 515 17.1 267 8.9 290 9.6 486 16.1 181 6.0 186 6.2 66 2.2 60 2.0 359 11.9 3,011 100 All 130 2.4 405 7.5 754 13.9 989 18.3 479 8.8 498 9.2 805 14.9 297 5.5 333 6.1 98 1.8 97 1.8 533 9.8 5,418 100
ALL UNDERGRADUATESPart-time 127 3.0 446 10.5 700 16.4 899 21.1 411 9.7 414 9.7 483 11.3 181 4.3 239 5.6 44 1.0 52 1.2 261 6.1 4,257 100 Full-time 168 1.4 1,162 9.7 2,210 18.4 2,273 19.0 1,225 10.2 1,118 9.3 1,623 13.5 536 4.5 543 4.5 195 1.6 156 1.3 777 6.5 11,986 100 All 295 1.8 1,608 9.9 2,910 17.9 3,172 19.5 1,636 10.1 1,532 9.4 2,106 13.0 717 4.4 782 4.8 239 1.5 208 1.3 1,038 6.4 16,243 100
TABLE U-43: SUPPLY EXPENSES PER ACADEMIC TERM BY SEGMENT, COURSE LOAD, AND DEPENDENCY STATUS
$160 to $179 $180 to $199
%
Total%
$180 to $199 $200 or More Total
Source: California Student Aid Commission 270 2003-04 SEARS

DEPENDENT UNDERGRADUATES INDEPENDENT UNDERGRADUATES ALL UNDERGRADUATES
CCC Part-time 998 74$ 58$ CCC Part-time 1,544 81$ 67$ CCC Part-time 2,542 78$ 62$ Full-time 2,168 80$ 70$ Full-time 1,174 100$ 95$ Full-time 3,342 87$ 77$ All 3,166 78$ 63$ All 2,718 89$ 73$ All 5,884 83$ 68$
UC Part-time 430 58$ 50$ UC Part-time 69 73$ 61$ UC Part-time 499 60$ 51$ Full-time 2,882 55$ 44$ Full-time 338 75$ 61$ Full-time 3,220 57$ 46$ All 3,312 55$ 46$ All 407 75$ 61$ All 3,719 58$ 47$
CSU Part-time 216 74$ 69$ CSU Part-time 576 81$ 68$ CSU Part-time 792 79$ 68$ Full-time 1,873 75$ 62$ Full-time 1,096 94$ 91$ Full-time 2,969 82$ 71$
All 2,089 75$ 63$ All 1,672 90$ 83$ All 3,761 82$ 70$ ICU Part-time 146 74$ 56$ ICU Part-time 151 80$ 64$ ICU Part-time 297 77$ 60$ Full-time 1,947 80$ 71$ Full-time 340 107$ 92$ Full-time 2,287 84$ 74$
All 2,093 79$ 70$ All 491 98$ 83$ All 2,584 83$ 72$ ALL Part-time 1,790 70$ 58$ ALL Part-time 2,340 80$ 67$ ALL Part-time 4,130 76$ 62$
Full-time 8,870 71$ 62$ Full-time 2,948 96$ 92$ Full-time 11,818 77$ 70$ All 10,660 71$ 60$ All 5,288 89$ 74$ All 15,948 77$ 66$
Note: "Nothing" category was excluded from the means and median calculations.
TABLE M-43: MEAN AND MEDIAN SUPPLY EXPENSES PER ACADEMIC TERM BY SEGMENT, COURSE LOAD, AND DEPENDENCY STATUS
Number Mean Median Number MedianMean Median Number Mean
Source: California Student Aid Commission 271 2003-04 SEARS
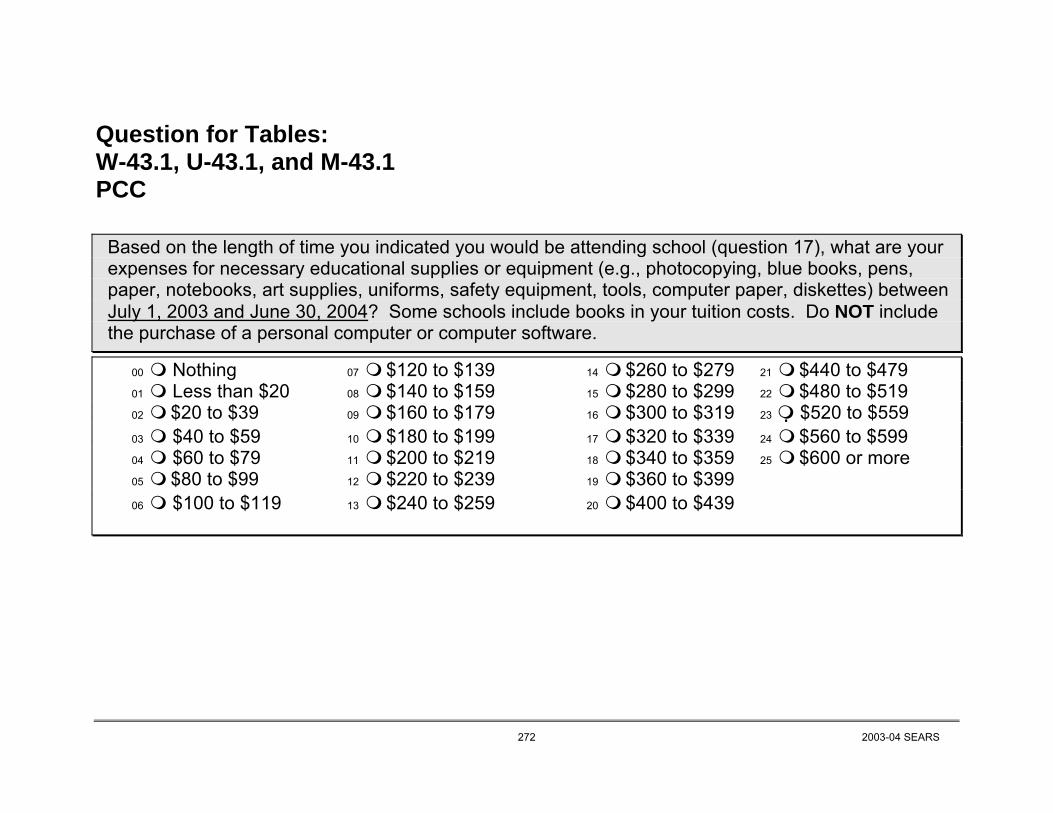
Question for Tables: W-43.1, U-43.1, and M-43.1 PCC
Based on the length of time you indicated you would be attending school (question 17), what are your
expenses for necessary educational supplies or equipment (e.g., photocopying, blue books, pens, paper, notebooks, art supplies, uniforms, safety equipment, tools, computer paper, diskettes) between July 1, 2003 and June 30, 2004? Some schools include books in your tuition costs. Do NOT include the purchase of a personal computer or computer software.
00 Nothing 07 $120 to $139 14 $260 to $279 21 $440 to $479 01 Less than $20 08 $140 to $159 15 $280 to $299 22 $480 to $519
02 $20 to $39 09 $160 to $179 16 $300 to $319 23 $520 to $559 03 $40 to $59 10 $180 to $199 17 $320 to $339 24 $560 to $599 04 $60 to $79 11 $200 to $219 18 $340 to $359 25 $600 or more
05 $80 to $99 12 $220 to $239 19 $360 to $399
06 $100 to $119 13 $240 to $259 20 $400 to $439
272 2003-04 SEARS

DEPENDENT UNDERGRADUATES
Nothing Under $40 $40 to $79 $80 to $119 $120 to $159 $160 to $199 $200 to $239 $240 to $279 $280 to $319 $400 or More# % # % # % # % # % # % # % # % # % # % # % #
PCC Part-time 670 11.4 403 6.9 698 11.9 780 13.3 519 8.9 205 3.5 661 11.3 387 6.6 335 5.7 186 3.2 1,013 17.3 5,857 100 Full-time 2,445 11.2 1,792 8.2 2,075 9.5 3,252 14.9 1,521 6.9 1,205 5.5 1,880 8.6 796 3.6 1,548 7.1 758 3.5 4,617 21.1 21,890 100 All 3,115 11.2 2,195 7.9 2,773 10.0 4,032 14.5 2,040 7.4 1,410 5.1 2,542 9.2 1,182 4.3 1,882 6.8 944 3.4 5,630 20.3 27,746 100
INDEPENDENT UNDERGRADUATES
Nothing Under $40 $40 to $79 $80 to $119 $120 to $159 $160 to $199 $200 to $239 $240 to $279 $280 to $319 $400 or More# % # % # % # % # % # % # % # % # % # % # % #
PCC Part-time 1,729 8.9 1,533 7.9 1,327 6.8 2,513 13.0 1,339 6.9 1,251 6.4 2,657 13.7 1,041 5.4 961 5.0 708 3.7 4,341 22.4 19,399 100 Full-time 3,836 8.3 3,211 6.9 4,730 10.2 5,171 11.2 4,107 8.9 2,386 5.2 4,184 9.0 3,024 6.5 3,317 7.2 1,812 3.9 10,480 22.7 46,257 100 All 5,565 8.5 4,744 7.2 6,057 9.2 7,684 11.7 5,445 8.3 3,636 5.5 6,841 10.4 4,065 6.2 4,278 6.5 2,520 3.8 14,821 22.6 65,655 100
ALL UNDERGRADUATESPart-time 2,399 9.5 1,936 7.7 2,025 8.0 3,293 13.0 1,857 7.4 1,456 5.8 3,319 13.1 1,428 5.7 1,295 5.1 894 3.5 5,354 21.2 25,255 100 Full-time 6,281 9.2 5,003 7.3 6,805 10.0 8,423 12.4 5,628 8.3 3,591 5.3 6,064 8.9 3,820 5.6 4,865 7.1 2,570 3.8 15,097 22.2 68,147 100 All 8,680 9.3 6,939 7.4 8,829 9.5 11,716 12.5 7,485 8.0 5,046 5.4 9,383 10.0 5,247 5.6 6,160 6.6 3,464 3.7 20,451 21.9 93,402 100
TABLE W-43.1: PCC SUPPLY EXPENSES PER ACADEMIC YEAR BY SEGMENT, COURSE LOAD, AND DEPENDENCY STATUS
Total%
%
$320 to $399
$320 to $399 Total
Source: California Student Aid Commission 273 2003-04 SEARS

DEPENDENT UNDERGRADUATES
Nothing Under $40 $40 to $79 $80 to $119 $120 to $159 $160 to $199 $200 to $239 $240 to $279 $280 to $319 $400 or More# % # % # % # % # % # % # % # % # % # % # % #
PCC Part-time 41 15.5 21 7.9 32 12.1 32 12.1 26 9.8 13 4.9 23 8.7 7 2.6 11 4.2 14 5.3 45 17.0 265 100 Full-time 107 10.6 79 7.8 97 9.6 136 13.5 69 6.8 47 4.7 94 9.3 40 4.0 62 6.2 35 3.5 242 24.0 1,008 100 All 148 11.6 100 7.9 129 10.1 168 13.2 95 7.5 60 4.7 117 9.2 47 3.7 73 5.7 49 3.8 287 22.5 1,273 100
INDEPENDENT UNDERGRADUATES
Nothing Under $40 $40 to $79 $80 to $119 $120 to $159 $160 to $199 $200 to $239 $240 to $279 $280 to $319 $400 or More# % # % # % # % # % # % # % # % # % # % # % #
PCC Part-time 68 12.4 32 5.9 44 8.0 78 14.3 42 7.7 32 5.9 55 10.1 25 4.6 29 5.3 19 3.5 123 22.5 547 100 Full-time 183 11.3 124 7.6 169 10.4 196 12.1 131 8.1 86 5.3 142 8.7 72 4.4 98 6.0 52 3.2 370 22.8 1,623 100 All 251 11.6 156 7.2 213 9.8 274 12.6 173 8.0 118 5.4 197 9.1 97 4.5 127 5.9 71 3.3 493 22.7 2,170 100
ALL UNDERGRADUATESPart-time 109 13.4 53 6.5 76 9.4 110 13.5 68 8.4 45 5.5 78 9.6 32 3.9 40 4.9 33 4.1 168 20.7 812 100 Full-time 290 11.0 203 7.7 266 10.1 332 12.6 200 7.6 133 5.1 236 9.0 112 4.3 160 6.1 87 3.3 612 23.3 2,631 100 All 399 11.6 256 7.4 342 9.9 442 12.8 268 7.8 178 5.2 314 9.1 144 4.2 200 5.8 120 3.5 780 22.7 3,443 100
TABLE U-43.1: PCC SUPPLY EXPENSES PER ACADEMIC YEAR BY SEGMENT, COURSE LOAD, AND DEPENDENCY STATUS
$320 to $399
%
Total%
$320 to $399 Total
Source: California Student Aid Commission 274 2003-04 SEARS

DEPENDENT UNDERGRADUATES INDEPENDENT UNDERGRADUATES ALL UNDERGRADUATES
PCC Part-time 224 227$ 200$ PCC Part-time 479 266$ 206$ PCC Part-time 703 254$ 205$ Full-time 901 264$ 196$ Full-time 1,440 261$ 209$ Full-time 2,341 262$ 206$ All 1,125 257$ 197$ All 1,919 262$ 208$ All 3,044 260$ 205$
Note: "Nothing" category was excluded from the means and median calculations.
TABLE M-43.1: MEAN AND MEDIAN SUPPLY EXPENSES PER ACADEMIC TERM BY SEGMENT, COURSE LOAD, AND DEPENDENCY STATUS
Number Mean Median Number MedianMean Median Number Mean
Source: California Student Aid Commission 275 2003-04 SEARS

Question for Tables: W-44, U-44, and M-44 CCC, UC, CSU and ICU
What are your average expenses for course material fees (e.g., laboratory or studio fees) per
academic term (semester or quarter) at your campus? 00 Nothing 04 $30 to $39 08 $70 to $79 12 $200 to $299 01 Under $10 05 $40 to $49 09 $80 to $89 13 $300 to $399 02 $10 to $19 06 $50 to $59 10 $90 to $99 14 $400 or more 03 $20 to $29 07 $60 to $69 11 $100 to $199
276 2003-04 SEARS

DEPENDENT UNDERGRADUATES
Nothing Less than $ 50 $50 to $99 $100 to $199 $200 to $299 $300 to $399 $400 or More Total
# % # % # % # % # % # % # % # %CCC Part-time 150,914 40.7 135,537 36.5 50,066 13.5 20,027 5.4 5,364 1.4 3,576 1.0 5,722 1.5 371,206 100
Full-time 98,647 36.7 107,461 39.9 36,223 13.5 14,489 5.4 5,675 2.1 2,656 1.0 3,985 1.5 269,136 100 All 249,561 39.0 242,998 37.9 86,289 13.5 34,516 5.4 11,039 1.7 6,233 1.0 9,706 1.5 640,342 100
UC Part-time 9,130 34.4 2,734 10.3 1,396 5.3 4,314 16.2 4,923 18.5 1,492 5.6 2,588 9.7 26,578 100 Full-time 37,530 34.8 10,963 10.2 8,273 7.7 19,465 18.1 15,988 14.8 6,717 6.2 8,834 8.2 107,770 100 All 46,660 34.7 13,697 10.2 9,669 7.2 23,779 17.7 20,911 15.6 8,208 6.1 11,422 8.5 134,347 100
CSU Part-time 6,752 34.7 2,748 14.1 2,146 11.0 3,641 18.7 2,270 11.7 807 4.1 1,101 5.7 19,465 100 Full-time 53,333 36.6 18,064 12.4 14,778 10.1 28,012 19.2 15,659 10.7 5,325 3.7 10,565 7.2 145,736 100 All 60,085 36.4 20,812 12.6 16,924 10.2 31,653 19.2 17,929 10.9 6,132 3.7 11,666 7.1 165,201 100
ICU Part-time 1,673 33.3 1,122 22.3 1,068 21.2 541 10.8 383 7.6 137 2.7 104 2.1 5,028 100 Full-time 23,163 26.4 22,320 25.4 14,931 17.0 13,013 14.8 6,146 7.0 3,547 4.0 4,667 5.3 87,787 100 All 24,836 26.8 23,442 25.3 15,999 17.2 13,554 14.6 6,528 7.0 3,685 4.0 4,771 5.1 92,816 100
ALL Part-time 168,469 39.9 142,141 33.7 54,676 12.9 28,523 6.8 12,941 3.1 6,012 1.4 9,516 2.3 422,278 100 Full-time 212,673 34.8 158,808 26.0 74,205 12.2 74,979 12.3 43,468 7.1 18,245 3.0 28,051 4.6 610,428 100 All 381,142 36.9 300,949 29.1 128,881 12.5 103,502 10.0 56,408 5.5 24,258 2.3 37,566 3.6 1,032,706 100
INDEPENDENT UNDERGRADUATES
Nothing Less than $ 50 $50 to $99 $100 to $199 $200 to $299 $300 to $399 $400 or More Total
# % # % # % # % # % # % # % # %CCC Part-time 196,689 34.8 197,404 34.9 84,040 14.9 51,497 9.1 18,596 3.3 6,437 1.1 10,728 1.9 565,391 100
Full-time 45,641 31.1 50,712 34.6 22,941 15.6 15,093 10.3 4,830 3.3 2,536 1.7 4,950 3.4 146,703 100 All 242,330 34.0 248,116 34.8 106,981 15.0 66,590 9.4 23,426 3.3 8,973 1.3 15,678 2.2 712,094 100
UC Part-time 1,718 47.9 38 1.1 286 8.0 652 18.2 370 10.3 156 4.3 366 10.2 3,586 100 Full-time 4,449 34.9 1,067 8.4 895 7.0 1,691 13.3 2,203 17.3 827 6.5 1,619 12.7 12,751 100 All 6,167 37.8 1,105 6.8 1,181 7.2 2,343 14.3 2,573 15.7 983 6.0 1,985 12.2 16,337 100
CSU Part-time 16,685 35.2 6,512 13.7 5,214 11.0 6,998 14.8 5,911 12.5 2,112 4.5 3,970 8.4 47,402 100 Full-time 22,941 29.9 7,110 9.3 7,043 9.2 16,778 21.8 9,988 13.0 3,291 4.3 9,652 12.6 76,803 100 All 39,626 31.9 13,623 11.0 12,257 9.9 23,776 19.1 15,899 12.8 5,403 4.4 13,622 11.0 124,205 100
ICU Part-time 3,744 39.2 2,792 29.2 690 7.2 1,219 12.8 461 4.8 288 3.0 363 3.8 9,557 100 Full-time 4,789 28.5 4,633 27.6 2,069 12.3 2,214 13.2 1,248 7.4 591 3.5 1,265 7.5 16,809 100 All 8,533 32.4 7,425 28.2 2,760 10.5 3,434 13.0 1,710 6.5 878 3.3 1,628 6.2 26,366 100
ALL Part-time 218,836 35.0 206,746 33.0 90,231 14.4 60,366 9.6 25,339 4.0 8,993 1.4 15,426 2.5 625,937 100 Full-time 77,820 30.8 63,522 25.1 32,948 13.0 35,776 14.1 18,268 7.2 7,245 2.9 17,487 6.9 253,065 100 All 296,656 33.7 270,268 30.7 123,179 14.0 96,142 10.9 43,607 5.0 16,238 1.8 32,913 3.7 879,002 100
ALL UNDERGRADUATESPart-time 387,304 36.9 348,887 33.3 144,907 13.8 88,890 8.5 38,279 3.7 15,005 1.4 24,942 2.4 1,048,214 100 Full-time 290,493 33.6 222,330 25.7 107,153 12.4 110,755 12.8 61,736 7.1 25,490 3.0 45,537 5.3 863,494 100 All 677,797 35.5 571,217 29.9 252,060 13.2 199,645 10.4 100,015 5.2 40,495 2.1 70,479 3.7 1,911,708 100
TABLE W-44: COURSE MATERIAL FEES PER ACADEMIC TERM BY SEGMENT, COURSE LOAD, AND DEPENDENCY STATUS
Source: California Student Aid Commission 277 2003-04 SEARS

DEPENDENT UNDERGRADUATES
Nothing Less than $ 50 $50 to $99 $100 to $199 $200 to $299 $300 to $399 $400 or More Total
# % # % # % # % # % # % # % # %CCC Part-time 422 40.7 379 36.5 140 13.5 56 5.4 15 1.4 10 1.0 16 1.5 1,038 100
Full-time 817 36.7 890 39.9 300 13.5 120 5.4 47 2.1 22 1.0 33 1.5 2,229 100 All 1,239 37.9 1,269 38.8 440 13.5 176 5.4 62 1.9 32 1.0 49 1.5 3,267 100
UC Part-time 144 33.5 43 10.0 23 5.3 71 16.5 79 18.4 25 5.8 45 10.5 430 100 Full-time 986 34.7 286 10.1 218 7.7 520 18.3 414 14.6 181 6.4 235 8.3 2,840 100 All 1,130 34.6 329 10.1 241 7.4 591 18.1 493 15.1 206 6.3 280 8.6 3,270 100
CSU Part-time 82 38.1 32 14.9 22 10.2 39 18.1 19 8.8 7 3.3 14 6.5 215 100 Full-time 643 35.3 228 12.5 189 10.4 352 19.3 204 11.2 68 3.7 138 7.6 1,822 100 All 725 35.6 260 12.8 211 10.4 391 19.2 223 10.9 75 3.7 152 7.5 2,037 100
ICU Part-time 50 34.2 31 21.2 34 23.3 19 13.0 7 4.8 3 2.1 2 1.4 146 100 Full-time 518 26.5 505 25.8 338 17.3 286 14.6 133 6.8 80 4.1 97 5.0 1,957 100 All 568 27.0 536 25.5 372 17.7 305 14.5 140 6.7 83 3.9 99 4.7 2,103 100
ALL Part-time 698 38.2 485 26.5 219 12.0 185 10.1 120 6.6 45 2.5 77 4.2 1,829 100 Full-time 2,964 33.5 1,909 21.6 1,045 11.8 1,278 14.4 798 9.0 351 4.0 503 5.7 8,848 100 All 3,662 34.3 2,394 22.4 1,264 11.8 1,463 13.7 918 8.6 396 3.7 580 5.4 10,677 100
INDEPENDENT UNDERGRADUATES
Nothing Less than $ 50 $50 to $99 $100 to $199 $200 to $299 $300 to $399 $400 or More Total
# % # % # % # % # % # % # % # %CCC Part-time 550 34.8 552 34.9 235 14.9 144 9.1 52 3.3 18 1.1 30 1.9 1,581 100
Full-time 378 31.1 420 34.6 190 15.6 125 10.3 40 3.3 21 1.7 41 3.4 1,215 100 All 928 33.2 972 34.8 425 15.2 269 9.6 92 3.3 39 1.4 71 2.5 2,796 100
UC Part-time 32 48.5 1 1.5 5 7.6 11 16.7 7 10.6 3 4.5 7 10.6 66 100 Full-time 115 34.7 28 8.5 23 6.9 43 13.0 58 17.5 21 6.3 43 13.0 331 100 All 147 37.0 29 7.3 28 7.1 54 13.6 65 16.4 24 6.0 50 12.6 397 100
CSU Part-time 205 36.0 66 11.6 60 10.5 93 16.3 72 12.7 26 4.6 47 8.3 569 100 Full-time 323 30.6 94 8.9 94 8.9 238 22.6 135 12.8 55 5.2 115 10.9 1,054 100 All 528 32.5 160 9.9 154 9.5 331 20.4 207 12.8 81 5.0 162 10.0 1,623 100
ICU Part-time 66 42.0 35 22.3 15 9.6 21 13.4 8 5.1 5 3.2 7 4.5 157 100 Full-time 94 27.2 93 27.0 43 12.5 48 13.9 25 7.2 13 3.8 29 8.4 345 100 All 160 31.9 128 25.5 58 11.6 69 13.7 33 6.6 18 3.6 36 7.2 502 100
ALL Part-time 853 35.9 654 27.6 315 13.3 269 11.3 139 5.9 52 2.2 91 3.8 2,373 100 Full-time 910 30.9 635 21.6 350 11.9 454 15.4 258 8.8 110 3.7 228 7.7 2,945 100 All 1,763 33.2 1,289 24.2 665 12.5 723 13.6 397 7.5 162 3.0 319 6.0 5,318 100
ALL UNDERGRADUATESPart-time 1,551 36.9 1,139 27.1 534 12.7 454 10.8 259 6.2 97 2.3 168 4.0 4,202 100 Full-time 3,874 32.8 2,544 21.6 1,395 11.8 1,732 14.7 1,056 9.0 461 3.9 731 6.2 11,793 100 All 5,425 33.9 3,683 23.0 1,929 12.1 2,186 13.7 1,315 8.2 558 3.5 899 5.6 15,995 100
TABLE U-44: COURSE MATERIAL FEES PER ACADEMIC TERM BY SEGMENT, COURSE LOAD, AND DEPENDENCY STATUS
Source: California Student Aid Commission 278 2003-04 SEARS

DEPENDENT UNDERGRADUATES INDEPENDENT UNDERGRADUATES ALL UNDERGRADUATES
CCC Part-time 616 132$ 39$ CCC Part-time 1,031 162$ 46$ CCC Part-time 1,647 151$ 43$ Full-time 1,412 129$ 37$ Full-time 837 186$ 47$ Full-time 2,249 150$ 40$ All 2,028 130$ 38$ All 1,868 173$ 46$ All 3,896 150$ 42$
UC Part-time 295 171$ 205$ UC Part-time 38 258$ 193$ UC Part-time 333 181$ 203$ Full-time 1,906 146$ 181$ Full-time 228 197$ 222$ Full-time 2,134 151$ 184$ All 2,201 149$ 185$ All 266 205$ 217$ All 2,467 155$ 188$
CSU Part-time 134 85$ 139$ CSU Part-time 382 130$ 151$ CSU Part-time 516 118$ 147$ Full-time 1,225 120$ 147$ Full-time 776 150$ 175$ Full-time 2,001 132$ 157$
All 1,359 117$ 146$ All 1,158 143$ 168$ All 2,517 129$ 155$ ICU Part-time 96 202$ 75$ ICU Part-time 91 296$ 57$ ICU Part-time 187 247$ 68$ Full-time 1,439 263$ 82$ Full-time 251 322$ 82$ Full-time 1,690 282$ 82$
All 1,535 259$ 82$ All 342 315$ 76$ All 1,877 269$ 81$ ALL Part-time 1,141 143$ 43$ ALL Part-time 1,542 164$ 49$ ALL Part-time 2,683 155$ 47$
Full-time 5,982 165$ 82$ Full-time 2,092 190$ 93$ Full-time 8,074 171$ 85$ All 7,123 161$ 60$ All 3,634 179$ 58$ All 10,757 167$ 59$
Note: "Nothing" category was excluded from the means and median calculations.
TABLE M-44: MEAN AND MEDIAN COURSE MATERIAL FEES PER ACADEMIC TERM BY SEGMENT, COURSE LOAD, AND DEPENDENCY STATUS
Number Mean Median Number MedianMean Median Number Mean
Source: California Student Aid Commission 279 2003-04 SEARS

Question for Tables: W-44.1, U-44.1, and M-44.1 PCC
Based on the length of time you indicated you would be attending school (question 17), what are your
expenses for course material fees (e.g., laboratory or studio fees) between July 1, 2003 and June 30, 2004 at your campus?
00 Nothing 07 $50 to $59 14 $300 to $399 21 $1,000 to $1,099 01 Less than $10 08 $60 to $69 15 $400 to $499 22 $1,100 to $1,199
02 $10 to $19 09 $70 to $79 16 $500 to $599 23 $1,200 or more 03 $20 to $29 10 $80 to $89 17 $600 to $699 04 $30 to $39 11 $90 to $99 18 $700 to $799
05 $40 to $49 12 $100 to $199 19 $800 to $899
06 $100 to $119 13 $200 to $299 20 $900 to $999
280 2003-04 SEARS

DEPENDENT UNDERGRADUATES
Nothing Under $50 $50 to $99 $100 to $199 $200 to $299 $300 to $399 $400 to $499 $500 to $599 $1,000 or More# % # % # % # % # % # % # % # % # % # % # % #
PCC Part-time 2,472 43.5 379 6.7 425 7.5 710 12.5 692 12.2 45 0.8 126 2.2 343 6.0 89 1.6 73 1.3 334 5.9 5,688 100 Full-time 9,957 46.7 1,659 7.8 2,298 10.8 1,919 9.0 1,923 9.0 603 2.8 328 1.5 429 2.0 287 1.3 118 0.6 1,812 8.5 21,332 100 All 12,429 46.0 2,038 7.5 2,723 10.1 2,629 9.7 2,615 9.7 648 2.4 454 1.7 772 2.9 376 1.4 191 0.7 2,146 7.9 27,020 100
INDEPENDENT UNDERGRADUATES
Nothing Under $50 $50 to $99 $100 to $199 $200 to $299 $300 to $399 $400 to $499 $500 to $599 $1,000 or More# % # % # % # % # % # % # % # % # % # % # % #
PCC Part-time 9,626 50.8 1,291 6.8 912 4.8 1,442 7.6 1,311 6.9 720 3.8 831 4.4 773 4.1 383 2.0 245 1.3 1,433 7.6 18,965 100 Full-time 22,112 49.0 3,083 6.8 3,470 7.7 4,165 9.2 2,402 5.3 1,888 4.2 1,635 3.6 1,239 2.7 1,429 3.2 262 0.6 3,422 7.6 45,107 100 All 31,738 49.5 4,373 6.8 4,382 6.8 5,607 8.8 3,713 5.8 2,608 4.1 2,465 3.8 2,012 3.1 1,812 2.8 507 0.8 4,855 7.6 64,073 100
ALL UNDERGRADUATESPart-time 12,098 49.1 1,670 6.8 1,337 5.4 2,152 8.7 2,002 8.1 765 3.1 957 3.9 1,116 4.5 473 1.9 318 1.3 1,766 7.2 24,654 100 Full-time 32,069 48.3 4,741 7.1 5,768 8.7 6,083 9.2 4,326 6.5 2,491 3.7 1,963 3.0 1,668 2.5 1,716 2.6 381 0.6 5,234 7.9 66,440 100 All 44,167 48.5 6,411 7.0 7,105 7.8 8,235 9.0 6,328 6.9 3,256 3.6 2,920 3.2 2,784 3.1 2,188 2.4 699 0.8 7,000 7.7 91,093 100
TABLE W-44.1: PCC COURSE MATERIAL FEES PER ACADEMIC YEAR BY SEGMENT, COURSE LOAD, AND DEPENDENCY STATUS
%
$800 to $999 Total$600 to $799
$600 to $799 $800 to $999 Total
%
Source: California Student Aid Commission 281 2003-04 SEARS

DEPENDENT UNDERGRADUATES
Nothing Under $50 $50 to $99 $100 to $199 $200 to $299 $300 to $399 $400 to $499 $500 to $599 $1,000 or More# % # % # % # % # % # % # % # % # % # % # % #
PCC Part-time 126 48.8 22 8.5 23 8.9 20 7.8 22 8.5 4 1.6 6 2.3 8 3.1 5 1.9 4 1.6 18 7.0 258 100 Full-time 486 49.1 81 8.2 87 8.8 65 6.6 91 9.2 28 2.8 17 1.7 23 2.3 17 1.7 8 0.8 87 8.8 990 100 All 612 49.0 103 8.3 110 8.8 85 6.8 113 9.1 32 2.6 23 1.8 31 2.5 22 1.8 12 1.0 105 8.4 1,248 100
INDEPENDENT UNDERGRADUATES
Nothing Under $50 $50 to $99 $100 to $199 $200 to $299 $300 to $399 $400 to $499 $500 to $599 $1,000 or More# % # % # % # % # % # % # % # % # % # % # % #
PCC Part-time 271 50.8 42 7.9 26 4.9 44 8.3 31 5.8 21 3.9 17 3.2 16 3.0 13 2.4 5 0.9 47 8.8 533 100 Full-time 869 54.0 120 7.5 111 6.9 110 6.8 68 4.2 48 3.0 51 3.2 53 3.3 42 2.6 9 0.6 127 7.9 1,608 100 All 1,140 53.2 162 7.6 137 6.4 154 7.2 99 4.6 69 3.2 68 3.2 69 3.2 55 2.6 14 0.7 174 8.1 2,141 100
ALL UNDERGRADUATESPart-time 397 50.2 64 8.1 49 6.2 64 8.1 53 6.7 25 3.2 23 2.9 24 3.0 18 2.3 9 1.1 65 8.2 791 100 Full-time 1,355 52.2 201 7.7 198 7.6 175 6.7 159 6.1 76 2.9 68 2.6 76 2.9 59 2.3 17 0.7 214 8.2 2,598 100 All 1,752 51.7 265 7.8 247 7.3 239 7.1 212 6.3 101 3.0 91 2.7 100 3.0 77 2.3 26 0.8 279 8.2 3,389 100
TABLE U-44.1: PCC COURSE MATERIAL FEES PER ACADEMIC YEAR BY SEGMENT, COURSE LOAD, AND DEPENDENCY STATUS
%
$800 to $999 Total$600 to $799
$600 to $799 $800 to $999 Total
%
Source: California Student Aid Commission 282 2003-04 SEARS

DEPENDENT UNDERGRADUATES INDEPENDENT UNDERGRADUATES ALL UNDERGRADUATES
PCC Part-time 132 363$ 212$ PCC Part-time 263 426$ 279$ PCC Part-time 395 405$ 255$ Full-time 504 388$ 197$ Full-time 738 412$ 241$ Full-time 1,242 402$ 221$ All 636 383$ 201$ All 1,001 416$ 254$ All 1,637 403$ 232$
Note: "Nothing" category was excluded from the means and median calculations.
TABLE M-44.1: MEAN AND MEDIAN PCC COURSE MATERIAL FEES PER ACADEMIC YEAR BY SEGMENT, COURSE LOAD, AND DEPENDENCY STATUS
Number Mean Median Number MedianMean Median Number Mean
Source: California Student Aid Commission 283 2003-04 SEARS

Question for Tables: W-45 and U-45
Do you own a computer? Yes No
284 2003-04 SEARS

TABLE W-45 COMPUTER OWNERSHIP BY SEGMENT, COURSE LOAD, AND DEPENDENCY STATUS
Own a Computer Do Not Own a ComputerDependent Independent All Dependent Independent All# % # % # % # % # % # % # %
CCC Part-time 304,689 32.1 476,345 50.2 781,034 82.4 72,238 7.6 95,126 10.0 167,364 17.6 948,398 100 Full-time 223,011 53.1 116,275 27.7 339,286 80.8 48,780 11.6 31,997 7.6 80,777 19.2 420,063 100 All 527,700 38.6 592,620 43.3 1,120,320 81.9 121,018 8.8 127,123 9.3 248,141 18.1 1,368,461 100
UC Part-time 25,586 82.7 3,289 10.6 28,875 93.3 1,591 5.1 475 1.5 2,065 6.7 30,940 100 Full-time 106,419 86.8 12,248 10.0 118,667 96.7 3,030 2.5 969 0.8 3,999 3.3 122,666 100 All 132,005 85.9 15,537 10.1 147,542 96.1 4,620 3.0 1,444 0.9 6,064 3.9 153,606 100
CSU Part-time 18,870 27.3 44,574 64.5 63,444 91.9 827 1.2 4,796 6.9 5,623 8.1 69,067 100 Full-time 139,421 60.5 74,041 32.1 213,462 92.6 10,590 4.6 6,537 2.8 17,127 7.4 230,589 100 All 158,291 52.8 118,615 39.6 276,906 92.4 11,417 3.8 11,332 3.8 22,749 7.6 299,655 100
ICU Part-time 4,677 31.9 8,951 61.0 13,628 92.9 351 2.4 687 4.7 1,038 7.1 14,666 100 Full-time 83,901 80.1 15,445 14.8 99,346 94.9 3,988 3.8 1,364 1.3 5,353 5.1 104,699 100 All 88,578 74.2 24,396 20.4 112,974 94.6 4,340 3.6 2,051 1.7 6,391 5.4 119,364 100
PCC Part-time 4,961 18.6 17,630 66.2 22,591 84.9 1,163 4.4 2,861 10.7 4,024 15.1 26,615 100 Full-time 18,535 26.2 38,204 54.1 56,739 80.3 4,445 6.3 9,442 13.4 13,887 19.7 70,626 100 All 23,496 24.2 55,834 57.4 79,330 81.6 5,608 5.8 12,303 12.7 17,911 18.4 97,241 100
ALL Part-time 358,783 32.9 550,788 50.5 909,571 83.5 76,169 7.0 103,944 9.5 180,114 16.5 1,089,685 100 Full-time 571,287 60.2 256,213 27.0 827,500 87.2 70,833 7.5 50,309 5.3 121,142 12.8 948,642 100 All 930,070 45.6 807,001 39.6 1,737,071 85.2 147,002 7.2 154,254 7.6 301,256 14.8 2,038,327 100
Total
Source: California Student Aid Commission 285 2003-04 SEARS

TABLE U-45 COMPUTER OWNERSHIP BY SEGMENT, COURSE LOAD, AND DEPENDENCY STATUS
Own a Computer Do Not Own a ComputerDependent Independent All Dependent Independent All# % # % # % # % # % # % # %
CCC Part-time 852 32.1 1,332 50.2 2,184 82.4 202 7.6 266 10.0 468 17.6 2,652 100 Full-time 1,847 53.1 963 27.7 2,810 80.8 404 11.6 265 7.6 669 19.2 3,479 100 All 2,699 44.0 2,295 37.4 4,994 81.5 606 9.9 531 8.7 1,137 18.5 6,131 100
UC Part-time 415 81.7 60 11.8 475 93.5 24 4.7 9 1.8 33 6.5 508 100 Full-time 2,803 86.9 318 9.9 3,121 96.7 81 2.5 25 0.8 106 3.3 3,227 100 All 3,218 86.2 378 10.1 3,596 96.3 105 2.8 34 0.9 139 3.7 3,735 100
CSU Part-time 207 25.7 533 66.1 740 91.8 11 1.4 55 6.8 66 8.2 806 100 Full-time 1,739 58.4 1,006 33.8 2,745 92.1 136 4.6 98 3.3 234 7.9 2,979 100 All 1,946 51.4 1,539 40.7 3,485 92.1 147 3.9 153 4.0 300 7.9 3,785 100
ICU Part-time 139 45.7 145 47.7 284 93.4 7 2.3 13 4.3 20 6.6 304 100 Full-time 1,875 81.4 316 13.7 2,191 95.1 84 3.6 29 1.3 113 4.9 2,304 100 All 2,014 77.2 461 17.7 2,475 94.9 91 3.5 42 1.6 133 5.1 2,608 100
PCC Part-time 221 25.8 480 56.1 701 81.9 61 7.1 94 11.0 155 18.1 856 100 Full-time 862 31.4 1,296 47.2 2,158 78.7 193 7.0 392 14.3 585 21.3 2,743 100 All 1,083 30.1 1,776 49.3 2,859 79.4 254 7.1 486 13.5 740 20.6 3,599 100
ALL Part-time 1,834 35.8 2,550 49.7 4,384 85.5 305 6.0 437 8.5 742 14.5 5,126 100 Full-time 9,126 61.9 3,899 26.5 13,025 88.4 898 6.1 809 5.5 1,707 11.6 14,732 100 All 10,960 55.2 6,449 32.5 17,409 87.7 1,203 6.1 1,246 6.3 2,449 12.3 19,858 100
Total
Source: California Student Aid Commission 286 2003-04 SEARS

Question for Tables: W-46, U-46, and M-46
How much did your computer cost? 00 Less than $500 03 $1,000 to $1,249 06 $2,000 to $2,499 09 $3,500 to $3,999 01 $500 to $749 04 $1,250 to $1,499 07 $2,500 to $2,999 10 $4,000 or more 02 $750 to $999 05 $1,500 to $1,999 08 $3,000 to $3,499
287 2003-04 SEARS

TABLE W-46: COST OF COMPUTER BY SEGMENT, COURSE LOAD, AND DEPENDENCY STATUS
DEPENDENT UNDERGRADUATES
Total
# % # % # % # % # % # % # % # % # % # % # % #CC Part-time 17,166 6.4 32,543 12.1 44,702 16.6 64,371 23.9 29,682 11.0 31,828 11.8 25,391 9.4 10,728 4.0 7,868 2.9 1,431 0.5 3,576 1.3 269,285 100
Full-time 14,368 7.4 23,907 12.3 27,046 13.9 40,690 20.9 22,579 11.6 28,616 14.7 20,647 10.6 7,969 4.1 4,347 2.2 1,570 0.8 2,536 1.3 194,274 100 All 31,534 6.8 56,450 12.2 71,748 15.5 105,061 22.7 52,261 11.3 60,444 13.0 46,038 9.9 18,697 4.0 12,214 2.6 3,000 0.6 6,112 1.3 463,559 100
UC Part-time 847 3.8 2,393 11 3,128 14 4,494 20 3,091 14 5,036 22 1,883 8 723 3 533 2 107 0 211 0.9 22,444 100 Full-time 3,322 3.5 7,436 7.8 11,819 12.4 19,904 20.9 15,347 16.1 21,057 22.1 10,871 11.4 3,257 3.4 1,412 1.5 313 0.3 528 0.6 95,266 100 All 4,169 3.5 9,829 8.4 14,947 12.7 24,398 20.7 18,438 15.7 26,093 22.2 12,754 10.8 3,980 3.4 1,945 1.7 420 0.4 738 0.6 117,710 100
CSU Part-time 1,165 6.9 1,466 8.6 2,800 16.5 2,865 16.9 2,406 14.2 3,252 19.1 1,675 9.9 696 4.1 495 2.9 122 0.7 53 0.3 16,995 100 Full-time 5,208 4.3 10,249 8.5 17,232 14.2 28,484 23.5 17,863 14.7 21,534 17.8 13,329 11.0 3,968 3.3 2,582 2.1 467 0.4 254 0.2 121,171 100 All 6,373 4.6 11,715 8.5 20,032 14.5 31,349 22.7 20,269 14.7 24,786 17.9 15,004 10.9 4,664 3.4 3,077 2.2 589 0.4 307 0.2 138,166 100
ICU Part-time - 0.0 260 6.3 630 15.2 827 20.0 577 13.9 1,062 25.6 430 10.4 192 4.6 42 1.0 66 1.6 54 1.3 4,140 100 Full-time 2,842 4.0 4,802 6.7 7,729 10.9 12,729 17.9 9,961 14.0 14,997 21.1 9,605 13.5 4,268 6.0 1,972 2.8 1,441 2.0 874 1.2 71,219 100 All 2,842 3.8 5,062 6.7 8,358 11.1 13,556 18.0 10,538 14.0 16,059 21.3 10,035 13.3 4,459 5.9 2,014 2.7 1,507 2.0 929 1.2 75,360 100
PCC Part-time 294 6.1 273 5.7 476 9.9 689 14.3 524 10.9 1,106 23.0 800 16.6 272 5.6 330 6.9 19 0.4 33 0.7 4,816 100 Full-time 1,315 7.9 1,933 11.7 2,018 12.2 2,983 18.0 2,162 13.0 2,209 13.3 1,658 10.0 908 5.5 826 5.0 213 1.3 361 2.2 16,585 100 All 1,610 7.5 2,205 10.3 2,493 11.7 3,672 17.2 2,686 12.6 3,315 15.5 2,458 11.5 1,179 5.5 1,156 5.4 232 1.1 394 1.8 21,401 100
ALL Part-time 19,472 6.1 36,935 11.6 51,736 16.3 73,246 23.1 36,280 11.4 42,283 13.3 30,178 9.5 12,610 4.0 9,268 2.9 1,745 0.5 3,927 1.2 317,681 100 Full-time 27,055 5.4 48,327 9.7 65,843 13.2 104,790 21.0 67,912 13.6 88,413 17.7 56,110 11.3 20,370 4.1 11,139 2.2 4,004 0.8 4,553 0.9 498,515 100 All 46,527 5.7 85,262 10.4 117,579 14.4 178,036 21.8 104,192 12.8 130,696 16.0 86,289 10.6 32,980 4.0 20,407 2.5 5,749 0.7 8,480 1.0 816,196 100
INDEPENDENT UNDERGRADUATES
Total
# % # % # % # % # % # % # % # % # % # % # % # %CC Part-time 30,040 6.7 52,212 11.6 65,086 14.4 83,682 18.5 68,662 15.2 65,444 14.5 47,205 10.5 20,384 4.5 13,589 3.0 1,431 0.3 3,934 0.9 451,668 100
Full-time 12,436 11.4 12,557 11.5 16,783 15.3 17,628 16.1 16,059 14.7 16,783 15.3 8,935 8.2 4,347 4.0 1,811 1.7 966 0.9 1,087 1.0 109,391 100 All 42,476 7.6 64,769 11.5 81,869 14.6 101,310 18.1 84,721 15.1 82,227 14.7 56,140 10.0 24,731 4.4 15,400 2.7 2,396 0.4 5,021 0.9 561,060 100
UC Part-time 141 4.8 475 16.3 319 10.9 553 18.9 448 15.3 633 21.6 354 12.1 - - - - - - - - 2,922 100 Full-time 729 6.4 1,108 9.7 922 8.0 2,485 21.7 1,657 14.4 2,212 19.3 1,696 14.8 415 3.6 174 1.5 37 0.3 37 0.3 11,472 100 All 870 6.0 1,584 11.0 1,241 8.6 3,038 21.1 2,105 14.6 2,844 19.8 2,050 14.2 415 2.9 174 1.2 37 0.3 37 0.3 14,395 100
CSU Part-time 3,052 7.4 3,568 8.6 6,539 15.8 7,145 17.2 6,257 15.1 7,059 17.0 3,746 9.0 2,627 6.3 701 1.7 241 0.6 490 1.2 41,424 100 Full-time 3,907 5.7 7,002 10.2 8,793 12.8 11,998 17.5 10,573 15.4 14,065 20.5 7,472 10.9 1,757 2.6 2,035 3.0 505 0.7 360 0.5 68,467 100 All 6,959 6.3 10,570 9.6 15,332 14.0 19,143 17.4 16,830 15.3 21,124 19.2 11,218 10.2 4,384 4.0 2,736 2.5 746 0.7 850 0.8 109,890 100
ICU Part-time 519 6.1 1,297 15.1 1,035 12.1 1,321 15.4 1,017 11.9 1,461 17.0 788 9.2 600 7.0 303 3.5 177 2.1 58 0.7 8,575 100 Full-time 723 5.2 648 4.7 1,211 8.8 2,771 20.0 2,355 17.0 3,254 23.5 1,081 7.8 974 7.0 404 2.9 174 1.3 228 1.6 13,822 100 All 1,242 5.5 1,946 8.7 2,246 10.0 4,091 18.3 3,372 15.1 4,715 21.0 1,869 8.3 1,574 7.0 707 3.2 350 1.6 285 1.3 22,397 100
PCC Part-time 1,188 7.3 1,784 11.0 1,513 9.3 3,626 22.3 2,215 13.6 2,318 14.3 1,869 11.5 537 3.3 590 3.6 303 1.9 313 1.9 16,256 100 Full-time 2,692 7.5 3,060 8.6 4,696 13.2 6,147 17.2 5,542 15.5 6,035 16.9 3,997 11.2 1,659 4.6 1,307 3.7 179 0.5 385 1.1 35,700 100 All 3,880 7.5 4,844 9.3 6,210 12.0 9,774 18.8 7,757 14.9 8,353 16.1 5,866 11.3 2,196 4.2 1,897 3.7 482 0.9 698 1.3 51,956 100
ALL Part-time 34,939 6.7 59,336 11.4 74,493 14.3 96,327 18.5 78,598 15.1 76,914 14.8 53,961 10.4 24,148 4.6 15,184 2.9 2,152 0.4 4,794 0.9 520,845 100 Full-time 20,488 8.6 24,376 10.2 32,405 13.6 41,029 17.2 36,185 15.1 42,348 17.7 23,181 9.7 9,152 3.8 5,731 2.4 1,861 0.8 2,096 0.9 238,853 100 All 55,427 7.3 83,712 11.0 106,898 14.1 137,356 18.1 114,784 15.1 119,262 15.7 77,142 10.2 33,300 4.4 20,915 2.8 4,012 0.5 6,890 0.9 759,698 100
ALL UNDERGRADUATESPart-time 54,411 6.5 96,271 11.5 126,229 15.1 169,573 20.2 114,879 13.7 119,197 14.2 84,140 10.0 36,757 4.4 24,451 2.9 3,897 0.5 8,721 1.0 838,526 100 Full-time 47,543 6.4 72,703 9.9 98,248 13.3 145,819 19.8 104,097 14.1 130,761 17.7 79,291 10.8 29,522 4.0 16,871 2.3 5,864 0.8 6,649 0.9 737,368 100 All 101,954 6.5 168,974 10.7 224,477 14.2 315,392 20.0 218,976 13.9 249,958 15.9 163,431 10.4 66,279 4.2 41,322 2.6 9,761 0.6 15,370 1.0 1,575,894 100
%
Less than $500
$500 to $749
$750 to $999
$1,000 to $1,249
$1,250 to $1,499
$1,500 to $1,999
$2,000 to $2,499
$2,500 to $2,999
$3,000 to $3,499
$1,250 to $1,499
$1,500 to $1,999
$2,000 to $2,499
$2,500 to $2,999
Less than $500
$500 to $749
$750 to $999
$1,000 to $1,249
$3,000 to $3,499
$3,500 to $3,999
$4,000 or more
$3,500 to $3,999
$4,000 or more
Source: California Student Aid Commission 288 2003-04 SEARS

TABLE U-46: COST OF COMPUTER BY SEGMENT, COURSE LOAD, AND DEPENDENCY STATUS
DEPENDENT UNDERGRADUATES
Total
# % # % # % # % # % # % # % # % # % # % # % #CC Part-time 48 6.4 91 12.1 125 16.6 180 23.9 83 11.0 89 11.8 71 9.4 30 4.0 22 2.9 4 0.5 10 1.3 753 100
Full-time 119 7.4 198 12.3 224 13.9 337 20.9 187 11.6 237 14.7 171 10.6 66 4.1 36 2.2 13 0.8 21 1.3 1,609 100 All 167 7.1 289 12.2 349 14.8 517 21.9 270 11.4 326 13.8 242 10.2 96 4.1 58 2.5 17 0.7 31 1.3 2,362 100
UC Part-time 13 3.6 37 10 49 13 73 20 54 15 81 22 32 9 12 3 9 2 2 1 3 0.8 365 100 Full-time 88 3.5 199 7.9 311 12.4 528 21.0 406 16.2 548 21.8 287 11.4 85 3.4 38 1.5 8 0.3 14 0.6 2,512 100 All 101 3.5 236 8.2 360 12.5 601 20.9 460 16.0 629 21.9 319 11.1 97 3.4 47 1.6 10 0.3 17 0.6 2,877 100
CSU Part-time 12 6.4 15 8.0 29 15.4 33 17.6 27 14.4 35 18.6 19 10.1 8 4.3 7 3.7 1 0.5 2 1.1 188 100 Full-time 65 4.3 130 8.6 214 14.2 332 22.1 232 15.4 276 18.4 165 11.0 48 3.2 30 2.0 5 0.3 7 0.5 1,504 100 All 77 4.6 145 8.6 243 14.4 365 21.6 259 15.3 311 18.4 184 10.9 56 3.3 37 2.2 6 0.4 9 0.5 1,692 100
ICU Part-time - 0.0 8 6.6 17 14.0 22 18.2 16 13.2 28 23.1 18 14.9 6 5.0 1 0.8 3 2.5 2 1.7 121 100 Full-time 62 3.9 102 6.4 158 10.0 279 17.6 232 14.6 345 21.8 217 13.7 105 6.6 45 2.8 21 1.3 19 1.2 1,585 100 All 62 3.6 110 6.4 175 10.3 301 17.6 248 14.5 373 21.9 235 13.8 111 6.5 46 2.7 24 1.4 21 1.2 1,706 100
PCC Part-time 18 8.7 18 8.7 21 10.1 29 13.9 24 11.5 41 19.7 29 13.9 14 6.7 11 5.3 1 0.5 2 1.0 208 100 Full-time 50 6.5 72 9.4 89 11.6 146 19.0 102 13.2 117 15.2 86 11.2 42 5.5 43 5.6 13 1.7 10 1.3 770 100 All 68 7.0 90 9.2 110 11.2 175 17.9 126 12.9 158 16.2 115 11.8 56 5.7 54 5.5 14 1.4 12 1.2 978 100
ALL Part-time 91 5.6 169 10.3 241 14.7 337 20.6 204 12.5 274 16.8 169 10.3 70 4.3 50 3.1 11 0.7 19 1.2 1,635 100 Full-time 384 4.8 701 8.8 996 12.5 1,622 20.3 1,159 14.5 1,523 19.1 926 11.6 346 4.3 192 2.4 60 0.8 71 0.9 7,980 100 All 475 4.9 870 9.0 1,237 12.9 1,959 20.4 1,363 14.2 1,797 18.7 1,095 11.4 416 4.3 242 2.5 71 0.7 90 0.9 9,615 100
INDEPENDENT UNDERGRADUATES
Total
# % # % # % # % # % # % # % # % # % # % # % # %CC Part-time 84 6.7 146 11.6 182 14.4 234 18.5 192 15.2 183 14.5 132 10.5 57 4.5 38 3.0 4 0.3 11 0.9 1,263 100
Full-time 103 11.4 104 11.5 139 15.3 146 16.1 133 14.7 139 15.3 74 8.2 36 4.0 15 1.7 8 0.9 9 1.0 906 100 All 187 8.6 250 11.5 321 14.8 380 17.5 325 15.0 322 14.8 206 9.5 93 4.3 53 2.4 12 0.6 20 0.9 2,169 100
UC Part-time 2 3.7 10 18.5 5 9.3 11 20.4 7 13.0 12 22.2 7 13.0 - - - - - - - - 54 100 Full-time 19 6.4 28 9.4 24 8.1 65 21.8 43 14.4 57 19.1 44 14.8 11 3.7 5 1.7 1 0.3 1 0.3 298 100 All 21 6.0 38 10.8 29 8.2 76 21.6 50 14.2 69 19.6 51 14.5 11 3.1 5 1.4 1 0.3 1 0.3 352 100
CSU Part-time 34 6.9 44 8.9 79 15.9 84 16.9 73 14.7 82 16.5 56 11.3 27 5.4 10 2.0 2 0.4 5 1.0 496 100 Full-time 52 5.6 104 11.2 127 13.7 155 16.7 145 15.6 187 20.2 97 10.5 24 2.6 26 2.8 7 0.8 3 0.3 927 100 All 86 6.0 148 10.4 206 14.5 239 16.8 218 15.3 269 18.9 153 10.8 51 3.6 36 2.5 9 0.6 8 0.6 1,423 100
ICU Part-time 9 6.6 13 9.5 17 12.4 21 15.3 17 12.4 26 19.0 14 10.2 10 7.3 6 4.4 3 2.2 1 0.7 137 100 Full-time 13 4.6 14 5.0 25 8.9 55 19.6 49 17.4 68 24.2 23 8.2 18 6.4 9 3.2 3 1.1 4 1.4 281 100 All 22 5.3 27 6.5 42 10.0 76 18.2 66 15.8 94 22.5 37 8.9 28 6.7 15 3.6 6 1.4 5 1.2 418 100
PCC Part-time 34 7.8 47 10.8 46 10.6 70 16.1 67 15.4 73 16.8 42 9.7 21 4.8 18 4.1 7 1.6 9 2.1 434 100 Full-time 122 10.0 130 10.6 152 12.4 183 15.0 165 13.5 215 17.6 113 9.3 57 4.7 53 4.3 10 0.8 21 1.7 1,221 100 All 156 9.4 177 10.6 198 12.0 253 15.3 232 14.0 288 17.4 155 9.4 78 4.7 71 4.3 17 1.0 30 1.8 1,655 100
ALL Part-time 163 6.8 260 10.9 329 13.8 420 17.6 356 14.9 376 15.8 251 10.5 115 4.8 72 3.0 16 0.7 26 1.1 2,384 100 Full-time 309 8.5 380 10.5 467 12.9 604 16.6 535 14.7 666 18.3 351 9.7 146 4.0 108 3.0 29 0.8 38 1.0 3,633 100 All 472 7.8 640 10.6 796 13.2 1,024 17.0 891 14.8 1,042 17.3 602 10.0 261 4.3 180 3.0 45 0.7 64 1.1 6,017 100
ALL UNDERGRADUATESPart-time 254 6.3 429 10.7 570 14.2 757 18.8 560 13.9 650 16.2 420 10.5 185 4.6 122 3.0 27 0.7 45 1.1 4,019 100 Full-time 693 6.0 1,081 9.3 1,463 12.6 2,226 19.2 1,694 14.6 2,189 18.8 1,277 11.0 492 4.2 300 2.6 89 0.8 109 0.9 11,613 100 All 947 6.1 1,510 9.7 2,033 13.0 2,983 19.1 2,254 14.4 2,839 18.2 1,697 10.9 677 4.3 422 2.7 116 0.7 154 1.0 15,632 100
%
Less than $500
$500 to $749
$750 to $999
$1,000 to $1,249
$1,250 to $1,499
$1,500 to $1,999
$2,000 to $2,499
$2,500 to $2,999
$3,000 to $3,499
$1,250 to $1,499
$1,500 to $1,999
$2,000 to $2,499
$2,500 to $2,999
Less than $500
$500 to $749
$750 to $999
$1,000 to $1,249
$3,000 to $3,499
$3,500 to $3,999
$4,000 or more
$3,500 to $3,999
$4,000 or more
Source: California Student Aid Commission 289 2003-04 SEARS

DEPENDENT UNDERGRADUATES INDEPENDENT UNDERGRADUATES ALL UNDERGRADUATES
CCC Part-time 753 1,357$ 1,222$ CCC Part-time 1,263 1,392$ 1,339$ CCC Part-time 2,016 1,379$ 1,294$ Full-time 1,609 1,381$ 1,283$ Full-time 906 1,308$ 1,369$ Full-time 2,515 1,355$ 1,335$ All 2,362 1,373$ 1,245$ All 2,169 1,357$ 1,345$ All 4,531 1,365$ 1,306$
UC Part-time 365 1,430$ 1,347$ UC Part-time 54 1,294$ 1,301$ UC Part-time 419 1,412$ 1,342$ Full-time 2,512 1,442$ 1,387$ Full-time 298 1,439$ 1,433$ Full-time 2,810 1,442$ 1,392$ All 2,877 1,440$ 1,380$ All 352 1,417$ 1,408$ All 3,229 1,438$ 1,383$
CSU Part-time 188 1,452$ 1,391$ CSU Part-time 496 1,421$ 1,387$ CSU Part-time 684 1,430$ 1,388$ Full-time 1,504 1,403$ 1,314$ Full-time 927 1,400$ 1,401$ Full-time 2,431 1,402$ 1,346$
All 1,692 1,408$ 1,323$ All 1,423 1,408$ 1,396$ All 3,115 1,408$ 1,356$ ICU Part-time 121 1,617$ 1,321$ ICU Part-time 137 1,546$ 1,512$ ICU Part-time 258 1,579$ 1,491$ Full-time 1,585 1,601$ 758$ Full-time 281 1,569$ 1,491$ Full-time 1,866 1,596$ 1,508$
All 1,706 1,602$ 1,491$ All 418 1,561$ 1,508$ All 2,124 1,594$ 1,498$ PCC Part-time 208 1,554$ 1,692$ PCC Part-time 434 1,502$ 1,384$ PCC Part-time 642 1,519$ 1,445$ Full-time 770 1,538$ 1,409$ Full-time 1,221 1,445$ 1,425$ Full-time 1,991 1,481$ 1,420$
All 978 1,542$ 1,466$ All 1,655 1,460$ 1,413$ All 2,633 1,490$ 1,427$ ALL Part-time 1,635 1,429$ 1,238$ ALL Part-time 2,384 1,425$ 1,363$ ALL Part-time 4,019 1,426$ 1,323$
Full-time 7,980 1,463$ 1,361$ Full-time 3,633 1,408$ 1,398$ Full-time 11,613 1,446$ 1,374$ All 9,615 1,457$ 1,314$ All 6,017 1,415$ 1,373$ All 15,632 1,441$ 1,346$
TABLE M-46: MEAN AND MEDIAN COST OF A COMPUTER BY SEGMENT, COURSE LOAD, AND DEPENDENCY STATUS
Number Mean Median Number MedianMean Median Number Mean
Source: California Student Aid Commission 290 2003-04 SEARS

Questions for Tables: W-47, U-47, and M-47 UC, CSU and ICU
Excluding the purchase price of a computer, what will be your total computer related expenses for the
current academic year? Include hardware, software (excluding entertainment software), repairs, e-mail, and internet services.
00 Nothing 04 $500 to $749 07 $1,250 to $1,499 10 $2,000 to $2,249 01 Under $100 05 $750 to $999 08 $1,500 to $1,749 11 $2,250 to $2,499 02 $100 to $249 06 $1,000 to $1,249 09 $1,750 to $1,999 12 $2,500 or more 03 $250 to $499
291 2003-04 SEARS

DEPENDENT UNDERGRADUATES
Nothing Less Than $100 $100 to $249 $250 to $499 $500 to $749 $750 to $999 $1,000 to $1,249
# % # % # % # % # % # % # %UC Part-time 2,902 10.7 7,720 28.4 7,273 26.8 4,800 17.7 1,939 7.1 702 2.6 948 3.5
Full-time 8,559 7.8 34,956 31.9 32,778 29.9 20,045 18.3 7,128 6.5 2,326 2.1 1,836 1.7 All 11,461 8.4 42,676 31.2 40,051 29.3 24,845 18.2 9,068 6.6 3,029 2.2 2,784 2.0
CSU Part-time 1,849 9.4 5,107 25.9 5,888 29.9 4,907 24.9 917 4.7 452 2.3 378 1.9 Full-time 12,768 8.5 41,735 27.9 43,347 28.9 30,728 20.5 9,435 6.3 4,419 3.0 2,949 2.0 All 14,617 8.6 46,842 27.6 49,235 29.1 35,635 21.0 10,352 6.1 4,871 2.9 3,326 2.0
ICU Part-time 955 19.0 1,384 27.5 1,202 23.9 727 14.5 386 7.7 146 2.9 56 1.1 Full-time 9,561 10.9 23,995 27.4 25,098 28.7 17,075 19.5 6,296 7.2 1,442 1.6 2,192 2.5 All 10,516 11.4 25,379 27.4 26,300 28.4 17,802 19.2 6,682 7.2 1,588 1.7 2,247 2.4
ALL Part-time 5,707 11.0 14,211 27.4 14,363 27.7 10,434 20.1 3,242 6.2 1,300 2.5 1,381 2.7 Full-time 30,888 8.9 100,686 29.0 101,223 29.2 67,848 19.6 22,860 6.6 8,188 2.4 6,976 2.0 All 36,594 9.2 114,897 28.8 115,586 29.0 78,282 19.6 26,102 6.5 9,488 2.4 8,358 2.1
$1,250 to $1,499 $1,500 to $1,749 $1,750 to $1,999 $2,000 to $2,249 $2,250 to $2,499 $2,500 or More Total
# % # % # % # % # % # % # %UC Part-time 351 1.3 189 0.7 70 0.3 - - 70 0.3 211 0.8 27,177 100
Full-time 718 0.7 440 0.4 227 0.2 228 0.2 81 0.1 214 0.2 109,536 100 All 1,070 0.8 629 0.5 297 0.2 228 0.2 151 0.1 425 0.3 136,713 100
CSU Part-time 122 0.6 78 0.4 - - - - - - - - 19,697 100 Full-time 1,243 0.8 1,009 0.7 205 0.1 439 0.3 480 0.3 1,004 0.7 149,761 100 All 1,365 0.8 1,086 0.6 205 0.1 439 0.3 480 0.3 1,004 0.6 169,458 100
ICU Part-time 32 0.6 - - 80 1.6 - - 7 0.1 55 1.1 5,028 100 Full-time 257 0.3 481 0.5 363 0.4 352 0.4 - - 441 0.5 87,553 100 All 289 0.3 481 0.5 443 0.5 352 0.4 7 0.0 496 0.5 92,582 100
ALL Part-time 505 1.0 267 0.5 150 0.3 - - 77 0.1 266 0.5 51,902 100 Full-time 2,218 0.6 1,929 0.6 795 0.2 1,019 0.3 561 0.2 1,659 0.5 346,850 100 All 2,723 0.7 2,196 0.6 946 0.2 1,019 0.3 638 0.2 1,925 0.5 398,753 100
TABLE W-47A: ACADEMIC YEAR COMPUTER EXPENSES BY SEGMENT, COURSE LOAD, AND DEPENDENCY STATUS
Source: California Student Aid Commission 292 2003-04 SEARS

INDEPENDENT UNDERGRADUATES
Nothing Less Than $100 $100 to $249 $250 to $499 $500 to $749 $750 to $999 $1,000 to $1,249
# % # % # % # % # % # % # %UC Part-time 452 12.0 916 24.3 1,219 32.4 742 19.7 220 5.8 107 2.9 - -
Full-time 1,098 8.4 3,065 23.4 3,373 25.7 3,030 23.1 1,423 10.9 527 4.0 197 1.5 All 1,550 9.2 3,980 23.6 4,592 27.2 3,773 22.4 1,643 9.7 635 3.8 197 1.2
CSU Part-time 4,452 9.2 9,510 19.6 11,657 24.0 12,128 25.0 5,580 11.5 1,940 4.0 1,533 3.2 Full-time 5,158 6.5 13,953 17.5 21,253 26.6 19,752 24.7 9,063 11.4 4,084 5.1 2,694 3.4 All 9,610 7.5 23,463 18.3 32,910 25.6 31,880 24.8 14,643 11.4 6,023 4.7 4,226 3.3
ICU Part-time 822 8.5 1,281 13.3 2,083 21.6 3,390 35.2 1,012 10.5 221 2.3 435 4.5 Full-time 1,850 11.1 3,017 18.0 3,935 23.5 4,008 23.9 1,945 11.6 597 3.6 432 2.6 All 2,672 10.1 4,298 16.3 6,017 22.8 7,398 28.0 2,958 11.2 818 3.1 866 3.3
ALL Part-time 5,726 9.2 11,707 18.9 14,958 24.1 16,260 26.2 6,812 11.0 2,268 3.7 1,967 3.2 Full-time 8,106 7.4 20,035 18.3 28,561 26.0 26,791 24.4 12,431 11.3 5,208 4.7 3,322 3.0 All 13,832 8.1 31,741 18.5 43,519 25.4 43,051 25.1 19,243 11.2 7,476 4.4 5,289 3.1
$1,250 to $1,499 $1,500 to $1,749 $1,750 to $1,999 $2,000 to $2,249 $2,250 to $2,499 $2,500 or More Total
# % # % # % # % # % # % # %UC Part-time 37 1.0 - - - - - - - - 70 1.9 3,764 100
Full-time 116 0.9 - - 79 0.6 77 0.6 - - 117 0.9 13,101 100 All 153 0.9 - - 79 0.5 77 0.5 - - 187 1.1 16,865 100
CSU Part-time 490 1.0 373 0.8 127 0.3 635 1.3 - - 180 0.4 48,603 100 Full-time 1,295 1.6 797 1.0 25 0.0 436 0.5 317 0.4 982 1.2 79,808 100 All 1,785 1.4 1,170 0.9 151 0.1 1,071 0.8 317 0.2 1,161 0.9 128,412 100
ICU Part-time 69 0.7 34 0.4 52 0.5 58 0.6 - - 181 1.9 9,637 100 Full-time 207 1.2 137 0.8 68 0.4 215 1.3 - - 330 2.0 16,740 100 All 276 1.0 171 0.6 120 0.5 272 1.0 - - 511 1.9 26,378 100
ALL Part-time 596 1.0 407 0.7 179 0.3 693 1.1 - - 431 0.7 62,004 100 Full-time 1,618 1.5 934 0.9 171 0.2 727 0.7 317 0.3 1,429 1.3 109,650 100 All 2,214 1.3 1,342 0.8 350 0.2 1,420 0.8 317 0.2 1,859 1.1 171,654 100
TABLE W-47A: ACADEMIC YEAR COMPUTER EXPENSES BY SEGMENT, COURSE LOAD, AND DEPENDENCY STATUS
Source: California Student Aid Commission 293 2003-04 SEARS

ALL UNDERGRADUATES
Nothing Less Than $100 $100 to $249 $250 to $499 $500 to $749 $750 to $999 $1,000 to $1,249
# % # % # % # % # % # % # %Part-time 11,432 10.0 25,918 22.8 29,321 25.7 26,694 23.4 10,054 8.8 3,568 3.1 3,349 2.9 Full-time 38,994 8.5 120,721 26.4 129,784 28.4 94,639 20.7 35,291 7.7 13,396 2.9 10,298 2.3 All 50,426 8.8 146,638 25.7 159,105 27.9 121,333 21.3 45,345 7.9 16,964 3.0 13,647 2.4
$1,250 to $1,499 $1,500 to $1,749 $1,750 to $1,999 $2,000 to $2,249 $2,250 to $2,499 $2,500 or More Total
# % # % # % # % # % # % # %Part-time 1,101 1.0 674 0.6 329 0.3 693 0.6 77 0.1 696 0.6 113,907 100 Full-time 3,836 0.8 2,863 0.6 967 0.2 1,746 0.4 879 0.2 3,088 0.7 456,500 100 All 4,937 0.9 3,537 0.6 1,296 0.2 2,439 0.4 956 0.2 3,784 0.7 570,407 100
TABLE W-47C: ACADEMIC YEAR COMPUTER EXPENSES BY SEGMENT, COURSE LOAD, AND DEPENDENCY STATUS
Source: California Student Aid Commission 294 2003-04 SEARS

DEPENDENT UNDERGRADUATES
Nothing Less Than $100 $100 to $249 $250 to $499 $500 to $749 $750 to $999 $1,000 to $1,249
# % # % # % # % # % # % # %UC Part-time 45 10.3 126 28.7 122 27.8 77 17.5 31 7.1 10 2.3 15 3.4
Full-time 221 7.7 924 32.0 864 29.9 532 18.4 186 6.4 62 2.1 49 1.7 All 266 8.0 1,050 31.6 986 29.6 609 18.3 217 6.5 72 2.2 64 1.9
CSU Part-time 22 10.1 55 25.2 66 30.3 50 22.9 13 6.0 4 1.8 6 2.8 Full-time 163 8.7 522 27.9 564 30.2 359 19.2 119 6.4 56 3.0 33 1.8 All 185 8.9 577 27.6 630 30.2 409 19.6 132 6.3 60 2.9 39 1.9
ICU Part-time 25 17.1 40 27.4 39 26.7 19 13.0 10 6.8 5 3.4 3 2.1 Full-time 234 12.0 543 27.8 542 27.8 370 19.0 140 7.2 37 1.9 46 2.4 All 259 12.4 583 27.8 581 27.7 389 18.6 150 7.2 42 2.0 49 2.3
ALL Part-time 92 11.5 221 27.5 227 28.3 146 18.2 54 6.7 19 2.4 24 3.0 Full-time 618 9.2 1,989 29.7 1,970 29.4 1,261 18.8 445 6.6 155 2.3 128 1.9 All 710 9.5 2,210 29.4 2,197 29.3 1,407 18.7 499 6.6 174 2.3 152 2.0
$1,250 to $1,499 $1,500 to $1,749 $1,750 to $1,999 $2,000 to $2,249 $2,250 to $2,499 $2,500 or More Total
# % # % # % # % # % # % # %UC Part-time 5 1.1 3 0.7 1 0.2 - - 1 0.2 3 0.7 439 100
Full-time 18 0.6 11 0.4 6 0.2 6 0.2 2 0.1 6 0.2 2,887 100 All 23 0.7 14 0.4 7 0.2 6 0.2 3 0.1 9 0.3 3,326 100
CSU Part-time 1 0.5 1 0.5 - - - - - - - - 218 100 Full-time 13 0.7 13 0.7 4 0.2 6 0.3 6 0.3 12 0.6 1,870 100 All 14 0.7 14 0.7 4 0.2 6 0.3 6 0.3 12 0.6 2,088 100
ICU Part-time 1 0.7 - - 1 0.7 - - 1 0.7 2 1.4 146 100 Full-time 5 0.3 8 0.4 7 0.4 10 0.5 - - 9 0.5 1,951 100 All 6 0.3 8 0.4 8 0.4 10 0.5 1 0.0 11 0.5 2,097 100
ALL Part-time 7 0.9 4 0.5 2 0.2 - - 2 0.2 5 0.6 803 100 Full-time 36 0.5 32 0.5 17 0.3 22 0.3 8 0.1 27 0.4 6,708 100 All 43 0.6 36 0.5 19 0.3 22 0.3 10 0.1 32 0.4 7,511 100
TABLE U-47A: ACADEMIC YEAR COMPUTER EXPENSES BY SEGMENT, COURSE LOAD, AND DEPENDENCY STATUS
Source: California Student Aid Commission 295 2003-04 SEARS

INDEPENDENT UNDERGRADUATES
Nothing Less Than $100 $100 to $249 $250 to $499 $500 to $749 $750 to $999 $1,000 to $1,249
# % # % # % # % # % # % # %UC Part-time 9 13.0 18 26.1 21 30.4 13 18.8 4 5.8 2 2.9 - -
Full-time 29 8.5 79 23.2 88 25.9 78 22.9 37 10.9 14 4.1 5 1.5 All 38 9.3 97 23.7 109 26.7 91 22.2 41 10.0 16 3.9 5 1.2
CSU Part-time 48 8.3 113 19.6 149 25.8 140 24.2 61 10.6 27 4.7 20 3.5 Full-time 71 6.5 206 18.8 285 26.1 267 24.4 123 11.2 53 4.8 40 3.7 All 119 7.1 319 19.1 434 26.0 407 24.3 184 11.0 80 4.8 60 3.6
ICU Part-time 14 8.9 24 15.2 34 21.5 49 31.0 17 10.8 5 3.2 8 5.1 Full-time 38 11.0 66 19.2 85 24.7 74 21.5 40 11.6 12 3.5 9 2.6 All 52 10.4 90 17.9 119 23.7 123 24.5 57 11.4 17 3.4 17 3.4
ALL Part-time 71 8.8 155 19.3 204 25.3 202 25.1 82 10.2 34 4.2 28 3.5 Full-time 138 7.8 351 19.7 458 25.8 419 23.6 200 11.2 79 4.4 54 3.0 All 209 8.1 506 19.6 662 25.6 621 24.0 282 10.9 113 4.4 82 3.2
$1,250 to $1,499 $1,500 to $1,749 $1,750 to $1,999 $2,000 to $2,249 $2,250 to $2,499 $2,500 or More Total
# % # % # % # % # % # % # %UC Part-time 1 1.4 - - - - - - - - 1 1.4 69 100
Full-time 3 0.9 - - 2 0.6 2 0.6 - - 3 0.9 340 100 All 4 1.0 - - 2 0.5 2 0.5 - - 4 1.0 409 100
CSU Part-time 6 1.0 6 1.0 1 0.2 5 0.9 - - 2 0.3 578 100 Full-time 15 1.4 11 1.0 1 0.1 4 0.4 4 0.4 14 1.3 1,094 100 All 21 1.3 17 1.0 2 0.1 9 0.5 4 0.2 16 1.0 1,672 100
ICU Part-time 1 0.6 1 0.6 1 0.6 1 0.6 - - 3 1.9 158 100 Full-time 4 1.2 3 0.9 2 0.6 5 1.5 - - 6 1.7 344 100 All 5 1.0 4 0.8 3 0.6 6 1.2 - - 9 1.8 502 100
ALL Part-time 8 1.0 7 0.9 2 0.2 6 0.7 - - 6 0.7 805 100 Full-time 22 1.2 14 0.8 5 0.3 11 0.6 4 0.2 23 1.3 1,778 100 All 30 1.2 21 0.8 7 0.3 17 0.7 4 0.2 29 1.1 2,583 100
TABLE U-47B: ACADEMIC YEAR COMPUTER EXPENSES BY SEGMENT, COURSE LOAD, AND DEPENDENCY STATUS
Source: California Student Aid Commission 296 2003-04 SEARS

ALL UNDERGRADUATES
Nothing Less Than $100 $100 to $249 $250 to $499 $500 to $749 $750 to $999 $1,000 to $1,249
# % # % # % # % # % # % # %Part-time 163 10.1 376 23.4 431 26.8 348 21.6 136 8.5 53 3.3 52 3.2 Full-time 756 8.9 2,340 27.6 2,428 28.6 1,680 19.8 645 7.6 234 2.8 182 2.1 All 919 9.1 2,716 26.9 2,859 28.3 2,028 20.1 781 7.7 287 2.8 234 2.3
$1,250 to $1,499 $1,500 to $1,749 $1,750 to $1,999 $2,000 to $2,249 $2,250 to $2,499 $2,500 or More Total
# % # % # % # % # % # % # %Part-time 15 0.9 11 0.7 4 0.2 6 0.4 2 0.1 11 0.7 1,608 100 Full-time 58 0.7 46 0.5 22 0.3 33 0.4 12 0.1 50 0.6 8,486 100 All 73 0.7 57 0.6 26 0.3 39 0.4 14 0.1 61 0.6 10,094 100
TABLE U-47C: ACADEMIC YEAR COMPUTER EXPENSES BY SEGMENT, COURSE LOAD, AND DEPENDENCY STATUS
Source: California Student Aid Commission 297 2003-04 SEARS
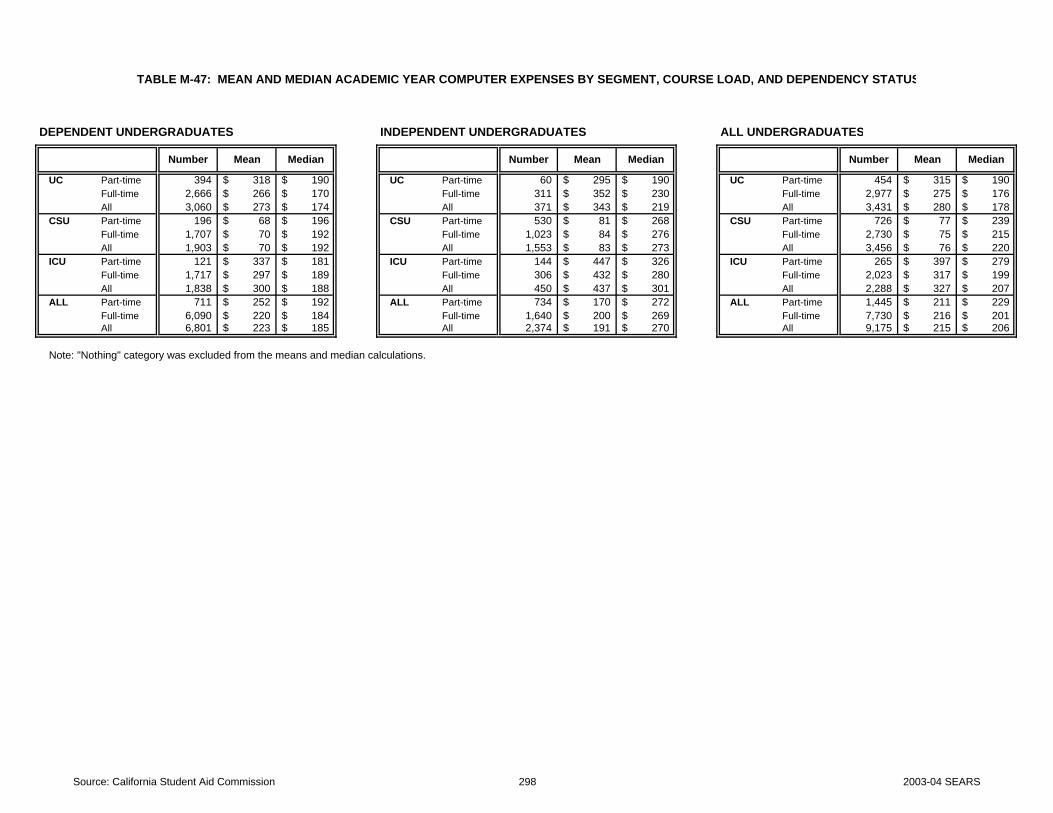
DEPENDENT UNDERGRADUATES INDEPENDENT UNDERGRADUATES ALL UNDERGRADUATES
UC Part-time 394 318$ 190$ UC Part-time 60 295$ 190$ UC Part-time 454 315$ 190$ Full-time 2,666 266$ 170$ Full-time 311 352$ 230$ Full-time 2,977 275$ 176$ All 3,060 273$ 174$ All 371 343$ 219$ All 3,431 280$ 178$
CSU Part-time 196 68$ 196$ CSU Part-time 530 81$ 268$ CSU Part-time 726 77$ 239$ Full-time 1,707 70$ 192$ Full-time 1,023 84$ 276$ Full-time 2,730 75$ 215$
All 1,903 70$ 192$ All 1,553 83$ 273$ All 3,456 76$ 220$ ICU Part-time 121 337$ 181$ ICU Part-time 144 447$ 326$ ICU Part-time 265 397$ 279$ Full-time 1,717 297$ 189$ Full-time 306 432$ 280$ Full-time 2,023 317$ 199$
All 1,838 300$ 188$ All 450 437$ 301$ All 2,288 327$ 207$ ALL Part-time 711 252$ 192$ ALL Part-time 734 170$ 272$ ALL Part-time 1,445 211$ 229$
Full-time 6,090 220$ 184$ Full-time 1,640 200$ 269$ Full-time 7,730 216$ 201$ All 6,801 223$ 185$ All 2,374 191$ 270$ All 9,175 215$ 206$
Note: "Nothing" category was excluded from the means and median calculations.
TABLE M-47: MEAN AND MEDIAN ACADEMIC YEAR COMPUTER EXPENSES BY SEGMENT, COURSE LOAD, AND DEPENDENCY STATUS
Number Mean Median Number MedianMean Median Number Mean
Source: California Student Aid Commission 298 2003-04 SEARS

Questions for Tables: W-47.1, U-47.1, and M-47.1 CCC
Excluding the purchase price of a computer, what will be your total computer related expenses for the
current academic year? Include hardware, software (excluding entertainment software), repairs, e-mail, and internet services.
00 Nothing 05 $125 to $149 10 $250 to $274 15 $525 to $599 01 Under $50 06 $150 to $174 11 $275 to $299 16 $600 or more 02 $50 to $74 07 $175 to $199 12 $300 to $374 03 $75 to $99 08 $200 to $224 13 $375 to $449 04 $100 to $124 09 $225 to $249 14 $450 to $524
\
299 2003-04 SEARS

DEPENDENT UNDERGRADUATES
Nothing Less Than $50 $50 to $74 $75 to $99 $100 to $124 $125 to $149 $150 to $174 $175 to $199 $200 to $224
# % # % # % # % # % # % # % # % # %CCC Part-time 99,775 27.1 51,139 13.9 38,623 10.5 21,815 5.9 32,901 8.9 14,305 3.9 15,735 4.3 8,583 2.3 21,099 5.7
Full-time 59,164 22.3 41,656 15.7 27,046 10.2 17,266 6.5 26,322 9.9 15,817 6.0 10,988 4.1 7,003 2.6 14,489 5.5 All 158,939 25.1 92,795 14.7 65,669 10.4 39,081 6.2 59,223 9.4 30,122 4.8 26,723 4.2 15,586 2.5 35,588 5.6
$225 to $249 $250 to $274 $275 to $299 $300 to $374 $375 to $449 $450 to $524 $525 to $599 $600 or more Total
# % # % # % # % # % # % # % # % # %CCC Part-time 8,583 2.3 6,437 1.7 4,291 1.2 11,086 3.0 4,649 1.3 10,013 2.7 3,576 1 15,735 4 368,345 100
Full-time 6,882 2.6 5,071 1.9 3,622 1.4 8,814 3.3 3,381 1.3 5,433 2.1 2,053 1 9,780 4 264,788 100 All 15,465 2.4 11,508 1.8 7,914 1.2 19,900 3.1 8,030 1.3 15,446 2.4 5,629 1 25,515 4 633,133 100
INDEPENDENT UNDERGRADUATES
Nothing Less Than $50 $50 to $74 $75 to $99 $100 to $124 $125 to $149 $150 to $174 $175 to $199 $200 to $224
# % # % # % # % # % # % # % # % # %CCC Part-time 101,205 18.4 70,093 12.7 40,411 7.3 35,046 6.4 62,225 11.3 33,616 6.1 25,748 4.7 16,808 3.1 31,470 5.7
Full-time 26,563 18.7 16,783 11.8 9,418 6.6 9,418 6.6 13,282 9.3 8,573 6.0 5,675 4.0 5,192 3.7 10,263 7.2 All 127,768 18.4 86,876 12.5 49,829 7.2 44,464 6.4 75,507 10.9 42,189 6.1 31,423 4.5 22,000 3.2 41,733 6.0
$225 to $249 $250 to $274 $275 to $299 $300 to $374 $375 to $449 $450 to $524 $525 to $599 $600 or more Total
# % # % # % # % # % # % # % # % # %CCC Part-time 19,311 3.5 16,093 2.9 10,013 1.8 18,596 3.4 12,874 2.3 14,662 2.7 7,152 1 35,046 6 550,369 100
Full-time 5,796 4.1 2,777 2.0 1,811 1.3 5,675 4.0 3,864 2.7 4,226 3.0 2,053 1 10,867 8 142,234 100 All 25,107 3.6 18,870 2.7 11,824 1.7 24,271 3.5 16,738 2.4 18,888 2.7 9,205 1 45,913 7 692,604 100
ALL UNDERGRADUATES
Nothing Less Than $50 $50 to $74 $75 to $99 $100 to $124 $125 to $149 $150 to $174 $175 to $199 $200 to $224
# % # % # % # % # % # % # % # % # %CCC Part-time 200,980 21.9 121,232 13.2 79,034 8.6 56,861 6.2 95,126 10.4 47,921 5.2 41,483 4.5 25,391 2.8 52,569 5.7
Full-time 85,727 21.1 58,439 14.4 36,464 9.0 26,684 6.6 39,604 9.7 24,390 6.0 16,663 4.1 12,195 3.0 24,752 6.1 All 286,707 21.6 179,671 13.6 115,498 8.7 83,545 6.3 134,730 10.2 72,311 5.5 58,146 4.4 37,586 2.8 77,321 5.8
$225 to $249 $250 to $274 $275 to $299 $300 to $374 $375 to $449 $450 to $524 $525 to $599 $600 or more Total
# % # % # % # % # % # % # % # % # %CCC Part-time 27,894 3.0 22,530 2.5 14,304 1.6 29,682 3.2 17,523 1.9 24,675 2.7 10,729 1 50,781 6 918,715 100
Full-time 12,678 3.1 7,848 1.9 5,433 1.3 14,489 3.6 7,245 1.8 9,659 2.4 4,105 1 20,647 5 407,022 100 All 40,572 3.1 30,378 2.3 19,738 1.5 44,171 3.3 24,768 1.9 34,334 2.6 14,834 1 71,428 5 1,325,737 100
TABLE W-47.1: ACADEMIC YEAR COMPUTER EXPENSES BY SEGMENT, COURSE LOAD, AND DEPENDENCY STATUS
Source: California Student Aid Commission 300 2003-04 SEARS

DEPENDENT UNDERGRADUATES
Nothing Less Than $50 $50 to $74 $75 to $99 $100 to $124 $125 to $149 $150 to $174 $175 to $199 $200 to $224
# % # % # % # % # % # % # % # % # %CCC Part-time 279 27.1 143 13.9 108 10.5 61 5.9 92 8.9 40 3.9 44 4.3 24 2.3 59 5.7
Full-time 490 22.3 345 15.7 224 10.2 143 6.5 218 9.9 131 6.0 91 4.1 58 2.6 120 5.5 All 769 23.9 488 15.1 332 10.3 204 6.3 310 9.6 171 5.3 135 4.2 82 2.5 179 5.6
$225 to $249 $250 to $274 $275 to $299 $300 to $374 $375 to $449 $450 to $524 $525 to $599 $600 or more Total
# % # % # % # % # % # % # % # % # %CCC Part-time 24 2.3 18 1.7 12 1.2 31 3.0 13 1.3 28 2.7 10 1 44 4 1,030 100
Full-time 57 2.6 42 1.9 30 1.4 73 3.3 28 1.3 45 2.1 17 1 81 4 2,193 100 All 81 2.5 60 1.9 42 1.3 104 3.2 41 1.3 73 2.3 27 1 125 4 3,223 100
INDEPENDENT UNDERGRADUATES
Nothing Less Than $50 $50 to $74 $75 to $99 $100 to $124 $125 to $149 $150 to $174 $175 to $199 $200 to $224
# % # % # % # % # % # % # % # % # %CCC Part-time 283 18.4 196 12.7 113 7.3 98 6.4 174 11.3 94 6.1 72 4.7 47 3.1 88 5.7
Full-time 220 18.7 139 11.8 78 6.6 78 6.6 110 9.3 71 6.0 47 4.0 43 3.7 85 7.2 All 503 18.5 335 12.3 191 7.0 176 6.5 284 10.5 165 6.1 119 4.4 90 3.3 173 6.4
$225 to $249 $250 to $274 $275 to $299 $300 to $374 $375 to $449 $450 to $524 $525 to $599 $600 or more Total
# % # % # % # % # % # % # % # % # %CCC Part-time 54 3.5 45 2.9 28 1.8 52 3.4 36 2.3 41 2.7 20 1 98 6 1,539 100
Full-time 48 4.1 23 2.0 15 1.3 47 4.0 32 2.7 35 3.0 17 1 90 8 1,178 100 All 102 3.8 68 2.5 43 1.6 99 3.6 68 2.5 76 2.8 37 1 188 7 2,717 100
ALL UNDERGRADUATES
Nothing Less Than $50 $50 to $74 $75 to $99 $100 to $124 $125 to $149 $150 to $174 $175 to $199 $200 to $224
# % # % # % # % # % # % # % # % # %CCC Part-time 562 21.9 339 13.2 221 8.6 159 6.2 266 10.4 134 5.2 116 4.5 71 2.8 147 5.7
Full-time 710 21.1 484 14.4 302 9.0 221 6.6 328 9.7 202 6.0 138 4.1 101 3.0 205 6.1 All 1,272 21.4 823 13.9 523 8.8 380 6.4 594 10.0 336 5.7 254 4.3 172 2.9 352 5.9
$225 to $249 $250 to $274 $275 to $299 $300 to $374 $375 to $449 $450 to $524 $525 to $599 $600 or more Total
# % # % # % # % # % # % # % # % # %CCC Part-time 78 3.0 63 2.5 40 1.6 83 3.2 49 1.9 69 2.7 30 1 142 6 2,569 100
Full-time 105 3.1 65 1.9 45 1.3 120 3.6 60 1.8 80 2.4 34 1 171 5 3,371 100 All 183 3.1 128 2.2 85 1.4 203 3.4 109 1.8 149 2.5 64 1 313 5 5,940 100
TABLE U-47.1: ACADEMIC YEAR COMPUTER EXPENSES BY SEGMENT, COURSE LOAD, AND DEPENDENCY STATUS
Source: California Student Aid Commission 301 2003-04 SEARS

DEPENDENT UNDERGRADUATES INDEPENDENT UNDERGRADUATES ALL UNDERGRADUATES
CCC Part-time 751 177$ 116$ CCC Part-time 1,256 200$ 137$ CCC Part-time 2,007 191$ 127$ Full-time 1,703 165$ 115$ Full-time 958 215$ 151$ Full-time 2,661 183$ 124$ All 2,454 169$ 116$ All 2,214 206$ 139$ All 4,668 187$ 126$
Note: "Nothing" category was excluded from the means and median calculations.
TABLE M-47.1: MEAN AND MEDIAN ACADEMIC YEAR COMPUTER EXPENSES BY SEGMENT, COURSE LOAD, AND DEPENDENCY STATUS
Number Mean Median Number MedianMean Median Number Mean
Source: California Student Aid Commission 302 2003-04 SEARS

Questions for Tables: W-47.2, U-47.2, and M-47.2 PCC
Excluding the purchase price of a computer, what will be your monthly average expenses between
July 1, 2003 and June 30, 2004? Include hardware, software (excluding entertainment software), repairs, e-mail, and internet services.
00 Nothing 05 $125 to $149 10 $250 to $274 15 $525 to $599 01 Under $50 06 $150 to $174 11 $275 to $299 16 $600 or more 02 $50 to $74 07 $175 to $199 12 $300 to $374 03 $75 to $99 08 $200 to $224 13 $375 to $449 04 $100 to $124 09 $225 to $249 14 $450 to $524
303 2003-04 SEARS

DEPENDENT UNDERGRADUATES
Nothing Less Than $50 $50 to $74 $75 to $99 $100 to $124 $125 to $149 $150 to $174 $175 to $199 $200 to $224
# % # % # % # % # % # % # % # % # %PCC Part-time 1,160 19.7 1,104 18.8 720 12.2 552 9.4 497 8.5 205 3.5 190 3.2 420 7.1 135 2.3
Full-time 4,754 22.8 3,472 16.7 2,197 10.5 1,713 8.2 1,941 9.3 840 4.0 583 2.8 302 1.4 1,013 4.9 All 5,913 22.1 4,576 17.1 2,917 10.9 2,265 8.5 2,438 9.1 1,045 3.9 773 2.9 722 2.7 1,147 4.3
$225 to $249 $250 to $274 $275 to $299 $300 to $374 $375 to $449 $450 to $524 $525 to $599 $600 or more Total
# % # % # % # % # % # % # % # % # %PCC Part-time 209 3.6 55 0.9 29 0.5 65 1.1 148 2.5 109 1.9 48 1 237 4 5,884 100
Full-time 576 2.8 526 2.5 74 0.4 547 2.6 175 0.8 456 2.2 353 2 1,316 6 20,837 100 All 785 2.9 581 2.2 103 0.4 611 2.3 324 1.2 565 2.1 401 2 1,553 6 26,722 100
INDEPENDENT UNDERGRADUATES
Nothing Less Than $50 $50 to $74 $75 to $99 $100 to $124 $125 to $149 $150 to $174 $175 to $199 $200 to $224
# % # % # % # % # % # % # % # % # %PCC Part-time 3,662 19.2 3,007 15.8 1,894 9.9 1,334 7.0 2,960 15.5 1,429 7.5 667 3.5 322 1.7 549 2.9
Full-time 8,229 18.5 8,278 18.6 6,554 14.7 3,480 7.8 4,077 9.2 2,140 4.8 1,464 3.3 937 2.1 2,119 4.8 All 11,891 18.7 11,285 17.7 8,449 13.3 4,814 7.6 7,037 11.1 3,569 5.6 2,131 3.4 1,259 2.0 2,668 4.2
$225 to $249 $250 to $274 $275 to $299 $300 to $374 $375 to $449 $450 to $524 $525 to $599 $600 or more Total
# % # % # % # % # % # % # % # % # %PCC Part-time 632 3.3 259 1.4 174 0.9 498 2.6 225 1.2 266 1.4 122 1 1,057 6 19,058 100
Full-time 837 1.9 543 1.2 216 0.5 911 2.0 552 1.2 1,223 2.7 158 0 2,821 6 44,539 100 All 1,470 2.3 802 1.3 390 0.6 1,410 2.2 777 1.2 1,488 2.3 280 0 3,877 6 63,596 100
ALL UNDERGRADUATES
Nothing Less Than $50 $50 to $74 $75 to $99 $100 to $124 $125 to $149 $150 to $174 $175 to $199 $200 to $224
# % # % # % # % # % # % # % # % # %PCC Part-time 4,822 19.3 4,111 16.5 2,615 10.5 1,886 7.6 3,457 13.9 1,634 6.6 857 3.4 742 3.0 684 2.7
Full-time 12,982 19.9 11,750 18.0 8,751 13.4 5,193 7.9 6,018 9.2 2,979 4.6 2,048 3.1 1,238 1.9 3,132 4.8 All 17,804 19.7 15,861 17.6 11,366 12.6 7,079 7.8 9,475 10.5 4,613 5.1 2,905 3.2 1,981 2.2 3,815 4.2
$225 to $249 $250 to $274 $275 to $299 $300 to $374 $375 to $449 $450 to $524 $525 to $599 $600 or more Total
# % # % # % # % # % # % # % # % # %PCC Part-time 842 3.4 314 1.3 203 0.8 563 2.3 373 1.5 375 1.5 170 1 1,294 5 24,942 100
Full-time 1,414 2.2 1,069 1.6 290 0.4 1,458 2.2 727 1.1 1,679 2.6 511 1 4,137 6 65,376 100 All 2,255 2.5 1,383 1.5 493 0.5 2,021 2.2 1,101 1.2 2,054 2.3 681 1 5,431 6 90,318 100
TABLE W-47.2: AVERAGE MONTHLY COMPUTER EXPENSES BY SEGMENT, COURSE LOAD, AND DEPENDENCY STATUS
Source: California Student Aid Commission 304 2003-04 SEARS

DEPENDENT UNDERGRADUATES
Nothing Less Than $50 $50 to $74 $75 to $99 $100 to $124 $125 to $149 $150 to $174 $175 to $199 $200 to $224
# % # % # % # % # % # % # % # % # %PCC Part-time 63 23.7 51 19.2 32 12.0 15 5.6 22 8.3 11 4.1 10 3.8 9 3.4 8 3.0
Full-time 238 24.3 158 16.2 104 10.6 76 7.8 86 8.8 48 4.9 32 3.3 20 2.0 41 4.2 All 301 24.2 209 16.8 136 10.9 91 7.3 108 8.7 59 4.7 42 3.4 29 2.3 49 3.9
$225 to $249 $250 to $274 $275 to $299 $300 to $374 $375 to $449 $450 to $524 $525 to $599 $600 or more Total
# % # % # % # % # % # % # % # % # %PCC Part-time 11 4.1 5 1.9 1 0.4 4 1.5 4 1.5 4 1.5 3 1 13 5 266 100
Full-time 20 2.0 23 2.4 5 0.5 20 2.0 13 1.3 20 2.0 17 2 57 6 978 100 All 31 2.5 28 2.3 6 0.5 24 1.9 17 1.4 24 1.9 20 2 70 6 1,244 100
INDEPENDENT UNDERGRADUATES
Nothing Less Than $50 $50 to $74 $75 to $99 $100 to $124 $125 to $149 $150 to $174 $175 to $199 $200 to $224
# % # % # % # % # % # % # % # % # %PCC Part-time 104 19.6 88 16.6 61 11.5 41 7.7 46 8.7 28 5.3 18 3.4 10 1.9 28 5.3
Full-time 340 21.8 273 17.5 196 12.6 112 7.2 146 9.4 64 4.1 53 3.4 35 2.2 69 4.4 All 444 21.3 361 17.3 257 12.3 153 7.3 192 9.2 92 4.4 71 3.4 45 2.2 97 4.6
$225 to $249 $250 to $274 $275 to $299 $300 to $374 $375 to $449 $450 to $524 $525 to $599 $600 or more Total
# % # % # % # % # % # % # % # % # %PCC Part-time 16 3.0 8 1.5 4 0.8 12 2.3 10 1.9 14 2.6 4 1 38 7 530 100
Full-time 37 2.4 20 1.3 14 0.9 38 2.4 20 1.3 27 1.7 10 1 105 7 1,559 100 All 53 2.5 28 1.3 18 0.9 50 2.4 30 1.4 41 2.0 14 1 143 7 2,089 100
ALL UNDERGRADUATES
Nothing Less Than $50 $50 to $74 $75 to $99 $100 to $124 $125 to $149 $150 to $174 $175 to $199 $200 to $224
# % # % # % # % # % # % # % # % # %PCC Part-time 167 21.0 139 17.5 93 11.7 56 7.0 68 8.5 39 4.9 28 3.5 19 2.4 36 4.5
Full-time 578 22.8 431 17.0 300 11.8 188 7.4 232 9.1 112 4.4 85 3.4 55 2.2 110 4.3 All 745 22.4 570 17.1 393 11.8 244 7.3 300 9.0 151 4.5 113 3.4 74 2.2 146 4.4
$225 to $249 $250 to $274 $275 to $299 $300 to $374 $375 to $449 $450 to $524 $525 to $599 $600 or more Total
# % # % # % # % # % # % # % # % # %PCC Part-time 27 3.4 13 1.6 5 0.6 16 2.0 14 1.8 18 2.3 7 1 51 6 796 100
Full-time 57 2.2 43 1.7 19 0.7 58 2.3 33 1.3 47 1.9 27 1 162 6 2,537 100 All 84 2.5 56 1.7 24 0.7 74 2.2 47 1.4 65 2.0 34 1 213 6 3,333 100
TABLE U-47.2: AVERAGE MONTHLY COMPUTER EXPENSES BY SEGMENT, COURSE LOAD, AND DEPENDENCY STATUS
Source: California Student Aid Commission 305 2003-04 SEARS

DEPENDENT UNDERGRADUATES INDEPENDENT UNDERGRADUATES ALL UNDERGRADUATES
PCC Part-time 203 161$ 99$ PCC Part-time 426 183$ 111$ PCC Part-time 629 176$ 109$ Full-time 740 177$ 108$ Full-time 1,219 171$ 97$ Full-time 1,959 173$ 101$
All 943 1,563$ 106$ All 1,645 1,569$ 103$ All 2,588 174$ 104$
Note: "Nothing" category was excluded from the means and median calculations.
TABLE M-47.2: MEAN AND MEDIAN AVERAGE MONTHLY COMPUTER EXPENSES BY SEGMENT, COURSE LOAD, AND DEPENDENCY STATUS
Number Mean Median Number MedianMean Median Number Mean
Source: California Student Aid Commission 306 2003-04 SEARS

Question for Tables: W-48, U-48, and M-48
What are your monthly average expenses for transportation to and from classes and work (e.g., bus
fare, train fare, gasoline, tolls, parking, etc.) during the current academic year? If your campus includes transportation costs in your fees, do NOT include them here. Do NOT include car payments, repairs, insurance, or registration.
00 Nothing 04 $30 to $39 08 $80 to $94 12 $140 to $159 01 Under $10 05 $40 to $49 09 $95 to $104 13 $160 to $179 02 $10 to $19 06 $50 to $64 10 $105 to $119 14 $180 to $199 03 $20 to $29 07 $65 to $79 11 $120 to $139 15 $200 or more
307 2003-04 SEARS
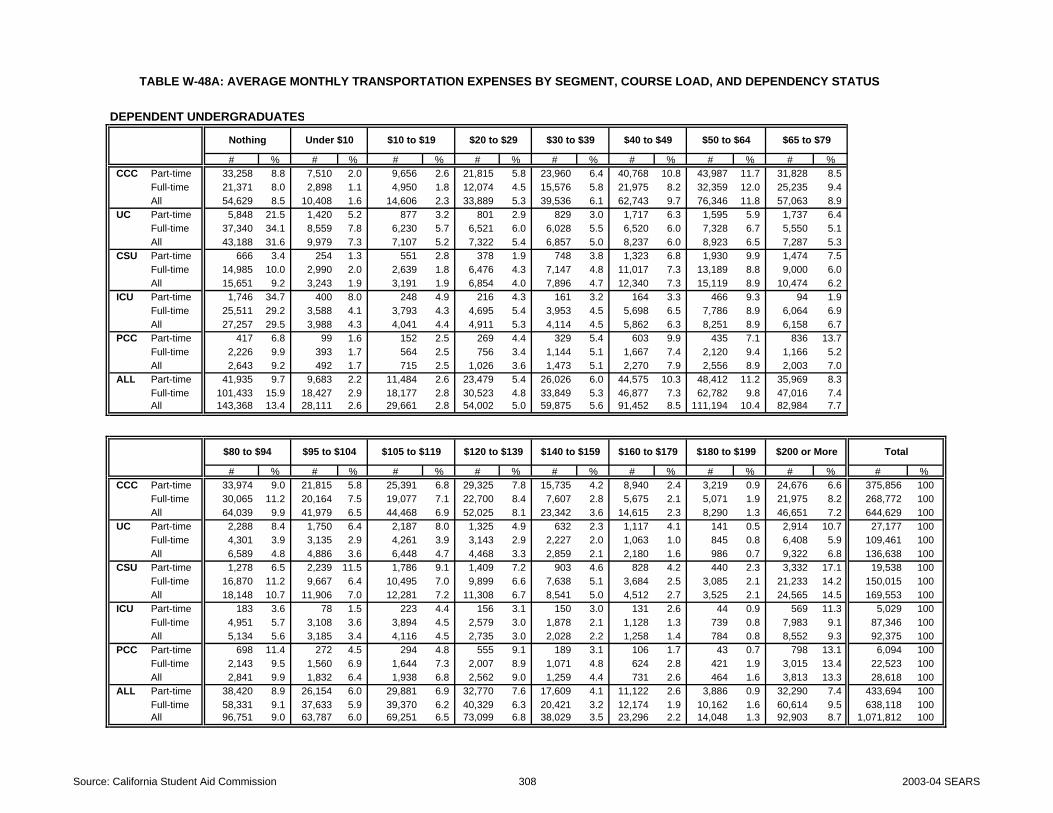
DEPENDENT UNDERGRADUATES
Nothing Under $10 $10 to $19 $20 to $29 $30 to $39 $50 to $64 $65 to $79
# % # % # % # % # % # % # % # %CCC Part-time 33,258 8.8 7,510 2.0 9,656 2.6 21,815 5.8 23,960 6.4 40,768 10.8 43,987 11.7 31,828 8.5
Full-time 21,371 8.0 2,898 1.1 4,950 1.8 12,074 4.5 15,576 5.8 21,975 8.2 32,359 12.0 25,235 9.4 All 54,629 8.5 10,408 1.6 14,606 2.3 33,889 5.3 39,536 6.1 62,743 9.7 76,346 11.8 57,063 8.9
UC Part-time 5,848 21.5 1,420 5.2 877 3.2 801 2.9 829 3.0 1,717 6.3 1,595 5.9 1,737 6.4 Full-time 37,340 34.1 8,559 7.8 6,230 5.7 6,521 6.0 6,028 5.5 6,520 6.0 7,328 6.7 5,550 5.1 All 43,188 31.6 9,979 7.3 7,107 5.2 7,322 5.4 6,857 5.0 8,237 6.0 8,923 6.5 7,287 5.3
CSU Part-time 666 3.4 254 1.3 551 2.8 378 1.9 748 3.8 1,323 6.8 1,930 9.9 1,474 7.5 Full-time 14,985 10.0 2,990 2.0 2,639 1.8 6,476 4.3 7,147 4.8 11,017 7.3 13,189 8.8 9,000 6.0 All 15,651 9.2 3,243 1.9 3,191 1.9 6,854 4.0 7,896 4.7 12,340 7.3 15,119 8.9 10,474 6.2
ICU Part-time 1,746 34.7 400 8.0 248 4.9 216 4.3 161 3.2 164 3.3 466 9.3 94 1.9 Full-time 25,511 29.2 3,588 4.1 3,793 4.3 4,695 5.4 3,953 4.5 5,698 6.5 7,786 8.9 6,064 6.9 All 27,257 29.5 3,988 4.3 4,041 4.4 4,911 5.3 4,114 4.5 5,862 6.3 8,251 8.9 6,158 6.7
PCC Part-time 417 6.8 99 1.6 152 2.5 269 4.4 329 5.4 603 9.9 435 7.1 836 13.7 Full-time 2,226 9.9 393 1.7 564 2.5 756 3.4 1,144 5.1 1,667 7.4 2,120 9.4 1,166 5.2 All 2,643 9.2 492 1.7 715 2.5 1,026 3.6 1,473 5.1 2,270 7.9 2,556 8.9 2,003 7.0
ALL Part-time 41,935 9.7 9,683 2.2 11,484 2.6 23,479 5.4 26,026 6.0 44,575 10.3 48,412 11.2 35,969 8.3 Full-time 101,433 15.9 18,427 2.9 18,177 2.8 30,523 4.8 33,849 5.3 46,877 7.3 62,782 9.8 47,016 7.4 All 143,368 13.4 28,111 2.6 29,661 2.8 54,002 5.0 59,875 5.6 91,452 8.5 111,194 10.4 82,984 7.7
$80 to $94 $95 to $104 $105 to $119 $120 to $139 $140 to $159 $180 to $199 $200 or More Total
# % # % # % # % # % # % # % # % # %CCC Part-time 33,974 9.0 21,815 5.8 25,391 6.8 29,325 7.8 15,735 4.2 8,940 2.4 3,219 0.9 24,676 6.6 375,856 100
Full-time 30,065 11.2 20,164 7.5 19,077 7.1 22,700 8.4 7,607 2.8 5,675 2.1 5,071 1.9 21,975 8.2 268,772 100 All 64,039 9.9 41,979 6.5 44,468 6.9 52,025 8.1 23,342 3.6 14,615 2.3 8,290 1.3 46,651 7.2 644,629 100
UC Part-time 2,288 8.4 1,750 6.4 2,187 8.0 1,325 4.9 632 2.3 1,117 4.1 141 0.5 2,914 10.7 27,177 100 Full-time 4,301 3.9 3,135 2.9 4,261 3.9 3,143 2.9 2,227 2.0 1,063 1.0 845 0.8 6,408 5.9 109,461 100 All 6,589 4.8 4,886 3.6 6,448 4.7 4,468 3.3 2,859 2.1 2,180 1.6 986 0.7 9,322 6.8 136,638 100
CSU Part-time 1,278 6.5 2,239 11.5 1,786 9.1 1,409 7.2 903 4.6 828 4.2 440 2.3 3,332 17.1 19,538 100 Full-time 16,870 11.2 9,667 6.4 10,495 7.0 9,899 6.6 7,638 5.1 3,684 2.5 3,085 2.1 21,233 14.2 150,015 100 All 18,148 10.7 11,906 7.0 12,281 7.2 11,308 6.7 8,541 5.0 4,512 2.7 3,525 2.1 24,565 14.5 169,553 100
ICU Part-time 183 3.6 78 1.5 223 4.4 156 3.1 150 3.0 131 2.6 44 0.9 569 11.3 5,029 100 Full-time 4,951 5.7 3,108 3.6 3,894 4.5 2,579 3.0 1,878 2.1 1,128 1.3 739 0.8 7,983 9.1 87,346 100 All 5,134 5.6 3,185 3.4 4,116 4.5 2,735 3.0 2,028 2.2 1,258 1.4 784 0.8 8,552 9.3 92,375 100
PCC Part-time 698 11.4 272 4.5 294 4.8 555 9.1 189 3.1 106 1.7 43 0.7 798 13.1 6,094 100 Full-time 2,143 9.5 1,560 6.9 1,644 7.3 2,007 8.9 1,071 4.8 624 2.8 421 1.9 3,015 13.4 22,523 100 All 2,841 9.9 1,832 6.4 1,938 6.8 2,562 9.0 1,259 4.4 731 2.6 464 1.6 3,813 13.3 28,618 100
ALL Part-time 38,420 8.9 26,154 6.0 29,881 6.9 32,770 7.6 17,609 4.1 11,122 2.6 3,886 0.9 32,290 7.4 433,694 100 Full-time 58,331 9.1 37,633 5.9 39,370 6.2 40,329 6.3 20,421 3.2 12,174 1.9 10,162 1.6 60,614 9.5 638,118 100 All 96,751 9.0 63,787 6.0 69,251 6.5 73,099 6.8 38,029 3.5 23,296 2.2 14,048 1.3 92,903 8.7 1,071,812 100
TABLE W-48A: AVERAGE MONTHLY TRANSPORTATION EXPENSES BY SEGMENT, COURSE LOAD, AND DEPENDENCY STATUS
$40 to $49
$160 to $179
Source: California Student Aid Commission 308 2003-04 SEARS

INDEPENDENT UNDERGRADUATES
Nothing Under $10 $10 to $19 $20 to $29 $30 to $39 $50 to $64 $65 to $79
# % # % # % # % # % # % # % # %CCC Part-time 23,960 4.2 12,874 2.3 18,954 3.3 45,060 8.0 36,119 6.4 51,497 9.1 72,596 12.8 42,199 7.5
Full-time 8,573 5.9 1,690 1.2 3,139 2.1 4,105 2.8 9,056 6.2 8,452 5.8 16,300 11.1 12,195 8.3 All 32,533 4.6 14,564 2.0 22,093 3.1 49,165 6.9 45,175 6.3 59,949 8.4 88,896 12.5 54,394 7.6
UC Part-time 392 10.4 141 3.7 70 1.9 37 1.0 139 3.7 189 5.0 235 6.3 287 7.6 Full-time 2,477 18.9 720 5.5 700 5.3 554 4.2 476 3.6 622 4.7 861 6.6 509 3.9 All 2,869 17.0 861 5.1 770 4.6 591 3.5 615 3.6 811 4.8 1,096 6.5 796 4.7
CSU Part-time 1,234 2.5 226 0.5 789 1.6 1,900 3.9 1,933 4.0 2,262 4.6 4,038 8.3 3,009 6.2 Full-time 2,969 3.7 837 1.0 1,419 1.8 1,935 2.4 1,697 2.1 3,538 4.4 4,908 6.1 5,669 7.1 All 4,203 3.3 1,063 0.8 2,208 1.7 3,835 3.0 3,630 2.8 5,800 4.5 8,946 6.9 8,677 6.7
ICU Part-time 661 6.9 249 2.6 422 4.4 188 1.9 401 4.2 488 5.1 1,321 13.7 344 3.6 Full-time 1,886 11.2 305 1.8 355 2.1 606 3.6 859 5.1 1,134 6.7 1,056 6.3 1,002 6.0 All 2,547 9.6 553 2.1 777 2.9 794 3.0 1,259 4.8 1,621 6.1 2,377 9.0 1,346 5.1
PCC Part-time 551 2.7 307 1.5 482 2.4 1,909 9.5 1,576 7.8 1,886 9.4 2,121 10.5 1,156 5.7 Full-time 2,536 5.4 508 1.1 977 2.1 2,871 6.1 3,587 7.6 3,102 6.6 4,693 9.9 3,359 7.1 All 3,087 4.6 815 1.2 1,459 2.2 4,779 7.1 5,164 7.7 4,988 7.4 6,814 10.1 4,514 6.7
ALL Part-time 26,798 4.1 13,796 2.1 20,717 3.2 49,094 7.6 40,167 6.2 56,321 8.7 80,311 12.4 46,994 7.2 Full-time 18,441 6.1 4,060 1.3 6,590 2.2 10,071 3.3 15,675 5.2 16,848 5.6 27,818 9.2 22,733 7.5 All 45,239 4.8 17,856 1.9 27,307 2.9 59,164 6.2 55,842 5.9 73,169 7.7 108,129 11.4 69,727 7.3
$80 to $94 $95 to $104 $105 to $119 $120 to $139 $140 to $159 $180 to $199 $200 or More Total
# % # % # % # % # % # % # % # % # %CCC Part-time 43,272 7.6 38,265 6.8 35,762 6.3 45,775 8.1 21,099 3.7 12,874 2.3 8,583 1.5 57,219 10.1 566,108 100
Full-time 14,006 9.6 10,746 7.3 10,867 7.4 12,316 8.4 8,694 5.9 3,381 2.3 3,260 2.2 19,440 13.3 146,220 100 All 57,278 8.0 49,011 6.9 46,629 6.5 58,091 8.2 29,793 4.2 16,255 2.3 11,843 1.7 76,659 10.8 712,327 100
UC Part-time 230 6.1 419 11.1 229 6.1 311 8.3 257 6.8 110 2.9 70 1.9 648 17.2 3,764 100 Full-time 894 6.8 776 5.9 632 4.8 822 6.3 767 5.9 278 2.1 198 1.5 1,815 13.9 13,100 100 All 1,124 6.7 1,195 7.1 860 5.1 1,134 6.7 1,024 6.1 387 2.3 268 1.6 2,462 14.6 16,863 100
CSU Part-time 3,808 7.8 3,683 7.5 4,353 8.9 3,932 8.0 2,861 5.9 1,371 2.8 1,721 3.5 11,743 24.0 48,863 100 Full-time 8,511 10.6 5,810 7.2 5,542 6.9 8,775 10.9 5,548 6.9 2,840 3.5 2,124 2.6 18,040 22.5 80,161 100 All 12,319 9.5 9,493 7.4 9,895 7.7 12,707 9.8 8,410 6.5 4,211 3.3 3,844 3.0 29,783 23.1 129,024 100
ICU Part-time 633 6.6 388 4.0 546 5.7 808 8.4 539 5.6 271 2.8 801 8.3 1,580 16.4 9,637 100 Full-time 1,408 8.4 1,027 6.1 897 5.3 1,231 7.3 1,029 6.1 508 3.0 515 3.1 2,992 17.8 16,809 100 All 2,041 7.7 1,415 5.4 1,443 5.5 2,039 7.7 1,568 5.9 778 2.9 1,317 5.0 4,572 17.3 26,446 100
PCC Part-time 1,439 7.1 1,414 7.0 887 4.4 1,677 8.3 463 2.3 605 3.0 614 3.0 3,066 15.2 20,152 100 Full-time 3,188 6.7 2,916 6.2 3,739 7.9 4,357 9.2 2,199 4.7 651 1.4 752 1.6 7,808 16.5 47,244 100 All 4,628 6.9 4,330 6.4 4,626 6.9 6,034 9.0 2,662 3.9 1,257 1.9 1,367 2.0 10,874 16.1 67,396 100
ALL Part-time 49,382 7.6 44,169 6.8 41,776 6.4 52,503 8.1 25,219 3.9 15,231 2.3 11,789 1.8 74,255 11.4 648,524 100 Full-time 28,007 9.2 21,275 7.0 21,677 7.1 27,502 9.1 18,237 6.0 7,657 2.5 6,849 2.3 50,094 16.5 303,534 100 All 77,389 8.1 65,445 6.9 63,453 6.7 80,004 8.4 43,456 4.6 22,888 2.4 18,638 2.0 124,350 13.1 952,057 100
TABLE W-48B: AVERAGE MONTHLY TRANSPORTATION EXPENSES BY SEGMENT, COURSE LOAD, AND DEPENDENCY STATUS
$160 to $179
$40 to $49
Source: California Student Aid Commission 309 2003-04 SEARS
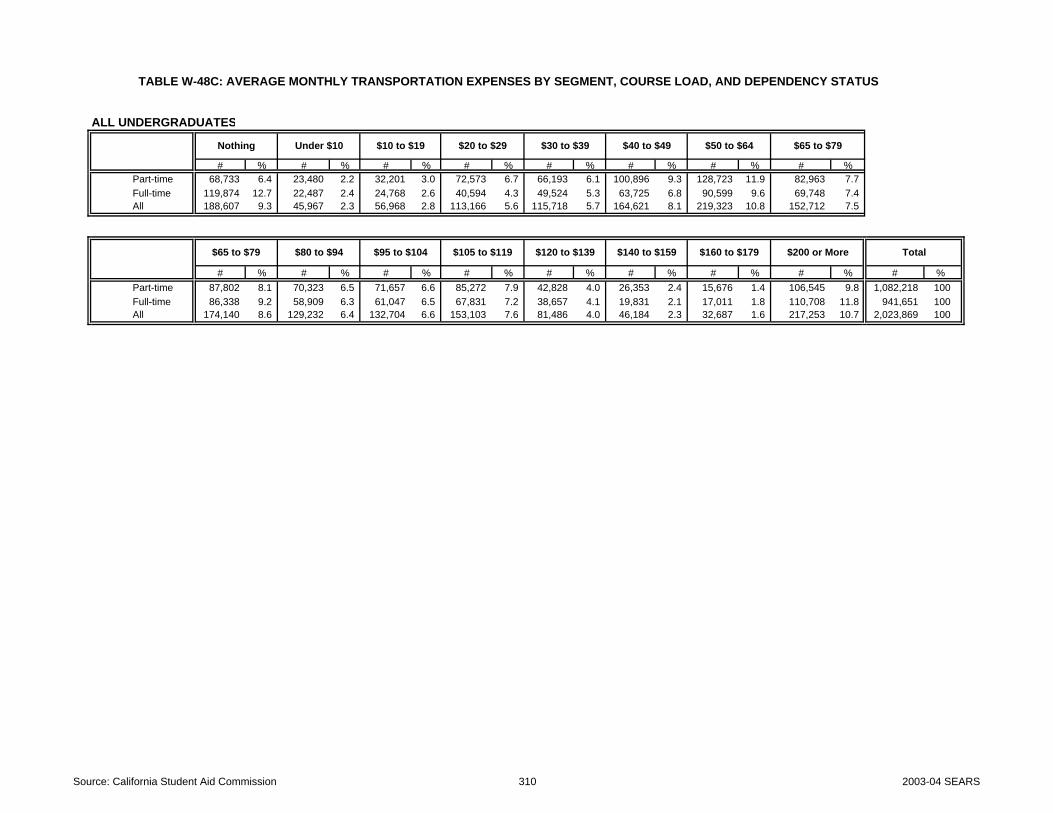
ALL UNDERGRADUATES
Nothing Under $10 $10 to $19 $20 to $29 $30 to $39 $50 to $64 $65 to $79
# % # % # % # % # % # % # % # %Part-time 68,733 6.4 23,480 2.2 32,201 3.0 72,573 6.7 66,193 6.1 100,896 9.3 128,723 11.9 82,963 7.7 Full-time 119,874 12.7 22,487 2.4 24,768 2.6 40,594 4.3 49,524 5.3 63,725 6.8 90,599 9.6 69,748 7.4 All 188,607 9.3 45,967 2.3 56,968 2.8 113,166 5.6 115,718 5.7 164,621 8.1 219,323 10.8 152,712 7.5
$65 to $79 $80 to $94 $95 to $104 $105 to $119 $120 to $139 $160 to $179 $200 or More Total
# % # % # % # % # % # % # % # % # %Part-time 87,802 8.1 70,323 6.5 71,657 6.6 85,272 7.9 42,828 4.0 26,353 2.4 15,676 1.4 106,545 9.8 1,082,218 100 Full-time 86,338 9.2 58,909 6.3 61,047 6.5 67,831 7.2 38,657 4.1 19,831 2.1 17,011 1.8 110,708 11.8 941,651 100 All 174,140 8.6 129,232 6.4 132,704 6.6 153,103 7.6 81,486 4.0 46,184 2.3 32,687 1.6 217,253 10.7 2,023,869 100
TABLE W-48C: AVERAGE MONTHLY TRANSPORTATION EXPENSES BY SEGMENT, COURSE LOAD, AND DEPENDENCY STATUS
$40 to $49
$140 to $159
Source: California Student Aid Commission 310 2003-04 SEARS

DEPENDENT UNDERGRADUATES
Nothing Under $10 $10 to $19 $20 to $29 $30 to $39 $50 to $64 $65 to $79
# % # % # % # % # % # % # % # %CCC Part-time 93 8.8 21 2.0 27 2.6 61 5.8 67 6.4 114 10.8 123 11.7 89 8.5
Full-time 177 8.0 24 1.1 41 1.8 100 4.5 129 5.8 182 8.2 268 12.0 209 9.4 All 270 8.2 45 1.4 68 2.1 161 4.9 196 6.0 296 9.0 391 11.9 298 9.1
UC Part-time 102 23.2 23 5.2 15 3.4 14 3.2 14 3.2 26 5.9 25 5.7 30 6.8 Full-time 958 33.2 221 7.7 161 5.6 170 5.9 159 5.5 173 6.0 199 6.9 151 5.2 All 1,060 31.9 244 7.3 176 5.3 184 5.5 173 5.2 199 6.0 224 6.7 181 5.4
CSU Part-time 9 4.1 3 1.4 5 2.3 7 3.2 9 4.1 15 6.9 18 8.3 12 5.5 Full-time 212 11.3 42 2.2 40 2.1 82 4.4 88 4.7 135 7.2 158 8.4 114 6.1 All 221 10.6 45 2.2 45 2.2 89 4.3 97 4.6 150 7.2 176 8.4 126 6.0
ICU Part-time 66 45.2 12 8.2 5 3.4 7 4.8 8 5.5 5 3.4 11 7.5 3 2.1 Full-time 629 32.3 92 4.7 75 3.9 115 5.9 95 4.9 124 6.4 150 7.7 131 6.7 All 695 33.2 104 5.0 80 3.8 122 5.8 103 4.9 129 6.2 161 7.7 134 6.4
PCC Part-time 27 9.6 6 2.1 10 3.6 13 4.6 15 5.4 34 12.1 19 6.8 29 10.4 Full-time 74 7.1 17 1.6 20 1.9 45 4.3 56 5.4 89 8.6 107 10.3 61 5.9 All 101 7.7 23 1.7 30 2.3 58 4.4 71 5.4 123 9.3 126 9.6 90 6.8
ALL Part-time 297 13.9 65 3.0 62 2.9 102 4.8 113 5.3 194 9.1 196 9.2 163 7.6 Full-time 2,050 20.6 396 4.0 337 3.4 512 5.1 527 5.3 703 7.1 882 8.8 666 6.7 All 2,347 19.4 461 3.8 399 3.3 614 5.1 640 5.3 897 7.4 1,078 8.9 829 6.8
$80 to $94 $95 to $104 $105 to $119 $120 to $139 $140 to $159 $180 to $199 $200 or More Total
# % # % # % # % # % # % # % # % # %CCC Part-time 95 9.0 61 5.8 71 6.8 82 7.8 44 4.2 25 2.4 9 0.9 69 6.6 1,051 100
Full-time 249 11.2 167 7.5 158 7.1 188 8.4 63 2.8 47 2.1 42 1.9 182 8.2 2,226 100 All 344 10.5 228 7.0 229 7.0 270 8.2 107 3.3 72 2.2 51 1.6 251 7.7 3,277 100
UC Part-time 35 8.0 28 6.4 33 7.5 22 5.0 9 2.1 17 3.9 2 0.5 44 10.0 439 100 Full-time 117 4.1 84 2.9 115 4.0 86 3.0 61 2.1 30 1.0 25 0.9 175 6.1 2,885 100 All 152 4.6 112 3.4 148 4.5 108 3.2 70 2.1 47 1.4 27 0.8 219 6.6 3,324 100
CSU Part-time 13 6.0 26 12.0 20 9.2 19 8.8 11 5.1 11 5.1 4 1.8 35 16.1 217 100 Full-time 199 10.6 136 7.3 132 7.0 121 6.5 90 4.8 45 2.4 36 1.9 243 13.0 1,873 100 All 212 10.1 162 7.8 152 7.3 140 6.7 101 4.8 56 2.7 40 1.9 278 13.3 2,090 100
ICU Part-time 5 3.4 2 1.4 4 2.7 3 2.1 2 1.4 2 1.4 1 0.7 10 6.8 146 100 Full-time 104 5.3 68 3.5 71 3.6 58 3.0 39 2.0 25 1.3 17 0.9 154 7.9 1,947 100 All 109 5.2 70 3.3 75 3.6 61 2.9 41 2.0 27 1.3 18 0.9 164 7.8 2,093 100
PCC Part-time 35 12.5 16 5.7 17 6.1 17 6.1 10 3.6 6 2.1 2 0.7 24 8.6 280 100 Full-time 103 9.9 74 7.1 73 7.0 86 8.3 45 4.3 36 3.5 21 2.0 132 12.7 1,039 100 All 138 10.5 90 6.8 90 6.8 103 7.8 55 4.2 42 3.2 23 1.7 156 11.8 1,319 100
ALL Part-time 183 8.6 133 6.2 145 6.8 143 6.7 76 3.6 61 2.9 18 0.8 182 8.5 2,133 100 Full-time 772 7.7 529 5.3 549 5.5 539 5.4 298 3.0 183 1.8 141 1.4 886 8.9 9,970 100 All 955 7.9 662 5.5 694 5.7 682 5.6 374 3.1 244 2.0 159 1.3 1,068 8.8 12,103 100
TABLE U-48A: AVERAGE MONTHLY TRANSPORTATION EXPENSES BY SEGMENT, COURSE LOAD, AND DEPENDENCY STATUS
$40 to $49
$160 to $179
Source: California Student Aid Commission 311 2003-04 SEARS

INDEPENDENT UNDERGRADUATES
Nothing Under $10 $10 to $19 $20 to $29 $30 to $39 $50 to $64 $65 to $79
# % # % # % # % # % # % # % # %CCC Part-time 67 4.2 36 2.3 53 3.3 126 8.0 101 6.4 144 9.1 203 12.8 118 7.5
Full-time 71 5.9 14 1.2 26 2.1 34 2.8 75 6.2 70 5.8 135 11.1 101 8.3 All 138 4.9 50 1.8 79 2.8 160 5.7 176 6.3 214 7.7 338 12.1 219 7.8
UC Part-time 8 11.6 2 2.9 1 1.4 1 1.4 4 5.8 3 4.3 5 7.2 5 7.2 Full-time 63 18.5 18 5.3 18 5.3 15 4.4 13 3.8 16 4.7 22 6.5 14 4.1 All 71 17.4 20 4.9 19 4.6 16 3.9 17 4.2 19 4.6 27 6.6 19 4.6
CSU Part-time 15 2.6 5 0.9 9 1.5 28 4.8 24 4.1 24 4.1 47 8.1 39 6.7 Full-time 37 3.4 16 1.5 24 2.2 33 3.0 31 2.8 45 4.1 76 6.9 79 7.2 All 52 3.1 21 1.2 33 2.0 61 3.6 55 3.3 69 4.1 123 7.3 118 7.0
ICU Part-time 15 9.5 4 2.5 7 4.4 3 1.9 6 3.8 8 5.1 20 12.7 6 3.8 Full-time 38 11.0 7 2.0 8 2.3 15 4.3 18 5.2 22 6.4 20 5.8 20 5.8 All 53 10.5 11 2.2 15 3.0 18 3.6 24 4.8 30 6.0 40 8.0 26 5.2
PCC Part-time 22 3.9 8 1.4 14 2.5 39 6.9 48 8.5 38 6.7 63 11.2 40 7.1 Full-time 107 6.4 18 1.1 39 2.3 85 5.1 117 7.0 131 7.9 166 10.0 124 7.4 All 129 5.8 26 1.2 53 2.4 124 5.6 165 7.4 169 7.6 229 10.3 164 7.3
ALL Part-time 127 4.3 55 1.9 84 2.8 197 6.7 183 6.2 217 7.3 338 11.4 208 7.0 Full-time 316 6.8 73 1.6 115 2.5 182 3.9 254 5.4 284 6.1 419 9.0 338 7.2 All 443 5.8 128 1.7 199 2.6 379 5.0 437 5.7 501 6.6 757 9.9 546 7.2
$80 to $94 $95 to $104 $105 to $119 $120 to $139 $140 to $159 $180 to $199 $200 or More Total
# % # % # % # % # % # % # % # % # %CCC Part-time 121 7.6 107 6.8 100 6.3 128 8.1 59 3.7 36 2.3 24 1.5 160 10.1 1,583 100
Full-time 116 9.6 89 7.3 90 7.4 102 8.4 72 5.9 28 2.3 27 2.2 161 13.3 1,211 100 All 237 8.5 196 7.0 190 6.8 230 8.2 131 4.7 64 2.3 51 1.8 321 11.5 2,794 100
UC Part-time 5 7.2 7 10.1 4 5.8 6 8.7 5 7.2 2 2.9 1 1.4 10 14.5 69 100 Full-time 23 6.8 20 5.9 15 4.4 23 6.8 20 5.9 7 2.1 5 1.5 48 14.1 340 100 All 28 6.8 27 6.6 19 4.6 29 7.1 25 6.1 9 2.2 6 1.5 58 14.2 409 100
CSU Part-time 47 8.1 45 7.7 43 7.4 47 8.1 35 6.0 20 3.4 17 2.9 138 23.7 583 100 Full-time 111 10.1 80 7.3 75 6.8 112 10.2 76 6.9 43 3.9 30 2.7 231 21.0 1,099 100 All 158 9.4 125 7.4 118 7.0 159 9.5 111 6.6 63 3.7 47 2.8 369 21.9 1,682 100
ICU Part-time 13 8.2 7 4.4 8 5.1 15 9.5 10 6.3 5 3.2 4 2.5 27 17.1 158 100 Full-time 27 7.8 20 5.8 18 5.2 25 7.2 22 6.4 11 3.2 9 2.6 65 18.8 345 100 All 40 8.0 27 5.4 26 5.2 40 8.0 32 6.4 16 3.2 13 2.6 92 18.3 503 100
PCC Part-time 49 8.7 40 7.1 36 6.4 49 8.7 16 2.8 13 2.3 17 3.0 73 12.9 565 100 Full-time 141 8.5 119 7.1 121 7.3 134 8.0 69 4.1 32 1.9 28 1.7 237 14.2 1,668 100 All 190 8.5 159 7.1 157 7.0 183 8.2 85 3.8 45 2.0 45 2.0 310 13.9 2,233 100
ALL Part-time 235 7.9 206 7.0 191 6.5 245 8.3 125 4.2 76 2.6 63 2.1 408 13.8 2,958 100 Full-time 418 9.0 328 7.0 319 6.8 396 8.5 259 5.6 121 2.6 99 2.1 742 15.9 4,663 100 All 653 8.6 534 7.0 510 6.7 641 8.4 384 5.0 197 2.6 162 2.1 1,150 15.1 7,621 100
TABLE U-48B: AVERAGE MONTHLY TRANSPORTATION EXPENSES BY SEGMENT, COURSE LOAD, AND DEPENDENCY STATUS
$40 to $49
$160 to $179
Source: California Student Aid Commission 312 2003-04 SEARS

ALL UNDERGRADUATES
Nothing Under $10 $10 to $19 $20 to $29 $30 to $39 $50 to $64 $65 to $79
# % # % # % # % # % # % # % # %Part-time 424 8.3 120 2.4 146 2.9 299 5.9 296 5.8 411 8.1 534 10.5 371 7.3 Full-time 2,366 16.2 469 3.2 452 3.1 694 4.7 781 5.3 987 6.7 1,301 8.9 1,004 6.9 All 2,790 14.1 589 3.0 598 3.0 993 5.0 1,077 5.5 1,398 7.1 1,835 9.3 1,375 7.0
$80 to $94 $95 to $104 $105 to $119 $120 to $139 $140 to $159 $180 to $199 $200 or More Total
# % # % # % # % # % # % # % # % # %Part-time 418 8.2 339 6.7 336 6.6 388 7.6 201 3.9 137 2.7 81 1.6 590 11.6 5,091 100 Full-time 1,190 8.1 857 5.9 868 5.9 935 6.4 557 3.8 304 2.1 240 1.6 1,628 11.1 14,633 100 All 1,608 8.2 1,196 6.1 1,204 6.1 1,323 6.7 758 3.8 441 2.2 321 1.6 2,218 11.2 19,724 100
TABLE U-48C: AVERAGE MONTHLY TRANSPORTATION EXPENSES BY SEGMENT, COURSE LOAD, AND DEPENDENCY STATUS
$40 to $49
$160 to $179
Source: California Student Aid Commission 313 2003-04 SEARS

DEPENDENT UNDERGRADUATES INDEPENDENT UNDERGRADUATES ALL UNDERGRADUATES
CCC Part-time 958 87$ 75$ CCC Part-time 1,516 90$ 76$ CCC Part-time 2,474 89$ 74$ Full-time 2,049 93$ 83$ Full-time 1,140 104$ 109$ Full-time 3,189 97$ 99$ All 3,007 91$ 79$ All 2,656 96$ 81$ All 5,663 94$ 78$
UC Part-time 337 96$ 90$ UC Part-time 61 110$ 107$ UC Part-time 398 98$ 87$ Full-time 1,927 74$ 54$ Full-time 277 101$ 109$ Full-time 2,204 77$ 52$ All 2,264 77$ 61$ All 338 103$ 98$ All 2,602 80$ 59$
CSU Part-time 208 112$ 104$ CSU Part-time 568 121$ 111$ CSU Part-time 776 119$ 119$ Full-time 1,661 102$ 107$ Full-time 1,062 121$ 116$ Full-time 2,723 109$ 94$
All 1,869 103$ 109$ All 1,630 121$ 114$ All 3,499 111$ 98$ ICU Part-time 80 76$ 64$ ICU Part-time 143 111$ 106$ ICU Part-time 223 98$ 93$ Full-time 1,318 82$ 67$ Full-time 307 114$ 105$ Full-time 1,625 88$ 66$
All 1,398 82$ 67$ All 450 113$ 107$ All 1,848 90$ 69$ PCC Part-time 253 89$ 82$ PCC Part-time 543 98$ 82$ PCC Part-time 796 95$ 80$ Full-time 965 102$ 96$ Full-time 1,561 101$ 94$ Full-time 2,526 101$ 91$
All 1,218 99$ 92$ All 2,104 100$ 90$ All 3,322 100$ 88$ ALL Part-time 1,836 91$ 77$ ALL Part-time 2,831 99$ 80$ ALL Part-time 4,667 96$ 77$
Full-time 7,920 90$ 82$ Full-time 4,347 108$ 102$ Full-time 12,267 96$ 83$ All 9,756 90$ 80$ All 7,178 104$ 87$ All 16,934 96$ 80$
Note: "Nothing" category were excluded from the means and median calculations.
TABLE M-48: MEAN AND MEDIAN AVERAGE MONTHLY TRANSPORTATION EXPENSES BY SEGMENT, COURSE LOAD, AND DEPENDENCY STATUS
Number Mean Median Number Mean Number Mean Median
Source: California Student Aid Commission 314 2003-04 SEARS

Questions for Tables: W-49, U-49, and M-49 (Travel Within California) W-50, U-50, and M-50 (Travel Outside of California)
What are your expenses, if any, for transportation to and from your parent(s)' residence(s) for the
current academic year (e.g., bus fare, train fair, gasoline, tolls, parking, etc
Travel Within California Travel Outside California Does Not Apply 00 00 I live with my parent(s) 01 01 Nothing 02 02 Under $135 03 03 $135 to $269 04 04 $270 to $404 05 05 $405 to $539 06 06 $540 to $674 07 07 $675 to $809 08 08 $810 to $944 09 09 $945 to $1,079 10 10 $1,080 to $1,214 11 11 $1,215 to $1,349 12 12 $1,350 or more 13 13
315 2003-04 SEARS

(TO AND FROM PARENTS)
DEPENDENT UNDERGRADUATES
# % # % # % # % # % # % # %CCC Part-time 75,099 20.8 179,523 49.6 18,238 5.0 38,623 10.7 16,450 4.5 10,013 2.8 5,722 1.6
Full-time 48,780 18.8 139,337 53.6 6,882 2.6 26,201 10.1 12,436 4.8 6,520 2.5 4,588 1.8 All 123,879 19.9 318,860 51.3 25,120 4.0 64,824 10.4 28,886 4.6 16,533 2.7 10,310 1.7
UC Part-time 2,919 11 5,020 19 1,305 4.9 6,012 22.6 3,594 13.5 2,812 10.6 1,508 5.7 Full-time 8,860 8 6,691 6 5,010 4.6 37,499 34.6 18,755 17.3 12,134 11.2 7,469 6.9 All 11,780 9 11,711 9 6,314 4.7 43,511 32.2 22,349 16.6 14,946 11.1 8,977 6.7
CSU Part-time 2,670 13.6 8,416 42.9 989 5.0 2,980 15.2 1,487 7.6 1,000 5.1 961 4.9 Full-time 22,187 14.8 44,999 30.1 4,674 3.1 34,316 23.0 15,420 10.3 10,927 7.3 5,276 3.5 All 24,857 14.7 53,415 31.6 5,663 3.4 37,296 22.1 16,907 10.0 11,927 7.1 6,237 3.7
ICU Part-time 1,194 24.2 573 11.6 274 5.6 1,119 22.7 283 5.7 623 12.6 462 9.4 Full-time 23,498 27.1 8,763 10.1 3,733 4.3 22,808 26.3 10,661 12.3 6,149 7.1 3,325 3.8 All 24,692 26.9 9,335 10.2 4,007 4.4 23,927 26.1 10,944 11.9 6,772 7.4 3,786 4.1
PCC Part-time 1,364 23.5 2,280 39.3 347 6.0 1,050 18.1 298 5.1 114 2.0 79 1.4 Full-time 4,821 21.7 9,305 41.8 672 3.0 2,631 11.8 2,397 10.8 944 4.2 295 1.3 All 6,185 22.0 11,586 41.3 1,019 3.6 3,681 13.1 2,695 9.6 1,057 3.8 375 1.3
ALL Part-time 83,246 19.9 195,812 46.8 21,153 5.1 49,785 11.9 22,112 5.3 14,562 3.5 8,732 2.1 Full-time 108,146 17.3 209,095 33.4 20,971 3.3 123,455 19.7 59,669 9.5 36,674 5.9 20,953 3.3 All 191,392 18.3 404,906 38.7 42,124 4.0 173,239 16.6 81,781 7.8 51,235 4.9 29,685 2.8
Total
# % # % # % # % # % # % # % # %CCC Part-time 3,576 1.0 2,146 0.6 2,503 0.7 1,788 0.5 1,431 0.4 715 0.2 6,080 1.7 361,906 100
Full-time 3,260 1.3 2,173 0.8 2,053 0.8 1,449 0.6 845 0.3 845 0.3 4,347 1.7 259,717 100All 6,836 1.1 4,319 0.7 4,556 0.7 3,237 0.5 2,276 0.4 1,560 0.3 10,426 1.7 621,623 100
UC Part-time 883 3.3 397 1.5 566 2.1 430 1.6 281 1.1 252 1.0 566 2.1 26,544 100Full-time 3,934 3.6 3,291 3.0 1,698 1.6 1,021 0.9 1,203 1.1 164 0.2 664 0.6 108,391 100All 4,817 3.6 3,688 2.7 2,263 1.7 1,451 1.1 1,484 1.1 416 0.3 1,229 0.9 134,935 100
CSU Part-time 443 2.3 371 1.9 140 0.7 - - - - - - 149 0.8 19,607 100Full-time 3,650 2.4 1,638 1.1 1,137 0.8 1,810 1.2 1,160 0.8 377 0.3 1,865 1.2 149,436 100All 4,093 2.4 2,009 1.2 1,278 0.8 1,810 1.1 1,160 0.7 377 0.2 2,014 1.2 169,043 100
ICU Part-time 102 2.1 - - 46 0.9 126 2.6 47 0.9 - - 87 1.8 4,936 100Full-time 2,828 3.3 1,318 1.5 646 0.7 1,308 1.5 582 0.7 272 0.3 873 1.0 86,763 100All 2,929 3.2 1,318 1.4 692 0.8 1,434 1.6 629 0.7 272 0.3 960 1.0 91,699 100
PCC Part-time 57 1.0 17 0.3 12 0.2 20 - 119 2.0 - - 43 0.7 5,800 100Full-time 410 1.8 112 0.5 78 0.3 77 0.3 61 0.3 226 1.0 222 1.0 22,250 100All 468 1.7 130 0.5 89 0.3 96 0.3 180 0.6 226 0.8 265 0.9 28,050 100
ALL Part-time 5,062 1.2 2,931 0.7 3,267 0.8 2,364 0.6 1,877 0.4 967 0.2 6,924 1.7 418,795 100Full-time 14,081 2.2 8,532 1.4 5,611 0.9 5,664 0.9 3,851 0.6 1,884 0.3 7,970 1.3 626,556 100All 19,143 1.8 11,463 1.1 8,878 0.8 8,028 0.8 5,728 0.5 2,852 0.3 14,894 1.4 1,045,351 100
Does Not Apply
TABLE W-49A: TRAVEL EXPENSES WITHIN CALIFORNIA BY SEGMENT, COURSE LOAD, AND DEPENDENCY STATUS
Live With Parent(s) Nothing Under $135 $135 to $269 $270 to $404 $405 to $539
$1,080 to $1,214 $1,215 to $1,349 $1,350 or More$540 to $674 $675 to $809 $810 to $944 $945 to $1,079
Source: California Student Aid Commission 316 2003-04 SEARS

(TO AND FROM PARENTS)
INDEPENDENT UNDERGRADUATES
# % # % # % # % # % # % # %CCC Part-time 234,954 44.7 73,669 14.0 50,424 9.6 80,106 15.2 31,470 6.0 20,027 3.8 8,225 1.6
Full-time 49,504 37.0 24,873 18.6 13,644 10.2 19,802 14.8 9,176 6.9 5,313 4.0 3,622 2.7 All 284,458 43.2 98,542 15.0 64,068 9.7 99,908 15.2 40,646 6.2 25,340 3.8 11,848 1.8
UC Part-time 901 24 318 9 216 5.8 1,094 29.6 490 13.3 326 8.8 70 1.9 Full-time 3,953 30 661 5 692 5.3 3,338 25.7 1,352 10.4 1,091 8.4 740 5.7 All 4,854 29 978 6 907 5.4 4,432 26.6 1,842 11.0 1,417 8.5 810 4.9
CSU Part-time 24,141 50.0 4,647 9.6 3,972 8.2 8,841 18.3 2,374 4.9 1,075 2.2 948 2.0 Full-time 26,557 33.4 11,964 15.1 6,754 8.5 16,739 21.1 8,647 10.9 3,121 3.9 1,472 1.9 All 50,698 39.7 16,611 13.0 10,726 8.4 25,580 20.0 11,021 8.6 4,195 3.3 2,420 1.9
ICU Part-time 6,104 66.6 612 6.7 549 6.0 572 6.2 456 5.0 274 3.0 259 2.8 Full-time 7,427 44.3 1,664 9.9 1,003 6.0 3,427 20.5 1,235 7.4 683 4.1 370 2.2 All 13,531 52.2 2,276 8.8 1,552 6.0 3,999 15.4 1,690 6.5 957 3.7 630 2.4
PCC Part-time 11,220 50.8 3,272 14.8 1,443 6.5 3,300 14.9 1,088 4.9 917 4.2 119 0.5 Full-time 25,783 49.9 7,435 14.4 3,803 7.4 7,923 15.3 2,933 5.7 1,452 2.8 615 1.2 All 37,003 50.2 10,708 14.5 5,246 7.1 11,223 15.2 4,021 5.5 2,369 3.2 735 1.0
ALL Part-time 277,320 45.6 82,517 13.6 56,603 9.3 93,912 15.4 35,878 5.9 22,618 3.7 9,622 1.6 Full-time 113,224 38.4 46,597 15.8 25,895 8.8 51,229 17.4 23,343 7.9 11,660 4.0 6,820 2.3 All 390,544 43.2 129,114 14.3 82,498 9.1 145,141 16.1 59,221 6.6 34,278 3.8 16,441 1.8
Total
# % # % # % # % # % # % # % # %CCC Part-time 4,649 0.9 4,291 0.8 1,073 0.2 3,934 0.7 2,503 0.5 1,431 0.3 8,583 1.6 525,339 100
Full-time 2,173 1.6 724 0.5 966 0.7 966 0.7 604 0.5 362 0.3 1,932 1.4 133,662 100All 6,822 1.0 5,016 0.8 2,039 0.3 4,900 0.7 3,107 0.5 1,793 0.3 10,515 1.6 659,001 100
UC Part-time 49 1.3 - - 49 1.3 - - - - 70 1.9 112 3.0 3,693 100Full-time 260 2.0 177 1.4 269 2.1 227 1.7 86 0.7 - - 139 1.1 12,984 100All 309 1.9 177 1.1 317 1.9 227 1.4 86 0.5 70 0.4 250 1.5 16,678 100
CSU Part-time 685 1.4 287 0.6 618 1.3 479 1.0 - - - - 236 0.5 48,302 100Full-time 888 1.1 833 1.0 666 0.8 557 0.7 304 0.4 - - 983 1.2 79,484 100All 1,574 1.2 1,120 0.9 1,284 1.0 1,036 0.8 304 0.2 - - 1,219 1.0 127,786 100
ICU Part-time 101 1.1 54 0.6 47 0.5 - - 52 0.6 - - 91 1.0 9,170 100Full-time 207 1.2 226 1.3 58 0.3 161 1.0 32 0.2 - - 261 1.6 16,754 100All 308 1.2 280 1.1 104 0.4 161 0.6 85 0.3 - - 352 1.4 25,924 100
PCC Part-time 272 1.2 37 0.2 74 0.3 38 - 140 0.6 20 0.1 137 0.6 22,077 100Full-time 531 1.0 145 0.3 280 0.5 46 0.1 116 0.2 - - 605 1.2 51,666 100All 803 1.1 182 0.2 353 0.5 84 0.1 256 0.3 20 0.0 742 1.0 73,743 100
ALL Part-time 5,756 0.9 4,669 0.8 1,860 0.3 4,451 0.7 2,696 0.4 1,520 0.2 9,159 1.5 608,581 100Full-time 4,060 1.4 2,105 0.7 2,238 0.8 1,956 0.7 1,141 0.4 362 0.1 3,919 1.3 294,550 100All 9,816 1.1 6,775 0.8 4,097 0.5 6,407 0.7 3,837 0.4 1,882 0.2 13,078 1.4 903,131 100
Does Not Apply
TABLE W-49B: TRAVEL EXPENSES WITHIN CALIFORNIA BY SEGMENT, COURSE LOAD, AND DEPENDENCY STATUS
Live With Parent(s) Nothing Under $135 $135 to $269 $270 to $404 $405 to $539
$1,080 to $1,214 $1,215 to $1,349 $1,350 or More$540 to $674 $675 to $809 $810 to $944 $945 to $1,079
Source: California Student Aid Commission 317 2003-04 SEARS

(TO AND FROM PARENTS)
ALL UNDERGRADUATES
# % # % # % # % # % # % # %ALL Part-time 360,566 35.1 278,329 27.1 77,756 7.6 143,697 14.0 57,991 5.6 37,180 3.6 18,354 1.8
Full-time 221,370 24.0 255,692 27.8 46,866 5.1 174,684 19.0 83,011 9.0 48,333 5.2 27,773 3.0 All 581,936 29.9 534,021 27.4 124,622 6.4 318,380 16.3 141,002 7.2 85,513 4.4 46,127 2.4
Total
# % # % # % # % # % # % # % # %ALL Part-time 10,818 1.1 7,600 0.7 5,127 0.5 6,815 0.7 4,573 0.4 2,488 0.2 16,083 1.6 1,027,375 100
Full-time 18,141 2.0 10,638 1.2 7,849 0.9 7,620 0.8 4,993 0.5 2,247 0.2 11,889 1.3 921,107 100All 28,959 1.5 18,238 0.9 12,976 0.7 14,435 0.7 9,565 0.5 4,734 0.2 27,972 1.4 1,948,482 100
TABLE W-49C: TRAVEL EXPENSES WITHIN CALIFORNIA BY SEGMENT, COURSE LOAD, AND DEPENDENCY STATUS
Does Not Apply Live With Parent(s) Nothing Under $135 $135 to $269 $270 to $404 $405 to $539
$1,080 to $1,214 $1,215 to $1,349 $1,350 or More$540 to $674 $675 to $809 $810 to $944 $945 to $1,079
Source: California Student Aid Commission 318 2003-04 SEARS

(TO AND FROM PARENTS)
DEPENDENT UNDERGRADUATES
# % # % # % # % # % # % # %CCC Part-time 210 20.8 502 49.6 51 5.0 108 10.7 46 4.5 28 2.8 16 1.6
Full-time 404 18.8 1,154 53.6 57 2.6 217 10.1 103 4.8 54 2.5 38 1.8 All 614 19.4 1,656 52.4 108 3.4 325 10.3 149 4.7 82 2.6 54 1.7
UC Part-time 49 11 82 19 22 5.0 100 22.9 57 13.0 47 10.8 23 5.3 Full-time 234 8 202 7 128 4.5 982 34.2 489 17.0 320 11.1 193 6.7 All 283 9 284 9 150 4.5 1,082 32.7 546 16.5 367 11.1 216 6.5
CSU Part-time 28 13.0 87 40.3 9 4.2 39 18.1 18 8.3 13 6.0 8 3.7 Full-time 259 14.0 536 28.9 58 3.1 435 23.5 203 10.9 143 7.7 70 3.8 All 287 13.9 623 30.1 67 3.2 474 22.9 221 10.7 156 7.5 78 3.8
ICU Part-time 50 35.2 11 7.7 8 5.6 31 21.8 9 6.3 15 10.6 10 7.0 Full-time 544 28.1 181 9.4 88 4.6 513 26.5 235 12.2 141 7.3 72 3.7 All 594 28.6 192 9.3 96 4.6 544 26.2 244 11.8 156 7.5 82 4.0
PCC Part-time 68 25.2 120 44.4 17 6.3 33 12.2 12 4.4 6 2.2 4 1.5 Full-time 217 21.0 450 43.5 39 3.8 144 13.9 82 7.9 41 4.0 17 1.6 All 285 21.9 570 43.7 56 4.3 177 13.6 94 7.2 47 3.6 21 1.6
ALL Part-time 405 19.5 802 38.6 107 5.2 311 15.0 142 6.8 109 5.2 61 2.9 Full-time 1,658 16.8 2,523 25.6 370 3.8 2,291 23.3 1,112 11.3 699 7.1 390 4.0 All 2,063 17.3 3,325 27.9 477 4.0 2,602 21.8 1,254 10.5 808 6.8 451 3.8
Total
# % # % # % # % # % # % # % # %CCC Part-time 10 1.0 6 0.6 7 0.7 5 0.5 4 0.4 2 0.2 17 1.7 1,012 100
Full-time 27 1.3 18 0.8 17 0.8 12 0.6 7 0.3 7 0.3 36 1.7 2,151 100All 37 1.2 24 0.8 24 0.8 17 0.5 11 0.3 9 0.3 53 1.7 3,163 100
UC Part-time 15 3.4 8 1.8 9 2.1 8 1.8 4 0.9 4 0.9 9 2.1 437 100Full-time 106 3.7 91 3.2 45 1.6 28 1.0 32 1.1 4 0.1 18 0.6 2,872 100All 121 3.7 99 3.0 54 1.6 36 1.1 36 1.1 8 0.2 27 0.8 3,309 100
CSU Part-time 5 2.3 5 2.3 2 0.9 - - - - - - 2 0.9 216 100Full-time 49 2.6 24 1.3 13 0.7 24 1.3 13 0.7 6 0.3 22 1.2 1,855 100All 54 2.6 29 1.4 15 0.7 24 1.2 13 0.6 6 0.3 24 1.2 2,071 100
ICU Part-time 2 1.4 - - 1 0.7 2 1.4 1 0.7 - - 2 1.4 142 100Full-time 59 3.1 31 1.6 16 0.8 16 0.8 13 0.7 5 0.3 19 1.0 1,933 100All 61 2.9 31 1.5 17 0.8 18 0.9 14 0.7 5 0.2 21 1.0 2,075 100
PCC Part-time 3 1.1 1 0.4 1 0.4 1 - 1 0.4 - - 3 1.1 270 100Full-time 13 1.3 5 0.5 5 0.5 4 0.4 4 0.4 6 0.6 7 0.7 1,034 100All 16 1.2 6 0.5 6 0.5 5 0.4 5 0.4 6 0.5 10 0.8 1,304 100
ALL Part-time 35 1.7 20 1.0 20 1.0 16 0.8 10 0.5 6 0.3 33 1.6 2,077 100Full-time 254 2.6 169 1.7 96 1.0 84 0.9 69 0.7 28 0.3 102 1.0 9,845 100All 289 2.4 189 1.6 116 1.0 100 0.8 79 0.7 34 0.3 135 1.1 11,922 100
TABLE U-49A: TRAVEL EXPENSES WITHIN CALIFORNIA BY SEGMENT, COURSE LOAD, AND DEPENDENCY STATUS
$1,350 or More$1,215 to $1,349$1,080 to $1,214$945 to $1,079$810 to $944$675 to $809
$405 to $539$270 to $404$135 to $269
$540 to $674
Live With Parent(s) Under $135NothingDoes Not Apply
Source: California Student Aid Commission 319 2003-04 SEARS

(TO AND FROM PARENTS)
INDEPENDENT UNDERGRADUATES
# % # % # % # % # % # % # %CCC Part-time 657 44.7 206 14.0 141 9.6 224 15.2 88 6.0 56 3.8 23 1.6
Full-time 410 37.0 206 18.6 113 10.2 164 14.8 76 6.9 44 4.0 30 2.7 All 1,067 41.4 412 16.0 254 9.9 388 15.1 164 6.4 100 3.9 53 2.1
UC Part-time 20 29 5 7 4 5.9 18 26.5 9 13.2 6 8.8 1 1.5 Full-time 102 30 18 5 19 5.6 87 25.8 34 10.1 27 8.0 19 5.6 All 122 30 23 6 23 5.7 105 25.9 43 10.6 33 8.1 20 4.9
CSU Part-time 282 49.1 51 8.9 47 8.2 104 18.1 31 5.4 16 2.8 15 2.6 Full-time 352 32.4 148 13.6 86 7.9 229 21.1 131 12.1 55 5.1 25 2.3 All 634 38.2 199 12.0 133 8.0 333 20.1 162 9.8 71 4.3 40 2.4
ICU Part-time 92 60.9 12 7.9 10 6.6 12 7.9 8 5.3 5 3.3 5 3.3 Full-time 146 42.6 32 9.3 21 6.1 70 20.4 26 7.6 16 4.7 10 2.9 All 238 48.2 44 8.9 31 6.3 82 16.6 34 6.9 21 4.3 15 3.0
PCC Part-time 299 49.2 98 16.1 34 5.6 94 15.5 29 4.8 18 3.0 7 1.2 Full-time 857 48.1 264 14.8 144 8.1 273 15.3 114 6.4 48 2.7 22 1.2 All 1,156 48.4 362 15.2 178 7.5 367 15.4 143 6.0 66 2.8 29 1.2
ALL Part-time 1,350 47.0 372 13.0 236 8.2 452 15.7 165 5.7 101 3.5 51 1.8 Full-time 1,867 40.1 668 14.4 383 8.2 823 17.7 381 8.2 190 4.1 106 2.3 All 3,217 42.8 1,040 13.8 619 8.2 1,275 17.0 546 7.3 291 3.9 157 2.1
Total
# % # % # % # % # % # % # % # %CCC Part-time 13 0.9 12 0.8 3 0.2 11 0.7 7 0.5 4 0.3 24 1.6 1,469 100
Full-time 18 1.6 6 0.5 8 0.7 8 0.7 5 0.5 3 0.3 16 1.4 1,107 100All 31 1.2 18 0.7 11 0.4 19 0.7 12 0.5 7 0.3 40 1.6 2,576 100
UC Part-time 1 1.5 - - 1 1.5 - - - - 1 1.5 2 2.9 68 100Full-time 7 2.1 5 1.5 7 2.1 6 1.8 2 0.6 - - 4 1.2 337 100All 8 2.0 5 1.2 8 2.0 6 1.5 2 0.5 1 0.2 6 1.5 405 100
CSU Part-time 9 1.6 7 1.2 4 0.7 5 0.9 - - - - 3 0.5 574 100Full-time 15 1.4 14 1.3 7 0.6 5 0.5 5 0.5 - - 13 1.2 1,085 100All 24 1.4 21 1.3 11 0.7 10 0.6 5 0.3 - - 16 1.0 1,659 100
ICU Part-time 2 1.3 1 0.7 1 0.7 - - 1 0.7 - - 2 1.3 151 100Full-time 5 1.5 5 1.5 1 0.3 4 1.2 1 0.3 - - 6 1.7 343 100All 7 1.4 6 1.2 2 0.4 4 0.8 2 0.4 - - 8 1.6 494 100
PCC Part-time 7 1.2 2 0.3 5 0.8 3 - 2 0.3 2 0.3 8 1.3 608 100Full-time 15 0.8 7 0.4 6 0.3 2 0.1 4 0.2 - - 24 1.3 1,780 100All 22 0.9 9 0.4 11 0.5 5 0.2 6 0.3 2 0.1 32 1.3 2,388 100
ALL Part-time 32 1.1 22 0.8 14 0.5 19 0.7 10 0.3 7 0.2 39 1.4 2,870 100Full-time 60 1.3 37 0.8 29 0.6 25 0.5 17 0.4 3 0.1 63 1.4 4,652 100All 92 1.2 59 0.8 43 0.6 44 0.6 27 0.4 10 0.1 102 1.4 7,522 100
Does Not Apply
TABLE U-49B: TRAVEL EXPENSES WITHIN CALIFORNIA BY SEGMENT, COURSE LOAD, AND DEPENDENCY STATUS
Live With Parent(s) Nothing Under $135 $135 to $269 $270 to $404 $405 to $539
$1,080 to $1,214 $1,215 to $1,349 $1,350 or More$540 to $674 $675 to $809 $810 to $944 $945 to $1,079
Source: California Student Aid Commission 320 2003-04 SEARS

(TO AND FROM PARENTS)
ALL UNDERGRADUATES
# % # % # % # % # % # % # %ALL Part-time 1,755 35.5 1,174 23.7 343 6.9 763 15.4 307 6.2 210 4.2 112 2.3
Full-time 3,525 24.3 3,191 22.0 753 5.2 3,114 21.5 1,493 10.3 889 6.1 496 3.4 All 5,280 27.2 4,365 22.4 1,096 5.6 3,877 19.9 1,800 9.3 1,099 5.7 608 3.1
Total
# % # % # % # % # % # % # % # %ALL Part-time 67 1.4 42 0.8 34 0.7 35 0.7 20 0.4 13 0.3 72 1.5 4,947 100
Full-time 314 2.2 206 1.4 125 0.9 109 0.8 86 0.6 31 0.2 165 1.1 14,497 100All 381 2.0 248 1.3 159 0.8 144 0.7 106 0.5 44 0.2 237 1.2 19,444 100
TABLE U-49C: TRAVEL EXPENSES WITHIN CALIFORNIA BY SEGMENT, COURSE LOAD, AND DEPENDENCY STATUS
Does Not Apply Live With Parent(s) Nothing Under $135 $135 to $269 $270 to $404 $405 to $539
$1,080 to $1,214 $1,215 to $1,349 $1,350 or More$540 to $674 $675 to $809 $810 to $944 $945 to $1,079
Source: California Student Aid Commission 321 2003-04 SEARS

DEPENDENT UNDERGRADUATES INDEPENDENT UNDERGRADUATES ALL UNDERGRADUATES
CCC Part-time 249 348$ 183$ CCC Part-time 465 302$ 148$ CCC Part-time 714 318$ 183$ Full-time 536 367$ 202$ Full-time 378 313$ 179$ Full-time 914 344$ 238$ All 785 361$ 191$ All 843 307$ 155$ All 1,628 333$ 198$
UC Part-time 284 347$ 234$ UC Part-time 39 286$ 145$ UC Part-time 323 340$ 232$ Full-time 2,308 274$ 181$ Full-time 198 298$ 185$ Full-time 2,506 276$ 208$ All 2,592 282$ 190$ All 237 296$ 174$ All 2,829 283$ 212$
CSU Part-time 92 280$ 206$ CSU Part-time 194 253$ 119$ CSU Part-time 286 262$ 131$ Full-time 1,002 288$ 174$ Full-time 499 254$ 141$ Full-time 1,501 277$ 187$
All 1,094 288$ 177$ All 693 255$ 131$ All 1,787 275$ 178$ ICU Part-time 73 299$ 279$ ICU Part-time 37 359$ 248$ ICU Part-time 110 319$ 258$ Full-time 1,120 269$ 168$ Full-time 144 288$ 139$ Full-time 1,264 271$ 204$
All 1,193 271$ 171$ All 181 302$ 168$ All 1,374 275$ 211$ PCC Part-time 65 284$ 116$ PCC Part-time 177 288$ 126$ PCC Part-time 242 287$ 130$ Full-time 328 276$ 201$ Full-time 515 249$ 123$ Full-time 843 260$ 129$
All 393 277$ 186$ All 692 259$ 124$ All 1,085 266$ 129$ ALL Part-time 763 329$ 193$ ALL Part-time 912 291$ 143$ ALL Part-time 1,675 308$ 183$
Full-time 5,294 285$ 182$ Full-time 1,734 274$ 154$ Full-time 7,028 282$ 203$ All 6,057 291$ 185$ All 2,646 279$ 147$ All 8,703 287$ 194$
Note: "Does Not Apply, Live with Parents and Nothing" categories were excluded from the means and median calculations.
Number Mean Median Number
TABLE M-49: MEAN AND MEDIAN TRAVEL EXPENSES WITHIN CALIFORNIA BY SEGMENT, COURSE LOAD, AND DEPENDENCY STATUS
MedianMean Median Number Mean
(TO AND FROM PARENTS)
Source: California Student Aid Commission 322 2003-04 SEARS

(TO AND FROM PARENTS)
DEPENDENT UNDERGRADUATES
# % # % # % # % # % # % # %CCC Part-time 121,590 57.4 44,344 20.9 20,027 9.5 5,364 2.5 2,861 1.4 3,219 1.5 1,788 0.8
Full-time 100,216 62.4 31,152 19.4 6,279 3.9 3,743 2.3 3,502 2.2 3,622 2.3 1,811 1.1 All 221,806 59.6 75,496 20.3 26,306 7.1 9,107 2.4 6,362 1.7 6,841 1.8 3,599 1.0
UC Part-time 21,052 79 1,682 6 1,521 5.7 463 1.7 37 0.1 405 1.5 318 1.2 Full-time 89,251 82 2,346 2 3,828 3.5 1,819 1.7 1,446 1.3 1,245 1.1 1,412 1.3 All 110,303 82 4,028 3 5,348 4.0 2,283 1.7 1,483 1.1 1,649 1.2 1,730 1.3
CSU Part-time 15,191 77.5 2,370 12.1 745 3.8 - - 222 1.1 158 0.8 26 0.1 Full-time 116,703 78.1 12,644 8.5 4,801 3.2 1,531 1.0 1,472 1.0 1,511 1.0 2,404 1.6 All 131,894 78.0 15,014 8.9 5,546 3.3 1,531 0.9 1,695 1.0 1,669 1.0 2,430 1.4
ICU Part-time 2,666 54.0 413 8.4 192 3.9 81 1.6 181 3.7 187 3.8 203 4.1 Full-time 50,587 58.3 4,767 5.5 2,627 3.0 1,992 2.3 2,898 3.3 4,849 5.6 3,158 3.6 All 53,253 58.1 5,180 5.6 2,819 3.1 2,073 2.3 3,080 3.4 5,036 5.5 3,361 3.7
PCC Part-time 1,850 34.1 2,416 44.5 102 1.9 84 1.5 92 1.7 102 1.9 131 2.4 Full-time 6,190 30.7 10,491 52.0 389 1.9 404 2.0 590 2.9 531 2.6 196 1.0 All 8,040 31.4 12,907 50.4 491 1.9 488 1.9 682 2.7 632 2.5 327 1.3
ALL Part-time 162,349 60.5 51,225 19.1 22,587 8.4 5,992 2.2 3,394 1.3 4,070 1.5 2,466 0.9 Full-time 362,947 69.1 61,400 11.7 17,924 3.4 9,489 1.8 9,908 1.9 11,758 2.2 8,981 1.7 All 525,295 66.2 112,625 14.2 40,511 5.1 15,481 2.0 13,302 1.7 15,828 2.0 11,447 1.4
Total
# % # % # % # % # % # % # % # %CCC Part-time 2,503 1.2 1,788 0.8 1,073 0.5 1,073 0.5 1,788 0.8 358 0.2 3,934 1.9 211,709 100
Full-time 1,328 0.8 724 0.5 1,328 0.8 966 0.6 966 0.6 724 0.5 4,226 2.6 160,588 100All 3,832 1.0 2,513 0.7 2,401 0.6 2,039 0.5 2,754 0.7 1,082 0.3 8,160 2.2 372,297 100
UC Part-time 70 0.3 180 0.7 144 0.5 248 0.9 70 0.3 141 0.5 215 0.8 26,545 100Full-time 1,396 1.3 995 0.9 824 0.8 801 0.7 791 0.7 708 0.7 1,529 1.4 108,391 100All 1,466 1.1 1,175 0.9 968 0.7 1,049 0.8 861 0.6 848 0.6 1,743 1.3 134,936 100
CSU Part-time 221 1.1 - - 137 0.7 291 1.5 - - - - 246 1.3 19,608 100Full-time 1,280 0.9 1,117 0.7 599 0.4 1,866 1.2 875 0.6 318 0.2 2,315 1.5 149,436 100All 1,501 0.9 1,117 0.7 736 0.4 2,157 1.3 875 0.5 318 0.2 2,561 1.5 169,044 100
ICU Part-time 190 3.8 225 4.6 60 1.2 132 2.7 94 1.9 50 1.0 263 5.3 4,936 100Full-time 2,832 3.3 3,071 3.5 1,518 1.7 2,296 2.6 2,022 2.3 648 0.7 3,498 4.0 86,762 100All 3,021 3.3 3,296 3.6 1,577 1.7 2,428 2.6 2,116 2.3 697 0.8 3,761 4.1 91,699 100
PCC Part-time 263 4.8 159 2.9 19 0.4 56 - 14 0.3 16 0.3 123 2.3 5,428 100Full-time 191 0.9 158 0.8 334 1.7 98 0.5 96 0.5 103 0.5 416 2.1 20,188 100All 454 1.8 318 1.2 353 1.4 153 0.6 111 0.4 119 0.5 540 2.1 25,616 100
ALL Part-time 3,246 1.2 2,353 0.9 1,433 0.5 1,799 0.7 1,966 0.7 564 0.2 4,781 1.8 268,226 100Full-time 7,027 1.3 6,066 1.2 4,604 0.9 6,028 1.1 4,750 0.9 2,500 0.5 11,984 2.3 525,365 100All 10,274 1.3 8,418 1.1 6,036 0.8 7,827 1.0 6,717 0.8 3,065 0.4 16,765 2.1 793,591 100
$1,080 to $1,214 $1,215 to $1,349 $1,350 or More$540 to $674 $675 to $809 $810 to $944 $945 to $1,079
Does Not Apply
TABLE W-50A: TRAVEL EXPENSES OUTSIDE CALIFORNIA BY SEGMENT, COURSE LOAD, AND DEPENDENCY STATUS
Live With Parent(s) Nothing Under $135 $135 to $269 $270 to $404 $405 to $539
Source: California Student Aid Commission 323 2003-04 SEARS

(TO AND FROM PARENTS)
INDEPENDENT UNDERGRADUATES
# % # % # % # % # % # % # %CCC Part-time 198,477 65.4 13,232 4.4 26,821 8.8 2,503 0.8 8,583 2.8 7,510 2.5 6,795 2.2
Full-time 48,176 57.3 6,037 7.2 7,003 8.3 1,932 2.3 2,415 2.9 2,656 3.2 1,328 1.6 All 246,653 63.7 19,269 5.0 33,824 8.7 4,435 1.1 10,998 2.8 10,166 2.6 8,123 2.1
UC Part-time 2,902 79 107 3 249 6.7 70 1.9 119 3.2 140 3.8 27 0.7 Full-time 9,737 75 201 2 669 5.2 117 0.9 157 1.2 247 1.9 458 3.5 All 12,639 76 308 2 918 5.5 187 1.1 276 1.7 387 2.3 485 2.9
CSU Part-time 37,310 77.2 1,051 2.2 3,236 6.7 255 0.5 913 1.9 1,194 2.5 489 1.0 Full-time 57,605 72.5 2,819 3.5 4,461 5.6 1,297 1.6 1,733 2.2 1,987 2.5 2,468 3.1 All 94,915 74.3 3,869 3.0 7,696 6.0 1,551 1.2 2,645 2.1 3,181 2.5 2,957 2.3
ICU Part-time 6,613 72.1 474 5.2 545 5.9 - - 88 1.0 211 2.3 409 4.5 Full-time 10,579 63.1 1,426 8.5 621 3.7 486 2.9 352 2.1 885 5.3 565 3.4 All 17,192 66.3 1,900 7.3 1,166 4.5 486 1.9 441 1.7 1,096 4.2 973 3.8
PCC Part-time 16,733 75.8 2,922 13.2 420 1.9 200 0.9 140 0.6 232 1.0 216 1.0 Full-time 35,966 69.6 8,309 16.1 1,698 3.3 745 1.4 675 1.3 591 1.1 424 0.8 All 52,699 71.5 11,231 15.2 2,117 2.9 944 1.3 815 1.1 822 1.1 640 0.9
ALL Part-time 262,035 67.8 17,786 4.6 31,269 8.1 3,028 0.8 9,842 2.5 9,287 2.4 7,934 2.1 Full-time 162,063 66.2 18,792 7.7 14,453 5.9 4,576 1.9 5,332 2.2 6,366 2.6 5,243 2.1 All 424,098 67.2 36,578 5.8 45,722 7.2 7,604 1.2 15,174 2.4 15,653 2.5 13,177 2.1
Total
# % # % # % # % # % # % # % # %CCC Part-time 4,649 1.5 3,934 1.3 2,146 0.7 7,510 2.5 5,007 1.7 2,146 0.7 13,947 4.6 303,258 100
Full-time 1,449 1.7 1,570 1.9 1,690 2.0 1,207 1.4 1,328 1.6 1,207 1.4 6,037 7.2 84,037 100All 6,098 1.6 5,504 1.4 3,836 1.0 8,717 2.3 6,335 1.6 3,353 0.9 19,984 5.2 387,295 100
UC Part-time - - 38 1.0 - - - - - - - - 41 1.1 3,693 100Full-time 446 3.4 225 1.7 116 0.9 27 0.2 192 1.5 88 0.7 304 2.3 12,984 100All 446 2.7 263 1.6 116 0.7 27 0.2 192 1.1 88 0.5 346 2.1 16,678 100
CSU Part-time 494 1.0 883 1.8 656 1.4 330 0.7 292 0.6 - - 1,200 2.5 48,302 100Full-time 1,340 1.7 1,012 1.3 1,072 1.3 373 0.5 816 1.0 69 0.1 2,433 3.1 79,484 100All 1,834 1.4 1,896 1.5 1,727 1.4 703 0.6 1,108 0.9 69 0.1 3,634 2.8 127,786 100
ICU Part-time 128 1.4 272 3.0 102 1.1 115 1.3 34 0.4 - - 180 2.0 9,170 100Full-time 291 1.7 555 3.3 330 2.0 197 1.2 115 0.7 - - 351 2.1 16,754 100All 419 1.6 826 3.2 432 1.7 312 1.2 149 0.6 - - 531 2.0 25,924 100
PCC Part-time 221 1.0 285 1.3 241 1.1 129 - 169 0.8 30 0.1 139 0.6 22,076 100Full-time 498 1.0 405 0.8 361 0.7 165 0.3 218 0.4 131 0.3 1,481 2.9 51,667 100All 719 1.0 690 0.9 602 0.8 295 0.4 387 0.5 161 0.2 1,620 2.2 73,743 100
ALL Part-time 5,491 1.4 5,412 1.4 3,145 0.8 8,085 2.1 5,502 1.4 2,176 0.6 15,508 4.0 386,499 100Full-time 4,024 1.6 3,767 1.5 3,569 1.5 1,969 0.8 2,669 1.1 1,496 0.6 10,608 4.3 244,926 100All 9,516 1.5 9,179 1.5 6,713 1.1 10,054 1.6 8,171 1.3 3,672 0.6 26,115 4.1 631,425 100
$1,080 to $1,214 $1,215 to $1,349 $1,350 or More$540 to $674 $675 to $809 $810 to $944 $945 to $1,079
Does Not Apply
TABLE W-50B: TRAVEL EXPENSES OUTSIDE CALIFORNIA BY SEGMENT, COURSE LOAD, AND DEPENDENCY STATUS
Live With Parent(s) Nothing Under $135 $135 to $269 $270 to $404 $405 to $539
Source: California Student Aid Commission 324 2003-04 SEARS

(TO AND FROM PARENTS)
ALL UNDERGRADUATES
# % # % # % # % # % # % # %ALL Part-time 424,384 64.8 69,011 10.5 53,857 8.2 9,020 1.4 13,236 2.0 13,357 2.0 10,400 1.6
Full-time 525,010 68.2 80,192 10.4 32,376 4.2 14,065 1.8 15,240 2.0 18,124 2.4 14,224 1.8 All 949,394 66.6 149,203 10.5 86,233 6.1 23,085 1.6 28,476 2.0 31,480 2.2 24,624 1.7
Total
# % # % # % # % # % # % # % # %ALL Part-time 8,738 1.3 7,764 1.2 4,577 0.7 9,884 1.5 7,468 1.1 2,740 0.4 20,289 3.1 654,725 100
Full-time 11,051 1.4 9,833 1.3 8,172 1.1 7,997 1.0 7,419 1.0 3,996 0.5 22,592 2.9 770,290 100All 19,789 1.4 17,597 1.2 12,750 0.9 17,881 1.3 14,887 1.0 6,737 0.5 42,880 3.0 1,425,016 100
$1,080 to $1,214 $1,215 to $1,349 $1,350 or More$540 to $674 $675 to $809 $810 to $944 $945 to $1,079
TABLE W-50C: TRAVEL EXPENSES OUTSIDE CALIFORNIA BY SEGMENT, COURSE LOAD, AND DEPENDENCY STATUS
Does Not Apply Live With Parent(s) Nothing Under $135 $135 to $269 $270 to $404 $405 to $539
Source: California Student Aid Commission 325 2003-04 SEARS

(TO AND FROM PARENTS)
DEPENDENT UNDERGRADUATES
# % # % # % # % # % # % # %CCC Part-time 340 57.4 124 20.9 56 9.5 15 2.5 8 1.4 9 1.5 5 0.8
Full-time 830 62.4 258 19.4 52 3.9 31 2.3 29 2.2 30 2.3 15 1.1 All 1,170 60.9 382 19.9 108 5.6 46 2.4 37 1.9 39 2.0 20 1.0
UC Part-time 332 76 42 10 24 5.5 8 1.8 1 0.2 7 1.6 5 1.1 Full-time 2,321 81 106 4 101 3.5 48 1.7 38 1.3 34 1.2 38 1.3 All 2,653 80 148 4 125 3.8 56 1.7 39 1.2 41 1.2 43 1.3
CSU Part-time 168 77.8 27 12.5 8 3.7 - - 3 1.4 1 0.5 1 0.5 Full-time 1,428 77.0 167 9.0 65 3.5 21 1.1 20 1.1 19 1.0 26 1.4 All 1,596 77.1 194 9.4 73 3.5 21 1.0 23 1.1 20 1.0 27 1.3
ICU Part-time 62 43.7 6 4.2 6 4.2 3 2.1 5 3.5 10 7.0 8 5.6 Full-time 1,104 57.1 99 5.1 63 3.3 48 2.5 70 3.6 104 5.4 78 4.0 All 1,166 56.2 105 5.1 69 3.3 51 2.5 75 3.6 114 5.5 86 4.1
PCC Part-time 80 31.4 124 48.6 6 2.4 5 2.0 5 2.0 7 2.7 5 2.0 Full-time 302 31.5 488 50.9 28 2.9 21 2.2 21 2.2 20 2.1 11 1.1 All 382 31.5 612 50.5 34 2.8 26 2.1 26 2.1 27 2.2 16 1.3
ALL Part-time 982 59.8 323 19.7 100 6.1 31 1.9 22 1.3 34 2.1 24 1.5 Full-time 5,985 66.9 1,118 12.5 309 3.5 169 1.9 178 2.0 207 2.3 168 1.9 All 6,967 65.8 1,441 13.6 409 3.9 200 1.9 200 1.9 241 2.3 192 1.8
Total
# % # % # % # % # % # % # % # %CCC Part-time 7 1.2 5 0.8 3 0.5 3 0.5 5 0.8 1 0.2 11 1.9 592 100
Full-time 11 0.8 6 0.5 11 0.8 8 0.6 8 0.6 6 0.5 35 2.6 1,330 100All 18 0.9 11 0.6 14 0.7 11 0.6 13 0.7 7 0.4 46 2.4 1,922 100
UC Part-time 1 0.2 3 0.7 3 0.7 4 0.9 1 0.2 2 0.5 4 0.9 437 100Full-time 37 1.3 27 0.9 21 0.7 21 0.7 21 0.7 19 0.7 40 1.4 2,872 100All 38 1.1 30 0.9 24 0.7 25 0.8 22 0.7 21 0.6 44 1.3 3,309 100
CSU Part-time 2 0.9 - - 1 0.5 2 0.9 - - - - 3 1.4 216 100Full-time 19 1.0 15 0.8 9 0.5 20 1.1 12 0.6 4 0.2 30 1.6 1,855 100All 21 1.0 15 0.7 10 0.5 22 1.1 12 0.6 4 0.2 33 1.6 2,071 100
ICU Part-time 9 6.3 7 4.9 2 1.4 6 4.2 7 4.9 3 2.1 8 5.6 142 100Full-time 70 3.6 72 3.7 37 1.9 56 2.9 33 1.7 17 0.9 82 4.2 1,933 100All 79 3.8 79 3.8 39 1.9 62 3.0 40 1.9 20 1.0 90 4.3 2,075 100
PCC Part-time 4 1.6 7 2.7 1 0.4 4 - 2 0.8 1 0.4 4 1.6 255 100Full-time 10 1.0 6 0.6 9 0.9 7 0.7 7 0.7 7 0.7 21 2.2 958 100All 14 1.2 13 1.1 10 0.8 11 0.9 9 0.7 8 0.7 25 2.1 1,213 100
ALL Part-time 23 1.4 22 1.3 10 0.6 19 1.2 15 0.9 7 0.4 30 1.8 1,642 100Full-time 147 1.6 126 1.4 87 1.0 112 1.3 81 0.9 53 0.6 208 2.3 8,948 100All 170 1.6 148 1.4 97 0.9 131 1.2 96 0.9 60 0.6 238 2.2 10,590 100
$540 to $674
Live With Parent(s) Under $135NothingDoes Not Apply
TABLE U-50A: TRAVEL EXPENSES OUTSIDE CALIFORNIA BY SEGMENT, COURSE LOAD, AND DEPENDENCY STATUS
$1,350 or More$1,215 to $1,349$1,080 to $1,214$945 to $1,079$810 to $944$675 to $809
$405 to $539$270 to $404$135 to $269
Source: California Student Aid Commission 326 2003-04 SEARS

(TO AND FROM PARENTS)
INDEPENDENT UNDERGRADUATES
# % # % # % # % # % # % # %CCC Part-time 555 65.4 37 4.4 75 8.8 7 0.8 24 2.8 21 2.5 19 2.2
Full-time 399 57.3 50 7.2 58 8.3 16 2.3 20 2.9 22 3.2 11 1.6 All 954 61.8 87 5.6 133 8.6 23 1.5 44 2.8 43 2.8 30 1.9
UC Part-time 53 78 1 1 4 5.9 1 1.5 2 2.9 4 5.9 1 1.5 Full-time 252 75 5 1 18 5.3 3 0.9 4 1.2 7 2.1 12 3.6 All 305 75 6 1 22 5.4 4 1.0 6 1.5 11 2.7 13 3.2
CSU Part-time 450 78.4 13 2.3 34 5.9 3 0.5 11 1.9 13 2.3 6 1.0 Full-time 808 74.5 36 3.3 64 5.9 16 1.5 21 1.9 24 2.2 25 2.3 All 1,258 75.8 49 3.0 98 5.9 19 1.1 32 1.9 37 2.2 31 1.9
ICU Part-time 102 67.5 9 6.0 10 6.6 - - 2 1.3 5 3.3 7 4.6 Full-time 216 63.0 26 7.6 14 4.1 9 2.6 7 2.0 18 5.2 11 3.2 All 318 64.4 35 7.1 24 4.9 9 1.8 9 1.8 23 4.7 18 3.6
PCC Part-time 420 69.1 109 17.9 16 2.6 5 0.8 6 1.0 7 1.2 8 1.3 Full-time 1,200 67.4 322 18.1 71 4.0 29 1.6 22 1.2 23 1.3 17 1.0 All 1,620 67.8 431 18.0 87 3.6 34 1.4 28 1.2 30 1.3 25 1.0
ALL Part-time 1,580 70.3 169 7.5 139 6.2 16 0.7 45 2.0 50 2.2 41 1.8 Full-time 2,875 67.8 439 10.4 225 5.3 73 1.7 74 1.7 94 2.2 76 1.8 All 4,455 68.6 608 9.4 364 5.6 89 1.4 119 1.8 144 2.2 117 1.8
Total
# % # % # % # % # % # % # % # %CCC Part-time 13 1.5 11 1.3 6 0.7 21 2.5 14 1.7 6 0.7 39 4.6 848 100
Full-time 12 1.7 13 1.9 14 2.0 10 1.4 11 1.6 10 1.4 50 7.2 696 100All 25 1.6 24 1.6 20 1.3 31 2.0 25 1.6 16 1.0 89 5.8 1,544 100
UC Part-time - - 1 1.5 - - - - - - - - 1 1.5 68 100Full-time 11 3.3 6 1.8 3 0.9 1 0.3 5 1.5 2 0.6 8 2.4 337 100All 11 2.7 7 1.7 3 0.7 1 0.2 5 1.2 2 0.5 9 2.2 405 100
CSU Part-time 5 0.9 8 1.4 8 1.4 5 0.9 5 0.9 - - 13 2.3 574 100Full-time 21 1.9 12 1.1 10 0.9 8 0.7 11 1.0 1 0.1 28 2.6 1,085 100All 26 1.6 20 1.2 18 1.1 13 0.8 16 1.0 1 0.1 41 2.5 1,659 100
ICU Part-time 2 1.3 5 3.3 2 1.3 2 1.3 1 0.7 - - 4 2.6 151 100Full-time 8 2.3 11 3.2 6 1.7 6 1.7 2 0.6 - - 9 2.6 343 100All 10 2.0 16 3.2 8 1.6 8 1.6 3 0.6 - - 13 2.6 494 100
PCC Part-time 5 0.8 7 1.2 3 0.5 5 - 6 1.0 2 0.3 9 1.5 608 100Full-time 12 0.7 12 0.7 8 0.4 9 0.5 6 0.3 4 0.2 45 2.5 1,780 100All 17 0.7 19 0.8 11 0.5 14 0.6 12 0.5 6 0.3 54 2.3 2,388 100
ALL Part-time 25 1.1 32 1.4 19 0.8 33 1.5 26 1.2 8 0.4 66 2.9 2,249 100Full-time 64 1.5 54 1.3 41 1.0 34 0.8 35 0.8 17 0.4 140 3.3 4,241 100All 89 1.4 86 1.3 60 0.9 67 1.0 61 0.9 25 0.4 206 3.2 6,490 100
$1,080 to $1,214 $1,215 to $1,349 $1,350 or More$540 to $674 $675 to $809 $810 to $944 $945 to $1,079
Does Not Apply
TABLE U-50B: TRAVEL EXPENSES OUTSIDE CALIFORNIA BY SEGMENT, COURSE LOAD, AND DEPENDENCY STATUS
Live With Parent(s) Nothing Under $135 $135 to $269 $270 to $404 $405 to $539
Source: California Student Aid Commission 327 2003-04 SEARS

(TO AND FROM PARENTS)
ALL UNDERGRADUATES
# % # % # % # % # % # % # %ALL Part-time 2,562 65.8 492 12.6 239 6.1 47 1.2 67 1.7 84 2.2 65 1.7
Full-time 8,860 67.2 1,557 11.8 534 4.0 242 1.8 252 1.9 301 2.3 244 1.9 All 11,422 66.9 2,049 12.0 773 4.5 289 1.7 319 1.9 385 2.3 309 1.8
Total
# % # % # % # % # % # % # % # %ALL Part-time 48 1.2 54 1.4 29 0.7 52 1.3 41 1.1 15 0.4 96 2.5 3,891 100
Full-time 211 1.6 180 1.4 128 1.0 146 1.1 116 0.9 70 0.5 348 2.6 13,189 100All 259 1.5 234 1.4 157 0.9 198 1.2 157 0.9 85 0.5 444 2.6 17,080 100
$1,080 to $1,214 $1,215 to $1,349 $1,350 or More$540 to $674 $675 to $809 $810 to $944 $945 to $1,079
TABLE U-50C: TRAVEL EXPENSES OUTSIDE CALIFORNIA BY SEGMENT, COURSE LOAD, AND DEPENDENCY STATUS
Does Not Apply Live With Parent(s) Nothing Under $135 $135 to $269 $270 to $404 $405 to $539
Source: California Student Aid Commission 328 2003-04 SEARS
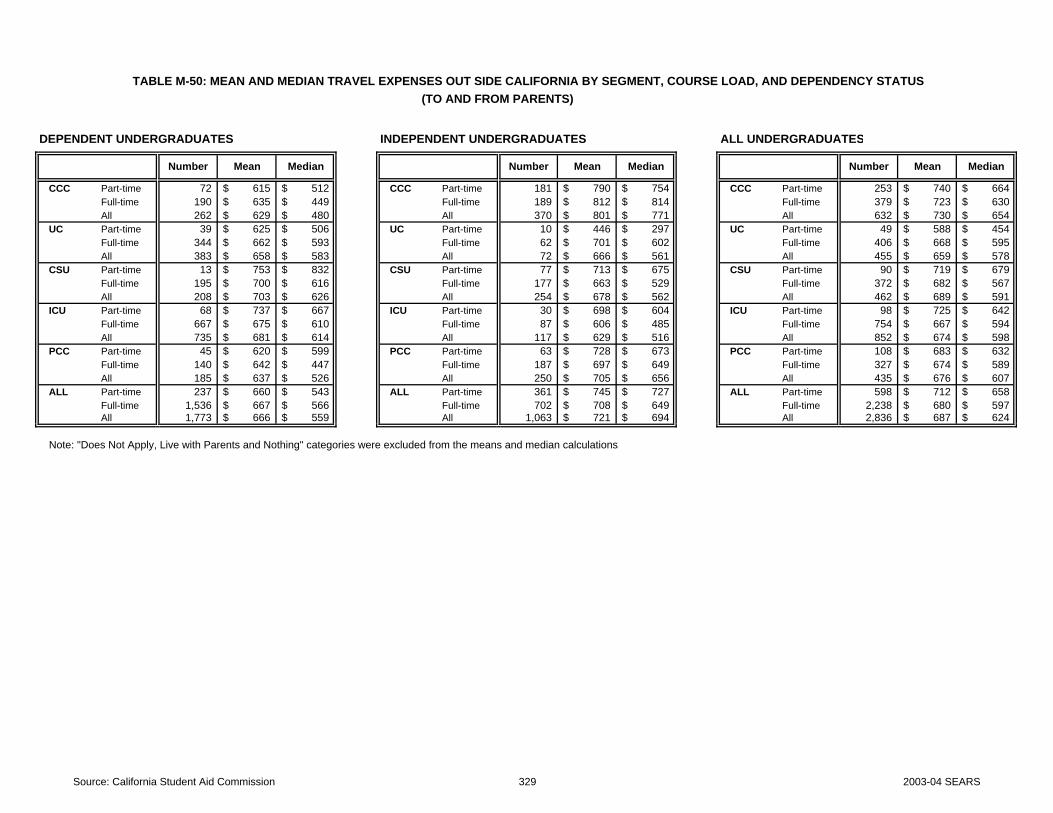
DEPENDENT UNDERGRADUATES INDEPENDENT UNDERGRADUATES ALL UNDERGRADUATES
CCC Part-time 72 615$ 512$ CCC Part-time 181 790$ 754$ CCC Part-time 253 740$ 664$ Full-time 190 635$ 449$ Full-time 189 812$ 814$ Full-time 379 723$ 630$ All 262 629$ 480$ All 370 801$ 771$ All 632 730$ 654$
UC Part-time 39 625$ 506$ UC Part-time 10 446$ 297$ UC Part-time 49 588$ 454$ Full-time 344 662$ 593$ Full-time 62 701$ 602$ Full-time 406 668$ 595$ All 383 658$ 583$ All 72 666$ 561$ All 455 659$ 578$
CSU Part-time 13 753$ 832$ CSU Part-time 77 713$ 675$ CSU Part-time 90 719$ 679$ Full-time 195 700$ 616$ Full-time 177 663$ 529$ Full-time 372 682$ 567$
All 208 703$ 626$ All 254 678$ 562$ All 462 689$ 591$ ICU Part-time 68 737$ 667$ ICU Part-time 30 698$ 604$ ICU Part-time 98 725$ 642$ Full-time 667 675$ 610$ Full-time 87 606$ 485$ Full-time 754 667$ 594$
All 735 681$ 614$ All 117 629$ 516$ All 852 674$ 598$ PCC Part-time 45 620$ 599$ PCC Part-time 63 728$ 673$ PCC Part-time 108 683$ 632$ Full-time 140 642$ 447$ Full-time 187 697$ 649$ Full-time 327 674$ 589$
All 185 637$ 526$ All 250 705$ 656$ All 435 676$ 607$ ALL Part-time 237 660$ 543$ ALL Part-time 361 745$ 727$ ALL Part-time 598 712$ 658$
Full-time 1,536 667$ 566$ Full-time 702 708$ 649$ Full-time 2,238 680$ 597$ All 1,773 666$ 559$ All 1,063 721$ 694$ All 2,836 687$ 624$
Note: "Does Not Apply, Live with Parents and Nothing" categories were excluded from the means and median calculations.
Mean Median Number Mean
TABLE M-50: MEAN AND MEDIAN TRAVEL EXPENSES OUT SIDE CALIFORNIA BY SEGMENT, COURSE LOAD, AND DEPENDENCY STATUS(TO AND FROM PARENTS)
Number Mean Median Number Median
Source: California Student Aid Commission 329 2003-04 SEARS

Question for Table: W-51, U-51, and M-51
What are your monthly average expenses for medical and dental costs not covered by insurance
(e.g., co-payments, medication, and deductibles) during the current academic year? 00 Nothing 03 $20 to $29 06 $50 to $64 09 $95 to $104 01 Under $10 04 $30 to $39 07 $65 to $79 10 $105 to $119 02 $10 to $19 05 $40 to $49 08 $80 to $94 11 $120 or more
330 2003-04 SEARS
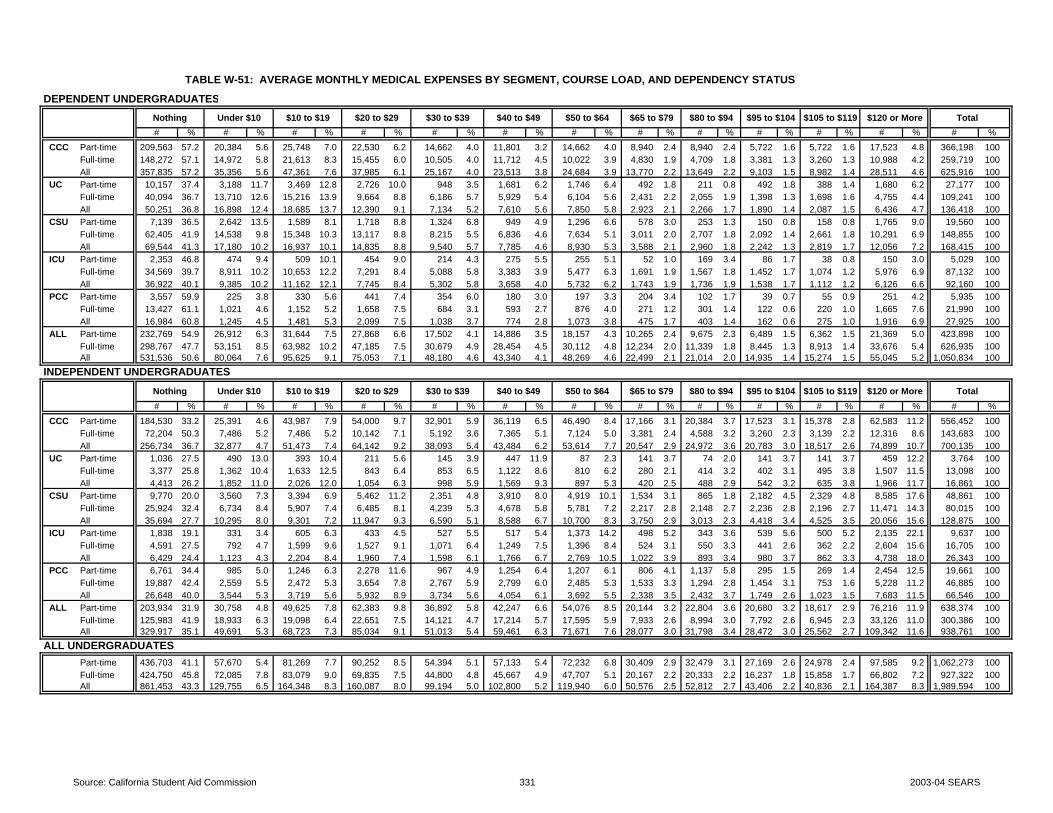
TABLE W-51: AVERAGE MONTHLY MEDICAL EXPENSES BY SEGMENT, COURSE LOAD, AND DEPENDENCY STATUS
DEPENDENT UNDERGRADUATES
Nothing Under $10 $10 to $19 $20 to $29 $30 to $39 $40 to $49 $50 to $64 $65 to $79 $80 to $94 $95 to $104 $105 to $119 $120 or More Total# % # % # % # % # % # % # % # % # % # % # % # % # %
CCC Part-time 209,563 57.2 20,384 5.6 25,748 7.0 22,530 6.2 14,662 4.0 11,801 3.2 14,662 4.0 8,940 2.4 8,940 2.4 5,722 1.6 5,722 1.6 17,523 4.8 366,198 100 Full-time 148,272 57.1 14,972 5.8 21,613 8.3 15,455 6.0 10,505 4.0 11,712 4.5 10,022 3.9 4,830 1.9 4,709 1.8 3,381 1.3 3,260 1.3 10,988 4.2 259,719 100 All 357,835 57.2 35,356 5.6 47,361 7.6 37,985 6.1 25,167 4.0 23,513 3.8 24,684 3.9 13,770 2.2 13,649 2.2 9,103 1.5 8,982 1.4 28,511 4.6 625,916 100
UC Part-time 10,157 37.4 3,188 11.7 3,469 12.8 2,726 10.0 948 3.5 1,681 6.2 1,746 6.4 492 1.8 211 0.8 492 1.8 388 1.4 1,680 6.2 27,177 100 Full-time 40,094 36.7 13,710 12.6 15,216 13.9 9,664 8.8 6,186 5.7 5,929 5.4 6,104 5.6 2,431 2.2 2,055 1.9 1,398 1.3 1,698 1.6 4,755 4.4 109,241 100 All 50,251 36.8 16,898 12.4 18,685 13.7 12,390 9.1 7,134 5.2 7,610 5.6 7,850 5.8 2,923 2.1 2,266 1.7 1,890 1.4 2,087 1.5 6,436 4.7 136,418 100
CSU Part-time 7,139 36.5 2,642 13.5 1,589 8.1 1,718 8.8 1,324 6.8 949 4.9 1,296 6.6 578 3.0 253 1.3 150 0.8 158 0.8 1,765 9.0 19,560 100 Full-time 62,405 41.9 14,538 9.8 15,348 10.3 13,117 8.8 8,215 5.5 6,836 4.6 7,634 5.1 3,011 2.0 2,707 1.8 2,092 1.4 2,661 1.8 10,291 6.9 148,855 100
All 69,544 41.3 17,180 10.2 16,937 10.1 14,835 8.8 9,540 5.7 7,785 4.6 8,930 5.3 3,588 2.1 2,960 1.8 2,242 1.3 2,819 1.7 12,056 7.2 168,415 100 ICU Part-time 2,353 46.8 474 9.4 509 10.1 454 9.0 214 4.3 275 5.5 255 5.1 52 1.0 169 3.4 86 1.7 38 0.8 150 3.0 5,029 100 Full-time 34,569 39.7 8,911 10.2 10,653 12.2 7,291 8.4 5,088 5.8 3,383 3.9 5,477 6.3 1,691 1.9 1,567 1.8 1,452 1.7 1,074 1.2 5,976 6.9 87,132 100
All 36,922 40.1 9,385 10.2 11,162 12.1 7,745 8.4 5,302 5.8 3,658 4.0 5,732 6.2 1,743 1.9 1,736 1.9 1,538 1.7 1,112 1.2 6,126 6.6 92,160 100 PCC Part-time 3,557 59.9 225 3.8 330 5.6 441 7.4 354 6.0 180 3.0 197 3.3 204 3.4 102 1.7 39 0.7 55 0.9 251 4.2 5,935 100 Full-time 13,427 61.1 1,021 4.6 1,152 5.2 1,658 7.5 684 3.1 593 2.7 876 4.0 271 1.2 301 1.4 122 0.6 220 1.0 1,665 7.6 21,990 100
All 16,984 60.8 1,245 4.5 1,481 5.3 2,099 7.5 1,038 3.7 774 2.8 1,073 3.8 475 1.7 403 1.4 162 0.6 275 1.0 1,916 6.9 27,925 100 ALL Part-time 232,769 54.9 26,912 6.3 31,644 7.5 27,868 6.6 17,502 4.1 14,886 3.5 18,157 4.3 10,265 2.4 9,675 2.3 6,489 1.5 6,362 1.5 21,369 5.0 423,898 100
Full-time 298,767 47.7 53,151 8.5 63,982 10.2 47,185 7.5 30,679 4.9 28,454 4.5 30,112 4.8 12,234 2.0 11,339 1.8 8,445 1.3 8,913 1.4 33,676 5.4 626,935 100 All 531,536 50.6 80,064 7.6 95,625 9.1 75,053 7.1 48,180 4.6 43,340 4.1 48,269 4.6 22,499 2.1 21,014 2.0 14,935 1.4 15,274 1.5 55,045 5.2 1,050,834 100
INDEPENDENT UNDERGRADUATES
Nothing Under $10 $10 to $19 $20 to $29 $30 to $39 $40 to $49 $50 to $64 $65 to $79 $80 to $94 $95 to $104 $105 to $119 $120 or More Total# % # % # % # % # % # % # % # % # % # % # % # % # %
CCC Part-time 184,530 33.2 25,391 4.6 43,987 7.9 54,000 9.7 32,901 5.9 36,119 6.5 46,490 8.4 17,166 3.1 20,384 3.7 17,523 3.1 15,378 2.8 62,583 11.2 556,452 100 Full-time 72,204 50.3 7,486 5.2 7,486 5.2 10,142 7.1 5,192 3.6 7,365 5.1 7,124 5.0 3,381 2.4 4,588 3.2 3,260 2.3 3,139 2.2 12,316 8.6 143,683 100 All 256,734 36.7 32,877 4.7 51,473 7.4 64,142 9.2 38,093 5.4 43,484 6.2 53,614 7.7 20,547 2.9 24,972 3.6 20,783 3.0 18,517 2.6 74,899 10.7 700,135 100
UC Part-time 1,036 27.5 490 13.0 393 10.4 211 5.6 145 3.9 447 11.9 87 2.3 141 3.7 74 2.0 141 3.7 141 3.7 459 12.2 3,764 100 Full-time 3,377 25.8 1,362 10.4 1,633 12.5 843 6.4 853 6.5 1,122 8.6 810 6.2 280 2.1 414 3.2 402 3.1 495 3.8 1,507 11.5 13,098 100 All 4,413 26.2 1,852 11.0 2,026 12.0 1,054 6.3 998 5.9 1,569 9.3 897 5.3 420 2.5 488 2.9 542 3.2 635 3.8 1,966 11.7 16,861 100
CSU Part-time 9,770 20.0 3,560 7.3 3,394 6.9 5,462 11.2 2,351 4.8 3,910 8.0 4,919 10.1 1,534 3.1 865 1.8 2,182 4.5 2,329 4.8 8,585 17.6 48,861 100 Full-time 25,924 32.4 6,734 8.4 5,907 7.4 6,485 8.1 4,239 5.3 4,678 5.8 5,781 7.2 2,217 2.8 2,148 2.7 2,236 2.8 2,196 2.7 11,471 14.3 80,015 100
All 35,694 27.7 10,295 8.0 9,301 7.2 11,947 9.3 6,590 5.1 8,588 6.7 10,700 8.3 3,750 2.9 3,013 2.3 4,418 3.4 4,525 3.5 20,056 15.6 128,875 100 ICU Part-time 1,838 19.1 331 3.4 605 6.3 433 4.5 527 5.5 517 5.4 1,373 14.2 498 5.2 343 3.6 539 5.6 500 5.2 2,135 22.1 9,637 100 Full-time 4,591 27.5 792 4.7 1,599 9.6 1,527 9.1 1,071 6.4 1,249 7.5 1,396 8.4 524 3.1 550 3.3 441 2.6 362 2.2 2,604 15.6 16,705 100
All 6,429 24.4 1,123 4.3 2,204 8.4 1,960 7.4 1,598 6.1 1,766 6.7 2,769 10.5 1,022 3.9 893 3.4 980 3.7 862 3.3 4,738 18.0 26,343 100 PCC Part-time 6,761 34.4 985 5.0 1,246 6.3 2,278 11.6 967 4.9 1,254 6.4 1,207 6.1 806 4.1 1,137 5.8 295 1.5 269 1.4 2,454 12.5 19,661 100 Full-time 19,887 42.4 2,559 5.5 2,472 5.3 3,654 7.8 2,767 5.9 2,799 6.0 2,485 5.3 1,533 3.3 1,294 2.8 1,454 3.1 753 1.6 5,228 11.2 46,885 100
All 26,648 40.0 3,544 5.3 3,719 5.6 5,932 8.9 3,734 5.6 4,054 6.1 3,692 5.5 2,338 3.5 2,432 3.7 1,749 2.6 1,023 1.5 7,683 11.5 66,546 100 ALL Part-time 203,934 31.9 30,758 4.8 49,625 7.8 62,383 9.8 36,892 5.8 42,247 6.6 54,076 8.5 20,144 3.2 22,804 3.6 20,680 3.2 18,617 2.9 76,216 11.9 638,374 100
Full-time 125,983 41.9 18,933 6.3 19,098 6.4 22,651 7.5 14,121 4.7 17,214 5.7 17,595 5.9 7,933 2.6 8,994 3.0 7,792 2.6 6,945 2.3 33,126 11.0 300,386 100 All 329,917 35.1 49,691 5.3 68,723 7.3 85,034 9.1 51,013 5.4 59,461 6.3 71,671 7.6 28,077 3.0 31,798 3.4 28,472 3.0 25,562 2.7 109,342 11.6 938,761 100
ALL UNDERGRADUATESPart-time 436,703 41.1 57,670 5.4 81,269 7.7 90,252 8.5 54,394 5.1 57,133 5.4 72,232 6.8 30,409 2.9 32,479 3.1 27,169 2.6 24,978 2.4 97,585 9.2 1,062,273 100 Full-time 424,750 45.8 72,085 7.8 83,079 9.0 69,835 7.5 44,800 4.8 45,667 4.9 47,707 5.1 20,167 2.2 20,333 2.2 16,237 1.8 15,858 1.7 66,802 7.2 927,322 100 All 861,453 43.3 129,755 6.5 164,348 8.3 160,087 8.0 99,194 5.0 102,800 5.2 119,940 6.0 50,576 2.5 52,812 2.7 43,406 2.2 40,836 2.1 164,387 8.3 1,989,594 100
Source: California Student Aid Commission 331 2003-04 SEARS

TABLE U-51: AVERAGE MONTHLY MEDICAL EXPENSES BY SEGMENT, COURSE LOAD, AND DEPENDENCY STATUS
DEPENDENT UNDERGRADUATES
Nothing Under $10 $10 to $19 $20 to $29 $30 to $39 $40 to $49 $50 to $64 $65 to $79 $80 to $94 $95 to $104 $105 to $119 $120 or More Total# % # % # % # % # % # % # % # % # % # % # % # % # %
CCC Part-time 586 57.2 57 5.6 72 7.0 63 6.2 41 4.0 33 3.2 41 4.0 25 2.4 25 2.4 16 1.6 16 1.6 49 4.8 1,024 100 Full-time 1,228 57.1 124 5.8 179 8.3 128 6.0 87 4.0 97 4.5 83 3.9 40 1.9 39 1.8 28 1.3 27 1.3 91 4.2 2,151 100 All 1,814 57.1 181 5.7 251 7.9 191 6.0 128 4.0 130 4.1 124 3.9 65 2.0 64 2.0 44 1.4 43 1.4 140 4.4 3,175 100
UC Part-time 169 38.5 52 11.8 54 12.3 44 10.0 16 3.6 25 5.7 28 6.4 7 1.6 3 0.7 7 1.6 6 1.4 28 6.4 439 100 Full-time 1,054 36.6 363 12.6 399 13.9 259 9.0 160 5.6 157 5.5 160 5.6 65 2.3 55 1.9 38 1.3 44 1.5 126 4.4 2,880 100 All 1,223 36.8 415 12.5 453 13.6 303 9.1 176 5.3 182 5.5 188 5.7 72 2.2 58 1.7 45 1.4 50 1.5 154 4.6 3,319 100
CSU Part-time 75 34.6 27 12.4 19 8.8 21 9.7 12 5.5 12 5.5 17 7.8 7 3.2 3 1.4 2 0.9 1 0.5 21 9.7 217 100 Full-time 783 42.1 180 9.7 197 10.6 166 8.9 93 5.0 86 4.6 98 5.3 34 1.8 31 1.7 29 1.6 29 1.6 134 7.2 1,860 100
All 858 41.3 207 10.0 216 10.4 187 9.0 105 5.1 98 4.7 115 5.5 41 2.0 34 1.6 31 1.5 30 1.4 155 7.5 2,077 100 ICU Part-time 61 41.8 17 11.6 14 9.6 11 7.5 10 6.8 8 5.5 6 4.1 3 2.1 5 3.4 3 2.1 1 0.7 7 4.8 146 100 Full-time 769 39.6 214 11.0 242 12.5 165 8.5 104 5.4 81 4.2 118 6.1 38 2.0 37 1.9 29 1.5 25 1.3 121 6.2 1,943 100
All 830 39.7 231 11.1 256 12.3 176 8.4 114 5.5 89 4.3 124 5.9 41 2.0 42 2.0 32 1.5 26 1.2 128 6.1 2,089 100 PCC Part-time 162 60.2 12 4.5 17 6.3 19 7.1 11 4.1 10 3.7 7 2.6 6 2.2 7 2.6 3 1.1 2 0.7 13 4.8 269 100 Full-time 618 61.1 50 4.9 62 6.1 58 5.7 36 3.6 30 3.0 44 4.4 14 1.4 23 2.3 6 0.6 12 1.2 58 5.7 1,011 100
All 780 60.9 62 4.8 79 6.2 77 6.0 47 3.7 40 3.1 51 4.0 20 1.6 30 2.3 9 0.7 14 1.1 71 5.5 1,280 100 ALL Part-time 1,053 50.3 165 7.9 176 8.4 158 7.5 90 4.3 88 4.2 99 4.7 48 2.3 43 2.1 31 1.5 26 1.2 118 5.6 2,095 100
Full-time 4,452 45.2 931 9.5 1,079 11.0 776 7.9 480 4.9 451 4.6 503 5.1 191 1.9 185 1.9 130 1.3 137 1.4 530 5.4 9,845 100 All 5,505 46.1 1,096 9.2 1,255 10.5 934 7.8 570 4.8 539 4.5 602 5.0 239 2.0 228 1.9 161 1.3 163 1.4 648 5.4 11,940 100
INDEPENDENT UNDERGRADUATES
Nothing Under $10 $10 to $19 $20 to $29 $30 to $39 $40 to $49 $50 to $64 $65 to $79 $80 to $94 $95 to $104 $105 to $119 $120 or More Total# % # % # % # % # % # % # % # % # % # % # % # % # %
CCC Part-time 516 33.2 71 4.6 123 7.9 151 9.7 92 5.9 101 6.5 130 8.4 48 3.1 57 3.7 49 3.1 43 2.8 175 11.2 1,556 100 Full-time 598 50.3 62 5.2 62 5.2 84 7.1 43 3.6 61 5.1 59 5.0 28 2.4 38 3.2 27 2.3 26 2.2 102 8.6 1,190 100 All 1,114 40.6 133 4.8 185 6.7 235 8.6 135 4.9 162 5.9 189 6.9 76 2.8 95 3.5 76 2.8 69 2.5 277 10.1 2,746 100
UC Part-time 20 29.0 10 14.5 7 10.1 3 4.3 3 4.3 8 11.6 2 2.9 2 2.9 2 2.9 2 2.9 2 2.9 8 11.6 69 100 Full-time 90 26.5 35 10.3 42 12.4 22 6.5 21 6.2 30 8.8 20 5.9 7 2.1 11 3.2 10 2.9 12 3.5 40 11.8 340 100 All 110 26.9 45 11.0 49 12.0 25 6.1 24 5.9 38 9.3 22 5.4 9 2.2 13 3.2 12 2.9 14 3.4 48 11.7 409 100
CSU Part-time 121 20.8 42 7.2 43 7.4 64 11.0 32 5.5 49 8.4 47 8.1 19 3.3 13 2.2 24 4.1 27 4.6 101 17.4 582 100 Full-time 340 31.0 84 7.7 77 7.0 91 8.3 62 5.7 67 6.1 79 7.2 33 3.0 35 3.2 30 2.7 31 2.8 167 15.2 1,096 100
All 461 27.5 126 7.5 120 7.2 155 9.2 94 5.6 116 6.9 126 7.5 52 3.1 48 2.9 54 3.2 58 3.5 268 16.0 1,678 100 ICU Part-time 33 20.9 7 4.4 11 7.0 7 4.4 10 6.3 8 5.1 25 15.8 8 5.1 6 3.8 9 5.7 9 5.7 25 15.8 158 100 Full-time 94 27.4 15 4.4 32 9.3 32 9.3 21 6.1 26 7.6 29 8.5 12 3.5 12 3.5 9 2.6 8 2.3 53 15.5 343 100
All 127 25.3 22 4.4 43 8.6 39 7.8 31 6.2 34 6.8 54 10.8 20 4.0 18 3.6 18 3.6 17 3.4 78 15.6 501 100 PCC Part-time 216 39.3 27 4.9 26 4.7 38 6.9 26 4.7 34 6.2 47 8.5 21 3.8 26 4.7 12 2.2 9 1.6 68 12.4 550 100 Full-time 805 48.7 67 4.1 75 4.5 97 5.9 91 5.5 78 4.7 86 5.2 51 3.1 58 3.5 42 2.5 34 2.1 170 10.3 1,654 100
All 1,021 46.3 94 4.3 101 4.6 135 6.1 117 5.3 112 5.1 133 6.0 72 3.3 84 3.8 54 2.5 43 2.0 238 10.8 2,204 100 ALL Part-time 906 31.1 157 5.4 210 7.2 263 9.0 163 5.6 200 6.9 251 8.6 98 3.4 104 3.6 96 3.3 90 3.1 377 12.9 2,915 100
Full-time 1,927 41.7 263 5.7 288 6.2 326 7.1 238 5.1 262 5.7 273 5.9 131 2.8 154 3.3 118 2.6 111 2.4 532 11.5 4,623 100 All 2,833 37.6 420 5.6 498 6.6 589 7.8 401 5.3 462 6.1 524 7.0 229 3.0 258 3.4 214 2.8 201 2.7 909 12.1 7,538 100
ALL UNDERGRADUATESPart-time 1,959 39.1 322 6.4 386 7.7 421 8.4 253 5.0 288 5.7 350 7.0 146 2.9 147 2.9 127 2.5 116 2.3 495 9.9 5,010 100 Full-time 6,379 44.1 1,194 8.3 1,367 9.4 1,102 7.6 718 5.0 713 4.9 776 5.4 322 2.2 339 2.3 248 1.7 248 1.7 1,062 7.3 14,468 100 All 8,338 42.8 1,516 7.8 1,753 9.0 1,523 7.8 971 5.0 1,001 5.1 1,126 5.8 468 2.4 486 2.5 375 1.9 364 1.9 1,557 8.0 19,478 100
Source: California Student Aid Commission 332 2003-04 SEARS

DEPENDENT UNDERGRADUATES INDEPENDENT UNDERGRADUATES ALL UNDERGRADUATES
CCC Part-time 438 50$ 36$ CCC Part-time 1,040 59$ 47$ CCC Part-time 1,478 57$ 44$ Full-time 923 46$ 33$ Full-time 592 59$ 46$ Full-time 1,515 51$ 38$ All 1,361 47$ 34$ All 1,632 59$ 47$ All 2,993 54$ 42$
UC Part-time 270 41$ 26$ UC Part-time 49 53$ 42$ UC Part-time 319 43$ 27$ Full-time 1,826 39$ 25$ Full-time 250 54$ 41$ Full-time 2,076 40$ 26$ All 2,096 39$ 25$ All 299 54$ 41$ All 2,395 41$ 26$
CSU Part-time 142 47$ 31$ CSU Part-time 461 64$ 52$ CSU Part-time 603 60$ 47$ Full-time 1,077 46$ 29$ Full-time 756 62$ 47$ Full-time 1,833 52$ 36$
All 1,219 46$ 30$ All 1,217 63$ 49$ All 2,436 54$ 39$ ICU Part-time 85 42$ 27$ ICU Part-time 125 70$ 67$ ICU Part-time 210 59$ 57$ Full-time 1,174 43$ 28$ Full-time 249 62$ 48$ Full-time 1,423 46$ 32$
All 1,259 65$ 28$ All 374 65$ 56$ All 1,633 48$ 35$ PCC Part-time 107 49$ 34$ PCC Part-time 334 64$ 47$ PCC Part-time 441 60$ 45$ Full-time 393 51$ 36$ Full-time 849 64$ 47$ Full-time 1,242 60$ 45$
All 500 51$ 35$ All 1,183 64$ 47$ All 1,683 60$ 45$ ALL Part-time 1,042 47$ 34$ ALL Part-time 2,009 62$ 48$ ALL Part-time 3,051 56$ 44$
Full-time 5,393 43$ 29$ Full-time 2,696 61$ 46$ Full-time 8,089 49$ 35$ All 6,435 44$ 31$ All 4,705 61$ 47$ All 11,140 51$ 40$
Note: "Nothing" category was excluded from the means and median calculations.
TABLE M-51: MEAN AND MEDIAN AVERAGE MONTHLY MEDICAL EXPENSES BY SEGMENT, COURSE LOAD, AND DEPENDENCY STATUS
Number Mean Median Number MedianMean Median Number Mean
Source: California Student Aid Commission 333 2003-04 SEARS

Question for Tables: W-52, U-52, and M-52
What are your monthly expenses for child care while participating in education-related activities
during the current academic year (e.g., studying, attending classes, fieldwork, commuting, and internships)?
00 I do not have children 05 $150 to $199 10 $400 to $449 15 $650 to $699 01 Nothing 06 $200 to $249 11 $450 to $499 16 $700 to $749 02 Under $50 07 $250 to $299 12 $500 to $549 17 $750 to $799 03 $50 to $99 08 $300 to $349 13 $550 to $599 18 $800 to $999 04 $100 to $149 09 $350 to $399 14 $600 to $649 19 $1,000 or more
334 2003-04 SEARS

By definition, a dependent student does not have any dependents.
INDEPENDENT UNDERGRADUATES
Nothing Under $50 $50 to $99 $100 to $149 $150 to $199 $200 to $249 $250 to $$299 $300 to $349 $350 to $399
# % # % # % # % # % # % # % # % # % # %CCC Part-time 247,828 47.3 114,437 21.8 18,238 3.5 15,735 3.0 20,027 3.8 11,801 2.3 18,954 3.6 8,940 1.7 11,444 2.2 8,225 1.6
Full-time 76,792 55.3 24,752 17.8 4,105 3.0 4,105 3.0 3,985 2.9 3,502 2.5 4,468 3.2 3,260 2.3 1,932 1.4 2,173 1.6 All 324,620 49.0 139,189 21.0 22,343 3.4 19,840 3.0 24,012 3.6 15,303 2.3 23,422 3.5 12,200 1.8 13,376 2.0 10,399 1.6
UC Part-time 2,576 69.7 417 11.3 167 4.5 178 4.8 141 3.8 - - - - - - - - - - Full-time 10,932 81.6 1,095 8.2 83 0.6 130 1.0 40 0.3 139 1.0 37 0.3 81 0.6 124 0.9 78 0.6 All 13,508 79.0 1,512 8.8 250 1.5 307 1.8 180 1.1 139 0.8 37 0.2 81 0.5 124 0.7 78 0.5
CSU Part-time 29,522 63.2 8,079 17.3 963 2.1 1,288 2.8 812 1.7 718 1.5 490 1.0 138 0.3 438 0.9 385 0.8 Full-time 51,984 67.0 10,101 13.0 2,223 2.9 1,982 2.6 2,356 3.0 673 0.9 1,020 1.3 1,194 1.5 1,077 1.4 832 1.1
All 81,506 65.6 18,180 14.6 3,186 2.6 3,270 2.6 3,168 2.5 1,392 1.1 1,510 1.2 1,332 1.1 1,515 1.2 1,218 1.0 ICU Part-time 5,168 52.9 1,882 19.2 91 0.9 133 1.4 303 3.1 266 2.7 900 9.2 119 1.2 106 1.1 80 0.8 Full-time 11,670 68.9 2,357 13.9 193 1.1 349 2.1 378 2.2 312 1.8 80 0.5 257 1.5 77 0.5 48 0.3
All 16,838 63.0 4,239 15.9 285 1.1 482 1.8 681 2.5 579 2.2 980 3.7 376 1.4 183 0.7 128 0.5 PCC Part-time 8,749 46.4 4,082 21.6 855 4.5 594 3.1 310 1.6 791 4.2 558 3.0 371 2.0 435 2.3 198 1.1 Full-time 21,515 47.6 8,381 18.6 993 2.2 1,094 2.4 1,530 3.4 980 2.2 1,756 3.9 1,012 2.2 964 2.1 745 1.7
All 30,264 47.3 12,463 19.5 1,848 2.9 1,688 2.6 1,840 2.9 1,771 2.8 2,314 3.6 1,383 2.2 1,399 2.2 944 1.5 ALL Part-time 293,843 48.7 128,896 21.4 20,314 3.4 17,927 3.0 21,592 3.6 13,577 2.3 20,902 3.5 9,569 1.6 12,423 2.1 8,889 1.5
Full-time 172,893 59.2 46,687 16.0 7,597 2.6 7,660 2.6 8,289 2.8 5,606 1.9 7,361 2.5 5,804 2.0 4,173 1.4 3,876 1.3 All 466,736 52.2 175,583 19.6 27,911 3.1 25,587 2.9 29,880 3.3 19,183 2.1 28,262 3.2 15,373 1.7 16,597 1.9 12,765 1.4
$500 to $549 $1,000 or More Total
# % # % # % # % # % # % # % # % # % # % # %CCC Part-time 8,225 1.6 6,795 1.3 6,437 1.2 5,722 1.1 5,364 1.0 2,503 0.5 1,073 0.2 358 0.1 2,861 0.5 8,940 1.7 523,908 100
Full-time 2,053 1.5 604 0.4 966 0.7 483 0.3 1,328 1.0 604 0.4 241 0.2 483 0.3 724 0.5 2,415 1.7 138,974 100 All 10,278 1.6 7,398 1.1 7,403 1.1 6,205 0.9 6,692 1.0 3,107 0.5 1,314 0.2 841 0.1 3,585 0.5 11,355 1.7 662,882 100
UC Part-time 70 1.9 - - - - - - - - - - - - - - 75 2.0 70 1.9 3,693 100 Full-time 158 1.2 40 0.3 74 0.6 - - - - 81 0.6 81 0.6 - - 112 0.8 114 0.9 13,397 100 All 228 1.3 40 0.2 74 0.4 - - - - 81 0.5 81 0.5 - - 187 1.1 185 1.1 17,090 100
CSU Part-time 665 1.4 349 0.7 731 1.6 553 1.2 322 0.7 254 0.5 54 0.1 127 0.3 825 1.8 - - 46,713 100 Full-time 848 1.1 149 0.2 1,088 1.4 442 0.6 - - 418 0.5 - - 42 0.1 1,135 1.5 - - 77,565 100
All 1,512 1.2 498 0.4 1,819 1.5 994 0.8 322 0.3 672 0.5 54 0.0 169 0.1 1,960 1.6 - - 124,278 100 ICU Part-time 52 0.5 - - 47 0.5 - - 184 1.9 - - - - - - 150 1.5 296 3.0 9,778 100 Full-time 80 0.5 58 0.3 150 0.9 170 1.0 46 0.3 142 0.8 - - 58 0.3 192 1.1 312 1.8 16,928 100
All 132 0.5 58 0.2 197 0.7 170 0.6 230 0.9 142 0.5 - - 58 0.2 342 1.3 609 2.3 26,706 100 PCC Part-time 345 1.8 27 0.1 189 1.0 - - 132 0.7 67 0.4 54 0.3 36 0.2 59 0.3 1,008 5.3 18,858 100 Full-time 1,052 2.3 658 1.5 1,040 2.3 112 0.2 1,058 2.3 121 0.3 354 0.8 73 0.2 266 0.6 1,463 3.2 45,167 100
All 1,396 2.2 685 1.1 1,229 1.9 112 0.2 1,190 1.9 188 0.3 407 0.6 109 0.2 325 0.5 2,471 3.9 64,025 100 ALL Part-time 9,357 1.6 7,171 1.2 7,404 1.2 6,274 1.0 6,002 1.0 2,824 0.5 1,180 0.2 520 0.1 3,970 0.7 10,315 1.7 602,950 100
Full-time 4,190 1.4 1,507 0.5 3,319 1.1 1,206 0.4 2,433 0.8 1,365 0.5 676 0.2 656 0.2 2,429 0.8 4,305 1.5 292,031 100 All 13,546 1.5 8,679 1.0 10,722 1.2 7,481 0.8 8,435 0.9 4,189 0.5 1,857 0.2 1,176 0.1 6,400 0.7 14,620 1.6 894,981 100
TABLE W-52: AVERAGE MONTHLY CHILD/DEPENDENT CARE EXPENSES BY SEGMENT, COURSE LOAD, AND DEPENDENCY STATUS
Do Not Have Children/Dependents
$600 to $649$400 to $449 $450 to $499 $550 to $599 $650 to $699 $700 to $749 $750 to $799 $800 to $999
Source: California Student Aid Commission 335 2003-04 SEARS

By definition, a dependent student does not have any dependents.
INDEPENDENT UNDERGRADUATES
Nothing Under $50 $50 to $99 $100 to $149 $150 to $199 $200 to $249 $250 to $$299 $300 to $349 $350 to $399
# % # % # % # % # % # % # % # % # % # %CCC Part-time 693 47.3 320 21.8 51 3.5 44 3.0 56 3.8 33 2.3 53 3.6 25 1.7 32 2.2 23 1.6
Full-time 636 55.3 205 17.8 34 3.0 34 3.0 33 2.9 29 2.5 37 3.2 27 2.3 16 1.4 18 1.6 All 1,329 50.8 525 20.1 85 3.2 78 3.0 89 3.4 62 2.4 90 3.4 52 2.0 48 1.8 41 1.6
UC Part-time 48 70.6 8 11.8 3 4.4 3 4.4 2 2.9 - - - - - - - - - - Full-time 284 81.6 28 8.0 2 0.6 4 1.1 1 0.3 4 1.1 1 0.3 2 0.6 3 0.9 2 0.6 All 332 79.8 36 8.7 5 1.2 7 1.7 3 0.7 4 1.0 1 0.2 2 0.5 3 0.7 2 0.5
CSU Part-time 340 61.4 97 17.5 16 2.9 15 2.7 15 2.7 7 1.3 7 1.3 5 0.9 7 1.3 3 0.5 Full-time 719 67.6 137 12.9 27 2.5 24 2.3 31 2.9 13 1.2 17 1.6 18 1.7 13 1.2 10 0.9
All 1,059 65.5 234 14.5 43 2.7 39 2.4 46 2.8 20 1.2 24 1.5 23 1.4 20 1.2 13 0.8 ICU Part-time 92 57.1 31 19.3 2 1.2 1 0.6 5 3.1 5 3.1 6 3.7 2 1.2 2 1.2 2 1.2 Full-time 249 71.8 43 12.4 4 1.2 6 1.7 6 1.7 6 1.7 2 0.6 5 1.4 1 0.3 1 0.3
All 341 67.1 74 14.6 6 1.2 7 1.4 11 2.2 11 2.2 8 1.6 7 1.4 3 0.6 3 0.6 PCC Part-time 265 50.6 107 20.4 8 1.5 10 1.9 9 1.7 16 3.1 11 2.1 14 2.7 14 2.7 5 1.0 Full-time 740 47.2 307 19.6 43 2.7 36 2.3 53 3.4 36 2.3 59 3.8 47 3.0 40 2.6 22 1.4
All 1,005 48.0 414 19.8 51 2.4 46 2.2 62 3.0 52 2.5 70 3.3 61 2.9 54 2.6 27 1.3 ALL Part-time 1,438 51.9 563 20.3 80 2.9 73 2.6 87 3.1 61 2.2 77 2.8 46 1.7 55 2.0 33 1.2
Full-time 2,628 58.7 720 16.1 110 2.5 104 2.3 124 2.8 88 2.0 116 2.6 99 2.2 73 1.6 53 1.2 All 4,066 56.1 1,283 17.7 190 2.6 177 2.4 211 2.9 149 2.1 193 2.7 145 2.0 128 1.8 86 1.2
$500 to $549 $1,000 or More Total
# % # % # % # % # % # % # % # % # % # % # %CCC Part-time 23 1.6 19 1.3 18 1.2 16 1.1 15 1.0 7 0.5 3 0.2 1 0.1 8 0.5 25 1.7 1,465 100
Full-time 17 1.5 5 0.4 8 0.7 4 0.3 11 1.0 5 0.4 2 0.2 4 0.3 6 0.5 20 1.7 1,151 100 All 40 1.5 24 0.9 26 1.0 20 0.8 26 1.0 12 0.5 5 0.2 5 0.2 14 0.5 45 1.7 2,616 100
UC Part-time 1 1.5 - - - - - - - - - - - - - - 2 2.9 1 1.5 68 100 Full-time 4 1.1 1 0.3 2 0.6 - - - - 2 0.6 2 0.6 - - 3 0.9 3 0.9 348 100 All 5 1.2 1 0.2 2 0.5 - - - - 2 0.5 2 0.5 - - 5 1.2 4 1.0 416 100
CSU Part-time 5 0.9 3 0.5 6 1.1 7 1.3 4 0.7 3 0.5 1 0.2 1 0.2 12 2.2 - - 554 100 Full-time 14 1.3 2 0.2 10 0.9 5 0.5 - - 7 0.7 - - 1 0.1 15 1.4 - - 1,063 100
All 19 1.2 5 0.3 16 1.0 12 0.7 4 0.2 10 0.6 1 0.1 2 0.1 27 1.7 - - 1,617 100 ICU Part-time 1 0.6 - - 1 0.6 - - 3 1.9 - - - - - - 2 1.2 6 3.7 161 100 Full-time 2 0.6 1 0.3 3 0.9 3 0.9 1 0.3 3 0.9 - - 1 0.3 3 0.9 7 2.0 347 100
All 3 0.6 1 0.2 4 0.8 3 0.6 4 0.8 3 0.6 - - 1 0.2 5 1.0 13 2.6 508 100 PCC Part-time 12 2.3 2 0.4 10 1.9 - - 8 1.5 3 0.6 4 0.8 2 0.4 3 0.6 21 4.0 524 100 Full-time 35 2.2 13 0.8 25 1.6 7 0.4 19 1.2 6 0.4 11 0.7 4 0.3 14 0.9 51 3.3 1,568 100
All 47 2.2 15 0.7 35 1.7 7 0.3 27 1.3 9 0.4 15 0.7 6 0.3 17 0.8 72 3.4 2,092 100 ALL Part-time 42 1.5 24 0.9 35 1.3 23 0.8 30 1.1 13 0.5 8 0.3 4 0.1 27 1.0 53 1.9 2,772 100
Full-time 72 1.6 22 0.5 48 1.1 19 0.4 31 0.7 23 0.5 15 0.3 10 0.2 41 0.9 81 1.8 4,477 100 All 114 1.6 46 0.6 83 1.1 42 0.6 61 0.8 36 0.5 23 0.3 14 0.2 68 0.9 134 1.8 7,249 100
$800 to $999
TABLE U-52: AVERAGE MONTHLY CHILD/DEPENDENT CARE EXPENSES BY SEGMENT, COURSE LOAD, AND DEPENDENCY STATUS
$600 to $649
Do Not Have Children/Dependents
$400 to $449 $450 to $499 $550 to $599 $650 to $699 $700 to $749 $750 to $799
Source: California Student Aid Commission 336 2003-04 SEARS

DEPENDENT UNDERGRADUATES INDEPENDENT UNDERGRADUATES
CCC Part-time 452 319$ 239$ Full-time 310 318$ 233$ All 762 279$ 238$
UC Part-time 12 323$ 101$ Full-time 36 436$ 383$ All 48 344$ 316$
CSU Part-time 117 329$ 316$ Full-time 207 287$ 224$
All 324 258$ 241$ ICU Part-time 38 425$ 227$ Full-time 55 424$ 294$
All 93 356$ 232$ PCC Part-time 152 436$ 238$ Full-time 521 380$ 315$
All 673 317$ 292$ ALL Part-time 771 349$ 239$
Full-time 1,129 350$ 247$ All 1,900 350$ 241$
Note: "Do Not Have Children/Dependents and Nothing" categories were excluded from the means and median calculations.
does not have any dependents.
TABLE M-52: MEAN AND MEDIAN AVERAGE MONTHLY CHILD/DEPENDENT CARE EXPENSES BY SEGMENT, COURSE LOAD, AND DEPENDENCY STATUS
Mean MedianNumber
By definition, a dependent student
Source: California Student Aid Commission 337 2003-04 SEARS

Question for Tables: W-53, U-53, and M-53
What are your monthly expenses for clothing, shoes, laundry, and hair care during the current
academic year? 00 Under $25 04 $100 to $124 07 $175 to $199 10 $300 to $399 01 $25 to $49 05 $125 to $149 08 $200 to $249 11 $400 to $499 02 $50 to $74 06 $150 to $174 09 $250 to $299 12 $500 or more 03 $75 to $99
338 2003-04 SEARS

TABLE W-53A: MONTHLY OTHER EXPENSES BY SEGMENT, COURSE LOAD, AND DEPENDENCY STATUS
DEPENDENT UNDERGRADUATES
Less Than $25 $25 to $49 $50 to $74 $75 to $99 $100 to $124 $125 to $149 $150 to $174
# % # % # % # % # % # % # %CCC Part-time 41,841 11.2 45,775 12.3 40,411 10.8 34,689 9.3 55,431 14.9 20,742 5.6 25,033 6.7
Full-time 30,669 11.5 27,529 10.3 35,498 13.3 22,579 8.4 40,328 15.1 16,542 6.2 18,594 7.0 All 72,510 11.3 73,304 11.5 75,909 11.9 57,268 8.9 95,759 15.0 37,284 5.8 43,627 6.8
UC Part-time 4,166 15.4 5,017 18.5 4,483 16.5 2,228 8.2 3,402 12.5 1,753 6.5 921 3.4 Full-time 23,546 21.5 25,288 23.1 17,852 16.3 10,003 9.1 10,890 9.9 5,289 4.8 4,943 4.5 All 27,711 20.3 30,305 22.2 22,335 16.3 12,231 9.0 14,292 10.5 7,042 5.2 5,863 4.3
CSU Part-time 2,528 12.8 3,783 19.2 2,393 12.1 1,555 7.9 2,547 12.9 637 3.2 1,836 9.3 Full-time 20,884 13.9 25,099 16.7 24,308 16.2 13,456 9.0 17,597 11.7 7,738 5.2 8,653 5.8
All 23,412 13.8 28,882 17.0 26,701 15.7 15,011 8.8 20,144 11.9 8,375 4.9 10,490 6.2 ICU Part-time 671 13.3 1,156 23.0 647 12.9 469 9.3 598 11.9 188 3.7 115 2.3 Full-time 15,078 17.2 16,775 19.2 13,763 15.7 7,553 8.6 10,693 12.2 3,212 3.7 4,718 5.4
All 15,749 17.0 17,931 19.4 14,410 15.6 8,022 8.7 11,291 12.2 3,400 3.7 4,833 5.2 PCC Part-time 818 13.5 538 8.9 470 7.8 680 11.2 691 11.4 388 6.4 230 3.8 Full-time 2,275 10.0 1,870 8.3 2,392 10.6 1,924 8.5 3,007 13.3 1,321 5.8 1,861 8.2
All 3,093 10.8 2,408 8.4 2,862 10.0 2,603 9.1 3,699 12.9 1,710 6.0 2,091 7.3 ALL Part-time 50,024 11.6 56,268 13.1 48,403 11.2 39,621 9.2 62,669 14.6 23,708 5.5 28,136 6.5
Full-time 92,452 14.5 96,561 15.2 93,813 14.7 55,514 8.7 82,515 13.0 34,102 5.4 38,769 6.1 All 142,476 13.3 152,829 14.3 142,217 13.3 95,135 8.9 145,185 13.6 57,810 5.4 66,904 6.3
$175 to $199 $200 to $249 $250 to $299 $300 to $399 $400 to $499 $500 or More Total
# % # % # % # % # % # % # %CCC Part-time 13,232 3.6 24,676 6.6 18,954 5.1 14,305 3.8 7,152 1.9 30,397 8.2 372,638 100
Full-time 10,505 3.9 16,783 6.3 10,867 4.1 9,659 3.6 5,675 2.1 22,217 8.3 267,445 100 All 23,737 3.7 41,459 6.5 29,821 4.7 23,964 3.7 12,827 2.0 52,614 8.2 640,084 100
UC Part-time 1,380 5.1 950 3.5 880 3.2 388 1.4 1,191 4.4 370 1.4 27,128 100 Full-time 3,146 2.9 2,180 2.0 2,526 2.3 1,099 1.0 2,237 2.0 529 0.5 109,527 100 All 4,526 3.3 3,130 2.3 3,406 2.5 1,487 1.1 3,429 2.5 900 0.7 136,655 100
CSU Part-time 820 4.2 1,084 5.5 425 2.2 703 3.6 205 1.0 1,180 6.0 19,697 100 Full-time 3,560 2.4 8,774 5.8 5,614 3.7 4,466 3.0 2,318 1.5 7,606 5.1 150,073 100
All 4,381 2.6 9,858 5.8 6,039 3.6 5,169 3.0 2,523 1.5 8,786 5.2 169,771 100 ICU Part-time 166 3.3 264 5.3 134 2.7 298 5.9 182 3.6 140 2.8 5,028 100 Full-time 2,432 2.8 3,268 3.7 2,308 2.6 2,145 2.5 1,204 1.4 4,296 4.9 87,445 100
All 2,598 2.8 3,532 3.8 2,442 2.6 2,442 2.6 1,386 1.5 4,436 4.8 92,473 100 PCC Part-time 375 6.2 400 6.6 436 7.2 389 6.4 171 2.8 469 7.7 6,055 100 Full-time 719 3.2 1,469 6.5 1,273 5.6 1,289 5.7 613 2.7 2,638 11.6 22,651 100
All 1,094 3.8 1,869 6.5 1,709 6.0 1,678 5.8 784 2.7 3,107 10.8 28,705 100 ALL Part-time 15,973 3.7 27,375 6.4 20,829 4.8 16,084 3.7 8,902 2.1 32,557 7.6 430,547 100
Full-time 20,363 3.2 32,473 5.1 22,587 3.5 18,657 2.9 12,047 1.9 37,286 5.9 637,141 100 All 36,336 3.4 59,848 5.6 43,416 4.1 34,741 3.3 20,949 2.0 69,843 6.5 1,067,688 100
Source: California Student Aid Commission 339 2003-04 SEARS
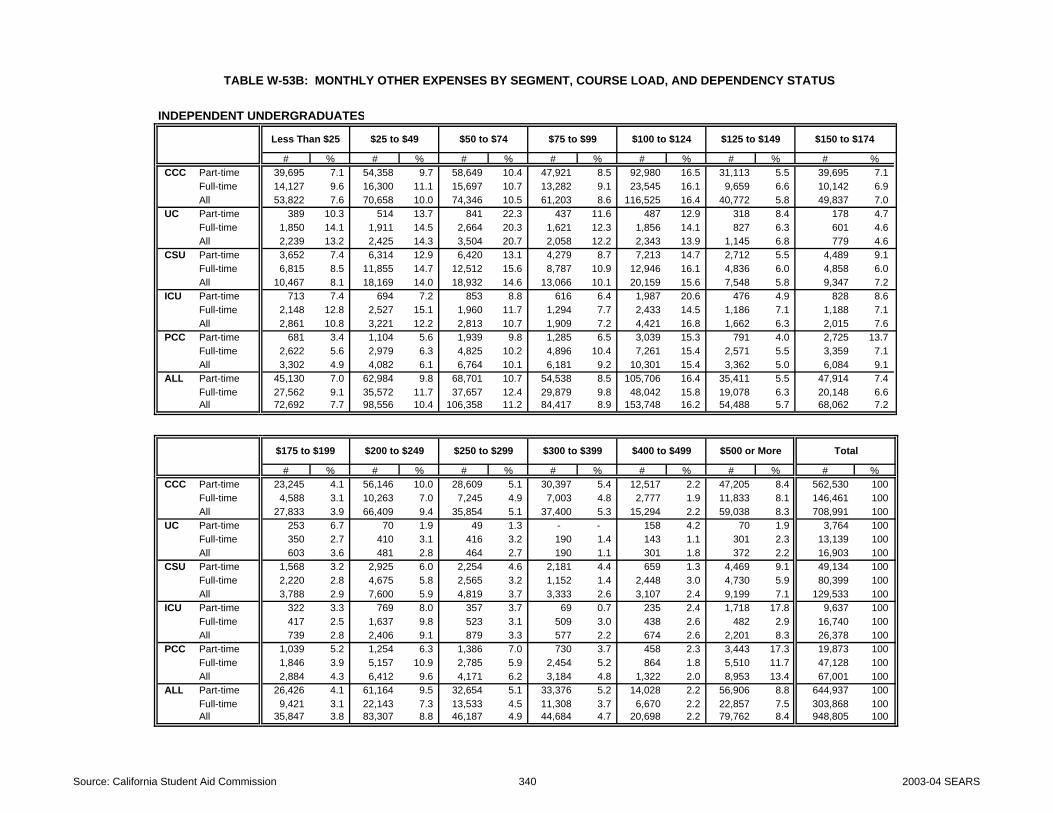
TABLE W-53B: MONTHLY OTHER EXPENSES BY SEGMENT, COURSE LOAD, AND DEPENDENCY STATUS
INDEPENDENT UNDERGRADUATES
Less Than $25 $25 to $49 $50 to $74 $75 to $99 $100 to $124 $125 to $149 $150 to $174
# % # % # % # % # % # % # %CCC Part-time 39,695 7.1 54,358 9.7 58,649 10.4 47,921 8.5 92,980 16.5 31,113 5.5 39,695 7.1
Full-time 14,127 9.6 16,300 11.1 15,697 10.7 13,282 9.1 23,545 16.1 9,659 6.6 10,142 6.9 All 53,822 7.6 70,658 10.0 74,346 10.5 61,203 8.6 116,525 16.4 40,772 5.8 49,837 7.0
UC Part-time 389 10.3 514 13.7 841 22.3 437 11.6 487 12.9 318 8.4 178 4.7 Full-time 1,850 14.1 1,911 14.5 2,664 20.3 1,621 12.3 1,856 14.1 827 6.3 601 4.6 All 2,239 13.2 2,425 14.3 3,504 20.7 2,058 12.2 2,343 13.9 1,145 6.8 779 4.6
CSU Part-time 3,652 7.4 6,314 12.9 6,420 13.1 4,279 8.7 7,213 14.7 2,712 5.5 4,489 9.1 Full-time 6,815 8.5 11,855 14.7 12,512 15.6 8,787 10.9 12,946 16.1 4,836 6.0 4,858 6.0
All 10,467 8.1 18,169 14.0 18,932 14.6 13,066 10.1 20,159 15.6 7,548 5.8 9,347 7.2 ICU Part-time 713 7.4 694 7.2 853 8.8 616 6.4 1,987 20.6 476 4.9 828 8.6 Full-time 2,148 12.8 2,527 15.1 1,960 11.7 1,294 7.7 2,433 14.5 1,186 7.1 1,188 7.1
All 2,861 10.8 3,221 12.2 2,813 10.7 1,909 7.2 4,421 16.8 1,662 6.3 2,015 7.6 PCC Part-time 681 3.4 1,104 5.6 1,939 9.8 1,285 6.5 3,039 15.3 791 4.0 2,725 13.7 Full-time 2,622 5.6 2,979 6.3 4,825 10.2 4,896 10.4 7,261 15.4 2,571 5.5 3,359 7.1
All 3,302 4.9 4,082 6.1 6,764 10.1 6,181 9.2 10,301 15.4 3,362 5.0 6,084 9.1 ALL Part-time 45,130 7.0 62,984 9.8 68,701 10.7 54,538 8.5 105,706 16.4 35,411 5.5 47,914 7.4
Full-time 27,562 9.1 35,572 11.7 37,657 12.4 29,879 9.8 48,042 15.8 19,078 6.3 20,148 6.6 All 72,692 7.7 98,556 10.4 106,358 11.2 84,417 8.9 153,748 16.2 54,488 5.7 68,062 7.2
$175 to $199 $200 to $249 $250 to $299 $300 to $399 $400 to $499 $500 or More Total
# % # % # % # % # % # % # %CCC Part-time 23,245 4.1 56,146 10.0 28,609 5.1 30,397 5.4 12,517 2.2 47,205 8.4 562,530 100
Full-time 4,588 3.1 10,263 7.0 7,245 4.9 7,003 4.8 2,777 1.9 11,833 8.1 146,461 100 All 27,833 3.9 66,409 9.4 35,854 5.1 37,400 5.3 15,294 2.2 59,038 8.3 708,991 100
UC Part-time 253 6.7 70 1.9 49 1.3 - - 158 4.2 70 1.9 3,764 100 Full-time 350 2.7 410 3.1 416 3.2 190 1.4 143 1.1 301 2.3 13,139 100 All 603 3.6 481 2.8 464 2.7 190 1.1 301 1.8 372 2.2 16,903 100
CSU Part-time 1,568 3.2 2,925 6.0 2,254 4.6 2,181 4.4 659 1.3 4,469 9.1 49,134 100 Full-time 2,220 2.8 4,675 5.8 2,565 3.2 1,152 1.4 2,448 3.0 4,730 5.9 80,399 100
All 3,788 2.9 7,600 5.9 4,819 3.7 3,333 2.6 3,107 2.4 9,199 7.1 129,533 100 ICU Part-time 322 3.3 769 8.0 357 3.7 69 0.7 235 2.4 1,718 17.8 9,637 100 Full-time 417 2.5 1,637 9.8 523 3.1 509 3.0 438 2.6 482 2.9 16,740 100
All 739 2.8 2,406 9.1 879 3.3 577 2.2 674 2.6 2,201 8.3 26,378 100 PCC Part-time 1,039 5.2 1,254 6.3 1,386 7.0 730 3.7 458 2.3 3,443 17.3 19,873 100 Full-time 1,846 3.9 5,157 10.9 2,785 5.9 2,454 5.2 864 1.8 5,510 11.7 47,128 100
All 2,884 4.3 6,412 9.6 4,171 6.2 3,184 4.8 1,322 2.0 8,953 13.4 67,001 100 ALL Part-time 26,426 4.1 61,164 9.5 32,654 5.1 33,376 5.2 14,028 2.2 56,906 8.8 644,937 100
Full-time 9,421 3.1 22,143 7.3 13,533 4.5 11,308 3.7 6,670 2.2 22,857 7.5 303,868 100 All 35,847 3.8 83,307 8.8 46,187 4.9 44,684 4.7 20,698 2.2 79,762 8.4 948,805 100
Source: California Student Aid Commission 340 2003-04 SEARS

TABLE W-53C: MONTHLY OTHER EXPENSES BY SEGMENT, COURSE LOAD, AND DEPENDENCY STATUS
ALL UNDERGRADUATES
Less Than $25 $25 to $49 $50 to $74 $75 to $99 $100 to $124 $125 to $149 $150 to $174
# % # % # % # % # % # % # %Part-time 95,154 8.8 119,252 11.1 117,105 10.9 94,159 8.8 168,376 15.7 59,118 5.5 76,050 7.1 Full-time 120,014 12.8 132,133 14.0 131,470 14.0 85,393 9.1 130,557 13.9 53,180 5.7 58,916 6.3 All 215,168 10.7 251,385 12.5 248,575 12.3 179,552 8.9 298,933 14.8 112,298 5.6 134,966 6.7
$175 to $199 $200 to $249 $250 to $299 $300 to $399 $400 to $499 $500 or More Total
# % # % # % # % # % # % # % Part-time 42,398 3.9 88,539 8.2 53,483 5.0 49,460 4.6 22,930 2.1 89,462 8.3 1,075,484 100
Full-time 29,784 3.2 54,616 5.8 36,120 3.8 29,965 3.2 18,718 2.0 60,143 6.4 941,009 100 All 72,182 3.6 143,155 7.1 89,603 4.4 79,425 3.9 41,647 2.1 149,605 7.4 2,016,493 100
Source: California Student Aid Commission 341 2003-04 SEARS

TABLE U-53A: MONTHLY OTHER EXPENSES BY SEGMENT, COURSE LOAD, AND DEPENDENCY STATUS
DEPENDENT UNDERGRADUATES
Less Than $25 $25 to $49 $50 to $74 $75 to $99 $100 to $124 $125 to $149 $150 to $174
# % # % # % # % # % # % # %CCC Part-time 117 11.2 128 12.3 113 10.8 97 9.3 155 14.9 58 5.6 70 6.7
Full-time 254 11.5 228 10.3 294 13.3 187 8.4 334 15.1 137 6.2 154 7.0 All 371 11.4 356 10.9 407 12.5 284 8.7 489 15.0 195 6.0 224 6.9
UC Part-time 66 15.1 87 19.9 73 16.7 37 8.4 52 11.9 28 6.4 15 3.4 Full-time 614 21.3 665 23.0 473 16.4 267 9.2 292 10.1 138 4.8 129 4.5 All 680 20.5 752 22.6 546 16.4 304 9.1 344 10.3 166 5.0 144 4.3
CSU Part-time 28 12.8 40 18.3 25 11.5 20 9.2 29 13.3 10 4.6 20 9.2 Full-time 265 14.1 331 17.7 307 16.4 178 9.5 216 11.5 96 5.1 106 5.7
All 293 14.0 371 17.7 332 15.9 198 9.5 245 11.7 106 5.1 126 6.0 ICU Part-time 22 15.1 33 22.6 20 13.7 14 9.6 15 10.3 4 2.7 5 3.4 Full-time 345 17.7 401 20.6 298 15.3 178 9.1 221 11.3 69 3.5 99 5.1
All 367 17.5 434 20.7 318 15.2 192 9.2 236 11.3 73 3.5 104 5.0 PCC Part-time 31 11.2 23 8.3 28 10.1 29 10.5 40 14.4 18 6.5 13 4.7 Full-time 101 9.7 100 9.6 90 8.6 97 9.3 129 12.4 59 5.7 81 7.8
All 132 10.0 123 9.3 118 8.9 126 9.6 169 12.8 77 5.8 94 7.1 ALL Part-time 264 12.4 311 14.7 259 12.2 197 9.3 291 13.7 118 5.6 123 5.8
Full-time 1,579 15.8 1,725 17.3 1,462 14.7 907 9.1 1,192 12.0 499 5.0 569 5.7 All 1,843 15.2 2,036 16.8 1,721 14.2 1,104 9.1 1,483 12.3 617 5.1 692 5.7
$175 to $199 $200 to $249 $250 to $299 $300 to $399 $400 to $499 $500 or More Total
# % # % # % # % # % # % # %CCC Part-time 37 3.6 69 6.6 53 5.1 40 3.8 20 1.9 85 8.2 1,042 100
Full-time 87 3.9 139 6.3 90 4.1 80 3.6 47 2.1 184 8.3 2,215 100 All 124 3.8 208 6.4 143 4.4 120 3.7 67 2.1 269 8.3 3,257 100
UC Part-time 21 4.8 14 3.2 13 3.0 6 1.4 19 4.3 7 1.6 438 100 Full-time 84 2.9 58 2.0 66 2.3 28 1.0 59 2.0 14 0.5 2,887 100 All 105 3.2 72 2.2 79 2.4 34 1.0 78 2.3 21 0.6 3,325 100
CSU Part-time 9 4.1 14 6.4 5 2.3 5 2.3 2 0.9 11 5.0 218 100 Full-time 41 2.2 103 5.5 65 3.5 50 2.7 31 1.7 84 4.5 1,873 100
All 50 2.4 117 5.6 70 3.3 55 2.6 33 1.6 95 4.5 2,091 100 ICU Part-time 5 3.4 9 6.2 3 2.1 5 3.4 3 2.1 8 5.5 146 100 Full-time 54 2.8 71 3.6 49 2.5 47 2.4 27 1.4 90 4.6 1,949 100
All 59 2.8 80 3.8 52 2.5 52 2.5 30 1.4 98 4.7 2,095 100 PCC Part-time 14 5.1 20 7.2 16 5.8 11 4.0 9 3.2 25 9.0 277 100 Full-time 29 2.8 73 7.0 61 5.9 55 5.3 35 3.4 132 12.7 1,042 100
All 43 3.3 93 7.1 77 5.8 66 5.0 44 3.3 157 11.9 1,319 100 ALL Part-time 86 4.1 126 5.9 90 4.2 67 3.2 53 2.5 136 6.4 2,121 100
Full-time 295 3.0 444 4.5 331 3.3 260 2.6 199 2.0 504 5.1 9,966 100 All 381 3.2 570 4.7 421 3.5 327 2.7 252 2.1 640 5.3 12,087 100
Source: California Student Aid Commission 342 2003-04 SEARS

TABLE U-53B: MONTHLY OTHER EXPENSES BY SEGMENT, COURSE LOAD, AND DEPENDENCY STATUS
INDEPENDENT UNDERGRADUATES
Less Than $25 $25 to $49 $50 to $74 $75 to $99 $100 to $124 $125 to $149 $150 to $174
# % # % # % # % # % # % # %CCC Part-time 111 7.1 152 9.7 164 10.4 134 8.5 260 16.5 87 5.5 111 7.1
Full-time 117 9.6 135 11.1 130 10.7 110 9.1 195 16.1 80 6.6 84 6.9 All 228 8.2 287 10.3 294 10.6 244 8.8 455 16.3 167 6.0 195 7.0
UC Part-time 6 8.7 10 14.5 15 21.7 9 13.0 10 14.5 5 7.2 3 4.3 Full-time 46 13.5 50 14.7 69 20.2 41 12.0 49 14.4 22 6.5 16 4.7 All 52 12.7 60 14.6 84 20.5 50 12.2 59 14.4 27 6.6 19 4.6
CSU Part-time 44 7.5 76 13.0 79 13.5 62 10.6 87 14.9 32 5.5 46 7.9 Full-time 105 9.6 178 16.2 163 14.8 114 10.4 167 15.2 70 6.4 64 5.8
All 149 8.9 254 15.1 242 14.4 176 10.5 254 15.1 102 6.1 110 6.5 ICU Part-time 13 8.2 15 9.5 16 10.1 12 7.6 31 19.6 6 3.8 15 9.5 Full-time 45 13.1 54 15.7 39 11.3 30 8.7 52 15.1 20 5.8 24 7.0
All 58 11.6 69 13.7 55 11.0 42 8.4 83 16.5 26 5.2 39 7.8 PCC Part-time 36 6.5 38 6.8 50 9.0 46 8.3 67 12.1 35 6.3 53 9.5 Full-time 127 7.7 123 7.4 165 10.0 147 8.9 257 15.5 100 6.0 119 7.2
All 163 7.4 161 7.3 215 9.7 193 8.7 324 14.6 135 6.1 172 7.8 ALL Part-time 210 7.1 291 9.9 324 11.0 263 8.9 455 15.5 165 5.6 228 7.8
Full-time 440 9.5 540 11.6 566 12.2 442 9.5 720 15.5 292 6.3 307 6.6 All 650 8.6 831 10.9 890 11.7 705 9.3 1,175 15.5 457 6.0 535 7.0
$175 to $199 $200 to $249 $250 to $299 $300 to $399 $400 to $499 $500 or More Total
# % # % # % # % # % # % # %CCC Part-time 65 4.1 157 10.0 80 5.1 85 5.4 35 2.2 132 8.4 1,573 100
Full-time 38 3.1 85 7.0 60 4.9 58 4.8 23 1.9 98 8.1 1,213 100 All 103 3.7 242 8.7 140 5.0 143 5.1 58 2.1 230 8.3 2,786 100
UC Part-time 5 7.2 1 1.4 1 1.4 - - 3 4.3 1 1.4 69 100 Full-time 9 2.6 11 3.2 11 3.2 5 1.5 4 1.2 8 2.3 341 100 All 14 3.4 12 2.9 12 2.9 5 1.2 7 1.7 9 2.2 410 100
CSU Part-time 19 3.3 34 5.8 27 4.6 21 3.6 7 1.2 50 8.6 584 100 Full-time 32 2.9 62 5.6 39 3.5 20 1.8 24 2.2 61 5.6 1,099 100
All 51 3.0 96 5.7 66 3.9 41 2.4 31 1.8 111 6.6 1,683 100 ICU Part-time 6 3.8 13 8.2 6 3.8 1 0.6 5 3.2 19 12.0 158 100 Full-time 8 2.3 30 8.7 11 3.2 11 3.2 9 2.6 11 3.2 344 100
All 14 2.8 43 8.6 17 3.4 12 2.4 14 2.8 30 6.0 502 100 PCC Part-time 26 4.7 40 7.2 35 6.3 25 4.5 13 2.3 92 16.5 556 100 Full-time 68 4.1 145 8.8 89 5.4 79 4.8 34 2.1 204 12.3 1,657 100
All 94 4.2 185 8.4 124 5.6 104 4.7 47 2.1 296 13.4 2,213 100 ALL Part-time 121 4.1 245 8.3 149 5.1 132 4.5 63 2.1 294 10.0 2,940 100
Full-time 155 3.3 333 7.2 210 4.5 173 3.7 94 2.0 382 8.2 4,654 100 All 276 3.6 578 7.6 359 4.7 305 4.0 157 2.1 676 8.9 7,594 100
Source: California Student Aid Commission 343 2003-04 SEARS

TABLE U-53C: MONTHLY OTHER EXPENSES BY SEGMENT, COURSE LOAD, AND DEPENDENCY STATUS
ALL UNDERGRADUATES
Less Than $25 $25 to $49 $50 to $74 $75 to $99 $100 to $124 $125 to $149 $150 to $174
# % # % # % # % # % # % # %Part-time 474 9.4 602 11.9 583 11.5 460 9.1 746 14.7 283 5.6 351 6.9 Full-time 2,019 13.8 2,265 15.5 2,028 13.9 1,349 9.2 1,912 13.1 791 5.4 876 6.0 All 2,493 12.7 2,867 14.6 2,611 13.3 1,809 9.2 2,658 13.5 1,074 5.5 1,227 6.2
$175 to $199 $200 to $249 $250 to $299 $300 to $399 $400 to $499 $500 or More Total
# % # % # % # % # % # % # % Part-time 207 4.1 371 7.3 239 4.7 199 3.9 116 2.3 430 8.5 5,061 100
Full-time 450 3.1 777 5.3 541 3.7 433 3.0 293 2.0 886 6.1 14,620 100 All 657 3.3 1,148 5.8 780 4.0 632 3.2 409 2.1 1,316 6.7 19,681 100
Source: California Student Aid Commission 344 2003-04 SEARS

DEPENDENT UNDERGRADUATES INDEPENDENT UNDERGRADUATES ALL UNDERGRADUATES
CCC Part-time 1,042 159$ 110$ CCC Part-time 1,573 175$ 121$ CCC Part-time 2,615 169$ 117$ Full-time 2,215 158$ 110$ Full-time 1,213 163$ 114$ Full-time 3,428 160$ 111$ All 3,257 150$ 110$ All 2,786 149$ 119$ All 6,043 164$ 115$
UC Part-time 438 112$ 73$ UC Part-time 69 113$ 82$ UC Part-time 507 112$ 74$ Full-time 2,887 86$ 57$ Full-time 341 107$ 76$ Full-time 3,228 89$ 60$ All 3,325 95$ 61$ All 410 105$ 77$ All 3,735 92$ 63$
CSU Part-time 218 128$ 92$ CSU Part-time 584 158$ 113$ CSU Part-time 802 150$ 108$ Full-time 1,873 124$ 83$ Full-time 1,099 136$ 99$ Full-time 2,972 128$ 89$
All 2,091 129$ 84$ All 1,683 139$ 104$ All 3,774 133$ 95$ ICU Part-time 146 126$ 76$ ICU Part-time 158 179$ 123$ ICU Part-time 304 153$ 114$ Full-time 1,949 114$ 71$ Full-time 344 132$ 104$ Full-time 2,293 116$ 74$
All 2,095 130$ 71$ All 502 139$ 112$ All 2,597 121$ 80$ PCC Part-time 277 173$ 117$ PCC Part-time 556 213$ 159$ PCC Part-time 833 200$ 153$ Full-time 1,042 193$ 122$ Full-time 1,657 191$ 135$ Full-time 2,699 192$ 130$
All 1,319 168$ 122$ All 2,213 168$ 147$ All 3,532 194$ 137$ ALL Part-time 2,121 146$ 107$ ALL Part-time 2,940 178$ 121$ ALL Part-time 5,061 164$ 116$
Full-time 9,966 126$ 90$ Full-time 4,654 160$ 110$ Full-time 14,620 137$ 99$ All 12,087 129$ 99$ All 7,594 167$ 117$ All 19,681 144$ 109$
TABLE 53: MEAN AND MEDIAN OF MONTHLY OTHER EXPENSES BY SEGMENT, COURSE LOAD, AND DEPENDENCY STATUS
Number Mean Median Number Mean Median Number Mean Median
Source: California Student Aid Commission 345 2003-04 SEARS
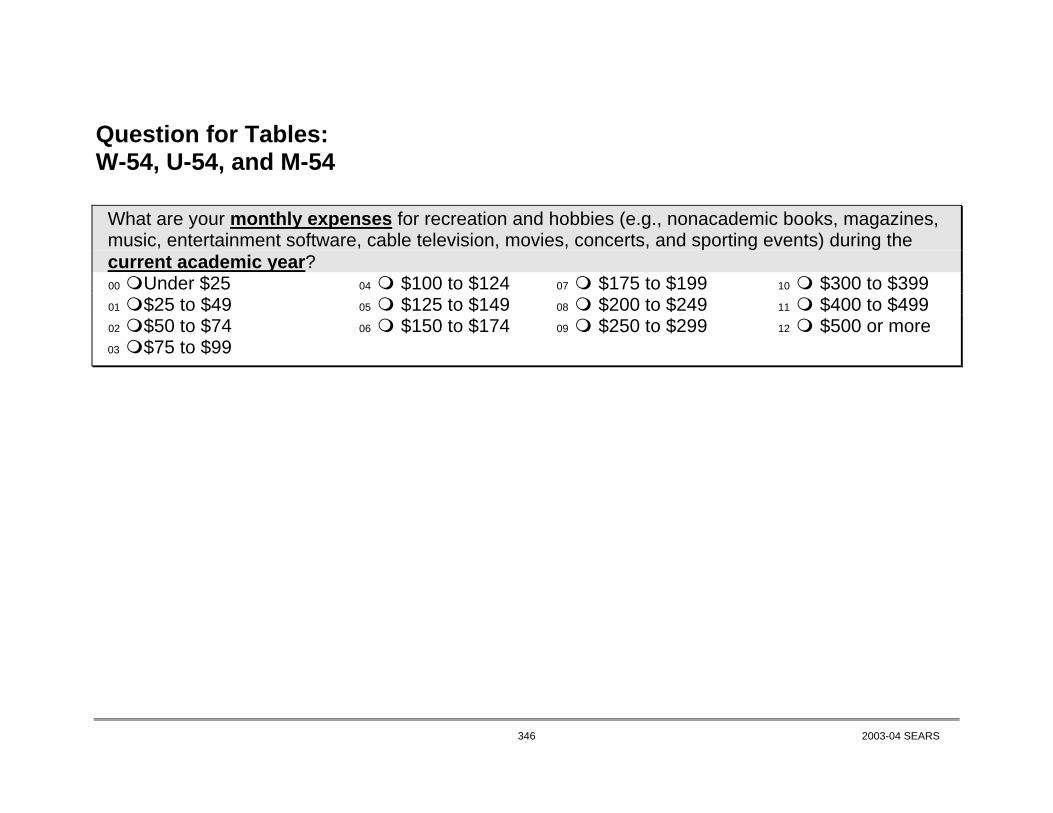
Question for Tables: W-54, U-54, and M-54
What are your monthly expenses for recreation and hobbies (e.g., nonacademic books, magazines,
music, entertainment software, cable television, movies, concerts, and sporting events) during the current academic year?
00 Under $25 04 $100 to $124 07 $175 to $199 10 $300 to $399 01 $25 to $49 05 $125 to $149 08 $200 to $249 11 $400 to $499 02 $50 to $74 06 $150 to $174 09 $250 to $299 12 $500 or more 03 $75 to $99
346 2003-04 SEARS

TABLE W-54A: MONTHLY RECREATION EXPENSES BY SEGMENT, COURSE LOAD, AND DEPENDENCY STATUS
DEPENDENT UNDERGRADUATES
Less Than $25 $25 to $49 $50 to $74 $75 to $99 $100 to $124 $125 to $149 $150 to $174
# % # % # % # % # % # % # %CCC Part-time 56,861 15.3 45,775 12.4 52,212 14.1 39,695 10.7 56,861 15.3 19,669 5.3 26,821 7.2
Full-time 40,811 15.3 36,947 13.9 39,241 14.7 27,892 10.5 42,018 15.8 15,214 5.7 16,904 6.3 All 97,672 15.3 82,722 13.0 91,453 14.4 67,587 10.6 98,879 15.5 34,883 5.5 43,725 6.9
UC Part-time 6,233 23.5 4,899 18.5 4,557 17.2 2,863 10.8 3,386 12.8 1,121 4.2 847 3.2 Full-time 22,719 21.0 24,456 22.6 21,185 19.6 11,130 10.3 10,769 10.0 4,960 4.6 3,823 3.5 All 28,952 21.5 29,355 21.8 25,742 19.1 13,993 10.4 14,155 10.5 6,081 4.5 4,669 3.5
CSU Part-time 2,614 13.3 3,272 16.7 3,094 15.8 1,653 8.4 2,629 13.4 784 4.0 2,003 10.2 Full-time 20,108 13.5 29,535 19.8 27,140 18.2 16,974 11.4 20,781 13.9 6,554 4.4 7,965 5.3
All 22,722 13.4 32,807 19.4 30,234 17.9 18,627 11.0 23,410 13.8 7,338 4.3 9,968 5.9 ICU Part-time 865 17.5 927 18.8 767 15.5 545 11.0 467 9.5 242 4.9 432 8.7 Full-time 16,250 18.9 17,663 20.5 15,402 17.9 8,938 10.4 9,035 10.5 3,903 4.5 3,300 3.8
All 17,115 18.8 18,590 20.4 16,169 17.8 9,484 10.4 9,501 10.4 4,146 4.6 3,732 4.1 PCC Part-time 728 12.2 1,144 19.2 986 16.6 470 7.9 668 11.2 466 7.8 402 6.8 Full-time 4,519 20.2 2,856 12.7 3,236 14.4 2,179 9.7 2,709 12.1 1,298 5.8 946 4.2
All 5,247 18.5 4,000 14.1 4,222 14.9 2,650 9.3 3,377 11.9 1,764 6.2 1,347 4.8 ALL Part-time 67,301 15.7 56,018 13.1 61,617 14.4 45,226 10.6 64,012 15.0 22,282 5.2 30,504 7.1
Full-time 104,407 16.5 111,457 17.6 106,204 16.8 67,114 10.6 85,312 13.5 31,930 5.0 32,938 5.2 All 171,708 16.2 167,475 15.8 167,821 15.8 112,340 10.6 149,323 14.1 54,212 5.1 63,442 6.0
$175 to $199 $200 to $249 $250 to $299 $300 to $399 $400 to $499 $500 or More Total
# % # % # % # % # % # % # %CCC Part-time 8,225 2.2 17,166 4.6 14,305 3.9 9,656 2.6 4,649 1.3 18,596 5.0 370,491 100
Full-time 5,675 2.1 11,471 4.3 10,022 3.8 4,226 1.6 3,260 1.2 13,040 4.9 266,721 100 All 13,900 2.2 28,637 4.5 24,327 3.8 13,882 2.2 7,909 1.2 31,636 5.0 637,212 100
UC Part-time 924 3.5 443 1.7 339 1.3 178 0.7 718 2.7 37 0.1 26,545 100 Full-time 2,956 2.7 1,779 1.6 1,393 1.3 854 0.8 2,005 1.9 200 0.2 108,229 100 All 3,880 2.9 2,222 1.6 1,732 1.3 1,032 0.8 2,723 2.0 237 0.2 134,774 100
CSU Part-time 695 3.5 1,853 9.5 405 2.1 25 0.1 - - 581 3.0 19,607 100 Full-time 2,807 1.9 5,970 4.0 3,309 2.2 3,185 2.1 1,067 0.7 4,083 2.7 149,479 100
All 3,502 2.1 7,824 4.6 3,713 2.2 3,209 1.9 1,067 0.6 4,664 2.8 169,086 100 ICU Part-time 47 0.9 257 5.2 101 2.1 148 3.0 14 0.3 124 2.5 4,936 100 Full-time 1,617 1.9 3,519 4.1 1,911 2.2 1,032 1.2 753 0.9 2,732 3.2 86,054 100
All 1,664 1.8 3,776 4.1 2,012 2.2 1,180 1.3 766 0.8 2,857 3.1 90,991 100 PCC Part-time 85 1.4 171 2.9 242 4.1 75 1.3 285 4.8 228 3.8 5,949 100 Full-time 507 2.3 1,512 6.7 846 3.8 300 1.3 462 2.1 1,042 4.7 22,411 100
All 591 2.1 1,683 5.9 1,088 3.8 375 1.3 746 2.6 1,270 4.5 28,360 100 ALL Part-time 9,975 2.3 19,890 4.7 15,392 3.6 10,081 2.4 5,665 1.3 19,566 4.6 427,528 100
Full-time 13,562 2.1 24,251 3.8 17,480 2.8 9,597 1.5 7,547 1.2 21,098 3.3 632,895 100 All 23,537 2.2 44,141 4.2 32,872 3.1 19,677 1.9 13,212 1.2 40,664 3.8 1,060,423 100
Source: California Student Aid Commission 347 2003-04 SEARS
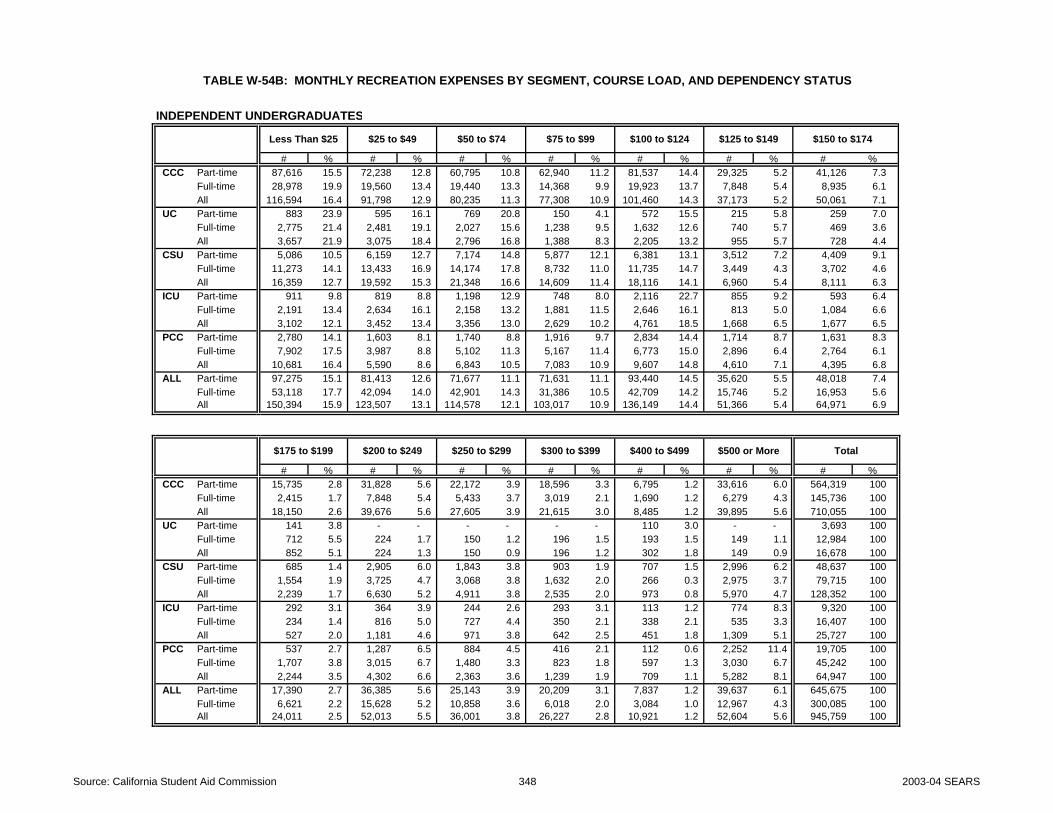
TABLE W-54B: MONTHLY RECREATION EXPENSES BY SEGMENT, COURSE LOAD, AND DEPENDENCY STATUS
INDEPENDENT UNDERGRADUATES
Less Than $25 $25 to $49 $50 to $74 $75 to $99 $100 to $124 $125 to $149 $150 to $174
# % # % # % # % # % # % # %CCC Part-time 87,616 15.5 72,238 12.8 60,795 10.8 62,940 11.2 81,537 14.4 29,325 5.2 41,126 7.3
Full-time 28,978 19.9 19,560 13.4 19,440 13.3 14,368 9.9 19,923 13.7 7,848 5.4 8,935 6.1 All 116,594 16.4 91,798 12.9 80,235 11.3 77,308 10.9 101,460 14.3 37,173 5.2 50,061 7.1
UC Part-time 883 23.9 595 16.1 769 20.8 150 4.1 572 15.5 215 5.8 259 7.0 Full-time 2,775 21.4 2,481 19.1 2,027 15.6 1,238 9.5 1,632 12.6 740 5.7 469 3.6 All 3,657 21.9 3,075 18.4 2,796 16.8 1,388 8.3 2,205 13.2 955 5.7 728 4.4
CSU Part-time 5,086 10.5 6,159 12.7 7,174 14.8 5,877 12.1 6,381 13.1 3,512 7.2 4,409 9.1 Full-time 11,273 14.1 13,433 16.9 14,174 17.8 8,732 11.0 11,735 14.7 3,449 4.3 3,702 4.6
All 16,359 12.7 19,592 15.3 21,348 16.6 14,609 11.4 18,116 14.1 6,960 5.4 8,111 6.3 ICU Part-time 911 9.8 819 8.8 1,198 12.9 748 8.0 2,116 22.7 855 9.2 593 6.4 Full-time 2,191 13.4 2,634 16.1 2,158 13.2 1,881 11.5 2,646 16.1 813 5.0 1,084 6.6
All 3,102 12.1 3,452 13.4 3,356 13.0 2,629 10.2 4,761 18.5 1,668 6.5 1,677 6.5 PCC Part-time 2,780 14.1 1,603 8.1 1,740 8.8 1,916 9.7 2,834 14.4 1,714 8.7 1,631 8.3 Full-time 7,902 17.5 3,987 8.8 5,102 11.3 5,167 11.4 6,773 15.0 2,896 6.4 2,764 6.1
All 10,681 16.4 5,590 8.6 6,843 10.5 7,083 10.9 9,607 14.8 4,610 7.1 4,395 6.8 ALL Part-time 97,275 15.1 81,413 12.6 71,677 11.1 71,631 11.1 93,440 14.5 35,620 5.5 48,018 7.4
Full-time 53,118 17.7 42,094 14.0 42,901 14.3 31,386 10.5 42,709 14.2 15,746 5.2 16,953 5.6 All 150,394 15.9 123,507 13.1 114,578 12.1 103,017 10.9 136,149 14.4 51,366 5.4 64,971 6.9
$175 to $199 $200 to $249 $250 to $299 $300 to $399 $400 to $499 $500 or More Total
# % # % # % # % # % # % # %CCC Part-time 15,735 2.8 31,828 5.6 22,172 3.9 18,596 3.3 6,795 1.2 33,616 6.0 564,319 100
Full-time 2,415 1.7 7,848 5.4 5,433 3.7 3,019 2.1 1,690 1.2 6,279 4.3 145,736 100 All 18,150 2.6 39,676 5.6 27,605 3.9 21,615 3.0 8,485 1.2 39,895 5.6 710,055 100
UC Part-time 141 3.8 - - - - - - 110 3.0 - - 3,693 100 Full-time 712 5.5 224 1.7 150 1.2 196 1.5 193 1.5 149 1.1 12,984 100 All 852 5.1 224 1.3 150 0.9 196 1.2 302 1.8 149 0.9 16,678 100
CSU Part-time 685 1.4 2,905 6.0 1,843 3.8 903 1.9 707 1.5 2,996 6.2 48,637 100 Full-time 1,554 1.9 3,725 4.7 3,068 3.8 1,632 2.0 266 0.3 2,975 3.7 79,715 100
All 2,239 1.7 6,630 5.2 4,911 3.8 2,535 2.0 973 0.8 5,970 4.7 128,352 100 ICU Part-time 292 3.1 364 3.9 244 2.6 293 3.1 113 1.2 774 8.3 9,320 100 Full-time 234 1.4 816 5.0 727 4.4 350 2.1 338 2.1 535 3.3 16,407 100
All 527 2.0 1,181 4.6 971 3.8 642 2.5 451 1.8 1,309 5.1 25,727 100 PCC Part-time 537 2.7 1,287 6.5 884 4.5 416 2.1 112 0.6 2,252 11.4 19,705 100 Full-time 1,707 3.8 3,015 6.7 1,480 3.3 823 1.8 597 1.3 3,030 6.7 45,242 100
All 2,244 3.5 4,302 6.6 2,363 3.6 1,239 1.9 709 1.1 5,282 8.1 64,947 100 ALL Part-time 17,390 2.7 36,385 5.6 25,143 3.9 20,209 3.1 7,837 1.2 39,637 6.1 645,675 100
Full-time 6,621 2.2 15,628 5.2 10,858 3.6 6,018 2.0 3,084 1.0 12,967 4.3 300,085 100 All 24,011 2.5 52,013 5.5 36,001 3.8 26,227 2.8 10,921 1.2 52,604 5.6 945,759 100
Source: California Student Aid Commission 348 2003-04 SEARS

TABLE W-54C: MONTHLY RECREATION EXPENSES BY SEGMENT, COURSE LOAD, AND DEPENDENCY STATUS
ALL UNDERGRADUATES
Less Than $25 $25 to $49 $50 to $74 $75 to $99 $100 to $124 $125 to $149 $150 to $174
# % # % # % # % # % # % # %Part-time 164,576 15.3 137,431 12.8 133,294 12.4 116,857 10.9 157,452 14.7 57,902 5.4 78,522 7.3 Full-time 157,525 16.9 153,551 16.5 149,106 16.0 98,500 10.6 128,021 13.7 47,676 5.1 49,891 5.3 All 322,101 16.1 290,982 14.5 282,400 14.1 215,357 10.7 285,473 14.2 105,578 5.3 128,413 6.4
$175 to $199 $200 to $249 $250 to $299 $300 to $399 $400 to $499 $500 or More Total
# % # % # % # % # % # % # % Part-time 27,365 2.5 56,275 5.2 40,535 3.8 30,289 2.8 13,502 1.3 59,204 5.5 1,073,203 100
Full-time 20,183 2.2 39,879 4.3 28,338 3.0 15,615 1.7 10,631 1.1 34,065 3.7 932,979 100 All 47,548 2.4 96,154 4.8 68,873 3.4 45,904 2.3 24,132 1.2 93,268 4.6 2,006,182 100
Source: California Student Aid Commission 349 2003-04 SEARS

TABLE U-54A: MONTHLY RECREATION EXPENSES BY SEGMENT, COURSE LOAD, AND DEPENDENCY STATUS
DEPENDENT UNDERGRADUATES
Less Than $25 $25 to $49 $50 to $74 $75 to $99 $100 to $124 $125 to $149 $150 to $174
# % # % # % # % # % # % # %CCC Part-time 159 15.3 128 12.4 146 14.1 111 10.7 159 15.3 55 5.3 75 7.2
Full-time 338 15.3 306 13.9 325 14.7 231 10.5 348 15.8 126 5.7 140 6.3 All 497 15.3 434 13.4 471 14.5 342 10.5 507 15.6 181 5.6 215 6.6
UC Part-time 100 23.3 81 18.8 75 17.4 45 10.5 54 12.6 18 4.2 13 3.0 Full-time 586 20.5 644 22.6 560 19.6 300 10.5 290 10.2 129 4.5 101 3.5 All 686 20.9 725 22.1 635 19.3 345 10.5 344 10.5 147 4.5 114 3.5
CSU Part-time 27 12.5 40 18.5 32 14.8 20 9.3 29 13.4 9 4.2 19 8.8 Full-time 250 13.5 383 20.6 341 18.4 210 11.3 257 13.8 74 4.0 95 5.1
All 277 13.4 423 20.4 373 18.0 230 11.1 286 13.8 83 4.0 114 5.5 ICU Part-time 25 17.6 31 21.8 25 17.6 13 9.2 12 8.5 8 5.6 8 5.6 Full-time 371 19.4 417 21.8 340 17.7 196 10.2 201 10.5 87 4.5 70 3.7
All 396 19.2 448 21.8 365 17.7 209 10.2 213 10.3 95 4.6 78 3.8 PCC Part-time 45 16.5 47 17.2 40 14.7 27 9.9 37 13.6 16 5.9 15 5.5 Full-time 204 19.8 139 13.5 142 13.8 94 9.1 129 12.5 44 4.3 54 5.2
All 249 19.1 186 14.3 182 14.0 121 9.3 166 12.7 60 4.6 69 5.3 ALL Part-time 356 17.0 327 15.6 318 15.2 216 10.3 291 13.9 106 5.1 130 6.2
Full-time 1,749 17.7 1,889 19.1 1,708 17.3 1,031 10.5 1,225 12.4 460 4.7 460 4.7 All 2,105 17.6 2,216 18.5 2,026 16.9 1,247 10.4 1,516 12.7 566 4.7 590 4.9
$175 to $199 $200 to $249 $250 to $299 $300 to $399 $400 to $499 $500 or More Total
# % # % # % # % # % # % # %CCC Part-time 23 2.2 48 4.6 40 3.9 27 2.6 13 1.3 52 5.0 1,036 100
Full-time 47 2.1 95 4.3 83 3.8 35 1.6 27 1.2 108 4.9 2,209 100 All 70 2.2 143 4.4 123 3.8 62 1.9 40 1.2 160 4.9 3,245 100
UC Part-time 14 3.3 8 1.9 7 1.6 3 0.7 11 2.6 1 0.2 430 100 Full-time 79 2.8 48 1.7 36 1.3 23 0.8 51 1.8 5 0.2 2,852 100 All 93 2.8 56 1.7 43 1.3 26 0.8 62 1.9 6 0.2 3,282 100
CSU Part-time 10 4.6 18 8.3 5 2.3 1 0.5 - - 6 2.8 216 100 Full-time 37 2.0 72 3.9 39 2.1 31 1.7 13 0.7 54 2.9 1,856 100
All 47 2.3 90 4.3 44 2.1 32 1.5 13 0.6 60 2.9 2,072 100 ICU Part-time 1 0.7 7 4.9 3 2.1 3 2.1 2 1.4 4 2.8 142 100 Full-time 37 1.9 65 3.4 36 1.9 26 1.4 15 0.8 56 2.9 1,917 100
All 38 1.8 72 3.5 39 1.9 29 1.4 17 0.8 60 2.9 2,059 100 PCC Part-time 7 2.6 12 4.4 10 3.7 3 1.1 2 0.7 12 4.4 273 100 Full-time 28 2.7 59 5.7 45 4.4 18 1.7 14 1.4 61 5.9 1,031 100
All 35 2.7 71 5.4 55 4.2 21 1.6 16 1.2 73 5.6 1,304 100 ALL Part-time 55 2.6 93 4.4 65 3.1 37 1.8 28 1.3 75 3.6 2,097 100
Full-time 228 2.3 339 3.4 239 2.4 133 1.3 120 1.2 284 2.9 9,865 100 All 283 2.4 432 3.6 304 2.5 170 1.4 148 1.2 359 3.0 11,962 100
Source: California Student Aid Commission 350 2003-04 SEARS

TABLE U-54B: MONTHLY RECREATION EXPENSES BY SEGMENT, COURSE LOAD, AND DEPENDENCY STATUS
INDEPENDENT UNDERGRADUATES
Less Than $25 $25 to $49 $50 to $74 $75 to $99 $100 to $124 $125 to $149 $150 to $174
# % # % # % # % # % # % # %CCC Part-time 245 15.5 202 12.8 170 10.8 176 11.2 228 14.4 82 5.2 115 7.3
Full-time 240 19.9 162 13.4 161 13.3 119 9.9 165 13.7 65 5.4 74 6.1 All 485 17.4 364 13.1 331 11.9 295 10.6 393 14.1 147 5.3 189 6.8
UC Part-time 15 22.1 10 14.7 14 20.6 3 4.4 13 19.1 5 7.4 4 5.9 Full-time 70 20.8 64 19.0 55 16.3 34 10.1 40 11.9 19 5.6 13 3.9 All 85 21.0 74 18.3 69 17.0 37 9.1 53 13.1 24 5.9 17 4.2
CSU Part-time 65 11.3 82 14.2 89 15.4 62 10.7 80 13.9 39 6.8 46 8.0 Full-time 155 14.3 194 17.8 175 16.1 115 10.6 165 15.2 50 4.6 54 5.0
All 220 13.2 276 16.6 264 15.9 177 10.6 245 14.7 89 5.3 100 6.0 ICU Part-time 16 10.5 16 10.5 24 15.7 13 8.5 25 16.3 14 9.2 10 6.5 Full-time 49 14.5 52 15.4 43 12.8 37 11.0 53 15.7 18 5.3 21 6.2
All 65 13.3 68 13.9 67 13.7 50 10.2 78 15.9 32 6.5 31 6.3 PCC Part-time 80 14.5 54 9.8 55 9.9 43 7.8 86 15.6 46 8.3 40 7.2 Full-time 341 20.9 160 9.8 198 12.1 169 10.3 229 14.0 101 6.2 97 5.9
All 421 19.3 214 9.8 253 11.6 212 9.7 315 14.4 147 6.7 137 6.3 ALL Part-time 421 14.4 364 12.4 352 12.0 297 10.1 432 14.7 186 6.4 215 7.3
Full-time 855 18.6 632 13.7 632 13.7 474 10.3 652 14.2 253 5.5 259 5.6 All 1,276 16.9 996 13.2 984 13.1 771 10.2 1,084 14.4 439 5.8 474 6.3
$175 to $199 $200 to $249 $250 to $299 $300 to $399 $400 to $499 $500 or More Total
# % # % # % # % # % # % # %CCC Part-time 44 2.8 89 5.6 62 3.9 52 3.3 19 1.2 94 6.0 1,578 100
Full-time 20 1.7 65 5.4 45 3.7 25 2.1 14 1.2 52 4.3 1,207 100 All 64 2.3 154 5.5 107 3.8 77 2.8 33 1.2 146 5.2 2,785 100
UC Part-time 2 2.9 - - - - - - 2 2.9 - - 68 100 Full-time 18 5.3 6 1.8 4 1.2 5 1.5 5 1.5 4 1.2 337 100 All 20 4.9 6 1.5 4 1.0 5 1.2 7 1.7 4 1.0 405 100
CSU Part-time 13 2.3 31 5.4 20 3.5 10 1.7 7 1.2 33 5.7 577 100 Full-time 28 2.6 50 4.6 38 3.5 20 1.8 4 0.4 39 3.6 1,087 100
All 41 2.5 81 4.9 58 3.5 30 1.8 11 0.7 72 4.3 1,664 100 ICU Part-time 5 3.3 7 4.6 4 2.6 4 2.6 2 1.3 13 8.5 153 100 Full-time 6 1.8 18 5.3 14 4.2 8 2.4 6 1.8 12 3.6 337 100
All 11 2.2 25 5.1 18 3.7 12 2.4 8 1.6 25 5.1 490 100 PCC Part-time 14 2.5 35 6.3 28 5.1 12 2.2 5 0.9 55 9.9 553 100 Full-time 42 2.6 101 6.2 57 3.5 25 1.5 19 1.2 94 5.8 1,633 100
All 56 2.6 136 6.2 85 3.9 37 1.7 24 1.1 149 6.8 2,186 100 ALL Part-time 78 2.7 162 5.5 114 3.9 78 2.7 35 1.2 195 6.7 2,929 100
Full-time 114 2.5 240 5.2 158 3.4 83 1.8 48 1.0 201 4.4 4,601 100 All 192 2.5 402 5.3 272 3.6 161 2.1 83 1.1 396 5.3 7,530 100
Source: California Student Aid Commission 351 2003-04 SEARS
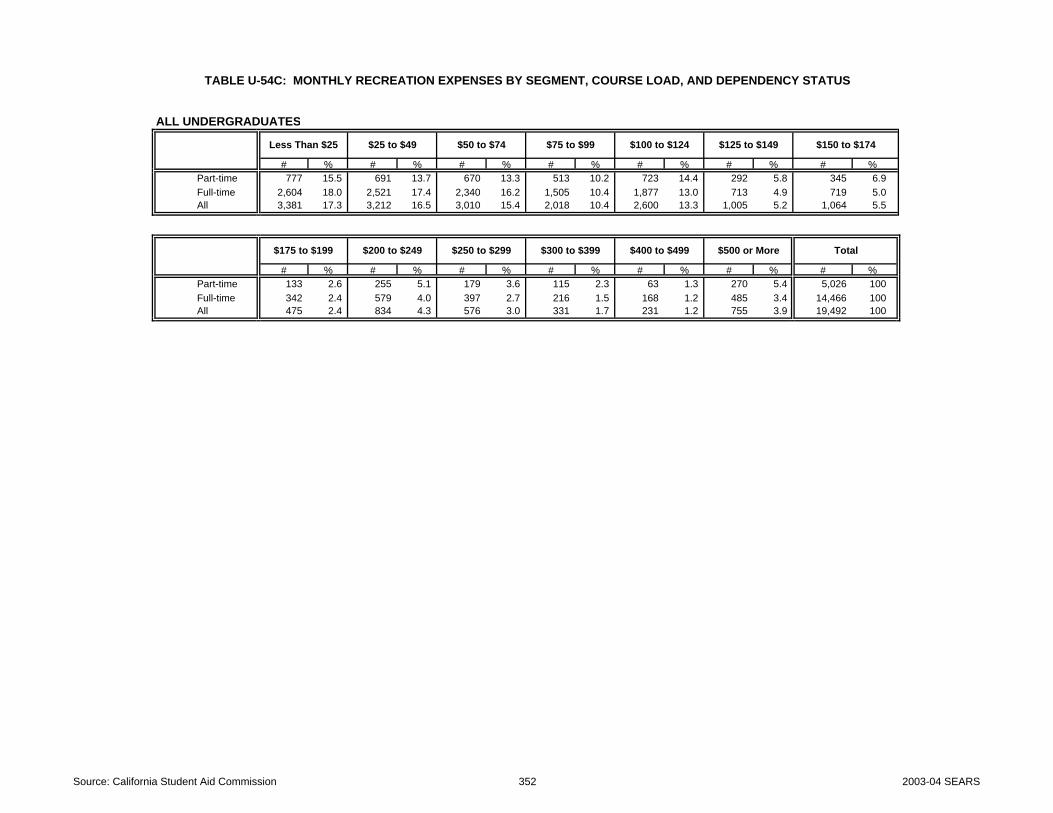
TABLE U-54C: MONTHLY RECREATION EXPENSES BY SEGMENT, COURSE LOAD, AND DEPENDENCY STATUS
ALL UNDERGRADUATES
Less Than $25 $25 to $49 $50 to $74 $75 to $99 $100 to $124 $125 to $149 $150 to $174
# % # % # % # % # % # % # %Part-time 777 15.5 691 13.7 670 13.3 513 10.2 723 14.4 292 5.8 345 6.9 Full-time 2,604 18.0 2,521 17.4 2,340 16.2 1,505 10.4 1,877 13.0 713 4.9 719 5.0 All 3,381 17.3 3,212 16.5 3,010 15.4 2,018 10.4 2,600 13.3 1,005 5.2 1,064 5.5
$175 to $199 $200 to $249 $250 to $299 $300 to $399 $400 to $499 $500 or More Total
# % # % # % # % # % # % # % Part-time 133 2.6 255 5.1 179 3.6 115 2.3 63 1.3 270 5.4 5,026 100
Full-time 342 2.4 579 4.0 397 2.7 216 1.5 168 1.2 485 3.4 14,466 100 All 475 2.4 834 4.3 576 3.0 331 1.7 231 1.2 755 3.9 19,492 100
Source: California Student Aid Commission 352 2003-04 SEARS

DEPENDENT UNDERGRADUATES INDEPENDENT UNDERGRADUATES ALL UNDERGRADUATES
CCC Part-time 1,036 129$ 93$ CCC Part-time 1,578 137$ 98$ CCC Part-time 2,614 134$ 96$ Full-time 2,209 123$ 89$ Full-time 1,207 119$ 83$ Full-time 3,416 122$ 87$ All 3,245 125$ 91$ All 2,785 129$ 95$ All 6,030 127$ 94$
UC Part-time 430 85$ 61$ UC Part-time 68 85$ 61$ UC Part-time 498 85$ 61$ Full-time 2,852 80$ 57$ Full-time 337 92$ 64$ Full-time 3,189 81$ 58$ All 3,282 81$ 58$ All 405 91$ 63$ All 3,687 82$ 58$
CSU Part-time 216 112$ 86$ CSU Part-time 577 132$ 99$ CSU Part-time 793 127$ 96$ Full-time 1,856 103$ 72$ Full-time 1,087 112$ 77$ Full-time 2,943 107$ 73$
All 2,072 104$ 73$ All 1,664 119$ 86$ All 3,736 111$ 78$ ICU Part-time 142 103$ 71$ ICU Part-time 153 149$ 111$ ICU Part-time 295 127$ 102$ Full-time 1,917 95$ 64$ Full-time 337 123$ 90$ Full-time 2,254 99$ 67$
All 2,059 96$ 64$ All 490 131$ 101$ All 2,549 103$ 70$ PCC Part-time 273 115$ 79$ PCC Part-time 553 158$ 115$ PCC Part-time 826 144$ 109$ Full-time 1,031 127$ 82$ Full-time 1,633 127$ 101$ Full-time 2,664 127$ 96$
All 1,304 125$ 82$ All 2,186 135$ 105$ All 3,490 131$ 100$ ALL Part-time 2,097 114$ 90$ ALL Part-time 2,929 140$ 99$ ALL Part-time 5,026 132$ 96$
Full-time 9,865 102$ 73$ Full-time 4,601 119$ 84$ Full-time 14,466 107$ 76$ All 11,962 104$ 79$ All 7,530 127$ 95$ All 19,492 113$ 87$
TABLE 54: MEAN AND MEDIAN OF MONTHLY RECREATION EXPENSES BY SEGMENT, COURSE LOAD, AND DEPENDENCY STATUS
Number Mean Median Number Mean Median Number Mean Median
Source: California Student Aid Commission 353 2003-04 SEARS
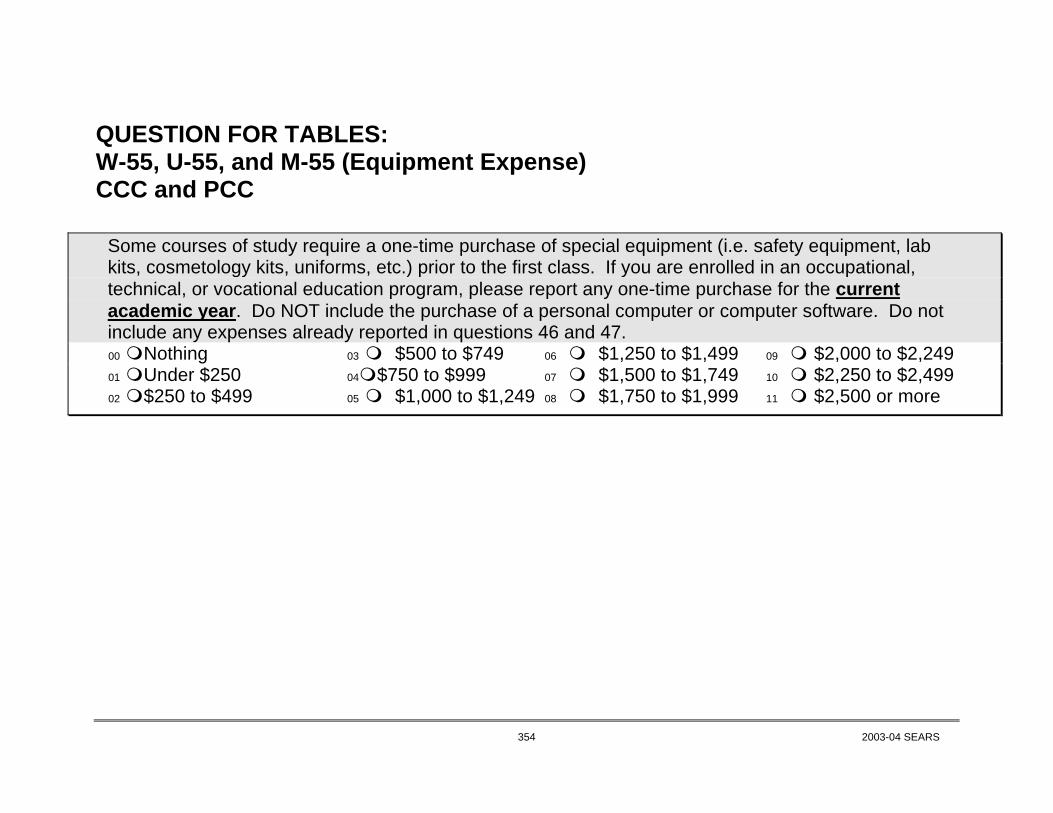
QUESTION FOR TABLES: W-55, U-55, and M-55 (Equipment Expense) CCC and PCC
Some courses of study require a one-time purchase of special equipment (i.e. safety equipment, lab
kits, cosmetology kits, uniforms, etc.) prior to the first class. If you are enrolled in an occupational, technical, or vocational education program, please report any one-time purchase for the current academic year. Do NOT include the purchase of a personal computer or computer software. Do not include any expenses already reported in questions 46 and 47.
00 Nothing 03 $500 to $749 06 $1,250 to $1,499 09 $2,000 to $2,249 01 Under $250 04 $750 to $999 07 $1,500 to $1,749 10 $2,250 to $2,499 02 $250 to $499 05 $1,000 to $1,249 08 $1,750 to $1,999 11 $2,500 or more
354 2003-04 SEARS

DEPENDENT UNDERGRADUATES
Nothing Under $250# % # % # % # % # % # % # % # % # % # % # % # % #
CCC Part-time 257,841 72.5 70,450 19.8 11,801 3.3 2,861 0.8 4,649 1.3 2,503 0.7 1,431 0.4 1,431 0.4 715 0.2 - - 715 0.2 1,073 0.3 355,469 100 Full-time 186,789 73.0 49,504 19.4 7,365 2.9 4,830 1.9 2,294 0.9 1,328 0.5 483 0.2 604 0.2 845 0.3 241 0.1 241 0.1 1,207 0.5 255,733 100 All 444,630 72.7 119,954 19.6 19,166 3.1 7,691 1.3 6,943 1.1 3,832 0.6 1,913 0.3 2,034 0.3 1,560 0.3 241 0.0 957 0.2 2,280 0.4 611,202 100
PCC Part-time 3,235 56.6 951 16.6 428 7.5 314 5.5 196 3.4 186 3.3 30 0.5 223 3.9 45 0.8 - - - - 110 1.9 5,719 100 Full-time 11,551 54.3 4,433 20.8 1,738 8.2 1,108 5.2 760 3.6 465 2.2 137 0.6 118 0.6 251 1.2 53 0.2 129 0.6 529 2.5 21,270 100
All 14,786 54.8 5,384 19.9 2,166 8.0 1,422 5.3 956 3.5 651 2.4 166 0.6 341 1.3 296 1.1 53 0.2 129 0.5 639 2.4 26,989 100 ALL Part-time 261,076 72.3 71,401 19.8 12,229 3.4 3,175 0.9 4,845 1.3 2,689 0.7 1,460 0.4 1,654 0.5 760 0.2 - - 715 0.2 1,183 0.3 361,188 100
Full-time 198,340 71.6 53,937 19.5 9,103 3.3 5,937 2.1 3,054 1.1 1,793 0.6 619 0.2 722 0.3 1,096 0.4 294 0.1 371 0.1 1,737 0.6 277,003 100 All 459,416 72.0 125,338 19.6 21,332 3.3 9,113 1.4 7,899 1.2 4,483 0.7 2,080 0.3 2,375 0.4 1,856 0.3 294 0.0 1,086 0.2 2,919 0.5 638,191 100
INDEPENDENT UNDERGRADUATES
Nothing Under $250# % # % # % # % # % # % # % # % # % # % # % # % #
CCC Part-time 364,769 67.8 110,503 20.5 29,325 5.4 7,510 1.4 8,225 1.5 3,934 0.7 1,431 0.3 2,503 0.5 4,291 0.8 1,073 0.2 358 0.1 4,291 0.8 538,213 100 Full-time 89,229 63.5 29,823 21.2 9,780 7.0 4,105 2.9 2,173 1.5 1,449 1.0 483 0.3 966 0.7 1,087 0.8 121 0.1 121 0.1 1,087 0.8 140,423 100 All 453,998 66.9 140,326 20.7 39,105 5.8 11,615 1.7 10,399 1.5 5,383 0.8 1,913 0.3 3,469 0.5 5,378 0.8 1,194 0.2 478 0.1 5,378 0.8 678,636 100
PCC Part-time 13,263 70.4 2,196 11.7 1,130 6.0 689 3.7 390 2.1 287 1.5 208 1.1 62 0.3 25 0.1 29 0.2 38 0.2 530 2.8 18,846 100 Full-time 27,249 62.2 6,289 14.3 2,918 6.7 1,965 4.5 1,008 2.3 1,863 4.3 217 0.5 261 0.6 163 0.4 363 0.8 128 0.3 1,417 3.2 43,841 100
All 40,512 64.6 8,485 13.5 4,047 6.5 2,654 4.2 1,397 2.2 2,150 3.4 425 0.7 323 0.5 188 0.3 392 0.6 166 0.3 1,947 3.1 62,687 100 ALL Part-time 378,032 67.9 112,699 20.2 30,455 5.5 8,198 1.5 8,615 1.5 4,221 0.8 1,639 0.3 2,565 0.5 4,316 0.8 1,102 0.2 396 0.1 4,822 0.9 557,059 100
Full-time 116,478 63.2 36,112 19.6 12,698 6.9 6,070 3.3 3,181 1.7 3,312 1.8 700 0.4 1,227 0.7 1,250 0.7 484 0.3 249 0.1 2,503 1.4 184,264 100 All 494,510 66.7 148,811 20.1 43,152 5.8 14,269 1.9 11,796 1.6 7,533 1.0 2,339 0.3 3,792 0.5 5,566 0.8 1,585 0.2 645 0.1 7,325 1.0 741,323 100
ALL UNDERGRADUATESPart-time 639,108 69.6 184,100 20.0 42,684 4.6 11,374 1.2 13,460 1.5 6,910 0.8 3,099 0.3 4,219 0.5 5,076 0.6 1,862 0.2 396 0.0 6,004 0.7 918,292 100 Full-time 314,818 68.1 90,049 19.5 21,801 4.7 12,008 2.6 6,235 1.3 5,105 1.1 1,320 0.3 1,949 0.4 2,346 0.5 1,579 0.3 543 0.1 4,240 0.9 461,992 100 All 953,926 69.1 274,149 19.9 64,484 4.7 23,381 1.7 19,695 1.4 12,016 0.9 4,418 0.3 6,168 0.4 7,422 0.5 3,441 0.2 939 0.1 10,244 0.7 1,380,284 100
$250 to $499
(ONE TIME PURCHASE)TABLE W-55: EQUIPMENT EXPENSES BY SEGMENT, COURSE LOAD, AND DEPENDENCY STATUS
$1,750 to $1,999$1,000 to $1,249$750 to $999$500 to $749
$2,250 to $2,499
$2,250 to $2,499
%
%
$250 to $499 $500 to $749 $750 to $999 $1,000 to $1,249 $1,250 to $1,499 $1,500 to $1,749 $2,500 or More
$2,500 or More $2,000 to $2,249
Total
Total$1,250 to $1,499
$1,750 to $1,999 $2,000 to $2,249
$1,500 to $1,749
Source: California Student Aid Commission 355 2003-04 SEARS
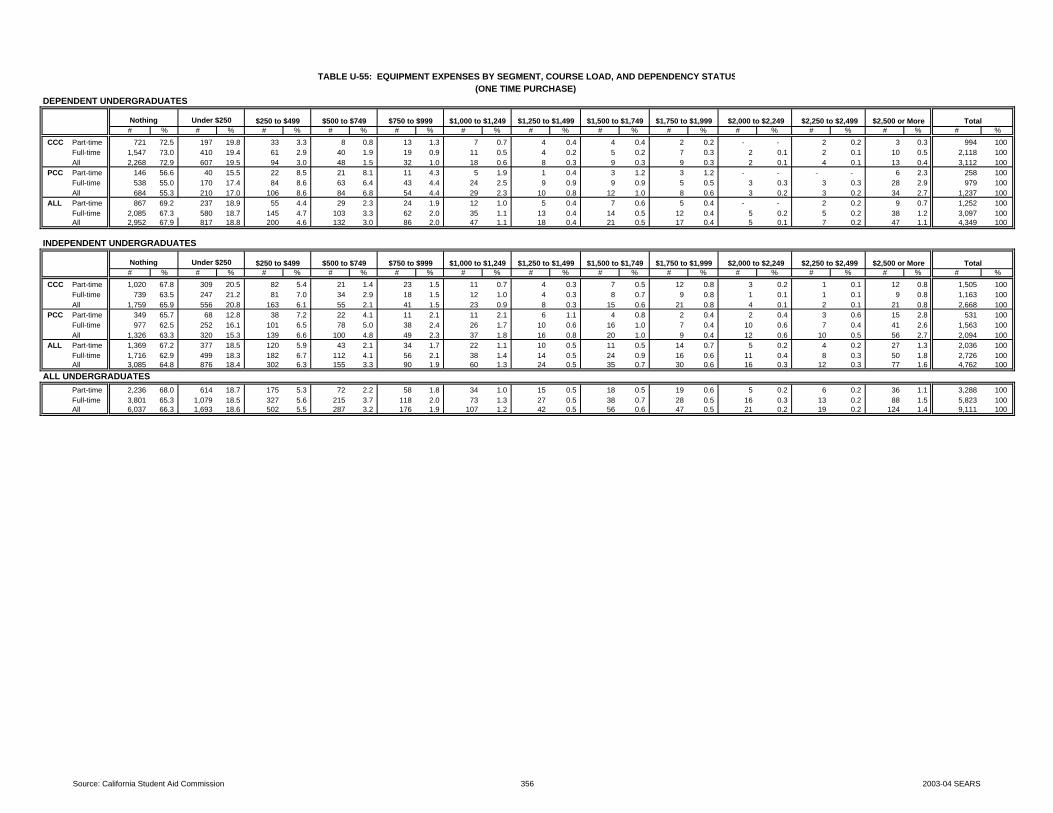
DEPENDENT UNDERGRADUATES
Nothing Under $250# % # % # % # % # % # % # % # % # % # % # % # % #
CCC Part-time 721 72.5 197 19.8 33 3.3 8 0.8 13 1.3 7 0.7 4 0.4 4 0.4 2 0.2 - - 2 0.2 3 0.3 994 100 Full-time 1,547 73.0 410 19.4 61 2.9 40 1.9 19 0.9 11 0.5 4 0.2 5 0.2 7 0.3 2 0.1 2 0.1 10 0.5 2,118 100 All 2,268 72.9 607 19.5 94 3.0 48 1.5 32 1.0 18 0.6 8 0.3 9 0.3 9 0.3 2 0.1 4 0.1 13 0.4 3,112 100
PCC Part-time 146 56.6 40 15.5 22 8.5 21 8.1 11 4.3 5 1.9 1 0.4 3 1.2 3 1.2 - - - - 6 2.3 258 100 Full-time 538 55.0 170 17.4 84 8.6 63 6.4 43 4.4 24 2.5 9 0.9 9 0.9 5 0.5 3 0.3 3 0.3 28 2.9 979 100
All 684 55.3 210 17.0 106 8.6 84 6.8 54 4.4 29 2.3 10 0.8 12 1.0 8 0.6 3 0.2 3 0.2 34 2.7 1,237 100 ALL Part-time 867 69.2 237 18.9 55 4.4 29 2.3 24 1.9 12 1.0 5 0.4 7 0.6 5 0.4 - - 2 0.2 9 0.7 1,252 100
Full-time 2,085 67.3 580 18.7 145 4.7 103 3.3 62 2.0 35 1.1 13 0.4 14 0.5 12 0.4 5 0.2 5 0.2 38 1.2 3,097 100 All 2,952 67.9 817 18.8 200 4.6 132 3.0 86 2.0 47 1.1 18 0.4 21 0.5 17 0.4 5 0.1 7 0.2 47 1.1 4,349 100
INDEPENDENT UNDERGRADUATES
Nothing Under $250# % # % # % # % # % # % # % # % # % # % # % # % #
CCC Part-time 1,020 67.8 309 20.5 82 5.4 21 1.4 23 1.5 11 0.7 4 0.3 7 0.5 12 0.8 3 0.2 1 0.1 12 0.8 1,505 100 Full-time 739 63.5 247 21.2 81 7.0 34 2.9 18 1.5 12 1.0 4 0.3 8 0.7 9 0.8 1 0.1 1 0.1 9 0.8 1,163 100 All 1,759 65.9 556 20.8 163 6.1 55 2.1 41 1.5 23 0.9 8 0.3 15 0.6 21 0.8 4 0.1 2 0.1 21 0.8 2,668 100
PCC Part-time 349 65.7 68 12.8 38 7.2 22 4.1 11 2.1 11 2.1 6 1.1 4 0.8 2 0.4 2 0.4 3 0.6 15 2.8 531 100 Full-time 977 62.5 252 16.1 101 6.5 78 5.0 38 2.4 26 1.7 10 0.6 16 1.0 7 0.4 10 0.6 7 0.4 41 2.6 1,563 100
All 1,326 63.3 320 15.3 139 6.6 100 4.8 49 2.3 37 1.8 16 0.8 20 1.0 9 0.4 12 0.6 10 0.5 56 2.7 2,094 100 ALL Part-time 1,369 67.2 377 18.5 120 5.9 43 2.1 34 1.7 22 1.1 10 0.5 11 0.5 14 0.7 5 0.2 4 0.2 27 1.3 2,036 100
Full-time 1,716 62.9 499 18.3 182 6.7 112 4.1 56 2.1 38 1.4 14 0.5 24 0.9 16 0.6 11 0.4 8 0.3 50 1.8 2,726 100 All 3,085 64.8 876 18.4 302 6.3 155 3.3 90 1.9 60 1.3 24 0.5 35 0.7 30 0.6 16 0.3 12 0.3 77 1.6 4,762 100
ALL UNDERGRADUATESPart-time 2,236 68.0 614 18.7 175 5.3 72 2.2 58 1.8 34 1.0 15 0.5 18 0.5 19 0.6 5 0.2 6 0.2 36 1.1 3,288 100 Full-time 3,801 65.3 1,079 18.5 327 5.6 215 3.7 118 2.0 73 1.3 27 0.5 38 0.7 28 0.5 16 0.3 13 0.2 88 1.5 5,823 100 All 6,037 66.3 1,693 18.6 502 5.5 287 3.2 176 1.9 107 1.2 42 0.5 56 0.6 47 0.5 21 0.2 19 0.2 124 1.4 9,111 100
$250 to $499
TABLE U-55: EQUIPMENT EXPENSES BY SEGMENT, COURSE LOAD, AND DEPENDENCY STATUS(ONE TIME PURCHASE)
$500 to $749
$750 to $999 $1,000 to $1,249 $1,250 to $1,499
$2,500 or More
Total%
$250 to $499
$1,500 to $1,749 $1,750 to $1,999 $2,500 or More $2,000 to $2,249 $2,250 to $2,499 $500 to $749
$750 to $999 $1,000 to $1,249 $1,250 to $1,499 Total%
$1,500 to $1,749 $1,750 to $1,999 $2,000 to $2,249 $2,250 to $2,499
Source: California Student Aid Commission 356 2003-04 SEARS

DEPENDENT UNDERGRADUATES INDEPENDENT UNDERGRADUATES ALL UNDERGRADUATES
CCC Part-time 273 328$ 173$ CCC Part-time 485 401$ 196$ CCC Part-time 758 375$ 187$ Full-time 571 333$ 174$ Full-time 424 413$ 215$ Full-time 995 367$ 189$ All 844 331$ 167$ All 909 407$ 192$ All 1,753 371$ 181$
PCC Part-time 112 619$ 411$ PCC Part-time 182 699$ 385$ PCC Part-time 294 668$ 392$ Full-time 441 636$ 322$ Full-time 586 650$ 416$ Full-time 1,027 644$ 307$
All 553 633$ 282$ All 768 662$ 289$ All 1,321 650$ 279$ ALL Part-time 385 413$ 168$ ALL Part-time 667 483$ 191$ ALL Part-time 1,052 457$ 182$
Full-time 1,012 465$ 177$ Full-time 1,010 551$ 218$ Full-time 2,022 508$ 193$ All 1,397 451$ 172$ All 1,677 524$ 198$ All 3,074 491$ 186$
Note: "Nothing" category was excluded from the means and median calculations.
Number Mean
(ONE TIME PURCHASE)TABLE M-55: MEAN AND MEDIAN EQUIPMENT EXPENSES BY SEGMENT, COURSE LOAD, AND DEPENDENCY STATUS
Number Mean Median Number MedianMean Median
Source: California Student Aid Commission 357 2003-04 SEARS

W-56, and U-56, (Vocational Education Enrollment) CCC and PCC
Are you currently enrolled in an occupational, technical, or vocational education program at your
current school? 00 Yes 01 No
358 2003-04 SEARS
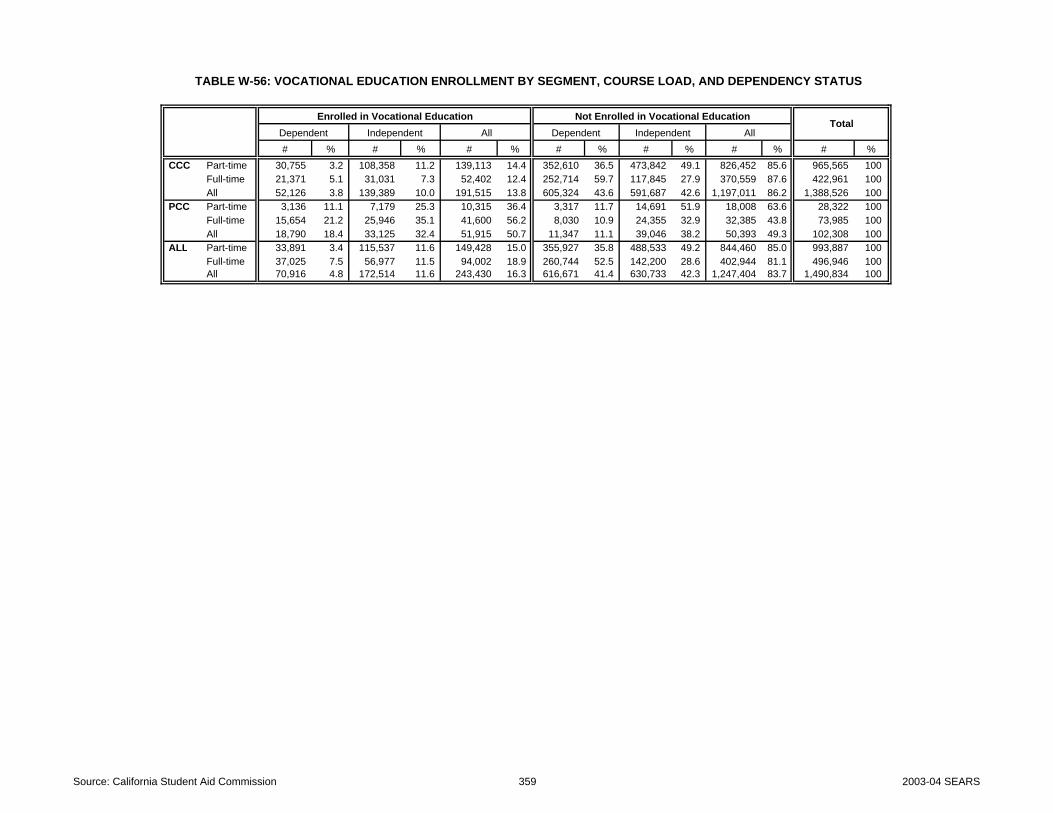
TABLE W-56: VOCATIONAL EDUCATION ENROLLMENT BY SEGMENT, COURSE LOAD, AND DEPENDENCY STATUS
Enrolled in Vocational Education Not Enrolled in Vocational EducationDependent Independent All Dependent Independent All# % # % # % # % # % # % # %
CCC Part-time 30,755 3.2 108,358 11.2 139,113 14.4 352,610 36.5 473,842 49.1 826,452 85.6 965,565 100 Full-time 21,371 5.1 31,031 7.3 52,402 12.4 252,714 59.7 117,845 27.9 370,559 87.6 422,961 100 All 52,126 3.8 139,389 10.0 191,515 13.8 605,324 43.6 591,687 42.6 1,197,011 86.2 1,388,526 100
PCC Part-time 3,136 11.1 7,179 25.3 10,315 36.4 3,317 11.7 14,691 51.9 18,008 63.6 28,322 100 Full-time 15,654 21.2 25,946 35.1 41,600 56.2 8,030 10.9 24,355 32.9 32,385 43.8 73,985 100 All 18,790 18.4 33,125 32.4 51,915 50.7 11,347 11.1 39,046 38.2 50,393 49.3 102,308 100
ALL Part-time 33,891 3.4 115,537 11.6 149,428 15.0 355,927 35.8 488,533 49.2 844,460 85.0 993,887 100 Full-time 37,025 7.5 56,977 11.5 94,002 18.9 260,744 52.5 142,200 28.6 402,944 81.1 496,946 100 All 70,916 4.8 172,514 11.6 243,430 16.3 616,671 41.4 630,733 42.3 1,247,404 83.7 1,490,834 100
Total
Source: California Student Aid Commission 359 2003-04 SEARS

TABLE U-56: VOCATIONAL EDUCATION ENROLLMENT BY SEGMENT, COURSE LOAD, AND DEPENDENCY STATUS
Enrolled in Vocational Education Not Enrolled in Vocational EducationDependent Independent All Dependent Independent All# % # % # % # % # % # % # %
CCC Part-time 86 3.2 303 11.2 389 14.4 986 36.5 1,325 49.1 2,311 85.6 2,700 100 Full-time 177 5.1 257 7.3 434 12.4 2,093 59.7 976 27.9 3,069 87.6 3,503 100 All 263 4.2 560 9.0 823 13.3 3,079 49.6 2,301 37.1 5,380 86.7 6,203 100
PCC Part-time 172 19.3 277 31.2 449 50.5 121 13.6 319 35.9 440 49.5 889 100 Full-time 712 25.2 1,131 40.1 1,843 65.4 371 13.2 606 21.5 977 34.6 2,820 100 All 884 23.8 1,408 38.0 2,292 61.8 492 13.3 925 24.9 1,417 38.2 3,709 100
ALL Part-time 258 7.2 580 16.2 838 23.3 1,107 30.8 1,644 45.8 2,751 76.7 3,589 100 Full-time 889 14.1 1,388 22.0 2,277 36.0 2,464 39.0 1,582 25.0 4,046 64.0 6,323 100 All 1,147 11.6 1,968 19.9 3,115 31.4 3,571 36.0 3,226 32.5 6,797 68.6 9,912 100
Total
Source: California Student Aid Commission 360 2003-04 SEARS

Question for Tables: W-57 and U-57 (Vocational Course of Study) CCC and PCC If you are currently enrolled in an occupational, technical, or vocational education program, which
category best describes your current course of study? 00 Medical/Respiratory Therapy 09 Network Administrator 18 Advertising 01 Medical/Dental Assistant 10 CADD/CAM 20 Public Safety 02 Nursing Program 11 GIS 21 Recreation/Travel 03 Pharmacy Technician 12 Electronic Technician 22 Cosmetology 04 Veterinary Technician 13 Telecommunication 23 Fashion Design 05 Other Medical 14 Graphic Arts 24 Food Services 06 Early Childhood Education 15 Secretarial/Clerical 25 Agriculture/Horticulture 07 Teaching Assistant 16 Business/Accounting 26 Mechanics/Skilled Trade 08 Computer Science 17 Legal Assistant Other
361 2003-04 SEARS

DEPENDENT UNDERGRADUATES
# % # % # % # % # % # % # % # % # %CCC Part-time 1,788 3.7 1,073 2.2 5,722 11.8 - - - - 1,788 3.7 5,364 11.0 1,073 2.2 2,146 4.4
Full-time 483 1.5 362 1.1 3,139 9.8 121 0.4 - - 1,690 5.3 2,173 6.8 966 3.0 1,449 4.5 All 2,271 2.8 1,435 1.8 8,861 11.0 121 0.1 - - 3,479 4.3 7,538 9.3 2,039 2.5 3,595 4.5
PCC Part-time - - 313 8.8 38 1.1 94 2.6 - - 62 1.7 - - - - 227 6.4 Full-time 129 0.8 2,730 16.8 208 1.3 746 4.6 61 0.4 753 4.6 - - 14 0.1 795 4.9 All 129 0.7 3,043 15.4 246 1.2 840 4.2 61 0.3 814 4.1 - - 14 0.1 1,021 5.2
ALL Part-time 1,788 3.4 1,386 2.7 5,760 11.0 94 0.2 - - 1,850 3.5 5,364 10.3 1,073 2.1 2,372 4.5 Full-time 612 1.3 3,092 6.4 3,347 6.9 867 1.8 61 0.1 2,443 5.1 2,173 4.5 980 2.0 2,243 4.6 All 2,400 2.4 4,478 4.5 9,107 9.1 961 1.0 61 0.1 4,293 4.3 7,538 7.5 2,053 2.0 4,616 4.6
# % # % # % # % # % # % # % # % # %CCC Part-time 715 1.5 358 0.7 358 0.7 1,431 2.9 358 0.7 3,219 6.6 - - 5,007 10.3 358 0.7
Full-time 604 1.9 483 1.5 - - 483 1.5 - - 1,811 5.6 121 0.4 2,777 8.6 362 1.1 All 1,319 1.6 841 1.0 358 0.4 1,913 2.4 358 0.4 5,030 6.2 121 0.1 7,784 9.6 720 0.9
PCC Part-time 336 9.4 260 7.3 - - 401 11.3 12 0.3 396 11.1 17 0.5 224 6.3 127 3.6 Full-time 480 3.0 619 3.8 - - 1,362 8.4 56 0.3 1,411 8.7 79 0.5 461 2.8 45 0.3 All 816 4.1 879 4.4 - - 1,763 8.9 69 0.3 1,807 9.1 96 0.5 685 3.5 173 0.9
ALL Part-time 1,051 2.0 617 1.2 358 0.7 1,832 3.5 370 0.7 3,615 6.9 17 0.0 5,231 10.0 485 0.9 Full-time 1,084 2.2 1,102 2.3 - - 1,844 3.8 56 0.1 3,222 6.7 200 0.4 3,238 6.7 408 0.8 All 2,135 2.1 1,720 1.7 358 0.4 3,676 3.7 426 0.4 6,836 6.8 217 0.2 8,468 8.4 893 0.9
# % # % # % # % # % # % # % # % # % # %CCC Part-time 358 0.7 1,073 2.2 - - - - - - 1,431 2.9 715 1.5 2,146 4.4 12,159 25.0 48,636 100
Full-time 362 1.1 966 3.0 - - 121 0.4 - - 1,207 3.8 845 2.6 845 2.6 10,746 33.5 32,117 100 All 720 0.9 2,039 2.5 - - 121 0.1 - - 2,638 3.3 1,560 1.9 2,991 3.7 22,905 28.4 80,753 100
PCC Part-time 70 2.0 - - 10 0.3 - - 471 13.2 54 1.5 - - 9 0.3 442 12.4 3,563 100 Full-time 49 0.3 - - 79 0.5 346 2.1 1,554 9.6 1,422 8.8 - - 824 5.1 2,010 12.4 16,232 100 All 119 0.6 - - 89 0.4 346 1.7 2,025 10.2 1,476 7.5 - - 833 4.2 2,452 12.4 19,795 100
ALL Part-time 428 0.8 1,073 2.1 10 0.0 - - 471 0.9 1,484 2.8 715 1.4 2,155 4.1 12,601 24.1 52,198 100 Full-time 411 0.9 966 2.0 79 0.2 467 1.0 1,554 3.2 2,629 5.4 845 1.7 1,669 3.5 12,756 26.4 48,349 100 All 839 0.8 2,039 2.0 89 0.1 467 0.5 2,025 2.0 4,113 4.1 1,560 1.6 3,824 3.8 25,357 25.2 100,548 100
TABLE W-57A: VOCATIONAL COURSE OF STUDY BY SEGMENT, COURSE LOAD, AND DEPENDENCY STATUS
Mechanics / Skilled Trade Other
Medical / Respiratory
Therapy
Medical & Dental Assistant Nursing Pharmacy Veterinary
Technician Other MedicalEarly
Childhood Education
Teachers Assistant
Computer Sciences
Network Administration CAD/CAM
Geographic Information
Systems
Electronic Technician Telecommunication Graphic Arts Secretarial /
ClericalBusiness / Accounting
Total
Legal Assistant
Advertising Public Security Recreation / Travel Cosmetology Fashion Design Food Service Agriculture /
Horticulture
Source: California Student Aid Commission 362 2003-04 SEARS
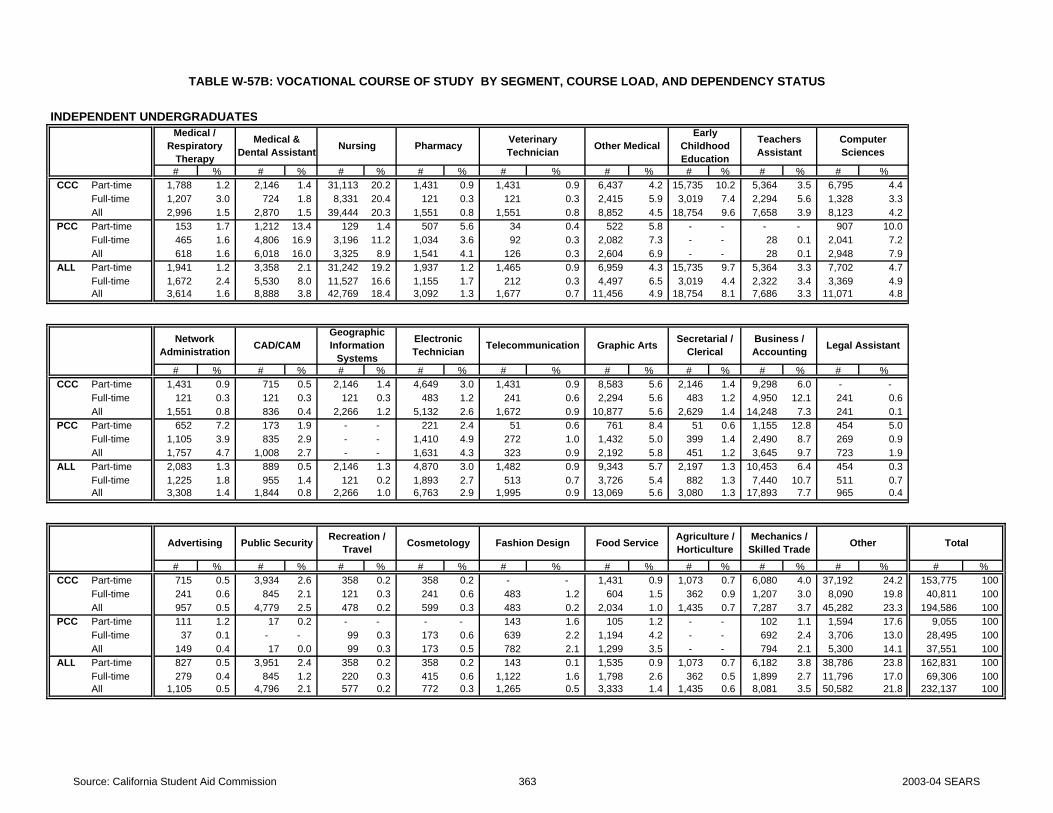
INDEPENDENT UNDERGRADUATES
# % # % # % # % # % # % # % # % # %CCC Part-time 1,788 1.2 2,146 1.4 31,113 20.2 1,431 0.9 1,431 0.9 6,437 4.2 15,735 10.2 5,364 3.5 6,795 4.4
Full-time 1,207 3.0 724 1.8 8,331 20.4 121 0.3 121 0.3 2,415 5.9 3,019 7.4 2,294 5.6 1,328 3.3 All 2,996 1.5 2,870 1.5 39,444 20.3 1,551 0.8 1,551 0.8 8,852 4.5 18,754 9.6 7,658 3.9 8,123 4.2
PCC Part-time 153 1.7 1,212 13.4 129 1.4 507 5.6 34 0.4 522 5.8 - - - - 907 10.0 Full-time 465 1.6 4,806 16.9 3,196 11.2 1,034 3.6 92 0.3 2,082 7.3 - - 28 0.1 2,041 7.2 All 618 1.6 6,018 16.0 3,325 8.9 1,541 4.1 126 0.3 2,604 6.9 - - 28 0.1 2,948 7.9
ALL Part-time 1,941 1.2 3,358 2.1 31,242 19.2 1,937 1.2 1,465 0.9 6,959 4.3 15,735 9.7 5,364 3.3 7,702 4.7 Full-time 1,672 2.4 5,530 8.0 11,527 16.6 1,155 1.7 212 0.3 4,497 6.5 3,019 4.4 2,322 3.4 3,369 4.9 All 3,614 1.6 8,888 3.8 42,769 18.4 3,092 1.3 1,677 0.7 11,456 4.9 18,754 8.1 7,686 3.3 11,071 4.8
# % # % # % # % # % # % # % # % # %CCC Part-time 1,431 0.9 715 0.5 2,146 1.4 4,649 3.0 1,431 0.9 8,583 5.6 2,146 1.4 9,298 6.0 - -
Full-time 121 0.3 121 0.3 121 0.3 483 1.2 241 0.6 2,294 5.6 483 1.2 4,950 12.1 241 0.6 All 1,551 0.8 836 0.4 2,266 1.2 5,132 2.6 1,672 0.9 10,877 5.6 2,629 1.4 14,248 7.3 241 0.1
PCC Part-time 652 7.2 173 1.9 - - 221 2.4 51 0.6 761 8.4 51 0.6 1,155 12.8 454 5.0 Full-time 1,105 3.9 835 2.9 - - 1,410 4.9 272 1.0 1,432 5.0 399 1.4 2,490 8.7 269 0.9 All 1,757 4.7 1,008 2.7 - - 1,631 4.3 323 0.9 2,192 5.8 451 1.2 3,645 9.7 723 1.9
ALL Part-time 2,083 1.3 889 0.5 2,146 1.3 4,870 3.0 1,482 0.9 9,343 5.7 2,197 1.3 10,453 6.4 454 0.3 Full-time 1,225 1.8 955 1.4 121 0.2 1,893 2.7 513 0.7 3,726 5.4 882 1.3 7,440 10.7 511 0.7 All 3,308 1.4 1,844 0.8 2,266 1.0 6,763 2.9 1,995 0.9 13,069 5.6 3,080 1.3 17,893 7.7 965 0.4
# % # % # % # % # % # % # % # % # % # %CCC Part-time 715 0.5 3,934 2.6 358 0.2 358 0.2 - - 1,431 0.9 1,073 0.7 6,080 4.0 37,192 24.2 153,775 100
Full-time 241 0.6 845 2.1 121 0.3 241 0.6 483 1.2 604 1.5 362 0.9 1,207 3.0 8,090 19.8 40,811 100 All 957 0.5 4,779 2.5 478 0.2 599 0.3 483 0.2 2,034 1.0 1,435 0.7 7,287 3.7 45,282 23.3 194,586 100
PCC Part-time 111 1.2 17 0.2 - - - - 143 1.6 105 1.2 - - 102 1.1 1,594 17.6 9,055 100 Full-time 37 0.1 - - 99 0.3 173 0.6 639 2.2 1,194 4.2 - - 692 2.4 3,706 13.0 28,495 100 All 149 0.4 17 0.0 99 0.3 173 0.5 782 2.1 1,299 3.5 - - 794 2.1 5,300 14.1 37,551 100
ALL Part-time 827 0.5 3,951 2.4 358 0.2 358 0.2 143 0.1 1,535 0.9 1,073 0.7 6,182 3.8 38,786 23.8 162,831 100 Full-time 279 0.4 845 1.2 220 0.3 415 0.6 1,122 1.6 1,798 2.6 362 0.5 1,899 2.7 11,796 17.0 69,306 100 All 1,105 0.5 4,796 2.1 577 0.2 772 0.3 1,265 0.5 3,333 1.4 1,435 0.6 8,081 3.5 50,582 21.8 232,137 100
TABLE W-57B: VOCATIONAL COURSE OF STUDY BY SEGMENT, COURSE LOAD, AND DEPENDENCY STATUS
Mechanics / Skilled Trade Other
Medical / Respiratory
Therapy
Medical & Dental Assistant Nursing Pharmacy Veterinary
Technician Other MedicalEarly
Childhood Education
Teachers Assistant
Computer Sciences
Network Administration CAD/CAM
Geographic Information
Systems
Electronic Technician Telecommunication Graphic Arts Secretarial /
ClericalBusiness / Accounting
Total
Legal Assistant
Advertising Public Security Recreation / Travel Cosmetology Fashion Design Food Service Agriculture /
Horticulture
Source: California Student Aid Commission 363 2003-04 SEARS

ALL UNDERGRADUATES
# % # % # % # % # % # % # % # % # %CCC Part-time 3,576 1.8 3,219 1.6 36,835 18.2 1,431 0.7 1,431 0.7 8,225 4.1 21,099 10.4 6,437 3.2 8,940 4.4
Full-time 1,690 2.3 1,087 1.5 11,471 15.7 241 0.3 121 0.2 4,105 5.6 5,192 7.1 3,260 4.5 2,777 3.8 All 5,267 1.9 4,305 1.6 48,305 17.5 1,672 0.6 1,551 0.6 12,330 4.5 26,291 9.5 9,697 3.5 11,718 4.3
PCC Part-time 153 1.2 1,525 12.1 167 1.3 601 4.8 34 0.3 584 4.6 - - - - 1,133 9.0 Full-time 594 1.3 7,536 16.8 3,404 7.6 1,780 4.0 153 0.3 2,835 6.3 - - 42 0.1 2,836 6.3 All 747 1.3 9,061 15.8 3,570 6.2 2,381 4.2 187 0.3 3,418 6.0 - - 42 0.1 3,969 6.9
ALL Part-time 3,729 1.7 4,743 2.2 37,002 17.2 2,031 0.9 1,465 0.7 8,809 4.1 21,099 9.8 6,437 3.0 10,074 4.7 Full-time 2,284 1.9 8,623 7.3 14,874 12.6 2,022 1.7 274 0.2 6,940 5.9 5,192 4.4 3,302 2.8 5,613 4.8 All 6,014 1.8 13,366 4.0 51,876 15.6 4,053 1.2 1,738 0.5 15,749 4.7 26,291 7.9 9,739 2.9 15,687 4.7
# % # % # % # % # % # % # % # % # %CCC Part-time 2,146 1.1 1,073 0.5 2,503 1.2 6,080 3.0 1,788 0.9 11,801 5.8 2,146 1.1 14,305 7.1 358 0.2
Full-time 724 1.0 604 0.8 121 0.2 966 1.3 241 0.3 4,105 5.6 604 0.8 7,728 10.6 604 0.8 All 2,870 1.0 1,677 0.6 2,624 1.0 7,045 2.6 2,030 0.7 15,907 5.8 2,749 1.0 22,032 8.0 961 0.3
PCC Part-time 989 7.8 433 3.4 - - 622 4.9 63 0.5 1,157 9.2 69 0.5 1,379 10.9 581 4.6 Full-time 1,585 3.5 1,454 3.3 - - 2,771 6.2 328 0.7 2,842 6.4 479 1.1 2,950 6.6 315 0.7 All 2,573 4.5 1,887 3.3 - - 3,394 5.9 391 0.7 3,999 7.0 547 1.0 4,330 7.6 896 1.6
ALL Part-time 3,134 1.5 1,506 0.7 2,503 1.2 6,702 3.1 1,852 0.9 12,958 6.0 2,214 1.0 15,684 7.3 939 0.4 Full-time 2,309 2.0 2,058 1.7 121 0.1 3,737 3.2 569 0.5 6,947 5.9 1,082 0.9 10,678 9.1 919 0.8 All 5,443 1.6 3,563 1.1 2,624 0.8 10,439 3.1 2,421 0.7 19,905 6.0 3,297 1.0 26,362 7.9 1,857 0.6
# % # % # % # % # % # % # % # % # % # %CCC Part-time 1,073 0.5 5,007 2.5 358 0.2 358 0.2 - - 2,861 1.4 1,788 0.9 8,225 4.1 49,351 24.4 202,411 100
Full-time 604 0.8 1,811 2.5 121 0.2 362 0.5 483 0.7 1,811 2.5 1,207 1.7 2,053 2.8 18,836 25.8 72,928 100 All 1,677 0.6 6,818 2.5 478 0.2 720 0.3 483 0.2 4,672 1.7 2,995 1.1 10,278 3.7 68,187 24.8 275,339 100
PCC Part-time 182 1.4 17 0.1 10 0.1 - - 613 4.9 159 1.3 - - 111 0.9 2,036 16.1 12,618 100 Full-time 86 0.2 - - 178 0.4 519 1.2 2,194 4.9 2,616 5.8 - - 1,515 3.4 5,716 12.8 44,727 100 All 268 0.5 17 0.0 188 0.3 519 0.9 2,807 4.9 2,774 4.8 - - 1,627 2.8 7,752 13.5 57,345 100
ALL Part-time 1,255 0.6 5,024 2.3 367 0.2 358 0.2 613 0.3 3,020 1.4 1,788 0.8 8,337 3.9 51,387 23.9 215,029 100 Full-time 690 0.6 1,811 1.5 299 0.3 881 0.7 2,677 2.3 4,427 3.8 1,207 1.0 3,568 3.0 24,552 20.9 117,655 100 All 1,945 0.6 6,835 2.1 666 0.2 1,239 0.4 3,290 1.0 7,446 2.2 2,995 0.9 11,905 3.6 75,939 22.8 332,684 100
TABLE W-57C: VOCATIONAL COURSE OF STUDY BY SEGMENT, COURSE LOAD, AND DEPENDENCY STATUS
Mechanics / Skilled Trade Other
Medical / Respiratory
Therapy
Medical & Dental Assistant Nursing Pharmacy Veterinary
Technician Other MedicalEarly
Childhood Education
Teachers Assistant
Computer Sciences
Network Administration CAD/CAM
Geographic Information
Systems
Electronic Technician Telecommunication Graphic Arts Secretarial /
ClericalBusiness / Accounting
Total
Legal Assistant
Advertising Public Security Recreation / Travel Cosmetology Fashion Design Food Service Agriculture /
Horticulture
Source: California Student Aid Commission 364 2003-04 SEARS

DEPENDENT UNDERGRADUATES
# % # % # % # % # % # % # % # % # %CCC Part-time 5 3.7 3 2.2 16 11.8 - - - - 5 3.7 15 11.0 3 2.2 6 4.4
Full-time 4 1.5 3 1.1 26 9.8 1 0.4 - - 14 5.3 18 6.8 8 3.0 12 4.5 All 9 2.2 6 1.5 42 10.4 1 0.2 - - 19 4.7 33 8.2 11 2.7 18 4.5
PCC Part-time - - 19 10.4 3 1.6 4 2.2 - - 3 1.6 - - - - 13 7.1 Full-time 6 0.8 133 17.9 9 1.2 14 1.9 4 0.5 26 3.5 - - 1 0.1 33 4.4 All 6 0.6 152 16.4 12 1.3 18 1.9 4 0.4 29 3.1 - - 1 0.1 46 5.0
ALL Part-time 5 1.6 22 6.9 19 6.0 4 1.3 - - 8 2.5 15 4.7 3 0.9 19 6.0 Full-time 10 1.0 136 13.5 35 3.5 15 1.5 4 0.4 40 4.0 18 1.8 9 0.9 45 4.5 All 15 1.1 158 11.9 54 4.1 19 1.4 4 0.3 48 3.6 33 2.5 12 0.9 64 4.8
# % # % # % # % # % # % # % # % # %CCC Part-time 2 1.5 1 0.7 1 0.7 4 2.9 1 0.7 9 6.6 - - 14 10.3 1 0.7
Full-time 5 1.9 4 1.5 - - 4 1.5 - - 15 5.6 1 0.4 23 8.6 3 1.1 All 7 1.7 5 1.2 1 0.2 8 2.0 1 0.2 24 6.0 1 0.2 37 9.2 4 1.0
PCC Part-time 10 5.5 13 7.1 - - 20 11.0 1 0.5 16 8.8 1 0.5 3 1.6 5 2.7 Full-time 30 4.0 31 4.2 - - 63 8.5 4 0.5 83 11.2 3 0.4 18 2.4 3 0.4 All 40 4.3 44 4.8 - - 83 9.0 5 0.5 99 10.7 4 0.4 21 2.3 8 0.9
ALL Part-time 12 3.8 14 4.4 1 0.3 24 7.5 2 0.6 25 7.9 1 0.3 17 5.3 6 1.9 Full-time 35 3.5 35 3.5 - - 67 6.6 4 0.4 98 9.7 4 0.4 41 4.1 6 0.6 All 47 3.5 49 3.7 1 0.1 91 6.9 6 0.5 123 9.3 5 0.4 58 4.4 12 0.9
# % # % # % # % # % # % # % # % # % # %CCC Part-time 1 0.7 3 2.2 - - - - - - 4 2.9 2 1.5 6 4.4 34 25.0 136 100
Full-time 3 1.1 8 3.0 - - 1 0.4 - - 10 3.8 7 2.6 7 2.6 89 33.5 266 100 All 4 1.0 11 2.7 - - 1 0.2 - - 14 3.5 9 2.2 13 3.2 123 30.6 402 100
PCC Part-time 4 2.2 - - 1 0.5 - - 31 17.0 3 1.6 - - 2 1.1 30 16.5 182 100 Full-time 2 0.3 - - 8 1.1 6 0.8 69 9.3 24 3.2 - - 79 10.6 95 12.8 744 100 All 6 0.6 - - 9 1.0 6 0.6 100 10.8 27 2.9 - - 81 8.7 125 13.5 926 100
ALL Part-time 5 1.6 3 0.9 1 0.3 - - 31 9.7 7 2.2 2 0.6 8 2.5 64 20.1 318 100 Full-time 5 0.5 8 0.8 8 0.8 7 0.7 69 6.8 34 3.4 7 0.7 86 8.5 184 18.2 1,010 100 All 10 0.8 11 0.8 9 0.7 7 0.5 100 7.5 41 3.1 9 0.7 94 7.1 248 18.7 1,328 100
TABLE U-57A: VOCATIONAL COURSE OF STUDY BY SEGMENT, COURSE LOAD, AND DEPENDENCY STATUS
Pharmacy
OtherMechanics / Skilled Trade
Medical / Respiratory
Therapy
Medical & Dental Assistant Nursing Veterinary
Technician Other MedicalEarly
Childhood Education
Teachers Assistant
Computer Sciences
Network Administration CAD/CAM
Geographic Information
Systems
Electronic Technician Telecommunication Graphic Arts Secretarial /
ClericalBusiness / Accounting
Total
Legal Assistant
Advertising Public Security Recreation / Travel Cosmetology Fashion Design Food Service Agriculture /
Horticulture
Source: California Student Aid Commission 365 2003-04 SEARS

INDEPENDENT UNDERGRADUATES
# % # % # % # % # % # % # % # % # %CCC Part-time 5 1.2 6 1.4 87 20.2 4 0.9 4 0.9 18 4.2 44 10.2 15 3.5 19 4.4
Full-time 10 3.0 6 1.8 69 20.4 1 0.3 1 0.3 20 5.9 25 7.4 19 5.6 11 3.3 All 15 2.0 12 1.6 156 20.3 5 0.7 5 0.7 38 4.9 69 9.0 34 4.4 30 3.9
PCC Part-time 6 1.9 37 11.7 10 3.2 9 2.8 2 0.6 25 7.9 - - - - 39 12.3 Full-time 19 1.6 243 20.1 64 5.3 31 2.6 4 0.3 119 9.8 - - 1 0.1 84 6.9 All 25 1.6 280 18.4 74 4.9 40 2.6 6 0.4 144 9.4 - - 1 0.1 123 8.1
ALL Part-time 11 1.5 43 5.8 97 13.0 13 1.7 6 0.8 43 5.8 44 5.9 15 2.0 58 7.8 Full-time 29 1.9 249 16.1 133 8.6 32 2.1 5 0.3 139 9.0 25 1.6 20 1.3 95 6.1 All 40 1.7 292 12.7 230 10.0 45 2.0 11 0.5 182 7.9 69 3.0 35 1.5 153 6.7
# % # % # % # % # % # % # % # % # %CCC Part-time 4 0.9 2 0.5 6 1.4 13 3.0 4 0.9 24 5.6 6 1.4 26 6.0 - -
Full-time 1 0.3 1 0.3 1 0.3 4 1.2 2 0.6 19 5.6 4 1.2 41 12.1 2 0.6 All 5 0.7 3 0.4 7 0.9 17 2.2 6 0.8 43 5.6 10 1.3 67 8.7 2 0.3
PCC Part-time 20 6.3 11 3.5 - - 12 3.8 3 0.9 6 1.9 3 0.9 28 8.9 20 6.3 Full-time 63 5.2 44 3.6 - - 46 3.8 15 1.2 79 6.5 18 1.5 80 6.6 13 1.1 All 83 5.4 55 3.6 - - 58 3.8 18 1.2 85 5.6 21 1.4 108 7.1 33 2.2
ALL Part-time 24 3.2 13 1.7 6 0.8 25 3.4 7 0.9 30 4.0 9 1.2 54 7.2 20 2.7 Full-time 64 4.1 45 2.9 1 0.1 50 3.2 17 1.1 98 6.3 22 1.4 121 7.8 15 1.0 All 88 3.8 58 2.5 7 0.3 75 3.3 24 1.0 128 5.6 31 1.4 175 7.6 35 1.5
# % # % # % # % # % # % # % # % # % # %CCC Part-time 2 0.5 11 2.6 1 0.2 1 0.2 - - 4 0.9 3 0.7 17 4.0 104 24.2 430 100
Full-time 2 0.6 7 2.1 1 0.3 2 0.6 4 1.2 5 1.5 3 0.9 10 3.0 67 19.8 338 100 All 4 0.5 18 2.3 2 0.3 3 0.4 4 0.5 9 1.2 6 0.8 27 3.5 171 22.3 768 100
PCC Part-time 4 1.3 1 0.3 - - - - 11 3.5 3 0.9 - - 8 2.5 58 18.4 316 100 Full-time 2 0.2 - - 10 0.8 3 0.2 31 2.6 21 1.7 - - 61 5.0 158 13.1 1,209 100 All 6 0.4 1 0.1 10 0.7 3 0.2 42 2.8 24 1.6 - - 69 4.5 216 14.2 1,525 100
ALL Part-time 6 0.8 12 1.6 1 0.1 1 0.1 11 1.5 7 0.9 3 0.4 25 3.4 162 21.7 746 100 Full-time 4 0.3 7 0.5 11 0.7 5 0.3 35 2.3 26 1.7 3 0.2 71 4.6 225 14.5 1,547 100 All 10 0.4 19 0.8 12 0.5 6 0.3 46 2.0 33 1.4 6 0.3 96 4.2 387 16.9 2,293 100
TABLE U-57B: VOCATIONAL COURSE OF STUDY BY SEGMENT, COURSE LOAD, AND DEPENDENCY STATUS
Mechanics / Skilled Trade Other
Medical / Respiratory
Therapy
Medical & Dental Assistant Nursing Pharmacy Veterinary
Technician Other MedicalEarly
Childhood Education
Teachers Assistant
Computer Sciences
Network Administration CAD/CAM
Geographic Information
Systems
Electronic Technician Telecommunication Graphic Arts Secretarial /
ClericalBusiness / Accounting
Total
Legal Assistant
Advertising Public Security Recreation / Travel Cosmetology Fashion Design Food Service Agriculture /
Horticulture
Source: California Student Aid Commission 366 2003-04 SEARS

ALL UNDERGRADUATES
# % # % # % # % # % # % # % # % # %CCC Part-time 10 1.8 9 1.6 103 18.2 4 0.7 4 0.7 23 4.1 59 10.4 18 3.2 25 4.4
Full-time 14 2.3 9 1.5 95 15.7 2 0.3 1 0.2 34 5.6 43 7.1 27 4.5 23 3.8 All 24 2.1 18 1.5 198 16.9 6 0.5 5 0.4 57 4.9 102 8.7 45 3.8 48 4.1
PCC Part-time 6 1.2 56 11.2 13 2.6 13 2.6 2 0.4 28 5.6 - - - - 52 10.4 Full-time 25 1.3 376 19.3 73 3.7 45 2.3 8 0.4 145 7.4 - - 2 0.1 117 6.0 All 31 1.3 432 17.6 86 3.5 58 2.4 10 0.4 173 7.1 - - 2 0.1 169 6.9
ALL Part-time 16 1.5 65 6.1 116 10.9 17 1.6 6 0.6 51 4.8 59 5.5 18 1.7 77 7.2 Full-time 39 1.5 385 15.1 168 6.6 47 1.8 9 0.4 179 7.0 43 1.7 29 1.1 140 5.5 All 55 1.5 450 12.4 284 7.8 64 1.8 15 0.4 230 6.4 102 2.8 47 1.3 217 6.0
# % # % # % # % # % # % # % # % # %CCC Part-time 6 1.1 3 0.5 7 1.2 17 3.0 5 0.9 33 5.8 6 1.1 40 7.1 1 0.2
Full-time 6 1.0 5 0.8 1 0.2 8 1.3 2 0.3 34 5.6 5 0.8 64 10.6 5 0.8 All 12 1.0 8 0.7 8 0.7 25 2.1 7 0.6 67 5.7 11 0.9 104 8.9 6 0.5
PCC Part-time 30 6.0 24 4.8 - - 32 6.4 4 0.8 22 4.4 4 0.8 31 6.2 25 5.0 Full-time 93 4.8 75 3.8 - - 109 5.6 19 1.0 162 8.3 21 1.1 98 5.0 16 0.8 All 123 5.0 99 4.0 - - 141 5.8 23 0.9 184 7.5 25 1.0 129 5.3 41 1.7
ALL Part-time 36 3.4 27 2.5 7 0.7 49 4.6 9 0.8 55 5.2 10 0.9 71 6.7 26 2.4 Full-time 99 3.9 80 3.1 1 0.0 117 4.6 21 0.8 196 7.7 26 1.0 162 6.3 21 0.8 All 135 3.7 107 3.0 8 0.2 166 4.6 30 0.8 251 6.9 36 1.0 233 6.4 47 1.3
# % # % # % # % # % # % # % # % # % # %CCC Part-time 3 0.5 14 2.5 1 0.2 1 0.2 - - 8 1.4 5 0.9 23 4.1 138 24.4 566 100
Full-time 5 0.8 15 2.5 1 0.2 3 0.5 4 0.7 15 2.5 10 1.7 17 2.8 156 25.8 604 100 All 8 0.7 29 2.5 2 0.2 4 0.3 4 0.3 23 2.0 15 1.3 40 3.4 294 25.1 1,170 100
PCC Part-time 8 1.6 1 0.2 1 0.2 - - 42 8.4 6 1.2 - - 10 2.0 88 17.7 498 100 Full-time 4 0.2 - - 18 0.9 9 0.5 100 5.1 45 2.3 - - 140 7.2 253 13.0 1,953 100 All 12 0.5 1 0.0 19 0.8 9 0.4 142 5.8 51 2.1 - - 150 6.1 341 13.9 2,451 100
ALL Part-time 11 1.0 15 1.4 2 0.2 1 0.1 42 3.9 14 1.3 5 0.5 33 3.1 226 21.2 1,064 100 Full-time 9 0.4 15 0.6 19 0.7 12 0.5 104 4.1 60 2.3 10 0.4 157 6.1 409 16.0 2,557 100 All 20 0.6 30 0.8 21 0.6 13 0.4 146 4.0 74 2.0 15 0.4 190 5.2 635 17.5 3,621 100
TABLE U-57C: VOCATIONAL COURSE OF STUDY BY SEGMENT, COURSE LOAD, AND DEPENDENCY STATUS
Mechanics / Skilled Trade Other
Medical / Respiratory
Therapy
Medical & Dental Assistant Nursing Pharmacy Veterinary
Technician Other MedicalEarly
Childhood Education
Teachers Assistant
Computer Sciences
Network Administration CAD/CAM
Geographic Information
Systems
Electronic Technician Telecommunication Graphic Arts Secretarial /
ClericalBusiness / Accounting
Total
Legal Assistant
Advertising Public Security Recreation / Travel Cosmetology Fashion Design Food Service Agriculture /
Horticulture
Source: California Student Aid Commission 367 2003-04 SEARS

2003-2004 SEARS Data Casebook
Appendices

California Community College

2003-2004 SEARS – California Community Colleges January 2004
STUDENT EXPENSES AND RESOURCES SURVEY 2003-2004 ACADEMIC YEAR
Dear Community College Student: The California Student Aid Commission, in partnership with the California Community Colleges Chancellor’s Office, conducts a Student Expenses and Resources Survey (SEARS) every three years to determine the actual costs associated with obtaining a postsecondary education in California. Data provided by students in prior years have been used to provide the Legislature with an accurate picture of the cost of attending college in California, which has enabled them to make informed decisions about student financial aid policy and determine typical student expense that is the basis for how much financial aid is provided. You and your fellow classmates have been selected to take part in this study. Because it is important to understand the costs associated with a wide variety of financial aid programs, your answers are vital to this project and your help is very much appreciated.
• It is critical that you respond regardless of whether or not you are receiving any student financial aid.
• The responses you provide will in no way affect any student financial aid you may be receiving.
• Your responses to these questions are confidential and will not be individually identifiable.
Thank you for your help with this very important project. Sincerely,
Diana Fuentes-Michel Executive Director California Student Aid Commission INSTRUCTIONS:
Please read and follow carefully all directions. Indicate your answer to each question by marking the appropriate circle. For each answer, please fill in marks like this: not like this: The survey results will be tallied using a scanning system. Marks that extend outside the circle can be misread, making the results less accurate. Please use Black Ink pen or Dark Lead pencil and do not fold or remove pages.
Please answer every question and mark only one circle per question unless otherwise indicated. If you are not sure of an answer, give us your best estimate. There are six sections on this questionnaire and it should take about thirty minutes to complete.
If you would like to provide additional details or have comments, please write ONLY in the Comments Section on the last page.
Thank you on behalf of all California Community College students.
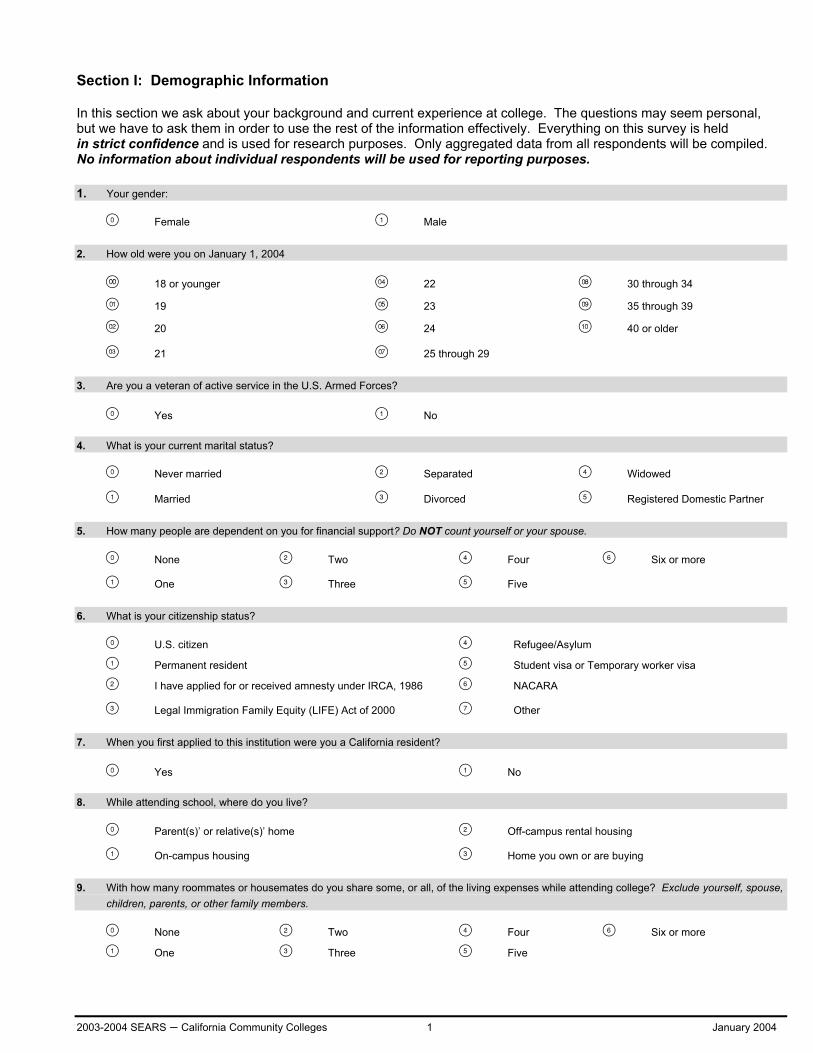
2003-2004 SEARS – California Community Colleges 1 January 2004
Section I: Demographic Information In this section we ask about your background and current experience at college. The questions may seem personal, but we have to ask them in order to use the rest of the information effectively. Everything on this survey is held in strict confidence and is used for research purposes. Only aggregated data from all respondents will be compiled. No information about individual respondents will be used for reporting purposes.
1. Your gender:
Female Male
2. How old were you on January 1, 2004
18 or younger 22 30 through 34
19 23 35 through 39
20 24 40 or older
21 25 through 29
3. Are you a veteran of active service in the U.S. Armed Forces?
Yes No
4. What is your current marital status?
Never married Separated Widowed
Married Divorced Registered Domestic Partner
5. How many people are dependent on you for financial support? Do NOT count yourself or your spouse.
None Two Four Six or more
One Three Five
6. What is your citizenship status?
U.S. citizen Refugee/Asylum
Permanent resident Student visa or Temporary worker visa
I have applied for or received amnesty under IRCA, 1986 NACARA
Legal Immigration Family Equity (LIFE) Act of 2000 Other
7. When you first applied to this institution were you a California resident?
Yes No
8. While attending school, where do you live?
Parent(s)’ or relative(s)’ home Off-campus rental housing
On-campus housing Home you own or are buying
9. With how many roommates or housemates do you share some, or all, of the living expenses while attending college? Exclude yourself, spouse, children, parents, or other family members.
None Two Four Six or more
One Three Five

2003-2004 SEARS – California Community Colleges 2 January 2004
10. How far away from school do you live during the current academic year (e.g., September through May or October through June)?
I live on campus 7 to 8.9 miles 26 to 30.9 miles
Less than 1 mile 9 to 10.9 miles 31 to 35.9 miles
1 to 2.9 miles 11 to 15.9 miles 36 to 40.9 miles
3 to 4.9 miles 16 to 20.9 miles More than 40 miles
5 to 6.9 miles 21 to 25.9 miles
11. Your race/ethnicity:
African American/Black Hispanic/Latino: Pacific Islander:
American Indian or Alaskan Native Central American Guamanian
White/Caucasian Cuban Hawaiian
Asian: Chicano/Mexican American Samoan
Asian Indian Filipino Puerto Rican Other Pacific Islander
Chinese Laotian South American
Japanese Cambodian Other Latino Multi-racial
Korean Pakistani
Vietnamese Other Asian
12. How do you usually commute to and from college? Please check only one.
Live on Campus Bus Rail or train
Walk Car-drive alone Carpool
Bicycle Motorcycle
13. What type of educational institution did you last attend prior to entering your current community college campus?
High school or equivalent Private/independent California four-year college or university
Another California Community College Private/independent California two-year college
California State University campus California private trade, business, or vocational school
University of California campus Out-of-state or foreign college or university
14. Are you currently enrolled in an occupational, technical, or vocational education program at your current community college?
Yes Continue with question 15. No Skip to question 16.
15. If you are enrolled in an occupational, technical, or vocational education program, which category best describes your current course of study?
Medical/Respiratory Therapy Network Administration Advertising
Medical/Dental Assistant CADD/CAM Public Safety
Nursing Program GIS Recreation/Travel
Pharmacy Technician Electronic Technician Cosmetology
Veterinary Technician Telecommunication Fashion Design
Other Medical Graphic Arts Food Service
Early Childhood Education Secretarial/Clerical Agriculture/Horticulture
Teaching Assistant Business/Accounting Mechanics/Skilled Trade Computer Science Legal Assistant Other

2003-2004 SEARS – California Community Colleges 3 January 2004
16. What is the total length of time required to complete your degree or certificate program, regardless of any courses you may already have completed?
EXAMPLES: UNITS=120; or SEMESTERS=12; or MONTHS=16
Units Semesters Months 0 0 0 1 1 1 2 2 2 3 3 3 4 4 4 5 5 5 6 6 6 7 7 7 8 8 8 9 9 9
Using the example above, please fill in the circles for either hours, weeks, or months as it applies to your program: Units Semesters Months 0 0 0 1 1 1 2 2 2 3 3 3 4 4 4 5 5 5 6 6 6 7 7 7 8 8 8
9 9 9
17. For how much of the current academic year (e.g., September through May or October through June) do you intend to be enrolled in college?
At least two semesters or three quarters Less than two semesters or three quarters
Section II: Parental Information Regardless of your age and dependency status, we would like you to answer these next few questions about your parents. These may have influenced your decision to attend college, and are important to our research. 18. What is the current marital status of your parent(s)?
My parents are married to each other.
My parents are separated or divorced from one another, or my parent is widowed or single.
Both of my parents are deceased.
I am a ward of the court, or I was a ward of the court until age 18.
19. How many people, other than yourself, are dependent on your parent(s) for financial support? Do NOT count your parent(s).
None Two Four Six or more
One Three Five
20. Of the dependents indicated above, how many are currently attending college? Do NOT count yourself.
None Two Four Six or more
One Three Five

2003-2004 SEARS – California Community Colleges 4 January 2004
21. What is the highest level of education attained by your parents? Please answer even if one or both of your parents are deceased, or if your parents are separated or divorced. Please check only one for each parent.
Mother’s Education Father’s Education
No formal education
Grade school (K-8)
Some high school
High school diploma/GED
Some college classes
Private trade, business or vocational school degree/certificate
Two-year college degree/certificate
Four-year college degree (BA, BS, etc.)
Teaching credential
Some post-baccalaureate classes
Post-baccalaureate degree (MA, Ph.D., JD, etc.)
I do not know
22. What was the total combined income of your parents from all sources in calendar year 2003? Include salaries, wages, retirement benefits, public assistance, income from investments, child support, and all other income. If you are not sure of the figure, please estimate.
Less than $6,000 $48,000 to $53,999 $96,000 to $107,999
$6,000 to $11,999 $54,000 to $59,999 $108,000 to $119,999
$12,000 to $17,999 $60,000 to $65,999 $120,000 to $143,999
$18,000 to $23,999 $66,000 to $71,999 $144,000 to $167,999
$24,000 to $29,999 $72,000 to $77,999 $168,000 to $191,999
$30,000 to $35,999 $78,000 to $83,999 $192,000 to $215,999
$36,000 to $41,999 $84,000 to $89,999 $216,000 to $239,999
$42,000 to $47,999 $90,000 to $95,999 $240,000 or more
Section III: Student Resources In this section, we ask about your work hours during the summer and academic year and about your income over different time periods. The answers you provide will help us understand how you will meet your college expenses this year. 23. Did/will you receive money from any of the following sources during the current academic year?
a. Employment Training Panel (ETP) Yes No
b. CalWorks Yes No
c. Veteran’s Benefits Yes No
d. Vocational Rehabilitation Yes No
e. SSI-survivor, disability benefits Yes No
24. How many hours on average did you work for pay per week during summer immediately before the current academic year (e.g., from June through August 2003)? Please include paid internships.
None, I did not work last summer
Less than 5 16 to 20 hours 31 to 35 hours
5 to 10 hours 21 to 25 hours 36 to 40 hours
11 to 15 hours 26 to 30 hours 40 hours or more

2003-2004 SEARS – California Community Colleges 5 January 2004
25. My average wage per hour was:
$6.75 or less $9.25 - $9.74 $13.75 - $14.74
$6.76 - $7.24 $9.75 - $10.24 $14.75 - $15.74
$7.25 - $7.74 $10.25 - $10.74 $15.75 - $16.74
$7.75 - $8.24 $10.75 - $11.74 $16.75 or more
$8.25 - $8.74 $11.75 - $12.74
$8.75 - $9.24 $12.75 - $13.74
26. How many hours on average did you work in unpaid internships per week during the summer immediately before the current academic year (e.g., from June through August 2003)?
None, I did not have an unpaid internship
Less than 5 16 to 20 hours 31 to 35 hours
5 to 10 hours 21 to 25 hours 36 to 40 hours
11 to 15 hours 26 to 30 hours 40 hours or more
27. How many hours on average did you volunteer per week during the summer immediately before the current academic year (e.g., from June through August 2003)?
None, I did not volunteer last summer
Less than 5 16 to 20 hours 31 to 35 hours
5 to 10 hours 21 to 25 hours 36 to 40 hours
11 to 15 hours 26 to 30 hours 40 hours or more
28. How many hours on average do you, or will you, work for pay per week during the current academic year (e.g., September through May or October through June)? Include all hours worked during the current academic year Including paid internships.
None, I do not/will not work
Less than 5 16 to 20 hours 31 to 35 hours
5 to 10 hours 21 to 25 hours 36 to 40 hours
11 to 15 hours 26 to 30 hours 40 hours or more
29. My average wage per hour is/was:
$6.75 or less $9.25 - $9.74 $13.75 - $14.74
$6.76 - $7.24 $9.75 - $10.24 $14.75 - $15.74
$7.25 - $7.74 $10.25 - $10.74 $15.75 - $16.74
$7.75 - $8.24 $10.75 - $11.74 $16.75 or more
$8.25 - $8.74 $11.75 - $12.74
$8.75 - $9.24 $12.75 - $13.74
30. How many hours on average do you, or will you, work in unpaid internships per week during the current academic year (e.g., September through May or October through June)?
None, I do not/will not have an unpaid internship
Less than 5 16 to 20 hours 31 to 35 hours
5 to 10 hours 21 to 25 hours 36 to 40 hours
11 to 15 hours 26 to 30 hours 40 hours or more
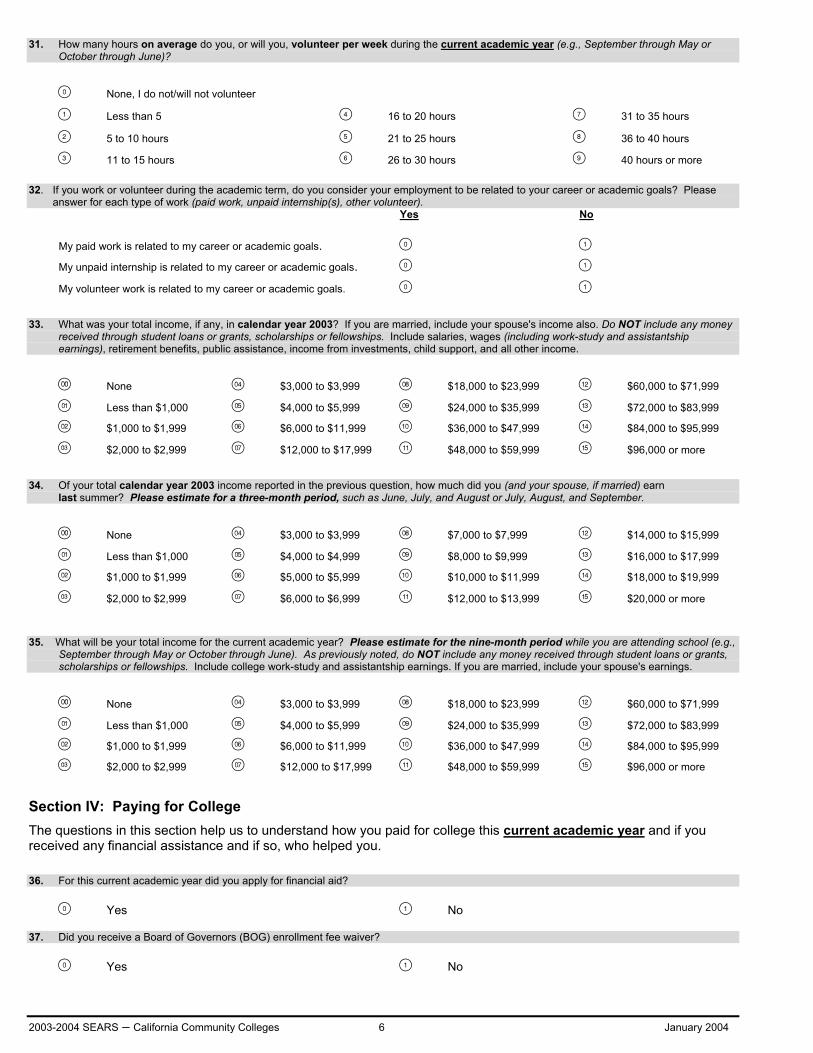
2003-2004 SEARS – California Community Colleges 6 January 2004
31. How many hours on average do you, or will you, volunteer per week during the current academic year (e.g., September through May or October through June)?
None, I do not/will not volunteer
Less than 5 16 to 20 hours 31 to 35 hours
5 to 10 hours 21 to 25 hours 36 to 40 hours
11 to 15 hours 26 to 30 hours 40 hours or more
32. If you work or volunteer during the academic term, do you consider your employment to be related to your career or academic goals? Please answer for each type of work (paid work, unpaid internship(s), other volunteer). Yes No
My paid work is related to my career or academic goals.
My unpaid internship is related to my career or academic goals. My volunteer work is related to my career or academic goals.
33. What was your total income, if any, in calendar year 2003? If you are married, include your spouse's income also. Do NOT include any money received through student loans or grants, scholarships or fellowships. Include salaries, wages (including work-study and assistantship earnings), retirement benefits, public assistance, income from investments, child support, and all other income.
None $3,000 to $3,999 $18,000 to $23,999 $60,000 to $71,999
Less than $1,000 $4,000 to $5,999 $24,000 to $35,999 $72,000 to $83,999
$1,000 to $1,999 $6,000 to $11,999 $36,000 to $47,999 $84,000 to $95,999
$2,000 to $2,999 $12,000 to $17,999 $48,000 to $59,999 $96,000 or more
34. Of your total calendar year 2003 income reported in the previous question, how much did you (and your spouse, if married) earn last summer? Please estimate for a three-month period, such as June, July, and August or July, August, and September.
None $3,000 to $3,999 $7,000 to $7,999 $14,000 to $15,999
Less than $1,000 $4,000 to $4,999 $8,000 to $9,999 $16,000 to $17,999
$1,000 to $1,999 $5,000 to $5,999 $10,000 to $11,999 $18,000 to $19,999
$2,000 to $2,999 $6,000 to $6,999 $12,000 to $13,999 $20,000 or more
35. What will be your total income for the current academic year? Please estimate for the nine-month period while you are attending school (e.g., September through May or October through June). As previously noted, do NOT include any money received through student loans or grants, scholarships or fellowships. Include college work-study and assistantship earnings. If you are married, include your spouse's earnings.
None $3,000 to $3,999 $18,000 to $23,999 $60,000 to $71,999
Less than $1,000 $4,000 to $5,999 $24,000 to $35,999 $72,000 to $83,999
$1,000 to $1,999 $6,000 to $11,999 $36,000 to $47,999 $84,000 to $95,999
$2,000 to $2,999 $12,000 to $17,999 $48,000 to $59,999 $96,000 or more
Section IV: Paying for College The questions in this section help us to understand how you paid for college this current academic year and if you received any financial assistance and if so, who helped you. 36. For this current academic year did you apply for financial aid?
Yes No
37. Did you receive a Board of Governors (BOG) enrollment fee waiver?
Yes No

2003-2004 SEARS – California Community Colleges 7 January 2004
38. How much had you, your parents, or others saved for your college education prior to your attending your first class as an undergraduate? Include savings accounts, education IRAs, savings bonds, Golden State ScholarShare Trust, or any other savings/investment vehicles.
Nothing $10,000 to $14,999 $40,000 to $44,999 $65,000 to $69,999
Less than $500 $15,000 to $19,999 $45,000 to $49,999 $70,000 to $74,999
$500 to $999 $20,000 to $24,999 $50,000 to $54,999 $75,000 to $79,999
$1,000 to $2,999 $25,000 to $29,999 $55,000 to $59,999 $80,000 or more
$3,000 to $4,999 $30,000 to $34,999 $60,000 to $64,999
$5,000 to $9,999 $35,000 to $39,999
39. If you, your parents, or others saved for your college education, which savings vehicles were used? Check all that apply.
Personal Savings Account(s) Certificate of Deposit (CD) Other Qualified Tuition Savings Program Custodial Savings Account Roth IRA Coverdell Education Savings Account
Savings Bonds Trust Fund / Inheritance Do not know
Money Market Account A 529 Savings Program
Mutual Funds/Stocks Golden State ScholarShare Trust
40. What will be the total amount of scholarships, fellowships, and grant assistance awarded to you for the current academic year? Include Pell Grants, Cal Grants, SEOG, or EOPS grants, and any other gift aid (money you do not have to repay) you received or will have received. If an employer is paying for education expenses, include this amount.
Nothing $1,000 to $1,999 $6,000 to $7,999 $14,000 to $15,999
Less than $200 $2,000 to $2,999 $8,000 to $9,999 $16,000 to $17,999
$200 to $499 $3,000 to $3,999 $10,000 to $11,999 $18,000 to $19,999
$500 to $999 $4,000 to $5,999 $12,000 to $13,999 $20,000 or more
41. How much money will your parent(s) contribute to support your education and living expenses each month during the current academic year? Include any monetary support for educational expenses, such as tuition and fees, food, housing, clothing, transportation, or books.
Nothing $800 to $999
Less than $50 $1,000 to $1,199
$50 to $99 $1,200 to $1,399
$100 to $149 $1,400 to $1,599
$150 to $199 $1,600 to $1,799
$200 to $399 $1,800 to $1,999
$400 to $599 $2,000 or more
$600 to $799
42. How much of your own money (and your spouse’s, if married) will you have spent each month during the current academic year on your education and living expenses (and your spouse’s, if married)? Include money spent from savings, earnings, work-study, or other assets to pay for any educational expenses or living expenses. Do NOT include money you spent from loans, grants, scholarships, fellowships, or credit card charges that you have not yet repaid.
Nothing $800 to $999
Less than $50 $1,000 to $1,199
$50 to $99 $1,200 to $1,399
$100 to $149 $1,400 to $1,599
$150 to $199 $1,600 to $1,799
$200 to $399 $1,800 to $1,999
$400 to $599 $2,000 or more
$600 to $799
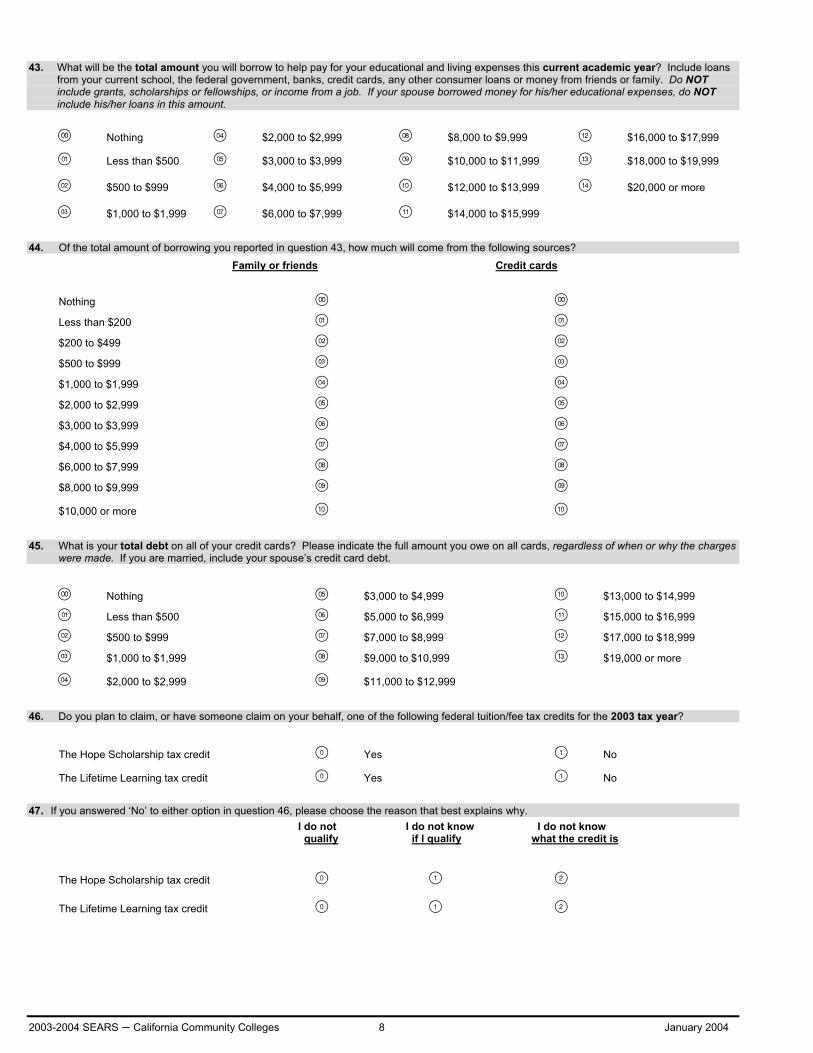
2003-2004 SEARS – California Community Colleges 8 January 2004
43. What will be the total amount you will borrow to help pay for your educational and living expenses this current academic year? Include loans
from your current school, the federal government, banks, credit cards, any other consumer loans or money from friends or family. Do NOT include grants, scholarships or fellowships, or income from a job. If your spouse borrowed money for his/her educational expenses, do NOT include his/her loans in this amount.
Nothing $2,000 to $2,999 $8,000 to $9,999 $16,000 to $17,999
Less than $500 $3,000 to $3,999 $10,000 to $11,999 $18,000 to $19,999
$500 to $999 $4,000 to $5,999 $12,000 to $13,999 $20,000 or more
$1,000 to $1,999 $6,000 to $7,999 $14,000 to $15,999
44. Of the total amount of borrowing you reported in question 43, how much will come from the following sources?
Family or friends Credit cards
Nothing
Less than $200 $200 to $499
$500 to $999
$1,000 to $1,999
$2,000 to $2,999
$3,000 to $3,999
$4,000 to $5,999
$6,000 to $7,999
$8,000 to $9,999
$10,000 or more
45. What is your total debt on all of your credit cards? Please indicate the full amount you owe on all cards, regardless of when or why the charges were made. If you are married, include your spouse’s credit card debt.
Nothing $3,000 to $4,999 $13,000 to $14,999
Less than $500 $5,000 to $6,999 $15,000 to $16,999
$500 to $999 $7,000 to $8,999 $17,000 to $18,999
$1,000 to $1,999 $9,000 to $10,999 $19,000 or more
$2,000 to $2,999 $11,000 to $12,999
46. Do you plan to claim, or have someone claim on your behalf, one of the following federal tuition/fee tax credits for the 2003 tax year?
The Hope Scholarship tax credit Yes No
The Lifetime Learning tax credit Yes No
47. If you answered ‘No’ to either option in question 46, please choose the reason that best explains why. I do not I do not know I do not know qualify if I qualify what the credit is
The Hope Scholarship tax credit
The Lifetime Learning tax credit
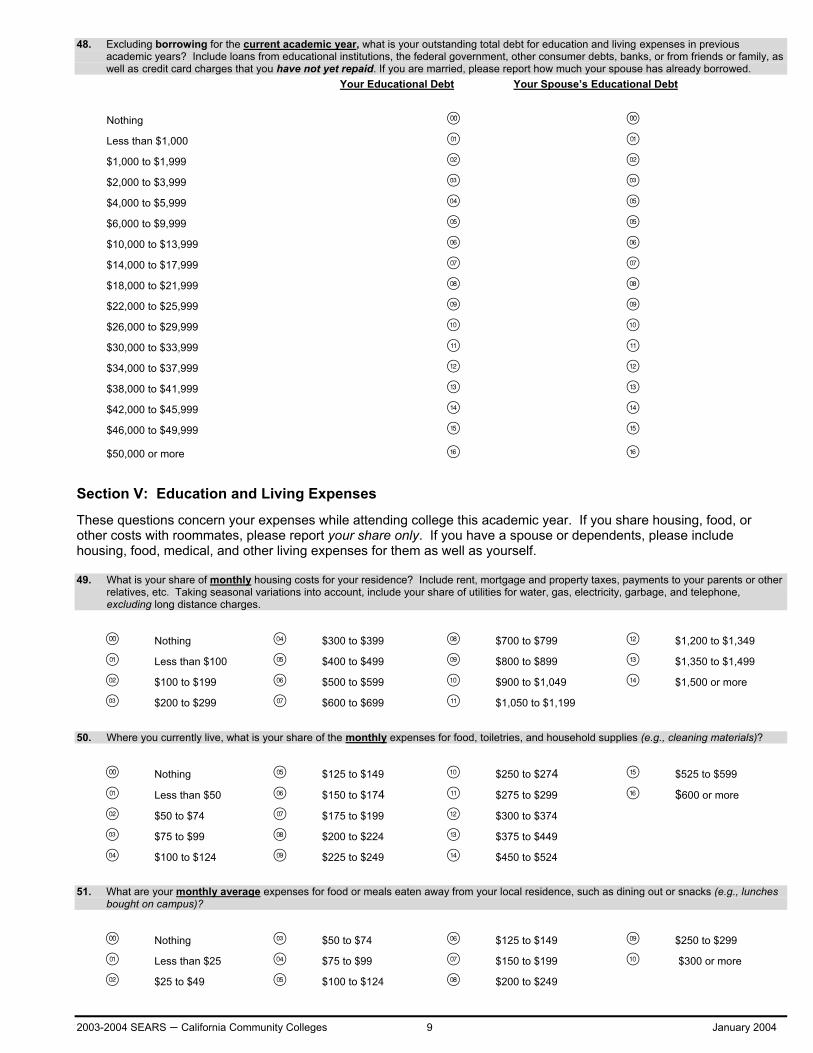
2003-2004 SEARS – California Community Colleges 9 January 2004
48. Excluding borrowing for the current academic year, what is your outstanding total debt for education and living expenses in previous academic years? Include loans from educational institutions, the federal government, other consumer debts, banks, or from friends or family, as well as credit card charges that you have not yet repaid. If you are married, please report how much your spouse has already borrowed.
Your Educational Debt Your Spouse’s Educational Debt
Nothing Less than $1,000
$1,000 to $1,999
$2,000 to $3,999
$4,000 to $5,999
$6,000 to $9,999
$10,000 to $13,999
$14,000 to $17,999
$18,000 to $21,999
$22,000 to $25,999
$26,000 to $29,999
$30,000 to $33,999
$34,000 to $37,999
$38,000 to $41,999
$42,000 to $45,999
$46,000 to $49,999
$50,000 or more
Section V: Education and Living Expenses
These questions concern your expenses while attending college this academic year. If you share housing, food, or other costs with roommates, please report your share only. If you have a spouse or dependents, please include housing, food, medical, and other living expenses for them as well as yourself.
49. What is your share of monthly housing costs for your residence? Include rent, mortgage and property taxes, payments to your parents or other relatives, etc. Taking seasonal variations into account, include your share of utilities for water, gas, electricity, garbage, and telephone, excluding long distance charges.
Nothing $300 to $399 $700 to $799 $1,200 to $1,349
Less than $100 $400 to $499 $800 to $899 $1,350 to $1,499
$100 to $199 $500 to $599 $900 to $1,049 $1,500 or more
$200 to $299 $600 to $699 $1,050 to $1,199
50. Where you currently live, what is your share of the monthly expenses for food, toiletries, and household supplies (e.g., cleaning materials)?
Nothing $125 to $149 $250 to $274 $525 to $599
Less than $50 $150 to $174 $275 to $299 $600 or more
$50 to $74 $175 to $199 $300 to $374
$75 to $99 $200 to $224 $375 to $449
$100 to $124 $225 to $249 $450 to $524
51. What are your monthly average expenses for food or meals eaten away from your local residence, such as dining out or snacks (e.g., lunches bought on campus)?
Nothing $50 to $74 $125 to $149 $250 to $299
Less than $25 $75 to $99 $150 to $199 $300 or more
$25 to $49 $100 to $124 $200 to $249
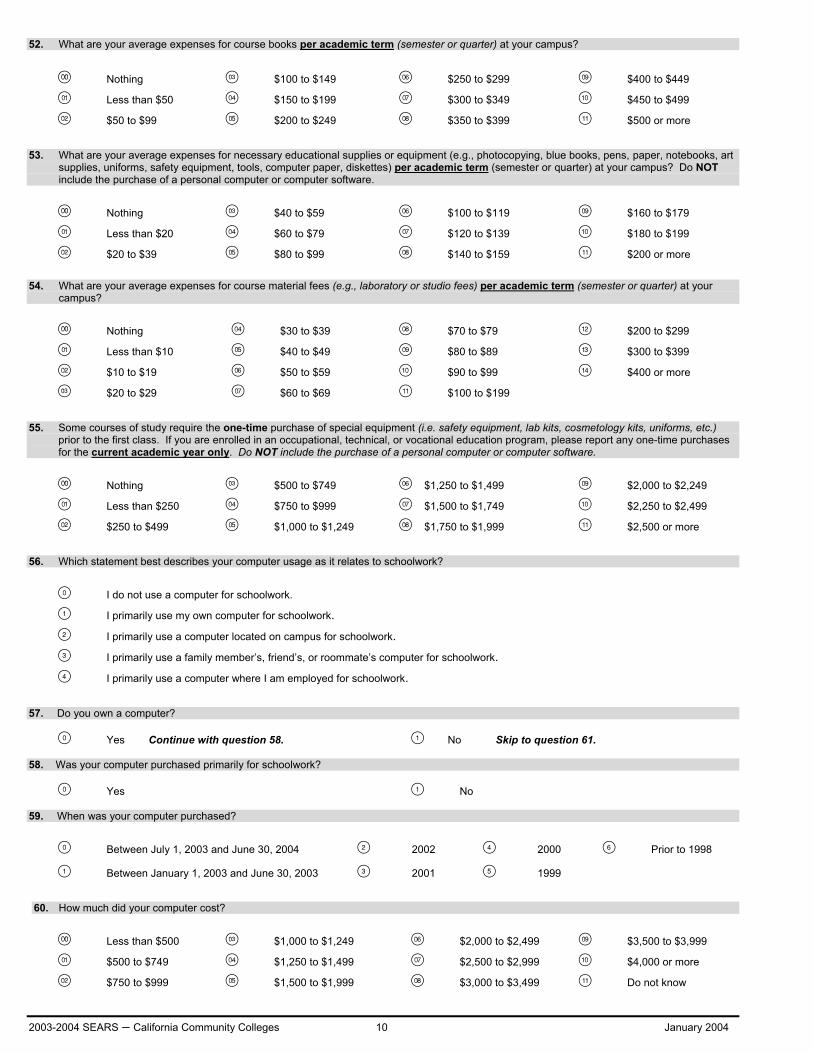
2003-2004 SEARS – California Community Colleges 10 January 2004
52. What are your average expenses for course books per academic term (semester or quarter) at your campus?
Nothing $100 to $149 $250 to $299 $400 to $449
Less than $50 $150 to $199 $300 to $349 $450 to $499
$50 to $99 $200 to $249 $350 to $399 $500 or more
53. What are your average expenses for necessary educational supplies or equipment (e.g., photocopying, blue books, pens, paper, notebooks, art supplies, uniforms, safety equipment, tools, computer paper, diskettes) per academic term (semester or quarter) at your campus? Do NOT include the purchase of a personal computer or computer software.
Nothing $40 to $59 $100 to $119 $160 to $179
Less than $20 $60 to $79 $120 to $139 $180 to $199
$20 to $39 $80 to $99 $140 to $159 $200 or more
54. What are your average expenses for course material fees (e.g., laboratory or studio fees) per academic term (semester or quarter) at your campus?
Nothing $30 to $39 $70 to $79 $200 to $299
Less than $10 $40 to $49 $80 to $89 $300 to $399
$10 to $19 $50 to $59 $90 to $99 $400 or more
$20 to $29 $60 to $69 $100 to $199
55. Some courses of study require the one-time purchase of special equipment (i.e. safety equipment, lab kits, cosmetology kits, uniforms, etc.) prior to the first class. If you are enrolled in an occupational, technical, or vocational education program, please report any one-time purchases for the current academic year only. Do NOT include the purchase of a personal computer or computer software.
Nothing $500 to $749 $1,250 to $1,499 $2,000 to $2,249 Less than $250 $750 to $999 $1,500 to $1,749 $2,250 to $2,499
$250 to $499 $1,000 to $1,249 $1,750 to $1,999 $2,500 or more
56. Which statement best describes your computer usage as it relates to schoolwork?
I do not use a computer for schoolwork.
I primarily use my own computer for schoolwork.
I primarily use a computer located on campus for schoolwork.
I primarily use a family member’s, friend’s, or roommate’s computer for schoolwork.
I primarily use a computer where I am employed for schoolwork.
57. Do you own a computer?
Yes Continue with question 58. No Skip to question 61.
58. Was your computer purchased primarily for schoolwork?
Yes No
59. When was your computer purchased?
Between July 1, 2003 and June 30, 2004 2002 2000 Prior to 1998
Between January 1, 2003 and June 30, 2003 2001 1999
60. How much did your computer cost?
Less than $500 $1,000 to $1,249 $2,000 to $2,499 $3,500 to $3,999
$500 to $749 $1,250 to $1,499 $2,500 to $2,999 $4,000 or more
$750 to $999 $1,500 to $1,999 $3,000 to $3,499 Do not know

2003-2004 SEARS – California Community Colleges 11 January 2004
61. Excluding the purchase price of a computer, what will your total computer-related expenses be for the current academic year? Include hardware, software (excluding entertainment software), repairs, supplies (toner, paper) e-mail, and internet services.
Nothing $125 to $149 $250 to $274 $525 to $599
Less than $50 $150 to $174 $275 to $299 $600 or more
$50 to $74 $175 to $199 $300 to $374
$75 to $99 $200 to $224 $375 to $449
$100 to $124 $225 to $249 $450 to $524
62. What are your monthly average expenses for transportation to and from classes and work (e.g., bus fare, train fare, gasoline, tolls, parking)? If your campus includes transportation costs in your fees, do NOT include them here. Do NOT include car payments, repairs, insurance or registration.
Nothing $30 to $39 $80 to $94 $140 to $159
Less than $10 $40 to $49 $95 to $104 $160 to $179
$10 to $19 $50 to $64 $105 to $119 $180 to $199
$20 to $29 $65 to $79 $120 to $139 $200 or more
63. What are your monthly average expenses for vehicle payments, insurance, repairs, license plates, and parking at your place of residence?
Nothing, or I do not own a vehicle
Less than $50 $100 to $149 $250 to $299
$50 to $74 $150 to $199 $300 to $399
$75 to $99 $200 to $249 $400 or more
64. Please indicate your total monthly medical and dental insurance premiums. If you have partial coverage through your parents, employer, or spouse, please indicate only the portion that you pay.
Nothing $100 to $149 $250 to $299 $400 or more
Less than $50 $150 to $199 $300 to $349 No insurance
$50 to $99 $200 to $249 $350 to $399
65. What are your monthly average expenses for medical and dental costs not covered by insurance (e.g., co-payments, medication, and deductibles)?
Nothing $20 to $29 $50 to $64 $95 to $104
Less than $10 $30 to $39 $65 to $79 $105 to $119
$10 to $19 $40 to $49 $80 to $94 $120 or more
66. What are your monthly average expenses for child or dependent care while participating in education-related activities during this current academic year (e.g., studying, attending classes, field work, commuting, and internships)?
I do not have dependents $150 to $199 $400 to $449 $650 to $699
Nothing $200 to $249 $450 to $499 $700 to $749
Less than $50 $250 to $299 $500 to $549 $750 to $799
$50 to $99 $300 to $349 $550 to $599 $800 to $999
$100 to $149 $350 to $399 $600 to $649 $1,000 or more
67. What are your monthly average expenses for clothing, shoes, laundry, and hair care during this current academic year?
Less than $25 $100 to $124 $175 to $199 $300 to $399
$25 to $49 $125 to $149 $200 to $249 $400 to $499
$50 to $74 $150 to $174 $250 to $299 $500 or more
$75 to $99

2003-2004 SEARS – California Community Colleges 12 January 2004
68. What are your monthly average expenses for recreation and hobbies (e.g., nonacademic books, magazines, music, entertainment software, cable television, movies, concerts, and sporting events) during this current academic year?
Less than $25 $100 to $124 $175 to $199 $300 to $399
$25 to $49 $125 to $149 $200 to $249 $400 to $499
$50 to $74 $150 to $174 $250 to $299 $500 or more
$75 to $99
69. What are your expenses for travel to and from your parent(s)' residence(s) for this current academic year (e.g., airfare, bus fare, train fare, gasoline)?
Current Academic Year Travel Within California Travel Outside California
Does not Apply
I live with my parent(s) Nothing Less than $135 $135 to $269
$270 to $404 $405 to $539 $540 to $674 $675 to $809 $810 to $944 $945 to $1,079 $1,080 to $1,214 $1,215 to $1,349 $1,350 or more Section VI: Student Opinion This last section provides us with information regarding your satisfaction with the education and services you receive. 70. Are/were you enrolled in more than one educational institution for the current academic year?
Yes Continue with question 71. No Skip to question 72.
71. If you answered yes above, what other educational institution do you/did you attend?
A High school or GED program. An independent college or university.
Another Community College. A private trade, business, or vocational school.
A California State University campus. Other.
A University of California campus.
72. Which statement best describes your educational plans for Fall 2004?
I do not plan to enroll in college for Fall 2004. Please continue with question 73. I plan to attend the same campus I am attending now. I plan to transfer to another California Community College. I plan to transfer to a University of California campus. I plan to transfer to a California State University campus. I plan to transfer to a private or independent college or university in California. I plan to transfer to a private trade, business, or vocational school in California. I plan to transfer to an out-of-state college or university. I plan to transfer to a regional occupational center/adult school.
I have not yet decided where I will transfer.
Skip to question 74.

2003-2004 SEARS – California Community Colleges 13 January 2004
73. If you do not plan to enroll in college for Fall 2004, which statement best describes why?
I am finishing my educational program/course before the Fall term. I have lost interest in school.
I have family commitments or problems. I can’t get the courses I need.
I can’t resolve scheduling conflicts between work hours and school. I was dismissed for academic reasons.
I am not enrolling for financial reasons. Other.
74 Based on your experience at the community college you are now attending, how do you rate the following? Good Average Poor Don’t Know
a. Subjects taught
b. Skills learned
c. Instructors
d. Classroom and lab equipment
e. Campus buildings
f. Clubs, intramural sports, and extracurricular activities
g. College as a whole
75. Please evaluate your experience with each of the college services listed below: Have used it, Have used it, but Have heard of it, Have never and it was helpful it was not helpful but never used it heard of it
a. Registration process
b. Orientation c. Testing & assessment for placement d. Counseling e. Tutoring
f. Financial aid g. Transfer Center h. Childcare services i. Job placement services j. EOPS k. CARE l. CalWorks m. Disabled Student Programs and
Services (DSP&S) n. Health Services
76. Following is a list of problems that some students have while attending college. Please rate each one as to the difficulty it presents to you while attending this college.
Not a problem A minor problem A major problem Does not apply
a. Enrolling in the classes I want
b. Paying for tuition, fees, books and supplies c. Paying for living expenses
d. Schoolwork too difficult e. Finding childcare f. Family or work responsibilities g. Scheduling conflicts (work & family) h. Transportation to and from classes i. Interacting with college administration

2003-2004 SEARS – California Community Colleges 14 January 2004
77. Please indicate your experience related to the statements below: Not Yes No Applicable
a. I was able to register for all the classes I wanted, when I wanted them.
b. I was able to register for all the classes I wanted, but not necessarily when I wanted them.
c. I enrolled in fewer total units than planned because I couldn’t get the courses I wanted.
d. I was unable to register for at least one class I wanted or needed, because classes were full or unavailable.
e. I was unable to register for an English class that I need(ed), because classes were full or unavailable.
f. I was unable to register for a Math class that I need(ed), because classes were full or unavailable.
g. I was unable to register for a vocational class that I need(ed), because classes were full or unavailable.
h. I enrolled in a class I would not normally take only because it was available.
i. I enrolled in a class I was not prepared for only because it was available.
78. Please indicate your agreement or disagreement to the statements below:
Strongly Somewhat Strongly Not Agree Agree Agree Disagree Disagree Applicable
a. I enrolled in more units than I planned because I believe the classes may not be available in the future.
b. I am less likely to withdraw from the classes in which I enrolled because I believe the classes may not be available in the future.
c. The increase in fees beginning in Fall 2003 did not greatly affect me.
d. I am less likely to withdraw from classes because I paid a higher fee to enroll.
e. I took fewer courses than planned because of increased fees.
f. I had to seek more financial aid to cover increased fees.
g. I would pay more per unit if I could get the courses I want when I want them.
Comments: Thank you for taking the time to answer all of our questions. Your help is greatly appreciated. Please return your completed questionnaire to the proctor. If you are interested in the survey results, please contact us at [email protected].

University of California

2003-2004 SEARS – University of California March 2004
STUDENT EXPENSES AND RESOURCES SURVEY 2003-2004 ACADEMIC YEAR
Dear University of California Student: The University of California and the California Student Aid Commission need your help. You have been randomly selected to participate in a University survey about how students finance their college education. The University is conducting this survey because, in this era of limited funding, we need to understand how students are actually dealing with the costs of attending the University. We also want to know what your opinions are about the University. As a token of our appreciation, each person who returns a completed questionnaire will be eligible to win a GRAND PRIZE OF $1,000 OR ONE OF TWO $500 RUNNER-UP PRIZES. A random drawing of returned questionnaires will be held after the survey is completed. Winners will be notified by the UC Office of the President. Please do not remove your name and address from the questionnaire, as they will be used for the random drawing and for notification of prizewinners. I guarantee that the information you provide will be treated with absolute confidentiality. The results of this survey will be used strictly for research purposes. Only aggregated data from all respondents will be compiled. No information about individual respondents will be used for reporting. Furthermore, your response will not affect, in any way, your eligibility to win a prize. For your convenience, we have designed the questionnaire so that you can send it back to us simply be reversing the fold and sealing the ends. You have been selected to represent your fellow UC students. You cannot be replaced! Your cooperation is vital and very much appreciated. Sincerely,
Dennis J. Galligani, Ph.D. Associate Vice President Student Academic Services University of California INSTRUCTIONS:
We are interested in your educational experiences during this current 2003-04 academic year. Please read and carefully follow all instructions. Indicate your answer in each question by marking the appropriate circle. For
each answer, please fill in marks like this: not like this: The survey results will be tallied using a scanning system. Marks that extend outside the circle can be misread, making the results less accurate. Please use Black Ink pen or Dark Lead pencil. Please do not remove pages.
Please answer every question unless otherwise indicated. If you’re not sure of an answer, please give us your best estimate. Write explanatory notes ONLY in the Comments Section at the end of the survey. There are six sections on this questionnaire and it should take about forty minutes to complete.
Please return your completed questionnaire with the mailing label intact. The mailing label is primarily used to help us identify non-respondents who will receive a follow-up phone call, but it also contains the identification number that will be used in the random drawing that will determine who wins a prize.
If you need assistance, you may contact us via e-mail at [email protected]. We will contact you as soon as possible.
When you have completed the questionnaire, fold and seal it so that the return address shows on the outside, and mail it as soon as possible.
Thank you on behalf of all University of California students.

2003-2004 SEARS – University of California March 2004 1
Section I: Demographic Information
In this section we ask about your background and current experience at college. The questions may seem personal, but we have to ask them in order to use the rest of the information effectively. Everything on this questionnaire is held in strict confidence and is used for research purposes. Only aggregated data from all respondents will be compiled. No information about individual respondents will be used for reporting purposes.
1. What is your current marital status?
Never married Separated Widowed
Married Divorced Registered Domestic Partner
2. How many people are dependent on you for financial support? Do NOT count yourself or your spouse.
None Two Four Six or more
One Three Five
3. Are you a veteran of active service in the U.S. Armed Forces?
Yes No
4. Where do you live or did you live? Please check only one for each column.
Current Academic Year Previous Summer (2003)
Parent(s)’ or relative(s)’ home
University dormitory or residence hall
University apartment or house
Off-campus non-university apartment, house, or room you are renting
Off-campus non-university dormitory or residence hall
House you own or are buying
Fraternity or sorority
Co-op
5. How far away from school do you live during the current academic year (e.g., September through May or October through June)?
I live on campus 7 to 8.9 miles 26 to 30.9 miles
Less than 1 mile 9 to 10.9 miles 31 to 35.9 miles
1 to 2.9 miles 11 to 15.9 miles 36 to 39.9 miles
3 to 4.9 miles 16 to 20.9 miles More than 40 miles
5 to 6.9 miles 21 to 25.9 miles
6. With how many roommates or housemates do you share some, or all, of the living expenses while attending college? Exclude yourself, spouse, children, parents, or other family members.
None Two Four Six or more
One Three Five
7. For how much of the current academic year (e.g., September through May or October through June) do you intend to be enrolled in college?
Two semesters or more Three quarters or more Less than two semesters Less than three quarters
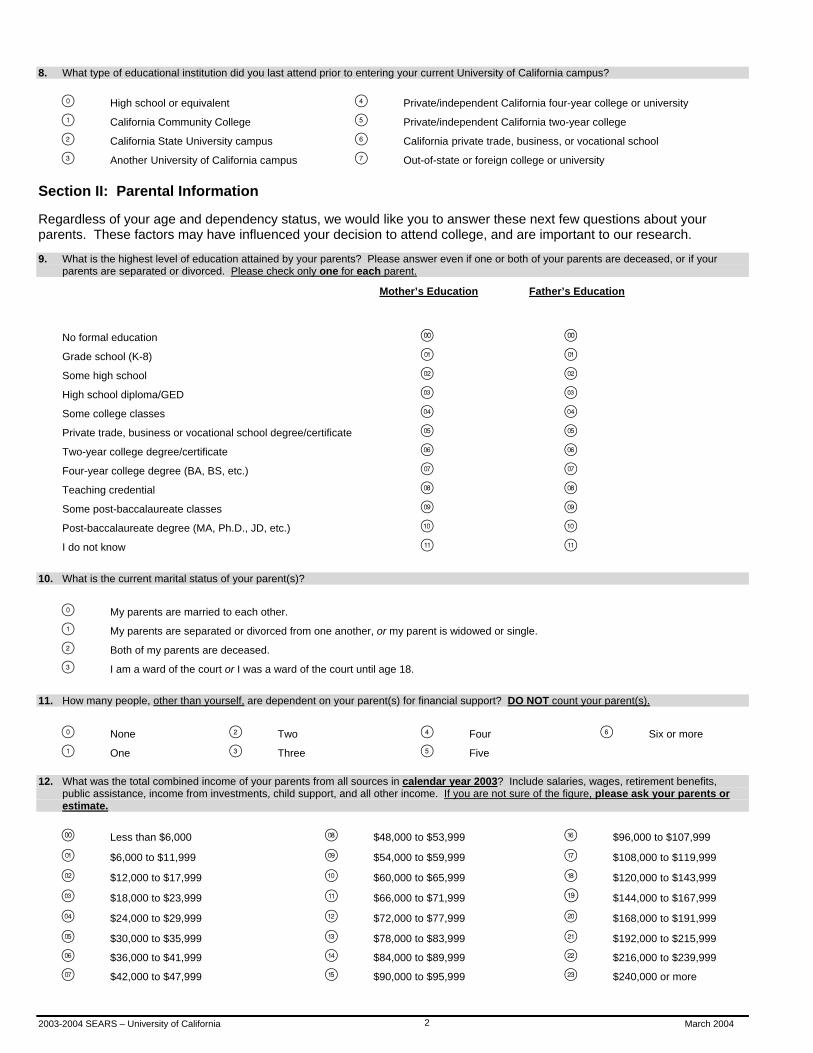
2003-2004 SEARS – University of California March 2004 2
8. What type of educational institution did you last attend prior to entering your current University of California campus?
High school or equivalent Private/independent California four-year college or university California Community College Private/independent California two-year college California State University campus California private trade, business, or vocational school
Another University of California campus Out-of-state or foreign college or university
Section II: Parental Information Regardless of your age and dependency status, we would like you to answer these next few questions about your parents. These factors may have influenced your decision to attend college, and are important to our research. 9. What is the highest level of education attained by your parents? Please answer even if one or both of your parents are deceased, or if your
parents are separated or divorced. Please check only one for each parent.
Mother’s Education Father’s Education
No formal education Grade school (K-8) Some high school High school diploma/GED Some college classes Private trade, business or vocational school degree/certificate Two-year college degree/certificate Four-year college degree (BA, BS, etc.) Teaching credential Some post-baccalaureate classes Post-baccalaureate degree (MA, Ph.D., JD, etc.) I do not know
10. What is the current marital status of your parent(s)?
My parents are married to each other.
My parents are separated or divorced from one another, or my parent is widowed or single. Both of my parents are deceased.
I am a ward of the court or I was a ward of the court until age 18.
11. How many people, other than yourself, are dependent on your parent(s) for financial support? DO NOT count your parent(s).
None Two Four Six or more
One Three Five
12. What was the total combined income of your parents from all sources in calendar year 2003? Include salaries, wages, retirement benefits, public assistance, income from investments, child support, and all other income. If you are not sure of the figure, please ask your parents or estimate.
Less than $6,000 $48,000 to $53,999 $96,000 to $107,999
$6,000 to $11,999 $54,000 to $59,999 $108,000 to $119,999
$12,000 to $17,999 $60,000 to $65,999 $120,000 to $143,999
$18,000 to $23,999 $66,000 to $71,999 $144,000 to $167,999
$24,000 to $29,999 $72,000 to $77,999 $168,000 to $191,999
$30,000 to $35,999 $78,000 to $83,999 $192,000 to $215,999
$36,000 to $41,999 $84,000 to $89,999 $216,000 to $239,999
$42,000 to $47,999 $90,000 to $95,999 $240,000 or more

2003-2004 SEARS – University of California March 2004 3
Section III: Student Resources In this section, we ask about your work hours during the current academic year (2003-04) and about your income over different time periods. The answers you provide will help us understand how you will meet your college expenses this year.
13. Did/will you receive money from Temporary Assistance for Needy Families (TANF) during the current academic year?
Yes No
14. How many hours on average did you work for pay per week in University employment during last summer (e.g., from June through August 2003)? Please include paid internships.
None, I did not work 16 to 20 hours 36 to 39 hours Less than 5 21 to 25 hours 40 hours or more 5 to 10 hours 26 to 30 hours 11 to 15 hours 31 to 35 hours
15. My average wage per hour was:
$6.75 or less $9.25 - $9.74 $13.75 - $14.74
$6.76 - $7.24 $9.75 - $10.24 $14.75 - $15.74 $7.25 - $7.74 $10.25 - $10.74 $15.75 - $16.74
$7.75 - $8.24 $10.75 - $11.74 $16.75 or more $8.25 - $8.74 $11.75 - $12.74
$8.75 - $9.24 $12.75 - $13.74
16. How many hours on average did you work for pay per week in non-University employment during last summer (e.g., from June through August 2003)? Please include paid internships.
None, I did not work 16 to 20 hours 36 to 39 hours Less than 5 21 to 25 hours 40 hours or more 5 to 10 hours 26 to 30 hours 11 to 15 hours 31 to 35 hours
17. My average wage per hour was:
$6.75 or less $9.25 - $9.74 $13.75 - $14.74
$6.76 - $7.24 $9.75 - $10.24 $14.75 - $15.74 $7.25 - $7.74 $10.25 - $10.74 $15.75 - $16.74
$7.75 - $8.24 $10.75 - $11.74 $16.75 or more $8.25 - $8.74 $11.75 - $12.74 $8.75 - $9.24 $12.75 - $13.74
18. How many hours on average did you work in unpaid internships per week during last summer (e.g., from June through August 2003)?
None, I did not have an internship 16 to 20 hours 36 to 39 hours
Less than 5 21 to 25 hours 40 hours or more 5 to 10 hours 26 to 30 hours 11 to 15 hours 31 to 35 hours

2003-2004 SEARS – University of California March 2004 4
19. How many hours on average did you volunteer per week during the summer immediately before the current academic year (e.g., from June through August 2003)?
None, I did not volunteer 16 to 20 hours 36 to 39 hours
Less than 5 21 to 25 hours 40 hours or more 5 to 10 hours 26 to 30 hours 11 to 15 hours 31 to 35 hours
20. How many hours on average do you, or will you, work for pay per week in University employment during the current academic year (e.g., September through May or October through June)? Please include paid internships.
None, I do not/will not work 16 to 20 hours 36 to 39 hours
Less than 5 21 to 25 hours 40 hours or more
5 to 10 hours 26 to 30 hours 11 to 15 hours 31 to 35 hours
21. My average wage per hour is/will be:
$6.75 or less $9.25 - $9.74 $13.75 - $14.74
$6.76 - $7.24 $9.75 - $10.24 $14.75 - $15.74 $7.25 - $7.74 $10.25 - $10.74 $15.75 - $16.74
$7.75 - $8.24 $10.75 - $11.74 $16.75 or more $8.25 - $8.74 $11.75 - $12.74
$8.75 - $9.24 $12.75 - $13.74
22. How many hours on average do you, or will you, work for pay per week in non-University employment during the current academic year (e.g., September through May or October through June)? Please include paid internships.
None, I do not/will not work 16 to 20 hours 36 to 39 hours
Less than 5 21 to 25 hours 40 hours or more
5 to 10 hours 26 to 30 hours
11 to 15 hours 31 to 35 hours
23. My average wage per hour is/will be:
$6.75 or less $9.25 - $9.74 $13.75 - $14.74
$6.76 - $7.24 $9.75 - $10.24 $14.75 - $15.74 $7.25 - $7.74 $10.25 - $10.74 $15.75 - $16.74
$7.75 - $8.24 $10.75 - $11.74 $16.75 or more $8.25 - $8.74 $11.75 - $12.74
$8.75 - $9.24 $12.75 - $13.74
24. How many hours on average do you, or will you, work in unpaid internships per week during the current academic year (e.g., September through May or October through June)?
None, I do not/will not intern 16 to 20 hours 36 to 39 hours
Less than 5 21 to 25 hours 40 hours or more 5 to 10 hours 26 to 30 hours
11 to 15 hours 31 to 35 hours

2003-2004 SEARS – University of California March 2004 5
25. How many hours on average do you, or will you, volunteer per week during the current academic year (e.g., September through May or October through June)?
None, I do/will not volunteer 16 to 20 hours 36 to 39 hours
Less than 5 21 to 25 hours 40 hours or more
5 to 10 hours 26 to 30 hours
11 to 15 hours 31 to 35 hours
26. If you work or volunteer during the current academic term, do you consider your employment to be related to your career or academic goals? Please answer for each type of work (paid, unpaid internship(s), other volunteer work). Yes No
My paid work is related to my career or academic goals.
My unpaid internship is related to my career or academic goals. My volunteer work is related to my career or academic goals.
27. If you did NOT work for pay during the summer months, which of the choices below best describes your summer activities?
I was enrolled in summer school. I traveled.
I did volunteer work or had an unpaid internship.
Other
28. What was your total income, if any, in calendar year 2003? If you are married, include your spouse's income also. DO NOT include any money received through student loans or grants, scholarships or fellowships. Include salaries, wages (including work-study and assistantship earnings), retirement benefits, public assistance, income from investments, child support, and all other income.
None $3,000 to $3,999 $18,000 to $23,999 $60,000 to $71,999 Less than $1,000 $4,000 to $5,999 $24,000 to $35,999 $72,000 to $83,999 $1,000 to $1,999 $6,000 to $11,999 $36,000 to $47,999 $84,000 to $95,999
$2,000 to $2,999 $12,000 to $17,999 $48,000 to $59,999 $96,000 or more
29. Of your total calendar year 2003 income reported in the previous question, how much did you (and your spouse, if married) earn last summer? Please estimate for a three-month period, such as June, July, and August or July, August, and September.
None $3,000 to $3,999 $7,000 to $7,999 $14,000 to $15,999 Less than $1,000 $4,000 to $4,999 $8,000 to $9,999 $16,000 to $17,999 $1,000 to $1,999 $5,000 to $5,999 $10,000 to $11,999 $18,000 to $19,999
$2,000 to $2,999 $6,000 to $6,999 $12,000 to $13,999 $20,000 or more
30. How much of your summer income did you save to use for your current academic year expenses?
None 20 to 29% 50 to 59% 80 to 89% Less than 10% 30 to 39% 60 to 69% 90% or more
10 to 19% 40 to 49% 70 to 79%
31. What will be your total income for the current academic year? Please estimate for the nine-month period while you are attending school (e.g., September through May or October through June). As previously noted, DO NOT include any money received through student loans or grants, scholarships or fellowships. Include college work-study and assistantship earnings. If you are married, include your spouse's earnings.
None $3,000 to $3,999 $18,000 to $23,999 $60,000 to $71,999 Less than $1,000 $4,000 to $5,999 $24,000 to $35,999 $72,000 to $83,999 $1,000 to $1,999 $6,000 to $11,999 $36,000 to $47,999 $84,000 to $95,999
$2,000 to $2,999 $12,000 to $17,999 $48,000 to $59,999 $96,000 or more

2003-2004 SEARS – University of California March 2004 6
Section IV: Paying for College The questions in this section help us to understand how you paid for college this current academic year (2003-04) and, if you received any financial assistance, who helped you. 32. For this current nine-month academic year did you apply for financial aid?
Yes No
33. Do you plan to claim, or have someone claim on your behalf, one of the following federal tuition/fee tax credits for the 2003 tax year?
Yes No
The Hope Scholarship tax credit The Lifetime Learning tax credit
34. If you answered ‘No’ to either option above, please choose the reason that best explains why.
I do not qualify I do not know if I qualify I do not know what the credit is
The Hope Scholarship tax credit The Lifetime Learning tax credit
35. Do your parents own their own home?
Yes No
36. If you answered ‘Yes” above, did your parent(s) take out a home equity loan to help finance your education?
Yes No
37. Will you repay (either in part or full) any loans your parents may have taken out on your behalf?
Yes No
38. If you, your parents, or others saved for your college education, which savings vehicles were used? Please check all that apply.
Personal Savings Account(s) Certificate of Deposit (CD) Other Qualified Tuition Savings Program
Custodial Savings Account Roth IRA Coverdell Education Savings Account
Savings Bonds Trust Fund / Inheritance I do not know
Money Market Account A 529 Savings Program
Mutual Funds/Stocks Golden State ScholarShare Trust
39. How much had you, your parents, or others saved for your college education prior to you attending your first class as an undergraduate? Include savings accounts, education IRAs, savings bonds, Golden State ScholarShare Trust, or any other savings vehicles.
Nothing $10,000 to $14,999 $40,000 to $44,999 $65,000 to $69,999
Less than $500 $15,000 to $19,999 $45,000 to $49,999 $70,000 to $74,999
$500 to $999 $20,000 to $24,999 $50,000 to $54,999 $75,000 to $79,999
$1,000 to $2,999 $25,000 to $29,999 $55,000 to $59,999 $80,000 or more
$3,000 to $4,999 $30,000 to $34,999 $60,000 to $64,999 I do not know
$5,000 to $9,999 $35,000 to $39,999

2003-2004 SEARS – University of California March 2004 7
40. What will be the total amount of scholarships, fellowships, and grant assistance awarded to you for the current nine-month academic year?
Include Pell Grants, Cal Grants, SEOG, or EOPS grants, and any other gift aid (money you do not have to repay) you received or will have received. If an employer is paying for education expenses, include this amount.
Nothing $1,000 to $1,999 $6,000 to $7,999 $14,000 to $15,999
Less than $200 $2,000 to $2,999 $8,000 to $9,999 $16,000 to $17,999
$200 to $499 $3,000 to $3,999 $10,000 to $11,999 $18,000 to $19,999
$500 to $999 $4,000 to $5,999 $12,000 to $13,999 $20,000 or more
41. How much of your own money (and your spouse’s, if married) will you have spent each month during the current nine-month academic year on your education and living expenses? Include money spent from savings, earnings, work-study, or other assets. DO NOT include money you spent from loans, grants, scholarships, fellowships, or credit card charges that you have not yet repaid.
Nothing $200 to $399 $1,200 to $1,399
Less than $50 $400 to $599 $1,400 to $1,599
$50 to $99 $600 to $799 $1,600 to $1,799
$100 to $149 $800 to $999 $1,800 to $1,999
$150 to $199 $1,000 to $1,199 $2,000 or more
42. How much money will your parent(s) contribute to support your education and living expenses each month during the current nine-month academic year? Include any monetary support for educational expenses, such as tuition and fees, food, housing, clothing, transportation, or books.
Nothing $200 to $399 $1,200 to $1,399
Less than $50 $400 to $599 $1,400 to $1,599
$50 to $99 $600 to $799 $1,600 to $1,799
$100 to $149 $800 to $999 $1,800 to $1,999
$150 to $199 $1,000 to $1,199 $2,000 or more
43. What will be the total amount you will borrow to help pay for your educational and living expenses for the current nine-month academic year? Include loans from this school, the federal government, banks, credit cards, or money from friends or family. DO NOT include grants, scholarships or fellowships, or income from a job. If your spouse borrowed money for his/her educational expenses, DO NOT include his/her loans in this amount.
Nothing $2,000 to $2,999 $8,000 to $9,999 $16,000 to $17,999
Less than $500 $3,000 to $3,999 $10,000 to $11,999 $18,000 to $19,999
$500 to $999 $4,000 to $5,999 $12,000 to $13,999 $20,000 or more
$1,000 to $1,999 $6,000 to $7,999 $14,000 to $15,999
44. Of the total amount of borrowing you reported in question 43, how much will come from the following sources? Family or friends Credit cards
Nothing Less than $200 $200 to $499 $500 to $999 $1,000 to $1,999 $2,000 to $2,999 $3,000 to $3,999 $4,000 to $5,999 $6,000 to $7,999 $8,000 to $9,999 $10,000 or more

2003-2004 SEARS – University of California March 2004 8
45. What is your total debt on all of your credit cards? Please indicate the full amount you owe on all cards, regardless of when or why the charges were made. If you are married, include your spouse’s credit card debt.
Nothing $3,000 to $4,999 $13,000 to $14,999 Less than $500 $5,000 to $6,999 $15,000 to $16,999 $500 to $999 $7,000 to $8,999 $17,000 to $18,999 $1,000 to $1,999 $9,000 to $10,999 $19,000 or more
$2,000 to $2,999 $11,000 to $12,999
46. Excluding borrowing for the current academic year, what is your outstanding total debt for education and living expenses in previous academic years? Include loans from the federal government, educational institutions, banks, or from friends or family, as well as credit card charges that you have not yet repaid. If you are married, please report how much your spouse has already borrowed.
Your Educational Debt Your Spouse’s Educational Debt
Nothing Less than $1,000 $1,000 to $1,999 $2,000 to $3,999 $4,000 to $5,999 $6,000 to $9,999 $10,000 to $13,999 $14,000 to $17,999 $18,000 to $21,999 $22,000 to $25,999 $26,000 to $29,999 $30,000 to $33,999 $34,000 to $37,999 $38,000 to $41,999 $42,000 to $45,999 $46,000 to $49,999 $50,000 or more
Section V: Education and Living Expenses
These questions concern your expenses while attending college this current academic year (2003-04). If you share housing, food, or other costs with roommates, please report your share only. If you have a spouse or dependents, please include housing, food, medical, and other living expenses for them as well as yourself. 47. Which of the following statements best describes your current housing arrangement?
I have a housing contract which includes both room and food (meal and/or points plan). Please continue with questions 48 and 49.
I have a housing contract which does not include food (meal and/or points plan). Please skip to question 50.
I do not have a housing contract. Please skip to question 50.
48. What is the cost of your room and food contract? Monthly Average OR Current Academic Year
Less than $300 Less than $2,700
$300 to $399 $2,700 to $3,599
$400 to $499 $3,600 to $4,499
$500 to $599 $4,500 to $5,399
$600 to $699 $5,400 to $6,299
$700 to $799 $6,300 to $7,199
$800 to $899 $7,200 to $8,099
$900 to $999 $8,100 to $8,999
$1,000 or more $9,000 or more

2003-2004 SEARS – University of California March 2004 9
49. What are your monthly expenses for food that you buy in addition to that provided in your housing contract (e.g., restaurant meals, snacks or groceries) during the current academic year?
Nothing $50 to $74 $125 to $149 $250 to $299 Less than $25 $75 to $99 $150 to $199 $300 or more
$25 to $49 $100 to $124 $200 to $249
Please skip to question 53.
Questions 50, 51, and 52 are for students who have a campus-owned housing contract that does not include food or who do not have a campus-owned housing contract at all.
50. What is your share of monthly housing costs for your residence during the current academic year? Include rent, mortgage and property taxes,
payments to your parents or other relatives, etc. Taking seasonal variations into account, include your share of utilities for water, gas, electricity, garbage, and telephone, excluding long distance charges.
Nothing $300 to $399 $700 to $799 $1,200 to $1,349 Less than $100 $400 to $499 $800 to $899 $1,350 to $1,499 $100 to $199 $500 to $599 $900 to $1,049 $1,500 or more
$200 to $299 $600 to $699 $1,050 to $1,199
51. Where you currently live, what is your share of the monthly expenses for food, toiletries, and household supplies (e.g., cleaning materials) during the current academic year?
Nothing $125 to $149 $225 to $249 $375 to $449 Less than $50 $150 to $174 $250 to $274 $450 to $524 $50 to $74 $175 to $199 $275 to $299 $525 to $599 $75 to $99 $200 to $224 $300 to $374 $600 or more $100 to $124
52. What are your monthly average expenses for food or meals eaten away from your local residence, such as dining out or snacks (e.g., lunches bought on campus) during the current academic year?
Nothing $50 to $74 $125 to $149 $250 to $299 Less than $25 $75 to $99 $150 to $199 $300 or more $25 to $49 $100 to $124 $200 to $249
The remaining question for ALL respondents.
53. What are your average expenses for course books per academic term (semester or quarter) at your campus?
Nothing $100 to $149 $250 to $299 $400 to $449 Less than $50 $150 to $199 $300 to $349 $450 to $499 $50 to $99 $200 to $249 $350 to $399 $500 or more
54. What are your average expenses for necessary educational supplies or equipment (e.g., photocopying, blue books, pens, paper, notebooks, art supplies, uniforms, safety equipment, tools) per academic term (semester or quarter) at your campus? DO NOT include the purchase of a personal computer or computer software.
Nothing $40 to $59 $100 to $119 $160 to $179 Less than $20 $60 to $79 $120 to $139 $180 to $199 $20 to $39 $80 to $99 $140 to $159 $200 or more
55. What are your average expenses for course material fees (e.g., laboratory or studio fees) per academic term (semester or quarter) at your campus?
Nothing $30 to $39 $70 to $79 $200 to $299 Less than $10 $40 to $49 $80 to $89 $300 to $399
$10 to $19 $50 to $59 $90 to $99 $400 or more $20 to $29 $60 to $69 $100 to $199

2003-2004 SEARS – University of California March 2004 10
56. Do you own a computer?
Yes Please continue with question 57. No Please skip to question 60.
57. Was your computer purchased for schoolwork?
Yes No
58. When was your computer purchased?
During the current 2003-04 academic year 2002 2000 1998
During 2003, but before the current academic year 2001 1999 Prior to 1998
59. How much did your computer cost?
Less than $500 $1,000 to $1,249 $2,000 to $2,499 $3,500 to $3,999 $500 to $749 $1,250 to $1,499 $2,500 to $2,999 $4,000 or more
$750 to $999 $1,500 to $1,999 $3,000 to $3,499 I do not know
60. Excluding the purchase price of a computer, what will be your total computer-related expenses for the current academic year? Include hardware, software (excluding entertainment software), repairs, supplies (toner, paper), e-mail, and internet services.
Nothing $500 to $749 $1,250 to $1,499 $2,000 to $2,249 Less than $100 $750 to $999 $1,500 to $1,749 $2,250 to $2,499
$100 to $249 $1,000 to $1,249 $1,750 to $1,999 $2,500 or more
$250 to $499
61. Please indicate your total monthly medical and dental insurance premiums during the current academic year. If you have partial coverage through your parents, employer, or spouse, please indicate only the portion that you pay. (DO NOT include any insurance premiums paid as part of your campus fees).
Nothing $100 to $149 $250 to $299 $350 to $399 Less than $50 $150 to $199 $300 to $349 $400 or more
$50 to $99 $200 to $249
62. What are your monthly average expenses for medical and dental costs not covered by insurance (e.g., co-payments, medication, and deductibles) during the current academic year?
Nothing $20 to $29 $50 to $64 $95 to $104 Less than $10 $30 to $39 $65 to $79 $105 to $119 $10 to $19 $40 to $49 $80 to $94 $120 or more
63. What are your monthly average expenses for transportation to and from classes and work (e.g., bus fare, train fare, gasoline, tolls, parking, etc.) during the current academic year? If your campus includes transportation costs in your fees, DO NOT include them here. DO NOT include car payments, repairs, insurance or registration.
Nothing $30 to $39 $80 to $94 $140 to $159
Less than $10 $40 to $49 $95 to $104 $160 to $179 $10 to $19 $50 to $64 $105 to $119 $180 to $199
$20 to $29 $65 to $79 $120 to $139 $200 or more
64. What are your monthly average expenses for child or dependent care while participating in education-related activities during this current academic year (e.g., studying, attending classes, field work, commuting, and internships)?
I do not have dependents $150 to $199 $400 to $449 $650 to $699
Nothing $200 to $249 $450 to $499 $700 to $749 Less than $50 $250 to $299 $500 to $549 $750 to $799
$50 to $99 $300 to $349 $550 to $599 $800 to $999 $100 to $149 $350 to $399 $600 to $649 $1,000 or more

2003-2004 SEARS – University of California March 2004 11
65. What are your monthly average expenses for clothing, shoes, laundry, and hair care during this current academic year?
Nothing $75 to $99 $175 to $199 $300 to $399
Less than $25 $100 to $124 $200 to $249 $400 to $499 $25 to $49 $125 to $149 $250 to $299 $500 or more
$50 to $74 $150 to $174
66. What are your monthly average expenses for recreation and hobbies (e.g., nonacademic books, magazines, music, entertainment software, cable television, movies, concerts, and sporting events) during this current academic year?
Nothing $75 to $99 $175 to $199 $300 to $399
Less than $25 $100 to $124 $200 to $249 $400 to $499 $25 to $49 $125 to $149 $250 to $299 $500 or more
$50 to $74 $150 to $174
67. What are your expenses for travel to and from your parent(s)’ residence(s) for this current academic year (e.g., airfare, bus fare, train fare, gasoline)?
Travel Within California Travel Outside California
Does not apply
I live with my parent(s) Nothing Less than $135 $135 to $269 $270 to $404 $405 to $539 $540 to $674 $675 to $809 $810 to $944 $945 to $1,079 $1,080 to $1,214 $1,215 to $1,349 $1,350 or more Section VI: Student Opinions This last section provides us with information regarding your satisfaction with the education and services you receive. 68. How would you rate the following aspects of your experience at the University to date?
Excellent Good Fair Poor
a. The education you are receiving.
b. The knowledge and skills you are acquiring that can help you in a career.
c. The knowledge and skills you are acquiring to prepare you for graduate/professional school.
d. The opportunities you have to hear new ideas or opinions different from your own.
e. The opportunities you have to learn about the latest developments in the arts or sciences.
f. The opportunities you have to learn about important issues facing the nation and the world.
g. The quality of your overall undergraduate experience.

2003-2004 SEARS – University of California March 2004 12
69. If you were preparing a report card for the California State Legislature on how well the University is meeting the educational needs of students, how would you grade the following areas?
B or D or A or Above C or Less than F or Excellent Average Satisfactory Satisfactory Failure
a. The quality of instruction by professors. b. The quality of instruction by graduate student
teaching assistants.
c. The quality of academic advising by professors.
d. The availability of a wide variety of courses. e. The ability to enroll in required courses for your major.
f. Personal contact with professors.
g. The intellectual climate on your campus.
70. How important is it for you to attend a university that offers the following opportunities, whether or not you yourself are presently taking advantage of these opportunities?
Very Somewhat Not Important Important Important
a. Courses of independent study. b. Internships related to your academic or career interest. c. Opportunities to work with a faculty member on a research project. d. Education Abroad Program or other exchange program. e. Community service or other volunteer work. f. Student clubs and organizations. g. Cultural events on your campus. h. Athletic events on your campus. i. The opportunity to live away from home.
j. The opportunity to live in a University residence hall or dormitory.
71. Please indicate whether or not you have actually participated in the following activities. No, but No, and Yes would like to would not like to
a. Taken a course of independent study.
b. Received an internship related to your academic or career interest. c. Worked on a research project with a faculty member. d. Enrolled in an Education Abroad Program or other exchange program. e. Did community service or other volunteer work. f. Participated in student clubs and organizations. g. Attended cultural events on your campus. h. Attended athletic events on your campus. i. Lived away from home.
j. Lived in a University residence hall or dormitory.

2003-2004 SEARS – University of California March 2004 13
72. Please think back to the last time you applied for admission to this university. At the time you were applying, which type of college or university did you really want to attend?
The campus I am now attending. A California Community College.
A different University of California campus. A California private or independent college or university.
A California State University campus. Out-of-state college or university.
73. If you are NOT attending the college or university you really wanted to attend, what is the single most important reason?
I was denied admission.
I could not afford to attend.
I could not get the classes, courses or programs that I wanted.
I received late notification of admission or housing.
The college was too far away or too close to home.
I did not receive any personal attention or interest from the college.
The classes conflicted with my work schedule.
Not applicable
74. Considering your loans, how much you have to work, and in general how much you pay for your education, would you say the education you are receiving is worth the cost?
Generally worth the cost Definitely worth the cost
Generally NOT worth the cost Definitely NOT worth the cost
Comments: Thank you for taking the time to answer all of our questions. Your help is greatly appreciated. Please return your completed questionnaire to us as soon as possible. If you are interested in the survey results, please contact us at [email protected].
Please fold, seal, and return this questionnaire by following the instructions on the outside cover page. Thank you.

California State University

2003-2004 SEARS – California State University March 2004
STUDENT EXPENSES AND RESOURCES SURVEY 2003-2004 ACADEMIC YEAR
Dear California State University Student: California State University and the California Student Aid Commission conduct a Student Expenses and Resources Survey every three years to determine the actual costs associated with obtaining a postsecondary education in California. Data provided by students in prior years have been used to provide the Legislature with an accurate picture of the cost of attending college in California, which has enabled them to make informed decisions about student financial aid policy. You have been randomly selected from a sample of students to take part in this study. Because the selection process was designed to obtain a representative cross-section of all students, no one can substitute for you. Your answers are vital to this project and your help is very much appreciated.
• It is critical that you respond regardless of whether or not you are receiving any student financial aid.
• The responses you provide will in no way affect any student financial aid you may be receiving.
• Your responses to these questions are confidential and will not be individually identifiable. Please complete the questionnaire and mail it as soon as possible. No postage is necessary. Thank you for your help with this important project. Sincerely,
Diana Fuentes-Michel Executive Director California Student Aid Commission INSTRUCTIONS:
We are interested in your educational experiences during the current 2003-04 academic year. Please read and carefully follow all instructions. Indicate your answer in each question by marking the appropriate circle. For
each answer, please fill in marks like this: not like this: The survey results will be tallied using a scanning system. Marks that extend outside the circle can be misread, making the results less accurate. Please use Black Ink pen or Dark Lead pencil. Please do not remove pages.
Please answer every question and mark only one circle per question unless otherwise indicated. If you’re not sure of an answer, give us your best estimate. There are six sections on this questionnaire and it should take about thirty minutes to complete.
If you would like to provide additional details or have comments, please write ONLY in the Comments Section on the last page.
If you need assistance, you may contact us via e-mail at [email protected]. We will contact you as soon as possible.
Please return your completed questionnaire with the mailing address information intact. When you have completed the questionnaire, fold and seal it so that the return address shows on the outside, and mail it as soon as possible.
Thank you on behalf of all California State University students.

2003-2004 SEARS – California State University March 2004 1
Section I: Demographic Information In this section we ask about your background and current experience at college. The questions may seem personal, but we have to ask them in order to use the rest of the information effectively. Everything on this questionnaire is held in strict confidence and is used for research purposes. Only aggregated data from all respondents will be compiled. No information about individual respondents will be used for reporting purposes.
1. Are you a veteran of active service in the U.S. Armed Forces?
Yes No
2. What is your current marital status?
Never married Separated Widowed
Married Divorced Registered Domestic Partner
3. How many people are dependent on you for financial support? DO NOT count yourself or your spouse.
None Two Four Six or more
One Three Five
4. While attending school, where do you live?
Parent(s)’ or relative(s)’ home Off-campus rental housing
On-campus housing Home you own or are buying
5. With how many roommates or housemates do you share some, or all, of the living expenses while attending college? Exclude yourself, spouse, children, parents, or other family members.
None Two Four Six or more
One Three Five
6. How far away from school do you live during the academic year (e.g., September through May or October through June)?
I live on campus 7 to 8.9 miles 26 to 30.9 miles
Less than 1 mile 9 to 10.9 miles 31 to 35.9 miles
1 to 2.9 miles 11 to 15.9 miles 36 to 39.9 miles
3 to 4.9 miles 16 to 20.9 miles More than 40 miles
5 to 6.9 miles 21 to 25.9 miles
7. For how much of the current academic year (e.g., September through May or October through June) do you intend to be enrolled in college?
At least two semesters or three quarters Less than two semesters or three quarters
8. What type of educational institution did you last attend prior to entering your current California State University campus?
High school or equivalent Private/independent California four-year college or university
California Community College Private/independent California two-year college
Another California State University campus California private trade, business, or vocational school
University of California campus An out-of-state or foreign college or university

2003-2004 SEARS – California State University March 2004 2
Section II: Parental Information
Regardless of your age and dependency status, we would like you to answer these next few questions about your parents. These may have influenced your decision to attend college, and are important to our research.
9. What is the highest level of education attained by your parents? Please answer even if one or both of your parents are deceased, or if your parents are separated or divorced. Please check only one for each parent.
Mother’s Education Father’s Education
No formal education
Grade school (K-8)
Some high school
High school diploma/GED
Some college classes
Private trade, business or vocational school degree/certificate
Two-year college degree/certificate
Four-year college degree (BA, BS, etc.)
Teaching credential
Some post-baccalaureate classes
Post-baccalaureate degree (MA, Ph.D., JD, etc.)
I do not know
10. What is the current marital status of your parent(s)?
My parents are married to each other.
My parents are separated or divorced from one another, or my parent is widowed or single.
Both of my parents are deceased.
I am a ward of the court, or I was a ward of the court until age 18.
11. How many people, other than yourself, are dependent on your parent(s) for financial support? DO NOT count your parent(s).
None Two Four Six or more
One Three Five
12. Of the dependents indicated above, how many are currently attending college? DO NOT count yourself.
None Two Four Six or more
One Three Five
13. What was the total combined income of your parents from all sources in calendar year 2003? Include salaries, wages, retirement benefits, public assistance, income from investments, child support, and all other income. If you are not sure of the figure, please estimate.
Less than $6,000 $48,000 to $53,999 $96,000 to $107,999
$6,000 to $11,999 $54,000 to $59,999 $108,000 to $119,999
$12,000 to $17,999 $60,000 to $65,999 $120,000 to $143,999
$18,000 to $23,999 $66,000 to $71,999 $144,000 to $167,999
$24,000 to $29,999 $72,000 to $77,999 $168,000 to $191,999
$30,000 to $35,999 $78,000 to $83,999 $192,000 to $215,999
$36,000 to $41,999 $84,000 to $89,999 $216,000 to $239,999
$42,000 to $47,999 $90,000 to $95,999 $240,000 or more

2003-2004 SEARS – California State University March 2004 3
Section III: Student Resources
In this section, we ask about your work and volunteer hours during the current academic year (2003-04) and about your income over different time periods. The answers you provide will help us understand how you met your college expenses and academic or career goals this year.
14. How many hours on average did you work for pay per week during summer immediately before the current academic year (e.g., from June through August 2003)? Include paid internships.
None, I did not work 16 to 20 hours 36 to 39 hours
Less than 5 21 to 25 hours 40 hours or more
5 to 10 hours 26 to 30 hours
11 to 15 hours 31 to 35 hours
15. My average wage per hour was:
$6.75 or less $9.25 - $9.74 $13.75 - $14.74
$6.76 - $7.24 $9.75 - $10.24 $14.75 - $15.74
$7.25 - $7.74 $10.25 - $10.74 $15.75 - $16.74
$7.75 - $8.24 $10.75 - $11.74 $16.75 or more
$8.25 - $8.74 $11.75 - $12.74
$8.75 - $9.24 $12.75 - $13.74
16. How many hours on average did you work in unpaid internships per week during the summer immediately before the current academic year (e.g., from June through August 2003)?
None, I did not have an internship 16 to 20 hours 36 to 39 hours
Less than 5 21 to 25 hours 40 hours or more
5 to 10 hours 26 to 30 hours
11 to 15 hours 31 to 35 hours
17. How many hours on average did you volunteer per week during the summer immediately before the current academic year (e.g., from June through August 2003)?
None, I did not volunteer 16 to 20 hours 36 to 39 hours
Less than 5 21 to 25 hours 40 hours or more
5 to 10 hours 26 to 30 hours
11 to 15 hours 31 to 35 hours
18. How many hours on average do you, or will you, work for pay per week during the current academic year (e.g., September through May or October through June)? Include paid internships.
None, I do not/will not work 16 to 20 hours 36 to 39 hours
Less than 5 21 to 25 hours 40 hours or more
5 to 10 hours 26 to 30 hours
11 to 15 hours 31 to 35 hours
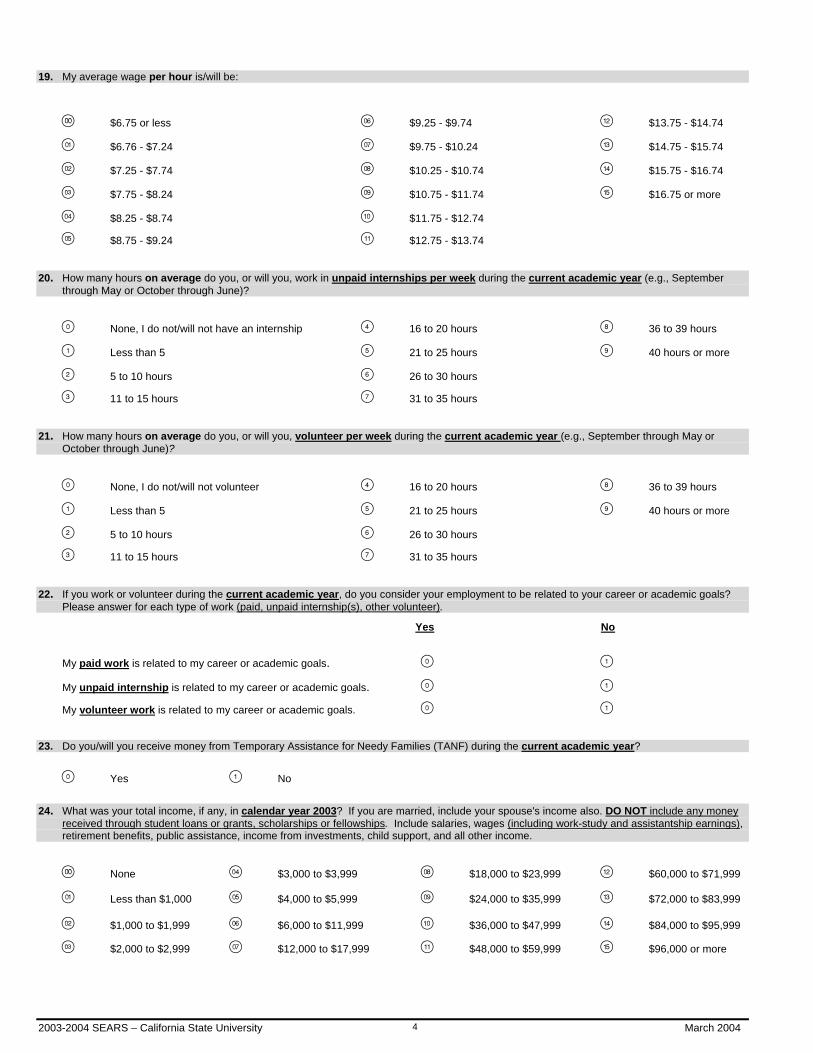
2003-2004 SEARS – California State University March 2004 4
19. My average wage per hour is/will be:
$6.75 or less $9.25 - $9.74 $13.75 - $14.74
$6.76 - $7.24 $9.75 - $10.24 $14.75 - $15.74
$7.25 - $7.74 $10.25 - $10.74 $15.75 - $16.74
$7.75 - $8.24 $10.75 - $11.74 $16.75 or more
$8.25 - $8.74 $11.75 - $12.74
$8.75 - $9.24 $12.75 - $13.74
20. How many hours on average do you, or will you, work in unpaid internships per week during the current academic year (e.g., September through May or October through June)?
None, I do not/will not have an internship 16 to 20 hours 36 to 39 hours
Less than 5 21 to 25 hours 40 hours or more
5 to 10 hours 26 to 30 hours
11 to 15 hours 31 to 35 hours
21. How many hours on average do you, or will you, volunteer per week during the current academic year (e.g., September through May or October through June)?
None, I do not/will not volunteer 16 to 20 hours 36 to 39 hours
Less than 5 21 to 25 hours 40 hours or more
5 to 10 hours 26 to 30 hours
11 to 15 hours 31 to 35 hours
22. If you work or volunteer during the current academic year, do you consider your employment to be related to your career or academic goals? Please answer for each type of work (paid, unpaid internship(s), other volunteer).
Yes No
My paid work is related to my career or academic goals.
My unpaid internship is related to my career or academic goals.
My volunteer work is related to my career or academic goals.
23. Do you/will you receive money from Temporary Assistance for Needy Families (TANF) during the current academic year?
Yes No
24. What was your total income, if any, in calendar year 2003? If you are married, include your spouse's income also. DO NOT include any money received through student loans or grants, scholarships or fellowships. Include salaries, wages (including work-study and assistantship earnings), retirement benefits, public assistance, income from investments, child support, and all other income.
None $3,000 to $3,999 $18,000 to $23,999 $60,000 to $71,999
Less than $1,000 $4,000 to $5,999 $24,000 to $35,999 $72,000 to $83,999
$1,000 to $1,999 $6,000 to $11,999 $36,000 to $47,999 $84,000 to $95,999
$2,000 to $2,999 $12,000 to $17,999 $48,000 to $59,999 $96,000 or more

2003-2004 SEARS – California State University March 2004 5
25. Of your total calendar year 2003 income reported in the previous question, how much did you (and your spouse, if married) earn last summer?
Please estimate for a three-month period, such as June, July, and August or July, August, and September.
None $3,000 to $3,999 $7,000 to $7,999 $14,000 to $15,999
Less than $1,000 $4,000 to $4,999 $8,000 to $9,999 $16,000 to $17,999
$1,000 to $1,999 $5,000 to $5,999 $10,000 to $11,999 $18,000 to $19,999
$2,000 to $2,999 $6,000 to $6,999 $12,000 to $13,999 $20,000 or more
26. What will be your total income for the current academic year? Please estimate for the nine-month period while you are attending school (e.g., September through May or October through June). As previously noted, DO NOT include any money received through student loans or grants, scholarships or fellowships. Include college work-study and assistantship earnings. If you are married, include your spouse's earnings.
None $3,000 to $3,999 $18,000 to $23,999 $60,000 to $71,999
Less than $1,000 $4,000 to $5,999 $24,000 to $35,999 $72,000 to $83,999
$1,000 to $1,999 $6,000 to $11,999 $36,000 to $47,999 $84,000 to $95,999
$2,000 to $2,999 $12,000 to $17,999 $48,000 to $59,999 $96,000 or more
Section IV: Paying for College The questions in this section help us to understand how you paid for college this current academic year (2003-04) and, if you received any financial assistance, who helped you.
27. For this current nine-month academic year (2003-04) did you apply for financial aid?
Yes No
28. Do you plan to claim, or have someone claim on your behalf, one of the following federal tuition/fee tax credits for the 2003 tax year?
The Hope Scholarship tax credit Yes No
The Lifetime Learning tax credit Yes No
29. If you answered ‘No’ to either option above, please choose the reason that best explains why.
I do not I do not know I do not know qualify if I qualify what the credit is
The Hope Scholarship tax credit
The Lifetime Learning tax credit
30. If you, your parents, or others saved for your college education, which savings vehicles were used? Please check all that apply.
Personal Savings Account(s) Certificate of Deposit (CD) Other Qualified Tuition Savings Program
Custodial Savings Account Roth IRA Coverdell Education Savings Account
Savings Bonds Trust Fund / Inheritance I do not know
Money Market Account A 529 Savings Program
Mutual Funds/Stocks Golden State ScholarShare Trust

2003-2004 SEARS – California State University March 2004 6
31. How much had you, your parents, or others saved for your college education prior to you attending your first class as an undergraduate? Include savings accounts, education IRAs, savings bonds, Golden State ScholarShare Trust, or any other savings/investment vehicles.
Nothing $10,000 to $14,999 $40,000 to $44,999 $65,000 to $69,999
Less than $500 $15,000 to $19,999 $45,000 to $49,999 $70,000 to $74,999
$500 to $999 $20,000 to $24,999 $50,000 to $54,999 $75,000 to $79,999
$1,000 to $2,999 $25,000 to $29,999 $55,000 to $59,999 $80,000 or more
$3,000 to $4,999 $30,000 to $34,999 $60,000 to $64,999 I do not know
$5,000 to $9,999 $35,000 to $39,999
32. What will be the total amount of scholarships, fellowships, and grant assistance awarded to you for the current nine-month academic year? Include Pell Grants, Cal Grants, SEOG, or EOPS grants, and any other gift aid (money you do not have to repay) you received or will have received. If an employer is paying for education expenses, include this amount.
Nothing $1,000 to $1,999 $6,000 to $7,999 $14,000 to $15,999
Less than $200 $2,000 to $2,999 $8,000 to $9,999 $16,000 to $17,999
$200 to $499 $3,000 to $3,999 $10,000 to $11,999 $18,000 to $19,999
$500 to $999 $4,000 to $5,999 $12,000 to $13,999 $20,000 or more
33. How much of your own money (and your spouse’s, if married) will you have spent each month during the current nine-month academic year on your education and living expenses (and your spouse’s, if married)? Include money spent from savings, earnings, work-study, or other assets to pay for any educational expenses or living expenses. DO NOT include money you spent from loans, grants, scholarships, fellowships, or credit card charges that you have not yet repaid.
Nothing $200 to $399 $1,200 to $1,399
Less than $50 $400 to $599 $1,400 to $1,599
$50 to $99 $600 to $799 $1,600 to $1,799
$100 to $149 $800 to $999 $1,800 to $1,999
$150 to $199 $1,000 to $1,199 $2,000 or more
34. How much money will your parent(s) contribute to support your education and living expenses each month during the current nine-month academic year? Include any monetary support for educational expenses, such as tuition and fees, food, housing, clothing, transportation, or books.
Nothing $200 to $399 $1,200 to $1,399
Less than $50 $400 to $599 $1,400 to $1,599
$50 to $99 $600 to $799 $1,600 to $1,799
$100 to $149 $800 to $999 $1,800 to $1,999
$150 to $199 $1,000 to $1,199 $2,000 or more
35. What will be the total amount you will borrow to help pay for your educational and living expenses for the current nine-month academic year? Include loans from this school, federal government, banks, credit cards, or money from friends or family. DO NOT include grants, scholarships or fellowships, or income from a job. If your spouse borrowed money for his/her educational expenses, DO NOT include his/her loans in this amount.
Nothing $2,000 to $2,999 $8,000 to $9,999 $16,000 to $17,999
Less than $500 $3,000 to $3,999 $10,000 to $11,999 $18,000 to $19,999
$500 to $999 $4,000 to $5,999 $12,000 to $13,999 $20,000 or more
$1,000 to $1,999 $6,000 to $7,999 $14,000 to $15,999
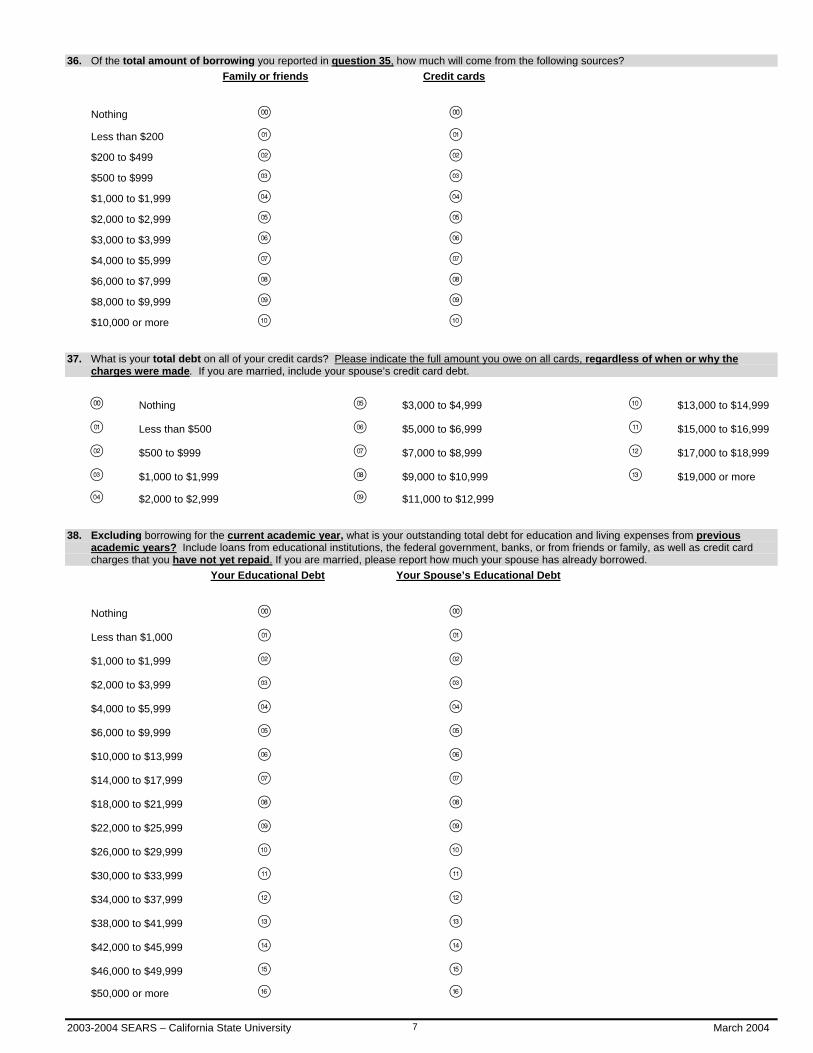
2003-2004 SEARS – California State University March 2004 7
36. Of the total amount of borrowing you reported in question 35, how much will come from the following sources? Family or friends Credit cards
Nothing
Less than $200 $200 to $499
$500 to $999
$1,000 to $1,999
$2,000 to $2,999
$3,000 to $3,999
$4,000 to $5,999
$6,000 to $7,999
$8,000 to $9,999
$10,000 or more
37. What is your total debt on all of your credit cards? Please indicate the full amount you owe on all cards, regardless of when or why the charges were made. If you are married, include your spouse’s credit card debt.
Nothing $3,000 to $4,999 $13,000 to $14,999
Less than $500 $5,000 to $6,999 $15,000 to $16,999
$500 to $999 $7,000 to $8,999 $17,000 to $18,999
$1,000 to $1,999 $9,000 to $10,999 $19,000 or more
$2,000 to $2,999 $11,000 to $12,999
38. Excluding borrowing for the current academic year, what is your outstanding total debt for education and living expenses from previous academic years? Include loans from educational institutions, the federal government, banks, or from friends or family, as well as credit card charges that you have not yet repaid. If you are married, please report how much your spouse has already borrowed.
Your Educational Debt Your Spouse’s Educational Debt
Nothing
Less than $1,000
$1,000 to $1,999
$2,000 to $3,999
$4,000 to $5,999
$6,000 to $9,999
$10,000 to $13,999
$14,000 to $17,999
$18,000 to $21,999
$22,000 to $25,999
$26,000 to $29,999
$30,000 to $33,999
$34,000 to $37,999
$38,000 to $41,999
$42,000 to $45,999
$46,000 to $49,999
$50,000 or more
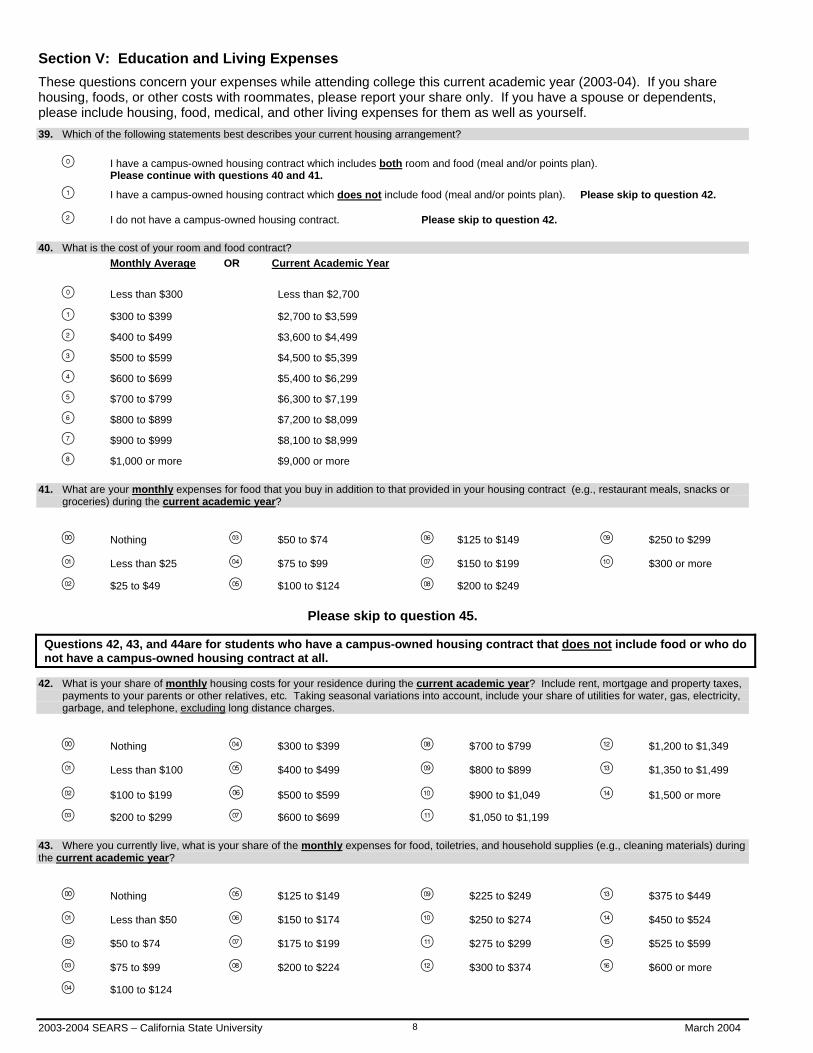
2003-2004 SEARS – California State University March 2004 8
Section V: Education and Living Expenses
These questions concern your expenses while attending college this current academic year (2003-04). If you share housing, foods, or other costs with roommates, please report your share only. If you have a spouse or dependents, please include housing, food, medical, and other living expenses for them as well as yourself. 39. Which of the following statements best describes your current housing arrangement?
I have a campus-owned housing contract which includes both room and food (meal and/or points plan). Please continue with questions 40 and 41.
I have a campus-owned housing contract which does not include food (meal and/or points plan). Please skip to question 42.
I do not have a campus-owned housing contract. Please skip to question 42.
40. What is the cost of your room and food contract? Monthly Average OR Current Academic Year
Less than $300 Less than $2,700
$300 to $399 $2,700 to $3,599 $400 to $499 $3,600 to $4,499 $500 to $599 $4,500 to $5,399 $600 to $699 $5,400 to $6,299 $700 to $799 $6,300 to $7,199 $800 to $899 $7,200 to $8,099
$900 to $999 $8,100 to $8,999 $1,000 or more $9,000 or more
41. What are your monthly expenses for food that you buy in addition to that provided in your housing contract (e.g., restaurant meals, snacks or groceries) during the current academic year?
Nothing $50 to $74 $125 to $149 $250 to $299
Less than $25 $75 to $99 $150 to $199 $300 or more
$25 to $49 $100 to $124 $200 to $249
Please skip to question 45.
Questions 42, 43, and 44are for students who have a campus-owned housing contract that does not include food or who do not have a campus-owned housing contract at all.
42. What is your share of monthly housing costs for your residence during the current academic year? Include rent, mortgage and property taxes,
payments to your parents or other relatives, etc. Taking seasonal variations into account, include your share of utilities for water, gas, electricity, garbage, and telephone, excluding long distance charges.
Nothing $300 to $399 $700 to $799 $1,200 to $1,349
Less than $100 $400 to $499 $800 to $899 $1,350 to $1,499
$100 to $199 $500 to $599 $900 to $1,049 $1,500 or more
$200 to $299 $600 to $699 $1,050 to $1,199
43. Where you currently live, what is your share of the monthly expenses for food, toiletries, and household supplies (e.g., cleaning materials) during the current academic year?
Nothing $125 to $149 $225 to $249 $375 to $449
Less than $50 $150 to $174 $250 to $274 $450 to $524
$50 to $74 $175 to $199 $275 to $299 $525 to $599
$75 to $99 $200 to $224 $300 to $374 $600 or more
$100 to $124

2003-2004 SEARS – California State University March 2004 9
44. What are your monthly average expenses for food or meals eaten away from your local residence, such as dining out or snacks (e.g., lunches bought on campus) during the current academic year?
Nothing $50 to $74 $125 to $149 $250 to $299
Less than $25 $75 to $99 $150 to $199 $300 or more
$25 to $49 $100 to $124 $200 to $249
The remaining questions are for ALL respondents.
45. What are your average expenses for course books per academic term (semester or quarter) at your campus?
Nothing $100 to $149 $250 to $299 $400 to $449
Less than $50 $150 to $199 $300 to $349 $450 to $499
$50 to $99 $200 to $249 $350 to $399 $500 or more
46. What are your average expenses for necessary educational supplies or equipment (e.g., photocopying, blue books, pens, paper, notebooks, art supplies, uniforms, safety equipment, tools) per academic term (semester or quarter) at your campus? DO NOT include the purchase of a personal computer or computer software.
Nothing $40 to $59 $100 to $119 $160 to $179
Less than $20 $60 to $79 $120 to $139 $180 to $199
$20 to $39 $80 to $99 $140 to $159 $200 or more
47. What are your average expenses for course material fees (e.g., laboratory or studio fees) per academic term (semester or quarter) at your campus?
Nothing $30 to $39 $70 to $79 $200 to $299
Less than $10 $40 to $49 $80 to $89 $300 to $399
$10 to $19 $50 to $59 $90 to $99 $400 or more
$20 to $29 $60 to $69 $100 to $199
48. Do you own a computer?
Yes Please continue with question 49. No Please skip to question 52.
49. Was your computer purchased for schoolwork?
Yes No
50. When was your computer purchased?
During the current 2003-04 academic year 2002 2000 1998
During 2003, but before the current academic year 2001 1999 Prior to 1998
51. How much did your computer cost?
Less than $500 $1,000 to $1,249 $2,000 to $2,499 $3,500 to $3,999
$500 to $749 $1,250 to $1,499 $2,500 to $2,999 $4,000 or more
$750 to $999 $1,500 to $1,999 $3,000 to $3,499 I do not know

2003-2004 SEARS – California State University March 2004 10
52. Excluding the purchase price of a computer, what will your total computer-related expenses for the current academic year? Include hardware, software (excluding entertainment software), supplies (paper, toner) repairs, e-mail, and internet services.
Nothing $500 to $749 $1,250 to $1,499 $2,000 to $2,249
Less than $100 $750 to $999 $1,500 to $1,749 $2,250 to $2,499
$100 to $249 $1,000 to $1,249 $1,750 to $1,999 $2,500 or more
$250 to $499
53. Please indicate your total monthly medical and dental insurance premiums during the current academic year. If you have partial coverage through your parents, employer, or spouse, please indicate only the portion that you pay.
Nothing $100 to $149 $250 to $299 $350 to $399
Less than $50 $150 to $199 $300 to $349 $400 or more
$50 to $99 $200 to $249
54. What are your monthly average expenses for medical and dental costs not covered by insurance (e.g., co-payments, medication, and deductibles) during the current academic year?
Nothing $20 to $29 $50 to $64 $95 to $104
Less than $10 $30 to $39 $65 to $79 $105 to $119
$10 to $19 $40 to $49 $80 to $94 $120 or more
55. What are your monthly average expenses for transportation to and from classes and work (e.g., bus fare, train fare, gasoline, tolls, parking) during the current academic year? If your campus includes transportation costs in your fees, DO NOT include them here. DO NOT include car payments, repairs, insurance or registration.
Nothing $30 to $39 $80 to $94 $140 to $159
Less than $10 $40 to $49 $95 to $104 $160 to $179
$10 to $19 $50 to $64 $105 to $119 $180 to $199
$20 to $29 $65 to $79 $120 to $139 $200 or more
56. What are your monthly average expenses for child or dependent care while participating in education-related activities during the current academic year (e.g., studying, attending classes, field work, commuting, and internships)?
I do not have dependents $150 to $199 $400 to $449 $750 to $899
Nothing $200 to $249 $450 to $499 $900 to $949
Less than $50 $250 to $299 $500 to $549 $950 to $999
$50 to $99 $300 to $349 $550 to $699 $1,000 or more
$100 to $149 $350 to $399 $700 to $749
57. What are your monthly average expenses for clothing, shoes, laundry, and hair care during the current academic year?
Less than $25 $100 to $124 $175 to $199 $300 to $399
$25 to $49 $125 to $149 $200 to $249 $400 to $499
$50 to $74 $150 to $174 $250 to $299 $500 or more
$75 to $99

2003-2004 SEARS – California State University March 2004 11
58. What are your monthly average expenses for recreation and hobbies (e.g., nonacademic books, magazines, music, entertainment software, cable television, movies, concerts, and sporting events) during the current academic year?
Less than $25 $100 to $124 $175 to $199 $300 to $399
$25 to $49 $125 to $149 $200 to $249 $400 to $499
$50 to $74 $150 to $174 $250 to $299 $500 or more
$75 to $99
59. What are your expenses, if any, for travel to and from your parent(s)' residence(s) for this current academic year (e.g., airfare, bus fare, train fare, gasoline)?
Travel Within California Travel Outside California
Does not apply
I live with my parent(s) Nothing Less than $135 $135 to $269
$270 to $404 $405 to $539 $540 to $674 $675 to $809 $810 to $944 $945 to $1,079 $1,080 to $1,214 $1,215 to $1,349 $1,350 or more
Section VI: Student Opinions This last section is used to gather your opinions on issues that the California State University is studying and to allow for any comments you may have.
60. Please think back to the last time you applied for admission to this school. At the time you were applying, which type of educational institution did you really want to attend?
The California State University campus I am now attending. A California Community College.
A different California State University campus. A California private trade, business, or vocational school.
A University of California campus. An out-of-state or foreign college or university.
A private or independent college or university in California.
61. If you are NOT currently attending the college you really wanted to attend, what is the single most important reason?
I was denied admission. The college was too far away or too close to home.
I could not afford to attend. I did not receive any personal attention or interest from the college.
I could not get the classes, courses or programs that I wanted. The classes conflicted with my work schedule.
I received late notification of admission or housing. Not applicable.

2003-2004 SEARS – California State University March 2004 12
62. Year-round operations would enable you to enroll term after term without taking a summer break. Attending school in this manner could allow you to complete your degree or credential program up to one year earlier than traditional operations. If financial aid policies can be adjusted to accommodate year-round attendance, would you be interested in enrolling year-round?
Yes No
63. If you are enrolled in one of the following California Commission on Teaching Credentialing (CTC) approved credential programs, please fill in the appropriate circle:
Single Subject Multiple Subject Special Education

2003-2004 SEARS – California State University March 2004 13
Comments: Thank you for taking the time to answer all of our questions. Your help is greatly appreciated. Please return your completed questionnaire to us as soon as possible. If you are interested in the survey results, please contact us at [email protected].
Please fold, seal and return this questionnaire by following the instructions on the outside cover page. Thank you.

Independent Colleges and Universities

2003-2004 SEARS – Independent Colleges and Universities March 2004
STUDENT EXPENSES AND RESOURCES SURVEY 2003-2004 ACADEMIC YEAR
Dear Independent College Student: Your college or university and the California Student Aid Commission conduct a Student Expenses and Resources Survey every three years to determine the actual costs associated with obtaining a postsecondary education in California. Data provided by students in prior years have been used to provide the Governor and the Legislature with an accurate picture of the cost of attending college in California, which has enabled them to make informed decisions about student financial aid policy. Informing the policy process about actual college costs and also understanding the profile of students who attend California institutions is critical to assuming an informed fee and financial aid policy in the state. You have been randomly selected from a sample of students to take part in this study. Because the selection process was designed to obtain a representative cross-section of all students, no one can substitute for you. Your answers are vital to this project and your help is very much appreciated. * It is critical that you respond regardless of whether or not you are receiving any student financial aid.
* The responses you provide will in no way affect any student financial aid you may be receiving.
* Your responses to these questions are confidential and will not be individually identifiable.
Thank you for your help with this important project. Sincerely,
Jonathan Brown President Association of Independent California Colleges and Universities
INSTRUCTIONS:
We are interested in your educational experiences during the current 2003-04 academic year. Please read and carefully follow all instructions. Indicate your answer in each question by marking the appropriate circle. For
each answer, please fill in marks like this: not like this: The survey results will be tallied using a scanning system. Marks that extend outside the circle can be misread, making the results less accurate. Please use Black Ink pen or Dark Lead pencil. Please do not remove pages.
Please answer every question and mark only one circle per question unless otherwise indicated. If you’re not sure of an answer, give us your best estimate. There are six sections on this questionnaire and it should take about thirty minutes to complete.
If you would like to provide additional details or have comments, please write ONLY in the Comments Section on the last page.
If you need assistance, you may contact us via e-mail at [email protected]. We will contact you as soon as possible.
Please return your completed questionnaire with the mailing address information intact. When you have completed the questionnaire, fold and seal it so that the return address shows on the outside, and mail it as soon as possible.
Thank you on behalf of all California Independent College and University students.

2003-2004 SEARS – Independent Colleges and Universities 1 March 2004
Section I: Demographic & Enrollment Information In this section we ask about your background and current experience at college. The questions may seem personal, but we have to ask them in order to use the rest of the information effectively. Everything on this questionnaire is held in strict confidence and is used only for research purposes. Only aggregated data from all respondents will be compiled. No information about individual respondents will be used for reporting purposes.
1. Your gender:
Female Male
2. How old were you on January 1, 2004?
18 or younger 22 30 through 34
19 23 35 through 39
20 24 40 or older
21 25 through 29
3. Are you a veteran of active service in the U.S. Armed Forces?
Yes No
4. What is your current marital status?
Never married Separated Widowed
Married Divorced Registered Domestic Partner
5. How many people are dependent on you for financial support? DO NOT count yourself or your spouse.
None Two Four Six or more
One Three Five
6. What is your citizenship status?
U.S. citizen Refugee/Asylum
Permanent resident Student visa or Temporary worker visa
I have applied for or received amnesty under IRCA, 1986 NACARA
Legal Immigration Family Equity (LIFE) Act of 2000 Other
7. When you first applied to this institution were you a California resident?
Yes No
8. Your race/ethnicity: Please check only one answer.
African American/Black Hispanic/Latino: Pacific Islander:
American Indian or Alaskan Native Central American Guamanian
White/Caucasian Cuban Hawaiian
Asian: Chicano/Mexican American Samoan
Asian Indian Filipino Puerto Rican Other Pacific Islander
Chinese Laotian South American
Japanese Cambodian Other Latino Other
Korean Pakistani Multi-racial
Vietnamese Other Asian

2003-2004 SEARS – Independent Colleges and Universities 2 March 2004
9. While attending school, where do you live?
Parent(s)’ or relative(s)’ home Off-campus rental housing
On-campus housing Home you own or are buying
Off-campus university-owned housing
10. With how many roommates or housemates do you share some, or all, of the living expenses while attending college? Exclude yourself, spouse, children, parents, or other family members.
None Two Four Six or more
One Three Five
11. How far away from school do you live during the current academic year (e.g., September through May or October through June)?
I live on campus 7 to 8.9 miles 26 to 30.9 miles
Less than 1 mile 9 to 10.9 miles 31 to 35.9 miles
1 to 2.9 miles 11 to 15.9 miles 36 to 39.9 miles
3 to 4.9 miles 16 to 20.9 miles More than 40 miles
5 to 6.9 miles 21 to 25.9 miles
12. What is your current academic level?
Freshman Teaching credential program student
Sophomore Master’s student
Junior Doctoral student
Senior Student in professional school(e.g. law or medical school, etc.)
Fifth year (or more) undergraduate
13. For how much of the current academic year (e.g., September through May or October through June) do you intend to be enrolled in college?
At least two semesters or three quarters Less than two semesters or three quarters
14. How many units are you taking for credit this term?
Less than 3 12 to 14.99
3 to 5.99 15 to 17.99
6 to 7.99 18 or more
8 to 11.99 I am not taking any courses for credit at this time.
15. At the end of the last grading period, what was your approximate cumulative grade point average for all work you have completed at this school?
Under 2.00 3.00 to 3.24
2.00 to 2.24 3.25 to 3.49
2.25 to 2.49 3.50 to 3.74
2.50 to 2.74 3.75 or above
2.75 to 2.99 I have not yet completed any courses at this school, or my courses at this school are not graded.

2003-2004 SEARS – Independent Colleges and Universities 3 March 2004
16. What type of educational institution did you last attend prior to entering your current college or university campus?
High school or equivalent Private/independent California four-year college or university
California Community College Private/independent California two-year college
California State University campus A California private trade, business, or vocational school
University of California campus Out of-state or foreign college or university Section II: Parental Information Regardless of your age and dependency status, we would like you to answer these next few questions about your parents. These may have influenced your decision to attend college, and are important to our research. 17. What is the highest level of education attained by your parents? Please answer even if one or both of your parents are deceased, or if your
parents are separated or divorced. Please check only one for each parent. Mother’s Education Father’s Education
No formal education
Grade school (K-8)
Some high school
High school diploma/GED
Some college classes
Private trade, business or vocational school degree/certificate
Two-year college degree/certificate
Four-year college degree (BA, BS, etc.)
Teaching credential
Some post-baccalaureate classes
Post-baccalaureate degree (MA, Ph.D., JD, etc.)
I do not know
18. What is the current marital status of your parent(s)?
My parents are married to each other.
My parents are separated or divorced from one another, or my parent is widowed or single.
Both of my parents are deceased.
I am a ward of the court or I was a ward of the court until age 18.
19. How many people, other than yourself, are dependent on your parent(s) for financial support? DO NOT count your parent(s).
None Two Four Six or more
One Three Five
20. Of the dependents indicated above, how many are currently attending college? DO NOT count yourself.
None Two Four Six or more
One Three Five

2003-2004 SEARS – Independent Colleges and Universities 4 March 2004
21. What was the total combined income of your parents from all sources in calendar year 2003? Include salaries, wages, retirement benefits, public assistance, income from investments, child support, and all other income. If you are not sure of the figure, please estimate, or if possible ask your parents.
Less than $6,000 $48,000 to $53,999 $96,000 to $107,999
$6,000 to $11,999 $54,000 to $59,999 $108,000 to $119,999
$12,000 to $17,999 $60,000 to $65,999 $120,000 to $143,999
$18,000 to $23,999 $66,000 to $71,999 $144,000 to $167,999
$24,000 to $29,999 $72,000 to $77,999 $168,000 to $191,999
$30,000 to $35,999 $78,000 to $83,999 $192,000 to $215,999
$36,000 to $41,999 $84,000 to $89,999 $216,000 to $239,999
$42,000 to $47,999 $90,000 to $95,999 $240,000 or more Section III: Student Resources
In this section, we ask about your work hours during the current academic year (2003-04) and about your income over different time periods. Your answers will help us understand how you have met college expenses this year. 22. How many hours on average did you work for pay per week during summer immediately before the current academic year (e.g., from June
through August 2003)? Please include paid internships.
None, I did not work 16 to 20 hours 36 to 39 hours Less than 5 21 to 25 hours 40 hours or more 5 to 10 hours 26 to 30 hours
11 to 15 hours 31 to 35 hours
23. My average wage per hour was:
$6.75 or less $9.25 - $9.74 $13.75 - $14.74
$6.76 - $7.24 $9.75 - $10.24 $14.75 - $15.74 $7.25 - $7.74 $10.25 - $10.74 $15.75 - $16.74
$7.75 - $8.24 $10.75 - $11.74 $16.75 or more $8.25 - $8.74 $11.75 - $12.74
$8.75 - $9.24 $12.75 - $13.74
24. How many hours on average did you work in unpaid internships per week during the summer immediately before the current academic year (e.g., from June through August 2003)?
None, I did not have an internship 16 to 20 hours 36 to 39 hours Less than 5 21 to 25 hours 40 hours or more 5 to 10 hours 26 to 30 hours
11 to 15 hours 31 to 35 hours
25. How many hours on average did you volunteer per week during the summer immediately before the current academic year (e.g., from June through August 2003)?
None, I did not volunteer 16 to 20 hours 36 to 39 hours Less than 5 21 to 25 hours 40 hours or more 5 to 10 hours 26 to 30 hours
11 to 15 hours 31 to 35 hours

2003-2004 SEARS – Independent Colleges and Universities 5 March 2004
26. How many hours on average do you, or will you, work for pay per week during the current academic year (e.g., September through May or October through June)? Please include paid internships.
None, I do not/will not work 16 to 20 hours 36 to 39 hours Less than 5 21 to 25 hours 40 hours or more 5 to 10 hours 26 to 30 hours 11 to 15 hours 31 to 35 hours
27. My average wage per hour is/will be:
$6.75 or less $9.25 - $9.74 $13.75 - $14.74
$6.76 - $7.24 $9.75 - $10.24 $14.75 - $15.74 $7.25 - $7.74 $10.25 - $10.74 $15.75 - $16.74
$7.75 - $8.24 $10.75 - $11.74 $16.75 or more $8.25 - $8.74 $11.75 - $12.74
$8.75 - $9.24 $12.75 - $13.74
28. How many hours on average do you, or will you, work in unpaid internships per week during the current academic year (e.g., September through May or October through June)?
None, I do not/will not have an internship 16 to 20 hours 36 to 39 hours Less than 5 21 to 25 hours 40 hours or more 5 to 10 hours 26 to 30 hours 11 to 15 hours 31 to 35 hours
29. How many hours on average do you, or will you, volunteer per week during the current academic year (e.g., September through May or October through June)?
None, I can not/will not volunteer 16 to 20 hours 36 to 39 hours Less than 5 21 to 25 hours 40 hours or more 5 to 10 hours 26 to 30 hours 11 to 15 hours 31 to 35 hours
30. What was your total income, if any, in calendar year 2003? If you are married, include your spouse's income also. DO NOT include any money received through student loans or grants, scholarships or fellowships. Include salaries, wages (including work-study and assistantship earnings), retirement benefits, public assistance, income from investments, child support, and all other income.
None $3,000 to $3,999 $18,000 to $23,999 $60,000 to $71,999
Less than $1,000 $4,000 to $5,999 $24,000 to $35,999 $72,000 to $83,999 $1,000 to $1,999 $6,000 to $11,999 $36,000 to $47,999 $84,000 to $95,999
$2,000 to $2,999 $12,000 to $17,999 $48,000 to $59,999 $96,000 or more
31. Of your total calendar year 2003 income reported in the previous question, how much did you (and your spouse, if married) earn last summer? Please estimate for a three-month period, such as June, July, and August or July, August, and September.
None $3,000 to $3,999 $7,000 to $7,999 $14,000 to $15,999 Less than $1,000 $4,000 to $4,999 $8,000 to $9,999 $16,000 to $17,999 $1,000 to $1,999 $5,000 to $5,999 $10,000 to $11,999 $18,000 to $19,999 $2,000 to $2,999 $6,000 to $6,999 $12,000 to $13,999 $20,000 or more

2003-2004 SEARS – Independent Colleges and Universities 6 March 2004
32. What will be your total income for the current academic year? Please estimate for the nine-month period while you are attending school (e.g., September through May or October through June). As previously noted, DO NOT include any money received through student loans or grants, scholarships or fellowships. Include college work-study and assistantship earnings. If you are married, include your spouse's earnings.
None $3,000 to $3,999 $18,000 to $23,999 $60,000 to $71,999
Less than $1,000 $4,000 to $5,999 $24,000 to $35,999 $72,000 to $83,999 $1,000 to $1,999 $6,000 to $11,999 $36,000 to $47,999 $84,000 to $95,999
$2,000 to $2,999 $12,000 to $17,999 $48,000 to $59,999 $96,000 or more
33. Did/will you receive money from Temporary Assistance for Needy Families (TANF) during the current academic year?
Yes No
Section IV: Paying for College These questions will help us understand how you paid for college this current academic year (2003-04) and, if you received any financial assistance, who helped you.
34. For this current nine-month academic year (2003-2004) did you apply for financial aid?
Yes No
35. Do you plan to claim, or have someone claim on your behalf, one of the following federal tuition/fee tax credits for the 2003 tax year?
The Hope Scholarship tax credit Yes No
The Lifetime Learning tax credit Yes No
36. If you answered ‘No” to either option above, please choose the reason that best explains why.
I do not I do not know I do not know qualify if I qualify what the credit is
The Hope Scholarship tax credit The Lifetime Learning tax credit
37. If you, your parents, or others saved for your college education, which savings vehicles were used? Check all that apply.
Personal Savings Account(s) Certificate of Deposit (CD) Other Qualified Tuition Savings Program Custodial Savings Account Roth IRA Coverdell Education Savings Account Savings Bonds Trust Fund / Inheritance I do not know Money Market Account A 529 Savings Program
Mutual Funds/Stocks Golden State ScholarShare Trust
38. How much had you, your parents, or others saved for your college education prior to your attending your first class as an undergraduate? Include savings accounts, education IRAs, savings bonds, or any other savings/investment vehicles.
Nothing $10,000 to $14,999 $40,000 to $44,999 $65,000 to $69,999
Less than $500 $15,000 to $19,999 $45,000 to $49,999 $70,000 to $74,999
$500 to $999 $20,000 to $24,999 $50,000 to $54,999 $75,000 to $79,999
$1,000 to $2,999 $25,000 to $29,999 $55,000 to $59,999 $80,000 or more
$3,000 to $4,999 $30,000 to $34,999 $60,000 to $64,999 I do not know
$5,000 to $9,999 $35,000 to $39,999
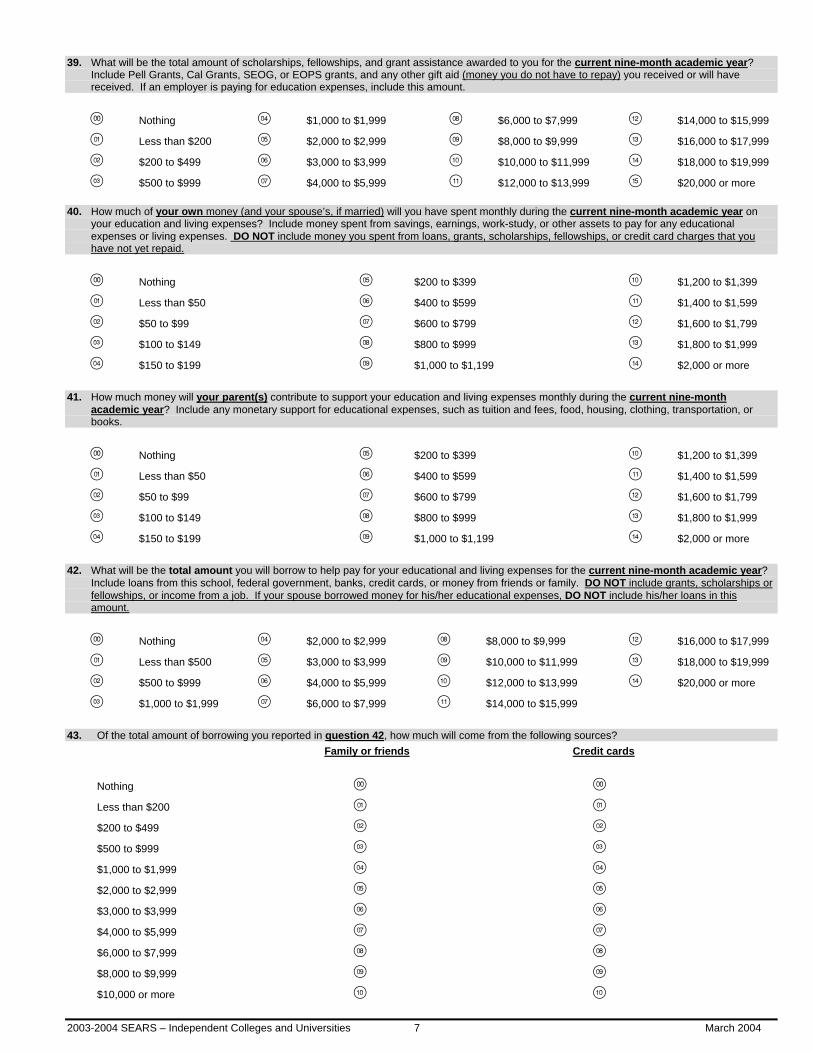
2003-2004 SEARS – Independent Colleges and Universities 7 March 2004
39. What will be the total amount of scholarships, fellowships, and grant assistance awarded to you for the current nine-month academic year?
Include Pell Grants, Cal Grants, SEOG, or EOPS grants, and any other gift aid (money you do not have to repay) you received or will have received. If an employer is paying for education expenses, include this amount.
Nothing $1,000 to $1,999 $6,000 to $7,999 $14,000 to $15,999
Less than $200 $2,000 to $2,999 $8,000 to $9,999 $16,000 to $17,999
$200 to $499 $3,000 to $3,999 $10,000 to $11,999 $18,000 to $19,999
$500 to $999 $4,000 to $5,999 $12,000 to $13,999 $20,000 or more
40. How much of your own money (and your spouse’s, if married) will you have spent monthly during the current nine-month academic year on your education and living expenses? Include money spent from savings, earnings, work-study, or other assets to pay for any educational expenses or living expenses. DO NOT include money you spent from loans, grants, scholarships, fellowships, or credit card charges that you have not yet repaid.
Nothing $200 to $399 $1,200 to $1,399
Less than $50 $400 to $599 $1,400 to $1,599
$50 to $99 $600 to $799 $1,600 to $1,799
$100 to $149 $800 to $999 $1,800 to $1,999
$150 to $199 $1,000 to $1,199 $2,000 or more
41. How much money will your parent(s) contribute to support your education and living expenses monthly during the current nine-month academic year? Include any monetary support for educational expenses, such as tuition and fees, food, housing, clothing, transportation, or books.
Nothing $200 to $399 $1,200 to $1,399
Less than $50 $400 to $599 $1,400 to $1,599
$50 to $99 $600 to $799 $1,600 to $1,799
$100 to $149 $800 to $999 $1,800 to $1,999
$150 to $199 $1,000 to $1,199 $2,000 or more
42. What will be the total amount you will borrow to help pay for your educational and living expenses for the current nine-month academic year? Include loans from this school, federal government, banks, credit cards, or money from friends or family. DO NOT include grants, scholarships or fellowships, or income from a job. If your spouse borrowed money for his/her educational expenses, DO NOT include his/her loans in this amount.
Nothing $2,000 to $2,999 $8,000 to $9,999 $16,000 to $17,999
Less than $500 $3,000 to $3,999 $10,000 to $11,999 $18,000 to $19,999
$500 to $999 $4,000 to $5,999 $12,000 to $13,999 $20,000 or more
$1,000 to $1,999 $6,000 to $7,999 $14,000 to $15,999
43. Of the total amount of borrowing you reported in question 42, how much will come from the following sources? Family or friends Credit cards
Nothing
Less than $200 $200 to $499
$500 to $999
$1,000 to $1,999
$2,000 to $2,999
$3,000 to $3,999
$4,000 to $5,999
$6,000 to $7,999
$8,000 to $9,999
$10,000 or more

2003-2004 SEARS – Independent Colleges and Universities 8 March 2004
44. What is your total debt on all of your credit cards? Please indicate the full amount you owe on all cards, regardless of when or why the charges were made. If you are married, include your spouse’s credit card debt.
Nothing $3,000 to $4,999 $13,000 to $14,999
Less than $500 $5,000 to $6,999 $15,000 to $16,999
$500 to $999 $7,000 to $8,999 $17,000 to $18,999
$1,000 to $1,999 $9,000 to $10,999 $19,000 or more
$2,000 to $2,999 $11,000 to $12,999
45. Excluding borrowing for the current academic year, what is your outstanding total debt for education and living expenses in previous academic years? Include loans from educational institutions, federal government, banks, or from friends or family, as well as credit card
charges that you have not yet repaid. If you are married, please tell us how much your spouse has already borrowed.
Your Educational Debt Your Spouse’s Educational Debt
Nothing Less than $1,000
$1,000 to $1,999
$2,000 to $3,999
$4,000 to $5,999
$6,000 to $9,999
$10,000 to $13,999
$14,000 to $17,999
$18,000 to $21,999
$22,000 to $25,999
$26,000 to $29,999
$30,000 to $33,999
$34,000 to $37,999
$38,000 to $41,999
$42,000 to $45,999
$46,000 to $49,999
$50,000 or more
Section V: Education and Living Expenses These questions concern your expenses while attending college this current academic year (2003-04). If you share housing, food, or other costs with roommates, please report your share only. If you have a spouse or dependents, please include housing, food, medical, and other living expenses for them as well as yourself. 46. Which of the following statements best describes your current housing arrangement?
I have a campus-owned housing contract which includes both room and food (meal and/or points plan). Please continue with questions 47 and 48.
I have a campus-owned housing contract which does not include food (meal and/or points plan). Please skip to question 49.
I do not have a campus-owned housing contract. Please skip to question 49.

2003-2004 SEARS – Independent Colleges and Universities 9 March 2004
47. What is the cost of your room and food contract?
Monthly Average OR Current Academic Year
Less than $300 Less than $2,700
$300 to $399 $2,700 to $3,599 $400 to $499 $3,600 to $4,499 $500 to $599 $4,500 to $5,399 $600 to $699 $5,400 to $6,299 $700 to $799 $6,300 to $7,199
$800 to $899 $7,200 to $8,099
$900 to $999 $8,100 to $8,999 $1,000 or more $9,000 or more
48. What are your monthly expenses for food that you buy in addition to that provided in your housing contract (e.g., restaurant meals, snacks or groceries)?
Nothing $50 to $74 $125 to $149 $250 to $299
Less than $25 $75 to $99 $150 to $199 $300 or more
$25 to $49 $100 to $124 $200 to $249
Please skip to question 52.
Questions 49, 50, and 51 are for students who have a campus-owned housing contract that does not include food or who do not have a campus-owned housing contract at all.
49. What is your share of monthly housing costs for your residence during the current academic year? Include rent, mortgage and property taxes,
payments to your parents or other relatives, etc. Taking seasonal variations into account, include your share of utilities for water, gas, electricity, garbage, and telephone, excluding long distance charges.
Nothing $300 to $399 $700 to $799 $1,200 to $1,349
Less than $100 $400 to $499 $800 to $899 $1,350 to $1,499
$100 to $199 $500 to $599 $900 to $1,049 $1,500 or more
$200 to $299 $600 to $699 $1,050 to $1,199
50. Where you currently live, what is your share of the monthly expenses for food, toiletries, and household supplies (e.g., cleaning materials) during the current academic year?
Nothing $125 to $149 $225 to $249 $375 to $449
Less than $50 $150 to $174 $250 to $274 $450 to $524
$50 to $74 $175 to $199 $275 to $299 $525 to $599
$75 to $99 $200 to $224 $300 to $374 $600 or more
$100 to $124
51. What are your monthly average expenses for food or meals eaten away from your local residence, such as dining out or snacks (e.g., lunches
bought on campus) during the current academic year?
Nothing $50 to $74 $125 to $149 $250 to $299
Less than $25 $75 to $99 $150 to $199 $300 or more
$25 to $49 $100 to $124 $200 to $249

2003-2004 SEARS – Independent Colleges and Universities 10 March 2004
Remaining questions are for ALL respondents.
52. What are your average expenses for course books per academic term (semester or quarter) at your campus?
Nothing $100 to $149 $250 to $299 $400 to $449
Less than $50 $150 to $199 $300 to $349 $450 to $499
$50 to $99 $200 to $249 $350 to $399 $500 or more
53. What are your average expenses for necessary educational supplies or equipment (e.g., photocopying, blue books, pens, paper, notebooks, art supplies, uniforms, safety equipment, tools) per academic term (semester or quarter) at your campus? DO NOT include the purchase of a personal computer or computer software.
Nothing $40 to $59 $100 to $119 $160 to $179
Less than $20 $60 to $79 $120 to $139 $180 to $199
$20 to $39 $80 to $99 $140 to $159 $200 or more
54. What are your average expenses for course material fees (e.g., laboratory or studio fees) per academic term (semester or quarter) at your campus?
Nothing $100 to $149 $250 to $299 $400 to $449
Less than $50 $150 to $199 $300 to $349 $450 to $499
$50 to $99 $200 to $249 $350 to $399 $500 or more
55. Do you own a computer?
Yes Please continue with question 56. No Please skip to question 59.
56. Was your computer purchased for schoolwork?
Yes No
57. When was your computer purchased?
During the current 2003-04 academic year 2002 2000 1998
During 2003, but before the current academic year 2001 1999 Prior to 1998
58. How much did your computer cost?
Less than $500 $1,000 to $1,249 $2,000 to $2,499 $3,500 to $3,999
$500 to $749 $1,250 to $1,499 $2,500 to $2,999 $4,000 or more
$750 to $999 $1,500 to $1,999 $3,000 to $3,499 I do not know
59. Excluding the purchase price of a computer, what will your total computer-related expenses be for the current academic year? Include hardware, software (excluding entertainment software), supplies (paper, toner) repairs, e-mail, and internet services.
Nothing $500 to $749 $1,250 to $1,499 $2,000 to $2,249
Less than $100 $750 to $999 $1,500 to $1,749 $2,250 to $2,499
$100 to $249 $1,000 to $1,249 $1,750 to $1,999 $2,500 or more
$250 to $499

2003-2004 SEARS – Independent Colleges and Universities 11 March 2004
60. Please indicate your total monthly medical and dental insurance premiums during the current academic year. If you have partial coverage through your parents, employer, or spouse, please indicate only the portion that you pay.
Nothing $100 to $149 $250 to $299 $350 to $399
Less than $50 $150 to $199 $300 to $349 $400 or more
$50 to $99 $200 to $249
61. What are your monthly average expenses for medical and dental costs not covered by insurance (e.g., co-payments, medication, and deductibles) during the current academic year?
Nothing $20 to $29 $50 to $64 $95 to $104
Less than $10 $30 to $39 $65 to $79 $105 to $119
$10 to $19 $40 to $49 $80 to $94 $120 or more
62. What are your monthly average expenses for transportation to and from classes and work (e.g., bus fare, train fare, gasoline, tolls, parking) during the current academic year? If your campus includes transportation costs in your fees, DO NOT include them here. DO NOT include car payments, repairs, insurance or registration.
Nothing $30 to $39 $80 to $94 $140 to $159
Less than $10 $40 to $49 $95 to $104 $160 to $179
$10 to $19 $50 to $64 $105 to $119 $180 to $199
$20 to $29 $65 to $79 $120 to $139 $200 or more
63. What are your monthly average expenses for child or dependent care while participating in education-related activities during the current academic year (e.g., studying, attending classes, field work, commuting, and internships)?
I do not have dependents $150 to $199 $400 to $449 $650 to $699
Nothing $200 to $249 $450 to $499 $700 to $749
Less than $50 $250 to $299 $500 to $549 $750 to $799
$50 to $99 $300 to $349 $550 to $599 $800 to $999
$100 to $149 $350 to $399 $600 to $649 $1,000 or more
64. What are your monthly average expenses for clothing, shoes, laundry, and hair care during the current academic year?
Less than $25 $100 to $124 $175 to $199 $300 to $399
$25 to $49 $125 to $149 $200 to $249 $400 to $499
$50 to $74 $150 to $174 $250 to $299 $500 or more
$75 to $99
65. What are your monthly average expenses for recreation and hobbies (e.g., nonacademic books, magazines, music, entertainment software, cable television, movies, concerts, and sporting events) during the current academic year?
Less than $25 $100 to $124 $175 to $199 $300 to $399
$25 to $49 $125 to $149 $200 to $249 $400 to $499
$50 to $74 $150 to $174 $250 to $299 $500 or more
$75 to $99

2003-2004 SEARS – Independent Colleges and Universities 12 March 2004
66. What are your expenses, if any, for travel to and from your parent(s)' residence(s) for the current academic year (e.g., airfare, bus fare, train
fare, gasoline)?
Travel Within California Travel Outside California
Does not Apply
I live with my parent(s) Nothing Less than $135 $135 to $269 $270 to $404 $405 to $539 $540 to $674 $675 to $809 $810 to $944 $945 to $1,079 $1,080 to $1,214 $1,215 to $1,349 $1,350 or more
Section VI: Student Opinions This last section provides us with information regarding your satisfaction with the education and services you receive. 67. How satisfied are you with each of the following?
Very Somewhat Does Satisfied Satisfied Satisfied Dissatisfied Not Apply a. The availability of courses. b. The quality of academic advising. c. The quality of instruction. d. New student orientation. e. The financial aid you received. f. The services provided by your financial aid office.
g. The overall quality of your education at this university.
h. Safety on campus. i. Residence hall life (if applicable). j. Level of technology used for academic purposes (on-campus).
k. The quality of campus facilities. l. Your previous education in preparing you for your current studies.
m. Personal attention from faculty. n. Personal attention from university staff and administrators.
o. Your level of participation in campus life. p. The quality of student life on campus.

2003-2004 SEARS – Independent Colleges and Universities 13 March 2004
68. Please think back to the last time you applied for admission to this school. At the time you were applying, which type of educational institution did you really want to attend?
The campus I am now attending.
A different private or independent college or university in California.
A University of California campus.
A California State University campus.
A California Community College.
A private trade, business, or vocational school in California.
An out-of-state college or university.
69. If you are NOT currently attending the college you really wanted to attend, what is the single most important reason?
I was denied admission.
I could not afford to attend.
I could not get the classes, courses or programs that I wanted.
I received late notification of admission or housing.
The college was too far away or too close to home.
I did not receive any personal attention or interest from the college.
The classes conflicted with my work schedule.
Not applicable.
Comments:
Thank you for taking the time to answer all of our questions. Your help is greatly appreciated. If you have any questions or would like to see the survey results, please contact us at [email protected].
Please fold, seal and return this questionnaire by following the instructions on the outside return mail page. Thank you.

Private Career Colleges

2003-2004 – Private Career Colleges January 2004
STUDENT EXPENSES AND RESOURCES SURVEY
2003-2004 ACADEMIC YEAR Dear Student: The California Student Aid Commission, in partnership with Private Career Colleges, conducts a Student Expenses and Resources Survey (SEARS) every three years to determine the actual costs associated with obtaining a postsecondary education in California. Data provided by students in prior years have been used to provide the Legislature with an accurate picture of the cost of attending college in California, which has enabled them to make informed decisions about student financial aid policy. Your school has selected you and your fellow classmates to take part in this study. Because it is important to understand the costs associated with a wide variety of financial aid programs, your answers are vital to this project and your help is very much appreciated.
• It is critical that you respond regardless of whether or not you are receiving any student financial aid.
• The responses you provide will in no way affect any student financial aid you may be receiving.
• Your responses to these questions are confidential and will not be individually identifiable. Thank you for your help with this important project. Sincerely,
Diana Fuentes-Michel Executive Director California Student Aid Commission INSTRUCTIONS:
We are interested in your educational experiences between July 1, 2003 and June 30, 2004. Please keep this twelve-month period in mind as you work through the survey.
Please read and carefully follow all directions. Indicate your answer to each question by marking the appropriate circle. For each answer, please fill in marks like this: not like this: The survey results will be tallied using a scanning system. Marks that extend outside the circle can be misread, making the results less accurate. Please use Black Ink pen or Dark Lead pencil and do not fold or remove pages.
Please answer every question and mark only one circle per question unless otherwise indicated. If you’re not sure of an answer, give us your best estimate. There are six sections on this questionnaire and it should take about thirty minutes to complete.
If you would like to provide additional details or have comments, please write ONLY in the Comments Section on the last page.
When you have completed the questionnaire, return it to your school. The school will forward all surveys directly to the California Student Aid Commission.
Thank you on behalf of all private career college students.
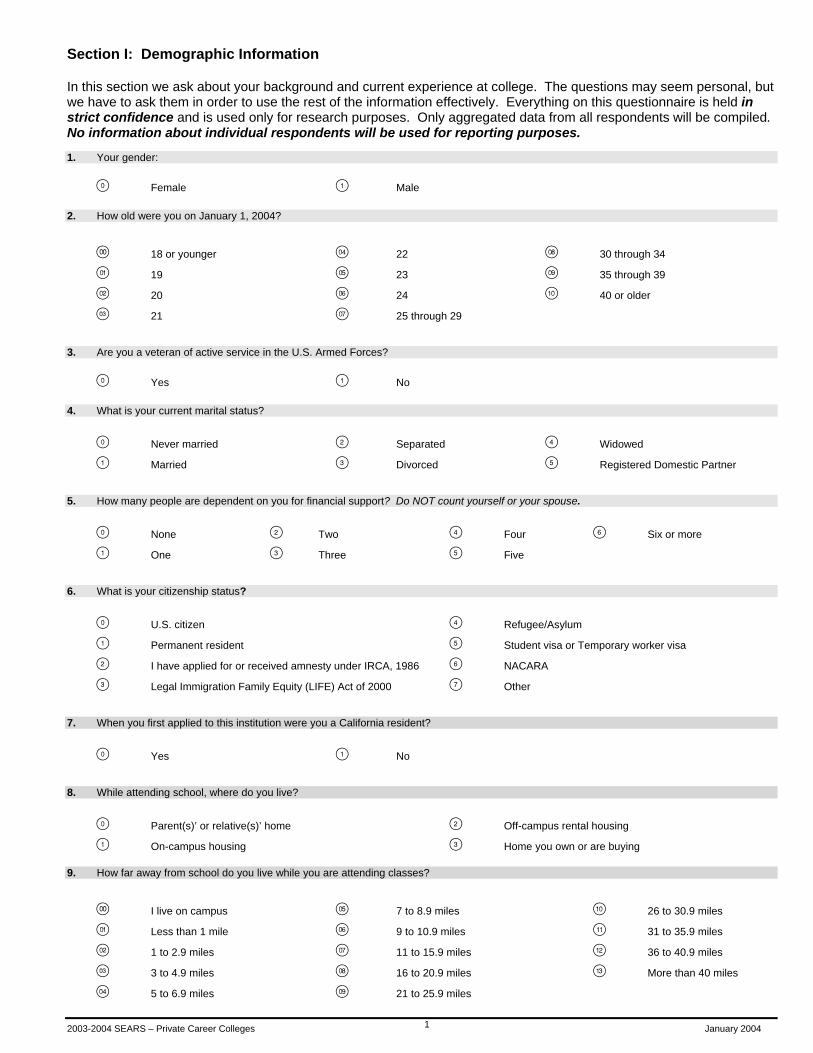
2003-2004 SEARS – Private Career Colleges January 2004 1
Section I: Demographic Information In this section we ask about your background and current experience at college. The questions may seem personal, but we have to ask them in order to use the rest of the information effectively. Everything on this questionnaire is held in strict confidence and is used only for research purposes. Only aggregated data from all respondents will be compiled. No information about individual respondents will be used for reporting purposes.
1. Your gender:
Female Male
2. How old were you on January 1, 2004?
18 or younger 22 30 through 34
19 23 35 through 39
20 24 40 or older
21 25 through 29
3. Are you a veteran of active service in the U.S. Armed Forces?
Yes No
4. What is your current marital status?
Never married Separated Widowed
Married Divorced Registered Domestic Partner
5. How many people are dependent on you for financial support? Do NOT count yourself or your spouse.
None Two Four Six or more
One Three Five
6. What is your citizenship status?
U.S. citizen Refugee/Asylum
Permanent resident Student visa or Temporary worker visa
I have applied for or received amnesty under IRCA, 1986 NACARA
Legal Immigration Family Equity (LIFE) Act of 2000 Other
7. When you first applied to this institution were you a California resident?
Yes No
8. While attending school, where do you live?
Parent(s)’ or relative(s)’ home Off-campus rental housing
On-campus housing Home you own or are buying
9. How far away from school do you live while you are attending classes?
I live on campus 7 to 8.9 miles 26 to 30.9 miles
Less than 1 mile 9 to 10.9 miles 31 to 35.9 miles
1 to 2.9 miles 11 to 15.9 miles 36 to 40.9 miles
3 to 4.9 miles 16 to 20.9 miles More than 40 miles
5 to 6.9 miles 21 to 25.9 miles

2003-2004 – Private Career Colleges January 2004 2
10. With how many roommates or housemates do you share some, or all, of the living expenses while attending college? Exclude yourself, spouse, children, parents, or other family members.
None Two Four Six or more
One Three Five
11. Your race/ethnicity:
African American/Black Hispanic/Latino: Pacific Islander:
American Indian or Alaskan Native Central American Guamanian
White/Caucasian Cuban Hawaiian
Asian: Chicano/Mexican American Samoan
Asian Indian Filipino Puerto Rican Other Pacific Islander
Chinese Laotian South American
Japanese Cambodian Other Latino Multi-racial
Korean Pakistani
Vietnamese Other Asian
12. What is your current academic level?
Undergraduate seeking a certificate or diploma Master’s or doctoral student
Undergraduate seeking an associate’s degree Teaching Credential
Undergraduate seeking a bachelor’s degree Other
13. What type of educational institution did you last attend prior to entering your current private career college? Please choose one.
High school or equivalent Private/independent four-year college or university in California
California Community College Private/independent two-year college in California
California State University (CSU) campus Another California private trade, business, or vocational school
University of California (UC) campus Out-of-state or foreign college or university
14. Are you currently enrolled in an occupational, technical, or vocational education program?
Yes Continue with question 15 No Go to question 16.
15. If you are enrolled in an occupational, technical, or vocational education program, which category best describes your current course of study?
Medical/Respiratory Therapy Network Administration Advertising
Medical/Dental Assistant CADD/CAM Public Safety
Nursing Program GIS Recreation/Travel
Pharmacy Technician Electronic Technician Cosmetology
Veterinary Technician Telecommunication Fashion Design
Other Medical Graphic Arts Food Service
Early Childhood Education Secretarial/Clerical Agriculture/Horticulture
Teaching Assistant Business/Accounting Mechanics/Skilled Trade Computer Science Legal Assistant Other

2003-2004 SEARS – Private Career Colleges January 2004 3
16. What is the total length of time required to complete your degree or certificate program, regardless of any courses you may already have completed?
EXAMPLES: CLOCK HOURS=1654; WEEKS=236; MONTHS=16 Clock Hours Weeks Months 0 0 0
1 1 1 2 2 2 3 3 3 4 4 4 5 5 5 6 6 6 7 7 7 8 8 8 9 9 9
Using the example above, please fill in either the circles for hours, weeks, or months as it applies to your program: Clock Hours Weeks Months
0 0 0 1 1 1 2 2 2 3 3 3 4 4 4 5 5 5 6 6 6 7 7 7 8 8 8
9 9 9
17. Between July 1, 2003 and June 30, 2004, how long do you intend to be enrolled in college? Using the example in question 16, please fill in the circles for hours, weeks, or months for your length of enrollment:
Clock Hours Weeks Months
0 0 0 1 1 1 2 2 2 3 3 3 4 4 4 5 5 5 6 6 6 7 7 7 8 8 8
9 9 9
18 If your school uses clock hours for your programs answer this question. How many clock hours per week do you attend school? Include classroom instruction and any required internships, externships, work experience, or labs that apply towards your program.
Less than 10 hours 25 to 29 hours
10 to 14 hours 30 to 34 hours
15 to 19 hours 35 to 39 hours
20 to 24 hours 40 hours or more

2003-2004 – Private Career Colleges January 2004 4
19. If your school uses units for your program answer this question. How many units are you taking for credit this term?
I am taking Semester units and/or I am taking Quarter units
Less than 6 units Less than 6 units
6 to 8.99 units 6 to 8.99 units
9 to 11.99 units 9 to 11.99 units
12 units or more 12 units or more
20. At the end of the last grading period, what was your approximate cumulative grade point average for all work you have completed at this school?
Under 2.00 OR (D+ or less = 55% or less)
2.00 to 2.24 (C- = 60%)
2.25 to 2.49 (C = 65%)
2.50 to 2.74 (C+ = 70%)
2.75 to 2.99 (B- = 75%)
3.00 to 3.24 (B = 80%)
3.25 to 3.49 (B+ = 85%)
3.50 to 3.74 (A- = 90%)
3.75 to 3.99 (A = 95%)
4.0 (A+ = 100%)
I have not yet completed any courses at this school, or my courses at this school are not graded.
Section II: Parental Information Regardless of your age and dependency status, we would like you to answer these next few questions about your parents. These may have influenced your decision to attend college, and are important to our research.
21. What is the highest level of education attained by your parents? Please answer even if one or both of your parents are deceased, or if your parents are separated or divorced. Please check only one for each parent.
Mother’s Education Father’s Education
No formal education
Grade school (K-8)
Some high school
High school diploma/GED
Some college classes
Private trade, business or vocational school degree/certificate
Two-year college degree/certificate
Four-year college degree (BA, BS, etc.)
Teaching credential
Some post-baccalaureate classes
Post-baccalaureate degree (MA, Ph.D., JD, etc.)
I do not know
22. What is the current marital status of your parent(s)?
My parents are married to each other.
My parents are separated or divorced from one another, or my parent is widowed or single.
Both of my parents are deceased.
I am a ward of the court, or I was a ward of the court until age 18.

2003-2004 SEARS – Private Career Colleges January 2004 5
23. How many people, other than yourself, are dependent on your parent(s) for financial support? Do NOT count your parent(s).
None Two Four Six or more
One Three Five
24. Of the dependents indicated in question 23, how many are currently attending college? Do NOT count yourself or your parent(s).
None Two Four Six or more
One Three Five
25. What was the total combined income of your parents from all sources in calendar year 2003? Include salaries, wages, retirement benefits, public assistance, income from investments, child support, and all other income. If you are not sure of the figure, please estimate.
Less than $6,000 $48,000 to $53,999 $96,000 to $107,999
$6,000 to $11,999 $54,000 to $59,999 $108,000 to $119,999
$12,000 to $17,999 $60,000 to $65,999 $120,000 to $143,999
$18,000 to $23,999 $66,000 to $71,999 $144,000 to $167,999
$24,000 to $29,999 $72,000 to $77,999 $168,000 to $191,999
$30,000 to $35,999 $78,000 to $83,999 $192,000 to $215,999
$36,000 to $41,999 $84,000 to $89,999 $216,000 to $239,999
$42,000 to $47,999 $90,000 to $95,999 $240,000 or more
Section III: Student Resources In this section, we ask about your work hours between July 1, 2003 and June 30, 2004 and about your income over different time periods. Your answers will help us understand how you have met college expenses this year. 26. How many hours on average did you work for pay per week during last summer (e.g., from June through August 2003)? Please include paid
internships.
None, I did not work for pay last summer
Less than 5 16 to 20 hours 31 to 35 hours
5 to 10 hours 21 to 25 hours 36 to 40 hours
11 to 15 hours 26 to 30 hours 40 hours or more
27. My average wage per hour was:
$6.75 or less $9.25 - $9.74 $13.75 - $14.74
$6.76 - $7.24 $9.75 - $10.24 $14.75 - $15.74
$7.25 - $7.74 $10.25 - $10.74 $15.75 - $16.74
$7.75 - $8.24 $10.75 - $11.74 $16.75 or more
$8.25 - $8.74 $11.75 - $12.74
$8.75 - $9.24 $12.75 - $13.74
28. How many hours on average did you work in unpaid internships per week during last summer (e.g., from June through August 2003)?
None, I did not have an unpaid internship
Less than 5 16 to 20 hours 31 to 35 hours
5 to 10 hours 21 to 25 hours 36 to 40 hours
11 to 15 hours 26 to 30 hours 40 hours or more

2003-2004 – Private Career Colleges January 2004 6
29. How many hours on average did you volunteer per week during last summer (e.g., from June through August 2003)?
None, I did not volunteer last summer
Less than 5 16 to 20 hours 31 to 35 hours
5 to 10 hours 21 to 25 hours 36 to 40 hours
11 to 15 hours 26 to 30 hours 40 hours or more
30. How many hours on average do you, or will you, work for pay per week from July 1, 2003 to June 30, 2004? Include all hours worked including paid internships.
None, I do not /will not work
Less than 5 16 to 20 hours 31 to 35 hours
5 to 10 hours 21 to 25 hours 36 to 40 hours
11 to 15 hours 26 to 30 hours 40 hours or more
31. My average wage per hour is/was:
$6.75 or less $9.25 - $9.74 $13.75 - $14.74
$6.76 - $7.24 $9.75 - $10.24 $14.75 - $15.74
$7.25 - $7.74 $10.25 - $10.74 $15.75 - $16.74
$7.75 - $8.24 $10.75 - $11.74 $16.75 or more
$8.25 - $8.74 $11.75 - $12.74
$8.75 - $9.24 $12.75 - $13.74
32. How many hours on average do you, or will you, work in unpaid internships per week from July 1, 2003 to June 30, 2004?
None, I do not/will not have an unpaid internship
Less than 5 16 to 20 hours 31 to 35 hours
5 to 10 hours 21 to 25 hours 36 to 40 hours
11 to 15 hours 26 to 30 hours 40 hours or more
33. How many hours on average do you, or will you, volunteer per week from July 1, 2003 to June 30, 2004?
None, I do not/will not volunteer
Less than 5 16 to 20 hours 31 to 35 hours
5 to 10 hours 21 to 25 hours 36 to 40 hours
11 to 15 hours 26 to 30 hours 40 hours or more
34. Did/will you receive money from any of the following sources between July 1, 2003 and June 30, 2004?
a. Employment Training Panel (ETP) Yes No
b. CalWorks Yes No
c. Veteran’s Benefits Yes No
d. Vocational Rehabilitation Yes No
e. SSI-survivor, disability benefits Yes No

2003-2004 SEARS – Private Career Colleges January 2004 7
35. If you answered ‘Yes’ to any of the funding sources listed in question 34, please indicate what types of expenses those sources covered. For example, if CalWorks provided funding for child care only, you would mark only the circle under “Child Care” on line C. Please check all that apply.
Books & Child Tuition Supplies Transportation Clothing Care Other Unknown
a. Employment Training Panel (ETP)
b. CalWorks
c. Veteran’s Benefits
d. Vocational Rehabilitation
e. SSI-survivor, disability benefits
36. What was your total income, if any, in calendar year 2003? If you are married, include your spouse’s income also. Do NOT include any money received through student loans or grants, scholarships or fellowships. Include salaries, wages (including work-study and assistantship earnings), retirement benefits, public assistance, income from investments, child support, and all other income.
None $3,000 to $3,999 $18,000 to $23,999 $60,000 to $71,999
Less than $1,000 $4,000 to $5,999 $24,000 to $35,999 $72,000 to $83,999
$1,000 to $1,999 $6,000 to $11,999 $36,000 to $47,999 $84,000 to $95,999
$2,000 to $2,999 $12,000 to $17,999 $48,000 to $59,999 $96,000 or more
37. Of your total calendar year 2003 income reported in the previous question, how much did you (and your spouse, if married) earn last summer? Please estimate for the three-month period of June, July, and August.
None $3,000 to $3,999 $7,000 to $7,999 $14,000 to $15,999
Less than $1,000 $4,000 to $4,999 $8,000 to $9,999 $16,000 to $17,999
$1,000 to $1,999 $5,000 to $5,999 $10,000 to $11,999 $18,000 to $19,999
$2,000 to $2,999 $6,000 to $6,999 $12,000 to $13,999 $20,000 or more
38. What will be your total income between July 1, 2003 and June 30, 2004? As previously noted, do NOT include any money received through student loans or grants, scholarships or fellowships. Include college work-study and assistantship earnings. If you are married, include your spouse's earnings.
None $3,000 to $3,999 $18,000 to $23,999 $60,000 to $71,999
Less than $1,000 $4,000 to $5,999 $24,000 to $35,999 $72,000 to $83,999
$1,000 to $1,999 $6,000 to $11,999 $36,000 to $47,999 $84,000 to $95,999
$2,000 to $2,999 $12,000 to $17,999 $48,000 to $59,999 $96,000 or more
Section IV: Paying for College These questions will help us understand how you paid for educational and living expenses between July 1, 2003 and June 30, 2004.
39. How much had you, your parents, or others saved for your college education prior to attending your first class as an undergraduate? Include savings accounts, education IRAs, savings bonds, Golden State ScholarShare Trust, or any other savings vehicles.
Nothing $10,000 to $14,999 $40,000 to $44,999 $65,000 to $69,999
Less than $500 $15,000 to $19,999 $45,000 to $49,999 $70,000 to $74,999
$500 to $999 $20,000 to $24,999 $50,000 to $54,999 $75,000 to $79,999
$1,000 to $2,999 $25,000 to $29,999 $55,000 to $59,999 $80,000 or more
$3,000 to $4,999 $30,000 to $34,999 $60,000 to $64,999
$5,000 to $9,999 $35,000 to $39,999

2003-2004 – Private Career Colleges January 2004 8
40. If you, your parents, or others saved for your college education, which savings vehicles were used? Check all that apply.
Personal Savings Account(s) Certificate of Deposit (CD) Other Qualified Tuition Savings Program Custodial Savings Account Roth IRA Coverdell Education Savings Account
Savings Bonds Trust Fund / Inheritance Do not know
Money Market Account A 529 Savings Program
Mutual Funds/Stocks Golden State ScholarShare Trust
41. Do you plan to claim, or have someone claim on your behalf, one of the following federal tuition/fee tax credits for the 2003 tax year?
The Hope Scholarship tax credit Yes No The Lifetime Learning tax credit Yes No
42. If you answered no to either option above, please choose the reason that best explains why. I do not I do not know I do not know qualify if I qualify what the credit is
The Hope Scholarship tax credit
The Lifetime Learning tax credit
43. How much of your own money (and your spouse’s, if married) will you have spent per month between July 1, 2003 and June 30, 2004 on your education and living expenses (and your spouse’s, if married)? Include money spent from savings, earnings, work-study, or other assets to pay for any educational expenses or living expenses. Do NOT include money you spent from loans, grants, scholarships, fellowships, or credit card charges that you have not yet repaid.
Nothing $200 to $399 $1,200 to $1,399
Less than $50 $400 to $599 $1,400 to $1,599
$50 to $99 $600 to $799 $1,600 to $1,799
$100 to $149 $800 to $999 $1,800 to $1,999
$150 to $199 $1,000 to $1,199 $2,000 or more
44. How much money will your parent(s) contribute per month to support your education and living expenses between July 1, 2003 and June 30, 2004? Include any monetary support for educational expenses, such as tuition and fees, food, housing, clothing, transportation, or books.
Nothing $200 to $399 $1,200 to $1,399
Less than $50 $400 to $599 $1,400 to $1,599
$50 to $99 $600 to $799 $1,600 to $1,799
$100 to $149 $800 to $999 $1,800 to $1,999
$150 to $199 $1,000 to $1,199 $2,000 or more
45. Did you apply for financial aid between July 1, 2003 and June 30, 2004?
Yes No
46. Did you receive a Cal Grant for this academic year?
I did not apply for a Cal Grant. I received a Cal Grant A I received a Cal Grant C.
I applied but did not receive a Cal Grant I received a Cal Grant B.

2003-2004 SEARS – Private Career Colleges January 2004 9
47. What will be the total amount of scholarships, fellowships, and grant assistance awarded to you between July 1, 2003 and June 30, 2004? Include Pell Grants, Cal Grants, SEOG, or EOPS grants, and any other gift aid (money you do not have to repay) you received or will have received. If an employer is paying for your education expenses, include this amount.
Nothing $1,000 to $1,999 $6,000 to $7,999 $14,000 to $15,999
Less than $200 $2,000 to $2,999 $8,000 to $9,999 $16,000 to $17,999
$200 to $499 $3,000 to $3,999 $10,000 to $11,999 $18,000 to $19,999
$500 to $999 $4,000 to $5,999 $12,000 to $13,999 $20,000 or more
48. What will be the total amount you will borrow to help pay for your educational and living expenses between July 1, 2003 and June 30, 2004? Include loans from the institution you are currently attending, the federal government, banks, credit cards, or friends or family. Do NOT include grants, scholarships or fellowships, or income from a job. If your spouse borrowed money for his/her educational expenses, do NOT include his/her loans in this amount.
Nothing $2,000 to $2,999 $8,000 to $9,999 $16,000 to $17,999
Less than $500 $3,000 to $3,999 $10,000 to $11,999 $18,000 to $19,999
$500 to $999 $4,000 to $5,999 $12,000 to $13,999 $20,000 or more
$1,000 to $1,999 $6,000 to $7,999 $14,000 to $15,999
49. Of the total amount of borrowing you reported in question 48, how much will come from the following sources? Family or friends Credit cards
Nothing
Less than $200 $200 to $499
$500 to $999
$1,000 to $1,999
$2,000 to $2,999
$3,000 to $3,999
$4,000 to $5,999
$6,000 to $7,999
$8,000 to $9,999
$10,000 or more
50. What is your total debt on all of your credit cards? Please indicate the full amount you owe on all cards, regardless of when or why the charges were made. If you are married, include your spouse’s credit card debt.
Nothing $3,000 to $4,999 $13,000 to $14,999
Less than $500 $5,000 to $6,999 $15,000 to $16,999
$500 to $999 $7,000 to $8,999 $17,000 to $18,999
$1,000 to $1,999 $9,000 to $10,999 $19,000 or more
$2,000 to $2,999 $11,000 to $12,999

2003-2004 – Private Career Colleges January 2004 10
51. Excluding borrowing reported in question 48, what is your outstanding total debt for education and living expenses in previous academic years? Include loans from educational institutions, from banks, the federal government or from friends or family, as well as credit card charges that you have not yet repaid. If you are married, please report how much your spouse has already borrowed.
Your Educational Debt Your Spouse’s Educational Debt
Nothing
Less than $1,000 $1,000 to $1,999 $2,000 to $3,999 $4,000 to $5,999 $6,000 to $9,999 $10,000 to $13,999 $14,000 to $17,999 $18,000 to $21,999 $22,000 to $25,999 $26,000 to $29,999 $30,000 to $33,999 $34,000 to $37,999 $38,000 to $41,999 $42,000 to $45,999 $46,000 to $49,999
$50,000 or more
Section V: Education and Living Expenses
These questions concern your expenses while attending college. Please answer these questions for the period between July 1, 2003 and June 30, 2004. If you share housing, food, or other costs with roommates, please report your share only. If you have a spouse or dependents, please include housing, food, medical, and other living expenses for them as well as yourself. 52. What is your share of monthly housing costs for your residence? Include rent, mortgage and property taxes, payments to your parents or other
relatives, etc. Taking seasonal variations into account, include your share of utilities for water, gas, electricity, garbage, and telephone, excluding long distance charges.
Nothing $300 to $399 $700 to $799 $1,200 to $1,349
Less than $100 $400 to $499 $800 to $899 $1,350 to $1,499
$100 to $199 $500 to $599 $900 to $1,049 $1,500 or more
$200 to $299 $600 to $699 $1,050 to $1,199
53. Where you currently live, what is your share of the monthly expenses for food, toiletries, and household supplies (e.g., cleaning materials)?
Nothing $125 to $149 $250 to $274 $525 to $599
Less than $50 $150 to $174 $275 to $299 $600 or more
$50 to $74 $175 to $199 $300 to $374
$75 to $99 $200 to $224 $375 to $449
$100 to $124 $225 to $249 $450 to $524
54. Please indicate your total monthly medical and dental insurance premiums. If you have partial coverage through your parents, employer, or spouse, please indicate only the portion that you pay.
Nothing $100 to $149 $250 to $299 $400 or more
Less than $50 $150 to $199 $300 to $349 No insurance
$50 to $99 $200 to $249 $350 to $399
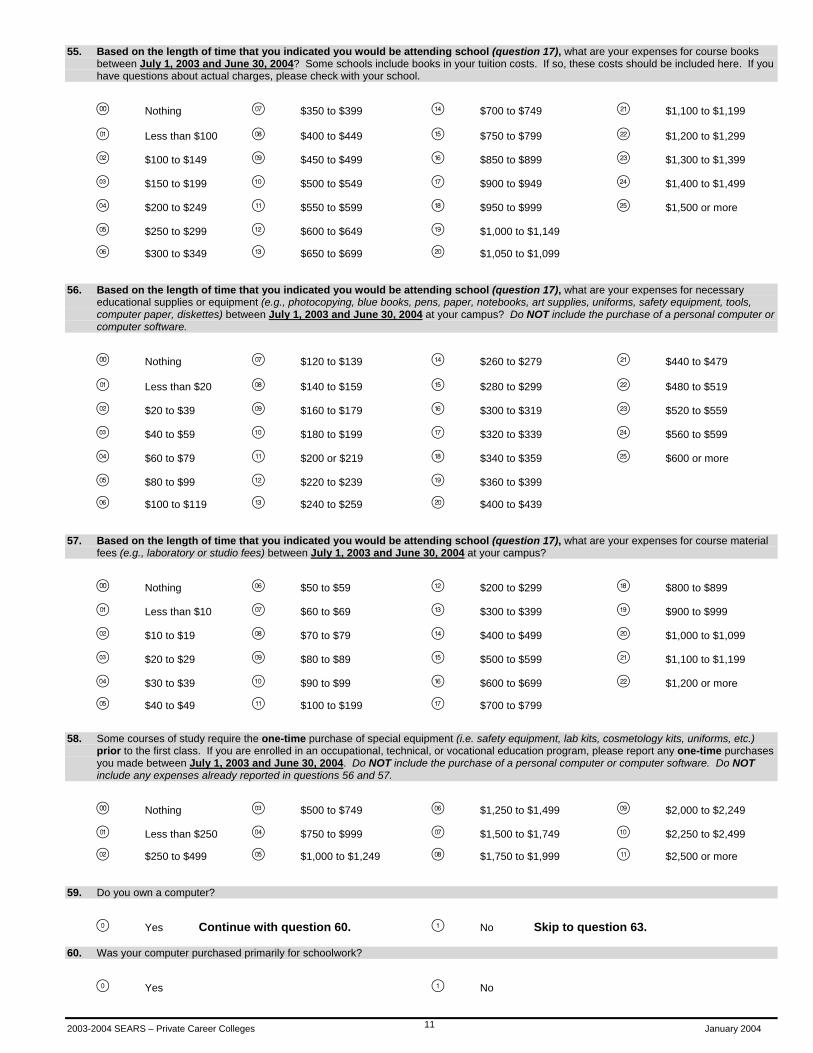
2003-2004 SEARS – Private Career Colleges January 2004 11
55. Based on the length of time that you indicated you would be attending school (question 17), what are your expenses for course books between July 1, 2003 and June 30, 2004? Some schools include books in your tuition costs. If so, these costs should be included here. If you have questions about actual charges, please check with your school.
Nothing $350 to $399 $700 to $749 $1,100 to $1,199
Less than $100 $400 to $449 $750 to $799 $1,200 to $1,299
$100 to $149 $450 to $499 $850 to $899 $1,300 to $1,399
$150 to $199 $500 to $549 $900 to $949 $1,400 to $1,499
$200 to $249 $550 to $599 $950 to $999 $1,500 or more
$250 to $299 $600 to $649 $1,000 to $1,149
$300 to $349 $650 to $699 $1,050 to $1,099
56. Based on the length of time that you indicated you would be attending school (question 17), what are your expenses for necessary educational supplies or equipment (e.g., photocopying, blue books, pens, paper, notebooks, art supplies, uniforms, safety equipment, tools, computer paper, diskettes) between July 1, 2003 and June 30, 2004 at your campus? Do NOT include the purchase of a personal computer or computer software.
Nothing $120 to $139 $260 to $279 $440 to $479
Less than $20 $140 to $159 $280 to $299 $480 to $519
$20 to $39 $160 to $179 $300 to $319 $520 to $559
$40 to $59 $180 to $199 $320 to $339 $560 to $599
$60 to $79 $200 or $219 $340 to $359 $600 or more
$80 to $99 $220 to $239 $360 to $399
$100 to $119 $240 to $259 $400 to $439
57. Based on the length of time that you indicated you would be attending school (question 17), what are your expenses for course material fees (e.g., laboratory or studio fees) between July 1, 2003 and June 30, 2004 at your campus?
Nothing $50 to $59 $200 to $299 $800 to $899
Less than $10 $60 to $69 $300 to $399 $900 to $999
$10 to $19 $70 to $79 $400 to $499 $1,000 to $1,099
$20 to $29 $80 to $89 $500 to $599 $1,100 to $1,199
$30 to $39 $90 to $99 $600 to $699 $1,200 or more
$40 to $49 $100 to $199 $700 to $799
58. Some courses of study require the one-time purchase of special equipment (i.e. safety equipment, lab kits, cosmetology kits, uniforms, etc.) prior to the first class. If you are enrolled in an occupational, technical, or vocational education program, please report any one-time purchases you made between July 1, 2003 and June 30, 2004. Do NOT include the purchase of a personal computer or computer software. Do NOT include any expenses already reported in questions 56 and 57.
Nothing $500 to $749 $1,250 to $1,499 $2,000 to $2,249
Less than $250 $750 to $999 $1,500 to $1,749 $2,250 to $2,499
$250 to $499 $1,000 to $1,249 $1,750 to $1,999 $2,500 or more
59. Do you own a computer?
Yes Continue with question 60. No Skip to question 63.
60. Was your computer purchased primarily for schoolwork?
Yes No

2003-2004 – Private Career Colleges January 2004 12
61 When was your computer purchased?
Between July 1, 2003 and June 30, 2004 2002 2000 Prior to 1998
Between January 1, 2003 and June 30, 2003 2001 1999
62. How much did your computer cost?
Less than $500 $1,000 to $1,249 $2,000 to $2,499 $3,500 to $3,999
$500 to $749 $1,250 to $1,499 $2,500 to $2,999 $4,000 or more
$750 to $999 $1,500 to $1,999 $3,000 to $3,499 Do not know
63 Excluding the purchase price of a computer, what will be your monthly average expenses between July 1, 2003 and June 30, 2004? Include hardware, software (excluding entertainment software), supplied (toner, paper) repairs, e-mail, and internet services.
Nothing $125 to $149 $250 to $274 $525 to $599
Less than $50 $150 to $174 $275 to $299 $600 or more
$50 to $74 $175 to $199 $300 to $374
$75 to $99 $200 to $224 $375 to $449
$100 to $124 $225 to $249 $450 to $524
64. What are your monthly average expenses for transportation to and from classes and work (e.g., bus fare, train fare, gasoline, tolls, parking.)? If your campus includes transportation costs in your fees, do NOT include them here. Do NOT include car payments, repairs, insurance or registration.
Nothing $30 to $39 $80 to $94 $140 to $159
Less than $10 $40 to $49 $95 to $104 $160 to $179
$10 to $19 $50 to $64 $105 to $119 $180 to $199
$20 to $29 $65 to $79 $120 to $139 $200 or more
65. What are your monthly average expenses for medical and dental costs not covered by insurance (e.g., co-payments, medication, and deductibles)?
Nothing $20 to $29 $50 to $64 $95 to $104
Less than $10 $30 to $39 $65 to $79 $105 to $119
$10 to $19 $40 to $49 $80 to $94 $120 or more
66. What are your monthly average expenses for child or dependent care while participating in education-related activities between July 1, 2003 and June 30, 2004 (e.g., studying, attending classes, field work, commuting, and internships)?
I do not have dependents $150 to $199 $400 to $449 $650 to $699
Nothing $200 to $249 $450 to $499 $700 to $749
Less than $50 $250 to $299 $500 to $549 $750 to $799
$50 to $99 $300 to $349 $550 to $599 $800 to $999
$100 to $149 $350 to $399 $600 to $649 $1,000 or more
67. What are your monthly average expenses for clothing, shoes, laundry, and hair care between July 1, 2003 and June 30, 2004?
Less than $25 $100 to $124 $175 to $199 $300 to $399
$25 to $49 $125 to $149 $200 to $249 $400 to $499
$50 to $74 $150 to $174 $250 to $299 $500 or more
$75 to $99

2003-2004 SEARS – Private Career Colleges January 2004 13
68. What are your monthly average expenses for food or meals eaten away from your local residence, such as dining out or snacks (e.g., lunches bought on campus)?
Nothing $50 to $74 $125 to $149 $250 to $299
Less than $25 $75 to $99 $150 to $199 $300 or more
$25 to $49 $100 to $124 $200 to $249
69. What are your monthly average expenses for recreation and hobbies (e.g. nonacademic books, magazines, music, entertainment software, cable television, movies, concerts, and sporting events) between July 1, 2003 and June 30, 2004?.
Less than $25 $100 to $124 $175 to $199 $300 to $399
$25 to $49 $125 to $149 $200 to $249 $400 to $499
$50 to $74 $150 to $174 $250 to $299 $500 or more
$75 to $99
70. What are your monthly average expenses for travel to and from your parent(s)’ residence(s) between July 1, 2003 and June 30, 2004 (e.g., airfare, bus fare, train fare, gasoline)?
Travel Within California Travel Outside California
Does not Apply
I live with my parent(s) Nothing Less than $135 $135 to $269
$270 to $404 $405 to $539 $540 to $674 $675 to $809 $810 to $944 $945 to $1,079 $1,080 to $1,214 $1,215 to $1,349 $1,350 or more Section VI: Student Opinions This last section provides us with information regarding your satisfaction with the education and services you receive. 71. Please think back to the last time you applied for admission to this school. At the time you were applying, which type of educational institution
did you really want to attend?
The school I am now attending. (Please go to question #73)
A different private trade, business, or vocational school in California.
A University of California campus.
A California State University campus.
A California Community College.
A private or independent college or university in California.
An out-of-state college or university.

2003-2004 – Private Career Colleges January 2004 14
72. If you are NOT currently attending the college you really wanted to attend, what is the single most important reason? Please choose only one.
I was denied admission.
I could not afford to attend.
I could not get the classes, courses or programs that I wanted.
I received late notification of admission or housing.
The college was too far away or too close to home.
I did not receive any personal attention or interest from the college.
The classes conflicted with my work schedule.
Other
73. If you had the option of taking this survey on-line in a web version or a paper version, which would you choose?
I would prefer a paper version of the questionnaire.
I would prefer to take the survey on the Internet.
Comments: Thank you for taking the time to answer all of our questions. Your help is greatly appreciated. Please return your completed questionnaire to your school as soon as possible. If you are interested in the survey results, please contact us at [email protected]