CRL Print Archives Preservation Registry (PAPR) ALA Midwinter 2012 Update.
Upload
maurice-shepherdCategory
view
213download
0
2002 Survey of Business Owners and Self-Employed Persons (SBO)
Lee R. WentelaU.S. Census Bureau - Company Statistics Division
ALA 2008 Midwinter MeetingPennsylvania Convention Center
Philadelphia, PA, January 14, 2008

2 ALA 2008January 14, 2008
Survey of Business OwnersFormerly the Surveys of Minority-
and Women-Owned Businesses
Part of the Economic Census required by law to be taken every 5 years for years ending in “2” and “7”
Provides data for businesses and business owners by • Gender • Hispanic or Latino origin (May be of any
race) • Race

3 ALA 2008January 14, 2008
Survey of Business Owners(cont.)
Established in 1969 by the same Executive Order that created Dept. of Commerce’s Minority Business Development Agency (MBDA)
Data compiled from several sources• IRS business income tax returns• Other Economic Census reports• Mailout/mailback survey
Conducted on a company or firm basis rather than individual locations of a firm

4 ALA 2008January 14, 2008
Which Businesses Are Included
Includes all nonfarm firms operating during 2002 with receipts of $1,000 or more that filed tax forms as:
• Individual proprietorships• Partnerships• Any type of corporation

5 ALA 2008January 14, 2008
Which Businesses Are Excluded
Excludes firms classified as:
• Crop and animal production• Rail and scheduled air transportation• Postal service• Funds, trusts, and other financial vehicles,
except real estate investment trusts• Religious, grantmaking, civic, professional,
and similar organizations• Private households• Public administration

6 ALA 2008January 14, 2008
Definition of Hispanic or Latino Business Ownership
• Defined as owning 51% or more of the stock or equity in the business.

7 ALA 2008January 14, 2008
Categories of Hispanic or Latino Business Ownership
• Hispanic or Latino origin- Hispanic- Non-Hispanic
• Gender- Male- Female- Equally Male-/Female-Owned

8 ALA 2008January 14, 2008
Categories of Hispanic or Latino Business Ownership (cont.)
• Detailed Hispanic or Latino categories- Mexican, Mexican American, Chicano- Puerto Rican- Cuban- Other Spanish/Hispanic/Latino

9 ALA 2008January 14, 2008
Categories of Other Business Ownership
• Race- White- Black or African American- American Indian or Alaska Native
(AIAN)- Asian- Native Hawaiian or Other Pacific
Islander (NHPI)

10 ALA 2008January 14, 2008
Categories of Other BusinessOwnership (cont.)
• Other- Publicly held and other firms not
classifiable by gender, Hispanic or Latino origin, and race
• For respondent firms only - Veteran- Service-disabled veteran

11 ALA 2008January 14, 2008
Most Significant Changes in2002
• Ethnicity and race questions were modified to meet Office of Management and Budget (OMB) guidelines.
• Allowed an individual business owner to self-identify with more than one racial category.

12 ALA 2008January 14, 2008
Most Significant Changes in2002 (cont.)
• North American Industry Classification System (NAICS) replaced the Standard Industrial Classification (SIC) system used in previous surveys.

13 ALA 2008January 14, 2008
New Owner Characteristics Data Collected in 2002
• Age• Education level• Veteran status• Primary function in the business• Average number of hours worked per week• Whether the business provided the owner’s
primary income source

14 ALA 2008January 14, 2008
New Business CharacteristicsData Collected in 2002
• Year the business was originally established, purchased, or acquired
• Home-based• Family-owned• Franchise• Source(s) of capital used to:
- start/acquire the business- expand/improve the business
• Types of customers• Types of workers

15 ALA 2008January 14, 2008
Publication Levels - Businesses
Summary statistics at the U.S. level and at the State level by 2- and 3-digit NAICS codes on the total number of firms by gender, Hispanic or Latino origin, and race; sales and receipts, employees, and annual payroll
U.S. level data by employment and receipts size of firm
Selected metropolitan areas, counties, and places with 100 or more women- or minority-owned firms

16 ALA 2008January 14, 2008
Publication Levels – Characteristics of Respondent Firms
U.S. level by kind of business, gender, Hispanic or Latino origin, and race
U.S. level by employment and receipts size of firms

17 ALA 2008January 14, 2008
Publication Levels – Characteristics of Owners of Respondent Firms
U.S. level by kind of business, gender, Hispanic or Latino origin, race, and business interest

18 ALA 2008January 14, 2008
SBO Includes Firms With Paid Employees and Firms With No Paid
Employees
2002
All firms(millions)
Sales and receipts
(billion dollars)
Total U.S. firms 23.0 22,604
Employer firms 5.5 21,836
Nonemployer firms 17.4 767
19 ALA 2008January 14, 2008
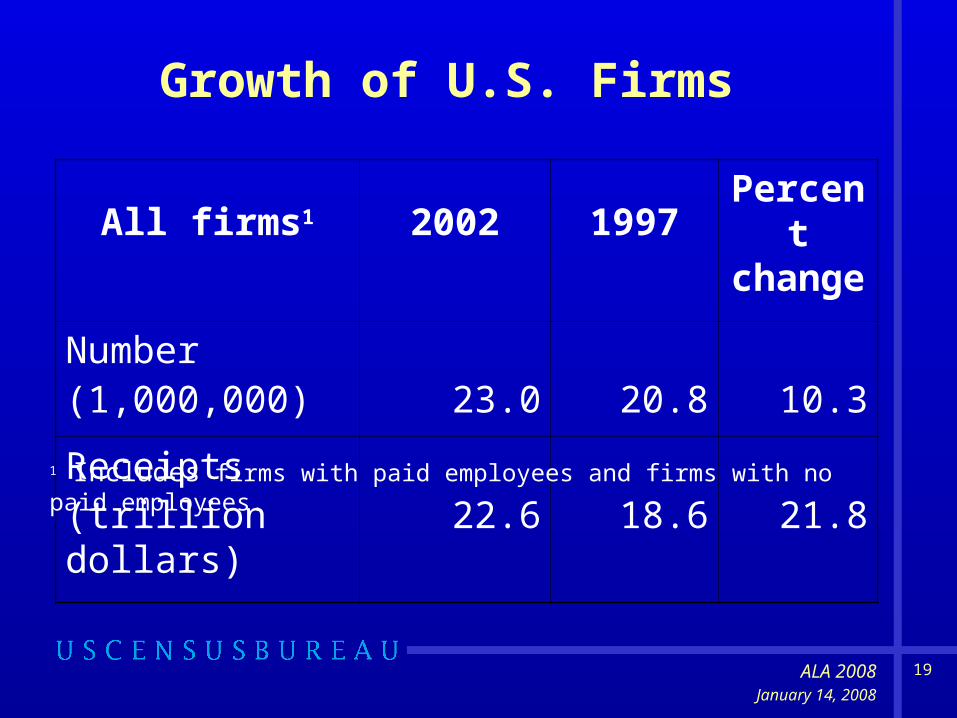
Growth of U.S. Firms
All firms1 2002 1997Percent change
Number(1,000,000) 23.0 20.8 10.3
Receipts(trillion dollars) 22.6 18.6 21.8
1 Includes firms with paid employees and firms with no paid employees.

20 ALA 2008January 14, 2008
Growth of Hispanic-Owned Firms
All firms1 2002 1997Percent change
Number(1,000) 1,573 1,200 31.1
Receipts(billion dollars) 221.9 186.3 19.1
1 Includes firms with paid employees and firms with no paid employees.

21 ALA 2008January 14, 2008
Percent Change Comparisonfrom 1997 to 2002 by Group1
1 American Indian- and Alaska Native-owned businesses have been excluded due to noncomparability.
* Denotes that the percent change for NHPI-owned firms’ receipts was not statistically significant.
31%
49%
22%
45%
10%
24%24%19%
8%
3%
0%
10%
20%
30%
40%
50%
60%
U.S. Total Hispanic orLatino
Black Asian NHPI*
All firms
Receipts

22 ALA 2008January 14, 2008
Growth of U.S. Employer Firms
Firms with paid employees 2002 1997
Percent change
Number(1,000,000) 5.5 5.3 4.3
Receipts(trillion dollars) 21.8 17.9 21.9

23 ALA 2008January 14, 2008
Growth of Hispanic-OwnedEmployer Firms
Firms with paid employees 2002 1997
Percent change
Number(1,000) 200 212 -5.8
Receipts(billion dollars) 179.5 158.7 13.1

24 ALA 2008January 14, 2008
Percent Change Comparisonfrom 1997 to 2002 by Group1
1 American Indian- and Alaska Native-owned businesses have been excluded due to noncomparability.
* Denotes that the percent changes for Black-owned employer firms and Asian- and NHPI-owned employer firms’ receipts were not statistically significant.
22%22%
1%4%
11%
-6%
17%13%
6%
-6%0%
10%
20%
30%
40%
50%
60%
U.S. Total Hispanic orLatino
Black* Asian* NHPI*
Employer firms
Receipts

25 ALA 2008January 14, 2008

26 ALA 2008January 14, 2008
Growth of Hispanic-OwnedFirms by State
All firms by state1 2002 1997
Percent change
California 427,678 336,405 27.1
Texas 319,340 240,396 32.8
Florida 266,688 193,902 37.5
1 Includes firms with paid employees and firms with no paid employees. Firms with more than one domestic establishment are counted in each geographic area in which they operate, but only once in the state total.

27 ALA 2008January 14, 2008
Combined Statistical Areas (CSAs) With the Largest Number
of Hispanic-Owned Firms: 2002
CSAFirms
(number)1
Los Angeles-Long Beach-Riverside, CA 277,858New York-Newark-Bridgeport, NY-NJ-CT-PA 211,024Houston-Baytown-Huntsville, TX 75,5621 Includes firms with paid employees and firms with no paid employees. Firms with more than one domestic establishment are counted in each geographic area in which they operate, but only once in the U.S. total.

28 ALA 2008January 14, 2008
Counties With the Largest Numberof Hispanic-Owned Firms : 2002
CountyFirms
(number)1
Los Angeles County, CA 188,422
Miami-Dade County, FL 163,187
Harris County, TX 61,934
Bronx County, NY 38,324
Queens County, NY 35,195
1 Includes firms with paid employees and firms with no paid employees. Firms with more than one domestic establishment are counted in each county in which they operate, but only once in the state total.

29 ALA 2008January 14, 2008
Cities With the Largest Number of Hispanic-Owned Firms: 2002
1 Includes firms with paid employees and firms with no paid employees. Firms with more than one domestic establishment are counted in each city in which they operate, but only once in the state total.
CityFirms
(number)1
New York, NY 129,412Los Angeles, CA 84,629
Houston, TX 41,753
Miami, FL 35,887
San Antonio, TX 29,654

30 ALA 2008January 14, 2008
Distribution of Hispanic-Owned Firms by Kind of Business: 2002
Total: 1,573,464
Administrative and
support and waste
management and remediation
services13%
Health care and social
assistance12%
All other kinds of businesses
26%
Other services (except public administration)
16%
Construction14%
Professional, scientific, and
technical services
9%
Retail trade10%
1 Firms with more than one domestic establishment are counted in each industry in which they operated, but only once in the U.S. total.

31 ALA 2008January 14, 2008
Industries Accounting for theLargest Receipts for
Hispanic-Owned Firms: 2002
Kind of businessSales and
receipts(billion dollars)1
Retail trade 40.4Wholesale trade 39.3Construction 31.4Manufacturing 18.0
1 Receipts are for firms with paid employees and firms with no paid employees.

32 ALA 2008January 14, 2008
Industries With the Highest Average Receipts (in $1,000s) Per Firm for
Hispanic-Owned Firms Compared to All U.S. Firms: 2002
460
664
534
1,811
2,669
234
267
488
581
1,151
Accommodation and foodservices
Retail trade
Mining
Manufacturing
Wholesale trade
Hispanic
All U.S. firms, excludingpublicly held and otherunclassifiable firms

33 ALA 2008January 14, 2008
Percent of Home-based Firms by Receipts Size of Firm: 2002
Receipts size of respondent firms
% of Hispanic-owned respondent firms
% of all respondent firms
Less than $5,000 55.6 64.7
$5,000 to $9,999 51.8 62.5
$10,000 to $24,999 46.9 58.7
$25,000 to $49,999 44.4 54.4
$50,000 to $99,999 42.6 49.0
$100,000 to $249,999 33.8 37.4
$250,000 to $499,999 23.8 23.4
$500,000 to $999,999 16.5 14.4
$1,000,000 or more 7.8 5.8

34 ALA 2008January 14, 2008
Percent of Franchised Employer Firmsby Employment Size of Firm: 2002
Employment size of respondent firms
% of Hispanic-owned respondent firms
% of all respondent firms
No employees1 3.3 3.1
1 to 4 employees 2.1 2.0
5 to 9 employees 3.3 4.0
10 to 19 employees 4.7 5.8
20 to 49 employees 7.6 8.7
50 to 99 employees 5.5 8.8
100 to 499 employees 9.0 7.7
500 employees or more 6.4 3.7
1 Includes firms with payroll at any time during 2002.

35 ALA 2008January 14, 2008
Sources of Start-Up Capital: 2002
Sources ofstart-up capital
% of Hispanic-owned respondent firms
% of all respondent firms
Personal/family savings 51.2 54.6
Other personal/family assets 6.7 9.0
Personal/business credit card9.4 8.8
Business loan from govt. 0.8 0.9
Govt.-guaranteed bank loan 0.4 0.7
Business loan from bank 5.6 11.4
Outside investor 1.8 2.7
None needed 33.1 27.7
Item not reported 5.1 3.9

36 ALA 2008January 14, 2008
All U.S. Firms by DetailedHispanic or Latino Origin: 2002
Detailed Hispanic or Latino origin Firms1
(thousands)
Sales and receipts
(billion dollars)
Mexican, Mexican American, Chicano 701 96.7
Puerto Rican 109 12.3
Cuban 152 35.4
Other Spanish/Hispanic/Latino 596 74.21 Includes firms with paid employees and firms with no paid employees.

37 ALA 2008January 14, 2008
Changes for 2007
One comprehensive 2007 SBO form accommodating up to four owners
Nineteen new questions “Some other race” added to race categories Opportunity provided to report online

38 ALA 2008January 14, 2008
Changes for 2007 (cont.)
Protective noise for disclosure avoidance Estimates for equally Hispanic-/Not Hispanic-
owned firms (50% / 50% ownership) are tabulated separately
More Veteran-owned data More timely data releases

39 ALA 2008January 14, 2008
Tentative 2007 SBO Calendar
Phase I Mailout June 2008• 1.2 million employers • 3 mail report form follow-ups
Phase II Mailout May 2009• 1.2 million nonemployers and new employers• 2 mail report form follow-ups

40 ALA 2008January 14, 2008
2007 SBO Results Released on a flow basis from 2010 to 2011
• Press events
• SBO Web site: www.census.gov/csd/sbo
• For access to prepackaged data products and the ability to build custom tables, visit American FactFinder (AFF), the Census Bureau’s online, self-service data access tool at www.factfinder.census.gov

41 ALA 2008January 14, 2008
Contact InformationLee Wentela Chief, Economic Census BranchPhone: 301.763.7270Email: [email protected]
Katherine RussellProject Manager, Survey of Business OwnersPhone: 301.763.3316Toll-free number: 888.225.4022Email: [email protected]