VETERANS BENEFITS ADMINISTRATION Department of Veterans Affairs VA Once.
2001 National Survey of Veterans (NSV) Final Report

ii
ACKNOWLEDGEMENTS
Susan Krumhaus was the Project Officer for the U.S. Department of Veterans Affairs. In addition to her
management responsibilities, she provided valuable input into the sample and questionnaire design
process, and outlined the overall focus for this final report. At Westat, Veronica Nieva was the Corporate
Officer and John Helmick was the Project Director. G. Hussain Choudhry was the senior staff statistician.
Katie Hubbell supervised all data processing activities and Susan Fraser was responsible for all telephone
center operations. Contributing authors to this report were Mike Wilson, Shelley Perry, Cynthia Helba,
Wayne Hintze, Mareena Wright, Kimya Lee, James Greenlees, David Rockwell and Mary Ann Deak.
iii
TABLE OF CONTENTS
Chapter Page
EXECUTIVE SUMMARY....................................................................... xiii 1 INTRODUCTION.................................................................................... 1-1
1.1 The 2001 National Survey of Veterans........................................... 1-2 1.2 Veteran Access to Information About VA Benefits ......................... 1-6 1.3 Organization of the Report ............................................................ 1-10
2 STUDY METHODOLOGY...................................................................... 2-1
2.1 Questionnaire Development .......................................................... 2-1 2.2 Sample Design ............................................................................. 2-3 2.3 Survey Administration .................................................................. 2-3 2.4 Survey Yields ............................................................................... 2-6
3 THE VETERAN POPULATION............................................................... 3-1
3.1 Gender......................................................................................... 3-1 3.2 Age.............................................................................................. 3-2 3.3 Race and Ethnicity........................................................................ 3-3 3.4 Marital Status ............................................................................... 3-4 3.5 Level of Education........................................................................ 3-5 3.6 Employment Status ....................................................................... 3-6 3.7 Family Income ............................................................................. 3-7 3.8 Historical Perspective and Trends .................................................. 3-8
4 MILITARY SERVICE EXPERIENCE...................................................... 4-1
4.1 Introduction ................................................................................. 4-1 4.2 Branch of Service ......................................................................... 4-1 4.3 Period of Service .......................................................................... 4-6 4.4 Combat Exposure ......................................................................... 4-9 4.5 Service-Related Disability and Service-Connected Disability Rating 4-11
5 HEALTH STATUS.................................................................................. 5-1
5.1 Health Status ................................................................................ 5-3 5.2 Functional Limitations .................................................................. 5-8 5.3 Health Conditions ......................................................................... 5-14

iv
TABLE OF CONTENTS (continued)
Chapter Page
6 HEALTH CARE ...................................................................................... 6-1
6.1 Health Insurance Coverage............................................................ 6-1 6.2 Health Care Received in the Past Year........................................... 6-7 6.3 Sources of Health Care.................................................................. 6-12 6.4 Reasons for Not Using VA Health Care ......................................... 6-16
7 VETERAN BENEFITS ADMINISTRATION PROGRAMS....................... 7-1
7.1 VA Disability Compensation and Pension Programs ....................... 7-1 7.2 Educational Programs ................................................................... 7-9 7.3 Vocational Rehabilitation and Employment Services ...................... 7-15 7.4 Home Loan Guaranty Program...................................................... 7-18 7.5 Life Insurance Program................................................................. 7-22
8 BURIAL BENEFITS................................................................................ 8-1
8.1 Veteran Awareness of Burial Benefit Entitlements.......................... 8-2 8.2 Veteran Burial Plans ..................................................................... 8-4
8.2.1 Disposition of Cremated Remains for Veterans Indicating Cremation as a Burial Plan.............................. 8-8
8.2.2 Burial in a National or State Veterans’ Cemetery.............. 8-9
GLOSSARY OF TERMS.......................................................................... G-1
List of Appendixes
Appendix
A THE SURVEY INSTRUMENT................................................................ A-1 B SAMPLING PLAN.................................................................................. B-1 C SAMPLE WEIGHTING........................................................................... C-1
v
TABLE OF CONTENTS (continued)
List of Tables
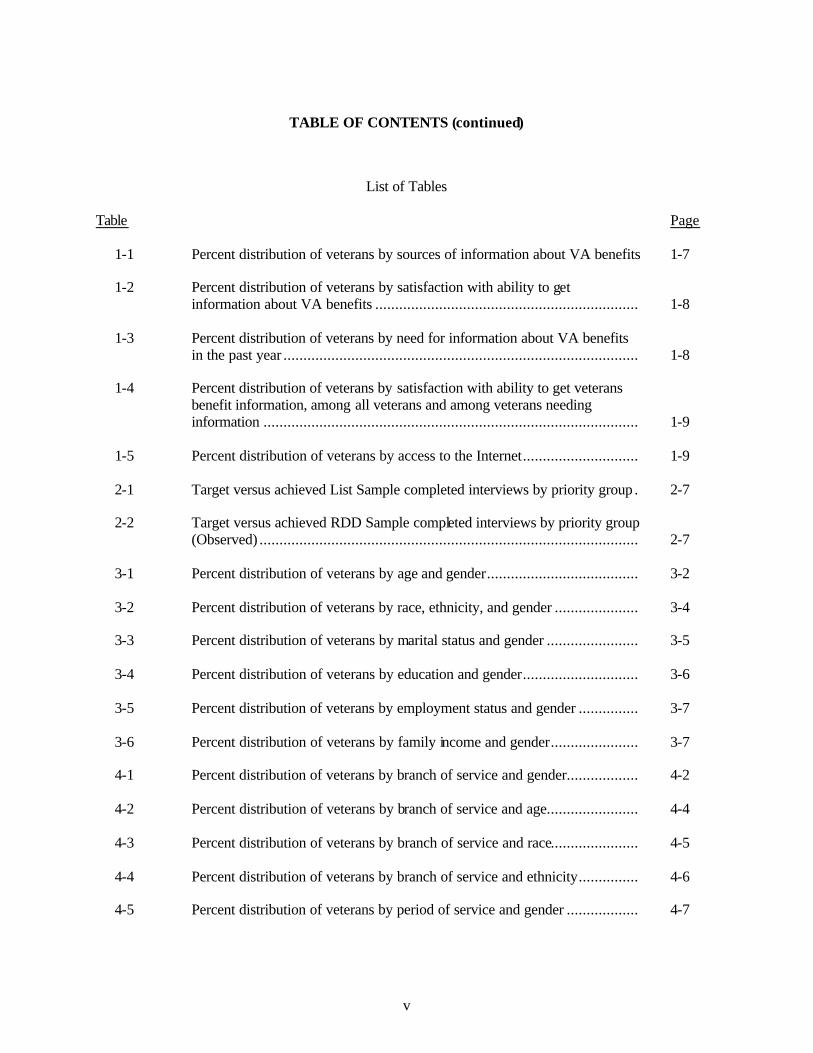
Table Page 1-1 Percent distribution of veterans by sources of information about VA benefits 1-7 1-2 Percent distribution of veterans by satisfaction with ability to get information about VA benefits .................................................................. 1-8 1-3 Percent distribution of veterans by need for information about VA benefits in the past year ......................................................................................... 1-8 1-4 Percent distribution of veterans by satisfaction with ability to get veterans benefit information, among all veterans and among veterans needing information .............................................................................................. 1-9 1-5 Percent distribution of veterans by access to the Internet............................. 1-9 2-1 Target versus achieved List Sample completed interviews by priority group . 2-7 2-2 Target versus achieved RDD Sample completed interviews by priority group (Observed) ............................................................................................... 2-7 3-1 Percent distribution of veterans by age and gender...................................... 3-2 3-2 Percent distribution of veterans by race, ethnicity, and gender ..................... 3-4 3-3 Percent distribution of veterans by marital status and gender ....................... 3-5 3-4 Percent distribution of veterans by education and gender............................. 3-6 3-5 Percent distribution of veterans by employment status and gender ............... 3-7 3-6 Percent distribution of veterans by family income and gender...................... 3-7 4-1 Percent distribution of veterans by branch of service and gender.................. 4-2 4-2 Percent distribution of veterans by branch of service and age....................... 4-4 4-3 Percent distribution of veterans by branch of service and race...................... 4-5 4-4 Percent distribution of veterans by branch of service and ethnicity............... 4-6 4-5 Percent distribution of veterans by period of service and gender .................. 4-7

vi
TABLE OF CONTENTS (continued)
List of Tables (continued)
Table Page 4-6 Percent distribution of veterans by period of service and race ...................... 4-8 4-7 Percent distribution of veterans by period of service and ethnicity................ 4-9 4-8 Percent distribution of veterans by service in combat or war zone or exposure to dead, dying, or wounded and gender ........................................ 4-10 4-9 Percent distribution of veterans by service in combat, war zone, or exposure to dead, dying, or wounded and period of service........................................ 4-11 4-10 Percent distribution of veterans by service-related disability and gender ....... 4-12 4-11 Percent distribution of veterans by service-connected disability rating and gender ............................................................................................... 4-12 4-12 Percent distribution of veterans by service-related disability and branch of service ..................................................................................................... 4-13 4-13 Percent distribution of veterans by service-connected disability rating and branch of service ...................................................................................... 4-13 4-14 Percent distribution of veterans by service-related disability and period of service ..................................................................................................... 4-14 4-15 Percent distribution of veterans by service-connected disability rating and period of service....................................................................................... 4-14 5-1 Percent distribution of veterans by health care enrollment priority groups..... 5-2 5-2 Percent distribution of veterans by health status and health care priority group ....................................................................................................... 5-3 5-3 Percent distribution of veterans by health status and age.............................. 5-4 5-4 Percent distribution of veterans by health status and age (under 65 and 65 or older) ......................................................................... 5-5 5-5 Percent distribution of veterans by health status and race............................. 5-6 5-6 Percent distribution of veterans by health status and ethnicity...................... 5-7

vii
TABLE OF CONTENTS (continued)
List of Tables (continued)
Table Page 5-7 Percent distribution of veterans by health status and gender......................... 5-7 5-8 Percent distribution of veterans by health status, gender, and age ................. 5-8 5-9 Percent distribution of veterans by activities of daily living and instrumental activities of daily living............................................................................. 5-9 5-10 Percent distribution of veterans by functional limitation and health care priority group ........................................................................................... 5-10 5-11 Percent distribution of veterans by functional limitation and age .................. 5-11 5-12 Percent distribution of veterans by functional limitation and age (under 65 and 65 or older) ......................................................................... 5-11 5-13 Percent distribution of veterans by functional limitation and race................. 5-12 5-14 Percent distribution of veterans by functional limitation and ethnicity .......... 5-13 5-15 Percent distribution of veterans by functional limitation and gender ............. 5-13 5-16 Percent distribution of veterans by health conditions and health care priority group ........................................................................................... 5-15 5-17 Percent distribution of veterans by health conditions and age....................... 5-16 5-18 Percent distribution of veterans by health conditions and age (under 65 and 65 or older) ......................................................................... 5-17 5-19 Percent distribution of veterans by health conditions and race...................... 5-18 5-20 Percent distribution of veterans by health conditions and ethnicity ............... 5-19 5-21 Percent distribution of veterans by health conditions and gender.................. 5-20 6-1 Percent distribution of veterans by type of insurance and health care priority group ........................................................................................... 6-3 6-2 Percent distribution of veterans by type of insurance and age....................... 6-4

viii
TABLE OF CONTENTS (continued)
List of Tables (continued)
Table Page 6-3 Percent distribution of veterans by type of insurance and age (under 65 and 65 or older) ......................................................................... 6-5 6-4 Percent distribution of veterans by type of insurance and race...................... 6-6 6-5 Percent distribution of veterans by type of insurance and ethnicity............... 6-7 6-6 Percent distribution of veterans by type of care and health care priority group ....................................................................................................... 6-9 6-7 Percent distribution of veterans by type of care and age............................... 6-10 6-8 Percent distribution of veterans by type of care and age (under 65 and 65 or older) ......................................................................... 6-10 6-9 Percent distribution of veterans by type of care and race.............................. 6-11 6-10 Percent distribution of veterans by type of care and ethnicity ....................... 6-12 6-11 Percent distribution of veterans by source of care and health care priority group ....................................................................................................... 6-13 6-12 Percent distribution of veterans by source of care and age ........................... 6-14 6-13 Percent distribution of veterans by source of care and age (under 65 and 65 or older) ......................................................................... 6-14 6-14 Percent distribution of veterans by source of care and race .......................... 6-15 6-15 Percent distribution of veterans by source of care and ethnicity.................... 6-16 6-16 Percent distribution of veterans by reasons veterans did not use VA health care in past 12 months ............................................................................... 6-17 6-17 Percent distribution of veterans by reasons veterans never used VA health care.......................................................................................................... 6-18 7-1 Percent distribution of veterans with self-reported disabilit ies and disability ratings ...................................................................................................... 7-2
ix
TABLE OF CONTENTS (continued)
List of Tables (continued)
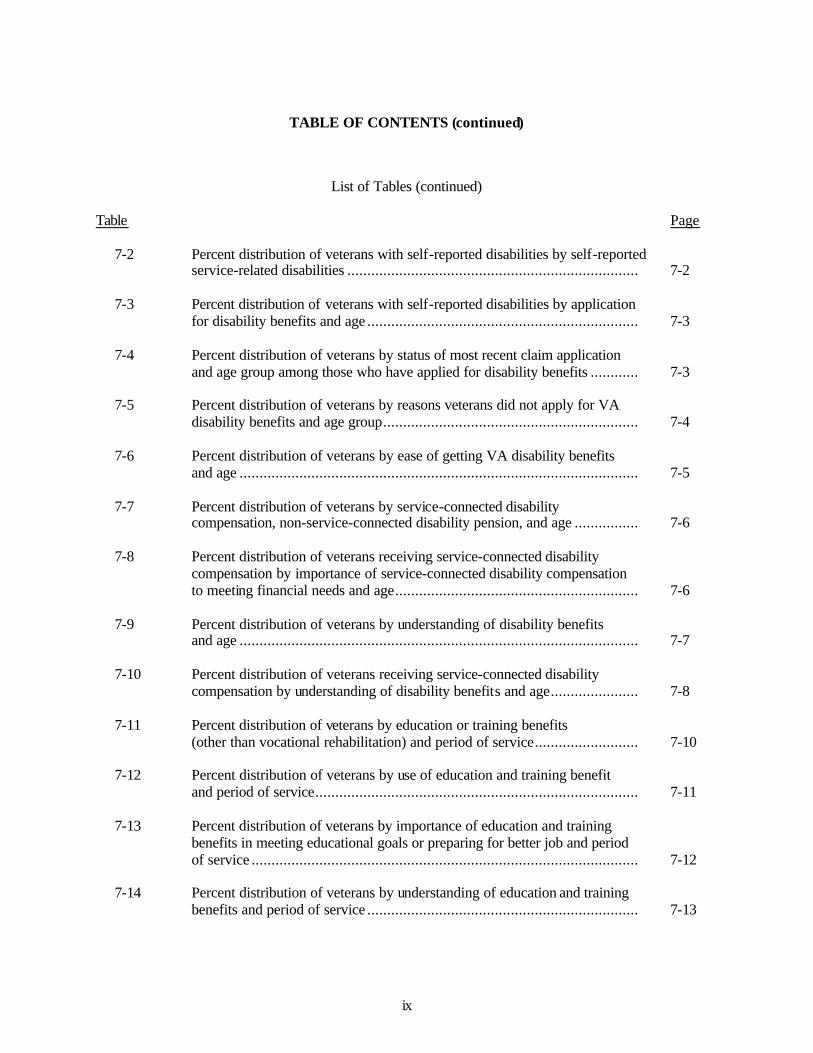
Table Page 7-2 Percent distribution of veterans with self-reported disabilities by self-reported service-related disabilities ......................................................................... 7-2 7-3 Percent distribution of veterans with self-reported disabilities by application for disability benefits and age .................................................................... 7-3 7-4 Percent distribution of veterans by status of most recent claim application and age group among those who have applied for disability benefits ............ 7-3 7-5 Percent distribution of veterans by reasons veterans did not apply for VA disability benefits and age group................................................................ 7-4 7-6 Percent distribution of veterans by ease of getting VA disability benefits and age .................................................................................................... 7-5 7-7 Percent distribution of veterans by service-connected disability compensation, non-service-connected disability pension, and age ................ 7-6 7-8 Percent distribution of veterans receiving service-connected disability compensation by importance of service-connected disability compensation to meeting financial needs and age............................................................. 7-6 7-9 Percent distribution of veterans by understanding of disability benefits and age .................................................................................................... 7-7 7-10 Percent distribution of veterans receiving service-connected disability compensation by understanding of disability benefits and age...................... 7-8 7-11 Percent distribution of veterans by education or training benefits (other than vocational rehabilitation) and period of service.......................... 7-10 7-12 Percent distribution of veterans by use of education and training benefit and period of service................................................................................. 7-11 7-13 Percent distribution of veterans by importance of education and training benefits in meeting educational goals or preparing for better job and period of service ................................................................................................. 7-12 7-14 Percent distribution of veterans by understanding of education and training benefits and period of service .................................................................... 7-13

x
TABLE OF CONTENTS (continued)
List of Tables (continued)
Table Page 7-15 Percent distribution of veterans by likelihood of using VA benefits for education or training and period of service ................................................. 7-13 7-16 Percent distribution of veterans by reasons veterans will not use VA educational or training benefits and period of service .................................. 7-14 7-17 Percent distribution of veterans by use of vocational rehabilitation services from VA and period of service .................................................................. 7-16 7-18 Percent distribution of veterans by reasons veterans have not used any VA vocational rehabilitation services and period of service................................. 7-17 7-19 Percent distribution of veterans by importance of vocational rehabilitation services in meeting educational goals or obtaining employment and period of service ................................................................................................. 7-18 7-20 Percent distribution of veterans by current living quarters and age ............... 7-19 7-21 Percent distribution of veterans by use of loans obtained through VA loan program and age ....................................................................................... 7-20 7-22 Percent distribution of veterans by reasons veterans did not use VA loan program and age ....................................................................................... 7-21 7-23 Percent distribution of veterans by life insurance from VA and period of service ..................................................................................................... 7-23 7-24 Percent distribution of veterans by life insurance from other sources and period of service....................................................................................... 7-23 7-25 Percent distribution of veterans by reasons for not having VA life insurance coverage and period of service................................................................... 7-25 7-26 Percent distribution of veterans by understanding of life insurance benefits and period of service................................................................................. 7-26 8-1 Percent distribution of veterans by veteran awareness of veteran burial benefits .................................................................................................... 8-2 8-2 Percent distribution of veterans by awareness of VA Memorial Affairs programs and gender................................................................................. 8-2

xi
TABLE OF CONTENTS (continued)
List of Tables (continued)
Table Page 8-3 Percent distribution of veterans by veteran awareness of veteran burial benefits and race....................................................................................... 8-3 8-4 Percent distribution of veterans by veteran awareness of veteran burial benefits and ethnicity ................................................................................ 8-4 8-5 Percent distribution of veterans by veteran awareness of veteran burial benefits and age........................................................................................ 8-4 8-6 Percent distribution of veterans by veteran burial plans and gender .............. 8-5 8-7 Percent distribution of veterans by veteran burial plans and race .................. 8-6 8-8 Percent distribution of veterans by veteran burial plans and ethnicity ........... 8-7 8-9 Percent distribution of veterans by veteran burial plans and age group.......... 8-7 8-10 Percent distribution of veterans by disposition of cremated remains for veterans indicating cremation as a burial plan............................................. 8-8 8-11 Percent distribution of veterans by disposition of cremated remains and age for veterans indicating cremation as a burial plan.................................. 8-8 8-12 Percent distribution of veterans by veteran plans for burial in a national or state Veterans’ Cemetery and veteran awareness of burial benefit ................ 8-9 8-13 Percent distribution of veterans by veteran plans for burial in a national or state Veterans’ Cemetery and veteran awareness of burial benefits for veterans not planning to have their cremated remains scattered.................... 8-9 8-14 Percent distribution of veterans by main reasons given for wanting burial in a national or state Veterans’ Cemetery.................................................... 8-10 8-15 Percent distribution of veterans by main reasons given for not wanting burial in a national or state Veterans’ Cemetery.......................................... 8-11 8-16 Percent distribution of veterans by veteran plans for use of a VA-provided headstone or marker and veteran awareness of burial benefit ....................... 8-12

xii
TABLE OF CONTENTS (continued)
List of Tables (continued)
Table Page 8-17 Percent distribution of veterans by veteran plans for use of a VA-provided headstone or marker and veteran awareness of burial benefits for veterans not planning to have their cremated remains scattered................................. 8-12 8-18 Percent distribution of veterans by main reasons given for not planning to use a VA-provided headstone or marker..................................................... 8-13 8-19 Percent distribution of veterans by understanding of veteran burial benefits veteran awareness of burial benefits ........................................................... 8-14 8-20 Percent distribution of veterans by ability to obtain information about veteran burial benefits and veteran awareness of burial benefits ................... 8-15 8-21 Percent distribution of veterans by ability to obtain information about veteran burial benefits and age group ......................................................... 8-16
xiii
EXECUTIVE SUMMARY
The 2001 National Survey of Veterans (NSV) is the fifth in a series of comprehensive
nationwide surveys designed to help the Department of Veterans Affairs (VA) plan its future programs
and services for veterans. The information gathered through these surveys will help VA to identify the
needs of veterans and then allocate resources in ways that will ensure these needs can be met.
The NSV is conducted under the general authorization of U.S. Code Title 38, Section 527.
This section authorizes the VA Secretary to gather data for the purposes of planning and evaluating VA
programs. Westat, under contract to VA, conducted the 2001 NSV.
Study Objectives
The NSV was conducted to obtain information VA may use in planning and allocating
resources for programs and services for veterans. It also provides a snapshot profile of the veteran
population. Data collected through the NSV enables VA to: follow changing trends in the veteran
population; compare characteristics of veterans who use VA services with those of veterans who do not;
study VA’s role in the delivery of all benefits that veterans receive; and update information about veterans
to help the Department develop its policies.
The survey collected key sociodemographic information to permit examination of responses
across subgroups. The sociodemographic variables used as crossing variables in this report include:
gender; age; race; and ethnicity (defined as Spanish, Hispanic, or Latino or not Spanish, Hispanic, or
Latino). Selected data are also examined by: health care priority group (as defined by the Veterans Health
Administration); branch of service; period of military service; and awareness of burial benefits.
Study Methodology
The 2001 National Survey of Veterans was administered to selected veterans using
computer-assisted telephone interviewing (CATI) technology. The sampling approach utilized a dual
frame methodology. The majority of cases came from houses called using random digit dialing (RDD)

xiv
methodology. Additional veterans were selected from file s of veterans who enrolled in VA health care or
who received compensation or pension from VA. This second group is referred to as the list sample.
Participation was voluntary and the information collected from each veteran is confidential.
Data collection began February 12, 2001, and ended November 12, 2001. A total of 20,048
interviews (12,956 from the RDD sample and 7,092 from the list sample) were completed. Survey data
were weighted to represent the entire non-institutionalized veteran population. Weighting incorporated the
probability of selection, survey nonresponse, and households with more than one telephone number.
Readers wishing information beyond that contained in this report may refer to the 2001 National Survey
of Veterans Design and Methodology Final Report.
Study Findings
One key issue addressed by the survey concerned communicating benefits to veterans. VA
was seen as the primary source for information about veteran benefits. Almost one-half of the veterans
were satisfied or very satisfied with their ability to get this information.
The average age of the 2000 veteran population was 58 years old, with the largest group of
veterans between the ages of 45 and 64. Female veterans, as a group, tended to be younger than male
veterans. Virtually all veterans reported only one racial category. A higher percentage of female than
male veterans classified themselves as Black, this may reflect the increased proportion of both racial
minorities and women in the armed forces in recent years. Virtually all of the veteran population reported
having been married at some point in their lives, with three-quarters saying they were currently married.
Most veterans reported having greater than a high school education; a higher proportion of female than
male veterans reported having bachelor’s degree or higher. Over one-half of the veterans reported that
they were currently working, with another one-third saying they were retired.
One-half of the veterans reported serving in the Army; this percentage increased as the age
of the veteran increased. The largest percentage of veterans reported serving in the Vietnam era, followed
by the post-Vietnam era. A higher proportion of female than male veterans served in the post-Vietnam or
Gulf War periods; these findings may also reflect increasing participation of females in the military
service.

xv
Most veterans rated their health as excellent, very good or good, with this proportion
decreasing with age. Self-assessment of health status varied by gender and race, but not by ethnicity. Only
a small proportion of veterans reported difficulty with daily living activities, with the percentage of
veterans reporting difficulties tending to increase with age. Proportionally more Black veterans than
veterans from other racial groups reported having high blood pressure, in addition, Black veterans were
the only racial group for which diabetes was among the top five health problems. American Indian or
Alaska Native’s were more likely than veterans of other races to report not receiv ing any medical
treatment. Male veterans were almost twice as likely as were female veterans to report treatment for high
blood pressure and heart trouble, while female veterans were much more likely than their male
counterparts to report suffering from severe chronic pain.
Most veterans reported having private insurance; this coverage varied by age. White veterans
were more likely than veterans from other racial groups to be covered by Medicare. Hispanic veterans
were much less likely than non-Hispanics to report Medicare coverage, and more likely not to mention
any insurance coverage. Over three-quarters of veterans reported using non-VA health care only; this
tended to decrease with age, and was lowest among Black veterans. The most common reasons cited for
not using VA health care were use of other sources for health care, followed by not needing any care and
believing they were not entitled or eligible for health care benefits. Of those veterans who never used VA
health care, more than one-fifth also reported not being aware of VA health care benefits.
Application for VA disability benefits was highest among the youngest veterans. Close to
one-half of veterans reporting a disabling condition reported applying for disability benefits. This
proportion decreased with age. The majority of these veterans said that their disability payments were
important in meeting their financial needs and that they thoroughly understood their benefits. Most
veterans using education or training benefits used them for college or university study, and about two-
thirds said these benefits were very or extremely important in helping them meet their educational or
career goals. Most veterans who owned a home reported taking advantage of the home loan guarantee
program. The most common reasons mentioned by veterans not using the program were lack of
awareness, they did not need or want loan assistance, or they did not believe they were eligible, although
perceived red tape was also cited.
Over one-half of veterans said they were aware of their entitlement to be buried in a national
or state Veterans Cemetery. Relatively few veterans, however, reported the intention to take advantage of
this. Awareness of all burial benefits was higher among older veterans. The honor associated with burial

xvi
in a national shrine was the most commonly stated reason for wanting burial in a veterans cemetery, while
wanting to be buried close to other family members was the most common reason for not wanting burial
in a national or state veterans cemetery. Close to one-half of all veterans indicated they did not thoroughly
understand their available veteran burial benefits, although a similar proportion thought it would not be
difficult to obtain information about burial benefit programs.

1-1
1. INTRODUCTION
The 2001 National Survey of Veterans (NSV) is the fifth in a series of comprehensive
nationwide surveys designed to help the Department of Veterans Affairs (VA) plan its future programs
and services for veterans. The information gathered through these surveys will help VA identify the needs
of veterans and then allocate resources in ways that ensure the needs of veterans can be met.
The NSV is conducted under the general authorization of U.S. Code Title 38, Section 527.
This section authorizes the VA Secretary to gather data for the purposes of planning and evaluating VA
programs. Westat, under contract to VA, conducted the 2001 NSV.
Data collected through the NSV enables VA to do several things:
§ Follow changing trends in the veteran population;
§ Compare characteristics of veterans who use VA services with those of veterans who do not;
§ Study VA’s role in the delivery of all benefits that veterans receive; and
§ Update information about veterans to help the Department develop its policies.
The next section of this chapter provides a brief description of the 2001 NSV instrument,
sampling, data collection, and weighting. Following this is a first glimpse at a critical set of findings
provided by the 2001 NSV: what veterans reported about their access to information about VA benefits.
The chapter concludes with an outline for the remainder of the report.
The examination of access to VA information is placed at the beginning of this report
because of the central importance to the VA mission of communication with veterans. In the strategic
planning process, VA has recognized the cross-cutting role of communications in delivering world-class
service to veterans and their families. The analyses reported here will provide insight into how veterans
might find out about the ir VA benefits and how satisfied they are with their access to information and will
provide a context for understanding and interpreting the reports of survey responses in many of the
chapters that follow.

1-2
1.1 The 2001 National Survey of Veterans
The 2001 National Survey of Veterans was conducted via telephone survey. The sampling
approach utilized a dual frame methodology. The majority of cases were contacted using random digit
dialing (RDD) methodology. This was augmented by a list sample selected from files of veterans who
enrolled in VA health care or who received compensation or pensions from VA. Participation was
voluntary and the information collected from each veteran is confidential.
Westat used computer-assisted telephone interviewing (CATI) methodology to administer
the NSV 2001. Data collection began February 12, 2001, and ended November 12, 2001. A total of
20,048 interviews (12,956 from the RDD sample and 7,092 from the list sample) were completed. The
interviewers achieved a screener response rate of 67.6 percent. The RDD sample achieved a 76.4 percent
response rate for the extended interview. The list sample had a 62.8 percent overall response rate for the
extended interview. The lower response rate for the list sample is attributable to difficulties in locating
veterans whose administrative data were no longer accurate. Results were within one percent of Vetpop
20001 estimates, before benchmarking to the Census 2000 Supplementary Survey (C2SS)2. Data
collection also reached the completion targets overall and for the RDD and list samples.
NSV 2001 Target Population
The NSV 2001 target population includes veterans living in private households in the US
and Puerto Rico. Thus, institutionalized veterans, homeless veterans, and veterans living outside the US
and Puerto Rico are not covered in the survey. The reference period for the NSV 2001 is the year 20003.
The under-coverage in the survey due to non-telephone households and the households with unlisted
numbers belonging to “zero-listed telephone banks” was corrected with a raking procedure that used
1 The VetPop 2000 is a veteran population projection model developed by the Office of the Actuary, Department of Veterans Affairs. It is the
official VA estimate and projection of the number and characteristics of veterans as of September 30, 2000. Details of all aspects of the development and content of the model are available from the Office of the Actuary, Department of Veterans Affairs, 810 Vermont Avenue NW, Washington DC 20420.
2 The Census 2000 Supplementary Survey (C2SS) was a Decennial Census program designed to demonstrate the feasibility of collecting long form type information at the same time as, but separate from, the Decennial Census. Data collection ran January 2000 through December 2000. The C2SS provided an early look at the detailed characteristics of the U.S. population in 2000 to include demographic, social, economic, and housing data from a national sample of 700,000 households in 1,203 counties. Group quarters were not included in the sample.
3 The data collection field period for the survey was February through November 2001. Nearly all of the survey items that address use or nonuse of VA Health Care Services use a reference period of "during the past 12 months," Individual and household income questions are for the year 2000.

1-3
veteran population estimates from the C2SS. The control total of veteran population for the raking
procedure was 25,196,036 veterans, which included the Puerto Rico veteran population. Although the
C2SS did not include Puerto Rico, the raking procedure used the control totals that included Puerto Rico
veteran population. The marginal totals for the Puerto Rico veteran population were estimated from 1990
Census counts using a model.
The current VA population model, VetPop2001, is based on several data sources, including
administrative data from VA, DOD, and the Social Security Administration, and uses 1990 Census data
as part of its baseline, since it was developed before the release of data from the 2000 Census. The
universe is all veterans, including those in group-quarters, those residing in U.S. Island Territories and
foreign countries, and veterans of the uniformed Public Health Service and National Oceanic and
Atmospheric Administration. The VetPop2001 estimate of the number of veterans for the U.S. and Puerto
Rico as of September 30, 2000, with adjustments based on the Census 2000 data on veterans by state, is
25.5 million.
Survey data were weighted to represent the entire veteran population residing in private
households in the U.S. and Puerto Rico. Weighting incorporated the probability of selection, survey non-
response, and households with more than one telephone number. Chapter 2 and Appendices B and C of
this report contain a more detailed discussion of sampling and weighting procedures. Readers interested
in additional information about sampling and weighting procedures may refer to the 2001 National Survey
of Veterans Design and Methodology Final Report.
VA Administrative and Survey Data Comparisons
NSV estimates differ from VA administrative data because of 1) differences in time frame,
2) survey errors, and 3) administrative data system errors. The time frame differences are due to NSV
interviews being spread out over several months, February 12, 2001 through November 12, 2001, and
each interview having its own time frame—12 months prior to the date of the interview. Administrative
data, on the other hand, are available for given fiscal years or at one point in time including at the end of
the fiscal year. Survey error can be from veterans failing to recall all relevant events in the 12-month
period or reporting events that occurred more than 12 months before the date of the interview.
Administrative data system error can occur because of duplication or omission of records.

1-4
Two examples of differences between estimates and administrative records are:
§ The VA outpatient care estimate from NSV 2001 is 4.0 million outpatients. VA
administrative numbers were below the survey estimate—3.6 for FY 2000 and 3.7 million from for FY 2001. And
§ The VA hospital care estimate from NSV 2001 is 555,000 patients. VA administrative counts were below the survey estimate—353,000 for FY2000 and 361,000 for FY2001.
The NSV 2001 also provided a second higher estimate of VA provided health care—5.2
million total VA health care unique counts. This second survey-based estimate was developed by
including a special additional set of health care questions not asked on past national veterans surveys
along with the VA inpatient and outpatient estimates. These questions asked the surveyed veterans about
emergency room care, prescription medications, environmental hazards, psychological counseling, in-
home health care and prosthetics care. Veterans, who had answered no to other questions on inpatient stay
or outpatient visits, sometimes responded yes to these questions and indicated the care was received at
VA or paid for by VA. Clearly some veterans did not think of these kinds of medical care without
prompting. Also, VA inpatient and outpatient administrative records do not include counts of all veterans
receiving these kinds of care.
Particularly noteworthy from the survey estimates are the: 1) estimated 273,000 VA (or VA
paid) emergency room visits not included in the VA inpatient/outpatient counts, and 2) estimated 500,000
prescription medications without VA patient visits (The VA administrative pharmacy file does not show
high enough fiscal year usage to explain these extra prescriptions estimated by the survey).
It is possible that the priority 7 veterans enrolling in VA health care (the number increased
by 44 percent from FY2000 to FY2001) are either reporting intended use of the VA health care system or
some usage is not being recorded by the VA administrative system. Also, differing time frames of VA
administrative data and survey estimates could again explain some of the discrepancy.
VA administrative data show that 2.3 million veterans living in the United States or Puerto
Rico received compensation payments in September 2000 and September 2001. The NSV 2001 estimates
2.6 million veterans received compensation payments over the survey interview period. It is possible that
some of the veterans interviewed do not distinguish between military disability payments and VA
compensation payments. Some veterans (an estimated 60,000) also reported receiving pension and

1-5
compensation payments when, in fact, veterans who have service-connected disabilities and non service-
connected disabilities that qualify for pension must choose only one type of payment.
The NSV 2001 estimates 248,000 veterans were currently (2001) receiving non-service-
connected disability pensions. The September 2001 VA administrative file shows a count of 346,000
veterans receiving a pension. VA administrative data for the end of FY 2000 show 362,149 veterans
receiving pension payments.
One reason that the survey estimate may be lower is because interviewers only asked
veterans who regarded themselves as having a disabling condition if they were currently (2001) receiving
non-service-connected disability pensions. Based on other survey questions interviewers asked of all
veterans on sources of 2000 family income, not all veterans receiving a VA pension consider themselves
to have a disabling condition. In fact, if you base your estimate on sources of family income in the year
2000 reported in the survey, 413,000 veterans were receiving a VA non-service-connected disability
pension. This second estimate is higher than the VA administrative records.
Estimates from the NSV 2001 should not be presented as official VA counts. But they are
useful in distinguishing users and nonusers of VA programs and can be used to highlight possible
problems with VA administrative record databases. It is tempting to view administrative records as true
numbers, but it is important to remember that large and complicated administrative file systems can be
subject to errors of duplication and omission.
Survey Data and Reporting Formats
Survey data displayed in each table of this report were evaluated for small sample sizes and
precision. Data in any cell where the sample size for the denominator was less than 30 were replaced with
the symbol “NR” for “Not Reported,” and this footnote appears at the bottom of these tables: “NR:
Sample size for the denominator less than 30.” In any cell where the sample size for the denominator was
between 30 and 59 inclusive or the relative standard error was greater than 30 percent, an asterisk was
appended to the percent estimate and this footnote appears at the bottom of the table: “* Low precision
and/or sample size for the denominator between 30 and 59.”

1-6
Estimates for the number of veterans for each item or category are rounded to the nearest
hundred. Percent estimates have been reported with one decimal and rounded to add to 100 percent using
a controlled rounding algorithm. The controlled rounding procedure rounds the first digit after the
decimal upward for the percentages with the largest second digits after the decimal in such a way that the
percentages add up to 100 percent.
1.2 Veteran Access to Information About VA Benefits
Access to benefit information (and knowledge that the information exists) is crucial for
veterans to be able to use those benefits. As shown through repeated mentions in VA’s 2001-2006
Strategic Plan, communication is a key element in VA’s core values:
We are committed to open, accurate, and timely communication with veterans, employees, and external stakeholders. We are committed to improved access for veterans and their families through facility location and design, and innovative uses of information technology.
VA’s enabling goal is to “create an environment that fosters the delivery of One VA world-
class service to veterans and their families through effective communication and management of people,
technology, business processes, and financial resources.” (Emphasis added.) One of the core sections of
the 2001 NSV dealt with access to information about veteran benefits.
Respondents were first asked where they would go to access information about VA benefits.
Respondents offered sources in their own words, and were encouraged to report up to six sources.
Interviewers did not suggest any sources, but used the list of sources shown in Table 1-1 to record
responses.
Two thirds (66.7 percent) of veterans reported that they would go to VA itself if they needed
information about their VA benefits. About 12 percent of veterans said that they would use the VA toll
free number and a similar proportion said they would use the VA web site. Less than 1 percent of veterans

1-7
Table 1-1. Percent distribution of veterans by sources of information about VA benefits
Total The Department of Veterans Affairs (VA) 66.6 VA: Toll-free telephone number 12.4 VA web site 12.2 Other Internet or web site 5.0 Veterans Service Organization (VFW, American Legion) 13.8 VA Benefits Booklet (Federal Benefits for Veterans and Dependents) 0.9 Social Security office 0.7 Another government agency 10.0 Senior citizens group (AARP) 0.2 Health advocacy group (MS Society; American Association for the Blind; Easter Seals;
March of Dimes) 0.4
Doctor or doctor’s office 0.7 Employer or former employer 0.2 Another veteran 1.7 Family or friends 2.1 Newspaper or magazine 0.7 TV or radio 0.1* Some other person or place 5.3 Nowhere 3.9 Number of veterans† 25,196,000
*Low precision and/or sample size for the denominator between 30 and 59.
† Estimate of number of veterans is rounded to the nearest hundred; percent estimates will not sum to 100 because veterans could indicate more than one source of information about benefits.
reported that they would use the VA benefits booklet4. These responses suggest that veterans prefer to get
their information directly from VA rather than from other agencies and that contact be personal or web-
based rather than written. It may also be the case that veterans had the VA benefits booklet in mind when
providing the general response ‘VA’, or that many veterans do not know about the booklet.
After a question about knowledge of VA benefits, the questionnaire asked veterans’
satisfaction with benefits information. Table 1-2 presents veterans’ responses to this item.
4 The VA benefits booklet is a common reference for the pamphlet entitled, Federal Benefits for Veterans and Dependents, published by the
Department of Veterans Affairs, Office of Public Affairs.

1-8
Table 1-2. Percent distribution of veterans by satisfaction with ability to get information about VA benefits
Total
Very satisfied 15.4 Somewhat satisfied 30.4 Neither satisfied nor dissatisfied 24.9 Somewhat dissatisfied 13.6 Very dissatisfied 9.2 Don’t need to know anything 2.0 Unknown 4.5 Total 100.0
Number of veterans† 25,196,000
† Estimate of number of veterans is rounded to the nearest hundred.
About 46 percent of veterans said that they were satisfied with their ability to get the
information they need about veterans’ benefits. A sizeable percentage, however, said they were
dissatisfied or very dissatisfied with their access to information (22.8 percent combined). This suggests
that for many veterans, access to information about veterans’ benefits may be a barrier to awareness and
understanding of the benefits and services available to them.
The next question asked whether veterans needed any information about their veterans’
benefits in the past year. As shown in Table 1-3, slightly more than 20 percent of veterans reported that
they needed information about their veterans’ benefits in the past year.
Table 1-3. Percent distribution of veterans by need for information about VA benefits in the past year Total
Yes 21.5 No 77.9 Unknown 0.6 Total 100.0
Number of veterans† 25,196,000
† Estimate of number of veterans is rounded to the nearest hundred.
1-9
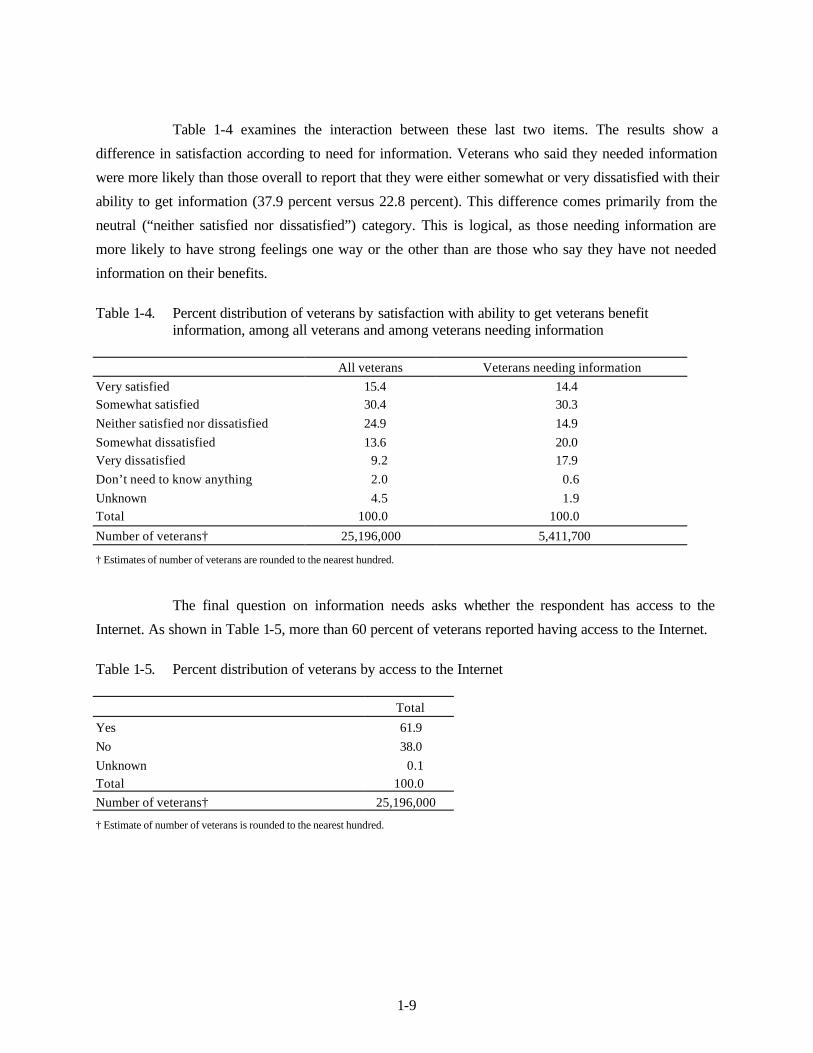
Table 1-4 examines the interaction between these last two items. The results show a
difference in satisfaction according to need for information. Veterans who said they needed information
were more likely than those overall to report that they were either somewhat or very dissatisfied with their
ability to get information (37.9 percent versus 22.8 percent). This difference comes primarily from the
neutral (“neither satisfied nor dissatisfied”) category. This is logical, as those needing information are
more likely to have strong feelings one way or the other than are those who say they have not needed
information on their benefits.
Table 1-4. Percent distribution of veterans by satisfaction with ability to get veterans benefit
information, among all veterans and among veterans needing information
All veterans Veterans needing information Very satisfied 15.4 14.4 Somewhat satisfied 30.4 30.3 Neither satisfied nor dissatisfied 24.9 14.9 Somewhat dissatisfied 13.6 20.0 Very dissatisfied 9.2 17.9 Don’t need to know anything 2.0 0.6 Unknown 4.5 1.9 Total 100.0 100.0
Number of veterans† 25,196,000 5,411,700
† Estimates of number of veterans are rounded to the nearest hundred.
The final question on information needs asks whether the respondent has access to the
Internet. As shown in Table 1-5, more than 60 percent of veterans reported having access to the Internet.
Table 1-5. Percent distribution of veterans by access to the Internet Total
Yes 61.9 No 38.0 Unknown 0.1 Total 100.0 Number of veterans† 25,196,000
† Estimate of number of veterans is rounded to the nearest hundred.

1-10
In summary, VA was seen as the primary source for information about veterans’ benefits.
Almost one-half of veterans said they were satisfied with their ability to get this information, with a
quarter reporting being neither satisfied nor dissatisfied. When focused on veterans who reported actually
needing information in the past year, dissatisfaction with their ability to get information went up
markedly. Finally, most, but not an overwhelming percentage, of veterans report having Internet access.
These results suggest that VA should continue its efforts to facilitate communication with veterans via the
Internet. The VA web site, while important, is still evolving as a resource for veterans.
1.3 Organization of the Report
The remainder of this report provides analysis on a number of topics and content areas of
interest to VA, in addition to several appendices. The content of each of these sections is as follow:
§ Chapter 2 describes the study protocol, including basic information on study design
and data collection.
§ Chapter 3 provides a descriptive profile of the 2001 veteran population.
§ Chapter 4 describes veterans’ military service experience.
§ Chapter 5 discusses the health status of veterans including medical conditions and limiting disabilities.
§ Chapter 6 presents data on the types of medical care veterans received over the last year, where that care was obtained, and how the cost of the care was paid.
§ Chapter 7 describes veterans’ knowledge and use of Veterans Benefits Administration Programs including compensation and pension programs, educational programs, vocational rehabilitation and employment programs, the Home Loan Guaranty Program, and the VA life insurance programs.
§ Chapter 8 provides information on veterans’ knowledge and use of the Veteran Burial Benefits.
§ The appendices to the report contain the survey instrument and detailed information on the sampling and weighting methodology.

2-1
2. STUDY METHODOLOGY
This chapter presents a summary of the 2001 National Survey of Veterans (NSV 2001) study
methodology. The chapter begins with a recounting of steps taken and issues addressed during
development of the NSV 2001 survey instrument. Following this section on questionnaire development,
survey sample design, survey administration, and survey yields are briefly reviewed.
2.1 Questionnaire Development
The NSV 2001 was designed to collect information to help the U.S. Department of Veterans
Affairs (VA) respond to many of its policy, planning, and budgetary challenges. Many of these challenges
were included in questionnaire design considerations from the start of this project. To further ensure that
the NSV 2001 would be useful to a large, diverse group of stakeholders, the 1992 NSV instrument and
results of the 1992 National Survey of Veterans Utilization Study5 were reviewed before formally
beginning questionnaire construction. In the last phase of development results of the Utilization Study
were integrated into the existing design of the proposed NSV 2001 instrument and sampling
methodology.
The 1992 National Survey of Veterans Utilization Study, conducted in 1999, was designed
to identify the uses to which stakeholders, both inside and outside VA, utilized previous NSV results and
allow them to articulate their anticipated information needs from a future NSV. For the study, a total of 51
interviews were conducted among a diverse group of stakeholders. One major finding of the study was
that while the 1992 survey included many important and useful questions, the 1992 instrument did
contain serious gaps and did not provide some information important to VA planners. Nonetheless,
despite shortcomings, the general pattern of interview responses revealed that current users of the
information would likely continue to use the results provided by a new NSV.
Both internal and external VA stakeholders requested more detailed information on service
patterns for special subpopulations to ensure fairness of service delivery and to meet special needs. For
example, stakeholders wanted more information on minority, female, and homeless veterans, as well as
other special subpopulations, such as veterans exposed to Agent Orange in Vietnam or veterans who 5 See 1992 National Survey of Veterans Utilization Study (Westat, 1999), for more detailed information about study methodology and results.
2-2
served in the Gulf War. Another primary finding was strong support for a survey effort to collect data that
would allow analysts to distinguish between those veterans who do and do not currently use VA
programs. Many of the stakeholders interviewed noted an increased need for information that could be
used to plan, manage, and evaluate programs. Although many of the organizations have their own survey
efforts focused on their program offerings, all VA organizations indicated a desire for information on
veterans who do not use VA programs as a part of their overall planning, policy, and evaluation efforts.
Based on the 1992 NSV Utilization Study, several structural and content changes were made
to the survey instrument to address VA’s needs and to increase the usability of the next NSV. As in
previous administrations, the final NSV 2001 instrument collected information about each veteran’s
military background and sociodemographic characteristics. The survey also asked about veterans’
perception of need and recent use of six benefit areas:
n Health Care;
n Disability;
n Mortgage Loan;
n Life Insurance;
n Education and Training; and
n Burial Benefits.
Additional survey topics collected data on other sources of assistance veterans used, access
and barriers to use of the service, veterans’ unmet needs, future plans to use benefit programs, and how
veterans prefer to receive information about the service. Finally, the NSV 2001 included a separate
module about veterans’ recent need for VA information, preferred media, and access to and use of the
Internet.
The survey design phase, which began in September of 2000, also resulted in the adoption of
several key survey design features:
n Use of telephone interviewing as the data collection mode;
n Use of CATI technology for questionnaire administration; and
n Use of a dual frame sample design that augmented a random digit dialing (RDD) sample with a VA List Sample.

2-3
2.2 Sample Design
The NSV 2001 target population includes veterans living in private households in the U.S.
and Puerto Rico. Thus, institutionalized veterans, homeless veterans, and veterans living outside the U.S.
and Puerto Rico are not covered in the survey. Additionally, the survey was also required to provide
information on veteran population subgroups of particular interest. These subgroups included: the veteran
population classified according to the mandatory health care enrollment group (groups 1 through 6)
criteria 6, female veterans, African American veterans, and Hispanic veterans. The precision required for
survey estimates for the total population and each of the subgroups of interest was a 95 percent
confidence interval of +/- 5 percent or less.
Sample design decisions were largely driven by the requirement for precise survey estimates
for each of the mandatory and one discretionary health care enrollment groups. A dual frame design was
adopted as a method for meeting these requirements. Some enrollment groups could be relatively easily
located in the general adult population. For these groups, use of an RDD sample frame was an efficient
approach. Other enrollment groups could be more efficiently contacted using a list frame where the list
was constructed from the VHA Healthcare enrollment file and the VBA Compensation and Pension
(C&P) file. The major design issue was determining the relative sample allocations from the RDD and list
frames. Appendix B details the issues associated with sample allocation.
To meet the variety of sample objectives and precision requirements, a dual frame sampling
plan was developed that called for the completion of 13,000 veteran interviews from randomly selected
households (the RDD Sample). This was augmented by 7,000 veteran interviews completed from a List
Sample selected from two VA administrative files. By completing 20,000 veteran interviews from these
two samples, NSV 2001 provides national estimates for veterans overall and for important subgroups.
2.3 Survey Administration
Survey administration includes the conduct of the survey pretest, interviewer training and
quality control, and the actual survey data collection.
6 The NSV 2001 actually provides data on the population of enrollees plus potential enrollees classified by enrollment group criteria. Since the
question, "Are you enrolled in VA healthcare" was not asked on the NSV 2001 we cannot distinguish between responses of healthcare enrollees or non-enrollees.
2-4
NSV Pretest
Prior to initiating survey administration, an extensive survey pretest was conducted. This
was done to thoroughly test all survey components. The NSV 2001 pretest was conducted between
February 12, 2001 and March 4, 2001. At that time, the List Sample contact procedures were still in
development, so the pretest was administered using only RDD sample cases. During the pretest,
interviewers called 21,609 telephone numbers and completed a total of 519 interviews with veterans. This
three-week period allowed evaluation of every facet of survey administration.
Information gained from the pretest was used to evaluate:
n Questionnaire design, content, wording, and structure;
n Length of interview administration;
n The functioning of the computerized CATI questionnaire and CATI case management and call scheduling software;
n Interviewer training; and
n The interviewing process itself.
The pretest revealed that the CATI instrument/program worked as intended (e.g., questions
were presented as intended and skip patterns were followed). Additionally, no problems were found with
the CATI system’s call scheduling, case management, or data storage functions. However, the pretest did
yield useful changes. First, modifications were made to initial sample yield assumptions to reflect actual
completion rates realized during the pretest. It was also learned from the pretest that the average length of
the interview was over the target administrative length of 30 minutes. Finally, interviewer training
curriculum was changed to increase focus on one area that presented difficulties for interviewers and
respondents during the pretest – correctly identifying current household members. An additional benefit
of the pretest was that it afforded VA an excellent opportunity to observe the methodologies and
procedures planned for the main data collection phase.

2-5
Interviewer Training and Quality Control
Interviewer recruitment began in January of 2001 and continued as the data collection
requirements for NSV increased. Project-specific training for the NSV 2001 began on February 10, 2001
with an initial group of 31 interviewers. In the 5 months following the first training session, another 267
interviewers were trained in ten separate sessions, bringing the total number of NSV 2001 interviewers
trained to 298. After production was underway, additional training sessions were conducted on special
topics, such as:
n Proxy interviewing;
n Refusal conversion;
n Tracing calls; and
n Language problem cases.
Interviewers selected to participate in these special sessions were observed by supervisors to possess
skills relevant for the operation for which they were trained.
During data collection, the primary method of ensuring that interviewers continued to
accurately administer the NSV 2001 questionnaire was through interviewer monitoring. Project staff and
telephone center supervisors monitored an average of 8 percent of all NSV 2001 interviews.
Data Collection
The NSV 2001 survey administration was a complex undertaking. Incorporated into the
survey task were screening requirements designed to establish respondent eligibility followed by a
questionnaire that contained skip patterns and required the performance of range, logic, and consistency
checks during the course of survey administration. To facilitate data collection, the NSV 2001 survey was
administered using a computer-assisted telephone interviewing (CATI) system. The CATI system
automated all operations thereby allowing interviewers to concentrate upon only the questions to be asked
and the coding of responses provided by the veteran. The selection of questions to be asked, given skip
patterns, their order, and the performance of range, logic, and consistency checks were all performed by
CATI in the background.
2-6
The CATI system also managed the scheduling of calls to members of the NSV sample.
Initial contact with a sample member was managed using the method of “time slicing.” This method
scheduled initial calls in a rotation including daytime, evening, weekday, and weekend contact attempts to
maximize the probability of contact. Once contact was established with a sample member, the CATI
system kept track of the member’s status (whether eligible or ineligible for the survey) and scheduled
call-backs at appointed times, if necessary, to complete the interviewing process.
To increase response rates, several special data collection operations were implemented. All
List Sample veterans were sent an advance letter to inform them of their selection to participate in the
survey. This letter explained the survey’s purpose, urged veterans to cooperate and complete a survey,
and established the survey as a valid project of the U.S. Department of Veterans Affairs. Veterans were
also provided a toll-free number they could call to voice any questions or concerns they might have. Other
mail operations included the mailing of a background letter to RDD Sample cases requesting a written
explanation of the survey before proceeding. Additionally, a proportion of veterans initially refusing to
participate in the survey were sent letters (where valid addresses were available) requesting their
cooperation in the survey effort.
The NSV 2001 data collection period extended from February 12, 2001 through November
12, 2001. Nearly 300 interviewers participated in the data collection phase, which resulted in 20,048
completed interviews (12,956 from the RDD Sample and 7,092 from the List Sample). The average
interview time for RDD Sample veterans was 33.3 minutes, while List Sample veterans took an average
of 38.7 minutes per completed interview. It was expected that List Sample veterans would take longer to
complete the interview because they generally have more medical conditions and medical treatment
experiences to report. List Sample veterans were also more likely to have a service-connected disability
that required them to complete an additional survey module about that disability.
2.4 Survey Yields
The NSV 2001 had a total sample target of 20,000 completed interviews. Of this total,
13,000 were expected to come from the household screening of RDD telephone numbers and 7,000 from
the List Sample. At the completion of survey administration, NSV 2001 realized 100.2 percent of the

2-7
overall target by completing 12,956 interviews from the RDD Sample (99.7 percent of goal) and 7,092
interviews from the List Sample (101.3 percent of goal).
As part of the NSV 2001 sample design, interview completion targets were also set by
sample stratum for both the List and RDD Samples. The main objective of the List Sample stratification
was to augment the sample for the veteran population classified according to the mandatory health care
enrollment priority group (groups 1 through 6) criteria and for female veterans. List Sample interview
targets were also set for Hispanic and African American veterans. Both List and RDD Sample size targets
were set in line with the distribution of the veteran population (by subgroup) provided by VA. Table 2-1
(List Sample) and Table 2-2 (RDD Sample) compare the target and achieved List Sample completed
interviews by priority groups
Table 2-1. Target versus achieved List Sample completed interviews by priority group
Priority Target Achieved Percent of target
1 1,239 1,410 113.8 2 1,200 1,354 112.8 3 1,636 1,758 107.5 4 931 549 59.0 5 1,231 1,179 95.8 6 763 842 110.4
Total list 7,000 7,092 101.3
Table 2-2. Target versus achieved RDD Sample completed interviews by priority group (Observed)
Observed Priority Target Achieved Percent of target
1 295 371 125.8 2 271 300 110.7 3 661 741 112.1 4 69 12 17.4 5 3,731 2,636 70.7 6 36 1,479 4,108.3 7 7,937 7,417 93.4
Total RDD 13,000 12,956 99.7
2-8
List Sample
Targets were exceeded for four of the six priority groups. The two groups falling short were
priority group 5 (96 percent of target), and priority group 4 (59 percent of target). A review of survey
yields reveals that the original expectations for this group underestimated the proportion of priority group
4 veterans that would be ineligible due to institutionalization or death. The proportion ineligible among
the priority group 4 veterans was 30.9 percent, whereas fewer than 5 percent of veterans in priority groups
2, 3 and 6 were ineligible, and just over 7 percent of priority groups 1 and 5 veterans were ineligible.
RDD Sample
For the RDD Sample, a target of 662 completed female veteran interviews was set and 699
interviews were completed (105.6 percent of target). The targets for African American and Hispanic
veterans were 1,066 and 520 interviews, respectively. A total of 983 interviews were completed with
African American veterans (92.2 percent of target), and 558 interviews with Hispanic veterans (107.3
percent of the target).
Table 2-2 shows that, although we met the overall target for the RDD Sample, the individual
priority groups varied considerably. According to the veteran population distribution used for the NSV
2001 sample design, the two smallest priority groups were groups 4 and 6. However, the number of
veterans in priority group 4 turned out to be only a fraction (14.5 percent) of what we projected from our
assumed distribution. Conversely, the number of veterans belonging to priority group 6 was almost 40
times greater than expected given the population distribution provided by VA. This is partially due to the
fact that the absolute numbers for the RDD targets for priority groups 4 and 6 were also very low, which
led to large percentage differences. Also, for Priority 6 the definition for the target population was slightly
different than what was used to count the achieved number. Data used to estimate the target population
was only available for veterans using VA facilities solely for treatment of environmental exposures,
whereas the observed population considered anyone stating they had been exposed to environmental
hazards regardless of treatment. The RDD Sample completed interviews for priority group 5 also fell
significantly short, at just over 60 percent of the target.

3-1
3. THE VETERAN POPULATION
Approximately 25.2 million veterans of the U.S. uniformed services were living in the
United States and Puerto Rico at the end of 2000. Although veterans comprise a richly diverse group,
most veterans are White, non-Hispanic, married males. Overall the average age of a veteran is 58 years
old, with the largest group of veterans between the ages of 45 and 64. Most veterans are currently
employed, have a combined family income of more than $50,000, and have completed high school.
The NSV 2001 surveyed individuals who served their full obligation of active duty in the
military, or received early discharge for a medical condition, reduction in force, hardship, or at the
convenience of the military. Active duty military service members and dishonorably discharged veterans
were excluded from the survey.
This chapter summarizes demographic information about veterans. In addition, it describes
historical changes in the veteran population. Characteristics detailed in this chapter include gender, age,
race, ethnicity, marital status, education, and employment status. Because men and women veterans differ
substantially on some of these demographic characteristics, comparisons are made by gender.
3.1 Gender
Female veteran demographic characteristics are quite different from those of their male
counterparts. For example, female veterans tend to be younger, have a higher education level, and include
a greater percentage of minorities. One plausible explanation for these gender differences is the increased
number of women in armed forces since the cessation of the draft. Although, the majority of veterans are
male, almost 6 percent of veterans are female. That is increase of 2 percent from the 1992 figures where
females made up 4 percent of the veteran population. Given these gender differences, descriptions of
veteran demographic characteristics in the remaining sections include gender comparisons.

3-2
3.2 Age
Respondents were asked to give their birthdate. Age was then calculated from this
information. The average age of all veterans was 58 years. More specifically, 21.1 percent of the veteran
population was under the age of 45, 41.2 percent were between the ages of 45 and 64, and 37.1 percent of
the population was 65 years or older. These findings reflect the continuing trend of the aging veteran
population. In comparison to the 1992 veteran population, the percentages of veterans in the youngest age
cohort decreased (21 percent vs. 32 percent), the age percentage of the oldest age cohort increased (38
percent vs. 26 percent), and the middle cohort remained virtually unchanged (42 percent vs. 41 percent).
Gender comparisons shown in Table 3-1 indicate that almost 4 in 5 male veterans are 45
years and older. This percentage of male veterans over 45 reflects their participation in the major wars of
the last century. In contrast, female veterans tend to be younger. More than half of female veterans are
under the age of 45. This gender difference between male and female veterans is due in part because
females did not enter into the armed forces in great numbers until 1975. However, there is also a smaller
peak in the female veteran age distribution at the older ages, reflecting their participation in WWII.
Approximately 12 percent of female veterans are 75 years or older.
Table 3-1. Percent distribution of veterans by age and gender
Total Males Females Less than 25 years 1.1 0.8 4.7 25-29 years 2.7 2.4 7.9 30-34 years 5.3 4.9 12.6 35-39 years 5.3 4.8 13.6 40-44 years 6.7 6.1 16.4 45-49 years 8.1 7.8 13.6 50-54 years 13.4 13.8 6.5 55-59 years 11.1 11.5 3.8 60-64 years 8.6 8.9 2.8 65-69 years 10.1 10.6 2.4 70-74 years 10.7 11.2 3.4 75-79 years 9.5 9.7 6.4 80 years or older 6.8 6.9 5.5 Unknown 0.6 0.6 0.4* Total 100.0 100.0 100.0 Number of veterans† 25,196,000 23,712,400 1,483,600
* Low precision and/or sample size for the denominator between 30 and 59.
† Estimates of number of veterans are rounded to the nearest hundred.

3-3
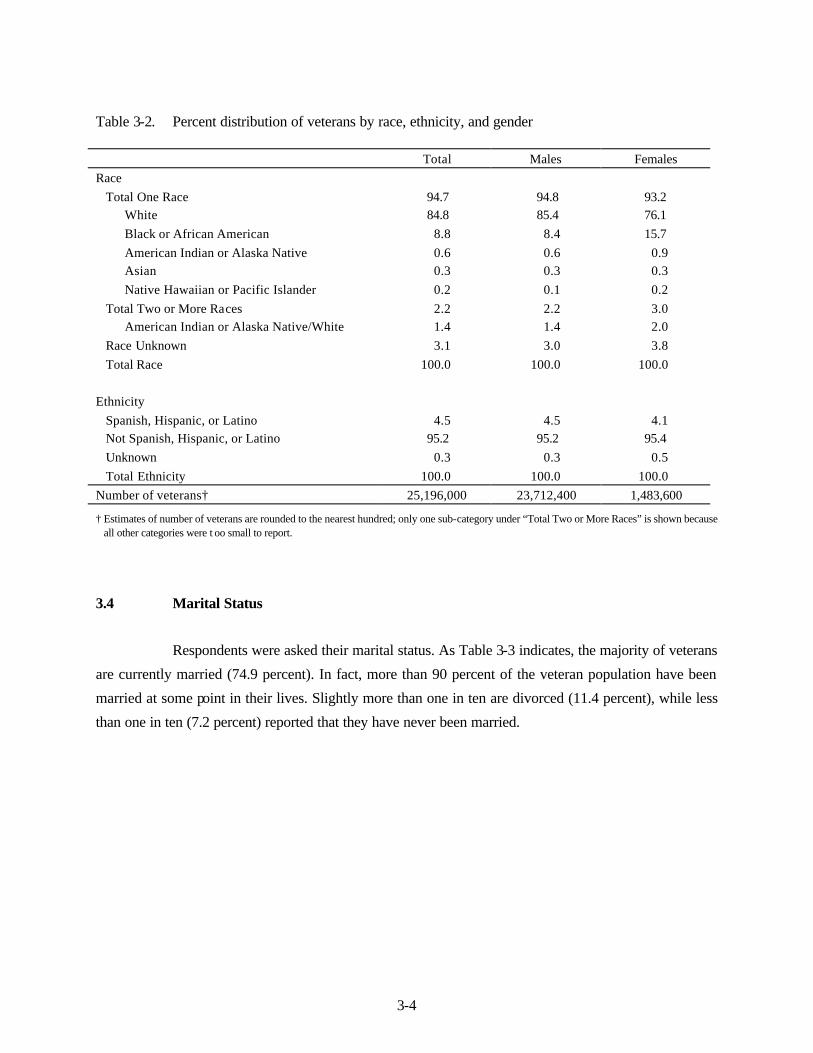
3.3 Race and Ethnicity
The majority of veterans surveyed reported only one racial group with the highest proportion
classifying themselves as White (84.8 percent). About 9 percent identified themselves as Black, while
American Indian,7 Asian, and Native Hawaiian8 each comprise less than one percent. Of the 2.2 percent
veterans who reported two or more races, the largest percentage classified themselves as American Indian
or Alaska Native/White (Biracial American Indian-White).
Similar to results found in the 1992 National Survey of Veterans, Whites and Blacks
accounted for 93.6 percent of today’s veteran population. Overall, the number of minorities serving in the
Armed Forces is increasing, leading to a more socially and ethnically diverse military. This trend is
reflected in the veteran population as well. This increase in the minority veteran population may have
significant ramifications, especially in terms of health care needs, programs, and possible benefits.
Similar to the gender differences in veterans’ ages, men and women veterans also differ in
race and ethnicity. About 9 percent of male veterans classified themselves in a minority racial group (any
racial group other than White), in contrast to 17.1 percent of female veterans. This differential was
primarily between male and female veterans who classified themselves as Black (8.4 percent vs. 15.7
percent, respectively). About equal proportions of male and female veterans were self-identified as
Hispanic (4.5 percent and 4.1 percent, respectively).
In order to determine race and ethnicity, respondents first were asked whether they were
Spanish, Hispanic, or Latino. Next, they were read a list of racial categories and asked to select one or
more to describe their race. These categories, and the percent of veterans selecting them, are displayed in
Table 3-2.
7 This includes American Indian and Alaskan native. 8 This includes native Hawaiian and Pacific Islander.
3-4
Table 3-2. Percent distribution of veterans by race, ethnicity, and gender
Total Males Females Race
Total One Race 94.7 94.8 93.2 White 84.8 85.4 76.1 Black or African American 8.8 8.4 15.7 American Indian or Alaska Native 0.6 0.6 0.9 Asian 0.3 0.3 0.3 Native Hawaiian or Pacific Islander 0.2 0.1 0.2
Total Two or More Races 2.2 2.2 3.0 American Indian or Alaska Native/White 1.4 1.4 2.0
Race Unknown 3.1 3.0 3.8 Total Race 100.0 100.0 100.0
Ethnicity Spanish, Hispanic, or Latino 4.5 4.5 4.1 Not Spanish, Hispanic, or Latino 95.2 95.2 95.4 Unknown 0.3 0.3 0.5 Total Ethnicity 100.0 100.0 100.0
Number of veterans† 25,196,000 23,712,400 1,483,600
† Estimates of number of veterans are rounded to the nearest hundred; only one sub-category under “Total Two or More Races” is shown because all other categories were t oo small to report.
3.4 Marital Status
Respondents were asked their marital status. As Table 3-3 indicates, the majority of veterans
are currently married (74.9 percent). In fact, more than 90 percent of the veteran population have been
married at some point in their lives. Slightly more than one in ten are divorced (11.4 percent), while less
than one in ten (7.2 percent) reported that they have never been married.
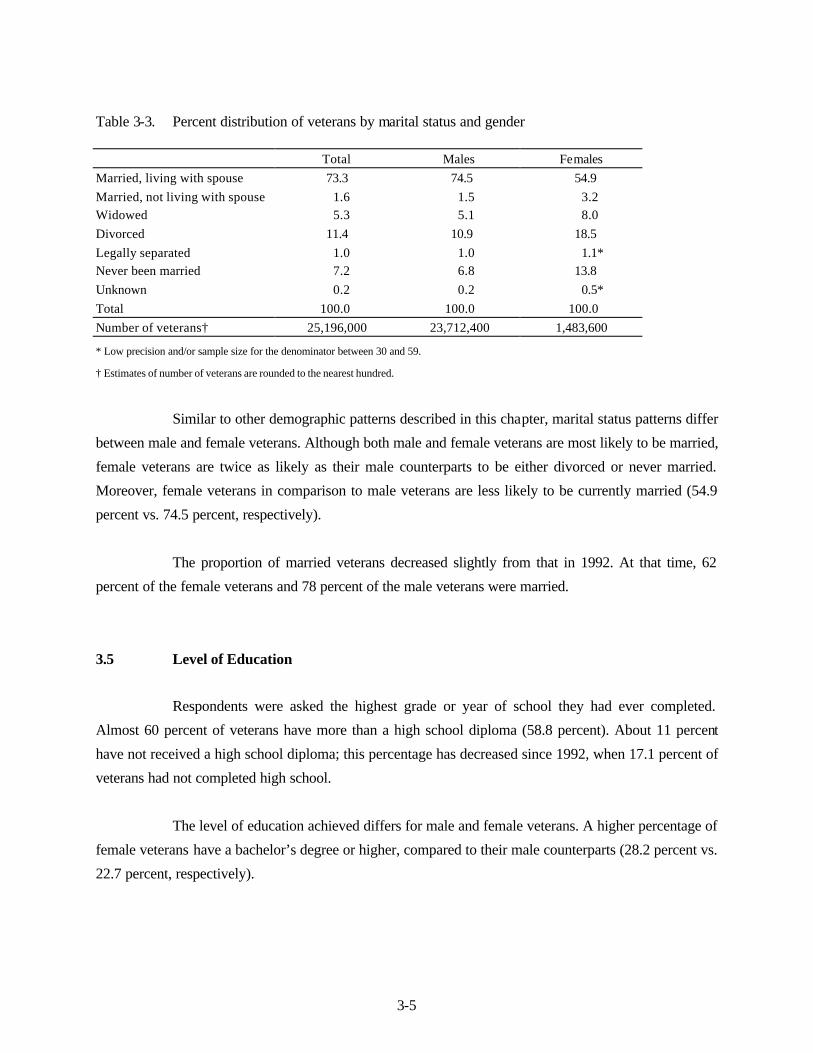
3-5
Table 3-3. Percent distribution of veterans by marital status and gender
Total Males Females Married, living with spouse 73.3 74.5 54.9 Married, not living with spouse 1.6 1.5 3.2 Widowed 5.3 5.1 8.0 Divorced 11.4 10.9 18.5 Legally separated 1.0 1.0 1.1* Never been married 7.2 6.8 13.8 Unknown 0.2 0.2 0.5* Total 100.0 100.0 100.0 Number of veterans† 25,196,000 23,712,400 1,483,600
* Low precision and/or sample size for the denominator between 30 and 59.
† Estimates of number of veterans are rounded to the nearest hundred.
Similar to other demographic patterns described in this chapter, marital status patterns differ
between male and female veterans. Although both male and female veterans are most likely to be married,
female veterans are twice as likely as their male counterparts to be either divorced or never married.
Moreover, female veterans in comparison to male veterans are less likely to be currently married (54.9
percent vs. 74.5 percent, respectively).
The proportion of married veterans decreased slightly from that in 1992. At that time, 62
percent of the female veterans and 78 percent of the male veterans were married.
3.5 Level of Education
Respondents were asked the highest grade or year of school they had ever completed.
Almost 60 percent of veterans have more than a high school diploma (58.8 percent). About 11 percent
have not received a high school diploma; this percentage has decreased since 1992, when 17.1 percent of
veterans had not completed high school.
The level of education achieved differs for male and female veterans. A higher percentage of
female veterans have a bachelor’s degree or higher, compared to their male counterparts (28.2 percent vs.
22.7 percent, respectively).

3-6
Table 3-4. Percent distribution of veterans by education and gender Total Males Females Less than high school graduate 11.1 11.7 1.7* High school graduate or GED 29.9 30.5 20.5 Post high school schooling/training 35.8 34.9 49.4 Bachelor’s degree or higher 23.0 22.7 28.2 Unknown 0.2 0.2 0.2* Total 100.0 100.0 100.0
Number of veterans† 25,196,000 23,712,400 1,483,600
* Low precision and/or sample size for the denominator between 30 and 59.
† Estimates of number of veterans are rounded to the nearest hundred.
3.6 Employment Status
Respondents were asked whether they had worked or were looking for work the week prior
to the survey. If not, they were asked why. From the responses to these questions, veterans were classified
into employment categories displayed in Table 3-5. More than 50 percent (54.9 percent) of the 2000
veteran population was employed. Almost one-third (32.0 percent) of veterans were retired, 3.6 percent
were not working but were looking for a job, and 6.9 percent were disabled. These proportions are similar
to those found in the 1992 survey.
Due to their relative youth, a higher percentage of female veterans were currently employed
(60.0 percent) compared to their male counterparts (54.6 percent). Moreover, a lower percentage of
female veterans were retired compared to male veterans. In fact, twice as many male veterans were
retired, compared to female veterans (33.0 percent vs. 16.9 percent, respectively).
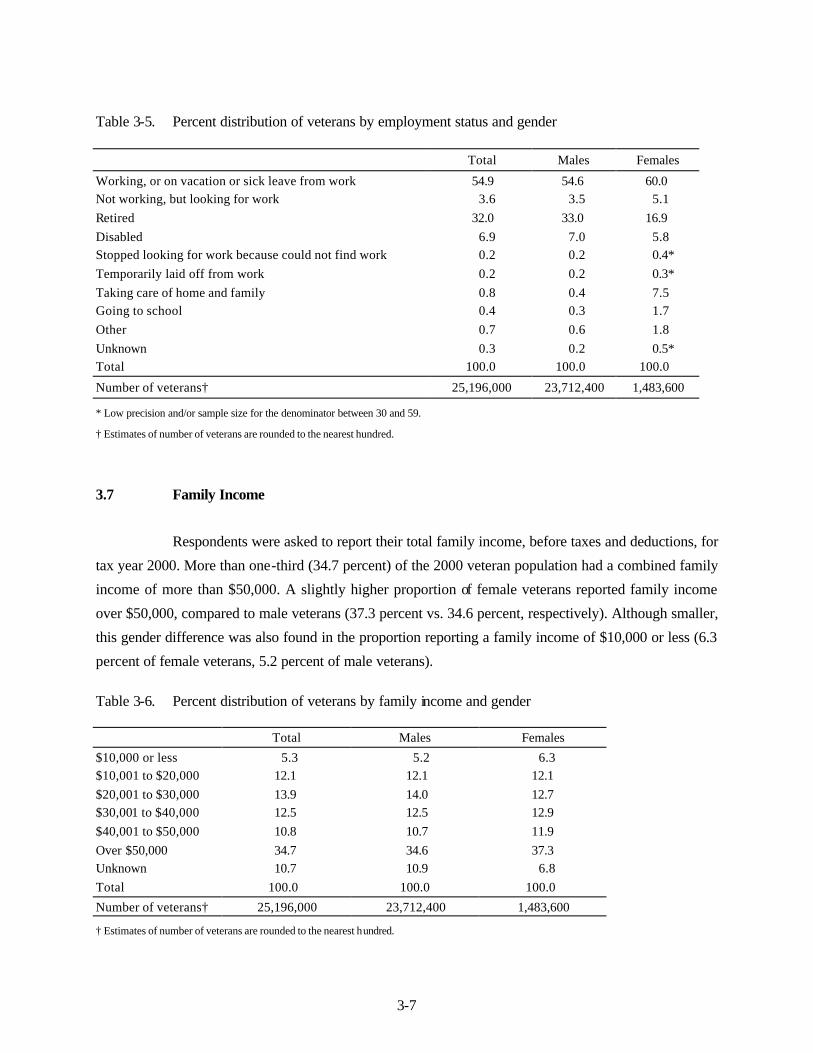
3-7
Table 3-5. Percent distribution of veterans by employment status and gender
Total Males Females
Working, or on vacation or sick leave from work 54.9 54.6 60.0 Not working, but looking for work 3.6 3.5 5.1 Retired 32.0 33.0 16.9 Disabled 6.9 7.0 5.8 Stopped looking for work because could not find work 0.2 0.2 0.4* Temporarily laid off from work 0.2 0.2 0.3* Taking care of home and family 0.8 0.4 7.5 Going to school 0.4 0.3 1.7 Other 0.7 0.6 1.8 Unknown 0.3 0.2 0.5* Total 100.0 100.0 100.0
Number of veterans† 25,196,000 23,712,400 1,483,600
* Low precision and/or sample size for the denominator between 30 and 59.
† Estimates of number of veterans are rounded to the nearest hundred.
3.7 Family Income
Respondents were asked to report their total family income, before taxes and deductions, for
tax year 2000. More than one-third (34.7 percent) of the 2000 veteran population had a combined family
income of more than $50,000. A slightly higher proportion of female veterans reported family income
over $50,000, compared to male veterans (37.3 percent vs. 34.6 percent, respectively). Although smaller,
this gender difference was also found in the proportion reporting a family income of $10,000 or less (6.3
percent of female veterans, 5.2 percent of male veterans).
Table 3-6. Percent distribution of veterans by family income and gender
Total Males Females
$10,000 or less 5.3 5.2 6.3 $10,001 to $20,000 12.1 12.1 12.1 $20,001 to $30,000 13.9 14.0 12.7 $30,001 to $40,000 12.5 12.5 12.9 $40,001 to $50,000 10.8 10.7 11.9 Over $50,000 34.7 34.6 37.3 Unknown 10.7 10.9 6.8 Total 100.0 100.0 100.0
Number of veterans† 25,196,000 23,712,400 1,483,600
† Estimates of number of veterans are rounded to the nearest hundred.

3-8
3.8 Historical Perspective and Trends
The number of female veterans is increasing, although the size of the female veteran
population lags far behind that of the male veteran population. On the 1992 survey, females made up 4
percent of the veteran population whereas on the 2001 NSV, females made up 6 percent of the veteran
population. In addition to the increase in the number of female veterans, the number of minority veterans
has also increased.
The percentage of veterans who report being married on the 2001 NSV (74.9 percent)
decreased slightly from the percentage of veterans who reported being married in the 1992 population
(77.3 percent). Inversely, the percentage of veterans on the 2001 NSV who report being divorced or
legally separated (12.4 percent) increased slightly over veterans in the 1992 survey (10.6 percent). The
other marital status categories remained virtually unchanged.
Overall, the educational levels of veterans have continually increased since 19869. For both
1992 and 2001 surveys, at least 50 percent of all veterans reported having some advanced schooling or
training (i.e., greater than high school graduate or GED). The percentage of veterans who received some
advanced schooling or training on the 2001 NSV (58.7 percent) was higher than the 1992 survey
(53.0 percent). Paralleling this trend, the percentage of veterans who reported having less than a high
school degree on the 2001 survey (11.1 percent) was lower than the comparable group of veterans in the
1992 survey (17.0 percent).
9 National Survey of Veterans (NSV9503), Department of Veterans Affairs, National Center for Veteran Analysis and Statistics, April 1995

4-1
4. MILITARY SERVICE EXPERIENCE
4.1 Introduction
The previous chapter discussed results showing that socio-demographic characteristics of the
veteran population have changed over time. For example, women, minorities and better-educated
individuals make up a larger proportion of the veteran population compared to years past. Differences in
veterans’ military experiences, like differences in socio-demographic characteristics, may have a
differential impact on health status, health needs, insurance needs, and current benefits. Thus,
understanding the military service characteristics of the ever-changing veteran population is essential to
developing policies and programs that meet those veterans’ needs.
In this chapter, we examine four key aspects of veterans’ military service experience:
n Branch of service;
n Period of service;
n Combat exposure; and
n Service-connected disability.
We describe service experiences for all veterans, and compare these experiences by gender,
age, race, and Hispanic 10 ethnicity.
4.2 Branch of Service
Respondents were asked whether they had ever served on active duty in each branch of the
military, as well as the Public Health Service, Environmental Services Administration, National Oceanic
and Atmospheric Administration, and the U.S. Merchant Marines during World War II (WWII). Women
respondents were also asked whether they had ever served in any of the women’s corps and auxiliary
corps.
10This includes veterans who identified themselves as having Spanish, Hispanic, or Latino ethnicity.

4-2
As Table 4-1 illustrates, about 50 percent of all veterans served in the Army, almost 25
percent in the Navy, 20 percent in the Air Force, 10 percent in the Marine Corps, and slightly more than 1
percent in the Coast Guard. One out of four veterans reported serving in one of the special branches (e.g.,
Merchant Marines during WWII; Women’s Army Auxiliary Corps [WAAC]; Women’s Army Corps
[WAC]).
Gender and Branch of Service. Table 4-1 also illustrates several gender differences in
branch of service evident among these veterans. Women were less likely than men to have served in the
Army (41.0 percent vs. 50.8 percent, respectively) and the Marine Corps (7.7 percent vs. 10.0 percent,
respectively). Women were more likely than men to have served in the Air Force (27.5 percent vs. 19.1
percent, respectively). About the same proportion of women as men served in the Navy (23.7 percent and
24.5 percent, respectively). Very few male veterans (2.0 percent) served in the Merchant Marines during
WWII. About 25 percent of women veterans served in one of the women’s special branches, with the
largest proportion (10.8 percent) having served in the WAC.
Table 4-1. Percent distribution of veterans by branch of service and gender
Total Males Females Army 50.2 50.8 41.0
Navy 24.4 24.5 23.7 Air Force 19.6 19.1 27.5 Marine Corps 9.9 10.0 7.7 Coast Guard 1.4 1.4 0.9* Women’s Army Auxiliary Corps (WAAC) 1.8 NR 1.8 Women’s Army Corps (WACs) 10.8 NR 10.8 Women Accepted for Voluntary Emergency Service
(WAVES) 6.7 NR 6.7 Navy Nursing Corps (NNC) 1.5 NR 1.5 Air Force Nursing Corps (AFNC) 2.8 NR 2.8 Women’s Air Force Service Pilots (WASPS) 0.2* NR 0.2* Coast Guard Women’s Reserve (SPARS) 0.3* NR 0.3* The Public Health Service, the Environmental Services
Administration or the National Oceanic and Atmospheric Administration 0.2 0.2 0.4*
U. S. Merchant Marine 2.0 2.0 NR Number of veterans† 25,095,000 23,629,800 1,465,200
* Low precision and/or sample size for the denominator between 30 and 59; NR: Sample size for the denominator less than 30.
† Estimates of number of veterans are rounded to the nearest hundred; percent estimates will not sum to 100 because veterans could indicate more than one branch of service.
NOTE: This table excludes veterans who received a medical discharge from the National Guard or Reserves but never served on active duty.

4-3
Age and Branch of Service. Age differences in branch of service also were found among
these veterans, as shown in Table 4-2. The proportion of veterans who served in the Army increases
across age cohorts from 43 percent of those veterans less than 35 years of age to 60 percent of those
veterans age 75 years or older. Conversely, the proportion with Marine Corps service decreases from 18
percent of those veterans in the youngest age cohort to 6 percent of veterans in the oldest age cohort.
Proportion of veterans with Navy, Air Force, and Coast Guard service varied little across age cohorts.
Veterans with service in the women’s corps tend to be in the older age cohorts. This is not
surprising, given that many of the separate women’s corps (e.g., Women Accepted for Voluntary
Emergency Service [WAVES], Women’s Airforce Service Pilots [WASP]) were disbanded after WWII.
Race and Branch of Service. Table 4-3 displays race comparisons of branch of service. A
larger proportion of Blacks veterans (60.3 percent) served in the Army compared to any other racial
group. A larger proportion of White and biracial American Indian-White veterans served in the Air Force
(19.9 percent and 20.1 percent vs. 15.4 percent to 17.5 percent for other races). Among Black veterans,
proportionately fewer (14.3 percent) served in the Navy, compared to veterans of other races (21.9 to 25.7
percent). Aside from the main service branches, the number of veterans of racial groups other than White
reporting service in the special branches (e.g., WAAC; WAVES) is too small to make comparisons.
Ethnicity and Branch of Service. Table 4-4 illustrates comparisons of branch of service by
Hispanic ethnicity. Proportionately more Hispanic veterans served in the Army and the Marine Corps,
compared to non-Hispanic veterans (54.3 percent vs. 50.0 percent respectively in the Army, 15.2 percent
vs. 9.6 percent respectively in the Marine Corps). Proportionately fewer Hispanic veterans served in the
Navy, compared to non-Hispanic veterans (17.9 percent vs. 24.7 percent, respectively). Aside from the
main branches, the number of Hispanic veterans reporting service in the special branches (e.g., WAC;
WAVES) is too small to make comparisons.

4-4
Table 4-2. Percent distribution of veterans by branch of service and age
Total Less than 35 years
35-44 years
45-54 years
55-64 years
65-74 years
75 years or older
Army 50.2 43.1 42.4 48.6 48.4 53.8 59.7 Navy 24.4 24.7 24.0 23.0 24.5 23.9 26.8 Air Force 19.6 15.0 23.2 18.0 20.6 19.5 20.3 Marine Corps 9.9 17.5 11.5 12.0 9.0 7.3 6.1 Coast Guard 1.4 1.4 1.6 1.3 1.0 1.2 2.1 Women’s Army Auxiliary
Corps (WAAC) 1.8 0.1* 0.9* 1.6* 4.5* 1.0* 6.9* Women’s Army Corps
(WACs) 10.8 0.1* 3.4* 23.2 27.3 20.7* 17.4 Women Accepted for
Voluntary Emergency Service (WAVES) 6.7 0.0 0.8* 5.2* 16.2* 14.6* 29.1
Navy Nursing Corps (NNC) 1.5 0.3* 1.1* 0.2* 3.0* 3.5* 5.8*
Air Force Nursing Corps (AFNC) 2.8 0.1* 1.5* 5.5* 6.9* 1.2* 5.6*
Women’s Air Force Service Pilots (WASPS) 0.2* 0.0 0.0 0.2* 0.5* 0.2* 1.1*
Coast Guard Women’s Reserve (SPARS) 0.3* 0.0 0.0 0.0 0.0 0.0 2.6*
The Public Health Service, the Environmental Services Administration or the National Oceanic and Atmospheric Administration 0.2 0.1* 0.2* 0.2* 0.4 0.2* 0.2*
U. S. Merchant Marine 2.0 NR NR NR NR 1.2 3.1 Number of veterans† 25,095,000 2,264,300 3,003,700 5,393,700 4,935,700 5,243,100 4,114,700
* Low precision and/or sample size for the denominator between 30 and 59; NR: Sample size for the denominator less than 30.
† Estimates of number of veterans are rounded to the nearest hundred; the total estimate is larger than the sum of the groups because some veterans did not provide their age; percent estimates will not sum to 100 because veterans could indicate more than one branch of service.
NOTE: This table excludes veterans who received a medical discharge from the National Guard or Reserves but never served on active duty.

4-5
Table 4-3. Percent distribution of veterans by branch of service and race
One race Two or more races
Total Total
one race White
Black or African
American
American Indian or
Alaska Native Asian
Native Hawaiian or Other Pacific
Islander
Total two or
more races
American Indian or Alaska
Native/White Race
unknown Army 50.2 50.3 49.2 60.3 52.2 53.3 42.0* 50.9 53.0 47.7 Navy 24.4 24.6 25.7 14.3 24.3 23.9 9.9* 22.0 21.9 21.2 Air Force 19.6 19.6 19.9 17.5 15.4 17.7* 28.6* 21.3 20.1 16.7 Marine Corps 9.9 9.6 9.5 10.9 12.0 6.4* 19.5* 12.0 11.6 17.1 Coast Guard 1.4 1.4 1.5 0.6* 0.8* 1.9* 0.0* 1.4* 1.9* 1.3* Women’s Army Auxiliary
Corps (WAAC) 1.8 1.8 1.9 1.3* NR NR NR 5.8* 6.4* 0.0* Women’s Army Corps
(WACs) 10.8 11.2 12.1 4.5* NR NR NR 13.0* 16.5* 0.4* Women Accepted for
Voluntary Emergency Service (WAVES) 6.7 7.1 8.4 1.2* NR NR NR 0.0 0.0* 2.4*
Navy Nursing Corps (NNC) 1.5 1.5 1.9 0.0 NR NR NR 1.1* 0.0* 1.7* Air Force Nursing Corps
(AFNC) 2.8 3.0 3.4* 0.9* NR NR NR 0.6* 0.0* 0.0* Women’s Air Force Service
Pilots (WASPS) 0.2* 0.2* 0.3* 0.0 NR NR NR 0.0 0.0* 0.0* Coast Guard Women’s
Reserve (SPARS) 0.3* 0.3* 0.4* 0.0 NR NR NR 0.0 0.0* 0.0* The Public Health Serv ice,
the Environmental Services Administration or the National Oceanic and Atmospheric Administration 0.2 0.2 0.2 0.1* 0.7* 0.0 0.7* 0.1* 0.2* 0.3*
U. S. Merchant Marine 2.0 2.0 2.0 2.6* 2.8* 0.0* NR 3.2* 1.1* 1.0* Number of veterans† 25,095,000 23,763,200 21,289,000 2,206,000 158,500 73,200 36,500 552,900 360,600 778,800 * Low precision and/or sample size for the denominator between 30 and 59; NR: Sample size for the denominator less than 30. † Estimates of number of veterans are rounded to the nearest hundred; only one sub-category of “Total Two or More Races” is shown because all other categories were too small to report; percent estimates will
not sum to 100 because veterans could indicate more than one branch of service.
NOTE: This table excludes vet erans who received a medical discharge from the National Guard or Reserves but never served on active duty.
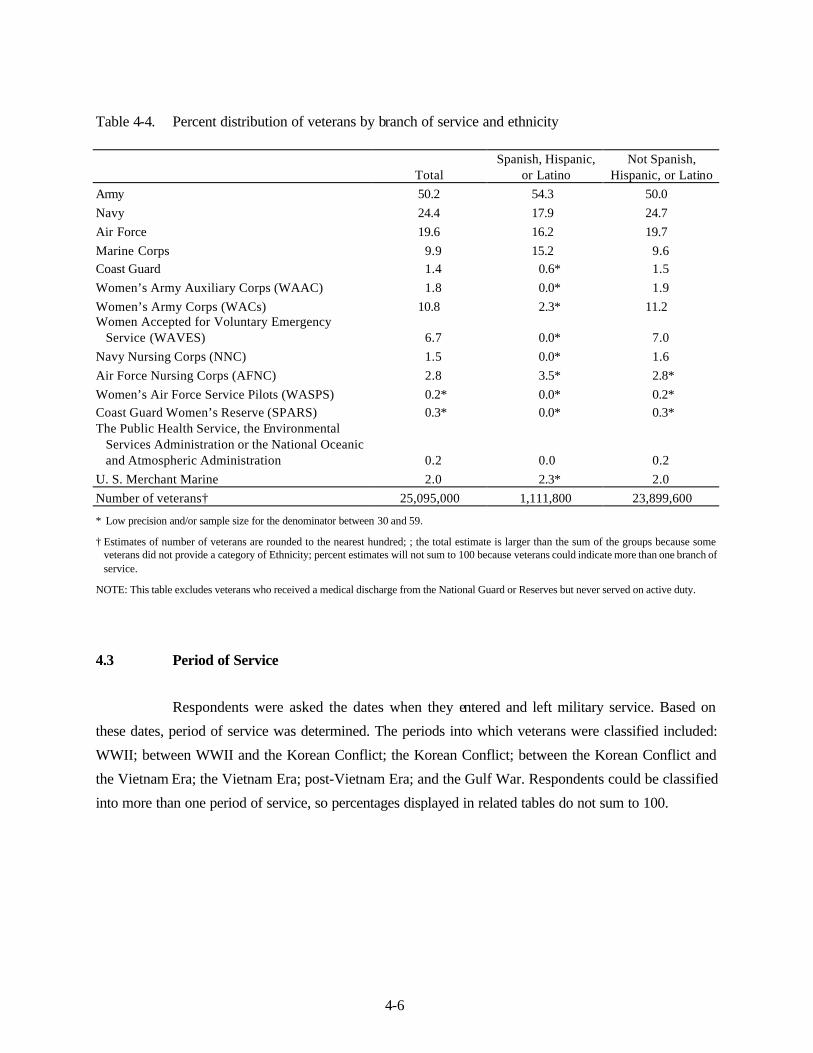
4-6
Table 4-4. Percent distribution of veterans by branch of service and ethnicity
Total Spanish, Hispanic,
or Latino Not Spanish,
Hispanic, or Latino Army 50.2 54.3 50.0 Navy 24.4 17.9 24.7 Air Force 19.6 16.2 19.7 Marine Corps 9.9 15.2 9.6 Coast Guard 1.4 0.6* 1.5 Women’s Army Auxiliary Corps (WAAC) 1.8 0.0* 1.9 Women’s Army Corps (WACs) 10.8 2.3* 11.2 Women Accepted for Voluntary Emergency
Service (WAVES) 6.7 0.0* 7.0 Navy Nursing Corps (NNC) 1.5 0.0* 1.6 Air Force Nursing Corps (AFNC) 2.8 3.5* 2.8* Women’s Air Force Service Pilots (WASPS) 0.2* 0.0* 0.2* Coast Guard Women’s Reserve (SPARS) 0.3* 0.0* 0.3* The Public Health Service, the Environmental
Services Administration or the National Oceanic and Atmospheric Administration 0.2 0.0 0.2
U. S. Merchant Marine 2.0 2.3* 2.0 Number of veterans† 25,095,000 1,111,800 23,899,600
* Low precision and/or sample size for the denominator between 30 and 59.
† Estimates of number of veterans are rounded to the nearest hundred; ; the total estimate is larger than the sum of the groups because some veterans did not provide a category of Ethnicity; percent estimates will not sum to 100 because veterans could indicate more than one branch of service.
NOTE: This table excludes veterans who received a medical discharge from the National Guard or Reserves but never served on active duty.
4.3 Period of Service
Respondents were asked the dates when they entered and left military service. Based on
these dates, period of service was determined. The periods into which veterans were classified included:
WWII; between WWII and the Korean Conflict; the Korean Conflict; between the Korean Conflict and
the Vietnam Era; the Vietnam Era; post-Vietnam Era; and the Gulf War. Respondents could be classified
into more than one period of service, so percentages displayed in related tables do not sum to 100.

4-7
Table 4-5 shows that the largest percentage of veterans report that they served during the
Vietnam Era (36.1 percent), followed by the Post-Vietnam Era (27.9 percent) and the era between the
Korean and Vietnam eras (25.6 percent). This pattern has changed slightly since the 1992 NSV, when the
majority of veterans reported that they served during the Vietnam Era (33.5 percent) or WWII (30.0
percent).
Table 4-5. Percent distribution of veterans by period of service and gender
Total Males Females World War II 20.5 21.0 12.0
Between World War II and the Korean Conflict 6.7 7.0 2.4 Korean Conflict 16.9 17.7 5.0 Between the Korean Conflict and the Vietnam Era 25.6 26.7 8.0 Vietnam Era 36.1 37.3 16.2 Post-Vietnam Era 27.9 26.3 53.8 Gulf War 13.9 12.4 37.0 Number of veterans† 25,095,000 23,629,800 1,465,200
† Estimates of number of veterans are rounded to the nearest hundred; percent estimates will not sum to 100 because veterans could indicate more than one period of service.
NOTE: This table excludes veterans who received a medical discharge from the National Guard or Reserves but never served on active duty.
Gender and Period of Service. Proportionately more women veterans served during the
two most recent periods, compared to men veterans. Almost 54 percent of female veterans served during
the Post-Vietnam Era compared to 26 percent of male veterans. In addition, proportionately three times as
many female veterans served during the Gulf War compared to men (37.0 percent vs. 12.4 percent,
respectively). These findings reflect increasing participation of women in military service in the past few
decades.
Race and Period of Service. As described above, the largest proportion of veterans served
during the Vietnam Era (36.1 percent), while the second-largest proportion served during the post-
Vietnam Era. Table 4-6 illustrates that this pattern is reversed among Black and American Indian
veterans. The proportion of minority veterans who served during the post-Vietnam Era and Gulf War is
also markedly higher than that of White veterans. This reflects the increasing racia l diversity observed
among military service members in recent decades.

4-8
Table 4-6. Percent distribution of veterans by period of service and race
One race Two or more races
Total Total
one race White
Black or African
American
American Indian or
Alaska Native Asian
Native Hawaiian or Other Pacific
Islander
Total two or
more races
American Indian or Alaska
Native/White Race
unknown World War II 20.5 21.1 22.4 10.1 8.1 20.4 4.9* 11.1 12.0 9.7 Between World War II and
the Korean Conflict 6.7 6.8 7.1 4.6 5.7* 9.8* 4.0* 5.7 7.2 3.5 Korean Conflict 16.9 17.2 17.7 13.3 11.5 13.5* 18.0* 13.6 16.5 9.5 Between the Korean
Conflict and the Vietnam Era 25.6 26.0 26.8 18.8 18.9 24.1 27.0* 21.2 25.9 17.9
Vietnam Era 36.1 35.8 35.9 34.8 34.6 36.3 56.1* 44.2 45.0 38.2 Post-Vietnam Era 27.9 27.3 25.2 45.8 50.5 32.5 56.2* 39.1 34.1 37.7 Gulf War 13.9 13.3 11.9 26.4 19.6 32.0 16.6* 19.2 14.9 27.0 Number of veterans† 25,095,000 23,763,200 21,289,000 2,206,000 158,500 73,200 36,500 552,900 360,600 778,800
* Low precision and/or sample size for the denominator between 30 and 59.
† Estimates of number of veterans are rounded to the nearest hundred; only one sub-category of “Total Two or More Races” is shown because all other categories were too small to report; percent estimates will not sum to 100 because veterans could indicate more than one period of service.
NOTE: This table excludes veterans who received a medical discharge from the National Guard or Reserves but never served on active duty.

4-9
Ethnicity and Period of Service. Table 4-7 compares Hispanic and non-Hispanic veterans
and the periods during which they served. Proportionately more Hispanic veterans served during the post-
Vietnam Era and the Gulf War, compared to non-Hispanic veterans. Fewer Hispanic veterans served
between WWII and the Vietnam Era, compared to their non-Hispanic counterparts. These results mirror
those seen in comparisons of race and period of service, indicating the increasing diversity of military
service members.
Table 4-7. Percent distribution of veterans by period of service and ethnicity
Total Spanish, Hispanic,
or Latino Not Spanish,
Hispanic, or Latino World War II 20.5 10.2 21.0 Between World War II and the Korean Conflict 6.7 3.1 6.9 Korean Conflict 16.9 10.6 17.2 Between the Korean Conflict and the Vietnam Era 25.6 17.9 26.0 Vietnam Era 36.1 34.9 36.1 Post-Vietnam Era 27.9 35.9 27.5 Gulf War 13.9 25.9 13.3 Number of veterans† 25,095,000 1,111,800 23,899,600
† Estimates of number of veterans are rounded to the nearest hundred; the total estimate is larger than the sum of the groups because some veterans did not provide a category of Ethnicity; percent estimates will not sum to 100 because veterans could indicate more than one period of service.
NOTE: This table excludes veterans who received a medical discharge from the National Guard or Reserves but never served on active duty.
4.4 Combat Exposure
Respondents were asked questions about combat and combat-related military experiences.
These questions included whether the veteran had served in a combat or war zone and had been exposed
to dead, dying, or wounded people. As Table 4-8 displays, nearly 39 percent of veterans said they had
served in a combat or war zone, while 36 percent said they had been exposed to dead, dying, or wounded
people during their military service.
Gender and Combat Exposure. As might be expected, male veterans were much more
likely to have served in combat or a war zone than were women veterans (40.6 percent vs. 12.0 percent,
respectively). Male veterans were also more likely than their female counterparts to have been exposed to
dead, dying or wounded people, although the difference is not as striking.

4-10
Table 4-8. Percent distribution of veterans by service in combat or war zone or exposure to dead, dying, or wounded and gender
Total Males Females Served in Combat or War Zone
Yes 38.9 40.6 12.0 No 60.1 58.3 87.8 Unknown 1.0 1.1 0.2 Total 100.0 100.0 100.0
Exposed to Dead, Dying, or Wounded People
Yes 36.4 37.2 24.4 No 62.9 62.1 75.2 Unknown 0.7 0.7 0.4 Total 100.0 100.0 100.0
Number of veterans† 25,095,000 23,629,800 1,465,200
† Estimates of number of veterans are rounded to the nearest hundred.
NOTE: This table excludes veterans who received a medical discharge from the National Guard or Reserves but never served on active duty.
Period of Service and Combat Exposure. Table 4-9 shows that, in general, the proportion
of veterans who reported serving in a combat or war zone decreases across the periods of service after
WWII, then increases during the Vietnam and Gulf War periods. More WWII veterans said they served in
a combat or war zone, followed by veterans who served between WWII and Korea and those who served
during the Vietnam era, compared to veterans of other periods of service. Although the relatively high
proportion with combat exposure among those who served between WWII and Korea seems at odds with
peacetime service, this may simply represent veterans who had already served during WWII and
experienced combat then.
A similar pattern (i.e., highest during WWII service and immediately thereafter, second-
highest during Vietnam era service) is seen in exposure to dead, dying, or wounded people.

4-11
Table 4-9. Percent distribution of veterans by service in combat, war zone, or exposure to dead, dying, or wounded and period of service
Total World War II
Between World War II
and Korea
Korean Conflict
Between Korean
Conflict and Vietnam Era
Vietnam Era
Post-Vietnam
Era Gulf War
Served in Combat or War Zone
Yes 38.9 60.3 52.8 42.4 31.9 48.1 31.5 38.1 No 60.1 38.7 46.5 56.9 67.1 51.1 67.3 60.7 Unknown 1.0 1.0 0.7 0.7 1.0 0.8 1.2 1.2 Total 100.0 100.0 100.0 100.0 100.0 100.0 100.0 100.0
Exposed to Dead, Dying, or Wounded People
Yes 36.4 49.7 42.9 34.8 30.0 45.9 32.3 31.7 No 62.9 49.2 56.3 64.6 69.4 53.5 67.0 67.6 Unknown 0.7 1.1 0.8 0.6 0.6 0.6 0.7 0.7 Total 100.0 100.0 100.0 100.0 100.0 100.0 100.0 100.0
Number of veterans† 25,095,000 5,149,100 1,680,600 4,245,600 6,426,500 9,057,200 7,005,000 3,483,600
† Estimates of number of veterans are rounded to the nearest hundred; the total number of veterans is smaller than the sum of the groups because veterans could indicate more than one period of service.
NOTE: This table excludes veterans who received a medical discharge from the National Guard or Reserves but never served on active duty.
4.5 Service -Related Disability and Service-Connected Disability Rating
All respondents were asked whether they had a disabling condition. Those who answered
affirmatively were asked whether their disabling condition was service-related. In addition, everyone was
asked whether they had a service-connected disability rating.
A service-connected disability is any disability incurred in or aggravated during a period of
active military service where the veteran did not receive a dishonorable discharge or the disability was not
due to willful misconduct of the veteran. In general, a service-connected disability evaluated as 10 percent
or more disabling by VA entitles a veteran to receive disability compensation. 11 Service-related disability,
on the other hand, is a self-reported disabling condition. Table 4-10 shows that almost 14 percent of
veterans said they had a service-related disability. The same proportion said they had a service-connected
disability rating, as Table 4-11 displays.
11 A small percent of veterans with less than a 10 percent rating receive compensation.

4-12
Gender and Service-Related Disability. Gender differences in service-related disability are
displayed in Tables 4-10 and 4-11. A slightly higher percentage of male veterans than female veterans
report having a service-connected disability (13.9 percent vs. 12.7 percent, respectively). The difference
in proportion of male and female veterans reporting a disability rating is even smaller (13.8 percent vs.
13.5 percent, respectively).
Table 4-10. Percent distribution of veterans by service-related disability and gender
Total Males Females Yes 13.8 13.9 12.7
No 16.6 16.8 12.0 Not Applicable or Unknown 69.6 69.3 75.3 Total 100.0 100.0 100.0 Number of veterans† 25,196,000 23,712,400 1,483,600
† Estimates of number of veterans are rounded to the nearest hundred.
Table 4-11. Percent distribution of veterans by service-connected disability rating and gender Total Males Females Yes 13.8 13.8 13.5 No 85.1 85.1 85.6 Unknown 1.1 1.1 0.9* Total 100.0 100.0 100.0 Number of veterans† 25,196,000 23,712,400 1,483,600
* Low precision and/or sample size for the denominator between 30 and 59.
† Estimates of number of veterans are rounded to the nearest hundred.
Branch of Service and Service-Related Disability. Table 4-12 compares the proportion of
veterans reporting a service-related disability in the different military branches. Comparing only the major
services (i.e., Army, Navy, Air Force, Marine Corps, Coast Guard), the highest proportion of veterans
reporting a service-related disability was among those who had served in the Marine Corps (16.7 percent).
The next highest proportion was found among those who had served in the Army (15.0 percent). The
lowest proportion reporting a service-related disability was found among Navy veterans (11.4 percent).
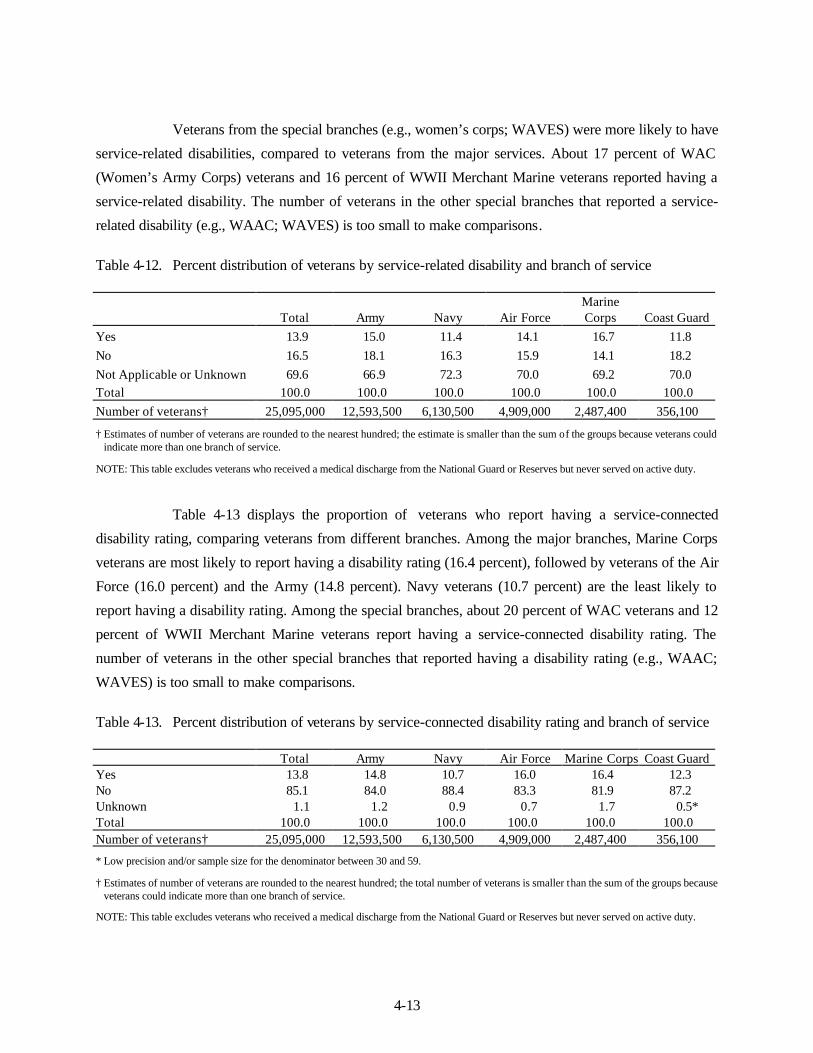
4-13
Veterans from the special branches (e.g., women’s corps; WAVES) were more likely to have
service-related disabilities, compared to veterans from the major services. About 17 percent of WAC
(Women’s Army Corps) veterans and 16 percent of WWII Merchant Marine veterans reported having a
service-related disability. The number of veterans in the other special branches that reported a service-
related disability (e.g., WAAC; WAVES) is too small to make comparisons.
Table 4-12. Percent distribution of veterans by service-related disability and branch of service
Total Army Navy Air Force Marine Corps Coast Guard
Yes 13.9 15.0 11.4 14.1 16.7 11.8 No 16.5 18.1 16.3 15.9 14.1 18.2 Not Applicable or Unknown 69.6 66.9 72.3 70.0 69.2 70.0 Total 100.0 100.0 100.0 100.0 100.0 100.0 Number of veterans† 25,095,000 12,593,500 6,130,500 4,909,000 2,487,400 356,100
† Estimates of number of veterans are rounded to the nearest hundred; the estimate is smaller than the sum of the groups because veterans could indicate more than one branch of service.
NOTE: This table excludes veterans who received a medical discharge from the National Guard or Reserves but never served on active duty.
Table 4-13 displays the proportion of veterans who report having a service-connected
disability rating, comparing veterans from different branches. Among the major branches, Marine Corps
veterans are most likely to report having a disability rating (16.4 percent), followed by veterans of the Air
Force (16.0 percent) and the Army (14.8 percent). Navy veterans (10.7 percent) are the least likely to
report having a disability rating. Among the special branches, about 20 percent of WAC veterans and 12
percent of WWII Merchant Marine veterans report having a service-connected disability rating. The
number of veterans in the other special branches that reported having a disability rating (e.g., WAAC;
WAVES) is too small to make comparisons.
Table 4-13. Percent distribution of veterans by service-connected disability rating and branch of service Total Army Navy Air Force Marine Corps Coast Guard Yes 13.8 14.8 10.7 16.0 16.4 12.3 No 85.1 84.0 88.4 83.3 81.9 87.2 Unknown 1.1 1.2 0.9 0.7 1.7 0.5* Total 100.0 100.0 100.0 100.0 100.0 100.0 Number of veterans† 25,095,000 12,593,500 6,130,500 4,909,000 2,487,400 356,100
* Low precision and/or sample size for the denominator between 30 and 59.
† Estimates of number of veterans are rounded to the nearest hundred; the total number of veterans is smaller than the sum of the groups because veterans could indicate more than one branch of service.
NOTE: This table excludes veterans who received a medical discharge from the National Guard or Reserves but never served on active duty.

4-14
Period of Service and Service-Related Disability. The general trend in the proportion of
veterans who report a service-related disability is upward across the periods of service after WWII, as
Table 4-14 indicates. However, the higher proportions among veterans who served later may be an
artifact of the fact that a higher proportion of veterans from earlier periods have already died. A similar
trend can be observed in the proportion of veterans who say they have a service-connected disability
rating (see Table 4-15).
Table 4-14. Percent distribution of veterans by service-related disability and period of service
Total World War
II
Between World War II
and Korea
Korean Conflict
Between Korean Conflict
and Vietnam
Era Vietnam
Era
Post-Vietnam
Era Gulf War
Yes 13.9 13.6 14.0 11.7 12.5 18.5 19.6 22.5 No 16.5 28.6 25.1 22.7 18.8 11.6 7.4 3.0 Not applicable or
unknown 69.6 57.8 60.9 65.6 68.7 69.9 73.0 74.5 Total 100.0 100.0 100.0 100.0 100.0 100.0 100.0 100.0 Number of veterans† 25,095,000 5,149,100 1,680,600 4,245,600 6,426,500 9,057,200 7,005,000 3,483,600
† Estimates of number of veterans are rounded to the nearest hundred; the total estimate is smaller than the sum of the groups because veterans could indicate more than one period of service.
NOTE: This table excludes veterans who received a medical discharge from the National Guard or Reserves but never served on active duty.
Table 4-15. Percent distribution of veterans by service-connected disability rating and period of service
Total World War II
Between World
War II and Korea
Korean Conflict
Between Korean Conflict
and Vietnam
Era Vietnam
Era
Post-Vietnam
Era Gulf War
Yes 13.8 14.2 16.3 13.3 12.8 18.1 20.4 24.2 No 85.1 84.6 82.6 85.9 86.6 80.9 78.6 74.5 Unknown 1.1 1.2 1.1* 0.8 0.6 1.0 1.0 1.3 Total 100.0 100.0 100.0 100.0 100.0 100.0 100.0 100.0 Number of veterans† 25,095,000 5,149,100 1,680,600 4,245,600 6,426,500 9,057,200 7,005,000 3,483,600
* Low precision and/or sample size for the denominator between 30 and 59.
† Estimates of number of veterans are rounded to the nearest hundred; the total estimate is smaller than the sum of the groups because veterans could indicate more than one period of service.
NOTE: This table excludes veterans who received a medical discharge from the National Guard or Reserves but never served on active duty.
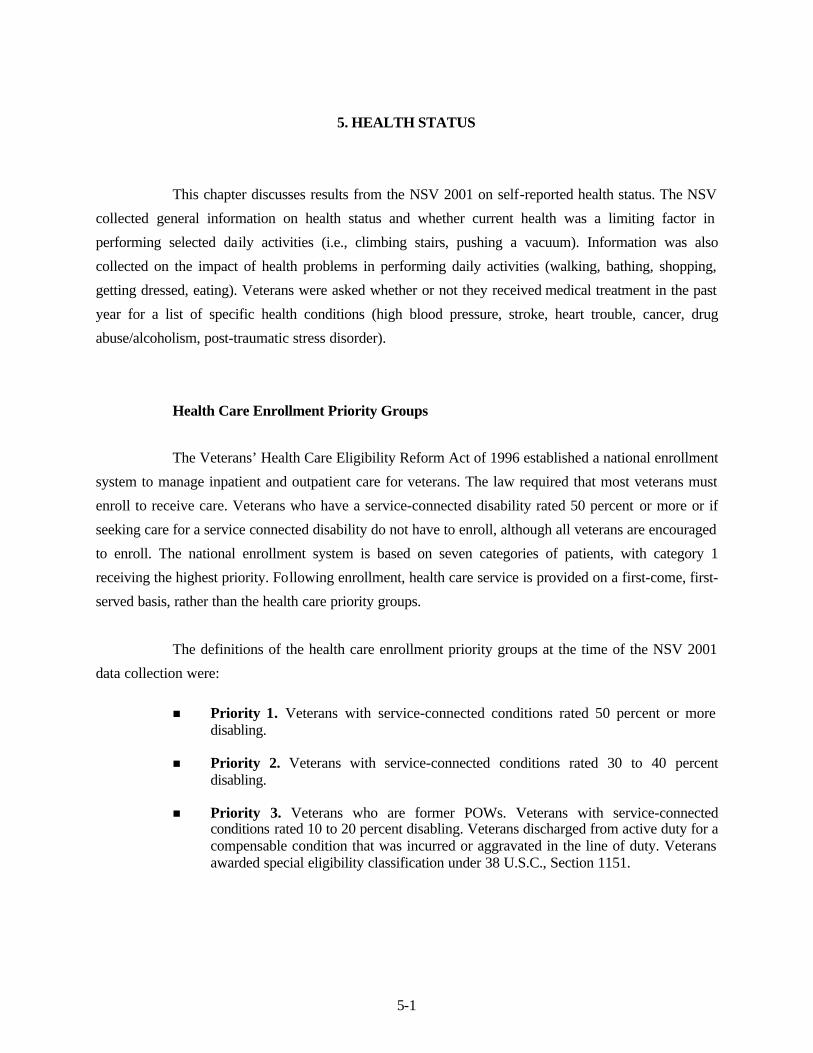
5-1
5. HEALTH STATUS
This chapter discusses results from the NSV 2001 on self-reported health status. The NSV
collected general information on health status and whether current health was a limiting factor in
performing selected daily activities (i.e., climbing stairs, pushing a vacuum). Information was also
collected on the impact of health problems in performing daily activities (walking, bathing, shopping,
getting dressed, eating). Veterans were asked whether or not they received medical treatment in the past
year for a list of specific health conditions (high blood pressure, stroke, heart trouble, cancer, drug
abuse/alcoholism, post-traumatic stress disorder).
Health Care Enrollment Priority Groups
The Veterans’ Health Care Eligibility Reform Act of 1996 established a national enrollment
system to manage inpatient and outpatient care for veterans. The law required that most veterans must
enroll to receive care. Veterans who have a service-connected disability rated 50 percent or more or if
seeking care for a service connected disability do not have to enroll, although all veterans are encouraged
to enroll. The national enrollment system is based on seven categories of patients, with category 1
receiving the highest priority. Following enrollment, health care service is provided on a first-come, first-
served basis, rather than the health care priority groups.
The definitions of the health care enrollment priority groups at the time of the NSV 2001
data collection were:
n Priority 1. Veterans with service-connected conditions rated 50 percent or more
disabling.
n Priority 2. Veterans with service-connected conditions rated 30 to 40 percent disabling.
n Priority 3. Veterans who are former POWs. Veterans with service-connected conditions rated 10 to 20 percent disabling. Veterans discharged from active duty for a compensable condition that was incurred or aggravated in the line of duty. Veterans awarded special eligibility classification under 38 U.S.C., Section 1151.
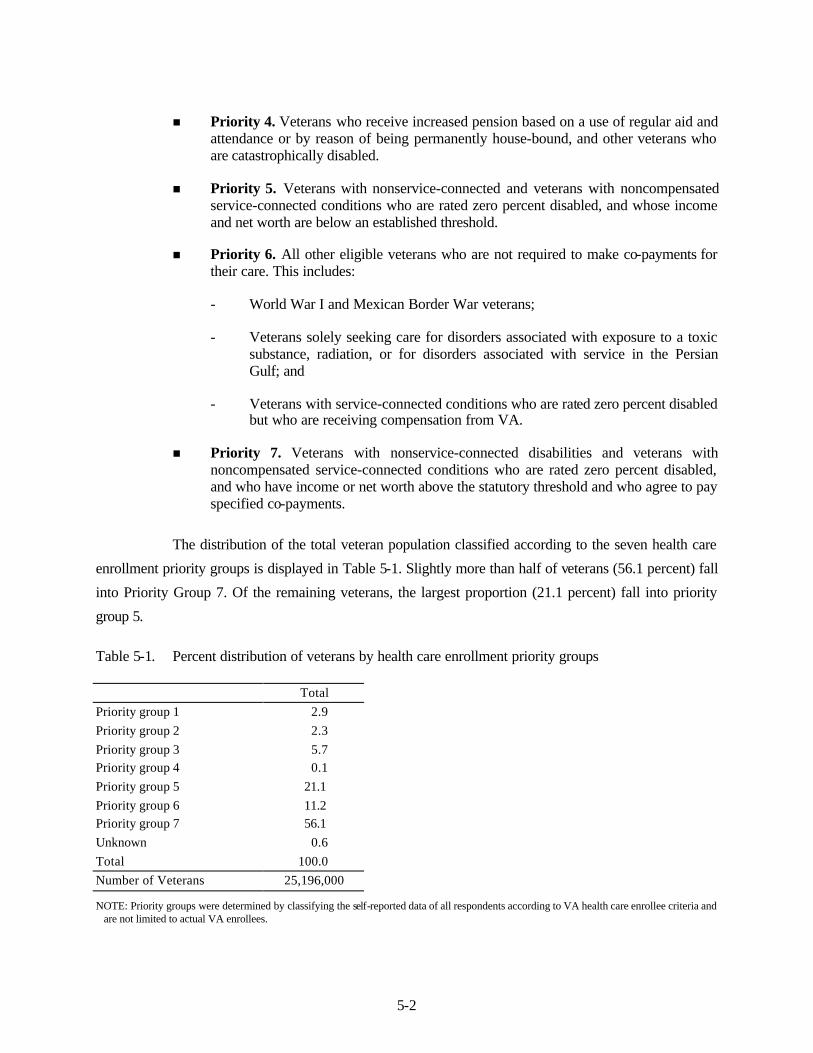
5-2
n Priority 4. Veterans who receive increased pension based on a use of regular aid and attendance or by reason of being permanently house-bound, and other veterans who are catastrophically disabled.
n Priority 5. Veterans with nonservice-connected and veterans with noncompensated service-connected conditions who are rated zero percent disabled, and whose income and net worth are below an established threshold.
n Priority 6. All other eligible veterans who are not required to make co-payments for their care. This includes:
- World War I and Mexican Border War veterans;
- Veterans solely seeking care for disorders associated with exposure to a toxic substance, radiation, or for disorders associated with service in the Persian Gulf; and
- Veterans with service-connected conditions who are rated zero percent disabled but who are receiving compensation from VA.
n Priority 7. Veterans with nonservice-connected disabilities and veterans with noncompensated service-connected conditions who are rated zero percent disabled, and who have income or net worth above the statutory threshold and who agree to pay specified co-payments.
The distribution of the total veteran population classified according to the seven health care
enrollment priority groups is displayed in Table 5-1. Slightly more than half of veterans (56.1 percent) fall
into Priority Group 7. Of the remaining veterans, the largest proportion (21.1 percent) fall into priority
group 5.
Table 5-1. Percent distribution of veterans by health care enrollment priority groups Total Priority group 1 2.9 Priority group 2 2.3 Priority group 3 5.7 Priority group 4 0.1 Priority group 5 21.1 Priority group 6 11.2 Priority group 7 56.1 Unknown 0.6 Total 100.0 Number of Veterans 25,196,000
NOTE: Priority groups were determined by classifying the self-reported data of all respondents according to VA health care enrollee criteria and are not limited to actual VA enrollees.

5-3
5.1 Health Status
In the NSV 2001, veterans were asked to assess their health status as excellent, very good,
good, fair, or poor. As Table 5-2 illustrates, nearly half of veterans (45.6 percent) reported their health as
very good or excellent; 3 out of 4 veterans (75.7 percent) assessed their health as excellent, very good, or
good.
Table 5-2. Percent distribution of veterans by health status and health care priority group Total Priority 1 Priority 2 Priority 3 Priority 4 Priority 5 Priority 6 Priority 7 Excellent 16.8 2.0 5.0 8.4 1.1* 8.5 18.1 21.7
Very good 28.8 8.4 15.7 21.9 5.0* 18.3 29.0 35.0 Good 30.1 22.6 35.9 35.8 11.9* 32.3 31.2 28.6 Fair 16.3 32.0 27.5 22.5 20.8 26.2 15.5 10.9 Poor 7.9 34.7 15.5 11.3 59.0 14.6 5.9 3.7 Unknown 0.1 0.3* 0.4* 0.1* 2.2* 0.1* 0.3* 0.1* Total 100.0 100.0 100.0 100.0 100.0 100.0 100.0 100.0 Number of veterans† 24,509,900 682,200 561,600 1,404,100 20,900 5,063,700 2,802,700 13,838,900
* Low precision and/or sample size for the denominator between 30 and 59.
† Estimates of number of veterans are rounded to the nearest hundred; the total estimate is larger than the sum of the groups because insufficient data were available to determine a priority group for some respondents.
NOTE: This table excludes those veterans for whom there was a proxy respondent. Priority groups were determined by classifying the self-reported data of all respondents according to VA health care enrollee criteria and are not limited to actual VA enrollees.
Health Care Priority Group and Health Status. Health care priority groups vary widely in
self-assessed health status. Priority 7 has the highest proportion of veterans assessing themselves as
excellent or very good, while Priority 1 and 4 have the lowest proportion rating their health as excellent or
very good. The percent of veterans whose health status is fair or poor also differs widely by health care
priority group.
Overall, 24.2 percent of surveyed veterans rated their health as fair or poor. Nearly 4 out of 5
veterans (79.8 percent) in Priority 4, however, assessed their health as fair or poor. Because these veterans
are permanently housebound or catastrophically disabled, this is not surprising. The second highest
proportion reporting fair or poor health is found in Priority 1, which includes veterans with service
connected conditions rated as 50 percent or more disabled.
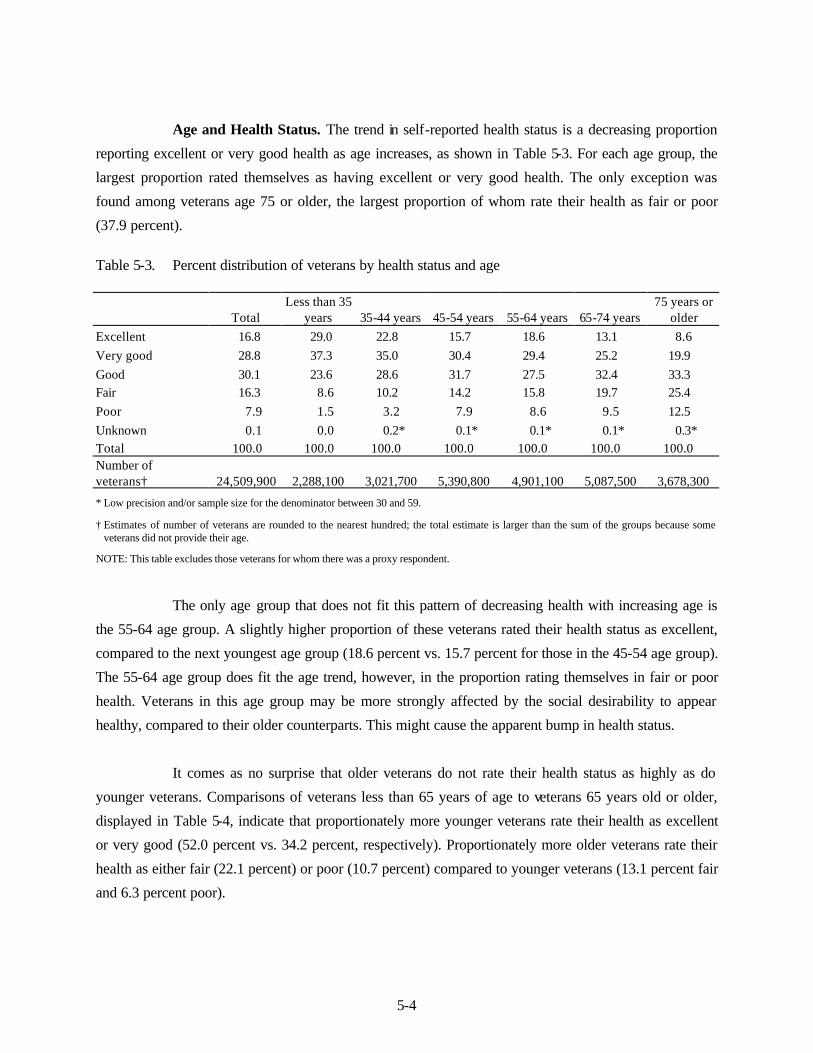
5-4
Age and Health Status. The trend in self-reported health status is a decreasing proportion
reporting excellent or very good health as age increases, as shown in Table 5-3. For each age group, the
largest proportion rated themselves as having excellent or very good health. The only exception was
found among veterans age 75 or older, the largest proportion of whom rate their health as fair or poor
(37.9 percent).
Table 5-3. Percent distribution of veterans by health status and age
Total Less than 35
years 35-44 years 45-54 years 55-64 years 65-74 years 75 years or
older Excellent 16.8 29.0 22.8 15.7 18.6 13.1 8.6 Very good 28.8 37.3 35.0 30.4 29.4 25.2 19.9 Good 30.1 23.6 28.6 31.7 27.5 32.4 33.3 Fair 16.3 8.6 10.2 14.2 15.8 19.7 25.4 Poor 7.9 1.5 3.2 7.9 8.6 9.5 12.5 Unknown 0.1 0.0 0.2* 0.1* 0.1* 0.1* 0.3* Total 100.0 100.0 100.0 100.0 100.0 100.0 100.0 Number of veterans† 24,509,900 2,288,100 3,021,700 5,390,800 4,901,100 5,087,500 3,678,300
* Low precision and/or sample size for the denominator between 30 and 59.
† Estimates of number of veterans are rounded to the nearest hundred; the total estimate is larger than the sum of the groups because some veterans did not provide their age.
NOTE: This table excludes those veterans for whom there was a proxy respondent.
The only age group that does not fit this pattern of decreasing health with increasing age is
the 55-64 age group. A slightly higher proportion of these veterans rated their health status as excellent,
compared to the next youngest age group (18.6 percent vs. 15.7 percent for those in the 45-54 age group).
The 55-64 age group does fit the age trend, however, in the proportion rating themselves in fair or poor
health. Veterans in this age group may be more strongly affected by the social desirability to appear
healthy, compared to their older counterparts. This might cause the apparent bump in health status.
It comes as no surprise that older veterans do not rate their health status as highly as do
younger veterans. Comparisons of veterans less than 65 years of age to veterans 65 years old or older,
displayed in Table 5-4, indicate that proportionately more younger veterans rate their health as excellent
or very good (52.0 percent vs. 34.2 percent, respectively). Proportionately more older veterans rate their
health as either fair (22.1 percent) or poor (10.7 percent) compared to younger veterans (13.1 percent fair
and 6.3 percent poor).

5-5
Table 5-4. Percent distribution of veterans by health status and age (under 65 and 65 or older)
Total Less than 65 years 65 years or older Excellent 16.8 19.9 11.2 Very good 28.8 32.0 23.0 Good 30.1 28.6 32.7 Fair 16.3 13.1 22.1 Poor 7.9 6.3 10.8 Unknown 0.1 0.1* 0.2 Total 100.0 100.0 100.0
Number of veterans† 24,509,900 15,680,000 9,372,600
* Low precision and/or sample size for the denominator between 30 and 59.
† Estimates of number of veterans are rounded to the nearest hundred; the total estimate is larger than the sum of the groups because some veterans did not provide their age.
NOTE: This table excludes those veterans for whom there was a proxy respondent.
Race, Ethnicity, and Health Status. Table 5-5 compares health status by race. Veteran self-
assessed health status varies strikingly by race. The highest proportion rating their health as excellent or
very good is found among Asian veterans (49.8 percent), followed by White veterans (46.8 percent). The
biracial American Indian12-White group had the smallest proportion assessing their health as excellent or
very good (32.1 percent), while Black veterans had the second-smallest proportion (35.5 percent). The
proportion reporting their health as fair or poor was highest among American Indian veterans
(35.5 percent), biracial American Indian-White veterans (34.6 percent) and Black veterans (33.6 percent).
This proportion is lowest among White veterans (22.9 percent) and Asian veterans (20.0 percent).
Table 5-6 compares Hispanic 13 and non-Hispanic veterans in terms of their self-reported
health status. Hispanic veterans did not differ from other veterans in terms of the proportion assessing
their health as excellent or very good (45.7 percent vs. 45.6 percent, respectively). About 3 percentage
points more Hispanic veterans assessed their health as fair or poor, compared to non-Hispanic veterans
(27.2 percent vs. 24.1 percent, respectively).
12 This includes veterans who identify as American Indian or Alaska Native. 13 This includes veterans who identified as Spanish, Hispanic, or Latino.
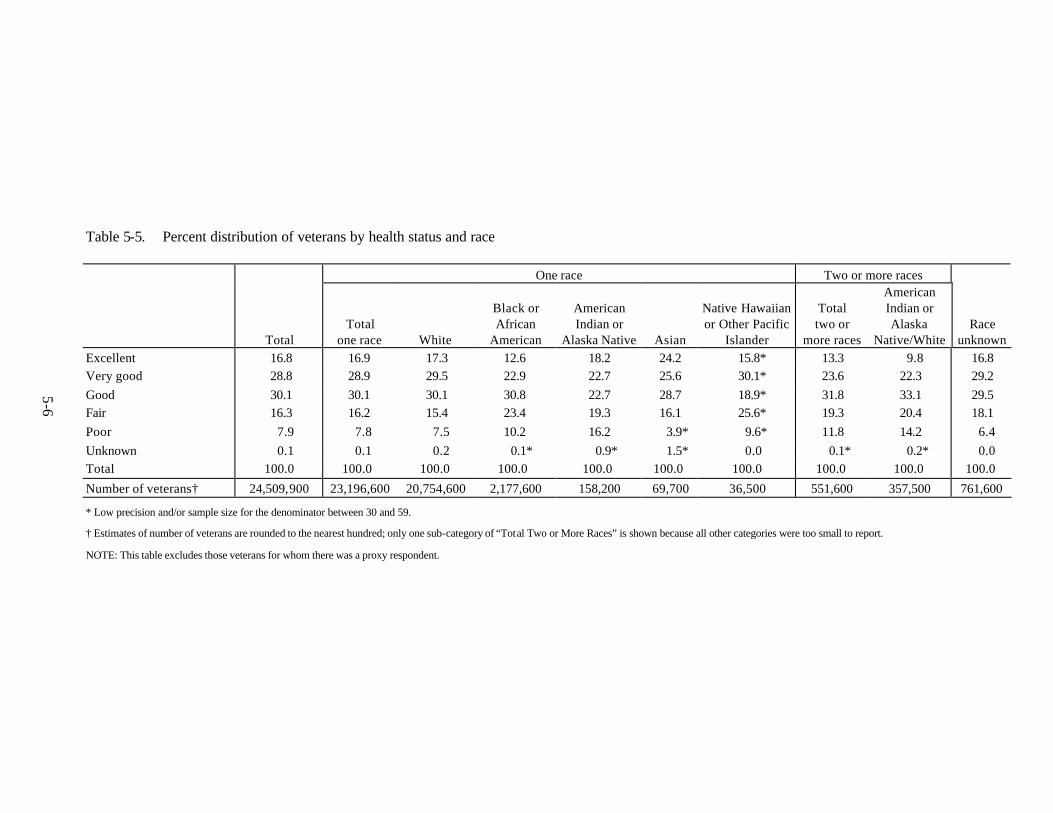
5-6
Table 5-5. Percent distribution of veterans by health status and race
One race Two or more races
Total Total
one race White
Black or African
American
American Indian or
Alaska Native Asian
Native Hawaiian or Other Pacific
Islander
Total two or
more races
American Indian or Alaska
Native/White Race
unknown Excellent 16.8 16.9 17.3 12.6 18.2 24.2 15.8* 13.3 9.8 16.8 Very good 28.8 28.9 29.5 22.9 22.7 25.6 30.1* 23.6 22.3 29.2 Good 30.1 30.1 30.1 30.8 22.7 28.7 18.9* 31.8 33.1 29.5 Fair 16.3 16.2 15.4 23.4 19.3 16.1 25.6* 19.3 20.4 18.1 Poor 7.9 7.8 7.5 10.2 16.2 3.9* 9.6* 11.8 14.2 6.4 Unknown 0.1 0.1 0.2 0.1* 0.9* 1.5* 0.0 0.1* 0.2* 0.0 Total 100.0 100.0 100.0 100.0 100.0 100.0 100.0 100.0 100.0 100.0
Number of veterans† 24,509,900 23,196,600 20,754,600 2,177,600 158,200 69,700 36,500 551,600 357,500 761,600
* Low precision and/or sample size for the denominator between 30 and 59.
† Estimates of number of veterans are rounded to the nearest hundred; only one sub-category of “Total Two or More Races” is shown because all other categories were too small to report.
NOTE: This table excludes those veterans for whom there was a proxy respondent.
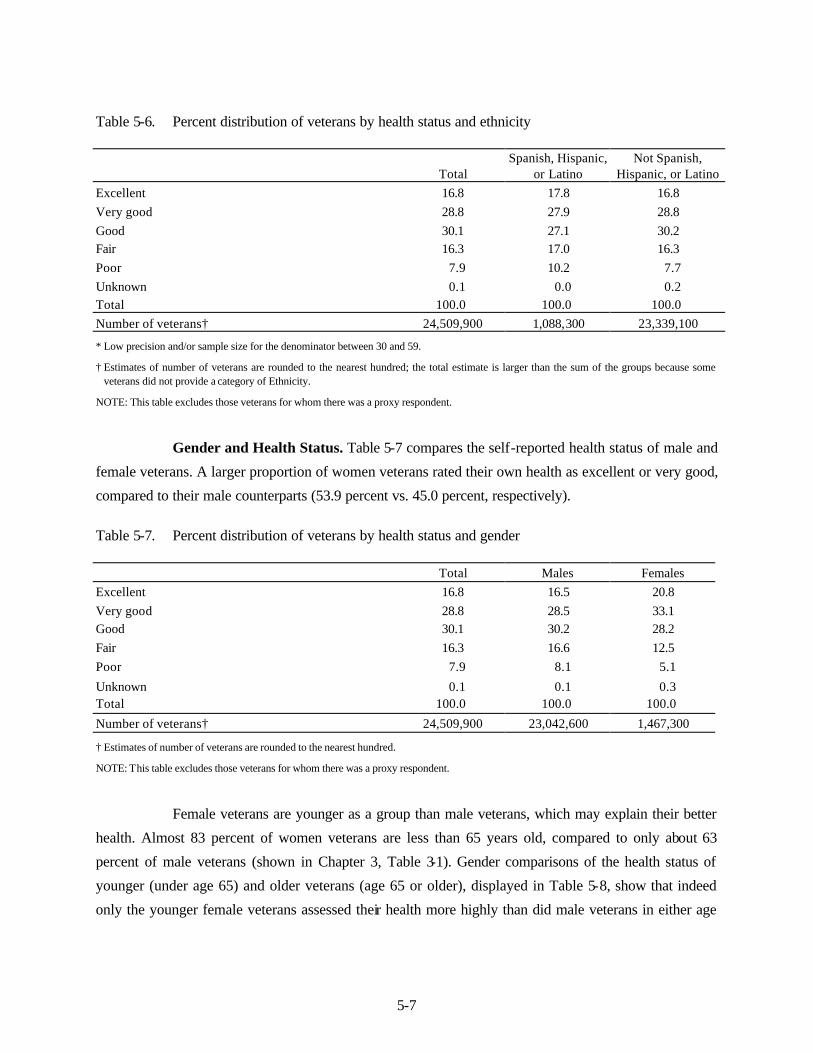
5-7
Table 5-6. Percent distribution of veterans by health status and ethnicity
Total Spanish, Hispanic,
or Latino Not Spanish,
Hispanic, or Latino Excellent 16.8 17.8 16.8 Very good 28.8 27.9 28.8 Good 30.1 27.1 30.2 Fair 16.3 17.0 16.3 Poor 7.9 10.2 7.7 Unknown 0.1 0.0 0.2 Total 100.0 100.0 100.0 Number of veterans† 24,509,900 1,088,300 23,339,100
* Low precision and/or sample size for the denominator between 30 and 59.
† Estimates of number of veterans are rounded to the nearest hundred; the total estimate is larger than the sum of the groups because some veterans did not provide a category of Ethnicity.
NOTE: This table excludes those veterans for whom there was a proxy respondent.
Gender and Health Status. Table 5-7 compares the self-reported health status of male and
female veterans. A larger proportion of women veterans rated their own health as excellent or very good,
compared to their male counterparts (53.9 percent vs. 45.0 percent, respectively).
Table 5-7. Percent distribution of veterans by health status and gender
Total Males Females Excellent 16.8 16.5 20.8 Very good 28.8 28.5 33.1 Good 30.1 30.2 28.2 Fair 16.3 16.6 12.5 Poor 7.9 8.1 5.1
Unknown 0.1 0.1 0.3 Total 100.0 100.0 100.0
Number of veterans† 24,509,900 23,042,600 1,467,300
† Estimates of number of veterans are rounded to the nearest hundred.
NOTE: This table excludes those veterans for whom there was a proxy respondent.
Female veterans are younger as a group than male veterans, which may explain their better
health. Almost 83 percent of women veterans are less than 65 years old, compared to only about 63
percent of male veterans (shown in Chapter 3, Table 3-1). Gender comparisons of the health status of
younger (under age 65) and older veterans (age 65 or older), displayed in Table 5-8, show that indeed
only the younger female veterans assessed their health more highly than did male veterans in either age
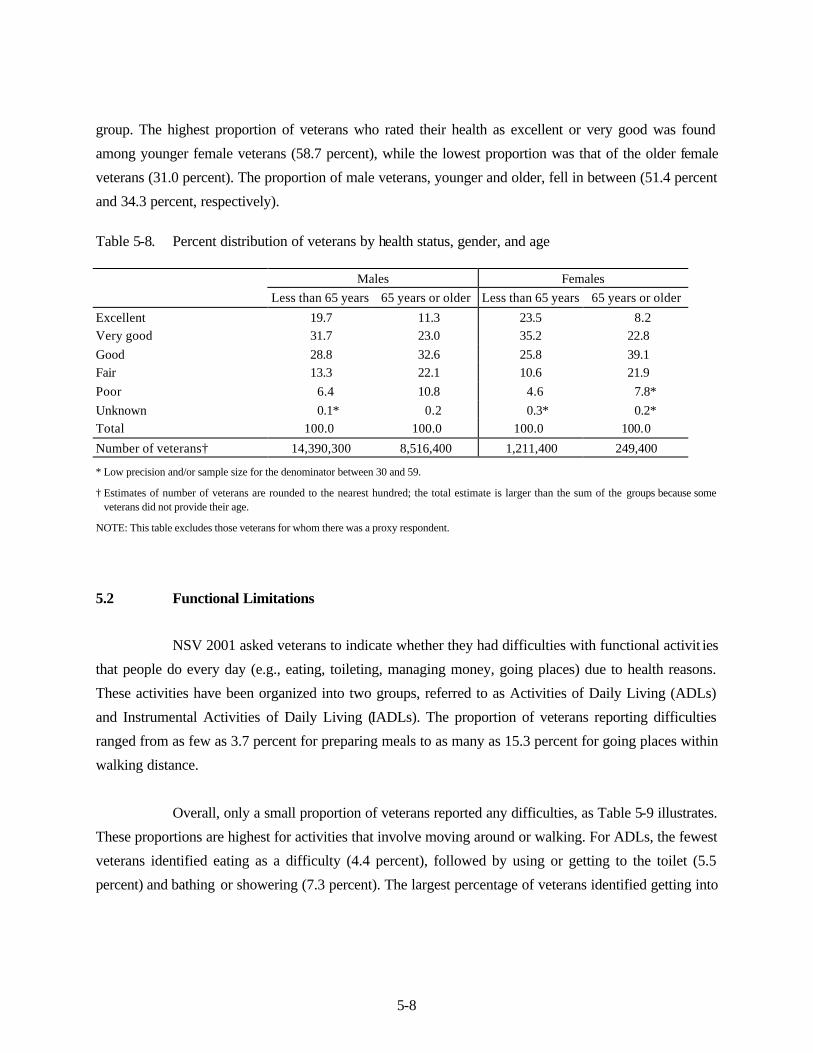
5-8
group. The highest proportion of veterans who rated their health as excellent or very good was found
among younger female veterans (58.7 percent), while the lowest proportion was that of the older female
veterans (31.0 percent). The proportion of male veterans, younger and older, fell in between (51.4 percent
and 34.3 percent, respectively).
Table 5-8. Percent distribution of veterans by health status, gender, and age
Males Females
Less than 65 years 65 years or older Less than 65 years 65 years or older
Excellent 19.7 11.3 23.5 8.2 Very good 31.7 23.0 35.2 22.8 Good 28.8 32.6 25.8 39.1 Fair 13.3 22.1 10.6 21.9 Poor 6.4 10.8 4.6 7.8* Unknown 0.1* 0.2 0.3* 0.2* Total 100.0 100.0 100.0 100.0
Number of veterans† 14,390,300 8,516,400 1,211,400 249,400
* Low precision and/or sample size for the denominator between 30 and 59.
† Estimates of number of veterans are rounded to the nearest hundred; the total estimate is larger than the sum of the groups because some veterans did not provide their age.
NOTE: This table excludes those veterans for whom there was a proxy respondent.
5.2 Functional Limitations
NSV 2001 asked veterans to indicate whether they had difficulties with functional activit ies
that people do every day (e.g., eating, toileting, managing money, going places) due to health reasons.
These activities have been organized into two groups, referred to as Activities of Daily Living (ADLs)
and Instrumental Activities of Daily Living (IADLs). The proportion of veterans reporting difficulties
ranged from as few as 3.7 percent for preparing meals to as many as 15.3 percent for going places within
walking distance.
Overall, only a small proportion of veterans reported any difficulties, as Table 5-9 illustrates.
These proportions are highest for activities that involve moving around or walking. For ADLs, the fewest
veterans identified eating as a difficulty (4.4 percent), followed by using or getting to the toilet (5.5
percent) and bathing or showering (7.3 percent). The largest percentage of veterans identified getting into

5-9
or out of chairs as difficult (14.7 percent), walking across a room (11.4 percent), and controlling bladder
or bowels (10.4 percent).
Table 5-9. Percent distribution of veterans by activities of daily living and instrumental activities of
daily living
ADLs Percent reporting difficulty Eating 4.4 Using the toilet or getting to it 5.5 Bathing or showering 7.3 Getting dressed 9.0 Controlling bladder or bowels 10.4 Walking across a room 11.4 Getting in or out of chairs or bed 14.7
IADLs
Preparing meals 3.7 Managing money, such as paying bills 5.0 Using the telephone 5.2 Doing light housework 7.6 Shopping for personal items 8.5 Shopping for groceries 8.9 Going to places out of walking distance 11.0 Going places within walking distance 15.3
Number of veterans† 25,196,000
† Estimate of number of veterans is rounded to the nearest hundred; percent estimates will not sum to 100 because veterans could indicate more than one category.
In terms of IADLs, the lowest proportion of veterans reported difficulties preparing meals
(3.7 percent), managing money (5.0 percent), and using the telephone (5.2 percent). The highest
proportion had difficulties going places within walking distance (15.3 percent) and going places out of
walking distance (11.0 percent).
To facilitate comparisons of different veterans in terms of their functional limitations, ADLs
and IADLs were collapsed into an overall indicator of the presence and number of ADLs and IADLs.
Difficulties with ADLs are generally considered more limiting than difficulties with IADLs. Table 5-10
indicates that more than two-thirds of veterans (67.2 percent) reported no difficulties with ADLs or
IADLs. Seven point one percent of veterans reported only IADL difficulties, while 16.3 percent had
difficulties with one or two ADLs. Only 9.3 percent reported difficulties with more than two ADLs.
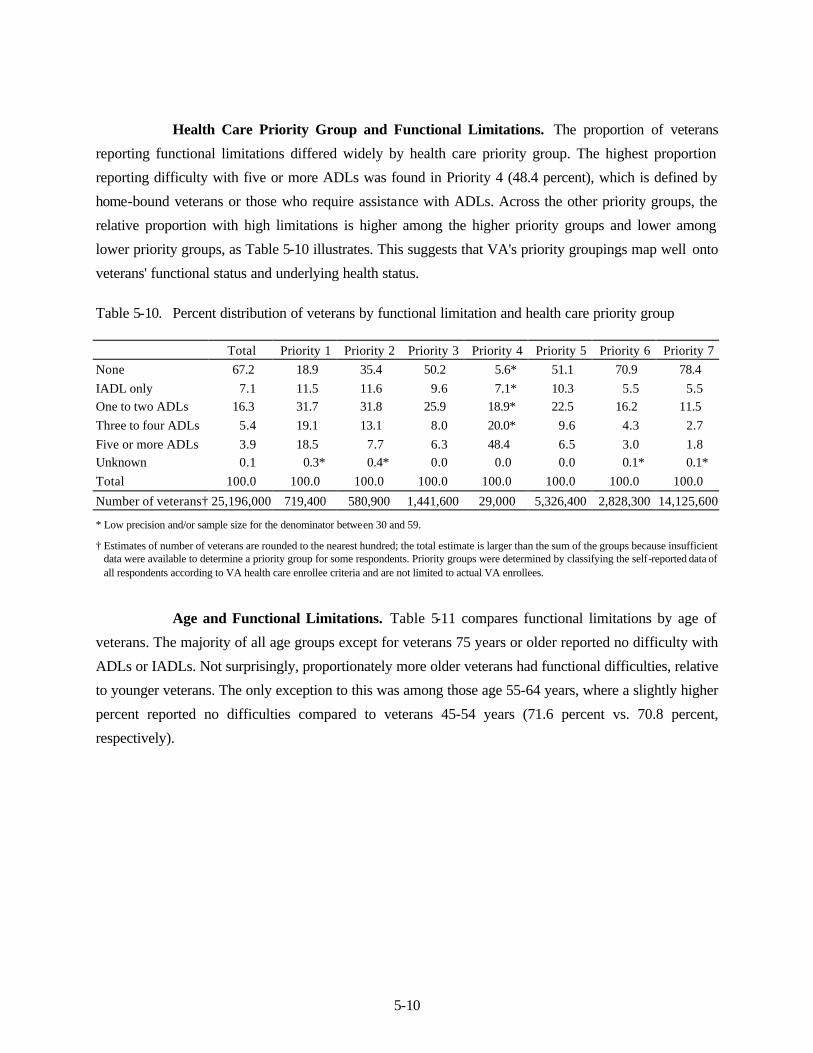
5-10
Health Care Priority Group and Functional Limitations. The proportion of veterans
reporting functional limitations differed widely by health care priority group. The highest proportion
reporting difficulty with five or more ADLs was found in Priority 4 (48.4 percent), which is defined by
home-bound veterans or those who require assistance with ADLs. Across the other priority groups, the
relative proportion with high limitations is higher among the higher priority groups and lower among
lower priority groups, as Table 5-10 illustrates. This suggests that VA's priority groupings map well onto
veterans' functional status and underlying health status.
Table 5-10. Percent distribution of veterans by functional limitation and health care priority group Total Priority 1 Priority 2 Priority 3 Priority 4 Priority 5 Priority 6 Priority 7 None 67.2 18.9 35.4 50.2 5.6* 51.1 70.9 78.4 IADL only 7.1 11.5 11.6 9.6 7.1* 10.3 5.5 5.5 One to two ADLs 16.3 31.7 31.8 25.9 18.9* 22.5 16.2 11.5 Three to four ADLs 5.4 19.1 13.1 8.0 20.0* 9.6 4.3 2.7 Five or more ADLs 3.9 18.5 7.7 6.3 48.4 6.5 3.0 1.8 Unknown 0.1 0.3* 0.4* 0.0 0.0 0.0 0.1* 0.1* Total 100.0 100.0 100.0 100.0 100.0 100.0 100.0 100.0
Number of veterans† 25,196,000 719,400 580,900 1,441,600 29,000 5,326,400 2,828,300 14,125,600
* Low precision and/or sample size for the denominator between 30 and 59.
† Estimates of number of veterans are rounded to the nearest hundred; the total estimate is larger than the sum of the groups because insufficient data were available to determine a priority group for some respondents. Priority groups were determined by classifying the self-reported data of all respondents according to VA health care enrollee criteria and are not limited to actual VA enrollees.
Age and Functional Limitations. Table 5-11 compares functional limitations by age of
veterans. The majority of all age groups except for veterans 75 years or older reported no difficulty with
ADLs or IADLs. Not surprisingly, proportionately more older veterans had functional difficulties, relative
to younger veterans. The only exception to this was among those age 55-64 years, where a slightly higher
percent reported no difficulties compared to veterans 45-54 years (71.6 percent vs. 70.8 percent,
respectively).

5-11
Table 5-11. Percent distribution of veterans by functional limitation and age Total
Less than 35 years 35-44 years 45-54 years 55-64 years 65-74 years
75 years or older
None 67.2 83.7 76.4 70.8 71.6 63.5 45.8 IADL only 7.1 4.5 4.9 5.2 6.2 8.7 11.9 One to two ADLs 16.3 8.9 11.7 14.1 13.8 19.3 25.8 Three to four ADLs 5.4 1.7 3.8 5.6 5.3 5.3 8.6 Five or more ADLs 3.9 1.1 2.9 4.2 3.0 3.2 7.8 Unknown 0.1 0.1* 0.3* 0.1* 0.1* 0.0 0.1 Total 100.0 100.0 100.0 100.0 100.0 100.0 100.0 Number of veterans† 25,196,000 2,288,600 3,030,300 5,415,100 4,946,000 5,256,400 4,116,100
* Low precision and/or sample size for the denominator between 30 and 59.
† Estimates of number of veterans are rounded to the nearest hundred; the total estimate is larger than the sum of the groups because some veterans did not provide their age.
To highlight differences between older and younger veterans, Table 5-12 collapses the age
groups into two categories: under 65 years, and age 65 or older. A smaller proportion of older veterans
had no functional limitations, compared to their younger counterparts.
Table 5-12. Percent distribution of veterans by functional limitation and age (under 65 and 65 or older)
Total Less than 65 years 65 years or older None 67.2 74.0 55.7 IADL only 7.1 5.4 10.1 One to two ADLs 16.3 12.8 22.2 Three to four ADLs 5.4 4.6 6.8 Five or more ADLs 3.9 3.1 5.2 Unknown 0.1 0.1* 0.0 Total 100.0 100.0 100.0 Number of veterans† 25,196,000 15,680,000 9,372,600
* Low precision and/or sample size for the denominator between 30 and 59.
† Estimates of number of veterans are rounded to the nearest hundred; the total estimate is larger than the sum of the groups because some veterans did not provide their age.
Race, Ethnicity, and Functional Limitations. Minor differences in functional status were
found among veterans of different races and ethnicity, as shown in Tables 5-13 and 5-14. White and
Asian veterans had the highest proportion with no functional limitations (68.4 percent and 68.8 percent, respectively), while biracial American Indian-White and American Indian veterans had the lowest
proportions (51.2 percent and 56.4 percent, respectively). About the same proportions reported difficulty
with only IADLs. Twice as many Black, American Indian, and biracial American Indian-White veterans as White veterans (7.6 percent, 7.2 percent, and 7.0 percent vs. 3.4 percent, respectively) reported
difficulties with five or more ADLs; the overall percentage, however, was quite low regardless of race.
Hispanic and non-Hispanic veterans did not differ in terms of functional limitations.

5-12
Table 5-13. Percent distribution of veterans by functional limitation and race
One race Two or more races
Total Total
one race White
Black or African
American
American Indian or Alaska Native Asian
Native Hawaiian or Other Pacific
Islander
Total two or more races
American Indian or Alaska
Native/White Race
unknown None 67.2 67.5 68.4 59.7 56.4 68.8 53.9* 55.2 51.2 67.3 IADL only 7.1 7.0 7.1 6.1 8.6 7.4* 12.3* 9.7 8.8 7.8 One to two ADLs 16.3 16.3 15.9 19.6 20.8 15.6 21.5* 20.1 22.6 13.3 Three to four ADLs 5.4 5.3 5.1 7.0 7.0 3.9* 4.7* 8.8 10.4 7.0 Five or more ADLs 3.9 3.8 3.4 7.6 7.2 2.0* 7.6* 6.2 7.0 4.0 Unknown 0.1 0.1 0.1* 0.0 0.0 2.3* 0.0 0.0 0.0 0.6* Total 100.0 100.0 100.0 100.0 100.0 100.0 100.0 100.0 100.0 100.0 Number of veterans† 25,196,000 23,857,100 21,370,900 2,216,600 159,900 73,200 36,500 557,500 360,800 781,400
* Low precision and/or sample size for the denominator between 30 and 59.
† Estimates of number of veterans are rounded to the nearest hundred; only one sub-category of “Total Two or More Races” is shown because all other categories were too small to report.

5-13
Table 5-14. Percent distribution of veterans by functional limitation and ethnicity
Total
Spanish, Hispanic, or Latino
Not Spanish, Hispanic, or
Latino None 67.2 64.3 67.4 IADL only 7.1 7.1 7.1 One to two ADLs 16.3 16.4 16.3 Three to four ADLs 5.4 7.5 5.3 Five or more ADLs 3.9 4.7 3.8 Unknown 0.1 0.0 0.1 Total 100.0 100.0 100.0
Number of veterans† 25,196,000 1,122,200 23,990,200
* Low precision and/or sample size for the denominator between 30 and 59.
† Estimates of number of veterans are rounded to the nearest hundred; the total estimate is larger than the sum of the groups because some veterans did not provide a category of Ethnicity.
Gender and Functional Limitations. Table 5-15 compares functional limitations of male
and female veterans. Female veterans reported fewer difficulties with ADLs than did male veterans. A
higher percentage of female veterans had no ADL or IADL difficulties, compared to male veterans (70.8
percent vs. 67.0 percent, respectively). Further, a higher percentage of male veterans reported difficulties
with three or more ADLs than did female veterans (9.4 percent vs. 7.6 percent, respectively). The overall
percentage, however, was very low. Since female veterans are, as a group, younger than male veterans,
women's higher functional status is not surprising.
Table 5-15. Percent distribution of veterans by functional limitation and gender Total Males Females
None 67.2 67.0 70.8 IADL only 7.1 7.1 7.3 One to two ADLs 16.3 16.4 13.9 Three to four ADLs 5.4 5.4 4.6 Five or more ADLs 3.9 4.0 3.0 Unknown 0.1 0.1 0.4* Total 100.0 100.0 100.0
Number of veterans† 25,196,000 23,712,400 1,483,600
† Estimates of number of veterans are rounded to the nearest hundred.

5-14
5.3 Health Conditions
In the NSV 2001, veterans were asked to report whether they had received medical treatment
in the past year. They could select from a list of 20 health conditions that included physical problems such
high blood pressure, cancer, and stroke, and emotional problems such as post-traumatic stress disorder
(PTSD) and drug or alcohol abuse. Table 5-16 displays these results.
The proportion of veterans reporting treatment in the past year for one of these health
conditions ranged from 0.3 percent for immune deficiency disease to 55.8 percent for eye or vision
problems. Other common problems mentioned included high blood pressure (34.5 percent), arthritis or
rheumatism (26.8 percent), heart trouble (15.9 percent), and severe chronic pain (15.1 percent). Almost 4
percent (3.8 percent) reported treatment for PTSD, and another 6.2 percent reported treatment for other
mental or emotional problems. Slightly over 1 percent (1.2 percent) reported getting treatment for drug or
alcohol problems.
Health Care Priority Group and Health Conditions. Table 5-16 also displays a
comparison of health care priority groups' responses to health condition treatment in the past year.
Generally speaking, the proportion of veterans reporting treatment for each condition decreased across the
priority groups (with the exception being Priority Group 4). Although the relative proportions of priority
groups reporting medical treatment for any particular problem varied widely, the rank order of problems
was fairly similar across groups. For example, eye or vision problems was the most common problem
across all priority groups, while the proportion with this problem ranged from a high of 76.5 percent of
Priority 1 veterans to a low of 52.7 percent of Priority 7 veterans. Among the five most common
problems for all priority groups were arthritis or rheumatism and high blood pressure. Severe chronic pain
also ranked among the top five problems for all groups except those in Priority 7.
Priority 1 was characterized by relatively high proportions receiving treatment for many
problems. For example, more than half of this group (54.2 percent) received treatment for severe chronic
pain, compared to between 8.8 and 44.6 percent for the other priority groups. Nearly one in three Priority
1 veterans (29.9 percent) received treatment for PTSD, one in four received treatment for another mental
or emotional problem (26.5 percent), and one in four were treated for some other serious condition (24.9
percent).

5-15
Table 5-16. Percent distribution of veterans by health conditions and health care priority group
Total Priority 1 Priority 2 Priority 3 Priority 4 Priority 5 Priority 6 Priority 7 High blood pressure 34.5 47.9 45.7 39.6 44.2 41.7 28.9 31.2 Lung trouble 9.2 20.3 15.3 13.7 27.1* 13.3 11.0 6.0 Hearing condition
that requires a hearing aid
9.3 22.9 18.2 14.8 30.9 12.0 6.3 7.1
Other ear, nose, or throat condition
12.9 27.9 22.0 19.2 29.3 13.6 16.8 10.0
Eye or vision problem, including needing glasses
55.8 76.5 69.0 62.6 62.5 56.7 58.0 52.7
Cancer 7.4 11.3 10.4 9.8 15.3* 9.1 5.8 6.4 Heart trouble 15.9 28.1 25.1 20.1 34.0 22.2 12.2 12.8 Stroke 3.0 6.7 3.3 3.1 17.0* 5.9 1.9 1.9 Kidney or bladder
trouble 10.2 24.4 15.8 14.0 27.6 14.6 8.2 7.5
Arthritis or rheumatism
26.8 54.7 47.3 38.6 48.1 33.1 24.5 21.2
Hepatitis C or other liver disease
1.6 5.7 2.2 2.8 10.6* 2.8 1.7 0.8
Immune deficiency disease like HIV/AIDS
0.3 1.6* 0.2* 0.2* 2.7* 0.4 0.2* 0.2
Diabetes requiring insulin or diet treatment
11.2 17.7 14.9 12.3 22.6 15.7 9.7 9.1
Stomach or digestive disorder
13.0 37.4 25.7 19.4 35.9 15.2 13.9 9.6
Severe chronic pain 15.1 54.2 38.7 27.0 44.6 19.7 15.5 8.8 Drug abuse or
alcoholism 1.2 3.2 1.3 0.9 0.5* 2.6 1.4 0.6
Post-traumatic stress disorder (PTSD)
3.8 29.9 11.8 6.0 13.5* 5.6 4.8 1.0
Other mental or emotional problems
6.2 26.5 12.4 8.3 18.6* 8.7 6.4 3.6
Accident-related injury
8.2 15.6 11.0 11.5 12.8* 9.7 8.9 6.6
Other serious condition
9.4 24.9 17.5 12.5 38.9 11.0 9.8 7.2
No medical treatment mentioned
17.6 1.8 4.4 9.4 1.9* 13.9 17.5 21.3
Number of veterans† 25,196,000 719,400 580,900 1,441,600 29,000 5,326,400 2,828,300 14,125,600 * Low precision and/or sample size for the denominator between 30 and 59.
† Estimates of number of veterans are rounded to the nearest hundred; percent estimates will not sum to 100 because veterans could indicate more than one health condition; the total estimate is larger than the sum of the groups because insufficient data were available to determine a priority group for some respondents.
NOTE: Priority groups were determined by classifying the self-reported data of all respondents according to VA health care enrollee criteria and are not limited to actual VA enrollees.

5-16
Age and Health Conditions. Table 5-17 compares health problems by age. Veterans of
different ages also varied in the kinds of health problems for which they received treatment. Some
problems become more prevalent with age (e.g., eye and vision problems, high blood pressure, arthritis or
rheumatism). A few problems become le ss prevalent with age (e.g., accident-related injury, hepatitis C or
other liver disease), while some were more prevalent among the middle age groups (e.g., PTSD, mental or
emotional problems).
Table 5-17. Percent distribution of veterans by health conditions and age
Total
Less than 35 years
35-44 years
45-54 years
55-64 years
65-74 years
75 years or older
High blood pressure 34.5 4.8 13.8 27.7 39.0 49.1 51.7 Lung trouble 9.2 4.5 5.4 8.0 7.8 11.6 15.0 Hearing condition that
requires a hearing aid 9.3 0.5* 1.4 3.6 6.6 13.5 25.2
Other ear, nose, or throat condition
12.9 12.0 13.4 13.6 13.0 11.9 13.3
Eye or vision problem, including needing glasses
55.8 28.7 37.2 58.5 58.3 63.6 68.4
Cancer 7.4 0.8* 1.4 2.9 6.5 11.9 16.6 Heart trouble 15.9 2.5 4.9 8.9 15.1 24.1 31.6 Stroke 3.0 0.3* 0.6 1.5 2.4 4.8 7.0 Kidney or bladder trouble 10.2 2.4 5.1 7.4 9.0 12.5 20.3 Arthritis or rheumatism 26.8 6.6 13.3 24.3 27.7 34.3 40.6 Hepatitis C or other liver
disease 1.6 0.3* 1.7 3.2 1.3 1.2 1.2
Immune deficiency disease like HIV/AIDS
0.3 0.3* 0.5* 0.4 0.1* 0.2* 0.2*
Diabetes requiring insulin or diet treatment
11.2 0.8* 2.8 8.2 13.6 17.4 16.1
Stomach or digestive disorder
13.0 7.1 11.4 14.4 13.4 13.2 15.2
Severe chronic pain 15.1 10.0 16.1 17.9 15.9 13.0 15.3 Drug abuse or alcoholism 1.2 1.3 2.9 2.2 0.7 0.4 0.4* Post-traumatic stress
disorder (PTSD) 3.8 2.4 3.9 7.1 3.7 1.6 2.8
Other mental or emotional problems
6.2 6.2 9.9 9.2 4.9 2.9 5.2
Accident-related injury 8.2 11.3 12.7 11.5 6.8 4.3 5.5 Other serious condition 9.4 5.8 8.1 10.0 9.5 8.8 12.2 No medical treatment
mentioned 17.6 44.3 32.3 17.7 14.7 9.6 5.2
Number of veterans† 25,196,000 2,288,600 3,030,300 5,415,100 4,946,000 5,256,400 4,116,100 * Low precision and/or sample size for the denominator between 30 and 59.
† Estimates of number of veterans are rounded to the nearest hundred; the total estimate is larger than the sum of the groups because some veterans did not provide their age; percent estimates will not sum to 100 because veterans could indicate more than one health condition.

5-17
To highlight young-old age differences, Table 5-18 compares these results among veterans
under 65 years and those 65 years or older. The three most prevalent problems were the same for both
groups, (i.e., eye or vision problems, high blood pressure, and arthritis or rheumatism), although the
relative frequency for each was higher in the older age group.
Table 5-18. Percent distribution of veterans by health conditions and age (under 65 and 65 or older)
Total
Less than 65 years
65 years or older
High blood pressure 34.5 25.3 50.2 Lung trouble 9.2 6.9 13.1 Hearing condition that requires a hearing aid 9.3 3.7 18.6 Other ear, nose, or throat condition 12.9 13.1 12.5 Eye or vision problem, including needing glasses 55.8 50.0 65.7 Cancer 7.4 3.4 14.0 Heart trouble 15.9 9.1 27.4 Stroke 3.0 1.4 5.7 Kidney or bladder trouble 10.2 6.7 15.9 Arthritis or rheumatism 26.8 20.7 37.1 Hepatitis C or other liver disease 1.6 1.9 1.2 Immune deficiency disease like HIV/AIDS 0.3 0.3 0.2* Diabetes requiring insulin or diet treatment 11.2 7.8 16.8 Stomach or digestive disorder 13.0 12.4 14.1 Severe chronic pain 15.1 15.7 14.0 Drug abuse or alcoholism 1.2 1.7 0.4 Post-traumatic stress disorder (PTSD) 3.8 4.7 2.2 Other mental or emotional problems 6.2 7.5 3.9 Accident-related injury 8.2 10.2 4.8 Other serious condition 9.4 8.9 10.2 No medical treatment mentioned 17.6 23.5 7.7 Number of veterans† 25,196,000 15,680,000 9,372,600 * Low precision and/or sample size for the denominator between 30 and 59. † Estimates of number of veterans are rounded to the nearest hundred; the total estimate is larger than the sum of the groups because some
veterans did not provide their age; percent estimates will not sum to 100 because veterans could indicate more than one health condition.
Race, Ethnicity, and Health Conditions. Table 5-19 compares health conditions of
veterans of different races. Across all racial groups, eye or vision problems, high blood pressure, and
arthritis or rheumatism are the three most prevalent problems. Proportionately more White, Asian, and
biracial American Indian-White veterans reported vision problems (56.4 percent, 61.3 percent, and 57.1
percent, respectively), while more Black veterans reported high blood pressure (41.2 percent). Black
veterans were also the only racial group to have diabetes among their top five problems. However, a
higher percentage of American Indian veterans reported having diabetes (14.7 percent) than did Black
veterans (13.4 percent).

5-18
Table 5-19. Percent distribution of veterans by health conditions and race One race Two or more races
Total Total
one race White
Black or African
American
American Indian or
Alaska Native Asian
Native Hawaiian or Other Pacific
Islander
Total two or
more races
American Indian or Alaska
Native/White Race
unknown High blood pressure 34.5 34.8 34.2 41.2 31.2 29.0 26.3* 32.6 36.2 26.6 Lung trouble 9.2 9.2 9.5 7.1 12.3 6.9* 1.9* 12.8 14.7 6.6 Hearing condition that requires a
hearing aid 9.3 9.4 9.9 4.3 8.3 8.7* 2.9* 8.2 9.2 7.0 Other ear, nose, or throat
condition 12.9 12.9 13.0 11.5 16.6 8.5 14.7* 15.6 17.8 11.6 Eye or vision problem, including
needing glasses 55.8 55.8 56.4 49.8 50.1 61.3 69.4* 55.0 57.1 55.4 Cancer 7.4 7.5 7.7 5.7 5.7 2.8* 2.0* 7.7 10.5 3.3 Heart trouble 15.9 16.0 16.5 11.6 13.4 15.7 11.3* 19.6 19.5 10.1 Stroke 3.0 3.1 3.0 3.7 2.0* 0.9* 0.0 4.5 4.9 1.1* Kidney or bladder trouble 10.2 10.2 10.1 10.8 12.1 9.2* 6.3* 13.4 16.1 7.8 Arthritis or rheumatism 26.8 26.7 26.5 28.5 27.9 23.8 20.5* 32.2 36.4 25.4 Hepatitis C or other liver disease 1.6 1.6 1.5 2.0 3.6* 5.0* 7.6* 3.2 2.8 1.8* Immune deficiency disease like
HIV/AIDS 0.3 0.3 0.2 0.6 0.0 0.0 0.3* 0.4* 0.4* 0.2* Diabetes requiring insulin or diet
treatment 11.2 11.0 10.8 13.4 14.7 7.5* 15.5* 11.3 14.1 14.7 Stomach or digestive disorder 13.0 12.9 13.0 12.7 14.5 5.3* 17.4* 16.4 19.5 13.9 Severe chronic pain 15.1 14.8 14.3 20.0 23.2 5.2* 16.7* 26.0 30.8 14.4 Drug abuse or alcoholism 1.2 1.2 1.0 3.1 3.2* 0.0 9.1* 2.0 2.4 1.4* Post-traumatic stress disorder
(PTSD) 3.8 3.6 3.2 7.4 8.6 2.2* 8.0* 7.8 9.0 5.5 Other mental or emotional
problems 6.2 6.1 5.9 7.8 8.1 2.8* 4.1* 9.0 11.7 6.3 Accident-related injury 8.2 7.9 7.7 9.4 12.3 7.5* 14.7* 14.7 13.7 13.4 Other serious condition 9.4 9.4 9.3 10.2 7.0 6.2* 14.8* 12.0 12.8 6.6 No medical treatment mentioned 17.6 17.5 17.1 20.9 27.5 16.9 19.8* 18.4 14.1 19.9 Number of veterans† 25,196,000 23,857,100 21,370,900 2,216,600 159,900 73,200 36,500 557,500 360,800 781,400 * Low precision and/or sample size for the denominator between 30 and 59. † Estimates of number of veterans are rounded to the nearest hundred; only one sub-category of “Total Two or More Races” is shown because all other categories were too small to report; percent estimates will
not sum to 100 because veterans could indicate more than one health condition.
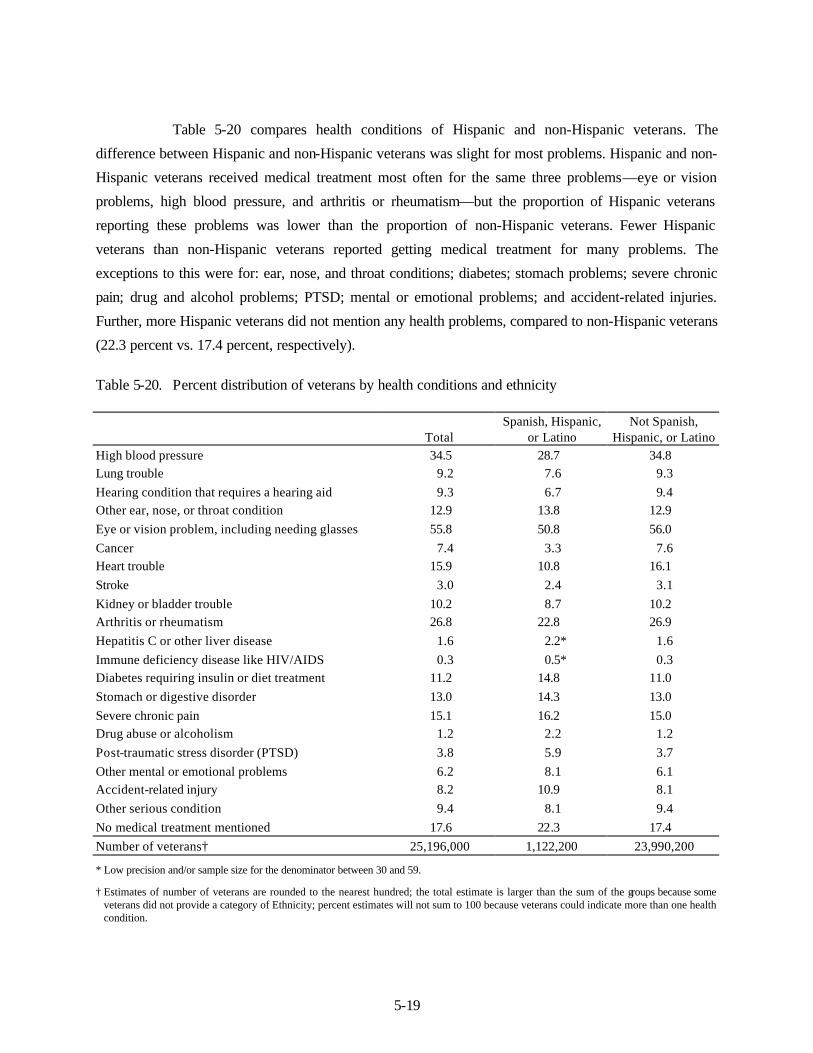
5-19
Table 5-20 compares health conditions of Hispanic and non-Hispanic veterans. The
difference between Hispanic and non-Hispanic veterans was slight for most problems. Hispanic and non-
Hispanic veterans received medical treatment most often for the same three problems—eye or vision
problems, high blood pressure, and arthritis or rheumatism—but the proportion of Hispanic veterans
reporting these problems was lower than the proportion of non-Hispanic veterans. Fewer Hispanic
veterans than non-Hispanic veterans reported getting medical treatment for many problems. The
exceptions to this were for: ear, nose, and throat conditions; diabetes; stomach problems; severe chronic
pain; drug and alcohol problems; PTSD; mental or emotional problems; and accident-related injuries.
Further, more Hispanic veterans did not mention any health problems, compared to non-Hispanic veterans
(22.3 percent vs. 17.4 percent, respectively).
Table 5-20. Percent distribution of veterans by health conditions and ethnicity
Total
Spanish, Hispanic, or Latino
Not Spanish, Hispanic, or Latino
High blood pressure 34.5 28.7 34.8 Lung trouble 9.2 7.6 9.3 Hearing condition that requires a hearing aid 9.3 6.7 9.4 Other ear, nose, or throat condition 12.9 13.8 12.9 Eye or vision problem, including needing glasses 55.8 50.8 56.0 Cancer 7.4 3.3 7.6 Heart trouble 15.9 10.8 16.1 Stroke 3.0 2.4 3.1 Kidney or bladder trouble 10.2 8.7 10.2 Arthritis or rheumatism 26.8 22.8 26.9 Hepatitis C or other liver disease 1.6 2.2* 1.6 Immune deficiency disease like HIV/AIDS 0.3 0.5* 0.3 Diabetes requiring insulin or diet treatment 11.2 14.8 11.0 Stomach or digestive disorder 13.0 14.3 13.0 Severe chronic pain 15.1 16.2 15.0 Drug abuse or alcoholism 1.2 2.2 1.2 Post-traumatic stress disorder (PTSD) 3.8 5.9 3.7 Other mental or emotional problems 6.2 8.1 6.1 Accident-related injury 8.2 10.9 8.1 Other serious condition 9.4 8.1 9.4 No medical treatment mentioned 17.6 22.3 17.4 Number of veterans† 25,196,000 1,122,200 23,990,200
* Low precision and/or sample size for the denominator between 30 and 59.
† Estimates of number of veterans are rounded to the nearest hundred; the total estimate is larger than the sum of the groups because some veterans did not provide a category of Ethnicity; percent estimates will not sum to 100 because veterans could indicate more than one health condition.

5-20
Gender and Health Conditions. Male and female veterans differed in some respects in
terms of the health conditions for which they received medical treatment, as Table 5-21 illustrates. For
veterans of both genders, eye and vision problems were the most prevalent condition. For some other
conditions, men and women veterans differed greatly. About twice as many male veterans as female
veterans received treatment for high blood pressure (35.5 percent vs. 18.6 percent, respectively). Men
were also more likely than women to report heart trouble (16.3 percent vs. 9.6 percent, respectively). As
noted earlier, the younger age of female veterans as a group likely contributes to these differences.
Female veterans were more likely than their male counterparts to report severe chronic pain (18.7 percent
vs. 14.8 percent). Female veterans were also slightly more likely to report no medical treatment in the past
year (19.4 percent vs. 17.5 percent, respectively).
Table 5-21. Percent distribution of veterans by health conditions and gender
Total Males Females High blood pressure 34.5 35.5 18.6 Lung trouble 9.2 9.2 9.1 Hearing condition that requires a hearing aid 9.3 9.7 3.1 Other ear, nose, or throat condition 12.9 12.6 17.8 Eye or vision problem, including needing glasses 55.8 55.8 55.4 Cancer 7.4 7.6 3.3 Heart trouble 15.9 16.3 9.6 Stroke 3.0 3.1 1.5 Kidney or bladder trouble 10.2 10.1 10.8 Arthritis or rheumatism 26.8 26.9 24.0 Hepatitis C or other liver disease 1.6 1.6 1.5 Immune deficiency disease like HIV/AIDS 0.3 0.3 0.3* Diabetes requiring insulin or diet treatment 11.2 11.5 6.3 Stomach or digestive disorder 13.0 13.0 13.5 Severe chronic pain 15.1 14.8 18.7 Drug abuse or alcoholism 1.2 1.3 0.8* Post-traumatic stress disorder (PTSD) 3.8 3.8 3.9 Other mental or emotional problems 6.2 5.7 14.3 Accident-related injury 8.2 8.1 10.0 Other serious condition 9.4 9.2 11.8 No medical treatment mentioned 17.6 17.5 19.4 Unknown 0.2 0.2 0.2*
Number of veterans† 25,196,000 23,712,400 1,483,600
* Low precision and/or sample size for the denominator between 30 and 59.
† Estimates of number of veterans are rounded to the nearest hundred; percent estimates will not sum to 100 because veterans could indicate more than one health condition.

6-1
6. HEALTH CARE
This chapter discusses results from the NSV 2001 on use of health care services. The NSV
collected information about veterans’ current health insurance plans or programs, including Medicare (Part
A, Part B); Medicare managed care; HMO; Medigap/Medicare supplemental health insurance; Medicaid
(Medi-Cal); CHAMPUS; TRICARE; other government health care programs; or private health insurance.
Information was also collected on veterans’ use of VA and non-VA health care services within the past 12
months. These included emergency room use, outpatient care (number of visits), and inpatient care
(number of overnights hospitalized). Additionally, NSV collected data on how services were paid for
(CHAMPUS/TRICARE, HMO, Medicare, private health insurance, VA). If VA health care benefits had
not been used in the past year or were not used, veterans were asked why they did not use them.
The Veterans Health Administration (VHA) is the nation’s largest integrated health care
system. The VHA mission is to serve the needs of America’s veterans by providing primary care,
specialized care, and related medical and social support services. VHA employs approximately 180,000
health care professionals at 163 hospitals, more than 800 community and facility-based clinics, 135
nursing homes, 43 domiciliaries, 206 readjustment counseling centers, and various other facilities.
Historically, VA’s health care has been provided through a hospital-based delivery system. However, in
recent years VHA restructured health care delivery to emphasize managed care through an extended
network of community-based clinics and ambulatory care units.
Demographic trends indicate that VHA will continue to face the challenge of providing
efficient and effective long-term care and geriatric services to an aging veteran population over the next
decade. The percentage of older veterans is increasing as the percentage of younger veterans is declining.
6.1 Health Insurance Coverage
As seen in Table 6-1, veterans report having a number of health insurance coverage types.
These types fall into the following five major modes:
n Medicare,
n Medigap or Medicare supplemental,
n CHAMPUS or TRICARE,
6-2
n Other government-provided health service plans, and
n Private insurance.
Some veterans report more than one type of coverage. For example, some report coverage by
both Medicare and a supplemental Medigap plan.14 The table also shows subsets of coverage within these
major modes of coverage, such as Medicare Part A only and Part B only coverage. Nearly two out of
three veterans (63.0 percent) report coverage by some form of private insurance, either non-HMO (37.2
percent) or HMO (25.8 percent), while more than one out of three (39.3 percent) report some form of
Medicare. Another type reported frequently was Medigap or Medicare Supplemental insurance (18.0
percent). Ten percent of veterans did not mention any insurance coverage.
Health Care Priority Group and Health Insurance Coverage. Table 6-1 also compares
priority groups in terms of their insurance coverage. The pattern of coverage varies by priority group. A
larger percentage of veterans in Priority 1, 4, and 5 report Medicare coverage than report private
coverage. The reverse is found among Priority 2, 3, 6, and 7, where more veterans report coverage in
private plans than in Medicare.
Age and Health Insurance Coverage. Health insurance varies by age group, as shown in
Table 6-2. For example, the proportion of veterans reporting Medicare coverage increases across the age
groups, while the proportion of veterans with private health insurance decreases. The percentage of
veterans reporting no insurance coverage also decreased as the age of veterans increased. Other types are
mentioned by proportionately more veterans in the middle age groups, compared to oldest and youngest
age groups (e.g., CHAMPUS or TRICARE).
Medicare eligibility criteria effectively separates the types of coverage reported by the age of
veterans. More than 95 percent of veterans age 65 and older (96.0 percent) report Medicare coverage,
while only 5.5 percent of veterans under 65 do so. Table 6-3 displays comparisons of health insurance
coverage by veteran age, with age divided into less than 65 years and 65 years or older. Nearly three-
quarters of younger veterans (74.7 percent) report some form of private medical insurance, compared to
only 43.3 percent of older veterans. Younger veterans also reported no insurance coverage more
frequently than older veterans (15.3 percent versus 1.0 percent, respectively).
14 In a small number of cases, veterans did not report coverage by one of the major modes of coverage such as private insurance
but did report coverage by one of the major mode subtypes of coverage such as a private HMO.

6-3
Table 6-1. Percent distribution of veterans by type of insurance and health care priority group Total Priority 1 Priority 2 Priority 3 Priority 4 Priority 5 Priority 6 Priority 7 Medicare 39.3 47.1 36.5 38.2 75.0 57.1 19.7 36.2 Medicare managed care or
Medicare HMO 11.0 8.7 9.7 10.1 9.0* 17.0 6.1 10.1 Medicare Part A for hospital care
only 2.4 6.0 2.5 2.1 7.9* 4.2 1.3 1.8 Medicare Part B for visits to doctor
offices only 1.0 1.3 0.9 0.9 5.7* 1.9 0.4* 0.8 Both Medicare Part A and Part B 24.2 28.0 22.8 24.5 52.8 32.9 11.4 23.2 Medigap or Medicare Supplement
health insurance plan 18.0 13.8 16.2 18.3 23.3* 23.1 8.5 18.1 Medicaid/Medi-Cal 3.5 3.1 3.2 3.4 13.4* 14.6 0.0 0.0 CHAMPUS or TRICARE 7.1 24.0 30.2 20.6 1.6* 3.3 10.9 4.6 Other government-provided health
insurance or health service plan 3.5 8.2 9.5 6.1 1.7* 2.9 3.6 3.0 Private Non-HMO 37.2 23.7 28.6 33.5 3.7* 24.2 40.4 43.0 Private HMO 25.8 11.3 19.5 23.1 1.3* 13.1 35.6 30.1 No insurance coverage mentioned 10.0 17.7 11.3 10.9 15.4 19.1 8.5 6.2 Unknown 0.4 1.2 0.8* 0.4* 3.5* 0.7 0.2* 0.2 Number of veterans† 25,196,000 719,400 580,900 1,441,600 29,000 5,326,400 2,828,300 14,125,600
* Low precision and/or sample size for the denominator between 30 and 59.
† Estimates of number of veterans are rounded to the nearest hundred; the total estimate is larger than the sum of the groups because insufficient data were available to determine a priority group for some respondents; percent estimates will not sum to 100 because veterans could indicate more than one type of insurance.
NOTE: Priority groups were determined by classifying the self-reported data of all respondents according to VA health care enrollee criteria and are not limited to actual VA enrollees.

6-4
Table 6-2. Percent distribution of veterans by type of insurance and age
Total Less than 35 years
35-44 years
45-54 years
55-64 years
65-74 years
75 years or older
Medicare 39.3 1.1* 3.6 6.2 8.0 95.5 96.6 Medicare managed care or
Medicare HMO 11.0 0.8* 1.1 1.9 1.8 27.5 26.3 Medicare Part A for hospital
care only 2.4 0.0 0.5* 0.6 0.7 6.3 4.7 Medicare Part B for visits to
doctor offices only 1.0 0.0 0.2* 0.2 0.2* 2.2 2.7 Both Medicare Part A and
Part B 24.2 0.2* 1.6 2.9 4.8 58.6 61.4 Medigap or Medicare
Supplement health insurance plan 18.0 0.4* 0.5* 0.5 1.7 43.0 51.3
Medicaid/Medi-Cal 3.5 1.3 1.6 2.1 1.7 7.3 5.4 CHAMPUS or TRICARE 7.1 4.5 9.6 8.9 9.9 5.4 3.4 Other government-provided
health insurance or health service plan 3.5 2.3 3.5 3.7 3.5 4.0 3.4
Private Non-HMO 37.2 36.7 37.1 37.9 43.4 34.3 32.8 Private HMO 25.8 35.2 36.5 35.8 34.4 11.3 7.6 No insurance coverage
mentioned 10.0 22.1 16.0 15.5 11.6 1.0 1.0 Unknown 0.4 0.8* 0.5 0.7 0.2* 0.1* 0.2*
Number of veterans† 25,196,000 2,288,600 3,030,300 5,415,100 4,946,000 5,256,400 4,116,100
* Low precision and/or sample size for the denominator between 30 and 59.
† Estimates of number of veterans are rounded to the nearest hundred; the total estimate is larger than the sum of the groups because some veterans did not provide their age; percent estimates will not sum to 100 because veterans could indicate more than one type of insurance.

6-5
Table 6-3. Percent distribution of veterans by type of insurance and age (under 65 and 65 or older)
Total Less than 65 years
65 years or older
Medicare 39.3 5.5 96.0 Medicare managed care or Medicare HMO 11.0 1.5 27.0 Medicare Part A for hospital care only 2.4 0.5 5.6 Medicare Part B for visits to doctor offices only 1.0 0.2 2.4 Both Medicare Part A and Part B 24.2 2.9 59.8 Medigap or Medicare Supplement health insurance plan 18.0 0.9 46.7 Medicaid/Medi-Cal 3.5 1.7 6.5 CHAMPUS or TRICARE 7.1 8.7 4.5 Other government-provided health insurance or health service plan 3.5 3.4 3.7 Private non-HMO 37.2 39.3 33.6 Private HMO 25.8 35.4 9.7 No insurance coverage mentioned 10.0 15.3 1.0 Unknown 0.4 0.5 0.1* Number of veterans† 25,196,000 15,680,000 9,372,600
* Low precision and/or sample size for the denominator between 30 and 59.
† Estimates of number of veterans are rounded to the nearest hundred; the total estimate is larger than the sum of the groups because some veterans did not provide their age; percent estimates will not sum to 100 because veterans could indicate more than one type of health insurance.
Race, Ethnicity, and Health Insurance Coverage. Table 6-4 reports insurance coverage by race. A larger proportion of White veterans are covered by Medicare, compared to veterans of other races.
This is not surprising, since White veterans are older as a group, compared to other races. White veterans
also more frequently report having some type of private insurance than do veterans of other races, although this difference is less striking. Asian veterans reported the highest percentage of CHAMPUS or
TRICARE coverage (17.9 percent), relative to other veterans. Proportionately more Black, biracial
American Indian-White, American Indian, and Asian veterans did not mention any insurance coverage (17.6 percent, 16.3 percent, 15.7 percent, and 14.7 percent, respectively) than did White veterans (8.6
percent).
Table 6-5 compares insurance coverage for Hispanic and non-Hispanic veterans. The
percentage of Hispanic veterans reporting Medicare coverage is nearly half that of non-Hispanic veterans
(23.2 percent vs. 40.0 percent, respectively). Slightly fewer Hispanic veterans reported private non-HMO insurance coverage, relative to non-Hispanic veterans (30.4 percent vs. 37.5 percent, respectively), but
more Hispanic veterans reported having private HMO coverage (30.1 percent of Hispanic vs. 25.6 percent
of non-Hispanic veterans). More Hispanic veterans did not mention any insurance coverage, compared to non-Hispanic veterans (19.0 percent vs. 9.6 percent, respectively).

6-6
Table 6-4. Percent distribution of veterans by type of insurance and race
One race Two or more races
Total Total
one race White
Black or African
American
American Indian or
Alaska Native Asian
Native Hawaiian or Other Pacific
Islander
Total two or
more races
American Indian or Alaska
Native/White Race
unknown Medicare 39.3 40.1 41.5 28.4 23.5 29.4 27.3* 29.0 33.4 22.0 Medicare managed care or
Medicare HMO 11.0 11.2 11.3 10.0 7.7* 10.1 17.7* 8.6 9.5 8.4 Medicare Part A for
hospital care only 2.4 2.4 2.4 2.6 1.7* 5.3* 3.1* 3.0 3.3 1.6* Medicare Part B for visits
to doctor offices only 1.0 1.0 1.0 1.9 0.6* 0.9* 0.0 1.2* 1.3* 0.5* Both Medicare Part A
and Part B 24.2 24.8 26.2 13.0 13.1 11.4* 6.5* 15.4 18.5 10.8 Medigap or Medicare
Supplement health insurance plan 18.0 18.5 19.7 8.0 4.7 12.6 4.7* 8.4 10.2 8.9
Medicaid/Medi-Cal 3.5 3.5 3.1 6.9 4.8* 5.0* 5.6* 3.4* 2.6 2.9 CHAMPUS or TRICARE 7.1 7.1 6.8 8.7 9.3 17.9 10.5* 9.4 9.3 7.3 Other government-
provided health insurance or health service plan 3.5 3.4 3.3 4.0 15.4 9.2* 1.0* 8.0 7.3 2.7
Private Non-HMO 37.2 37.5 39.0 25.3 28.2 27.6 8.4* 32.9 33.1 30.5 Private HMO 25.8 25.6 24.8 33.1 32.1 30.4 41.2* 26.8 21.8 30.4 Percent distribution of
veterans by No insurance coverage
mentioned 10.0 9.5 8.6 17.6 15.7 14.7 20.3* 15.5 16.3 18.5 Unknown 0.4 0.3 0.3 0.5* 1.3* 1.4* 0.0* 1.1* 1.3* 1.2* Number of veterans† 25,196,000 23,857,100 21,370,900 2,216,600 159,900 73,200 36,500 557,500 360,800 781,400 * Low precision and/or sample size for the denominator between 30 and 59.
† Estimates of number of veterans are rounded to the nearest hundred; percent estimates will not sum to 100 because veterans could indicate more than one type of health insurance.

6-7
Table 6-5. Percent distribution of veterans by type of insurance and ethnicity
Total Spanish, Hispanic,
or Latino Not Spanish,
Hispanic, or Latino Medicare 39.3 23.2 40.0 Medicare managed care or Medicare HMO 11.0 9.7 11.1 Medicare Part A for hospital care only 2.4 1.6* 2.5 Medicare Part B for visits to doctor offices only 1.0 0.3* 1.1 Both Medicare Part A and Part B 24.2 10.7 24.8 Medigap or Medicare Supplement health insurance plan 18.0 7.3 18.4 Medicaid/Medi-Cal 3.5 3.6 3.5 CHAMPUS or TRICARE 7.1 5.9 7.2 Other government-provided health insurance or health
service plan 3.5 2.3 3.6 Private Non-HMO 37.2 30.4 37.5 Private HMO 25.8 30.1 25.6 No insurance coverage mentioned 10.0 19.0 9.6 Unknown 0.4 1.1* 0.4 Number of veterans† 25,196,000 1,122,200 23,990,200
* Low precision and/or sample size for the denominator between 30 and 59.
† Estimates of number of veterans are rounded to the nearest hundred; the total estimate is larger than the sum of the groups because some veterans did not provide a cat egory of Ethnicity; percent estimates will not sum to 100 because veterans could indicate more than one type of health insurance.
6.2 Health Care Received in the Past Year
Veterans were asked to indicate types of health care they had received in the past 12 months.
Veterans could mention more than one type of health care received in the previous 12 months, so columns
may not sum to 100 percent. As Table 6-6, displays, the most frequently mentioned type of health care
was for prescriptions; more than three in four veterans (76.7 percent) received this type of care in the past
12 months. Also frequently mentioned were outpatient care (74.1 percent), prostheses (including hearing
aids and eyeglasses) (24.6 percent), and emergency room care (23.4 percent).

6-8
Health Care Priority Group and Health Care Received in the Past Year. Table 6-6 also
displays results that compare health care priority groups in the kinds of medical treatment they received in
the past 12 months. Tables include all veterans who reported their medical treatment in the past year, not
just veterans enrolled in the national health care enrollment system (see Chapter 5 introduction for further
explanation). Prescription services are the most commonly mentioned type across all priority groups.
Outpatient care ranges from a low of 69.4 percent for Priority 5 veterans to a high of 86.6 percent for
Priority 1 veterans. The incidence of prescription services ranges from 74.2 percent for Priority 7 to 96.4
percent for Priority 4.
The proportion of veterans reporting emergency room and inpatient care varies considerably
by priority group. The highest reported rates of emergency room and inpatient care are for veterans in
Priority 4 (61.2 percent and 59.6 percent, respectively). Veterans in Priority 4 also report the highest
incidence of in-home health care (26.6 percent) and prosthetic services (39.6 percent). Since these
veterans are classified into Priority 4 because they are permanently house-bound or catastrophically
disabled, these findings are not surprising.
The lowest percentage of emergency room care and inpatient care is found among veterans
in Priority 7 (19.0 percent and 11.7 percent). Veterans in Priority 6 also report relatively low incidences of
emergency room and inpatient care.
Age and Heath Care Received in the Past Year. Table 6-7 compares health care received
in the past 12 months by age group of veterans. Some types of health care varied consistently by age. The
proportion of veterans reporting outpatient and inpatient services, prescription services, in-home health
care, and prostheses increased across the age groups. For example, only 7.2 percent of veterans under 35
years of age reported inpatient care in the past 12 months while 24.1 percent of veterans 75 years or older
reported inpatient care. Conversely, psychiatric treatment or counseling is reported by a smaller
percentage of older veterans.
Table 6-8 displays age comparisons of health care received in the past 12 months for two
groups of veterans, those under age 65 and those age 65 or older. Across all health care types,
proportionately more older veterans reported receiving such care, compared to younger veterans. The
only exceptions to this are for psychiatric treatment or counseling and treatment for environmental
hazard.

6-9
Table 6-6. Percent distribution of veterans by type of care and health care priority group Total Priority 1 Priority 2 Priority 3 Priority 4 Priority 5 Priority 6 Priority 7 Emergency room 23.4 43.9 33.6 29.2 61.2 30.0 21.8 19.0 Outpatient 74.1 86.6 86.1 83.5 81.8 69.4 76.3 73.4 Inpatient 14.3 28.5 20.9 16.1 59.6 19.2 12.0 11.7 Prescriptions 76.7 95.1 91.7 86.4 96.4 77.3 75.6 74.2 Treatment for environmental hazard 1.6 12.7 7.0 3.2 11.5* 1.6 4.3 0.0 Psychiatric treatment/ counseling 6.7 32.9 14.1 9.5 10.5 9.0 7.6 3.7 In-home health care 3.8 9.5 4.8 5.1 26.6 6.1 2.7 2.6 Prostheses 24.6 51.4 37.5 32.6 39.6 22.3 26.1 22.4 Number of veterans† 25,196,000 719,400 580,900 1,441,600 29,000 5,326,400 2,828,300 14,125,600
* Low precision and/or sample size for the denominator between 30 and 59.
† Estimates of number of veterans are rounded to the nearest hundred; the total estimate is larger than the sum of the groups because insufficient data were available to determine a priority group for some respondents; percent estimates will not sum to 100 because veterans could indicate more than one type of health care.
NOTE: Priority groups were determined by classifying the self-reported data of all respondents according to VA health care enrollee criteria and are not limited to actual VA enrollees.

6-10
Table 6-7. Percent distribution of veterans by type of care and age
Total Less than 35 years
35-44 years
45-54 years
55-64 years
65-74 years
75 years or older
Emergency room 23.4 23.0 25.9 23.4 18.8 22.3 29.1 Outpatient 74.1 59.7 68.1 71.3 76.6 80.4 79.4 Inpatient 14.3 7.2 7.9 10.8 12.8 18.5 24.1 Prescriptions 76.7 57.4 66.3 73.7 79.2 84.0 87.0 Treatment for environmental hazard 1.6 0.9* 1.2 2.7 1.8 1.2 1.0 Psychiatric treatment/counseling 6.7 8.9 10.6 11.4 5.8 2.7 2.5 In-home health care 3.8 1.1* 1.7 2.4 2.3 4.9 8.9 Prostheses 24.6 13.8 16.8 26.0 26.4 26.9 30.0 Number of veterans† 25,196,000 2,288,600 3,030,300 5,415,100 4,946,000 5,256,400 4,116,100
* Low precision and/or sample size for the denominator between 30 and 59.
† Estimates of number of veterans are rounded to the nearest hundred; the total estimate is larger than the sum of the groups because some veterans did not provide their age; percent estimates will not sum to 100 because veterans could indicate more than one type of health care.
Table 6-8. Percent distribution of veterans by type of care and age (under 65 and 65 or older) Total Less than 65 years 65 years or older Emergency room 23.4 22.4 25.3 Outpatient 74.1 70.6 79.9 Inpatient 14.3 10.3 21.0 Prescriptions 76.7 71.7 85.3 Treatment for environmental hazard 1.6 1.9 1.1 Psychiatric treatment/counseling 6.7 9.1 2.7 In-home health care 3.8 2.1 6.7 Prostheses 24.6 22.6 28.3 Number of veterans† 25,196,000 15,680,000 9,372,600
* Low precision and/or sample size for the denominator between 30 and 59.
† Estimates of number of veterans are rounded to the nearest hundred; the total estimate is larger than the sum of the groups because some veterans did not provide their age; percent estimates will not sum to 100 because veterans could indicate more than one type of health care.
Race, Ethnicity, and Health Care Received in the Past Year. Differences in type of health care received were found among veterans of different races and ethnicity, as shown in Tables 6-9 and 6-
10. Compared to all other races, White veterans had the highest percentage of outpatient care and a high
percentage of prosthetic use. Black veterans reported a high percentage of emergency room use, compared to others. American Indian veterans had the highest percentage of inpatient services use and a
high proportion of psychiatric treatment or counseling services use. Biracial American Indian-White
veterans reported high percentages using outpatient services and the highest percentage of emergency room services, prescription services, psychiatric treatment or counseling and prosthetic use of all racial
groups. Compared to non-Hispanic veterans, proportionately fewer Hispanic veterans reported receiving
all types of health care, except emergency room, treatment for environmental hazard, psychiatric, and in-home health care. For these four, slightly more Hispanic veterans reported their use, relative to non-
Hispanic veterans.

6-11
Table 6-9. Percent distribution of veterans by type of care and race
One race Two or more races
Total Total
one race White
Black or African
American American Indian or Alaska Native Asian
Native Hawaiian or Other Pacific
Islander
Total two or
more races
American Indian or
Alaska Native/ White
Race unknown
Emergency room 23.4 23.0 22.3 30.2 25.7 17.4 27.0* 32.4 33.3 28.1 Outpatient 74.1 74.4 75.2 68.3 63.2 65.1 61.2* 72.1 73.9 64.4 Inpatient 14.3 14.4 14.3 15.7 18.5 8.7* 8.9* 14.1 15.7 10.1 Prescriptions 76.7 77.1 77.4 75.2 70.3 65.4 60.0* 76.7 81.4 65.7 Treatment for environmental hazard
1.6 1.6 1.4 2.6 3.4* 4.3* 1.6* 3.3 3.2 1.5*
Psychiatric treatment/ counseling
6.7 6.5 6.2 9.3 11.9 2.6* 5.7* 13.0 14.4 8.1
In-home health care 3.8 3.7 3.6 4.9 3.7* 0.5* 12.8* 5.3 4.7 3.0 Prostheses 24.6 24.8 25.2 21.0 22.9 19.8 19.3* 24.0 26.4 20.4
Number of veterans† 25,196,000 23,857,100 21,370,900 2,216,600 159,900 73,200 36,500 557,500 360,800 781,400
* Low precision and/or sample size for the denominator between 30 and 59.
† Estimates of number of veterans are rounded to the nearest hundred; percent estimates will not sum to 100 because veterans could indicate more than one type of health care.

6-12
Table 6-10. Percent distribution of veterans by type of care and ethnicity
Total Spanish, Hispanic,
or Latino Not Spanish,
Hispanic, or Latino Emergency room 23.4 25.7 23.3 Outpatient 74.1 62.9 74.6 Inpatient 14.3 9.6 14.5 Prescriptions 76.7 67.7 77.1 Treatment for environmental hazard 1.6 2.1 1.6 Psychiatric treatment/counseling 6.7 7.7 6.6 In-home health care 3.8 3.9 3.8 Prostheses 24.6 18.4 24.9 Number of veterans† 25,196,000 1,122,200 23,990,200
* Low precision and/or sample size for the denominator between 30 and 59.
† Estimates of number of veterans are rounded to the nearest hundred; the total estimate is larger than the sum of the groups because some veterans did not provide a category of Ethnicity; percent estimates will not sum to 100 because veterans could indicate more than one type of health care.
6.3 Sources of Health Care
Veterans were asked to indicate whether VA provided the health care they received in the
past 12 months. A classification of health care source was constructed from survey responses as VA care
only, non-VA care only, and use of both VA and non-VA. As Table 6-11 displays, more than three-
quarters of veterans (76.6 percent) used only non-VA health care in the past year. Seven point four
percent used VA only, while 16.0 percent used both VA and non-VA health care.
Health Care Priority Group and Source of Care. Table 6-11 also compares source of
health care received in the past year by priority group. Usage patterns vary considerably by priority group.
For example, well over half of the veterans in Priority Groups 1, 2, and 4 received their care either
exclusively from VA or from VA plus non-VA sources (82.0, 57.1, and 79.1 percent, respectively). By
contrast, over 80 percent of veterans in Priority 6 and 7 report only receiving non-VA care (86.3 and 88.1
percent, respectively).
Age and Source of Care. Table 6-12 compares type of veteran health care received in the past
12 months by age group of veterans. Results show that regardless of age, the proportion of veterans who use
VA health care only is very low, between 5.6 and 8.4 percent. The proportion of veterans using both VA
and non-VA sources increases across age groups, except among the 55-64 age group.

6-13
Table 6-11. Percent distribution of veterans by source of care and health care priority group Total Priority 1 Priority 2 Priority 3 Priority 4 Priority 5 Priority 6 Priority 7
Use of VA health care only 7.4 30.4 18.6 12.0 33.1 15.5 3.4 2.6 Use of non-VA health care only 76.6 18.0 42.9 57.8 20.9* 60.8 86.3 88.1 Use of both VA and non-VA health
care 16.0 51.6 38.5 30.2 46.0 23.7 10.3 9.3 Total 100.0 100.0 100.0 100.0 100.0 100.0 100.0 100.0 Number of veterans† 22,223,200 707,100 557,400 1,353,900 28,200 4,695,600 2,453,800 12,317,500
* Low precision and/or sample size for the denominator between 30 and 59.
† Estimates of number of veterans are rounded to the nearest hundred; the total estimate is larger than the sum of the groups because insufficient data were available to determine a priority group for some respondents; percent estimates will not sum to 100 because veterans could indicate more than one type of health care.
NOTE: Priority groups were determined by classifying the self-reported data of all respondents according to VA health care enrollee criteria and are not limited to actual VA enrollees.
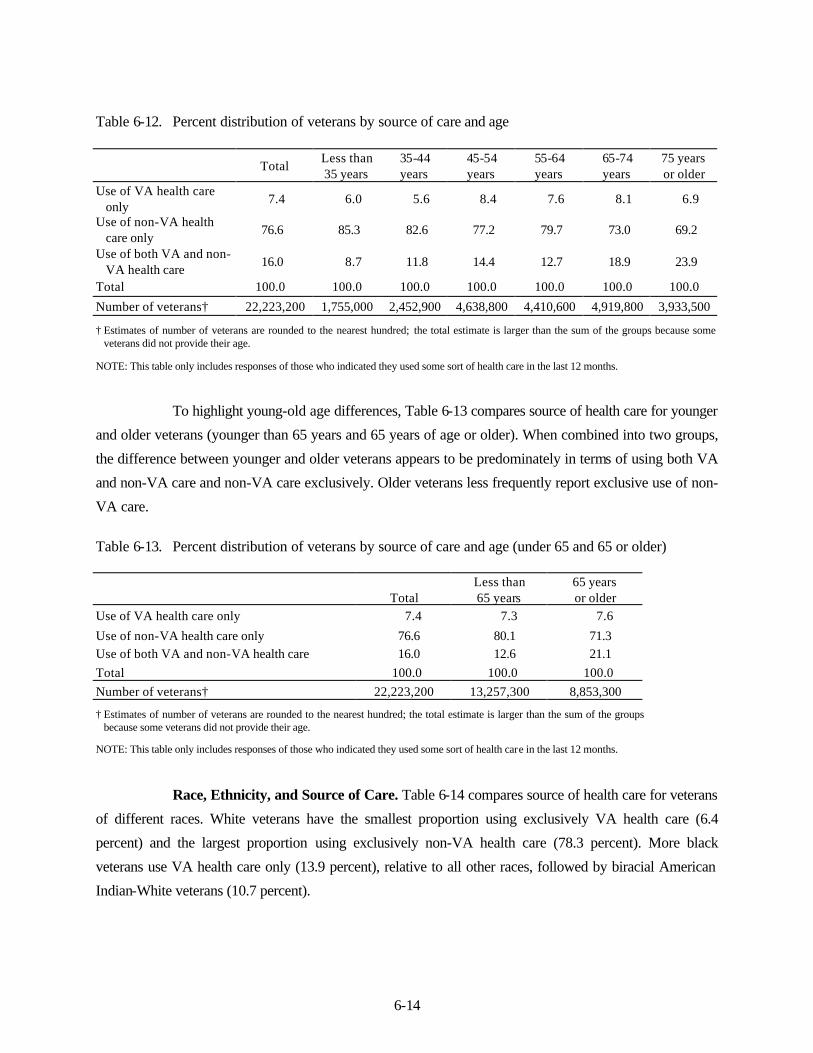
6-14
Table 6-12. Percent distribution of veterans by source of care and age
Total Less than 35 years
35-44 years
45-54 years
55-64 years
65-74 years
75 years or older
Use of VA health care only
7.4 6.0 5.6 8.4 7.6 8.1 6.9
Use of non-VA health care only
76.6 85.3 82.6 77.2 79.7 73.0 69.2
Use of both VA and non-VA health care
16.0 8.7 11.8 14.4 12.7 18.9 23.9
Total 100.0 100.0 100.0 100.0 100.0 100.0 100.0
Number of veterans† 22,223,200 1,755,000 2,452,900 4,638,800 4,410,600 4,919,800 3,933,500
† Estimates of number of veterans are rounded to the nearest hundred; the total estimate is larger than the sum of the groups because some veterans did not provide their age.
NOTE: This table only includes responses of those who indicated they used some sort of health care in the last 12 months.
To highlight young-old age differences, Table 6-13 compares source of health care for younger
and older veterans (younger than 65 years and 65 years of age or older). When combined into two groups,
the difference between younger and older veterans appears to be predominately in terms of using both VA
and non-VA care and non-VA care exclusively. Older veterans less frequently report exclusive use of non-
VA care.
Table 6-13. Percent distribution of veterans by source of care and age (under 65 and 65 or older)
Total Less than 65 years
65 years or older
Use of VA health care only 7.4 7.3 7.6
Use of non-VA health care only 76.6 80.1 71.3 Use of both VA and non-VA health care 16.0 12.6 21.1 Total 100.0 100.0 100.0 Number of veterans† 22,223,200 13,257,300 8,853,300
† Estimates of number of veterans are rounded to the nearest hundred; the total estimate is larger than the sum of the groups because some veterans did not provide their age.
NOTE: This table only includes responses of those who indicated they used some sort of health care in the last 12 months.
Race, Ethnicity, and Source of Care. Table 6-14 compares source of health care for veterans
of different races. White veterans have the smallest proportion using exclusively VA health care (6.4
percent) and the largest proportion using exclusively non-VA health care (78.3 percent). More black
veterans use VA health care only (13.9 percent), relative to all other races, followed by biracial American
Indian-White veterans (10.7 percent).

6-15
Table 6-14. Percent distribution of veterans by source of care and race
One race Two or more races
Total Total
one race White
Black or African
American American Indian or Alaska Native Asian
Native Hawaiian or Other Pacific
Islander
Total two or
more races
American Indian or Alaska
Native/White Race
unknown Use of VA health care only 7.4 7.1 6.4 13.9 9.7 9.0* 10.6* 12.6 10.7 12.0 Use of non-VA health care
only 76.6 77.0 78.3 64.3 70.5 71.9 72.4* 65.2 67.1 73.2
Use of both VA and non-VA health care
16.0 15.9 15.3 21.8 19.8 19.1 17.0* 22.2 22.2 14.8
Total 100.0 100.0 100.0 100.0 100.0 100.0 100.0 100.0 100.0 100.0
Number of veterans† 22,223,200 21,112,000 18,987,700 1,910,600 131,100 56,400 26,200 477,200 316,600 634,000
* Low precision and/or sample size for the denominator between 30 and 59.
† Estimates of number of veterans are rounded to the nearest hundred.
NOTE: This table only includes responses of those who indicated they used some sort of health care in the last 12 months.
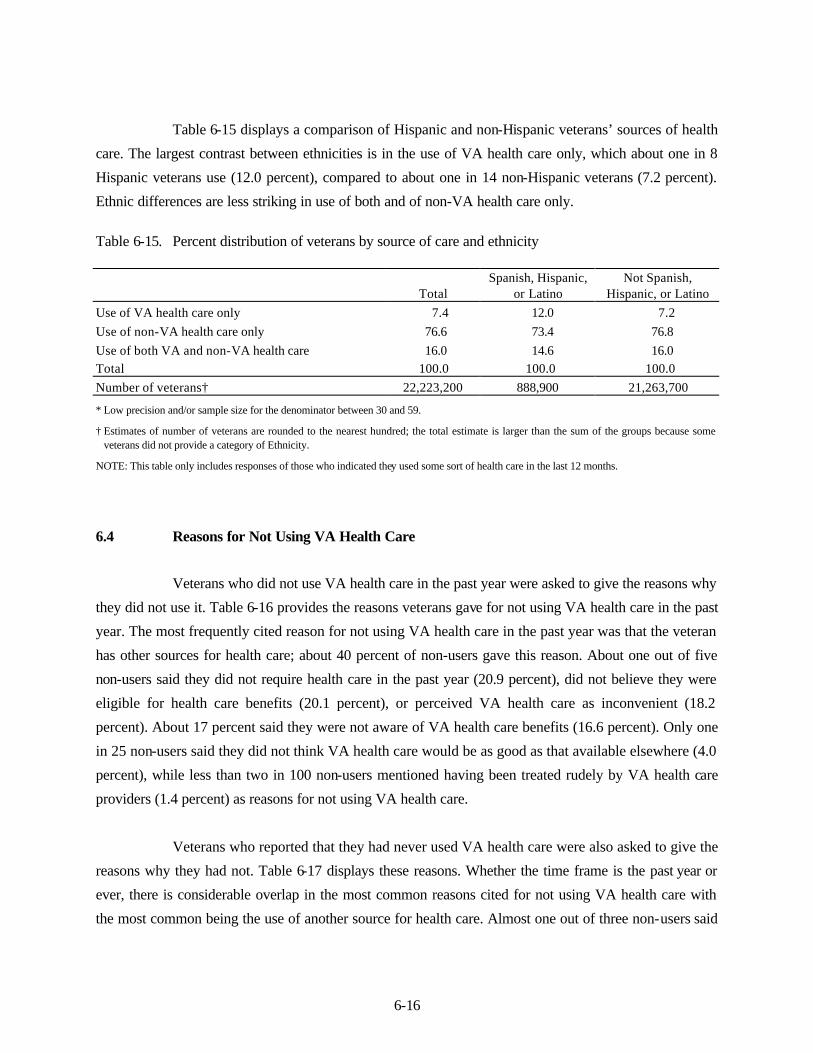
6-16
Table 6-15 displays a comparison of Hispanic and non-Hispanic veterans’ sources of health
care. The largest contrast between ethnicities is in the use of VA health care only, which about one in 8
Hispanic veterans use (12.0 percent), compared to about one in 14 non-Hispanic veterans (7.2 percent).
Ethnic differences are less striking in use of both and of non-VA health care only.
Table 6-15. Percent distribution of veterans by source of care and ethnicity
Total Spanish, Hispanic,
or Latino Not Spanish,
Hispanic, or Latino Use of VA health care only 7.4 12.0 7.2 Use of non-VA health care only 76.6 73.4 76.8 Use of both VA and non-VA health care 16.0 14.6 16.0 Total 100.0 100.0 100.0 Number of veterans† 22,223,200 888,900 21,263,700
* Low precision and/or sample size for the denominator between 30 and 59.
† Estimates of number of veterans are rounded to the nearest hundred; the total estimate is larger than the sum of the groups because some veterans did not provide a category of Ethnicity.
NOTE: This table only includes responses of those who indicated they used some sort of health care in the last 12 months.
6.4 Reasons for Not Using VA Health Care
Veterans who did not use VA health care in the past year were asked to give the reasons why
they did not use it. Table 6-16 provides the reasons veterans gave for not using VA health care in the past
year. The most frequently cited reason for not using VA health care in the past year was that the veteran
has other sources for health care; about 40 percent of non-users gave this reason. About one out of five
non-users said they did not require health care in the past year (20.9 percent), did not believe they were
eligible for health care benefits (20.1 percent), or perceived VA health care as inconvenient (18.2
percent). About 17 percent said they were not aware of VA health care benefits (16.6 percent). Only one
in 25 non-users said they did not think VA health care would be as good as that available elsewhere (4.0
percent), while less than two in 100 non-users mentioned having been treated rudely by VA health care
providers (1.4 percent) as reasons for not using VA health care.
Veterans who reported that they had never used VA health care were also asked to give the
reasons why they had not. Table 6-17 displays these reasons. Whether the time frame is the past year or
ever, there is considerable overlap in the most common reasons cited for not using VA health care with
the most common being the use of another source for health care. Almost one out of three non-users said

6-17
they had other sources for health care (31.8 percent), while nearly one in four said they did not need
health care (23.7 percent). About one in five veterans said they were not aware of VA health care benefits
(21.6 percent) or they did not believe they were eligible for VA health care (20.4 percent). The least
commonly mentioned reasons were: did not think VA health care would be as good as that available
elsewhere (3.1 percent); too much trouble or red tape in the application process (3.0 percent); and did not
know how to apply (2.3 percent).
Table 6-16. Percent distribution of veterans by reasons veterans did not use VA health care in past 12
months Total Uses other sources for health care 40.2 Did not need any care 20.9 Did not believe self entitled or eligible for health care benefits 20.1 VA care is inconvenient 18.2 Not aware of the VA health care benefits 16.6 Other 10.7 Did not need or want assistance from the VA 7.8 Never considered getting any health care from the VA 5.4 Didn’t think VA health care would be as good as that available elsewhere 4.0 Applying for health care benefits too much trouble or red tape 3.5 Did not know how to apply for health care benefits 2.1 Treated rudely in past 1.4 Unknown 0.4 Number of veterans† 19,978,000
† Estimate of number of veterans is rounded to the nearest hundred;. percent estimates will not add to 100 because veterans could indicate more than one reason;
NOTE: This table only includes responses of those who indicated they had not used VA health care during the past 12 months

6-18
Table 6-17. Percent distribution of veterans by reasons veterans never used VA health care Total Uses other sources for health care 31.8 Did not need any care 23.7 Not aware of the VA health care benefits 21.6 Did not believe self entitled or eligible for health care benefits 20.4 VA care is inconvenient 13.3 Other 9.5 Did not need or want assistance from the VA 8.0 Never considered getting any health care from the VA 5.1 Didn’t think VA health care would be as good as that available elsewhere 3.1 Applying for health care benefits too much trouble or red tape 3.0 Did not know how to apply for health care benefits 2.3 Number of veterans† 16,396,700
† Estimate of number of veterans is rounded to the nearest hundred; percent estimates will not sum to more than 100 because veterans could indicate more than one reason.
NOTE: This table only includes responses of those who indicated they had never used VA health care.

7-1
7. VETERAN BENEFITS ADMINISTRATION PROGRAMS
The Veteran Benefits Administration (VBA) continues a tradition of providing benefits and
services to the veteran population that began with the establishment of the first pension program for
veterans in 1789. 15 Currently, VBA provides a wide range of education and income benefits and services
to veterans through 58 VA regional offices. Benefits and services are provided by VBA in the following
areas: disability compensation and pension, education, home loans, vocational rehabilitation and
employment, and life insurance.
These five program areas are the focus of this chapter. For each area, survey data about
program use, helpfulness of these programs from the veterans’ perspectives, and veteran awareness and
understanding of the programs are reported.
7.1 VA Disability Compensation and Pension Programs
In general, eligible veterans may receive two types of monetary benefits for disability, which
include service-connected disability compensation and pension funds. Disability compensation is a
monetary benefit paid to veterans with service-connected disabilities. VA pension programs provide
income support to veterans and survivors (with wartime service) for a nonservice-connected disability or
death. Disability pension programs, which serve veterans and survivors who are experiencing financial
hardship, are means tested.16
Applying for Disability Benefits. Veterans who said they had a disabling condition were
asked whether they had ever applied for disability benefits from VA. Those who said they had applied
were asked the status of their most recent claim application. If they had not applied for benefits, veterans
were asked the main reasons why they had not. Self-reported disabled veterans were also asked whether
they agreed with the statement that getting VA disability benefits was easy. These results are displayed in
Tables 7-1 though 7-6. This analysis is restricted to veterans who indicated they had a disabling condition
or who refused or did not know the answer to that question. Veterans without a disabling condition who
15VA History in Brief 16Veterans Benefits Administration Annual Benefits Report for Fiscal Year 2001

7-2
indicated they had a service-connected disability rating (or who refused or did not know the answer to
that question) were also asked these questions but their responses are not included in these tables.
More than 8 million veterans reported having a disabling condition (32.1 percent of the
veteran population), as Table 7-1 displays. Table 7-2 illustrates that, among veterans with disabling
conditions, 43.1 percent (3.5 million) indicated the condition was service-related. An additional 5.4
percent were unsure whether their condit ion was service-related. Almost 14 percent, or roughly 3.5
million veterans, reported they had received a service-connected disability rating. This latter number
includes veterans who did not report that they had a disabling condition as well as those who did.
Table 7-1. Percent distribution of veterans with self-reported
disabilities and disability ratings Total Disabling condition 32.1 Disability rating 13.8 Number of veterans† 25,196,000
† Estimate of number of veterans is rounded to the nearest hundred. Table 7-2. Percent distribution of veterans with self-reported
disabilities by self-reported service-related disabilities
Total Service-related 43.1
Not service-related 51.5 Unsure 5.4 Total 100.0 Number of veterans† 8,089,000
† Estimate of number of veterans is rounded to the nearest hundred.
NOTE: This table only includes responses of those who indicated they had a disabling condition.
Table 7-3 indicates that, among the approximately 8.1 million veterans with a self-reported
disabling condition, 43.5 percent stated that they had applied for VA disability benefits. Of those who had
applied, 61 percent said that their most recent application had been approved (Table 7-4). The youngest
cohort of veterans was most likely to be in process with their applications (25.4 percent) while the oldest
cohort of veterans was most likely to have had their most recent application denied (24.8 percent).

7-3
Table 7-3. Percent distribution of veterans with self-reported disabilities by application for disability benefits and age
Total Less than 35 years
35-44 years
45-54 years
55-64 years
65-74 years
75 years or older
Applied 43.5 65.7 55.6 58.2 40.4 31.5 34.7
Never applied 56.1 34.3 44.2 41.5 59.2 68.0 64.6 Unknown 0.4 0.0 0.2* 0.3* 0.4* 0.5* 0.7* Total 100.0 100.0 100.0 100.0 100.0 100.0 100.0 Number of veterans† 8,089,000 392,100 727,200 1,739,400 1,507,300 1,785,000 1,904,600
* Low precision and/or sample size for the denominator between 30 and 59.
† Estimates of number of veterans are rounded to the nearest hundred; the total estimate is larger than the sum of the groups because some veterans did not provide their age.
NOTE: This table only includes responses from those veterans who indicated they had a disabling condition.
Table 7-4. Percent distribution of veterans by status of most recent claim application and age group
among those who have applied for disability benefits
Total Less than 35 Years
35-44 years
45-54 years
55-64 years
65-74 years
75 years or older
Approved 61.0 54.9 64.7 62.3 61.6 59.4 60.6 Waiting for decision from
VA regional office 12.6 19.3 13.2 12.2 13.9 12.5 8.9 Waiting for decision about
appeal 4.0 6.1 5.0 4.5 5.0 3.1 1.5* Denied 18.8 16.2 14.3 17.4 15.6 22.3 24.8 Unknown 3.6 3.5* 2.8* 3.6 3.9 2.7 4.2 Total 100.0 100.0 100.0 100.0 100.0 100.0 100.0 Number of veterans† 3,520,400 257,500 404,300 1,011,400 608,700 562,600 661,100
* Low precision and/or sample size for the denominator between 30 and 59.
† Estimates of number of veterans are rounded to the nearest hundred; the total estimate is larger than the sum of the groups because some veterans did not provide their age.
NOTE: This table only includes responses of those who indicated they had applied for VA disability benefits and who indicated they had a disabling condition.
Veterans with a self-reported disabling condition who did not apply for disability benefits
most frequently gave the following reasons for not applying:
§ Didn’t think was entitled or eligible (40.6 percent);
§ Didn’t need the assistance (22.7 percent); and
§ Not aware of VA service-connected disability program (12.7 percent).
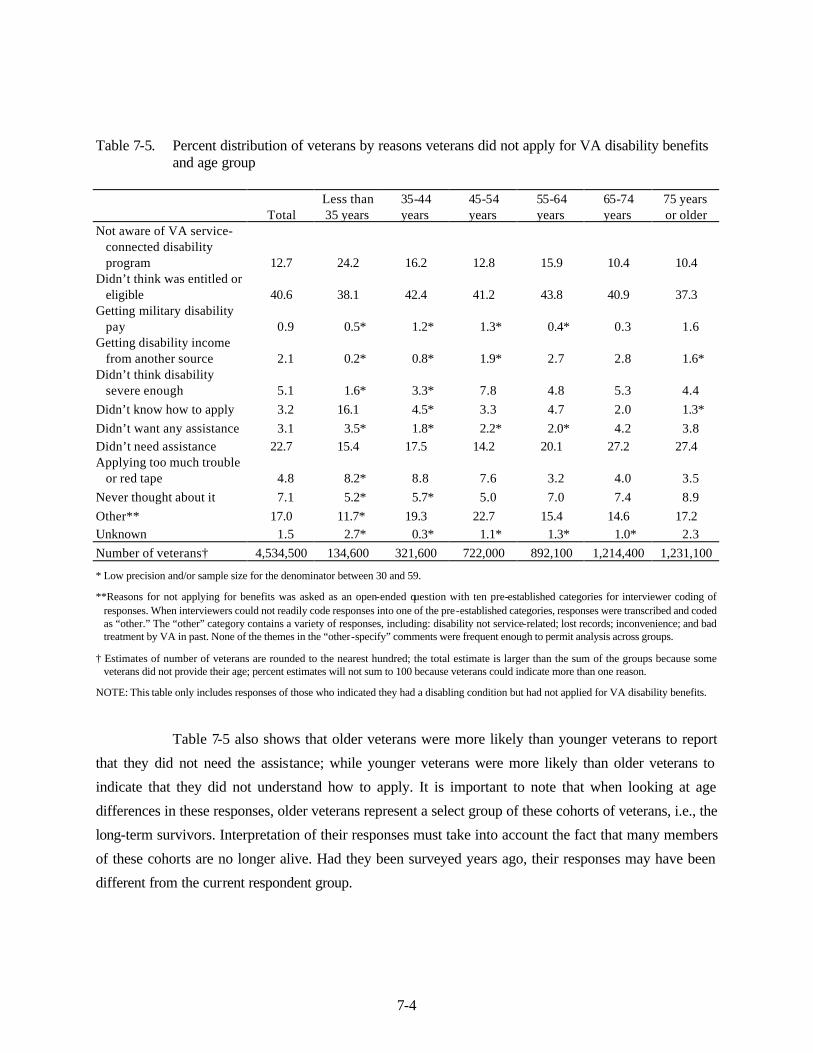
7-4
Table 7-5. Percent distribution of veterans by reasons veterans did not apply for VA disability benefits
and age group
Total Less than 35 years
35-44 years
45-54 years
55-64 years
65-74 years
75 years or older
Not aware of VA service-connected disability program 12.7 24.2 16.2 12.8 15.9 10.4 10.4
Didn’t think was entitled or eligible 40.6 38.1 42.4 41.2 43.8 40.9 37.3
Getting military disability pay 0.9 0.5* 1.2* 1.3* 0.4* 0.3 1.6
Getting disability income from another source 2.1 0.2* 0.8* 1.9* 2.7 2.8 1.6*
Didn’t think disability severe enough 5.1 1.6* 3.3* 7.8 4.8 5.3 4.4
Didn’t know how to apply 3.2 16.1 4.5* 3.3 4.7 2.0 1.3* Didn’t want any assistance 3.1 3.5* 1.8* 2.2* 2.0* 4.2 3.8 Didn’t need assistance 22.7 15.4 17.5 14.2 20.1 27.2 27.4 Applying too much trouble
or red tape 4.8 8.2* 8.8 7.6 3.2 4.0 3.5 Never thought about it 7.1 5.2* 5.7* 5.0 7.0 7.4 8.9 Other** 17.0 11.7* 19.3 22.7 15.4 14.6 17.2 Unknown 1.5 2.7* 0.3* 1.1* 1.3* 1.0* 2.3 Number of veterans† 4,534,500 134,600 321,600 722,000 892,100 1,214,400 1,231,100
* Low precision and/or sample size for the denominator between 30 and 59.
**Reasons for not applying for benefits was asked as an open-ended question with ten pre-established categories for interviewer coding of responses. When interviewers could not readily code responses into one of the pre-established categories, responses were transcribed and coded as “other.” The “other” category contains a variety of responses, including: disability not service-related; lost records; inconvenience; and bad treatment by VA in past. None of the themes in the “other-specify” comments were frequent enough to permit analysis across groups.
† Estimates of number of veterans are rounded to the nearest hundred; the total estimate is larger than the sum of the groups because some veterans did not provide their age; percent estimates will not sum to 100 because veterans could indicate more than one reason.
NOTE: This table only includes responses of those who indicated they had a disabling condition but had not applied for VA disability benefits.
Table 7-5 also shows that older veterans were more likely than younger veterans to report
that they did not need the assistance; while younger veterans were more likely than older veterans to
indicate that they did not understand how to apply. It is important to note that when looking at age
differences in these responses, older veterans represent a select group of these cohorts of veterans, i.e., the
long-term survivors. Interpretation of their responses must take into account the fact that many members
of these cohorts are no longer alive. Had they been surveyed years ago, their responses may have been
different from the current respondent group.

7-5
The veterans most likely to be eligible for disability benefits are those with a self-reported
service-related disability or with a disability rating. Among these veterans, about 38 percent agreed with
the statement that it was or would be easy to get the disability benefits to which they are entitled. Younger
veterans were somewhat less likely to agree with this statement than were older veterans.
Table 7-6. Percent distribution of veterans by ease of getting VA disability benefits and age
Total Less than 35 years
35-44 years
45-54 years
55-64 years
65-74 years
75 years or older
Strongly agree 8.7 6.6* 5.4 7.7 9.9 11.0 10.3 Agree 29.2 23.0 24.9 25.5 29.9 33.3 36.4 Neither agree nor disagree 13.1 22.0 17.0 14.0 12.5 11.0 7.2 Disagree 23.1 22.0 25.4 24.5 22.5 20.8 22.7 Strongly disagree 21.9 24.5 25.3 26.1 21.3 19.1 14.9 Unknown 4.0 1.9* 2.0* 2.2* 3.9 4.8 8.5 Total 100.0 100.0 100.0 100.0 100.0 100.0 100.0 Number of veterans† 4,425,400 380,600 536,000 1,233,200 771,263 665,600 818,600
* Low precision and/or sample size for the denominator between 30 and 59.
† Estimates of number of veterans are rounded to the nearest hundred; the total estimate is larger than the sum of the groups because some veterans did not provide their age.
NOTE: This table only includes responses of those who indicated they had a disabling condition that they thought was service-related or those who indicated they had a service-connected disability rating.
Receiving Disability Benefits. Veterans who said they had a disabling condition or a
disability rating were asked whether they were receiving service-connected disability compensation or
non-service-connected disability pension. Those who reported that they were receiving disability
compensation were further asked about the importance of that compensation in meeting their financial
needs. Tables 7-7 and 7-8 display these results.
As Table 7-7 indicates, nearly 9 in 10 veterans with a self-reported disabling condition or
disability rating reported that they currently receive service-connected disability compensation. Only
about 1 in 20 of these veterans (6.3 percent) received non-service-connected disability pension funds.
This percentage does not represent the entire population of veterans receiving non-service connected
disability funds, but rather the subset of veterans with a self-reported service-related disability or with a
disability rating.

7-6
Table 7-7. Percent distribution of veterans by service-connected disability compensation, non-service-connected disability pension, and age
Total Less than 35 years
35-44 years
45-54 years
55-64 years
65-74 years
75 years or older
Receiving service-connected disability compensation 88.2 94.1 91.7 89.4 89.6 82.7 86.5
Receiving non-service-connected disability pension 6.3 1.4* 2.5* 6.9 5.1 11.1 5.8
Receiving both compensation and pension 2.0 0.0 2.3* 1.5 3.1 2.0 2.6
Receiving neither compensation nor pension 2.3 1.4* 2.4* 1.5* 2.0 3.3 2.7
Unknown 1.2 3.1* 1.1* 0.7* 0.2* 0.9* 2.4 Total 100.0 100.0 100.0 100.0 100.0 100.0 100.0 Number of veterans† 2,982,700 195,800 327,600 875,100 506,400 460,000 604,900
* Low precision and/or sample size for the denominator between 30 and 59.
† Estimates of number of veterans are rounded to the nearest hundred; the total estimate is larger than the sum of the groups because some veterans did not provide their age.
NOTE: This table only includes responses of those who indicated that they received regular disability payments from the VA and who either indicated that they had a disabling condition or that they had a service-connected disability rating or refused or did not know the answer to any of those questions.
Table 7-8. Percent distribution of veterans receiving service-connected disability compensation by
importance of service-connected disability compensation to meeting financial needs and age
Total Less than 35 years
35-44 years
45-54 years
55-64 years
65-74 years
75 years or older
Extremely important 36.1 42.9 44.9 43.3 35.1 27.7 24.9 Very important 26.3 19.2 22.4 19.8 25.8 33.4 35.4 Moderately important 14.8 11.1 15.5 13.9 12.7 14.7 19.1 Slightly important 12.9 13.7 9.5 11.6 15.3 14.9 13.1 Not at all important 8.5 11.0 6.6 10.0 10.2 7.6 6.1 Unknown 1.4 2.1* 1.1* 1.4* 0.9* 1.7* 1.4 Total 100.0 100.0 100.0 100.0 100.0 100.0 100.0 Number of veterans† 2,692,200 184,300 307,900 795,200 469,600 389,600 539,100
* Low precision and/or sample size for the denominator between 30 and 59.
† Estimates of number of veterans are rounded to the nearest hundred; the total estimate is larger than the sum of the groups because some veterans did not provide their age.
NOTE: This table only includes responses of those who indicated they were receiving service-connected disability compensation.

7-7
Approximately 62 percent of veterans receiving service-connected disability compensation
said that their disability payments were extremely or very important to meeting their financial needs.
Across all age groups, at least 60 percent of veterans consistently said that these payments were extremely
or very important to meeting their financial needs.
Understanding Disability Benefits. Veterans who said they had a service-related disability
were asked how strongly they agreed with the statement that they thoroughly understood the disability
benefits to which they are entitled. Tables 7-9 and 7-10 display these results.
Table 7-9. Percent distribution of veterans by understanding of disability benefits and age
Total Less than 35 years
35-44 years
45-54 years
55-64 years
65-74 years
75 years or older
Strongly agree 15.1 12.1 12.8 16.6 15.9 18.3 12.5 Agree 36.1 25.1 30.4 35.1 33.8 42.5 44.2 Neither agree nor disagree 12.0 14.1 13.0 12.5 15.6 10.2 8.0 Disagree 21.2 28.2 27.2 21.8 19.4 15.3 19.2 Strongly disagree 12.6 20.2 15.8 12.1 11.8 11.5 8.5 Unknown 3.0 0.3* 0.8* 1.9 3.5 2.2 7.6 Total 100.0 100.0 100.0 100.0 100.0 100.0 100.0 Number of veterans† 4,425,400 350,600 536,000 1,233,200 771,300 665,600 818,600
* Low precision and/or sample size for the denominator between 30 and 59.
† Estimates of number of veterans are rounded to the nearest hundred; the total estimate is larger than the sum of the groups because some veterans did not provide their age.
NOTE: This table only includes responses of those who indicated they had a disabling condition that they thought was service-related
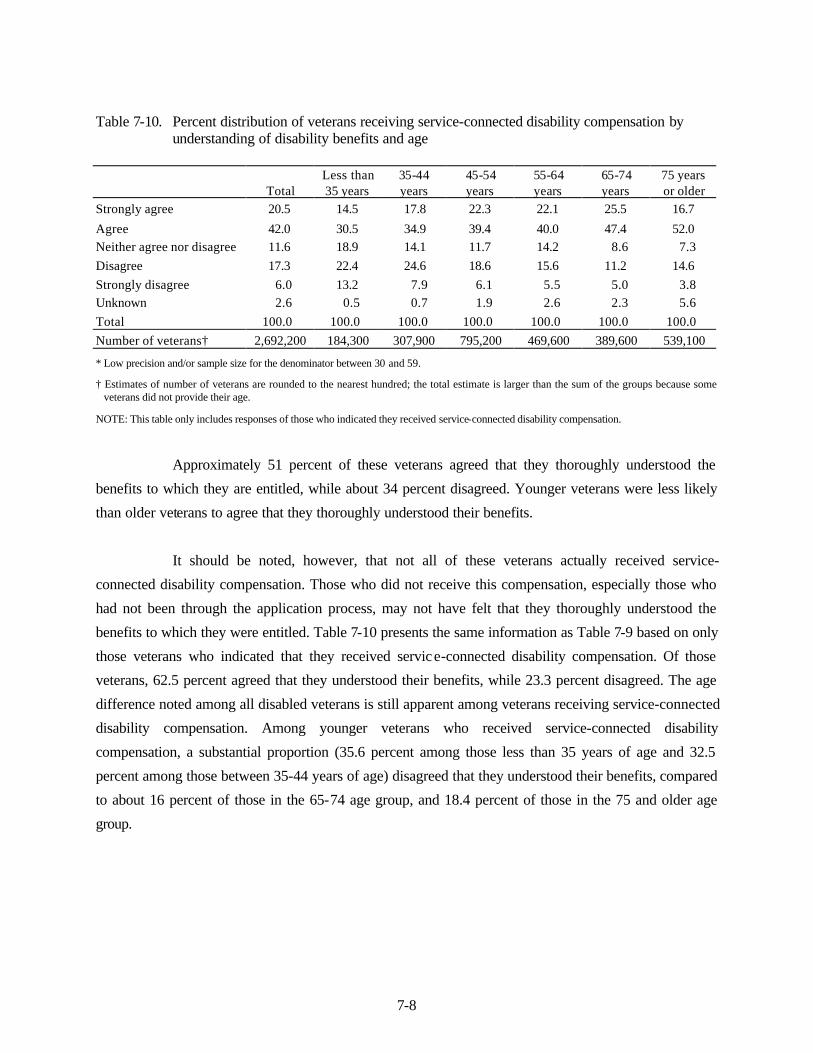
7-8
Table 7-10. Percent distribution of veterans receiving service-connected disability compensation by understanding of disability benefits and age
Total Less than 35 years
35-44 years
45-54 years
55-64 years
65-74 years
75 years or older
Strongly agree 20.5 14.5 17.8 22.3 22.1 25.5 16.7
Agree 42.0 30.5 34.9 39.4 40.0 47.4 52.0 Neither agree nor disagree 11.6 18.9 14.1 11.7 14.2 8.6 7.3 Disagree 17.3 22.4 24.6 18.6 15.6 11.2 14.6 Strongly disagree 6.0 13.2 7.9 6.1 5.5 5.0 3.8 Unknown 2.6 0.5 0.7 1.9 2.6 2.3 5.6 Total 100.0 100.0 100.0 100.0 100.0 100.0 100.0 Number of veterans† 2,692,200 184,300 307,900 795,200 469,600 389,600 539,100
* Low precision and/or sample size for the denominator between 30 and 59.
† Estimates of number of veterans are rounded to the nearest hundred; the total estimate is larger than the sum of the groups because some veterans did not provide their age.
NOTE: This table only includes responses of those who indicated they received service-connected disability compensation.
Approximately 51 percent of these veterans agreed that they thoroughly understood the
benefits to which they are entitled, while about 34 percent disagreed. Younger veterans were less likely
than older veterans to agree that they thoroughly understood their benefits.
It should be noted, however, that not all of these veterans actually received service-
connected disability compensation. Those who did not receive this compensation, especially those who
had not been through the application process, may not have felt that they thoroughly understood the
benefits to which they were entitled. Table 7-10 presents the same information as Table 7-9 based on only
those veterans who indicated that they received service-connected disability compensation. Of those
veterans, 62.5 percent agreed that they understood their benefits, while 23.3 percent disagreed. The age
difference noted among all disabled veterans is still apparent among veterans receiving service-connected
disability compensation. Among younger veterans who received service-connected disability
compensation, a substantial proportion (35.6 percent among those less than 35 years of age and 32.5
percent among those between 35-44 years of age) disagreed that they understood their benefits, compared
to about 16 percent of those in the 65-74 age group, and 18.4 percent of those in the 75 and older age
group.

7-9
7.2 Educational Programs
VBA education programs provide veterans with educational resources to supplement
opportunities missed because of military service. These programs are also meant to help the armed forces
and reserves to recruit and retain members. For members of the armed forces, VA educational benefits
also assist in the adjustment to civilian life.17
The provisions of VA-provided education programs have changed over the years, which may
have influenced veterans’ use of educational benefits. Because of these changes in benefits related to
period of service, many survey responses in this section are examined by period of service. There have
been five major education initiatives for veterans, including the following:
n In 1944, the Serviceman’s Readjustment Act provided World War II (WWII) veterans
with up to 4 years of education or training assistance, including tuition, books, fees, supplies, and a subsistence allowance.
n In 1952, the Veterans’ Readjustment Assistance Act, directed at Korean War veterans, reduced financial benefits and imposed new restrictions on veterans using the benefit. Veterans were permitted a maximum of 36 months of education/training and were expected to pay tuition costs out of subsistence allowances.
n In 1966, the Veterans’ Readjustment Benefits Act, provided Vietnam and Vietnam-era veterans one month (and later 1½ months) of educational benefits for each month of service.
n In 1977, the Post-Vietnam Era Veterans Educational Assistance Act provided 2:1 matching funds to service members for their contributions to an education fund.
n In 1984, the Veterans Educational Assistance Act, popularly known as the Montgomery GI Bill, provided educational assistance in exchange for completing 3 years of active duty or 2 years of active duty and 4 years in the reserve. The service member was also required to contribute to an educational fund. 18
This section describes survey results on VA education benefit use, barriers to use, and
expectations for future benefit use.
Education Benefit Use. Respondents were asked whether they had received any education
or training benefits from VA. If so, they were asked how they used their education benefit and how 17Veterans Benefits Administration Annual Benefits Report for Fiscal Year 2001 18VA History in Brief

7-10
important their VA education benefit had been in helping them to meet their education goals or preparing
them to get a better job. These results are displayed in Tables 7-11 through 7-13.
Overall, 40.1 percent of veterans said they had used VA education or training benefits since
they left the military (Table 7-11). The percentage of those reporting that they had used these benefits was
highest for those who served during the Vietnam era (49.2 percent) and lowest for those who had served
during the Gulf War (30.2 percent). The proportion of veterans using education-training benefits among
those who served during the Gulf War will likely increase over the next few years because veterans
generally have up to ten years after their separation to use their education-training benefits. (See Table 7-
15 for expectations about future use.)
Table 7-11. Percent distribution of veterans by education or training benefits (other than vocational
rehabilitation) and period of service
Total World War II
Between World
War II and Korea
Korean Conflict
Between Korean Conflict
and Vietnam
Era Vietnam
Era
Post-Vietnam
Era Gulf War
Received education or training benefits 40.1 42.1 38.0 42.1 37.1 49.2 34.7 30.2
Did not receive education or training benefits 59.5 57.1 61.7 57.7 62.3 50.4 65.1 69.5
Unknown 0.4 0.8 0.3* 0.2* 0.6 0.4* 0.2* 0.3* Total 100.0 100.0 100.0 100.0 100.0 100.0 100.0 100.0 Number of veterans† 25,095,000 5,149,100 1,680,600 4,245,600 6,426,500 9,057,200 7,005,000 3,483,600
* Low precision and/or sample size for the denominator between 30 and 59.
† Estimates of number of veterans are rounded to the nearest hundred; the total estimate is smaller than the sum of the groups because veterans could indicate more than one period of service.
Among those who had used their educational and training benefits, most veterans (60.5
percent) used their benefits for college or university study (Table 7-12). Approximately 38 percent used
their benefits for business, technical, or vocational training, and 15.3 percent used them for apprenticeship
or on-job training programs. Based on these responses, the proportions of veterans using these benefits for
college or university study or for business, technical and vocational training appear to have steadily
increased in more recent periods of service while the percentage of veterans using the benefits for
apprenticeship or on-job training has decreased in more recent periods of service. This trend may reflect
changes in labor market education requirements.

7-11
Approximately 67 percent of veterans who had used VA educational and training benefits
indicated that these benefits were either extremely or very important in helping them meet their
educational or career goals (Table 7-13). When veterans’ responses were examined across period of
service, the percentage of veterans emphasizing the importance of these benefits to achieving their goals
steadily increased to a high of 80 percent among Gulf War veterans. This reflects enlistment incentives
promulgated in recent years, which have encouraged people to volunteer by emphasizing the education
benefits they can obtain through military service.
Table 7-12. Percent distribution of veterans by use of education and training benefit and period of
service
Total World War
II
Between World War
II and Korea
Korean Conflict
Between Korean Conflict
and Vietnam
Era Vietnam
Era
Post-Vietnam
Era Gulf War
College or university coursework for bachelor or graduate degree 60.5 51.3 54.3 55.5 58.8 63.8 67.2 75.0
Business/technical/ vocational training for certificate/ diploma 37.5 34.9 39.3 38.2 39.6 39.2 40.0 35.4
Apprenticeship or on-job training program 15.3 22.2 17.5 15.3 11.9 14.5 12.0 10.5
Took correspondence courses 9.6 8.8 9.8 8.3 13.5 11.4 7.4 6.9
Flight training 3.7 7.0 5.8 4.8 4.5 2.8 2.2 1.7* Tutorial assistance, refresher
courses, or deficiency training 8.6 8.7 6.2 9.0 9.3 8.5 8.1 7.0
Teacher certification program 2.5 2.1 2.3 1.8 2.1 2.6 3.3 2.3*
Other 4.1 4.7 4.7 6.1 5.4 3.7 2.2 3.6 Unknown 0.5 0.8 0.4* 0.4* 0.7* 0.2* 0.3* 0.2*
Number of veterans† 10,178,300 2,207,400 643,700 1,796,700 2,420,600 4,494,000 2,445,600 1,060,900
* Low precision and/or sample size for the denominator between 30 and 59.
† Estimates of number of veterans are rounded to the nearest hundred; the total estimate is smaller than the sum of the groups because veterans could indicate more than one period of service; percent estimates will not sum to 100 because veterans could indicate more than one use of education and training benefits.
NOTE: This question was asked of those who indicated they had received any education or training benefits from the VA since they left the military or who refused or did not know the answer to that question.
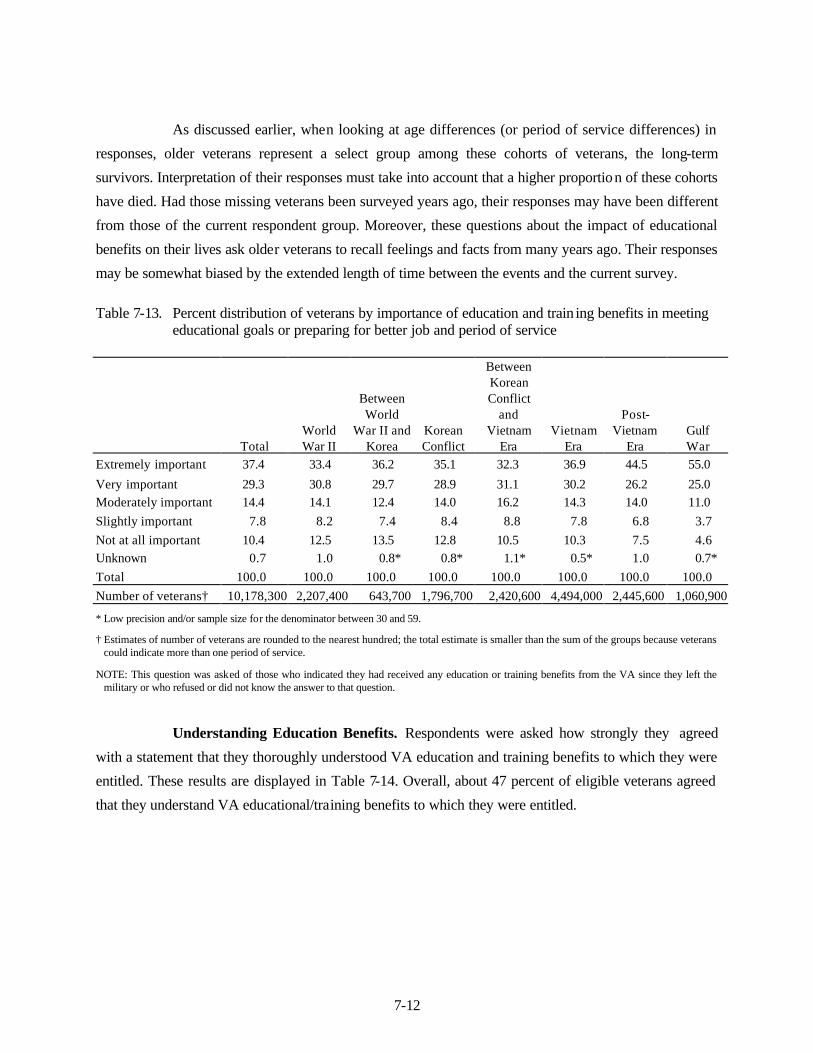
7-12
As discussed earlier, when looking at age differences (or period of service differences) in
responses, older veterans represent a select group among these cohorts of veterans, the long-term
survivors. Interpretation of their responses must take into account that a higher proportion of these cohorts
have died. Had those missing veterans been surveyed years ago, their responses may have been different
from those of the current respondent group. Moreover, these questions about the impact of educational
benefits on their lives ask older veterans to recall feelings and facts from many years ago. Their responses
may be somewhat biased by the extended length of time between the events and the current survey.
Table 7-13. Percent distribution of veterans by importance of education and train ing benefits in meeting
educational goals or preparing for better job and period of service
Total World War II
Between World
War II and Korea
Korean Conflict
Between Korean Conflict
and Vietnam
Era Vietnam
Era
Post-Vietnam
Era Gulf War
Extremely important 37.4 33.4 36.2 35.1 32.3 36.9 44.5 55.0
Very important 29.3 30.8 29.7 28.9 31.1 30.2 26.2 25.0 Moderately important 14.4 14.1 12.4 14.0 16.2 14.3 14.0 11.0 Slightly important 7.8 8.2 7.4 8.4 8.8 7.8 6.8 3.7 Not at all important 10.4 12.5 13.5 12.8 10.5 10.3 7.5 4.6 Unknown 0.7 1.0 0.8* 0.8* 1.1* 0.5* 1.0 0.7* Total 100.0 100.0 100.0 100.0 100.0 100.0 100.0 100.0 Number of veterans† 10,178,300 2,207,400 643,700 1,796,700 2,420,600 4,494,000 2,445,600 1,060,900
* Low precision and/or sample size for the denominator between 30 and 59.
† Estimates of number of veterans are rounded to the nearest hundred; the total estimate is smaller than the sum of the groups because veterans could indicate more than one period of service.
NOTE: This question was asked of those who indicated they had received any education or training benefits from the VA since they left the military or who refused or did not know the answer to that question.
Understanding Education Benefits. Respondents were asked how strongly they agreed
with a statement that they thoroughly understood VA education and training benefits to which they were
entitled. These results are displayed in Table 7-14. Overall, about 47 percent of eligible veterans agreed
that they understand VA educational/training benefits to which they were entitled.
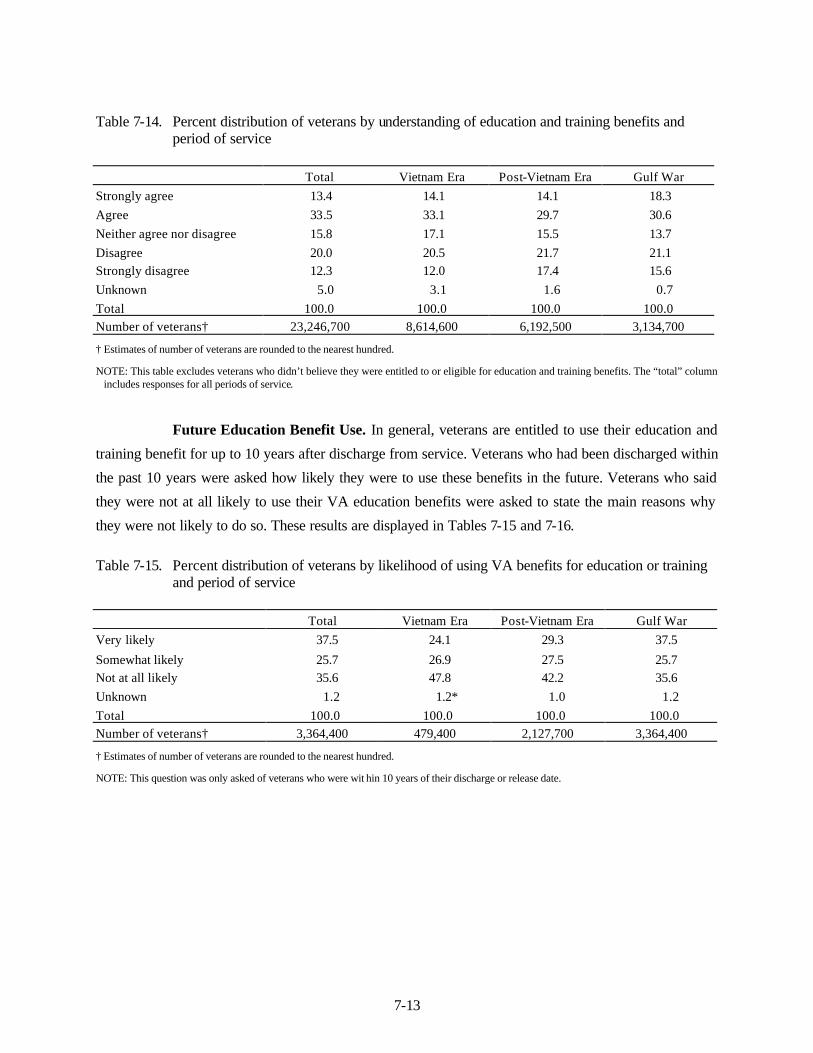
7-13
Table 7-14. Percent distribution of veterans by understanding of education and training benefits and period of service
Total Vietnam Era Post-Vietnam Era Gulf War Strongly agree 13.4 14.1 14.1 18.3 Agree 33.5 33.1 29.7 30.6 Neither agree nor disagree 15.8 17.1 15.5 13.7 Disagree 20.0 20.5 21.7 21.1 Strongly disagree 12.3 12.0 17.4 15.6 Unknown 5.0 3.1 1.6 0.7 Total 100.0 100.0 100.0 100.0 Number of veterans† 23,246,700 8,614,600 6,192,500 3,134,700
† Estimates of number of veterans are rounded to the nearest hundred.
NOTE: This table excludes veterans who didn’t believe they were entitled to or eligible for education and training benefits. The “total” column includes responses for all periods of service.
Future Education Benefit Use. In general, veterans are entitled to use their education and
training benefit for up to 10 years after discharge from service. Veterans who had been discharged within
the past 10 years were asked how likely they were to use these benefits in the future. Veterans who said
they were not at all likely to use their VA education benefits were asked to state the main reasons why
they were not likely to do so. These results are displayed in Tables 7-15 and 7-16.
Table 7-15. Percent distribution of veterans by likelihood of using VA benefits for education or training
and period of service Total Vietnam Era Post-Vietnam Era Gulf War Very likely 37.5 24.1 29.3 37.5
Somewhat likely 25.7 26.9 27.5 25.7 Not at all likely 35.6 47.8 42.2 35.6 Unknown 1.2 1.2* 1.0 1.2 Total 100.0 100.0 100.0 100.0 Number of veterans† 3,364,400 479,400 2,127,700 3,364,400
† Estimates of number of veterans are rounded to the nearest hundred.
NOTE: This question was only asked of veterans who were wit hin 10 years of their discharge or release date.
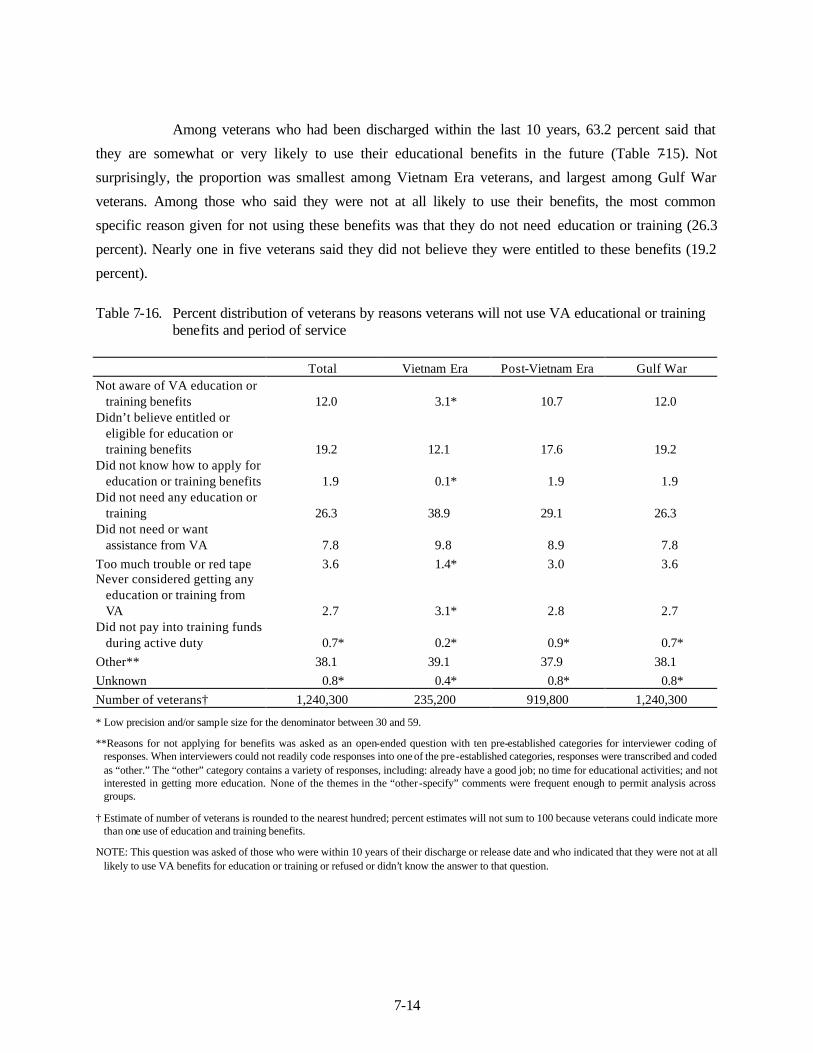
7-14
Among veterans who had been discharged within the last 10 years, 63.2 percent said that
they are somewhat or very likely to use their educational benefits in the future (Table 7-15). Not
surprisingly, the proportion was smallest among Vietnam Era veterans, and largest among Gulf War
veterans. Among those who said they were not at all likely to use their benefits, the most common
specific reason given for not using these benefits was that they do not need education or training (26.3
percent). Nearly one in five veterans said they did not believe they were entitled to these benefits (19.2
percent).
Table 7-16. Percent distribution of veterans by reasons veterans will not use VA educational or training
benefits and period of service Total Vietnam Era Post-Vietnam Era Gulf War Not aware of VA education or
training benefits 12.0 3.1* 10.7 12.0 Didn’t believe entitled or
eligible for education or training benefits 19.2 12.1 17.6 19.2
Did not know how to apply for education or training benefits 1.9 0.1* 1.9 1.9
Did not need any education or training 26.3 38.9 29.1 26.3
Did not need or want assistance from VA 7.8 9.8 8.9 7.8
Too much trouble or red tape 3.6 1.4* 3.0 3.6 Never considered getting any
education or training from VA 2.7 3.1* 2.8 2.7
Did not pay into training funds during active duty 0.7* 0.2* 0.9* 0.7*
Other** 38.1 39.1 37.9 38.1 Unknown 0.8* 0.4* 0.8* 0.8* Number of veterans† 1,240,300 235,200 919,800 1,240,300
* Low precision and/or sample size for the denominator between 30 and 59.
**Reasons for not applying for benefits was asked as an open-ended question with ten pre-established categories for interviewer coding of responses. When interviewers could not readily code responses into one of the pre-established categories, responses were transcribed and coded as “other.” The “other” category contains a variety of responses, including: already have a good job; no time for educational activities; and not interested in getting more education. None of the themes in the “other-specify” comments were frequent enough to permit analysis across groups.
† Estimate of number of veterans is rounded to the nearest hundred; percent estimates will not sum to 100 because veterans could indicate more than one use of education and training benefits.
NOTE: This question was asked of those who were within 10 years of their discharge or release date and who indicated that they were not at all likely to use VA benefits for education or training or refused or didn’t know the answer to that question.
7-15
7.3 Vocational Rehabilitation and Employment Services
The Vocational Rehabilitation and Employment Program (VR&E) helps veterans with
service-connected disabilities become employable in order to obtain and maintain suitable employment.
When the severity of disability prohibits suitable employment, VR&E assists those veterans in achieving
independence in daily living. Additionally, VR&E provides educational and vocational counseling for
eligible service members, veterans, and dependents.19
Veterans responding to the section of questions concerning disabilities also were asked
whether they had ever used VA vocational rehabilitation services. If they reported they had not used VA
vocational rehabilitation services, veterans then were asked the main reason why they had not. Veterans
who reported they had used VA vocational rehabilitation services were asked how important these
services were in meeting their education goals or obtaining employment. Results for veterans who report
receiving service-connected disability compensation are displayed in Tables 7-15 through 7-17. Analyses
for this report were restricted to this group because vocational rehabilitation services are particularly
relevant for this group of veterans.
About 1 in 5 veterans who reported receiving service-connected disability compensation also
reported that they received vocational rehabilitation services from VA at some point (Table 7-17). The
proportion of veterans indicating that they had received vocationa l rehabilitation services from VA varied
by period of service. The lowest proportion receiving VA vocational rehabilitation services were in
military service between the WWII and Korean Conflict eras (14.4 percent) and the largest proportions
serving in the post-Vietnam Era (24.6 percent) and during the Gulf War (23.2 percent).
Table 7-18 shows that, among veterans who said they had not received VA vocational
rehabilitation services from VA, the most common reason was, not needing any financial assistance from
VA (30.0 percent). About 1 out of 8 veterans said that they had not received these services from VA
because they never considered applying (13.3 percent), while more than 1 in 10 said they did not because
they didn't think their disability was severe enough (11.4 percent). Veterans from earlier periods of
service were more likely to report that they had never considered applying than were veterans serving in
the later periods of service.
19Veterans Benefits Administration Annual Benefits Report for Fiscal Year 2001

7-16
Table 7-17. Percent distribution of veterans by use of vocational rehabilitation services from VA and period of service
Total World War II
Between World
War II and Korea
Korean Conflict
Between Korean Conflict
and Vietnam
Era Vietnam
Era
Post-Vietnam
Era Gulf War
Yes 21.1 14.1 14.4 14.7 14.4 20.6 24.6 23.2
No 78.3 84.5 85.0 84.7 85.2 79.1 75.0 76.5 Unknown 0.6 1.4 0.6* 0.6* 0.4* 0.3* 0.4* 0.3* Total 100.0 100.0 100.0 100.0 100.0 100.0 100.0 100.0 Number of veterans† 2,692,200 604,800 205,500 426,000 643,600 1,327,600 1,114,400 612,700
* Low precision and/or sample size for the denominator between 30 and 59.
† Estimates of number of veterans are rounded to the nearest hundred; the total estimate is smaller than the sum of the groups because veterans could indicate more than one period of service.
NOTE: This table only includes responses of those who reported that they received service-connected disability compensation.

7-17
Table 7-18. Percent distribution of veterans by reasons veterans have not used any VA vocational
rehabilitation services and period of service
Total World War II
Between World War II
and Korea
Korean Conflict
Between Korean Conflict
and Vietnam
Era Vietnam
Era
Post-Vietnam
Era Gulf War
Didn’t think disability was severe enough 11.4 12.2 10.2 11.3 9.9 11.7 12.6 12.1
Didn’t know how to apply for or get needed benefits 6.5 4.9 6.4* 4.4 4.3 6.3 6.6 8.2
Didn’t want financial assistance from VA 1.4 1.4 1.6* 1.8 2.4 1.6 1.2 1.0*
Didn’t need financial assistance from VA 30.0 32.4 30.3 36.4 35.4 32.3 30.9 23.0
Applying was too much trouble or red tape 3.7 4.1 6.1 4.9 4.2 3.8 4.3 4.3
Never considered applying 13.3 16.6 14.8 14.7 13.5 12.1 11.2 11.1 Got assistance from
somewhere else 2.9 3.5 4.0 3.4 3.3 3.0 1.9 1.8 Got better/didn’t need
assistance any more 4.0 5.7 6.1 5.0 4.4 4.3 3.5 2.0 Just had claim approved 0.6* 0.2* 0.4* 0.3* 0.6* 0.5* 0.3* 1.1* Other** 35.2 27.0 31.7 29.4 34.5 35.0 37.7 43.0 Unknown 3.4 5.4 3.2* 2.7 1.6 2.6 1.5 2.0* Number of veterans† 2,107,100 510,900 174,700 361,000 548,500 1,050,600 836,300 469,000
* Low precision and/or sample size for the denominator between 30 and 59.
**Reasons for not using vocational rehabilitation benefits was asked as an open-ended question with nine pre-established categories for interviewer coding of responses. When interviewers could not readily code responses into one of the pre-established categories, responses were transcribed and coded as “other.” The “other” category contains a variety of responses, including: issues related to age or disability; denied benefits; not eligible for benefits; and lack of awareness of benefits. None of the themes in the “other-specify” comments were frequent enough to permit analysis across groups.
† Estimates of number of veterans are rounded to the nearest hundred; the total estimate is smaller than the sum of the groups because veterans could indicate more than one period of service; percent estimates will not sum to 100 because veterans could indicate more than one reason.
NOTE: This table only includes responses of those who indicated that they received service-connected disability compensation and had never used vocational rehabilitation services from VA.
Interpretation of older veterans’ responses must take into account that many members of
these cohorts are no longer alive. Had those missing veterans been surveyed years ago, their responses
may have been different from the current respondent group. Moreover, these questions ask older veterans
to recall feelings and explanations from many years ago. Their responses also may be somewhat biased
by the extended length of time between the events and the current survey.

7-18
Table 7-19 illustrates that overall, about 69 percent of veterans who received VA vocational
rehabilitation services said that these services were extremely or very important in meeting their
educational goals or helping them get a job. The proportion of veterans reporting that these services were
extremely or very important increased in more recent periods of service. It ranged from 61 percent for
those who served during World War II to just under 77 percent for those who served during the Gulf War.
Once again, period of service differences may reflect actual differences in the importance of vocational
rehabilitation, or it may reflect memory bias or unique characteristics of the surviving members of the
older cohorts of veterans.
Table 7-19. Percent distribution of veterans by importance of vocational rehabilitation services in
meeting educational goals or obtaining employment and period of service
Total World War II
Between World
War II and Korea
Korean Conflict
Between Korean Conflict
and Vietnam
Era Vietnam
Era
Post-Vietnam
Era Gulf War
Extremely important 41.7 23.9 31.6 36.2 40.1 38.8 49.4 54.0
Very important 26.9 37.1 34.5 29.1 24.0 28.6 23.0 22.9 Moderately important 10.7 11.2 9.0* 12.9 9.1 10.0 11.7 11.9 Slightly important 6.0 9.7 9.8* 7.4 7.9 7.2 4.4 2.6* Not at all important 12.5 14.6 15.1 12.5 17.6 14.4 9.5 5.4* Unknown 2.2 3.5* 0.0 1.9* 1.3* 1.0* 2.0* 3.2* Total 100.0 100.0 100.0 100.0 100.0 100.0 100.0 100.0 Number of veterans† 567,600 85,200 29,600 62,700 92,800 272,900 273,900 142,100
* Low precision and/or sample size for the denominator between 30 and 59.
† Estimates of number of veterans are rounded to the nearest hundred; the total estimate is smaller than the sum of the groups because veterans could indicate more than one period of service.
NOTE: This table only includes responses of those who indicated that they received service-connected disability compensation and had received vocational rehabilitation services from VA.
7.4 Home Loan Guaranty Program
The Home Loan Guaranty Program provides housing credit assistance to veterans and
service persons with the objective of enabling entry into the home-buying market. Assistance is provided
through the Government’s partia l guaranty of loans made by private lenders in lieu of the substantial
down payment and other investment safeguards required in conventional mortgage transactions. Veterans’
loans may be used to purchase a home, to purchase a residential unit in certain condominium projects, to

7-19
build a home, to refinance an existing home loan, or to improve a home by installing solar heating or
other energy conservation measures.20
Respondents were asked whether they owned their current residence, and whether they had
received any home loans since they left the military. Veterans who responded affirmatively were asked if
they had used VA home loan program to purchase a home, make home improvements, or refinance a
home loan. Veterans who had not used VA home loan program were asked the main reasons why they did
not. These results are displayed in Tables 7-20 – 7-22.
Nearly 4 out of 5 veterans (78.1 percent) owned their current residence, as Table 7-20
indicates. As might be expected, the percentage of home ownership steadily increased from 44.8 percent
in the youngest age groups to 88 percent of those in the 65-74 age group and 85.5 percent of those in the
75 and older age group.
Table 7-20. Percent distribution of veterans by current living quarters and age
Total Less Than 35 Years
35-44 Years
45-54 Years
55-64 Years
65-74 Years
75 Years or Older
Owned/being bought by vet or someone in vet’s household 78.1 44.8 66.5 77.3 84.8 88.0 85.5
Rented for cash 17.6 41.7 28.4 19.4 12.3 9.4 10.9 Occupied without
payment of cash rent 3.8 13.1 4.8 2.9 2.3 2.2 3.0 Unknown 0.5 0.4* 0.3* 0.4 0.6 0.4 0.6* Total 100.0 100.0 100.0 100.0 100.0 100.0 100.0 Number of veterans† 25,196,000 2,288,600 3,030,300 5,415,100 4,946,000 5,256,400 4,116,100
* Low precision and/or sample size for the denominator between 30 and 59.
† Estimates of number of veterans are rounded to the nearest hundred; the total estimate is larger than the sum of the groups because some veterans did not provide their age.
Among those veterans who had ever gotten a loan to purchase a home, make home
improvements, or refinance a home loan, about 60 percent had used a VA loan at some point. This
proportion varied little by age group (Table 7-21).
20Veterans Benefits Administration Annual Benefits Report for Fiscal Year 2001

7-20
Table 7-21. Percent distribution of veterans by use of loans obtained through VA loan program and age
Total Less Than 35 Years
35-44 Years
45-54 Years
55-64 Years
65-74 Years
75 Years or Older
Purchase a home 57.8 59.7 61.5 62.1 55.1 54.0 57.5 Make home improvements 1.1 0.3* 0.1* 1.0 1.3 1.3 1.4 Refinance a home loan 4.7 7.7 8.2 6.5 4.7 2.2 1.8 No VA loan used 40.7 40.3 38.0 36.3 43.5 44.3 40.4 Unknown 0.9 0.0 0.4* 0.8 1.0 1.0* 1.8 Number of veterans† 14,434,000 840,200 1,571,000 3,412,800 3,213,500 3,080,700 2,228,400
* Low precision and/or sample size for the denominator between 30 and 59.
† Estimates of number of veterans are rounded to the nearest hundred; the total estimate is larger than the sum of the groups because some veterans did not provide their age; percent estimates will not sum to 100 because veterans could indicate more than one use.
NOTE: This question was asked only of those who responded that they had gotten any loans to purchase a home, make home improvements, or refinance a home loan or who refused or did not know the answer to this question.
Table 7-22 displays the reasons veterans gave for not using a VA loan to buy a home. About
1 in 5 respondents (19.3 percent) said lack of awareness of the program was why they had not used a VA
loan. This varied little by age, with the exception of the under-35 age group, where only about 12 percent
gave this reason. The older age groups were more likely than their younger counterparts to say that they
did not need or want loan assistance from VA. This ranged from a low of 7.7 percent in the under age 35
group to a high of 29.1 percent in the age 75 and older group of veterans. About 1 in 10 veteran
homebuyers thought that applying for a VA loan would be too much trouble or red tape. This proportion
was higher among the middle cohorts (12-15 percent) and lower among the youngest and oldest cohorts
(10 percent and 7-9 percent, respectively).

7-21
Table 7-22. Percent distribution of veterans by reasons veterans did not use VA loan program and age
Total Less Than 35 Years
35-44 Years
45-54 Years
55-64 Years
65-74 Years
75 Years or Older
Not aware of VA loan program 19.3 12.5 16.4 17.5 22.7 19.0 21.1
Thinks not eligible for VA loan 11.3 7.4 16.7 9.7 15.9 10.4 5.9
Did not know how to apply for a loan 4.4 6.0* 6.4 5.5 4.8 3.3 2.3
Did not need or want loan assistance from VA 18.6 7.7 10.5 12.9 18.2 23.2 29.1
Thinks applying for VA loan too much trouble or red tape 10.8 10.0 11.7 14.7 11.5 9.1 6.9
Never considered getting a loan from VA 10.7 5.6* 5.4 10.1 11.0 12.5 14.2
Thinks amount needed larger than VA maximum 1.9 3.5* 4.8 1.7 2.3 0.9* 0.3*
Thinks VA inspection or appraisal requirements too stringent 1.2 0.9* 3.8 1.0* 1.4 0.7* 0.2*
Thinks VA funding fee too high 3.4 5.9 4.1 5.6 3.1 2.0 1.3*
Thinks other fees or costs too high (e.g., closing costs) 2.6 6.0 2.2* 3.3 3.6 1.4* 0.7*
Thinks no adjustable rates available 0.4* 1.2* 0.5* 0.2* 0.6* 0.1* 0.1*
Thinks seller would not sell if used VA loan 1.2 0.7* 1.0* 1.5 1.9 0.7* 0.5*
Thinks wouldn’t qualify for VA loan 1.8 2.5* 3.7* 1.7 1.8 1.5 0.7*
Applied but not approved for VA loan 2.1 4.2* 2.1* 2.4 1.1* 1.9 2.1
Other** 27.1 39.4 32.7 30.4 22.5 25.2 23.6 Unknown 3.3 2.5* 2.3* 1.6 3.2 4.2 5.7 Number of veterans† 5,879,000 338,800 597,400 1,239,400 1,397,200 1,365,900 899,400
* Low precision and/or sample size for the denominator between 30 and 59.
**Reasons for not using a VA loan was asked as an open-ended question with ten pre-established categories for interviewer coding of responses. When interviewers could not readily code responses into one of the pre-established categories, responses were transcribed and coded as “other.” The “other” category contains a variety of responses, including: assumed an existing loan; could get better rates with a commercial loan; and loan process took too long. None of the themes in the “other-specify” comments were frequent enough to permit analysis across groups.
† Estimates of number of veterans are rounded to the nearest hundred; the total estimate is larger than the sum of the groups because some veterans did not provide their age; percent estimates will not sum to 100 because veterans could indicate more than one reason.
NOTE: This question was asked of those who indicated they had not used the VA loan program to purchase a home, make home improvements, or refinance a home loan.

7-22
7.5 Life Insurance Program
Government life insurance programs were created to provide life insurance at a “standard”
premium rate to members of the armed forces who are exposed to the extra hazards of military service,
especially the deadly hazards of war. Few commercial insurance companies offer insurance that includes
coverage against death while in the armed forces. Those that do offer such policies charge a high premium
because of the additional risk. Members leaving the armed forces are eligible to maintain their government
insurance through VA following discharge. In general, new life insurance programs were created for each
wartime period after World War I21, so this discussion includes comparisons by period of service.
Respondents were asked whether they were currently covered by VA life insurance, and
whether they had any other life insurance. If they were not covered by VA life insurance, respondents
were asked what were the main reasons they were not. All respondents were asked how much they agreed
with the statement that they understood VA life insurance benefits to which they are entitled. These
results are displayed in Table 7-23 – 7-24.
Only 10.8 percent of all respondents said they were covered by VA life insurance. This
proportion varies substantially by period of service, however. Veterans from the three earliest service
periods are more likely to have VA life insurance (21.0-27.2 percent) compared to veterans from the later
service periods (5.7-12.9 percent).
21Veterans Benefits Administration Annual Benefits Report for Fiscal Year 2001
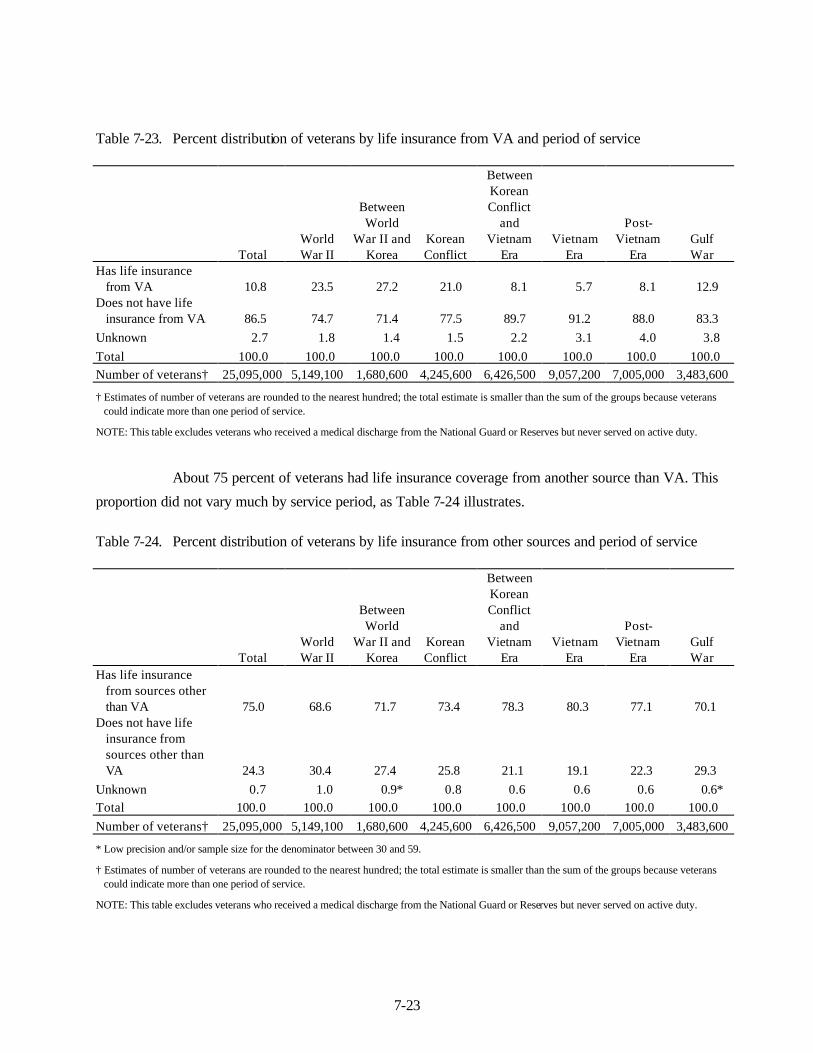
7-23
Table 7-23. Percent distribution of veterans by life insurance from VA and period of service
Total World War II
Between World
War II and Korea
Korean Conflict
Between Korean Conflict
and Vietnam
Era Vietnam
Era
Post-Vietnam
Era Gulf War
Has life insurance from VA 10.8 23.5 27.2 21.0 8.1 5.7 8.1 12.9
Does not have life insurance from VA 86.5 74.7 71.4 77.5 89.7 91.2 88.0 83.3
Unknown 2.7 1.8 1.4 1.5 2.2 3.1 4.0 3.8 Total 100.0 100.0 100.0 100.0 100.0 100.0 100.0 100.0 Number of veterans† 25,095,000 5,149,100 1,680,600 4,245,600 6,426,500 9,057,200 7,005,000 3,483,600
† Estimates of number of veterans are rounded to the nearest hundred; the total estimate is smaller than the sum of the groups because veterans could indicate more than one period of service.
NOTE: This table excludes veterans who received a medical discharge from the National Guard or Reserves but never served on active duty.
About 75 percent of veterans had life insurance coverage from another source than VA. This
proportion did not vary much by service period, as Table 7-24 illustrates.
Table 7-24. Percent distribution of veterans by life insurance from other sources and period of service
Total World War II
Between World
War II and Korea
Korean Conflict
Between Korean Conflict
and Vietnam
Era Vietnam
Era
Post-Vietnam
Era Gulf War
Has life insurance from sources other than VA 75.0 68.6 71.7 73.4 78.3 80.3 77.1 70.1
Does not have life insurance from sources other than VA 24.3 30.4 27.4 25.8 21.1 19.1 22.3 29.3
Unknown 0.7 1.0 0.9* 0.8 0.6 0.6 0.6 0.6* Total 100.0 100.0 100.0 100.0 100.0 100.0 100.0 100.0 Number of veterans† 25,095,000 5,149,100 1,680,600 4,245,600 6,426,500 9,057,200 7,005,000 3,483,600
* Low precision and/or sample size for the denominator between 30 and 59.
† Estimates of number of veterans are rounded to the nearest hundred; the total estimate is smaller than the sum of the groups because veterans could indicate more than one period of service.
NOTE: This table excludes veterans who received a medical discharge from the National Guard or Reserves but never served on active duty.

7-24
Table 7-25 displays reasons veterans gave for why they did not have VA life insurance.
Among veterans without VA life insurance, the largest proportion said they did not have VA life
insurance because they were not aware of VA insurance benefits (34.6 percent). Veterans who served
during WWII and between WWII and the Korean Conflict were least likely to say they were not aware of
VA life insurance benefits (17.1 percent and 18.1 percent, respectively), while about twice as many of
those serving after the Korean Conflict gave this reason.
The second-most common reason among all veterans (13.0 percent) was that they didn’t
believe they were eligible for VA life insurance benefits. Proportionately more veterans who served in
recent service periods said they did not believe they were eligible, compared to veterans who served in
earlier periods. Among veterans who served from WWII to the Korean Conflict, another common reason
was allowing their policy to lapse (15.1-20.9 percent). Among those who served after the Korean
Conflict, the proportion giving this reason was much lower (about 6 percent of each service period
group).
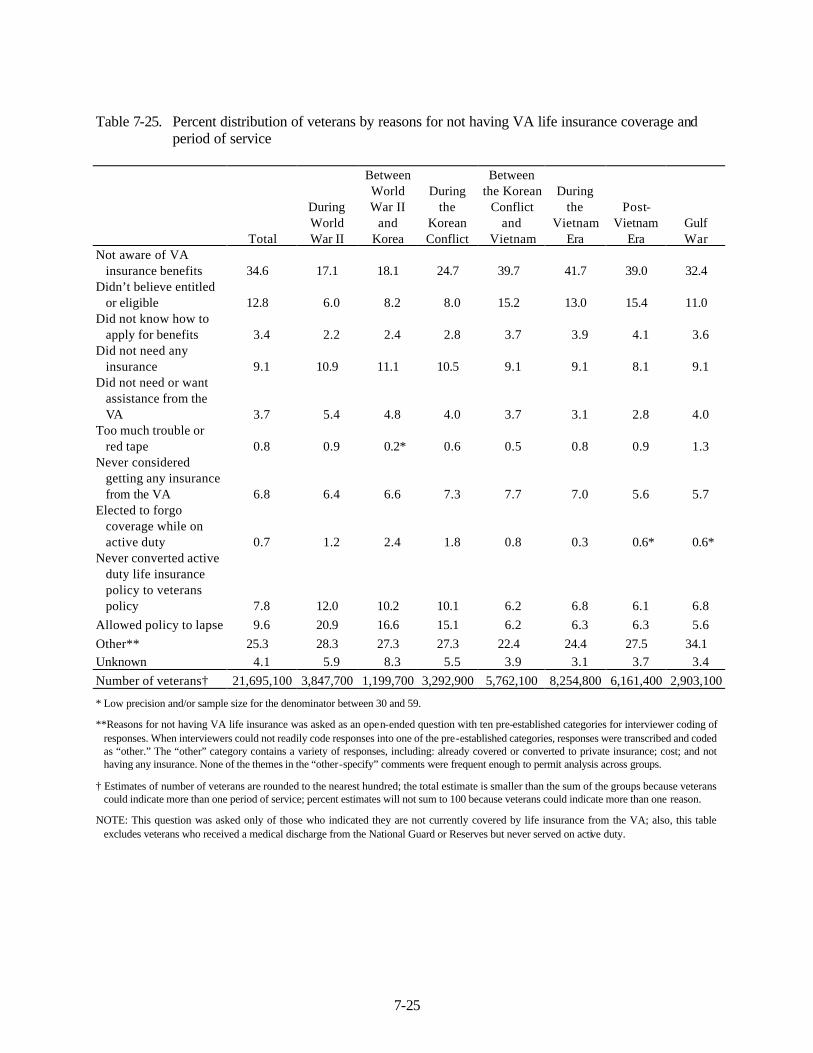
7-25
Table 7-25. Percent distribution of veterans by reasons for not having VA life insurance coverage and period of service
Total
During World War II
Between World War II
and Korea
During the
Korean Conflict
Between the Korean
Conflict and
Vietnam
During the
Vietnam Era
Post-Vietnam
Era Gulf War
Not aware of VA insurance benefits 34.6 17.1 18.1 24.7 39.7 41.7 39.0 32.4
Didn’t believe entitled or eligible 12.8 6.0 8.2 8.0 15.2 13.0 15.4 11.0
Did not know how to apply for benefits 3.4 2.2 2.4 2.8 3.7 3.9 4.1 3.6
Did not need any insurance 9.1 10.9 11.1 10.5 9.1 9.1 8.1 9.1
Did not need or want assistance from the VA 3.7 5.4 4.8 4.0 3.7 3.1 2.8 4.0
Too much trouble or red tape 0.8 0.9 0.2* 0.6 0.5 0.8 0.9 1.3
Never considered getting any insurance from the VA 6.8 6.4 6.6 7.3 7.7 7.0 5.6 5.7
Elected to forgo coverage while on active duty 0.7 1.2 2.4 1.8 0.8 0.3 0.6* 0.6*
Never converted active duty life insurance policy to veterans policy 7.8 12.0 10.2 10.1 6.2 6.8 6.1 6.8
Allowed policy to lapse 9.6 20.9 16.6 15.1 6.2 6.3 6.3 5.6 Other** 25.3 28.3 27.3 27.3 22.4 24.4 27.5 34.1 Unknown 4.1 5.9 8.3 5.5 3.9 3.1 3.7 3.4 Number of veterans† 21,695,100 3,847,700 1,199,700 3,292,900 5,762,100 8,254,800 6,161,400 2,903,100
* Low precision and/or sample size for the denominator between 30 and 59.
**Reasons for not having VA life insurance was asked as an open-ended question with ten pre-established categories for interviewer coding of responses. When interviewers could not readily code responses into one of the pre-established categories, responses were transcribed and coded as “other.” The “other” category contains a variety of responses, including: already covered or converted to private insurance; cost; and not having any insurance. None of the themes in the “other-specify” comments were frequent enough to permit analysis across groups.
† Estimates of number of veterans are rounded to the nearest hundred; the total estimate is smaller than the sum of the groups because veterans could indicate more than one period of service; percent estimates will not sum to 100 because veterans could indicate more than one reason.
NOTE: This question was asked only of those who indicated they are not currently covered by life insurance from the VA; also, this table excludes veterans who received a medical discharge from the National Guard or Reserves but never served on active duty.

7-26
Understanding VA Life Insurance Benefits. As Table 7-26 displays, only about 1 in 4
veterans agreed that they thoroughly understood VA life insurance benefits to which they are entitled.
Compared to their later-serving counterparts, veterans from earlier service periods were more likely to
agree that they thoroughly understood VA life insurance benefits to which they are entitled.
Table 7-26. Percent distribution of veterans by understanding of life insurance benefits and period of
service
Total
During World War II
Between World
War II and Korea
During the Korean Conflict
Between the Korean
Conflict and
Vietnam
During the Vietnam
Era
Post-Vietnam
Era Gulf War
Strongly agree 5.3 8.8 10.1 8.2 4.3 3.8 4.6 6.9 Agree 18.0 29.7 29.1 27.5 14.8 12.0 13.5 20.0 Neither agree nor
disagree 15.1 15.0 13.5 13.9 15.5 15.2 15.9 15.3 Disagree 27.3 22.5 22.6 23.6 27.7 29.3 29.1 27.8 Strongly disagree 25.4 8.9 10.6 15.7 26.4 32.4 32.8 27.7 Unknown 8.9 15.1 14.1 11.1 11.3 7.3 4.1 2.3 Total 100.0 100.0 100.0 100.0 100.0 100.0 100.0 100.0 Number of
veterans† 25,095,000 5,149,100 1,680,600 4,245,600 6,426,500 9,057,200 7,005,000 3,483,600
† Estimates of number of veterans are rounded to the nearest hundred; the total estimate is smaller than the sum of the groups because veterans could indicate more than one period of service.
NOTE: This table excludes veterans who received a medical discharge from the National Guard or Reserves but never served on active duty.

8-1
8. BURIAL BENEFITS
VA’s National Cemetery Administration’s memorial-related programs honor veterans with a
final resting place and lasting memorials that commemorate their service to our Nation. Veteran burial
benefits include a gravesite in any of the national cemeteries that have space available, opening and
closing of the grave, perpetual care of the gravesite, a government headstone or marker, a grave liner for
casketed remains, a burial flag22, and a Presidential Memorial Certificate at no cost to the family.
As of September 30, 2002, the Nationa l Cemetery Administration maintained more than 2.5
million gravesites at 120 national cemeteries in 39 states and Puerto Rico as well as 33 soldier’s lots and
monument sites. In addition, more than 325,000 full-casket gravesites, 68,000 in-ground gravesites for
cremated remains, and 35,900 columbarium niches are currently available. Approximately 13,900 acres of
land lie within established National Cemetery Administration installations. Just over half are undeveloped
and have the potential to provide more than 3.4 million gravesites.
In FY 2002, the National Cemetery Administration provided for more than 89,000
interments, and supplied more than 348,000 headstones and markers. In addition approximately 289,000
Presidential Memorial Certificates were delivered to the family members, friends, and loved ones of
deceased veterans.
This chapter describes NSV results related to VA burial benefits. This module of the survey
contained nine items. These nine items asked the veteran whether he or she had heard of specific burial
benefit programs (VA headstones and markers, burial in a National or State Veterans’ Cemetery,
Presidential Memorial Certificates for next of kin), and collected information on veteran burial plans and
preferences. These items also collected veteran reasons for wanting/not wanting to be buried in a
veterans’ cemetery, and asked whether the veteran intended to use a VA-provided headstone or marker.
Similar to other survey modules the “Burial Benefits” module collected information on how well the
veteran understood VA burial benefits and how difficult the veteran thought it would be to obtain
information about these benefits.
22 Burial flags are provided by the Veterans Benefits Administration (VBA)
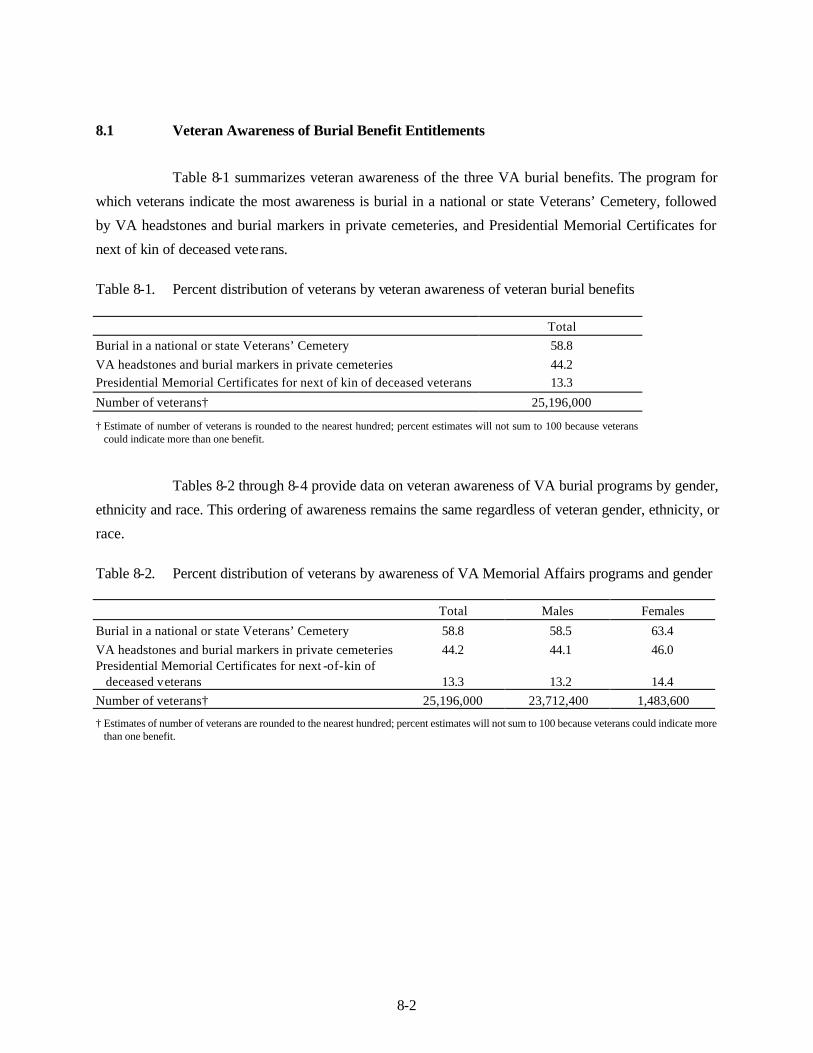
8-2
8.1 Veteran Awareness of Burial Benefit Entitlements
Table 8-1 summarizes veteran awareness of the three VA burial benefits. The program for
which veterans indicate the most awareness is burial in a national or state Veterans’ Cemetery, followed
by VA headstones and burial markers in private cemeteries, and Presidential Memorial Certificates for
next of kin of deceased vete rans.
Table 8-1. Percent distribution of veterans by veteran awareness of veteran burial benefits Total Burial in a national or state Veterans’ Cemetery 58.8 VA headstones and burial markers in private cemeteries 44.2 Presidential Memorial Certificates for next of kin of deceased veterans 13.3
Number of veterans† 25,196,000
† Estimate of number of veterans is rounded to the nearest hundred; percent estimates will not sum to 100 because veterans could indicate more than one benefit.
Tables 8-2 through 8-4 provide data on veteran awareness of VA burial programs by gender,
ethnicity and race. This ordering of awareness remains the same regardless of veteran gender, ethnicity, or
race.
Table 8-2. Percent distribution of veterans by awareness of VA Memorial Affairs programs and gender Total Males Females
Burial in a national or state Veterans’ Cemetery 58.8 58.5 63.4 VA headstones and burial markers in private cemeteries 44.2 44.1 46.0 Presidential Memorial Certificates for next -of-kin of
deceased veterans 13.3 13.2 14.4 Number of veterans† 25,196,000 23,712,400 1,483,600
† Estimates of number of veterans are rounded to the nearest hundred; percent estimates will not sum to 100 because veterans could indicate more than one benefit.

8-3
Table 8-3. Percent distribution of veterans by veteran awareness of veteran burial benefits and race One race Two or more races
Total Total
one race White
Black or African
American
American Indian or
Alaska Native Asian
Native Hawaiian or Other Pacific
Islander
Total two or
more races
American Indian or Alaska
Native/White Race
unknown VA headstones and burial
markers in private cemeteries 44.2 44.4 44.7 42.4 39.0 38.8 40.8* 44.5 43.5 38.8
Burial in a national or state Veterans Cemetery 58.8 58.8 59.2 56.7 45.7 55.0 58.1* 59.8 59.1 57.1
Presidential Memorial Certificates for next of kin of deceased veterans 13.3 13.2 12.8 16.3 16.2 17.9 14.1* 15.8 12.3 13.6
Number of veterans† 25,196,000 23,857,100 21,370,900 2,216,600 159,900 73,200 36,500 557,500 360,800 781,400
*Low precision and/or sample size for the denominator between 30 and 59. † Estimates of number of veterans are rounded to the nearest hundred; percent estimates will not sum to 100 because veterans could indicate more than one benefit.

8-4
Table 8-4. Percent distribution of veterans by veteran awareness of veteran burial benefits and ethnicity
Total Spanish, Hispanic,
or Latino
Not Spanish, Hispanic, or
Latino Burial in a national or state Veterans Cemetery 58.8 56.8 58.8 VA headstones and burial markers in private cemeteries 44.2 36.1 44.6 Presidential Memorial Certificates for next -of-kin of
deceased veterans 13.3 13.5 13.3 Number of veterans† 25,196,000 1,122,200 23,990,200
† Estimates of number of veterans are rounded to the nearest hundred; the total estimate is larger than the sum of the groups because some veterans did not provide their Ethnicity; percent estimates will not sum to 100 because veterans could indicate more than one benefit.
Table 8-5 summarizes veteran awareness of VA burial programs by age. A greater
percentage of older veterans than younger veterans indicate an awareness of burial in a national or state
Veterans’ Cemetery, and VA headstones and burial markers in private cemeteries.
Table 8-5. Percent distribution of veterans by veteran awareness of veteran burial benefits and age
Total Less than 35 years
35 - 44 years
45 - 54 years
55 - 64 years
65 - 74 years
75 years or older
Burial in a national or state Veterans’ Cemetery 58.8 47.2 52.1 58.9 58.9 62.9 64.7
VA headstones and burial markers in private cemeteries 44.2 29.9 35.6 43.0 40.9 50.6 55.7
Presidential Memorial Certificates for next of kin of deceased veterans 13.3 13.2 13.4 12.5 11.4 14.6 15.0
Number of veterans† 25,196,000 2,288,600 3,030,300 5,415,100 4,946,000 5,256,400 4,116,100
† Estimates of number of veterans are rounded to the nearest hundred; the total estimate is larger than the sum of the groups because some veterans did not provide their age; percent estimates will not sum to 100 because veterans could indicate more than one benefit.
8.2 Veteran Burial Plans
The survey also asked veterans about their burial plans in terms of the type of burial (i.e., in-
ground casket burial, cremation, or some other plan). Table 8-6 summarizes veteran burial plans in terms
of all veterans as well as by gender. In general, at a rate of approximately 2 to 1 over cremation, most
veterans indicate plans for an in-ground casket burial. About 7 percent of veterans remain undecided
about their burial plans, and nearly 3 percent indicated that they have made other plans.

8-5
Table 8-6. Percent distribution of veterans by veteran burial plans and gender
Total Males Females In-ground casket burial 59.8 60.2 53.0 Cremation 30.3 29.8 38.5 Undecided 6.6 6.7 5.1 Some other plan 2.7 2.7 2.7 Unknown 0.6 0.6 0.7* Total 100.0 100.0 100.0
Number of veterans† 25,196,000 23,712,400 1,483,600
* Low precision and/or sample size for the denominator between 30 and 59.
† Estimates of number of veterans are rounded to the nearest hundred.
When comparing male veterans to female veterans, a slightly higher percentage of male
veterans indicate plans for an in-ground casket burial than female veterans. A slightly higher percentage
of female veterans indicate plans for cremation than male veterans.
Table 8-7 examines veteran burial plans by race. Except for Asian veterans, the general
veteran preference is for an in-ground casket burial. Black/African American veterans indicated plans for
an in-ground casket burial at a rate of approximately 5.6 to 1 over cremation. About an equal number of
Asian veterans indicated an in-ground casket burial as indicated cremation. When compared to the other
racial groups, a higher percentage of Asian veterans indicated that they are presently undecided about
their burial plans.
Table 8-8 summarizes veteran burial plans by ethnicity. Spanish, Hispanic, or Latino
veterans indicated plans for an in-ground casket burial at a rate of about 2.6 to 1 over cremation. This rate
is slightly higher than that of non-Spanish, Hispanic or Latino veterans who indicated plans for an in-
ground casket burial at a rate of about 2 to 1 over cremation
Veteran burial plans by age group are summarized in Table 8-9. Veteran age and burial plans
do not appear to be strongly correlated.

8-6
Table 8-7. Percent distribution of veterans by veteran burial plans and race
One race Two or more races
Total Total
one race White
Black or African
American American Indian or Alaska Native Asian
Native Hawaiian or Other Pacific
Islander
Total two or
more races
American Indian or Alaska
Native/White Race
unknown In-ground casket burial 59.8 59.8 57.9 78.0 57.3 39.7 64.7* 52.5 48.7 65.4 Cremation 30.3 30.6 32.2 13.8 35.9 44.9 25.2* 35.3 38.9 19.9 Undecided 6.6 6.4 6.5 6.0 4.6* 13.3* 7.2* 6.6 7.4 9.9 Some other plan 2.7 2.6 2.8 1.6 2.2* 1.0* 2.9* 4.6 4.4 2.8 Unknown 0.6 0.6 0.6 0.6* 0.0 1.1* 0.0* 1.0* 0.6* 2.0* Total 100.0 100.0 100.0 100.0 100.0 100.0 100.0 100.0 100.0 100.0 Number of veterans† 25,196,000 23,857,100 21,370,900 2,216,600 159,900 73,200 36,500 557,500 360,800 781,400
* Low precision and/or sample size for the denominator between 30 and 59.
† Estimates of number of veterans are rounded to the nearest hundred.

8-7
Table 8-8. Percent distribution of veterans by veteran burial plans and ethnicity
Total Spanish, Hispanic
or Latino Not Spanish,
Hispanic or Latino In-ground casket burial 59.8 63.3 59.6 Cremation 30.3 24.2 30.7 Undecided 6.6 9.1 6.4 Some other plan 2.7 2.7* 2.7 Unknown 0.6 0.7* 0.6 Total 100.0 100.0 100.0 Number of veterans† 25,196,000 1,122,200 23,990,200
* Low precision and/or sample size for the denominator between 30 and 59.
† Estimates of number of veterans are rounded to the nearest hundred; the total estimate is larger than the sum of the groups because some veterans did not provide their Ethnicity.
Table 8-9. Percent distribution of veterans by veteran burial plans and age group
Total Less than 35 years
35 - 44 years
45 - 54 years
55 - 64 years
65 - 74 years
75 years or older
In-ground casket burial 59.8 62.8 57.8 58.0 56.7 62.9 61.7 Cremation 30.3 26.7 31.2 32.6 33.4 27.6 28.8 Undecided 6.6 7.3 7.5 6.5 7.4 5.8 5.3 Some other plan 2.7 2.3 2.8 2.2 2.1 3.1 3.5 Unknown 0.6 0.9* 0.7 0.7 0.4* 0.6 0.7 Total 100.0 100.0 100.0 100.0 100.0 100.0 100.0 Numb er of veterans† 25,196,000 2,288,600 3,030,300 5,415,100 4,946,000 5,256,400 4,116,100
* Low precision and/or sample size for the denominator between 30 and 59.
† Estimates of number of veterans are rounded to the nearest hundred; the total estimate is larger than the sum of the groups because some veterans did not provide their age.
8.2.1 Disposition of Cremated Remains for Veterans Indicating Cremation as a Burial Plan
Those veterans who indicated cremation as a burial plan were also asked what they planned
to have done with their cremated remains (i.e., placed in a columbarium, buried, scattered, or something
else). Table 8-10 indicates that nearly two-thirds of these veterans said that they planned to have their
cremated remains scattered. This finding is true of male veterans as well as female veterans.
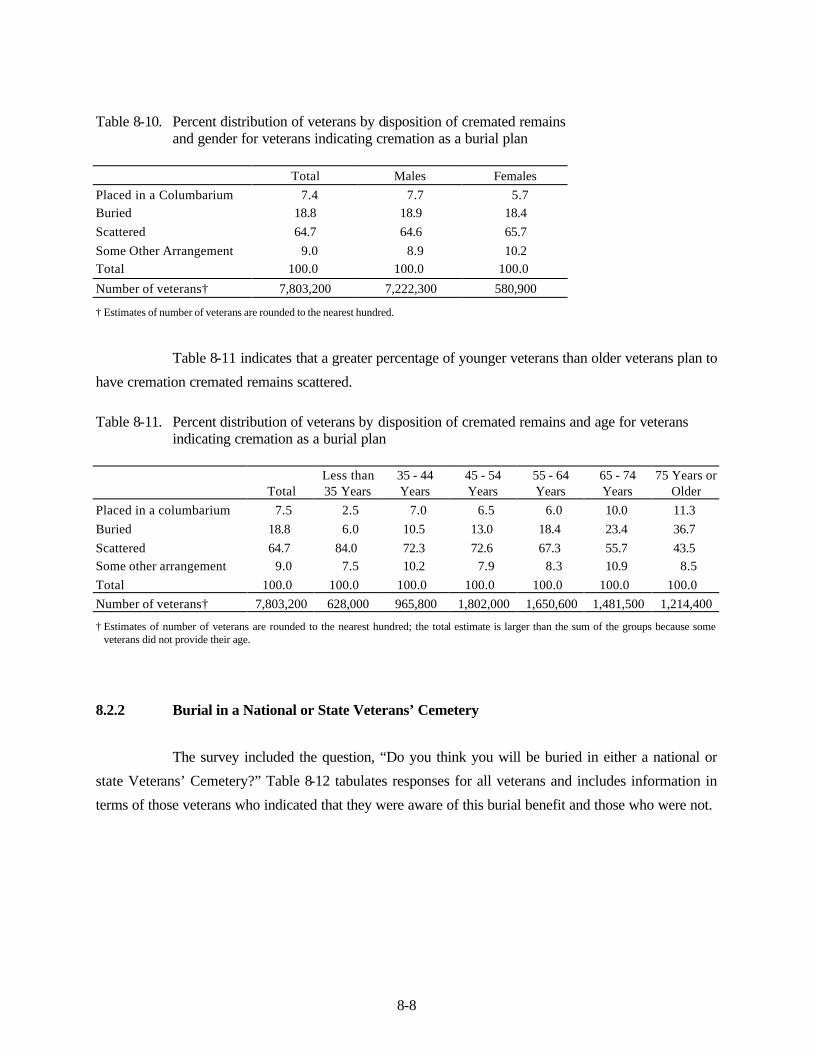
8-8
Table 8-10. Percent distribution of veterans by disposition of cremated remains and gender for veterans indicating cremation as a burial plan
Total Males Females
Placed in a Columbarium 7.4 7.7 5.7 Buried 18.8 18.9 18.4 Scattered 64.7 64.6 65.7 Some Other Arrangement 9.0 8.9 10.2 Total 100.0 100.0 100.0
Number of veterans† 7,803,200 7,222,300 580,900
† Estimates of number of veterans are rounded to the nearest hundred.
Table 8-11 indicates that a greater percentage of younger veterans than older veterans plan to
have cremation cremated remains scattered.
Table 8-11. Percent distribution of veterans by disposition of cremated remains and age for veterans
indicating cremation as a burial plan
Total Less than 35 Years
35 - 44 Years
45 - 54 Years
55 - 64 Years
65 - 74 Years
75 Years or Older
Placed in a columbarium 7.5 2.5 7.0 6.5 6.0 10.0 11.3 Buried 18.8 6.0 10.5 13.0 18.4 23.4 36.7 Scattered 64.7 84.0 72.3 72.6 67.3 55.7 43.5 Some other arrangement 9.0 7.5 10.2 7.9 8.3 10.9 8.5 Total 100.0 100.0 100.0 100.0 100.0 100.0 100.0 Number of veterans† 7,803,200 628,000 965,800 1,802,000 1,650,600 1,481,500 1,214,400
† Estimates of number of veterans are rounded to the nearest hundred; the total estimate is larger than the sum of the groups because some veterans did not provide their age.
8.2.2 Burial in a National or State Veterans’ Cemetery
The survey included the question, “Do you think you will be buried in either a national or
state Veterans’ Cemetery?” Table 8-12 tabulates responses for all veterans and includes information in
terms of those veterans who indicated that they were aware of this burial benefit and those who were not.
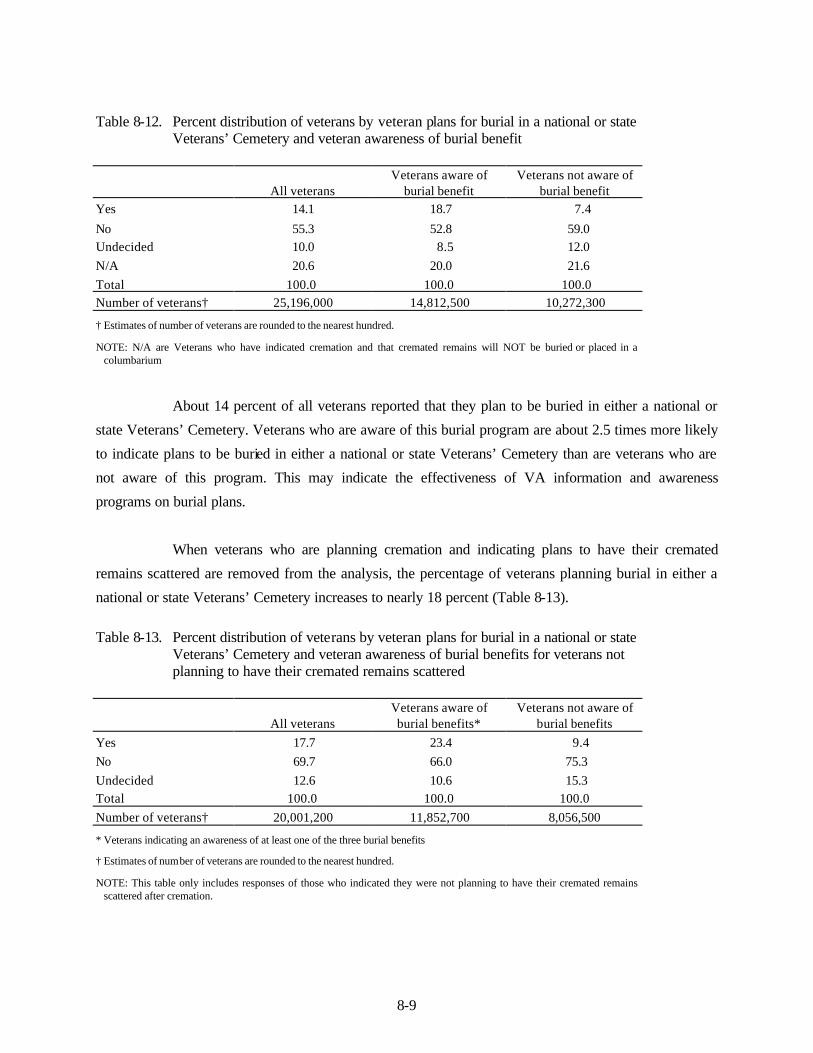
8-9
Table 8-12. Percent distribution of veterans by veteran plans for burial in a national or state Veterans’ Cemetery and veteran awareness of burial benefit
All veterans Veterans aware of
burial benefit Veterans not aware of
burial benefit Yes 14.1 18.7 7.4
No 55.3 52.8 59.0 Undecided 10.0 8.5 12.0 N/A 20.6 20.0 21.6 Total 100.0 100.0 100.0 Number of veterans† 25,196,000 14,812,500 10,272,300
† Estimates of number of veterans are rounded to the nearest hundred.
NOTE: N/A are Veterans who have indicated cremation and that cremated remains will NOT be buried or placed in a columbarium
About 14 percent of all veterans reported that they plan to be buried in either a national or
state Veterans’ Cemetery. Veterans who are aware of this burial program are about 2.5 times more likely
to indicate plans to be buried in either a national or state Veterans’ Cemetery than are veterans who are
not aware of this program. This may indicate the effectiveness of VA information and awareness
programs on burial plans.
When veterans who are planning cremation and indicating plans to have their cremated
remains scattered are removed from the analysis, the percentage of veterans planning burial in either a
national or state Veterans’ Cemetery increases to nearly 18 percent (Table 8-13).
Table 8-13. Percent distribution of veterans by veteran plans for burial in a national or state
Veterans’ Cemetery and veteran awareness of burial benefits for veterans not planning to have their cremated remains scattered
All veterans Veterans aware of burial benefits*
Veterans not aware of burial benefits
Yes 17.7 23.4 9.4 No 69.7 66.0 75.3 Undecided 12.6 10.6 15.3 Total 100.0 100.0 100.0 Number of veterans† 20,001,200 11,852,700 8,056,500
* Veterans indicating an awareness of at least one of the three burial benefits
† Estimates of number of veterans are rounded to the nearest hundred.
NOTE: This table only includes responses of those who indicated they were not planning to have their cremated remains scattered after cremation.

8-10
Reasons for Wanting/Not Wanting to be Buried in a National or State Veterans’
Cemetery. As a follow-up to the question, “Do you think you will be buried in either a national or state
Veterans’ Cemetery,” veterans responding with a “Yes” or a “No” are asked to clarify their response by
giving the main reasons for their answer. Veterans were able to provide an unprompted free response to
this question, and multiple reasons were permitted. These responses were recorded in several pre-
established categorical responses for each item.
Reasons for Wanting to be Burie d in a National or State Veterans’ Cemetery. Table 8-
14 provides the tabulations of reasons provided by veterans for wanting to be buried in either a national or
state Veterans’ Cemetery. Table 8-14 also lists the pre-established categories for recording the veteran
responses. The most mentioned reason given for wanting to be buried in either a national or state
Veterans’ Cemetery was “honor of burial in a National Shrine.” It was mentioned by 47.2 percent of the
veterans. “Cost” was the next most mentioned reason at 26.9 percent, followed by “friends or family
buried there” (16.9 percent). “Quality of services” was only mentioned by 10 percent of the veterans.
Table 8-14. Percent distribution of veterans by main reasons given for
wanting burial in a national or state Veterans’ Cemetery Total The honor of burial in a national shrine 47.2 Cost 26.9 Friends or family buried there 16.9 Quality of services 10.0 Some other reason 23.4
Number of veterans† 3,545,600
† Estimate of number of veterans is rounded to the nearest hundred; percent estimates will not sum to 100 because veterans could indicate more than one reason.
NOTE: This table only includes responses of those who indicated they were planning to be buried in a national or state veterans cemetery.
Reasons for Not Wanting to be Buried in a National or State Veterans’ Cemetery. Table
8-15 summarizes veterans’ reasons for not wanting to be buried in either a national or state Veterans’
Cemetery. The most mentioned reason given for not wanting to be buried in either a national or state
Veterans’ Cemetery was “wanted location close to other family members.” It was mentioned by 44.6
percent of the veterans. “Made other arrangements” was the next most mentioned reason at 41.2 percent.
Remaining reasons were mentioned by less than 10 percent of the veterans.
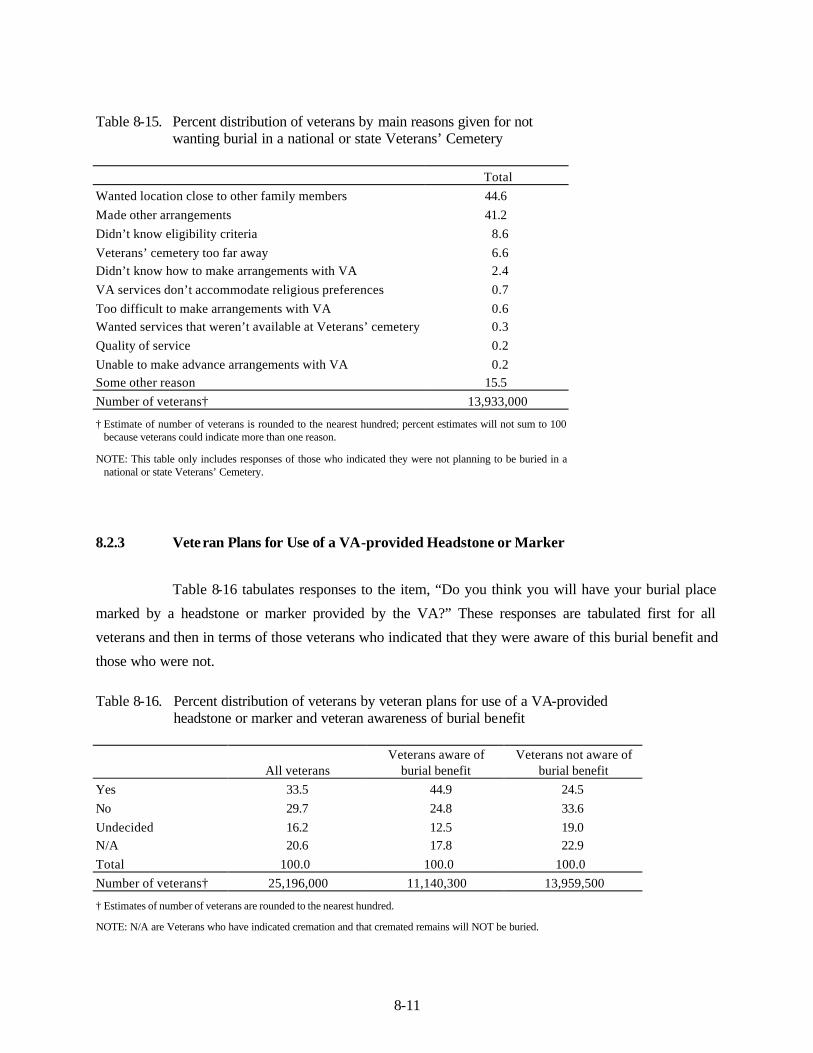
8-11
Table 8-15. Percent distribution of veterans by main reasons given for not wanting burial in a national or state Veterans’ Cemetery
Total Wanted location close to other family members 44.6 Made other arrangements 41.2 Didn’t know eligibility criteria 8.6 Veterans’ cemetery too far away 6.6 Didn’t know how to make arrangements with VA 2.4 VA services don’t accommodate religious preferences 0.7 Too difficult to make arrangements with VA 0.6 Wanted services that weren’t available at Veterans’ cemetery 0.3 Quality of service 0.2 Unable to make advance arrangements with VA 0.2 Some other reason 15.5 Number of veterans† 13,933,000
† Estimate of number of veterans is rounded to the nearest hundred; percent estimates will not sum to 100 because veterans could indicate more than one reason.
NOTE: This table only includes responses of those who indicated they were not planning to be buried in a national or state Veterans’ Cemetery.
8.2.3 Veteran Plans for Use of a VA-provided Headstone or Marker
Table 8-16 tabulates responses to the item, “Do you think you will have your burial place
marked by a headstone or marker provided by the VA?” These responses are tabulated first for all
veterans and then in terms of those veterans who indicated that they were aware of this burial benefit and
those who were not.
Table 8-16. Percent distribution of veterans by veteran plans for use of a VA-provided
headstone or marker and veteran awareness of burial benefit
All veterans Veterans aware of
burial benefit Veterans not aware of
burial benefit Yes 33.5 44.9 24.5 No 29.7 24.8 33.6 Undecided 16.2 12.5 19.0 N/A 20.6 17.8 22.9 Total 100.0 100.0 100.0 Number of veterans† 25,196,000 11,140,300 13,959,500
† Estimates of number of veterans are rounded to the nearest hundred.
NOTE: N/A are Veterans who have indicated cremation and that cremated remains will NOT be buried.
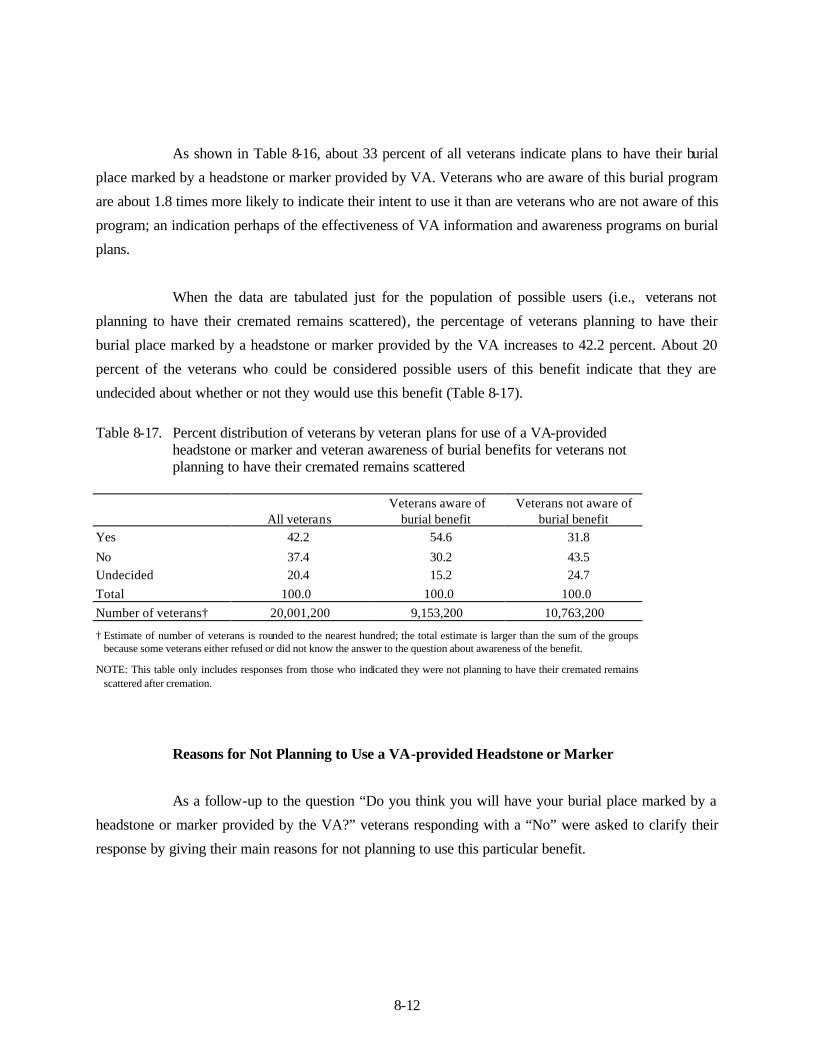
8-12
As shown in Table 8-16, about 33 percent of all veterans indicate plans to have their burial
place marked by a headstone or marker provided by VA. Veterans who are aware of this burial program
are about 1.8 times more likely to indicate their intent to use it than are veterans who are not aware of this
program; an indication perhaps of the effectiveness of VA information and awareness programs on burial
plans.
When the data are tabulated just for the population of possible users (i.e., veterans not
planning to have their cremated remains scattered), the percentage of veterans planning to have their
burial place marked by a headstone or marker provided by the VA increases to 42.2 percent. About 20
percent of the veterans who could be considered possible users of this benefit indicate that they are
undecided about whether or not they would use this benefit (Table 8-17).
Table 8-17. Percent distribution of veterans by veteran plans for use of a VA-provided
headstone or marker and veteran awareness of burial benefits for veterans not planning to have their cremated remains scattered
All veterans Veterans aware of
burial benefit Veterans not aware of
burial benefit Yes 42.2 54.6 31.8
No 37.4 30.2 43.5 Undecided 20.4 15.2 24.7 Total 100.0 100.0 100.0 Number of veterans† 20,001,200 9,153,200 10,763,200
† Estimate of number of veterans is rounded to the nearest hundred; the total estimate is larger than the sum of the groups because some veterans either refused or did not know the answer to the question about awareness of the benefit.
NOTE: This table only includes responses from those who indicated they were not planning to have their cremated remains scattered after cremation.
Reasons for Not Planning to Use a VA-provided Headstone or Marker
As a follow-up to the question “Do you think you will have your burial place marked by a
headstone or marker provided by the VA?” veterans responding with a “No” were asked to clarify their
response by giving their main reasons for not planning to use this particular benefit.

8-13
Table 8-18 indicates that approximately 42 percent of veterans who indicated that they
would not use this benefit reported that they had “made other arrangements” as a reason for not planning
to mark their burial place with a headstone or marker provided by VA.
Table 8-18. Percent distribution of veterans by main reasons given for not
planning to use a VA-provided headstone or marker Total Made other arrangements 42.3 Didn’t know about markers and headstones for veterans 35.9 Want headstone similar to other family members 13.7 Doesn’t like VA markers or headstones 4.0 Number of veterans† 7,486,100
† Estimate of number of veterans is rounded to the nearest hundred; percent estimates will not sum to 100 because veterans could indicate more than one reason.
NOTE: This table only includes responses from those who indicated they were not planning to use a VA-provided headstone or marker.
About 36 percent of these veterans indicated that they “didn’t know about markers and
headstones for veterans” as a reason for not planning to mark their burial place with a VA-provided
headstone or marker.
8.3 Understanding Veteran Burial Benefits
As a measure of their understanding of their burial benefits, veterans were asked how much
they agreed or disagreed with the statement, “I thoroughly understand the veteran benefits available to
me.” The response scale is a 5-point “Strongly agree” through “Strongly disagree” scale with a mid-point
of “Neither agree nor disagree.”
Table 8-19 summarizes responses to the item measuring veteran understanding of burial
benefits. This table includes data for veterans who indicated that they were aware of their burial benefits
(i.e., aware of at least one of the three programs), as well as data for veterans who did not indicate an
awareness of any VA burial benefits.

8-14
Table 8-19. Percent distribution of veterans by veteran understanding of veteran burial benefits and veteran awareness of burial benefits
All veterans Veterans aware of burial benefits*
Veterans not aware of burial benefits
Strongly agree 6.3 8.4 1.9
Agree 26.7 34.8 10.6 Neither agree nor disagree 17.2 18.4 14.9 Disagree 26.9 24.3 32.1 Strongly disagree 18.3 10.3 34.4 Did not answer or did not know 4.6 3.8 6.1 Total 100.0 100.0 100.0 Number of veterans† 25,196,000 16,820,700 8,375,400
* Veterans indicating an awareness of at least one of the three burial benefits.
† Estimates of number of veterans are rounded to the nearest hundred.
About 33 percent of veterans reported that they thoroughly understand (“strongly agree” or
“agree”) the veteran burial benefits available to them, while 45 percent indicated that they do not
thoroughly understand (“disagree” or “strongly disagree”) the veteran burial benefits available to them.
As would be expected, veterans aware of these programs are more likely to understand them. This is a
possible indication that VA burial benefit awareness programs are also informative.
8.3.1 Ease or Difficulty in Obtaining Information about Veteran Burial Benefits
As a measure of the veteran’s perception about how easy or difficult it would be to obtain
information about veteran burial benefits, the veteran is asked, “If your family needed to get information
about veteran burial benefits, how easy or difficult do you think it would be for them to find it?” The
response scale is a 5-point “very easy” through “very difficult” scale with a mid-point of “neither easy nor
difficult.”
Table 8-20 provides the responses to the item measuring a veteran’s perception of the ease or
difficulty of obtaining burial benefits information. In addition to tabulations for all veterans, Table 8-20
includes data for veterans who indicated that they were aware of their burial benefits (i.e., aware of at
least one of the three programs), and data for veterans who did not indicate an awareness of any VA
burial benefits.

8-15
Table 8-20. Percent distribution of veterans by ability to obtain information about veteran burial benefits and veteran awareness of burial benefits
All veterans Veterans aware of burial benefits*
Veterans not aware of burial benefits
Very easy 11.6 14.8 5.3
Easy 33.7 38.8 23.4 Neither easy nor difficult 11.8 11.8 11.9 Difficult 27.2 23.2 35.2 Very difficult 11.7 8.0 19.0 Did not answer or did not know 4.0 3.4 5.2 Total 100.0 100.0 100.0 Number of veterans† 25,196,000 16,820,700 8,375,400
* Veterans indicating an awareness of at least one of the three burial benefits.
† Estimates of number of veterans are rounded to the nearest hundred
About 45 percent of all veterans indicated that they thought it would be easy or very easy to
obtain information about veteran burial programs, while approximately 39 percent indicated that they
thought it would be difficult to very difficult to obtain information about veteran burial benefits. This
finding does not seem to be influenced by veteran awareness of VA burial programs. Slightly more than
one half (53.6 percent) of the veterans who indicated an awareness of veteran burial programs also
reported that they thought it would be easy or very easy to obtain information about veteran burial
benefits. About an equal proportion (54.2 percent) of the veterans who did not indicate an awareness of
veteran burial programs also indicated that they thought it would be difficult to very difficult to obtain
information about veteran burial benefits. The finding regarding the ease of difficulty in obtaining VA
burial information is probably more influenced by the fact that older veterans seem to be more confident
that it would be easy to very easy to obtain information about burial benefits than younger veterans (Table
8-21), and older veterans represent a greater proportion of the veteran population.
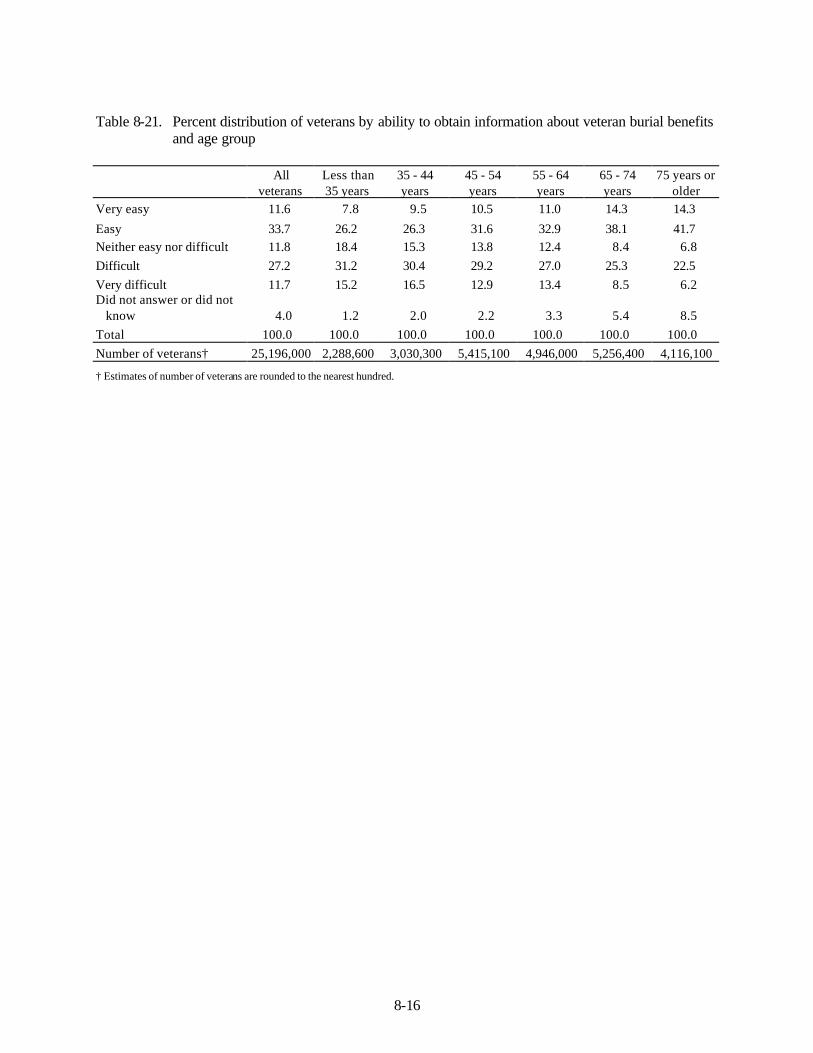
8-16
Table 8-21. Percent distribution of veterans by ability to obtain information about veteran burial benefits and age group
All
veterans Less than 35 years
35 - 44 years
45 - 54 years
55 - 64 years
65 - 74 years
75 years or older
Very easy 11.6 7.8 9.5 10.5 11.0 14.3 14.3
Easy 33.7 26.2 26.3 31.6 32.9 38.1 41.7 Neither easy nor difficult 11.8 18.4 15.3 13.8 12.4 8.4 6.8 Difficult 27.2 31.2 30.4 29.2 27.0 25.3 22.5 Very difficult 11.7 15.2 16.5 12.9 13.4 8.5 6.2 Did not answer or did not
know 4.0 1.2 2.0 2.2 3.3 5.4 8.5 Total 100.0 100.0 100.0 100.0 100.0 100.0 100.0 Number of veterans† 25,196,000 2,288,600 3,030,300 5,415,100 4,946,000 5,256,400 4,116,100
† Estimates of number of veterans are rounded to the nearest hundred.

G-17
GLOSSARY OF TERMS
CATI Computer-Assisted Telephone Interviewing
CHAMPUS Civilian Health and Medical Program of the Uniformed Services; an insurance program which covers active duty and retired career military persons, their dependents and survivors.
Domiciliary Facility that provides care and living space for persons who cannot otherwise live independently. Domiciliaries do not provide skilled nursing services.
Enrollment Groups Seven-level enrollment system. Enrollment groups range from veterans with no compensated service-related disabilities who have income or net worth above a specified threshold and who agree to pay specified co-payments (Group 7) to service-connected conditions rated 50 percent or more disabling (Group 1).
Health Care Priority Groups
Veteran population estimates or health care user estimates classified using self-reported survey data simulating enrollment group criteria.
HMO Health Maintenance Organization.
Hispanic The National Survey of Veterans definition includes answers to survey questions on Race and Hispanic Origin (Questions SD9 and SD10). Veterans who said “yes” when asked if they were of Hispanic origin or who did not answer “yes” to any of the four offered racial groups, but self-assessed their race as “other” and provided a “race” that the Census Bureau defines as “Hispanic” were classified as Hispanic.
Inpatient Care Treatment for at least one overnight stay at a hospital or other similar medical facility such as specialized treatment centers for drug/alcohol abuse.
Medicaid State health insurance programs for low-income persons.
Medicare Federal health insurance programs which cover everyone 65 and over as well as certain disabled persons.
Military Retirement Pay Monetary payments received by service member upon retirement as a result of successful completion of required years of active and reserve service, based on grade and total service longevity.

G-18
Outpatient Care Visits to doctors offices, clinics, HMOs, and hospital outpatient facilities; outpatient care also includes psychiatric and substance abuse treatments, routine examinations, and shots.
Public health insurance The National Survey of Veterans definition: Medicare, Medicaid, CHAMPUS, military or DoD health programs, Indian health insurance, and other state or federal public health programs.
RDD Random Digit Dialing
Service-connected disability (SC) compensation
Monetary benefits, called disability compensations, are paid to veterans who are disabled by an injury or disease incurred or aggravated during active military service in the line of duty. The service of the veteran must have been terminated through separation or discharge under conditions that were other than dishonorable. Monetary benefits are related to the residual effects of the injury or disease. The amounts of the benefits are set by Congress. Disability compensation is paid in monthly payments.
Service-connected disability rating
Classification based on determination of percent disabled. Typically limited to disabilities attributable to injury or disease incurred or aggravated during active military service.
Service-related disability or disabling condition
Self-reported disability or disabling condition which is thought to be service-related by respondent. Veterans in this category may or may not have a SC rating or receive SC disability compensation.
TRICARE The Department of Defense’s regional managed health care program for service families.
VA pension Veterans may be eligible for support if they have limited income when they have 90 days or more of active military service, at least one day of which was during a period of war. Their discharge from active duty must have been under conditions other than dishonorable. They must be permanently and totally disabled for reasons neither traceable to military service nor to willful misconduct. Payments are made to qualified veterans to bring their total income, including other retirement or Social Security income, to an established support level. Countable income may be reduced by unreimbursed medical expenses. Pension is not payable to those who have assets that can be used to provide adequate maintenance.

G-19
Veteran The National Survey of Veterans definition: An individual who served their full obligation of active duty service in the military, or received an early discharge for a medical condition, hardship, reduction in force, or at the convenience of the military. Individuals who received dishonorable discharges or who were still on active duty at the time of the survey were not eligible.