2001 Jepson monitoring results -...
46
EXOTIC AND NATIVE PLANT MONITORING AT JEPSON PRAIRIE PRESERVE, 2001 Prepared for: Julian Meisler Solano County Farmlands and Open Space Foundation PO Box 115 Fairfield, CA 94533 Prepared by: Tedmund J. Swiecki, Ph.D. Elizabeth Bernhardt, Ph.D. August 31, 2001 (reissued with minor corrections 7/19/2002) PR Project No. 2001-0401 P HYTOSPHERE R ESEARCH 1027 Davis Street, Vacaville, CA 95687-5495 707-452-8735 email: [email protected] URL: http://phytosphere.com
Transcript of 2001 Jepson monitoring results -...

EXOTIC AND NATIVE PLANT MONITORING AT JEPSON PRAIRIEPRESERVE, 2001
Prepared for:
Julian MeislerSolano County Farmlands and Open Space FoundationPO Box 115Fairfield, CA 94533
Prepared by:
Tedmund J. Swiecki, Ph.D.Elizabeth Bernhardt, Ph.D.
August 31, 2001(reissued with minor corrections 7/19/2002)
PR Project No. 2001-0401
P H Y T O S P H E R E R E S E A R C H
1027 Davis Street, Vacaville, CA 95687-5495707-452-8735email: [email protected] URL: http://phytosphere.com

Exotic and native plant monitoring, Jepson Prairie, 2001 page 2 of 46
P H Y T O S P H E R E R E S E A R C H
TABLE OF CONTENTS
Acknowledgements..................................................................................................................... 2Executive Summary..................................................................................................................... 3Introduction................................................................................................................................ 4Methods ..................................................................................................................................... 4
Plant species monitored........................................................................................................... 4Transect based monitoring....................................................................................................... 5
Plant cover estimates............................................................................................................ 9Polygon monitoring................................................................................................................10Additional site variables .........................................................................................................10Data analysis ..........................................................................................................................10
Results and Discussion...............................................................................................................10Comparison of spring and summer ratings...............................................................................10
Native species ....................................................................................................................10Exotic species .....................................................................................................................11
Overall species distribution ....................................................................................................12Overall correlations between targeted weeds and natives ........................................................16
Unweighted versus weighted cover rank sums.....................................................................16Overall target weed and native cover by pasture .....................................................................16Soil type and the distribution of target exotic and native species ..............................................17Correlation of management practices with soil type and exotic and native species distribution.21
Effects of grazing intensity ...................................................................................................22Effects of fire .......................................................................................................................22Interaction between fire and grazing....................................................................................23
Polygon monitoring................................................................................................................24Comments on methodology....................................................................................................25Comparisons with other research ............................................................................................27
Spread of target weeds ........................................................................................................27Factors associated with plant population levels ....................................................................27
Conclusions...............................................................................................................................28Literature cited...........................................................................................................................46
ACKNOWLEDGEMENTS
This project is funded by a CALFED grant to the Solano County Farmlands and Open SpaceFoundation (SCFOSF). We would like to acknowledge the help of SCFOSF staff members JulianMeisler and Ken Poerner, as well as input from Carol Witham, Kevin Rice, and Susan Harrison inthe design of native plant monitoring methods.

Exotic and native plant monitoring, Jepson Prairie, 2001 page 3 of 46
P H Y T O S P H E R E R E S E A R C H
EXECUTIVE SUMMARY
This report describes the development of a monitoring system to assess populations of selectedexotic and native plants at the Jepson Prairie Preserve. The monitoring system is primarily basedon the use of permanent belt transects (20 m wide) that traverse all of the pastures at the preserve.Transects are divided into 50 m long segments for purposes of data collection and analysis.Percent cover for each monitored species within each transect is estimated visually and assigned toone of three cover categories. Specific point/polygon mapping is used in conjunction with thetransect system to monitor rarely occurring target weeds. Initial monitoring along the transects wasconducted during a one week period in mid-April 2001. Two transects were resurveyed in June2001 for comparison with spring monitoring. This report discusses the sampling method in detailand presents results of the baseline monitoring. Preliminary statistical analyses show significantassociations between plant cover and soil type, burning, and grazing intensity. Among the targetweeds surveyed, perennial pepperweed (Lepidium latifolium) appears to have spread significantlysince 1995.

Exotic and native plant monitoring, Jepson Prairie, 2001 page 4 of 46
P H Y T O S P H E R E R E S E A R C H
INTRODUCTION
Jepson Prairie Preserve is managed to maintain a Central Valley vernal pool and native grasslandecosystem. The Preserve currently supports a wide diversity of native plants as well as a numberof exotic plants. Some of these exotic plants have the potential to displace native plants andseriously degrade the integrity of the ecosystem. The purpose of this project is to develop a systemto monitor exotic and native plants so that changes in vegetation can be detected and hopefullycorrected before they lead to serious degradation of the ecosystem.
Several factors needed to be taken into consideration in the design of the monitoring system. First,soil conditions at Jepson Prairie are diverse, both in terms of soil chemistry andmicrotopographical relief. These soil factors strongly influence plant distribution. Hence, in orderto make valid comparisons between different years, variation due to differences in soil type ormicrotopography should be eliminated. This is most readily accomplished by ensuring that thesame specific areas are resurveyed in successive years. Otherwise, changes observed may be dueto positional change of the observer rather than to actual change in species composition.
Second, the monitoring method needs to be as independent of observer bias as possible.Monitoring will be conducted over a period of many years, so it is likely that different personnelwill be collecting data in different years. Subjective cover ratings, such as those used in the 1995survey (The Nature Conservancy 1996) may be interpreted differently by different evaluators. Ifthe cover of a given species is assigned different cover ratings by different observers, variation isadded to the data set which obscures actual cover changes. To the degree possible, vegetationassessments need to be objective and quantifiable to reduce this source of error. However, giventhe constraints of time and resources available for monitoring, assessment methods must also berelatively simple and fast, while still maintaining a high level of reproducibility.
Changes in weather conditions, such as the timing and amount of winter rainfall, can favor somespecies and disfavor others. Hence, some of the year to year variation in vegetation compositionwill be associated with weather conditions alone. By minimizing error associated with othercontrollable factors, such as location and observer bias, our ability to model the variationassociated with weather will be improved.
One of the major questions for preserve managers is whether management practices such asburning and grazing are having their desired effects and whether changes in the timing, frequency,and/or intensity of these practices can be used to provide more effective control of target weeds.The data from the annual native and exotic plant monitoring may be used to assess the impacts ofvarious management inputs, but only certain comparisons may be valid if multiple factors thataffect plant cover are confounded. Planned studies are needed to investigate the effects of variousmanagement regimes, but the design and execution of such studies is beyond the scope of themonitoring effort. Nonetheless, the monitoring data can be used to address certain managementquestions and may also provide information that can be used to form hypotheses that can be testedthrough controlled experiments.
METHODS
Plant species monitored
Targeted exotic plants to include in weed monitoring were chosen based on conversations withFoundation staff, and review of the earlier weed monitoring program results by The NatureConservancy (1996). The targeted weeds have the potential to displace native species at the

Exotic and native plant monitoring, Jepson Prairie, 2001 page 5 of 46
P H Y T O S P H E R E R E S E A R C H
preserve. With the exception of Taeniatherum caput-medusae, most target weeds (Table 1)currently have relatively limited distributions and/or populations. Controlling the spread and/ordensity of the targeted exotics may be possible through available management practices. Anumber of common weedy species, including Bromus diandrus (ripgut brome) and Loliummultiflorum (annual ryegrass), have not been included on the list because they are widespread,occur in relatively high densities, and are not currently thought to be manageable. The targetedweed species include perennial forbs, late season annual forbs, and grasses. Erodium spp. wereincluded in the monitoring of exotics to represent the early season exotic forb plant guild (Pollakand Kan 1998) even though they are not considered to be targeted exotics.
The list of plants to include in native plant monitoring (Table 2) was chosen after consulting withKevin Rice (UC Davis) and Carol Witham (Vernalpools.org). Species were selected as commonrepresentatives of native plant guilds (native graminoids, native early forbs, and native late forbs)described in Pollak and Kan (1998).
Transect based monitoring
We established a system of parallel belt transects which form the backbone of the monitoringeffort (Figures 1 and 2). We placed at least 1 transect in each pasture. We used the mapped soiltypes (Bates 1977) to guide placement of transects to ensure that most or all of the soil typespresent within each pasture were represented within that pasture's transect(s). In a few instances,transects were divided into offset segments or legs to avoid areas that could not be sampled (e.g.,pond in Norris pasture, transect 18).
We used a handheld Garmin� 12XL GPS receiver operating without differential correction toestablish the starting point of each transect and to navigate along transects in the field. The GPSdisplay was set to UTM coordinates which display position as X and Y coordinates in meters. Eachtransect was divided into segments 50 m long. Segment length was determined using GPSreadings. For each transect segment, an area extending out approximately 10 m on either side ofthe centerline of the transect was evaluated. Hence, each transect segment covered an area ofabout 1000 m2 (50 by 20 m=0.1 ha). A measuring tape was used to help the evaluators determinethe 10 m distance from the centerline initially and was used for spot checking visual distanceestimates during the evaluation. Because the length of most transects was not an exact multiple of50, the final segment in most transects was either slightly longer or shorter than the 50 m targetlength. The total area surveyed in the transect system amounts to about 5% of the total area of thepastures at the Jepson Prairie Preserve, excluding Olcott Lake (Table 3). The distribution oftransect segments by pasture is shown in Table 4.
We placed a cylindrical galvanized steel post (about 1.2 m tall) with an attached perforatedgalvanized plate (8 by 18 cm) at the start and end of each transect. The 6 posts that are not locatedadjacent to fence lines (transects 4, 15 and 18) are also painted with red heat-resistant paint toincrease their visibility.

Exotic and native plant monitoring, Jepson Prairie, 2001 page 6 of 46
P H Y T O S P H E R E R E S E A R C H
Table 1. Monitored exotic plant species arranged by plant family.
Common name Scientific name Category Abbreviationusedoccasionally inreport
ApiaceaeFennel Foeniculum vulgare late perennial forbAsteraceaeItalian thistle Carduus pycnocephalus late annual forb ItalTYellow star-thistle Centaurea solstitialis late annual forb YSTPurple star-thistle Centaurea calcitrapa late annual forb PSTBull thistle Cirsium vulgare late annual forbWild lettuce Lactuca serriola late annual forb LactMilk thistle Silybum marianum late annual forbCocklebur Xanthium strumarium late annual forbBrassicaceaePerennial pepperweed Lepidium latifolium late perennial forb PepGeraniaceaeFilaree1 Erodium spp. early annual forbPoaceaeGoat grass Aegilops cylindrica annual grassMedusahead grass Taeniatherum caput-medusae annual grass Med1Erodium spp. are not considered to be target weeds.
Table 2. Monitored native plants arranged by plant family.
Common name Scientific name Category Abbreviationusedoccasionallyin report
AsteraceaeGoldfields Lasthenia spp.
(species with conspicuous rayflowers, including L. californica andL. fremontii)
early annual forb Goldfields
Yarrow Achillea millefolium late perennial forb AchilleaPoaceaeAnnual hairgrass Deschampsia danthonioides annual grass DeschSemaphore grass Pleuropogon californicus annual grass PleuroPurple needle grass Nassella pulchra perennial grass NassellaScrophulariaceaeButter and eggs Triphysaria eriantha ssp. eriantha early annual forb TriphysViolaceaeJohnny-jump-up Viola pedunculata early perennial forb Viola

Exotic and native plant monitoring, Jepson Prairie, 2001 page 7 of 46
P H Y T O S P H E R E R E S E A R C H
Figure 1. Transect segment locations superimposed on pasture map and soil types. Pasture names arein blue. Numbers assigned to each transect (1 to 20) are shown in black. Black squares which mark
transect segments are centered over the midpoint of the segment and are not to scale. Soil types:AoA=Antioch - San Ysidro complex, Pc=Pescadero clay loam, Pe=Pescadero clay, SeA=San Ysidro
sandy loam, Sh=Solano loam, W=water.

Exotic and native plant monitoring, Jepson Prairie, 2001 page 8 of 46
P H Y T O S P H E R E R E S E A R C H
Figure 2. Transect segments, pasture outlines, and soil type outlines superimposed on digital orthoimagery of the preserve (June 1993). Soil type outlines are in light blue. Pasture names are in dark blue.
Numbers assigned to each transect (1 to 20) are shown in black. Black squares which mark transectsegments are centered over the midpoint of the segment and are not to scale.

Exotic and native plant monitoring, Jepson Prairie, 2001 page 9 of 46
P H Y T O S P H E R E R E S E A R C H
Table 3. Transect dimensions relative to Jepson Prairie Preserve acreage.
Total transect length 16,115 m (10 miles)Transect width 20 mTotal area covered by transects 32.23 haTotal Preserve pasture area 602.8 ha (1,490 acres)Percent sampled in transects 5.35%
Table 4. List of pastures monitored, including approximate pasture areas (based on grazing records),transect segments, and approximate sample percentage. Please note that pasture areas calculated from
ArcView differ from those used in grazing records. To maintain consistency with other documents, wehave used areas reported in the grazing records. Areas of the nongrazed Docents, Dozier, and West of
Railroad pastures are based on ArcView calculations because their areas are not reported in grazingrecords.
Pasture Approximatearea (acres)
Approximate area (ha)
Transectnumber(s)
Number oftransectsegments
Approximatesample
percentageBuck 100 40 16 17 4Corral 20 8 12 6 7Docents 23 9 14 14 15Dozier 3.5 1.4 2 2 14Eucalyptus 370 150 5, 6, 7 81 5Norris 120 49 17, 18 17 4North Half Section24
340 138 8, 9 64 5
North of Barn 150 61 19, 20 32 5Northeast Barker 15 6 3 5 8Northwest Barker 15 6 1 9 15South Half Section 24 248 100 10, 11 53 5South of Calhoun Cut 35 14 13 9 6Triangle 35 14 4 8 6West of Railroad 15 6 15 7 12
Plant cover estimates
We visually estimated the amount of cover of each of the monitored plant species within eachtransect segment using the cover classes shown in Table 5 below. We developed visual depictionsof the cover classes to aid evaluators in assigning cover classes.
Table 5. Cover classes used for estimating exotic and native plant cover.
Cover classrank
Plant cover Equivalent area within 0.1 hatransect segment
0 Not observed Not observed1 >0 to <1% cover <10 square meters2 1% to 10% cover 10 to 100 square meters3 >10% cover >100 square meters

Exotic and native plant monitoring, Jepson Prairie, 2001 page 10 of 46
P H Y T O S P H E R E R E S E A R C H
Initial weed and native plant cover ratings were made between 12 and 18 April 2001 by theauthors of this report. On 23 June 2001, we reassessed weed cover in transects 6 and 8 (Figure 1)to determine how weed ratings are affected by the assessment date.
Polygon monitoring
We also tested the use of GPS receivers to map polygons (large patches) and/or points (smallpatches) that represent populations of certain weed species observed beyond the transects. Formapped weeds we recorded species and the number of weeds present by approximate countclasses (1-10, 11-50, 51-100, 101-500, >500). We also characterized the predominantmicrotopography at the site of weed occurrence using the following categories: depressed area(e.g. swale or pool), flat (average elevation), or elevated area (e.g., mound). Individual weeds orsmall patches (<10 m along one axis) were recorded as points. Larger patches were mapped byrecording the coordinates of two or more points along the outer border of the patch.
Additional site variables
GIS layers of the mapped soil type were downloaded from the USDA National SSURGO database.Grazing records for the interval July 1993 through June 2000 were obtained from the grazerthrough SCFOSF and were entered into a spreadsheet for summarization and calculation ofderived variables. Grazing data were expressed as average AUM (animal unit months) per acre foreach pasture. We also obtained fire records for the period 1995 through 2000 from Ken Poernerof SCFOSF. No burning occurred in 1996, 1997, or 1998.
Data analysis
We used JMP statistical software (SAS Inc., Cary NC) for data analysis. Unless otherwise indicated,effects or differences are referred to as significant if P≤0.05. The individual cover class rankswere treated as ordinal variables. We used ordinal logistic regression to test for effects of selectedpredictors on the cover rank outcome. We also used analysis of variance and analysis ofcovariance to compare sums of cover class ranks. For these analyses, sums of cover class rankswithin transect segments were transformed to the square root of (rank sum + 0.5) prior to analysisto stabilize the variance (Steele and Torrie 1960). We used a paired t-test to compare April andJune monitoring results.
RESULTS AND DISCUSSION
Comparison of spring and summer ratings
Native species
At the time of the April survey, Lasthenia spp. were at peak bloom to slightly past, most T. erianthaand V. pedunculata were past peak bloom, and A. millefolium was just starting to bloom. Most D.danthonioides and P. californicus plants were fully headed out whereas most N. pulchra werevegetative or just beginning to head. Overall, these plants were at nearly optimal stages for coverestimation at the time of the April survey. In areas where sheep had recently grazed, the tops of D.danthonioides and P. californicus were eaten off, making assessments of these species moredifficult. In general, few areas had been affected by recent sheep grazing at the time of the Aprilmonitoring.

Exotic and native plant monitoring, Jepson Prairie, 2001 page 11 of 46
P H Y T O S P H E R E R E S E A R C H
We did not attempt to reassess native cover in the June survey. None of the monitored nativeannual species could be reliably assessed in June because they were entirely dry, often largelydestroyed by grazing and trampling, and in some areas, overtopped by later maturing vegetation.Only N. pulchra and A. millefolium could have been rated at that time. Based on our observationsduring the June rating, ratings for these species would not have differed between April and June.
Exotic species
In April, Erodium spp. ranged from full bloom to past bloom. In areas where it was past bloom thedistinctive fruits generally made this species quite obvious. Erodium spp. were relatively easy todetect, but because they occurred at relatively high densities, cover ratings for Erodium spp.tended to require a high level of mental effort on the part of the evaluator. Cover for these speciescould not be reliably rated in June.
In general, the targeted exotics were less obvious in April than June because many of these aresummer annuals. L. serriola and most of the thistles had not yet started to bolt in April, and sowere somewhat less obvious then than they were in June. L. latifolium was beginning to bolt inApril and was readily observed in both April and June surveys. T. caput-medusae had not headedout in all areas by the April survey, so observations of the previous year's thatch was oftennecessary to confirm the presence of vegetative plants. It was also difficult to rate T. caput-medusae cover in June. A. cylindrica was not observed in transects monitored in April or June.
We used paired t-tests to compare results of April and June ratings on the same transect segments.These test showed that only L. serriola cover was rated significantly lower in April than in June(P>|t|=0.0066). Of the 64 transect segments scored in April and June, L. serriola was detectedin 12 segments in April but was found in 24 transect segments in June (Figure 20). In April, thesmall green L. serriola rosettes were often hidden by taller grasses and from a distance resembledrosettes of other native composites. In June, the green inflorescences of L. serriola were quiteevident against the brown background of lodged dried grasses and forbs, even though someinflorescences had been partly removed by sheep. None of the L. serriola June cover rankestimates were greater than 1% cover.
Although the mean difference in April and June ratings for T. caput-medusae was essentially zero,April and June cover ratings for this species were different in 39% (25/64) of the transectssegments. Most of these differences (16/25=64%) were shifts of a single cover rating class; theremainder were differences of 2 classes. However, because 13 of the June ratings were higher and12 lower than April ratings on the same segments, there was no directional shift in the overallmean ratings for these pastures. Changes in cover ratings could reflect real differences in coverbetween April and June due to the stage of plant development and/or shifts in transect positionrelated to GPS navigation errors. Some of the differences, especially single class shifts could berelated to visual estimation differences, especially when the rated cover is close to the class edge(e.g., near 1% or 10% cover). Only one segment scored as lacking T. caput-medusae in April wasfound to have this species in June (cover rating 1). However, 9 segments scored as positive for T.caput-medusae in April were scored as negative in June. Subsequent grazing and site conditionsin June may have made T. caput-medusae more difficult to detect at that time.
For the C. pycnocephalus and C. solstitialis, very few transect segments had different ratings inApril and June (5 and 1, respectively). For L. latifolium, April and June ratings did not differ in anysegment.

Exotic and native plant monitoring, Jepson Prairie, 2001 page 12 of 46
P H Y T O S P H E R E R E S E A R C H
For several reasons, we believe that the timing of the April survey was optimal for a one-timesurvey of the native and exotic plants. Most of the monitored natives can only be assessed readilyin spring near peak bloom. Furthermore, with the exception of L. serriola, target weed specieswere no more likely to be detected in June than in April, and mean cover ratings did not differbetween these two dates. Because L. serriola is not a high priority weed species and any errors ofomission are likely to occur in areas where the density of this species is low, a reduced detectionefficiency for this species is unlikely to adversely affect weed monitoring objectives. Also,differences in T. caput-medusae ratings in April and June were not sufficient to change overallaverages or to alter inferences drawn from the data. Finally, field conditions were much morepleasant in April than in June. This is a significant factor because it is anticipated that trainedvolunteers will be used for the annual monitoring. We believe that it would be far easier to recruitand retain volunteers for spring monitoring than summer monitoring, and that evaluators wouldbecome fatigued (and presumably less efficient) less quickly in the spring than in the summer.
Overall species distribution
April cover ratings by transect segment for each monitored species are graphically depicted at theend of this report. Native species are shown in Figures 9-15, Erodium is shown in Figure 16, andthe target weed species are depicted in Figures 17-25. These figures are ArcView presentations ofthe transect data and various base map information. The GIS and database files used to producethese figures have been transmitted to SCFOSF with this report.
Three of the monitored natives (Lasthenia spp., T. eriantha, N. pulchra) and two monitored exotics(Erodium spp., T. caput-medusae) occurred in well over 50% of the transect segments in April(Figures 3, 4). As noted above, because L. serriola was not efficiently detected in April, it ispossible that this species also occurred in close to 50% of the transect segments. The remainingnative species occurred in less than 40% of the transect segments, whereas the remaining weedspecies were present in less than 20% of the segments. Erodium spp. and Lasthenia spp. were notonly the most commonly encountered species overall, but had the greatest overall cover of allmonitored species (Figures 3, 4).

Exotic and native plant monitoring, Jepson Prairie, 2001 page 13 of 46
P H Y T O S P H E R E R E S E A R C H
0%
20%
40%
60%
80%
100%
Perc
ent o
f tra
nsec
t seg
men
ts
LastheniaTriphysaria
Nassella Deschampsia
PleuropogonViola
Achillea
<1% cover 1% - 10% cover >10% cover Not detected
Figure 3. Percent of transect segments containing each cover class for monitored native plants, April2001.
0%
20%
40%
60%
80%
100%
Perc
ent o
f tra
nsec
t seg
men
ts
ErodiumTaeniatherum
LactucaCarduus
C solstitialisLepidium
<1% cover 1% - 10% cover >10% cover Not detected
Figure 4. Percent of transect segments containing each cover class for monitored exotic plants, April2001.

Exotic and native plant monitoring, Jepson Prairie, 2001 page 14 of 46
P H Y T O S P H E R E R E S E A R C H
Most transect segments contained more than 1 target native plant species (Table 6). Only 3% ofthe transect segments contained no monitored native species, although undoubtedly thesetransects contained other native species that we did not monitor. No target weed species wereseen in 17% of the transect segments (Table 6). It is also apparent from Table 6 that the count ofnative species per segment is distributed in a roughly symmetrical fashion about the midpoint. Incontrast, the distribution of weed species counts is markedly left skew, as would be expected ifmost weed species monitored were relatively rare.
Among the monitored exotics, F. vulgare, C. calcitrapa, S. marianum, X. strumarium and A.cylindrica did not occur within the transects. We marked the coordinates of these species and C.vulgare using the GPS when we observed them in areas outside of the transects (see polygonmonitoring below). In general, these outlying weed populations were more obvious in June thanin April, with the exception of A. cylindrica, which was not observed.
Table 6. Percent of transect segments having various number of target species. Erodium spp. areexcluded from the counts of exotics.
Percent of segmentsTarget species pertransect segment Native species Targeted exotic species
0 3 171 10 472 20 243 29 94 24 35 11 0.36 2
To assess associations between different plant species statistically we used the nonparametricSpearman's Rho correlation coefficient (Figure 5). This correlation coefficient is computed on theranks of the data values instead of on the values themselves. As expected, cover ranks for certainspecies are correlated, in large part because they are correlated with soils and moisture regimeswithin transect segments. For example, cover of Lasthenia spp., D. danthonioides, and P.californicus are positively correlated. All three of these species are most common in and nearswales, pools, and playas. Likewise, V. pedunculata and A. millefolium, which are found almostexclusively on mounds and uplands, are positively correlated. An interesting negative correlationis that observed between Erodium spp. and Lasthenia spp. Based on our observations, we believethat this negative correlation may reflect differences in salinity tolerance between these speciesgroups. However, the positive correlation between the weeds C. solstitialis and L. latifolium,which tend to occupy different microhabitats, is more likely related to the fact that both werecommon in the rather weedy pastures in the northern portion of the preserve. It is important toremember that correlations may exist between species for a variety of reasons, including chance,and that correlation does not imply a cause and effect relationship.
Figure 5 overleaf. Spearman's Rho correlation coefficients between target species evaluated in April2001 at Jepson Prairie Preserve. The significance of each correlation coefficient is shown in the column
to the left of the bar chart. Species codes used in this figure are listed in Tables 1 and 2.

Exotic and native plant monitoring, Jepson Prairie, 2001 page 15 of 46
P H Y T O S P H E R E R E S E A R C H

Exotic and native plant monitoring, Jepson Prairie, 2001 page 16 of 46
P H Y T O S P H E R E R E S E A R C H
Overall correlations between targeted weeds and natives
As an initial attempt to produce a general index of weed and native plant cover, we summed thecover ranks for each of the targeted weeds and natives for each segment. A high rank sum for aspecies group (native or exotic) generally indicates that a high cover and/or diversity of themonitored species for that group. Thus, a desirable vegetation outcome is a high rank sum fornative species and a low rank sum for target weeds. Erodium spp. ratings were omitted from thesecalculations because current management is not directed either for or against these exotic species.
Across all transect segments, rank sums for weed cover tend to be inversely correlated with ranksums for native plant cover (Spearman's Rho=-0.245, P<0.0001, n=324). While this is generallyconsistent with the hypothesis that target weeds tend to displace native species, other alternativeexplanations cannot be ruled out. For example, areas with certain soil conditions may be bothfavorable to native species and unfavorable for most target weed species or disturbance regimes incertain areas may have both favored weed populations and disfavored establishment of nativespecies. The latter situation clearly exists in the Eucalyptus pasture in areas around the oldeucalyptus stumps.
Unweighted versus weighted cover rank sums
One potential problem with using straight rank sums as an index for overall weed and native coveris that cover classes are unweighted and therefore do not correspond directly to the percent coverrange represented by each rating (Table 5) . However, assigning appropriate weighting factors tothe ranks is difficult because the frequency distributions of plant cover are generally left skewedrather than normally distributed. Because of this distribution, weighting each rating by themidpoint of its respective interval would overweight the higher ranks. Furthermore, the maximumcover represented in cover class 3 (>10% cover) is unknown, although it is far less 100%. Hence,the appropriate central value for cover class 3 is not obvious.
We empirically tested a range of possible weightings for the ranks and examined the resultantfrequency distributions. The best weighting we tested was a progressive 3-fold weighting of theranks (i.e., 1,3,9). While this weighting tends to accentuate differences, such as those betweenpastures (discussed below), the overall pattern of differences is the same using weighted orunweighted ranks. Although the use of a weighted rank sum may be worth investigating furtherwhen additional data are gathered, we have used the unweighted rank sums as a somewhatconservative index of plant cover and diversity for this report.
Overall target weed and native cover by pasture
Rank sums of native and weed cover averaged by pasture are shown in Figure 6. Rank sumaverages generally reflect our overall impressions of the pastures. In general, the northernmostfields (Dozier, NE and NW Barker, and portions of Eucalyptus), as well as the Corral and S ofCalhoun Cut pastures had higher populations of target weeds and lower cover of monitored nativespecies than other fields. In contrast, the southwestern pastures (Buck, North of Barn, Norris) hadbelow average weed populations and relatively high cover of monitored native species, especiallyLasthenia spp. and D. danthonioides. The South half of Section 24 pasture stands out as a pasturewith relatively high levels of both natives and weeds. Overall, significant differences existbetween pastures in the rank sums for both natives and target weeds (P<0.0001 one way ANOVAfor square root transformed rank sums). However, cover rank sums for both natives and weedsvaried widely within pastures (Figure 6).

Exotic and native plant monitoring, Jepson Prairie, 2001 page 17 of 46
P H Y T O S P H E R E R E S E A R C H
Sum
of w
eed
cove
rs
-1
0
1
2
3
4
5
6
7
8
9
10
Buck CorralDocents
Dozier Euc NEBarker NHS24 NOBarn NWBarkerNorris
SHS24 SOCCTriangle
WORR
Pasture
Sum
of n
a tiv
e c o
v er s
-1
0
1
2
3
4
5
6
7
8
9
10
11
12
Buck CorralDocents
Dozier Euc NEBarker NHS24 NOBarn NWBarkerNorris
SHS24 SOCCTriangle
WORR
Figure 6. Plot of rank sums for native species (top) and target weed species (bottom) by pasture atJepson Preserve. Individual segment rank sums are shown alternately as circles or triangles for clarity.
The horizontal line in each graph represents the overall average. The center line of each diamondrepresents the mean for the pasture; the vertical extent of each diamond represents the 95% confidence
interval based on a pooled variance for all segments. The horizontal spread of each diamond isproportional to the number of transect segments in each pasture. Erodium cover is not included with
either the native or target weed covers.
Soil type and the distribution of target exotic and native species
Soil type is one of the factors that influence the distribution of monitored natives and target weedsamong pastures. As shown in Figure 1 and Table 7, different soil types are represented to varyingdegrees in the different pastures, and the transects sample a subset of the soil variation foundwithin each pasture. Pescadero clay, one of the five soil types mapped at Jepson Prairie, (Bates1977) did not occur within the transects because it occurs only beneath large vernal poolsincluding Olcott Lake. The remaining four soil types were represented to varying degrees in thetransects (Table 7).

Exotic and native plant monitoring, Jepson Prairie, 2001 page 18 of 46
P H Y T O S P H E R E R E S E A R C H
According to Bates (1977), two of these soils, Pescadero clay loam (Pc) and Solano loam (Sh) maybe slightly to highly saline (ECe=4-8 and 2-10 dS/m, respectively). Pescadero clay loam has analkaline soil reaction (pH 7.9-9.0+) whereas Solano loam's reaction is somewhat acidic (pH 5.1-6.5) in the surface soil. San Ysidro sandy loam (SeA) and Antioch - San Ysidro complex (AoA) arenonsaline soils with slightly acidic (pH 5.6-6.5) surface horizons. Areas mapped to Solano loamand Antioch-San Ysidro complex can contain small amounts of the other soil types (Bates 1977).
Soil salinity is likely to play a large role in the distribution of plant species at Jepson Prairie forseveral reasons. First, because plant species vary in their ability to grow in saline soils, only salt-tolerant species are able to colonize areas with highly elevated salinity levels. Salt tolerant plantsmay also have a competitive advantage over salt sensitive species in areas where soil salinity iselevated, but below critical thresholds. Furthermore, in soils where salinity is correlated with highlevels of exchangeable sodium (saline-sodic soils), resulting soil deflocculation leads to slowdrainage and hence longer periods of ponding in the winter and spring.
In the absence of actual soil salinity data, we used the dominance of saltgrass (Distichlis spicata),the presence of efflorescence on the soil surface, and overall plant growth to identify areas likely tobe affected by excess salinity. Of the species monitored, our observations led us to believe thatthat Erodium spp. are among the most salt sensitive species, whereas Lasthenia spp. is among themost salt tolerant. Among the two native annual grasses, D. danthonioides appeared to be muchmore tolerant of salinity than P. californicus. We believe that a better understanding of thevariation in soil salinity across the preserve and the relative salt sensitivity of various native andexotic species present would aid in the interpretation of vegetation dynamics at the preserve.
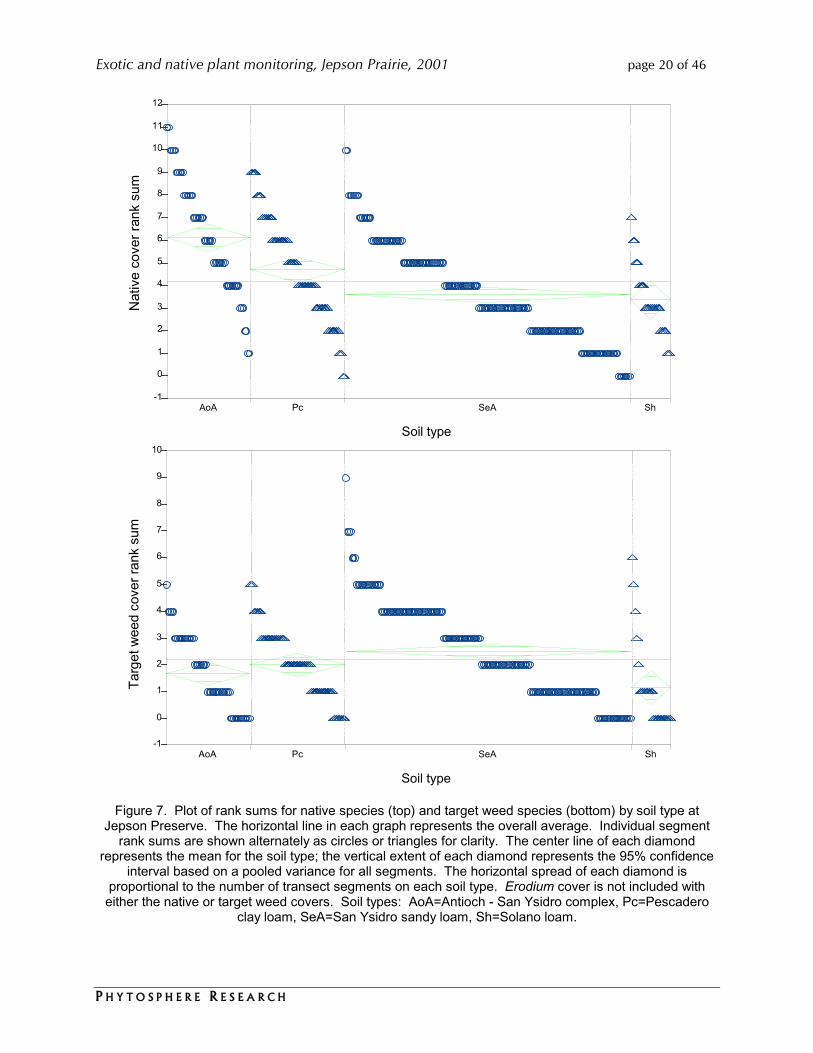
For both target weeds and natives, the effect of soil type on the cover rank sums was highlysignificant in a one-way analysis of variance (P< 0.0001, square root transformed data). Transectsegments assigned to San Ysidro sandy loam had the highest levels of target weeds overall (Figure7, lower graph), whereas segments assigned to the Antioch-San Ysidro complex and Pescaderoclay loam had the highest levels of monitored native species (Figure 7, upper graph). The fit of theANOVA model for soil type was better for native cover than for weed cover (adjusted R2= 0.1333for natives and 0.0681 for weeds, square root transformed data).

Exotic and native plant monitoring, Jepson Prairie, 2001 page 19 of 46
P H Y T O S P H E R E R E S E A R C H
Table 7. Number of transect segments per pasture mapped to each soil type. The soil type assigned toeach segment is based on an overlay of the transect segment center point on a digital version of the
Solano County Soil Survey (USDA SSURGO database).
Soil type
Pasture Antioch - San Ysidrocomplex (AoA):nonsaline, acid
Pescadero clay loam(Pc):
saline, alkaline
San Ysidro sandyloam (SeA):
nonsaline, acid
Solano loam(Sh):
saline, acid
Totals
Buck 12 5 - - 17
Corral - 6 - - 6
Docents - - 14 - 14
Dozier - - 2 - 2
Eucalyptus - - 63 18 81
NE Barker - - 5 - 5
N Half S24 13 22 29 - 64
N of Barn 16 3 13 - 32
NW Barker - - 9 - 9
Norris 4 - 10 3 17
S Half S24 7 25 21 - 53
S of Calhoun Cut - - 9 - 9
Triangle - - 8 - 8
W of Railroad 2 - 1 4 7
Totals for all transects 54 61 184 25 324
Exotic and native plant monitoring, Jepson Prairie, 2001 page 20 of 46
P H Y T O S P H E R E R E S E A R C H
Nat
ive
cove
r ran
k su
m
-1
0
1
2
3
4
5
6
7
8
9
10
11
12
AoA Pc SeA Sh
Soil type
-1
0
1
2
3
4
5
6
7
8
9
10
AoA Pc SeA Sh
Soil type
Targ
et w
eed
cove
r ran
k su
m
Figure 7. Plot of rank sums for native species (top) and target weed species (bottom) by soil type atJepson Preserve. The horizontal line in each graph represents the overall average. Individual segment
rank sums are shown alternately as circles or triangles for clarity. The center line of each diamondrepresents the mean for the soil type; the vertical extent of each diamond represents the 95% confidence
interval based on a pooled variance for all segments. The horizontal spread of each diamond isproportional to the number of transect segments on each soil type. Erodium cover is not included witheither the native or target weed covers. Soil types: AoA=Antioch - San Ysidro complex, Pc=Pescadero
clay loam, SeA=San Ysidro sandy loam, Sh=Solano loam.

Exotic and native plant monitoring, Jepson Prairie, 2001 page 21 of 46
P H Y T O S P H E R E R E S E A R C H
Correlation of management practices with soil type and exotic and native speciesdistribution
Pastures differ not only with respect to soil type, but also with respect to past management history.Management practices also contribute to differences in plant cover seen among the variouspastures. However, our ability to identify relationships between management factors and theabundance of monitored exotic and native weeds is limited because grazing and burning treatmentare partly confounded with soil type. For example, among the five pastures that were burned inJune 2000, all transect segments in four pastures (NE and NW Barker, Triangle, Docents) are foundon San Ysidro sandy loam. In the Corral pasture, which was also burned in 2000, the transectsegments are all on Pescadero clay loam, but specific grazing data for this field are lacking(grazer's records indicate the corral was pastured with the north half of section 24 or the south halfof section 24). One pasture (W of Railroad), with 7 transect segments has been grazed by cattleinstead of sheep. This pasture also lacks specific grazing intensity data and cannot be included inanalyses that include a grazing variable. The only nongrazed fields are the Dozier and Docentsunits, with a combined total of 16 transect segments on a single soil type (San Ysidro sandy loam).In addition to these singularities, overall grazing intensity since at least 1993 varies by soil type(Figure 8).
0
0.1
0.2
0.3
0.4
0.5
0.6
0.7
0.8
AoA Pc SeA ShSoil type
Ave
rage
AU
M/a
cre
1998
to 2
000
Figure 8. Average AUM/acre for each transect segment by soil type at Jepson Prairie for the period July1998 to June 2000. Circles or triangles represent the values present for each transect segment, and
alternate for clarity. The horizontal line in each graph represents the overall average. The center line ofeach diamond represents the mean for the soil type; the vertical extent of each diamond represents the95% confidence interval based on a pooled variance for all segments. The horizontal spread of each
diamond is proportional to the number of transect segments on each soil type. Soil types: AoA=Antioch -San Ysidro complex, Pc=Pescadero clay loam, SeA=San Ysidro sandy loam, Sh=Solano loam.

Exotic and native plant monitoring, Jepson Prairie, 2001 page 22 of 46
P H Y T O S P H E R E R E S E A R C H
Effects of grazing intensity
We excluded data from transect segments that had burned within the two previous years andconstructed ordinal logistic regression models using grazing variables and soil type as predictors(Table 8). These models showed significant positive associations between the two previous yearsstocking rate (1998 - 2000 average AUM/acre) and cover of N. pulchra, D. danthonioides,Lasthenia spp., and Erodium spp . Significant negative associations between 1998 - 2000 stockingrate and cover were seen for the target weeds C. pycnocephalus and C. solstitialis. Soil type washighly significant in models for Lasthenia spp., V. pedunculata, N. pulchra, A. millefolium, C.pycnocephalus, Erodium spp, and T. caput-medusae. This high correspondence between coverand soil type is interesting, given the relative coarseness of the soil map and the fact thatmicrotopographic relief (e.g., swale, upland, flat) is not directly addressed by soil type. Neithervariable was significant for P. californicus or T. eriantha. L. latifolium was not analyzed becauseso few points remained in the data set when the recently burned pastures were excluded.
Table 8. Model and parameter significance levels (effect likelihood ratio �2 test) for ordinal logisticregression models for native and exotic species cover class ranks for transect segments which were not
burned in either 1999 or 2000 (n=265).
Predictor variablesLikelihood Ratio P>�2 (effect direction)
Species Overall modellikelihood ratio
P>�2 Soil type Average AUM/acre 1998-2000
NativesAchillea millefolium <0.0001 0.0001 0.1512Deschampsia danthonioides <0.0001 0.7074 <0.0001 (+)Lasthenia spp. <0.0001 0.0006 <0.0001 (+)Nassella pulchra <0.0001 0.0202 <0.0001 (+)Viola pedunculata <0.0002 0.0053 0.0912ExoticsCarduus pycnocephalus <0.0001 <0.0001 0.0240 (-)Centaurea solstitialis <0.0001 0.1603 <0.0001 (-)Erodium spp. <0.0001 <0.0001 0.0004 (+)Lactuca serriola 0.0066 0.0384 0.1173Taeniatherum caput-medusae 0.0011 0.0004 0.3768
The native perennial soaproot (Chlorogalum pomeridianum), was observed only in transects 2(Dozier) and 15 (W of Railroad). Neither of these transects has been grazed by sheep for anextended period, although the W of Railroad pasture has been grazed by cattle for many years.Sheep have grazed most of the pastures for many years, so most species that are poorly adapted tothe traditional grazing regime have probably been eliminated from the grazed fields.
Effects of Fire
Only 42 transect segments were located in the five pastures that were burned in 2000. Anadditional 10 segments were located in an area on the east edge of the N Half Section 24 pasturethat was burned in 1999. Although we do not have prefire plant cover ratings, some effects of the2000 fire are reasonably obvious. In three pastures (Docents, NW Barker, Triangle), T. caput-medusae was nearly completely suppressed (Figure 24). T. caput-medusae cover was stillsubstantial in the two remaining burned pastures (NE Barker, Corral; Figure 24). Clearly, either thetiming or characteristics of the burns in the two latter pastures were suboptimal for effective T.

Exotic and native plant monitoring, Jepson Prairie, 2001 page 23 of 46
P H Y T O S P H E R E R E S E A R C H
caput-medusae control. Erodium cover was also high in the pastures burned in 2000 (Figure 16),although similarly high levels of Erodium spp. occurred in large portions of other pastures that hadnot been burned recently.
Interaction between fire and grazing
Because the San Ysidro soil (SeA) shows variation in both recent fire and grazing history, theeffects of these two factors can be examined for this soil type. Ordinal logistic regression modelsfor four native and five exotic species were significant (Table 9). In general, cover of the nativespecies was positively associated with higher previous year stocking levels and recent burning.Among exotic species, both positive and negative associations with grazing and recent burningwere observed.
Table 9. Model and parameter significance levels (effect likelihood ratio �2 test) for ordinal logisticregression models for native and exotic species cover class ranks developed for transect segments on
San Ysidro sandy loam soil (n=183).
Predictor variablesLikelihood Ratio P>�2 (effect direction)
Species Overall modellikelihood ratio
P>�2 Average AUM/acre 1999-2000 Burned 1999 or 2000NativesDeschampsia danthonioides <0.0001 <0.0001 (+) 0.0035 (+)Lasthenia spp. <0.0001 <0.0001 (+) NSNassella pulchra <0.0001 <0.0001 (+) 0.0003 (+)Triphysaria eriantha 0.0005 0.0150 (+) 0.0003 (+)ExoticsCarduus pycnocephalus 0.0464 0.0134 (–) NSCentaurea solstitialis <0.0001 0.0005 (–) 0.0486 (+)Erodium spp. <0.0001 NS <0.0001 (+)Lepidium latifolium 0.0040 NS 0.0183 (+)Taeniatherum caput-medusae <0.0001 0.0010 (+) <0.0001 (–)
We looked at overall effects of fire and grazing on the San Ysidro soil through analysis ofcovariance on cover rank sums. For the monitored native species average stocking density 1998-2000 was the best grazing variable. The model (Table 10) indicates that native cover rank sumincreases with grazing intensity (over the range of intensities represented) and is higher in plotsthat have been burned recently. The significant interaction between these factors results from thefact that the positive correlation between grazing and native cover rank sum is limited tononburned transect segments. Burned segments show no association between grazing and nativecover rank sum, presumably because the effects of recent fire largely mask those of grazing.
Table 10. Analysis of covariance model for the sum of native plant cover ranks (square root transformed)for transect segments on San Ysidro sandy loam.
Source DF F Ratio Prob>F Adjusted R2 NOverall model 3 27.0413 <0.0001 0.3003 183
Effect test DF F Ratio Prob>F Parameter estimateAverage AUM/acre 1998-2000 1 22.1828 <0.0001 0.8317
Burned 1999 or 2000 1 4.8818 0.0284 0.09138Interaction 1 27.7170 <0.0001 -0.8230
The equivalent model for target weed cover rank sum is shown in Table 11. For target weeds,using long term stocking density (1993-2000) improved model fit slightly compared with the 1998-2000 stocking density. Model fit for target weeds was much poorer than for the native species.

Exotic and native plant monitoring, Jepson Prairie, 2001 page 24 of 46
P H Y T O S P H E R E R E S E A R C H
Although recent burning shows a clear negative effect on weed cover rank sum, the overall effectof grazing intensity is nonsignificant. Investigation of the significant interaction term reveals that asignificant negative correlation between grazing intensity and weed cover rank sum exists only fornonburned transect segments. However, the strength of this effect is insufficient to make thegrazing variable significant in the overall model.
Table 11. Analysis of covariance model for the sum of target weed cover ranks (square root transformed)for transect segments on San Ysidro sandy loam. Erodium cover is not included in this analysis.
Source DF F Ratio Prob>F Adjusted R2 NOverall model 3 2.7893 0.0063 0.1073 183
Effect test DF F Ratio Prob>F Parameter estimateAverage AUM/acre 1993-2000 1 0.1977 0.6571 -0.01555
Burned 1999 or 2000 1 11.9540 0.0007 -0.1583Interaction 1 13.9422 0.0003 0.1306
Polygon monitoring
While transects are effective for monitoring both native and exotic species that are relativelycommon on the preserve, they do not efficiently detect relatively rare plant populations that arespatially clustered. In order to document the presence of target weed infestations that arelocalized or new, we tested the mapping of weed populations outside of the transects as points orpolygons. We found that the amount of effort and time required to map individual infestations canbe substantial if the target weed is present in multiple spots. We eventually determined thatmapping weed points and polygons was only efficient for weed species that are rarelyencountered. Such points need only be mapped if they are found outside of transect segments.
Among the targeted exotics, F. vulgare, C. calcitrapa, C. vulgare, S. marianum, X. strumarium, andA. cylindrica are sufficiently uncommon in all pastures that their presence at the preserve can onlybe documented adequately by point/polygon mapping. In contrast, C. pycnocephalus, L. serriola,and T. caput-medusae are so common and widespread that point/polygon mapping is impractical.L. latifolium and possibly C. solstitialis represent an intermediate situation. In some fields,primarily from the Eucalyptus pasture north, these species are too common to map individualpopulations (Figures 21, 22, 23). However, in most other pastures, these species are confined todiscrete infestations or isolated individuals that are more efficiently monitored via point/polygonmapping (compare Figures 22 and 23 for L. latifolium). Hence, a combination of monitoringtechniques will be necessary for species such as these.
Rare target weeds located within sight beyond transects can be readily mapped during the annualsurvey. In addition, rarely occurring weeds could be mapped within the course of other preserveactivities by personnel equipped with a GPS receiver and a standardized datasheet for recordingpoint/polygon attribute data. These two methods would probably locate many, though not all,outlying target weed occurrences. A more systematic survey would be needed to ensure completecoverage of the inter-transect areas, though it is questionable whether the resources to conduct thisadditional survey are likely to become available. It would probably not be practical to survey theinter-transect spaces on the preserve by foot, although it might be feasible if vehicles (e.g., ATVs,mountain bicycles) were used. Since most of the uncommon target weeds are summer annuals, itwould probably be most efficient to survey inter-transect areas in early summer after the springannuals have dried up. While conducting the June monitoring of transects 6 and 8 we observedsome populations of L. latifolium, C. vulgare, and S. marianum well beyond the transect area thathad not been obvious in the April monitoring.

Exotic and native plant monitoring, Jepson Prairie, 2001 page 25 of 46
P H Y T O S P H E R E R E S E A R C H
We found that it was a fairly complicated process to convert GPS coordinates taken around theperimeter of a weed population into a polygon using ArcView 3.2. We were eventually able toaccomplish it using a third party extension. Given that ArcView themes can only include a singletype of data (e.g. point or polygon), we found that it was more efficient to leave polygonperimeters coded as a series of points, each with the same weed population attribute data. Weused a unique polygon number field to allow for identification of those points which constitute agiven polygon boundary.
Comments on methodology
Based on 302 transect segments surveyed between 4/12/01 and 4/18/01 for which time recordswere available, the average time spent per transect segment was 3.22 minutes. This total, whichapplies to a well-trained two person team, includes time spent mapping point/polygon data nearthe transects, and some but not all of the time spent walking between successive transects. Basedon this average time, a two person team would have required about 17.4 hours of field time toread the transects. Probably an additional hour of time could be added to this total to account fortime spent walking between transect ends.
Hence, the total direct field time required was about 37 person-hours or about three 6-hour daysfor a single two-person team. Using two teams, it should take about 3 half days to collect the data.Three person teams are likely to be the optimal arrangement for monitoring transects: one personuses the GPS to navigate along the transect, one person specializes in rating native plant cover andthe third person specializes in rating exotic cover. Monitoring position with the GPS is ratherdistracting, so having a person assigned primarily to that task is the optimal arrangement. If onlytwo people are available for each transect, the GPS should be handled by the person with fewerplant species to rate, which will vary somewhat by transect.
Transects are most efficiently read in sets or loops that minimize the amount of walking betweenadjoining transects. Based on our experience, the following combinations of transects can bemonitored as sets, none of which should require more than 3 to 4 hours of field time for a trained2 or 3 person team:

Exotic and native plant monitoring, Jepson Prairie, 2001 page 26 of 46
P H Y T O S P H E R E R E S E A R C H
Transect set Transect numbers1 1 - 52 6, 73 8, 94 10, 115 12, 136 17 - 207 14 - 16
The list of monitored plants currently is at the upper limit of what is possible for two evaluators tohandle. It may be possible to increase detection of some of the target weeds such as L. serriola bydecreasing the number of monitored exotics. For example, Erodium spp., which are present inalmost every transect segment and require a good deal of mental energy to evaluate, could bedropped from the monitoring list without compromising weed monitoring goals. Alternatively L.serriola could be dropped from the monitoring list because it is not a high priority weed. Forfuture monitoring it probably makes sense to assign the most botanically skilled volunteers tothose areas which are likely to be the most difficult to rate. Although differences in observerratings of plant cover could contribute to variability in the data, we believe that adequate evaluatortraining/calibration and the use of visual aids should help minimize this source of variation. Theuse of only 3 cover ranks also serves to help minimize variation related to different observers.
Some orientation on the microsite factors that influence plant distribution will help improve theefficiency with which volunteers detect species that may be difficult to spot. For instance, manyspecies are either limited to or more likely to occur on upland or mound areas (e.g., A.millefolium, N. pulchra, V. pedunculata, C. solstitialis, C. pycnocephalus, L. serriola). Whenmounds occur near the outer edges of the transect, the evaluator generally needs to detour over tothem to look closely for these species. Knowing the preference of P. californicus for wet, generallynonsaline swales and the co-occurrence of D. danthonioides with Lasthenia spp. on flats andlowlands aids in the detection of these species when they are at low densities. Evaluation aidsdeveloped for volunteers will include notes on the typical microsites where given species arefound.
The nominal accuracy of the unaided GPS is 15 meters, but our typical accuracy was generallymuch better than that. Positional errors may have caused transect segments to vary in length ordrift from the true directional bearing by several meters. However, such errors had little impact oncover ratings due to the large size of the transect segments (1000 m2) and the relatively broadcover class categories (Table 5). At most, such positional errors could rarely result in a differencein cover ratings of one rank, or might cause an uncommon species to be shifted from one segmentto the adjacent one. Such differences would not be sufficient to change the interpretation ofmonitoring results.
While navigation with the uncorrected GPS worked well, anticipated advances in GPS technologyshould lead to improved positional accuracy which will improve the sensitivity and reliability ofthe method. Although not on the market in time for our April survey, it is now possible to buyaffordable handheld receivers that make use of the experimental WAAS system to providepositional accuracies of 3 m or less. Currently there is one WAAS satellite (number 47) positionedover the Pacific Ocean, which we were able to use to obtain differentially-corrected readings inour June survey.

Exotic and native plant monitoring, Jepson Prairie, 2001 page 27 of 46
P H Y T O S P H E R E R E S E A R C H
Comparisons with other research
Spread of target weeds
In October 1995, a walking survey of Jepson Prairie was conducted by The Nature Conservancystaff and volunteers (The Nature Conservancy 1996). The general monitoring approach wassimilar to the approach described in this report, although the 1995 survey was much less intensive:approximately one 20 ft circle was rated per 10 acres. Judging from the distribution mapsincluded in the 1996 report, the 1995 survey also omitted the pastures north of Barker Slough andsouth of Calhoun Cut, as well as the S Half of Section 24.
Among the target weeds documented in the 1995 study, only L. latifolium appears to have spreadsignificantly. In 1995, only four small L. latifolium infestations were reported. In our currentsurvey, we have documented extensive, dense patches of L. latifolium along Barker Slough andmany smaller L. latifolium patches throughout NW Barker pasture. Populations of this target weedare also found throughout the Triangle pasture and isolated spot infestations are found in theEucalyptus pasture, the small corrals north of the barn, and near Calhoun Cut (Figure 23).
L. latifolium is a rhizomatous perennial and is very difficult to eradicate. It has great potential forinvading the flat and swale topographic positions throughout the preserve. We think much moreattention needs to be paid to management of this species. Efforts should be directed at eradicatingit from the Eucalyptus pasture where it is just getting established. In addition, if eradication effortsare not directed at the Triangle and Barker pastures, L. latifolium is likely to overrun large areas ofthese pastures.
It is difficult to tell how much C. pycnocephalus and C. solstitialis populations have changed since1995. We documented populations of these species that are clearly more extensive than wasshown in 1995 survey. However, it is difficult to determine how much of this difference is relatedto the higher sampling intensity used in our survey.
We noted that C. pycnocephalus and C. solstitialis are especially prevalent around old tree stumpsin the Eucalyptus pasture. There may be several reasons for this, but the high level of disturbanceand lack of competitive native species in these areas probably contributes to the high localizedpopulations of these target weeds. Efforts should be made to prevent an expansion of this problemas the remaining eucalyptus is removed. One possible strategy would to make a concerted effortto establish appropriate native species (e.g. N. pulchra, A. millefolium) in these newly exposed,generally upland areas. Because it appears that sheep tend to congregate around stumps, completeremoval of the stumps may also reduce the high level of disturbance in these areas that favorsinvasive exotics.
Factors associated with plant population levelsMost of the associations between burning, grazing and plant cover noted in this report have beenpreviously reported (Pollack and Kan 1998). Pollack and Kan (1998) reported that June burningwas completely effective for eliminating T. caput-medusae. As noted above, T. caput-medusaewas apparently eliminated from some but not all of the transects that were burned in 2000, whichsuggests that the timing and/or intensity of the burn was suboptimal in some of the pastures. Ourobservations also concur with previous descriptions of the importance of mound, intermound, andpool microtopography on vegetation occurrence at Jepson Prairie (Pollack and Kan 1998).Correlations between species occurrence (Figure 5) and associations between vegetation and soiltypes (Figure 7) are at least in part related to microtopographical preferences of various species andthe association of certain microtopographies with specific soil types. Within our relatively short

Exotic and native plant monitoring, Jepson Prairie, 2001 page 28 of 46
P H Y T O S P H E R E R E S E A R C H
(50 m) transect segments variation in microtopography was sometimes considerable. We did nottry to assign a predominant microtopography to each transect segment, though if this informationis collected eventually, it could be used to help explain some of the variability in the data.
Although the analyses we presented based on transect data generally do not break any newground, their concurrence with previous analyses and observations provides at least somevalidation for the methodology we used. The transect-based monitoring system was sensitiveenough that differences in vegetation associated with past grazing and fire regimes could bedetected. This increases our confidence that analyses of monitoring data collected in successiveyears should enable Preserve managers to detect and document significant changes in vegetationthat may occur. One challenge in future analyses lies in the separating the effects of varyingenvironmental conditions from those of management inputs.
CONCLUSIONS
We believe that changes in target weed populations and selected native species at Jepson PrairiePreserve can be monitored effectively through the use of the transect based and point/polygonmonitoring methods presented in this report. We also believe that it is feasible to implementannual monitoring at the preserve with the help of trained volunteers using these methods. Webelieve that the techniques used represent a reasonable compromise between efficiency andsensitivity and are within the technical capabilities of trained volunteers assisted by SCFOSF staff.We believe that the monitoring methods will be most useful if they are consistently applied on anannual basis.

Exotic and native plant monitoring, Jepson Prairie, 2001 page 29 of 46
P H Y T O S P H E R E R E S E A R C H
Figure 9. Achillea millefolium cover ranks in transect segments, April 2001. Markers for transectsegments are centered over the midpoint of the segment and are not to scale. Soil types: AoA=Antioch -
San Ysidro complex, Pc=Pescadero clay loam, Pe=Pescadero clay, SeA=San Ysidro sandy loam,Sh=Solano loam, W=water.

Exotic and native plant monitoring, Jepson Prairie, 2001 page 30 of 46
P H Y T O S P H E R E R E S E A R C H
Figure10. Viola pedunculata cover ranks in transect segments, April 2001. Markers for transectsegments are centered over the midpoint of the segment and are not to scale. Soil types: AoA=Antioch -
San Ysidro complex, Pc=Pescadero clay loam, Pe=Pescadero clay, SeA=San Ysidro sandy loam,Sh=Solano loam, W=water.

Exotic and native plant monitoring, Jepson Prairie, 2001 page 31 of 46
P H Y T O S P H E R E R E S E A R C H
Figure 11. Triphysaria eriantha spp. eriantha cover ranks in transect segments, April 2001. Markers fortransect segments are centered over the midpoint of the segment and are not to scale. Soil types:
AoA=Antioch - San Ysidro complex, Pc=Pescadero clay loam, Pe=Pescadero clay, SeA=San Ysidrosandy loam, Sh=Solano loam, W=water.

Exotic and native plant monitoring, Jepson Prairie, 2001 page 32 of 46
P H Y T O S P H E R E R E S E A R C H
Figure 12. Lasthenia spp. (species with conspicuous ray flowers, including L. californica and L. fremontii)cover ranks in transect segments, April 2001. Markers for transect segments are centered over the
midpoint of the segment and are not to scale. Soil types: AoA=Antioch - San Ysidro complex,Pc=Pescadero clay loam, Pe=Pescadero clay, SeA=San Ysidro sandy loam, Sh=Solano loam, W=water.

Exotic and native plant monitoring, Jepson Prairie, 2001 page 33 of 46
P H Y T O S P H E R E R E S E A R C H
Figure13. Deschampsia danthonioides cover ranks in transect segments, April 2001. Markers for transectsegments are centered over the midpoint of the segment and are not to scale. Soil types: AoA=Antioch -
San Ysidro complex, Pc=Pescadero clay loam, Pe=Pescadero clay, SeA=San Ysidro sandy loam,Sh=Solano loam, W=water.

Exotic and native plant monitoring, Jepson Prairie, 2001 page 34 of 46
P H Y T O S P H E R E R E S E A R C H
Figure 14. Pleuropogon californicus cover ranks in transect segments, April 2001. Markers for transectsegments are centered over the midpoint of the segment and are not to scale. Soil types: AoA=Antioch -
San Ysidro complex, Pc=Pescadero clay loam, Pe=Pescadero clay, SeA=San Ysidro sandy loam,Sh=Solano loam, W=water.

Exotic and native plant monitoring, Jepson Prairie, 2001 page 35 of 46
P H Y T O S P H E R E R E S E A R C H
Figure 15. Nassella pulchra cover ranks in transect segments, April 2001. Markers for transect segmentsare centered over the midpoint of the segment and are not to scale. Soil types: AoA=Antioch - San
Ysidro complex, Pc=Pescadero clay loam, Pe=Pescadero clay, SeA=San Ysidro sandy loam, Sh=Solanoloam, W=water.

Exotic and native plant monitoring, Jepson Prairie, 2001 page 36 of 46
P H Y T O S P H E R E R E S E A R C H
Figure 16. Erodium spp. cover ranks in transect segments, April 2001. Markers for transect segmentsare centered over the midpoint of the segment and are not to scale. Soil types: AoA=Antioch - San
Ysidro complex, Pc=Pescadero clay loam, Pe=Pescadero clay, SeA=San Ysidro sandy loam, Sh=Solanoloam, W=water.

Exotic and native plant monitoring, Jepson Prairie, 2001 page 37 of 46
P H Y T O S P H E R E R E S E A R C H
Figure 17. Carduus pycnocephalus cover ranks in transect segments, April 2001. Markers for transectsegments are centered over the midpoint of the segment and are not to scale. Soil types: AoA=Antioch -
San Ysidro complex, Pc=Pescadero clay loam, Pe=Pescadero clay, SeA=San Ysidro sandy loam,Sh=Solano loam, W=water.

Exotic and native plant monitoring, Jepson Prairie, 2001 page 38 of 46
P H Y T O S P H E R E R E S E A R C H
Figure 18. Carduus pycnocephalus cover ranks in transect segments with mapped point/polygonpopulations, April 2001. Not all visible populations have been mapped. Markers for transect segments
are centered over the midpoint of the segment. Markers are not to scale. Soil types: AoA=Antioch - SanYsidro complex, Pc=Pescadero clay loam, Pe=Pescadero clay, SeA=San Ysidro sandy loam, Sh=Solano
loam, W=water.

Exotic and native plant monitoring, Jepson Prairie, 2001 page 39 of 46
P H Y T O S P H E R E R E S E A R C H
Figure 19. Lactuca serriola cover ranks in transect segments, April 2001. Markers for transect segmentsare centered over the midpoint of the segment and are not to scale. Soil types: AoA=Antioch - San
Ysidro complex, Pc=Pescadero clay loam, Pe=Pescadero clay, SeA=San Ysidro sandy loam, Sh=Solanoloam, W=water.

Exotic and native plant monitoring, Jepson Prairie, 2001 page 40 of 46
P H Y T O S P H E R E R E S E A R C H
Figure 20. June 2001 monitoring of transects 6 and 8 for Lactuca serriola (red dots), superimposed onresults of monitoring in April 2001 (blue squares). Markers for transect segments are centered over the
midpoint of the segment and are not to scale. Soil types: AoA=Antioch - San Ysidro complex,Pc=Pescadero clay loam, Pe=Pescadero clay, SeA=San Ysidro sandy loam, Sh=Solano loam, W=water.

Exotic and native plant monitoring, Jepson Prairie, 2001 page 41 of 46
P H Y T O S P H E R E R E S E A R C H
Figure 21. Centaurea solstitialis cover ranks in transect segments, April 2001. Markers for transectsegments are centered over the midpoint of the segment and are not to scale. Soil types: AoA=Antioch -
San Ysidro complex, Pc=Pescadero clay loam, Pe=Pescadero clay, SeA=San Ysidro sandy loam,Sh=Solano loam, W=water.

Exotic and native plant monitoring, Jepson Prairie, 2001 page 42 of 46
P H Y T O S P H E R E R E S E A R C H
Figure 22. Lepidium latifolium cover ranks in transect segments, April 2001. Markers for transectsegments are centered over the midpoint of the segment and are not to scale. Soil types: AoA=Antioch -
San Ysidro complex, Pc=Pescadero clay loam, Pe=Pescadero clay, SeA=San Ysidro sandy loam,Sh=Solano loam, W=water.

Exotic and native plant monitoring, Jepson Prairie, 2001 page 43 of 46
P H Y T O S P H E R E R E S E A R C H
Figure 23. Lepidium latifolium cover ranks in transect segments April 2001 with mapped point/polygonpopulations,. Not all visible populations have been mapped in the heavily infested pastures north of
Barker Slough. Markers for transect segments are centered over the midpoint of the segment.Point/polygon markers are not to scale. Soil types: AoA=Antioch - San Ysidro complex, Pc=Pescadero
clay loam, Pe=Pescadero clay, SeA=San Ysidro sandy loam, Sh=Solano loam, W=water. Markers are notto scale.

Exotic and native plant monitoring, Jepson Prairie, 2001 page 44 of 46
P H Y T O S P H E R E R E S E A R C H
Figure 24. Taeniatherum caput-medusae cover ranks in transect segments, April 2001. Squares arecentered at midpoints of transect segments and are not to scale. Markers for transect segments are
centered over the midpoint of the segment and are not to scale. Soil types: AoA=Antioch - San Ysidrocomplex, Pc=Pescadero clay loam, Pe=Pescadero clay, SeA=San Ysidro sandy loam, Sh=Solano loam,
W=water.

Exotic and native plant monitoring, Jepson Prairie, 2001 page 45 of 46
P H Y T O S P H E R E R E S E A R C H
Figure 25. Rarely-occurring weeds noted during the April and June 2001 monitoring. Only one transectsegment each contained Cirsium vulgare and Foenicium vulgare. Bristly ox-tongue (Picris echioides) is
not on the target list of weeds. Markers for transect segments are centered over the midpoint of thesegment. Markers are not to scale. Soil types: AoA=Antioch - San Ysidro complex, Pc=Pescadero clay
loam, Pe=Pescadero clay, SeA=San Ysidro sandy loam, Sh=Solano loam, W=water.

Exotic and native plant monitoring, Jepson Prairie, 2001 page 46 of 46
P H Y T O S P H E R E R E S E A R C H
LITERATURE CITEDBates, L. A., 1977. Soil Survey of Solano County, California. USDA Soil Conservation Service /
University of California Agricultural Experiment Station.
Pollak, O.; Kan, T. 1998. The use of prescribed fire to control invasive exotic weeds at JepsonPrairie Preserve. Pages 241-249 in: Witham, C. W.; Bauder, E. T.; Belk, D.; Ferren, W. R.;Ornduff, R. (Editors). Ecology, Conservation, and Management of Vernal Pool Ecosystems-Proceedings from a 1996 Conference. California Native Plant Society, Sacramento, CA 1998.
The Nature Conservancy. 1996. Draft Jepson Prairie Preserve Weed Control Program (1996-1998). 27 pages.
Steele, R. G. D.; Torrie, J. H. 1960. Principles and Procedures of Statistics. New York: McGraw-Hill Book Company, Inc.