2001 GED Testing Program Statistical Report (PDF)
48
Who took the GENERAL EDUCATIONAL DEVELOPMENT TESTING SERVICE OF THE AMERICAN COUNCIL ON EDUCATION GED ? 2001 Statistical Report
Transcript of 2001 GED Testing Program Statistical Report (PDF)

Who took the
GENERAL
EDUCATIONAL
DEVELOPMENT
TESTING
SERVICE
OF THE
AMERICAN
COUNCIL ON
EDUCATION
GED?2001 Statistical Report
Copyright © 2002 by the American Council on Education, GED Testing Service
GED Testing ServiceOne Dupont Circle NW, Suite 250Washington DC 20036-1163(202) 939-9490Fax: (202) 659-8875
www.gedtest.org
Who Took the GED? GED 2001 Statistical Report is a publication of the General Educational Development TestingService, a national program within the American Council on Education’s Center for Adult Learning and EducationalCredentials.
All rights reserved. No part of this book may be reproduced or transmitted in any form or by any means electronic or mechanical, including photocopying, recording, or by any information storage and retrieval system, without permission in writing from the publisher.
Item Number 250701
Additional copies of this publication are available by sending a check or money order for $20 per copy, plus $6.95shipping and handling (for orders of more than one copy, call the number below), to the following address:
ACE Fulfillment ServiceDepartment 191Washington, DC 20055-0191Phone: (301) 632-6758Fax: (301) 843-0159

i
20
01
GE
D S
tati
sti
ca
l R
ep
ort
On the CoverFeatured are five distinguished GED graduates whose biographies follow. In honor of its founder, the GED Testing Program established the Cornelius P.Turner Award to recognize, each year, a GED graduate who has made outstanding contributions to society in education or publicservice.
Barbara E. Pollard, 2000 Cornelius P. Turner Award WinnerBarbara E. Pollard is a living example of the “power of the GED,” as well as an outstanding contributor to the GED Program, edu-cation, and social welfare in Charlotte County, Florida.At Charlotte County Vo-Tech, her well-earned nickname is the “answerwoman.” Eight years after leaving school, Barbara passed her GED Tests and earned her diploma. She immediately accepted anentry-level bank position, working her way up to bookkeeper, teller, comptroller, branch manager, and finally, vice president.Working during the day, she attended college classes at night, earning her degree and later opening her own accounting and tax
service. Her commitment to the community continues outside work, as a leading proponent of the local GED program and as a volunteer withthe local Work and Gain Economic Self-Sufficiency (WAGES) program.
“I finally realized that my life was not going to change unless something happened,” Barbara says.“My mother was so sure about the necessityof a high school diploma, that I finally decided to give in.The wonderful power of the GED diploma! At age 16, I was a high school dropout.Atage 32, I was a vice president of a bank.”
Tommy Gallant, 2001 Cornelius P. Turner Award NomineeCanada’s Tommy Gallant exemplifies the power of lifelong learning.Author of five published articles,Tommy has also received astipend for graduate study from the Natural Sciences and Engineering Research Council of Canada, and is completing a master’sdegree in biology before pursuing his doctorate in the same field. One of his most cherished awards, however, is the AtomicEnergy of Canada scholarship—given to a successful GED graduate who continues to study science.As the youngest of eight chil-dren,Tommy left high school in Prince Edward Island at age 16. It took eight years as a manual laborer for Tommy to restore his
perspective on education and pass his GED Tests, which he did in 1989.Then it was on to the University of Prince Edward Island, where heearned a bachelor’s degree in biology, with honors, in 1999.
“I hope to spark a passion in students for lifelong education because I feel no one is ever too old to stop learning,”Tommy says.“My experi-ence has taught me there are only a couple of hurdles in the way of achievement, and they are the abilities to work hard for your dreams andignore the people that say you can’t.”
Ofelia Dimas, 2001 Cornelius P. Turner Award WinnerOfelia Dimas’ optimistic attitude is an inspiration to all who know her and have watched her overcome adversity. Interviewing fora painter’s job at the Adult Education Program in Collier County Public Schools inspired Ofelia to pursue her GED diploma.Passing the GED Tests in 1978 spurred her to give back to her adopted community of Immokalee, Florida. More than two decadeslater, she still works at the Adult Education Program—as a full-time ABE/GED tutor—and sets a stirring, energetic example toothers in her community.The child of a Mexican-American migrant family, Ofelia now serves as an elected fire district commis-
sioner and as treasurer of the local Hispanic Heritage Celebration. She also has remained active in local programs in reading, literacy, and mentalhealth, all while attending college and encouraging her own four children to pursue their education.
“I now understand that I can be more than just a mother, grandmother, and a wife,” Ofelia says.“I can make a difference, and with the supportof my family and my friends, for as long as I can, I am not stopping!”
Warren E. McDaniels, 1999 Cornelius P. Turner Award WinnerWarren E. McDaniels, superintendent of the New Orleans, Louisiana, Fire Department, is a lifelong resident of the “Big Easy,” but iswell-known across the nation.After leaving high school to work in the oil fields,Warren went back to school in 1968 to earn hisGED diploma. He continued his education at Delgado Community College, where he earned an associate degree; the NationalFire Academy; and Harvard University’s prestigious John F. Kennedy School of Government.Appointed New Orleans’ fire chief in1993,Warren became the first fireman to rise through the ranks to head the department, capping a 24-year career. Under his lead-
ership, New Orleans has improved its fire insurance rating, resulting in significantly lower insurance premiums for local citizens.The communityalso has benefited from his leadership in a variety of ways: as vice-chairman of the New Orleans Jazz & Heritage Festival, chairman of the New Orleans Parish Communication District Board of Commissioners, and a popular commencement speaker. His “Learn Not to Burn”program reaches 30,000 schoolchildren each year.
“The GED program afforded me, and continues to afford others, a second chance to make desired goals a reality,” Warren says.“I am livingtestimony that the GED program provides anyone with reasonable motivation the opportunity to change one’s individual circumstances.”
Carol M. Swain, 1993 Cornelius P. Turner Award WinnerDr. Carol M. Swain is the author of a well-regarded book, Black Faces, Black Interests:The Representation of African Americans in Con-gress, and a professor of law and political science at Vanderbilt University’s law school. Her distinguished academic career began,however, with a decision she made at age 20: to return to school after leaving in her mid-teens.With the help of a Virginia adulteducation program, she passed the GED Tests and enrolled a year later at Virginia Western Community College. Her two-yeardegree in merchandising led to further studies at Roanoke College, where she spearheaded the drive to establish a special scholar-
ship program for minority students.After graduating magna cum laude, she earned a master’s degree at Virginia Tech, then continued her doctoral studies at the University of North Carolina at Chapel Hill, and later served as an associate professor of politics and public affairs atPrinceton University.
“I realized I had to get an education in order to make something of my life,” Carol says.“It’s important for all students, especially minority stu-dents, to aim high. If students and teachers have low expectations, the true potential will not be reached.”
ii
20
01
GE
D S
tati
sti
ca
l R
ep
ort
On the Cover .................................................................................................................................................... i
Foreword .......................................................................................................................................................... 1
Introduction ...................................................................................................................................................... 4
Gathering the Data............................................................................................................................................ 6
How to Use this Report .................................................................................................................................. 7
2001 Statistical Highlights ................................................................................................................................ 8
APPENDICESDefinition of Geographic Regions .................................................................................................................. 35
GED Administrators ........................................................................................................................................ 36
American Council on Education Governing Bodies ...................................................................................... 40
GEDTS Staff .................................................................................................................................................. 43
Selected GED Publications.............................................................................................................................. 44
Table of Contents
TABLES1 GED Test Participation and Credentials Issued:
Percent Change from 2000 to 2001 ...................................... 10
2 Testing Volumes .................................................................... 12
3 Number of People Tested and Percentages, by Age Group...... 14
4 Number of Credentials Issued, and Percentagesby Age Group ........................................................................ 16
5 Number of People Tested, by Edition .................................... 18
6 Volume of Special Testing Accommodations .......................... 20
7 Highest Grade Completed .................................................... 22
8 Additional Data: Number of People Tested, GED Testing Centers,Active-Duty Military Personnel,and Reasons for Taking GED Tests ........................................ 24
9 Credentials Issued, 1991 and 1997–2001;Percent Change, 1991–2001; and Cumulative Credentials Issued Since 1971 ................................................ 26
10 Population of Adults Without High School Diplomas, GED Participation Rate, and GED Credentialing Rate, by Jurisdiction ........................................ 28
11 Trends in GED Testing, 1949–2001 ........................................ 30
12 GED Passing Score Requirements: Percentage of High School Graduates Meeting GED Standard and Jurisdictions Requiring GED Standard in 2001 .................... 31
13 Policies for Issuing High School Equivalency Credentials Based on GED Tests, by Jurisdiction ...................................... 32
FIGURES1 Number of People Who Completed GED Tests Batteries
in 2000 and 2001, by Region ................................................ 11
2 Percentage and Number of People Who Completed the GED Tests Batteries in 2001, by Region .............................. 13
3 Number and Percentage of People Who Took the GED Tests in 2001, by Age Group .................................................. 15
4 Percentage of GED Credentials Issued in 2001,in the United States, Insular Areas and Freely Associated States, and Canada, by Age Group .......................................... 17
5 Number of People Who Took Other Editions (Audiocassette,Braille, and Large Print) of the GED Tests, 1989–2001 .......... 19
6 Number of Special Testing Accommodations (1989–2001) and Number of Persons Requesting SLD Accommodations (1990–2001) ...................................... 21
7 Number and Percentage of People Who Took the GED Tests in 2001, by Highest Grade Completed.................. 23
8 Number of GED Candidates Planning Further Study, Compared with Total Number Tested, 1961–2001 ...... 25
9 Changes in a Decade: Number of Credentials Issued in 1991 and 2001, by Region ...................................... 27
10 Number and Percentage of Adults Without High School Diplomas, by Region (U.S. 1990, Canada 1991) .................... 29
11 Number of GED Candidates Receiving Credentials,Compared with Number Completing the TestsBattery, 1974–2001 ................................................................ 30
12 Percentage of High School Graduates Meeting GED Passing Score Requirements in the United States,Insular Areas and Freely Associated States, and Canada .......... 31
13 Percentage of Jurisdictions, by Minimum GED Score Requirements, in the United States, Insular Areas and Freely Associated States, and Canada ...................................... 33

1
20
01
GE
D S
tati
sti
ca
l R
ep
ort
involvement of people with a par-ticular and rare set of social gifts.These are the people who powerthe GED Testing Service deliverysystem. It is therefore a privilege torecognize the outstanding achieve-ment of the GED “Few”—eachGED Administrator, GED Exam-iner, and GED staff memberresponsible for administering thetests at the local level.To accom-modate the 24 percent increase inthe number of adults participatingin the GED Testing Program, theGED Few found innovative waysto extend their operational hoursand open their centers on addi-tional days, nights, and weekends.No adults were to be left behind.
Gladwell’s next element—TheStickiness Factor—says that there arespecific ways of making a conta-gious message memorable. More-over, relatively simple changes inthe presentation and structuring ofinformation can make a big differ-ence in the impact it makes.TheGED Testing Program developedthe “sticky” message,“A NewRace Begins in 2002,” using posterand press release templates so thatthe Few could tailor and deliverthe message to the GED candidatesat the local level. Beginning in Jan-uary 2002, earning a GED creden-tial requires passing all five of thenew 2002 Series GED Tests; testresults from previous series can nolonger be used.This decisionreflects the secondary schoolmovement toward higher standards.Because of this major change,and more specifically the wide-spread publicity strategically placedat the local level, Official GEDTesting Centers experienced
Calendar Year 2001: The End ofthe 1988 Series GED Tests EraWith the publication of the GED2001 Statistical Report, the era ofthe 1988 Series GED Tests passesinto history.While we forecastedtransitional challenges associatedwith moving to the 2002 SeriesGED Tests, it was impossible toprophesy the profound nationwideeffect of the September 11 terroristincidents. In the face of tragedy, theindividuals responsible for runningthe GED program garneredstrength and moved forward. Just aspredicted in the GED 1999 Statis-tical Report, the number of adultstaking the GED Tests sharplyincreased and reached an all-timehigh last year.We therefore taketime to celebrate the milestone ofserving more than 1 million adultsin 2001—the largest single-yeartotal in our 60-year history. Inaddition, the number of adultsrequesting and receiving accom-modations more than doubled.Thisprofound increase affirms the GEDTesting Program’s strong commit-ment to access—to meet the needsof GED candidates who requiretesting accommodations to obtain avalid assessment of their educa-tional skills.
Why these unprecedented num-bers and this remarkable growth in2001? What carefully conceivedalterations produced major andunparalleled consequences for boththe delivery system and the indi-viduals?
In his recent book, MalcolmGladwell defines three factors thatcontribute to a Tipping Point.Thefirst factor—Gladwell’s Law of theFew—depends heavily on the
by Joan Chikos Auchter, Executive Director, GEDTS
The name given to that
one dramatic moment
when everything can
change all at once is
the Tipping Point.
— Malcolm Gladwell,The Tipping Point:How Little Things Can Make a Big Difference(Back Bay Books, 2002)
Foreword
Years Data Were Collected 1949–1967 1968–1977 1978–1987 1988–2001Total Number of Years 19 10 10 14Number of Official GED Testing Centers
Initial Year 570 1,336 2,708 3,450 Final Year 1,194 2,704 3,314 3,378
Total Number ofAdults Tested
Initial Year 39,019 265,499 674,724 734,087Final Year 218,386 715,116 758,367 1,069,899
Total Number in Period 1,429,714 4,809,147 7,550,439 11,537,392Total Number of Credentials Issued
Initial Year 30,302 184,256 392,511 435,318Final Year 152,870 342,828 472,007 669,403
Total Number in Period 1,057,358 2,707,959 4,664,727 6,963,608Percent PlanningFurther Study
Initial Year (1953) 39.0 39.9 35.6 47.5Final Year 36.0 37.8 49.7 65.5
2
20
01
GE
D S
tati
sti
ca
l R
ep
ort
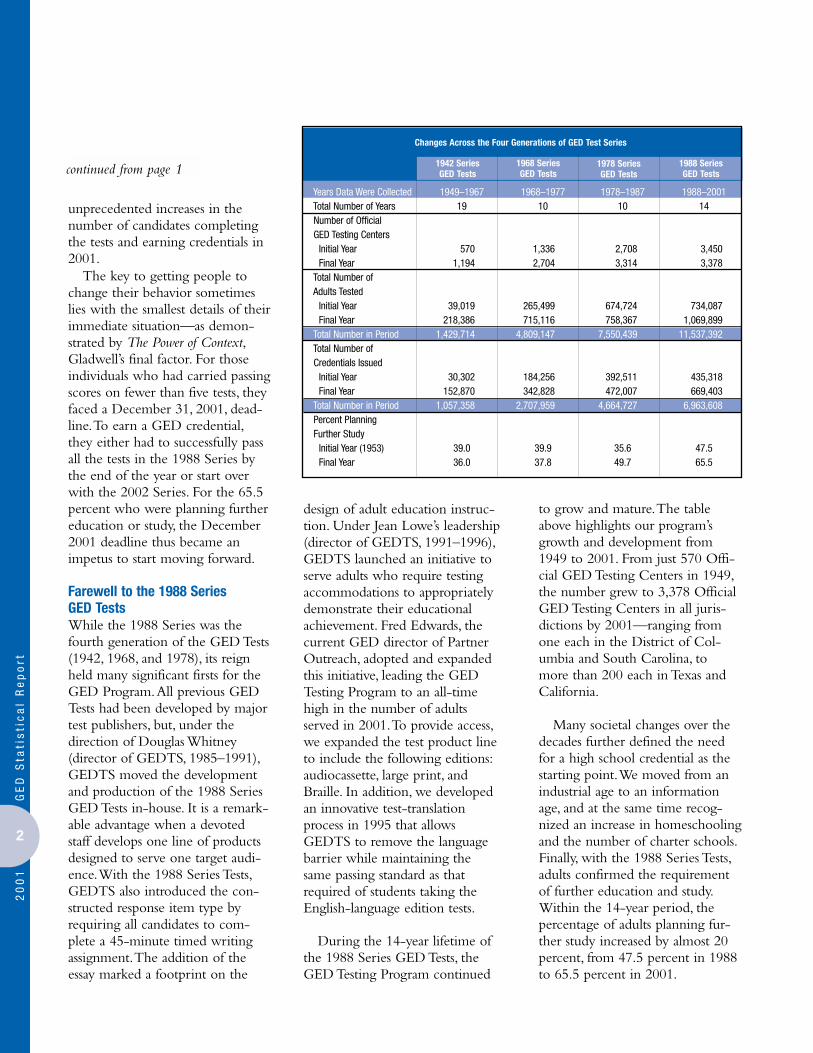
design of adult education instruc-tion. Under Jean Lowe’s leadership(director of GEDTS, 1991–1996),GEDTS launched an initiative toserve adults who require testingaccommodations to appropriatelydemonstrate their educationalachievement. Fred Edwards, thecurrent GED director of PartnerOutreach, adopted and expandedthis initiative, leading the GEDTesting Program to an all-timehigh in the number of adultsserved in 2001.To provide access,we expanded the test product lineto include the following editions:audiocassette, large print, andBraille. In addition, we developedan innovative test-translationprocess in 1995 that allowsGEDTS to remove the languagebarrier while maintaining thesame passing standard as thatrequired of students taking theEnglish-language edition tests.
During the 14-year lifetime ofthe 1988 Series GED Tests, theGED Testing Program continued
to grow and mature.The tableabove highlights our program’sgrowth and development from1949 to 2001. From just 570 Offi-cial GED Testing Centers in 1949,the number grew to 3,378 OfficialGED Testing Centers in all juris-dictions by 2001—ranging fromone each in the District of Col-umbia and South Carolina, to more than 200 each in Texas and California.
Many societal changes over thedecades further defined the needfor a high school credential as thestarting point.We moved from anindustrial age to an informationage, and at the same time recog-nized an increase in homeschoolingand the number of charter schools.Finally, with the 1988 Series Tests,adults confirmed the requirementof further education and study.Within the 14-year period, thepercentage of adults planning fur-ther study increased by almost 20percent, from 47.5 percent in 1988to 65.5 percent in 2001.
continued from page 1
unprecedented increases in thenumber of candidates completingthe tests and earning credentials in2001.
The key to getting people tochange their behavior sometimeslies with the smallest details of theirimmediate situation—as demon-strated by The Power of Context,Gladwell’s final factor. For thoseindividuals who had carried passingscores on fewer than five tests, theyfaced a December 31, 2001, dead-line.To earn a GED credential,they either had to successfully passall the tests in the 1988 Series bythe end of the year or start overwith the 2002 Series. For the 65.5percent who were planning furthereducation or study, the December2001 deadline thus became animpetus to start moving forward.
Farewell to the 1988 Series GED TestsWhile the 1988 Series was thefourth generation of the GED Tests(1942, 1968, and 1978), its reignheld many significant firsts for theGED Program.All previous GEDTests had been developed by majortest publishers, but, under thedirection of Douglas Whitney(director of GEDTS, 1985–1991),GEDTS moved the developmentand production of the 1988 SeriesGED Tests in-house. It is a remark-able advantage when a devotedstaff develops one line of productsdesigned to serve one target audi-ence.With the 1988 Series Tests,GEDTS also introduced the con-structed response item type byrequiring all candidates to com-plete a 45-minute timed writingassignment.The addition of theessay marked a footprint on the
Changes Across the Four Generations of GED Test Series
1978 SeriesGED Tests
1988 SeriesGED Tests
1942 SeriesGED Tests
1968 SeriesGED Tests

3
20
01
GE
D S
tati
sti
ca
l R
ep
ort
In the end, the Tipping Point is a reaffirmation of the potential for change and the power of intelligent action. Look at the world around you. It may seem like an immovable,implacable place. It is not.With the slightest push—in just the right place—it can be tipped.
— Malcolm Gladwell,The Tipping Point:How Little Things Can Make a Big Difference(Back Bay Books, 2002)
We dedicate this report to those1,070,000 adults who took theGED Tests and, more specifically, tothe 684,000 adults worldwide whomet the score requirements andearned their jurisdictions’ highschool credentials in 2001.We hopethat they each recognize the advan-tage of the GED as a Tipping Pointin their lives and, with the power ofintelligent action, reach their goals.
In recognition of publishing WhoTook the GED? GED 2001 Statis-tical Report, we owe special thanksto the talented staff devoted to thepublication of this issue.With dedi-cation, Ben Justesen and ZenittaJones have coordinated productionand directed data collection andquality control activities. Sen Qicontinued to refine procedures fordata analysis and verification.Special thanks to the talented staff of the American Council onEducation’s Publications Depart-ment for editing, proofing, and producing this report. Once again,a special thank you to former GEDdirector Douglas Whitney, whoprovided a historical perspectiveand an insightful interpretation ofthe tables, while Lyn Schaefer, Fred
Edwards, and Patricia Jones pro-vided an expert review of the accuracy and presentation of theinformation.Again, we recognizethe exceptional leadership of theGED Administrators (whose namesappear on pages 36–39) during ayear of challenging transition, aswell as the GED Examiners andstaff who lead the program in thefield, to serve the candidates andcollect and report the data thatmake this publication possible.
The theory of the Tipping Point requires, however, we reframe the way
we think about the world.
A Forward Glance: The 2002Series GED Tests and StatisticalReportThe 2002 Series GED Tests, intro-duced in January 2002, representsthe fifth generation of GED Tests.Changes were made to keep thetest content and passing standardcurrent with the changes in bothcurriculum and performance stan-dards in U.S. and Canadian schools.With this new generation of tests,we will have access to informationthat will dramatically change thecontent of this statistical report.Through December 31, 2001, thejurisdictions maintained all infor-mation regarding candidates andcandidate performance on theGED Tests.The GED Testing Ser-vice collected aggregate informa-tion for the GED Statistical Reportfrom each jurisdiction and thenmanually compiled the data. Begin-ning in 2002, however, certifiedelectronic scoring sites will uploaddemographic responses and candi-date performance data directly to acentralized, international database.We will be able to define the dif-ferences between those adults whoearn a credential and those who donot.Additionally, we will create aperformance profile linked withthe 2002 Series Tests passing stan-dard, a standard set so that thosewho pass the GED Tests must meetor exceed the performance of the top 58 percent of traditionalhigh school graduates—the highestin our program’s 60-year history.We can expect a brief plateaubecause, with the introduction ofthe new tests and higher passingstandard, past trends suggest areturn to more historically compa-rable levels of participation in2002.
— Malcolm Gladwell, The Tipping Point: How Little Things Can Make a Big Difference(Back Bay Books, 2002)

4
20
01
GE
D S
tati
sti
ca
l R
ep
ort
Introduction
THE GED TESTING SERVICEJoan Chikos Auchter, Executive Director
The Tests ofGeneral Edu-cational Devel-opment (GEDTests) provideadults who didnot completehigh schoolwith an oppor-tunity to earn
a high school equivalency diploma.By taking and passing a series offive tests in Language Arts,Writing;Social Studies; Science; LanguageArts, Reading; and Mathematics,adults demonstrate that they haveacquired a level of learning compa-rable to that of high school gradu-ates.
The GED Tests were first devel-oped in 1942 to provide returningWorld War II veterans who hadnot earned a high school diplomabefore entering military servicewith the opportunity to earn ahigh school credential.The pur-pose of the GED Tests, essentiallyunchanged for 60 years, is to measure the academic skills andknowledge developed in a four-year program of high school edu-cation in the core content areas ofU.S. and Canadian high schoolcurricula. Recognized nationwidein the United States and Canadaby employers and institutions ofhigher learning, the GED programhas served as a bridge to educationand employment opportunities formillions of adults since 1942.Nearly 15 million people haveearned high school equivalencydiplomas since the program began.Each year, approximately 800,000
adults complete the GED Tests bat-tery, and more than half a millionobtain high school credentialsbased on passing the tests.
A program of the AmericanCouncil on Education’s Center forAdult Learning and EducationalCredentials, the GED Testing Ser-vice (GEDTS) develops the GEDTests and collects, produces, anddisseminates research informationon those who take, as well as thosewho pass, the GED Tests. In addi-tion, the GEDTS contracts withmore than 3,000 Official GEDTesting Centers in the UnitedStates, Canada, and overseas to pro-vide test materials and to monitorservices to GED candidates.TheGED Testing Program is jointly administered by the GEDTesting Service of the AmericanCouncil on Education and eachparticipating state, provincial, orterritorial department or ministryof education.
But the real story of GEDTSstems from the people it serves—the individuals who take the teststo fulfill their goals and aspirations.For these individuals, the GEDTests truly represent anotheropportunity.As you read thisreport, you will find that thosewho take the GED Tests are a richlydiverse group. Some have recentlyleft school. Others have been outof school for several years.Whilemost people take the tests to qualifyfor further education, others hopethat passing the GED Tests willencourage their children or grand-children to stay in school.
The GED Tests certify the
attainment of subject matter
knowledge and skills associated
with high school completion.
The GED credential reflects the
acquisition of academic skills
and proficiencies widely viewed
as necessary for social and
economic advancement.

5
20
01
GE
D S
tati
sti
ca
l R
ep
ort
Many adults who take the GEDTests are preparing to enter a com-munity college or four-year univer-sity. In fact, each year approximatelyone out of 20 first-year college stu-dents has earned a GED diploma.GED graduates have achievedambitious career goals, securingsuccessful positions such as businessprofessionals, office workers,mechanics, college professors, mili-tary leaders, writers, and artists.
THE CENTER FOR ADULT LEARNINGAND EDUCATIONAL CREDENTIALSSusan Porter Robinson, Vice President and Director
Founded in1942, the Cen-ter for AdultLearning andEducationalCredentialspioneered theevaluation ofeducation andtraining
attained outside the classroom.For 60 years, the Center haschampioned the concept of life-long learning through its threemain program activities: highschool credentialing, college creditrecommendations, and educationalrecordkeeping.
High School CredentialingMany adults who dropped out ofhigh school have later acquired acomparable level of learning whileon the job or at home. In an effortto help these adults earn a highschool credential, the Center offersthe Tests of General EducationalDevelopment (GED Tests).TheGED Tests are a battery of exami-nations that measure the generalacademic skills and knowledgeusually acquired in a four-year highschool program of study. Passingscores on the tests are set so thatGED candidates must perform as
well as or better than 60 percent ofthe norm group of graduating highschool seniors.
College Credit RecommendationsIn step with its commitment tolifelong learning, the Centeradministers three programs thatrecommend credit for work-related education.The AmericanCouncil on Education’s CollegeCredit Recommendation Servicerecommends college credit forworkplace courses offered by busi-ness and industry, labor unions,associations, and government agencies, as well as for nationallyrecognized testing and certificationprograms. Its counterpart for thearmed services, Military Programs,helps thousands of servicemembersand veterans earn credit for thecollege-level learning they’veacquired while on active duty.
Educational RecordkeepingTo keep track of these collegecredit recommendations and othertraining, the Center offers threecomputerized recordkeeping serv-ices.The ACE Transcript Serviceoffers adults a computerized recordof their credit recommendations,including those made by the ACECollege Credit RecommendationService and Credit by ExaminationProgram.The CEU Transcript Ser-vice provides a transcript servicefor adults who are pursuing con-tinuing education units (CEUs) forprofessional development, careeradvancement, or state licensingrequirements. Lastly, the MilitaryPrograms Division offers educa-tional transcripting services forArmy, Navy, and Marine Corpsmilitary personnel.Taken together,all of these transcripting systemshelp college and other officials rec-ognize workplace learning alongwith the responsibilities and skillsthat registry participants gainedwhile on the job.
THE AMERICAN COUNCIL ON EDUCATIONDavid Ward, President
The AmericanCouncil onEducation(ACE), foundedin 1918, isthe nation’sumbrella highereducation asso-ciation.ACEbelieves that
equal educational opportunity anda strong higher education systemare essential cornerstones of a dem-ocratic society. Its approximately1,800 members include accredited,degree-granting colleges and uni-versities from all sectors of highereducation and other education andeducation-related organizations.ACE advances the interests andgoals of higher and adult educationin a changing environment by pro-viding leadership and advocacy onimportant issues, representing theviews of the higher and adult education community to policymakers, and offering services to itsmembers.

6
20
01
GE
D S
tati
sti
ca
l R
ep
ort
Currently, more than 3,000GED Testing Centers are in opera-tion in the 50 states, the District ofColumbia, nine U.S. Insular Areasand Freely Associated States, and 11 participating Canadian provincesand territories, as well as on mili-tary bases in the United States andoverseas, in correctional institu-tions, in Veterans Administrationhospitals, and in Prometric® Cen-ters outside the United States andCanada.
In the fall of 2001, GEDTS andACE staff began producing WhoTook the GED? GED 2001 Statis-tical Report, and GEDTS updatedits computer programs to generatethe statistical tables. In February2002, GED Administrators at thestate, provincial, and territorial levels sent their jurisdictionalreports to GEDTS.We at GEDTSchecked the data for accuracy andentered this information into ournational database. In March, prelim-inary tables were prepared andreturned to the GED Administra-tors, who then reviewed, revised,and approved the final figures.During March and April, GEDTSupdated all statistical databases toreflect the revisions. In April andMay, we generated and edited allstatistical tables, prepared graphsand text, and printed the finalreport.
The GED 2001 Statistical Reportpresents tabulations of the numbersand percentages of all persons whotook and passed the GED Tests in a calendar year within each partici-pating jurisdiction. Procedures forcollecting these data can differgreatly from one jurisdiction toanother. For example, in a calendaryear,Texas, California, and Michigancollect summary reports on thou-sands of GED candidates fromhundreds of testing centers. In con-trast, Guam, Newfoundland, SouthCarolina, and Prince Edward Islandcollect data on hundreds of GEDcandidates from a single center.Furthermore, some jurisdictionsrely on computerized scoring andrecordkeeping systems to generatethese data, while others performthe tasks manually.
In reviewing the tables in WhoTook the GED? GED 2001 Statis-tical Report, it is useful to bear inmind that local conditions such asextreme weather—as well as ajurisdiction’s policies, procedures,and education funding levels—caninfluence the number of persons ina given year who take the GEDTests, complete the test battery,meet score requirements, andreceive credentials.As we work toimprove the quality, clarity, andusefulness of the data we collect,we encourage readers to write tous to suggest ways we can improvethis report.
The collection of data for the GED
Annual Statistical Report is a joint
responsibility of the General
Educational Development
Testing Service (GEDTS), GED
Administrators, and GED Chief
Examiners. This data collection is
international in scope, requiring
the cooperation of educators and
testing professionals throughout
North America and abroad.
Gathering the Data
It is useful to bear in mind that local conditions such as extreme
weather—as well as a jurisdiction’s policies, procedures, and educa-
tion funding levels—can influence the number of persons in a given
year who take the GED Tests, complete the test battery, meet score
requirements, and receive credentials. We encourage readers to write
to us to suggest ways we can improve this report.

7
20
01
GE
D S
tati
sti
ca
l R
ep
ort
We are all users of data and con-sumers of information.To makeinformed educational and policydecisions in this time of rapidsocial and economic change, werequire accurate and up-to-dateinformation about our programs.The General Educational Devel-opment Testing Service (GEDTS)has produced annual statisticalreports profiling GED test-takersfor every calendar year since 1958.In response to growing demandsfor more information about ourprogram, we revised the GEDAnnual Statistical Report in 1993 tomake it easier to read.The positivereactions of our readers to theserevisions encouraged us to continueimproving the usefulness and read-ability of this report.We havestreamlined and expanded our datacollection operations beginningwith the new series of GED Tests,released in January 2002.
Throughout this report, theterm “GED test-taker” refers topeople who have taken at least oneof the five GED Tests.The term“GED completer” refers to peoplewho have taken all five tests in theGED battery.The term “GEDgraduate” refers to people whohave earned high school credentialsbased on passing all five tests in theGED battery. Since 1994, theGED Annual Statistical Report hasincluded the number of personscompleting the entire battery offive GED Tests. It is useful to notethat about 13 percent of thosewho take the tests each year donot complete the entire battery.Thus, they may be counted againin subsequent years. GED test-takers must take and pass all five
tests in order to meet their jurisdic-tion’s score requirements for a highschool equivalency credential.Thenumber of persons completing allfive tests in the battery provides thebasis for calculating the pass rate forthe program.
For readers new to the GEDStatistical Report, the data presentedin Tables 1 through 13 providesummary information about thosewho take the GED Tests and thejurisdictions that administer thosetests. Most tables summarize infor-mation for the United States, itsInsular Areas and Freely AssociatedStates, Canada, and GEDTS-administered programs, and alsooffer program totals. Readers cancompare information across cate-gories, jurisdictions, and years. Eachtable is arranged to provide datawithin the following umbrella top-ics: percent changes from 2000 to2001 (Table 1); number tested,number completing tests, and number meeting score require-ments (Table 2); people tested andcredentials issued by age groups(Tables 3 and 4); other test editionsand testing accommodations(Tables 5 and 6); formal educationand future plans (Tables 7 and 8);trends in participation and creden-tialing (Tables 9 and 11); participa-tion and credentialing rates (Table10); and minimum score require-ments and testing policies (Tables12–13).
The names, addresses, phonenumbers, and e-mail addresses of the GED Administrators for the participating jurisdictions areincluded on pages 36 through 39.
This report was developed with
several audiences in mind. For
those who rely on the statistical
tables for program status and
trend information, the tables and
graphs provide comparisons
across categories, jurisdictions,
and years. This report provides
photographs, expanded text, and
informative captions to describe
the program’s purpose and the
diversity of those who take the
GED Tests.
How to Use this Report

8
20
01
GE
D S
tati
sti
ca
l R
ep
ort
TRENDS IN GED TEST-TAKING◗The year 2001 marked the finalyear of administering the 1988Series GED Tests, the fourth gen-eration of GED Tests (after the1942, 1968, and 1978 series) inthe program’s 60-year history.When the GED Testing Service(GEDTS) transitioned to each ofthe former generations of tests,candidates had been permitted tocarry over their individual testpassing scores from earlier test edi-tions.The jurisdictions could thencombine passing scores from earlieredition tests with passing scores ontests in the new series to deter-mine eligibility for a credential.This has now changed. For the2002 Series GED Tests, all creden-tials earned beginning in January2002 must be earned by passing allfive of the 2002 GED Series Tests.This decision reflects the move-ment among secondary schoolstoward higher standards—standardsthat are reflected in the new tests.Because of this major change,along with widespread publicitystrategically placed at the locallevel, Official GED Testing Centersexperienced unprecedentedincreases in the number of candi-dates in 2001. GEDTS predictedthis significant increase in theForeword of the GED 2000 Statis-tical Report; past trends suggest areturn to more historically compa-rable levels across the board in2002.
◗ As a result, nearly 1,070,000adults participated in the GEDTesting Program by taking oneor more tests in 2001—a 24.3percent increase over 2000.Thisnumber represents the largest
single-year volume in the 60-yearhistory of the program (Table 2).Almost 684,000 adults worldwidemet their jurisdictions’ scorerequirements in 2001, exceedingthe 2000 passing rate by nearly 32percent (Table 1).This increase inthe number of adults who met the score requirements is commensurate with the increase in the number of adults who completed the GED Tests battery(31 percent).
◗About one of every 10 adults(100,529) who took one or moreof the GED Tests in 2001 tested inthe state of Texas (Table 2).
◗Nearly 980,000 adults worldwidecompleted the GED Tests batteryin 2001—about 31 percent morethan in 2000.This number repre-sents the largest single-year totaland percentage increase in the pro-gram’s 60-year history (Table 1).Seven of every 10 adult candidatesworldwide (71.1 percent) testedfor the first time in 2001 and com-pleted the GED Tests battery(Table 2).
◗ Thirteen jurisdictions reportedincreases of 5 percent or morein their 2001 passing rates: Palau(23.9 percent), New Mexico (23.5percent), Newfoundland (22.0percent), Northwest Territories(18.0 percent),Virgin Islands (13.1percent), New Brunswick (9.6percent), Pennsylvania (9.0 per-cent), Delaware (8.0 percent),New Hampshire (6.5 percent),Oregon (5.6 percent),Saskatchewan (5.5 percent), Michi-gan (5.4 percent), and Georgia (5.0percent) (Table 2).
2001Statistical Highlights
◗ Conversely, seven jurisdictionsreported decreases of 5 percent ormore in their 2001 passing rates:Puerto Rico (31.7 percent),Wis-consin (17.9 percent), PrinceEdward Island (9.1 percent),Ver-mont (8.7 percent), Colorado (7.9percent), Maryland (5.4 percent),and Alabama (5.3 percent) (Table2).
◗ In 2001, only 1.9 percent of the52 million adults in North Americawho had not graduated from highschool attempted to earn a highschool credential by completingthe GED Tests. Program-wide, 1.3percent of those 52 million adultspassed the tests and earned a highschool credential in 2001.Whilethe percentage of adults movingforward is low, the percentage ofadults who participated in 2001 is the highest in the program’s history (Table 10).
◗An estimated 15.4 million adultsworldwide have passed the GEDTests and earned their jurisdictions’high school credentials since 1949(Table 11).
◗Almost as many adults worldwide(669,403) earned credentials in2001 as adults worldwide (690,509)who completed the GED Tests bat-tery in 1987, the year before the1988 Series GED Tests werelaunched.These unprecedentedincreases in adults worldwide whoparticipated, who completed theGED Tests battery, and who mettheir jurisdictions’ score require-ments may be attributed to therush to complete the 1988 SeriesGED Tests before the December2001 deadline (Table 11).

9
20
01
GE
D S
tati
sti
ca
l R
ep
ort
AGE, FORMAL SCHOOLING, ANDACADEMIC GOALS◗The average age of the adultstaking the GED Tests worldwidewas 25.2 years—an increase of sixmonths over the average age of24.7 in 2000.The percentagetested decreased slightly for all agegroups 19 and younger, andincreased slightly for all age groupsfrom 20 to 24 years of age through60 years of age (Table 3).
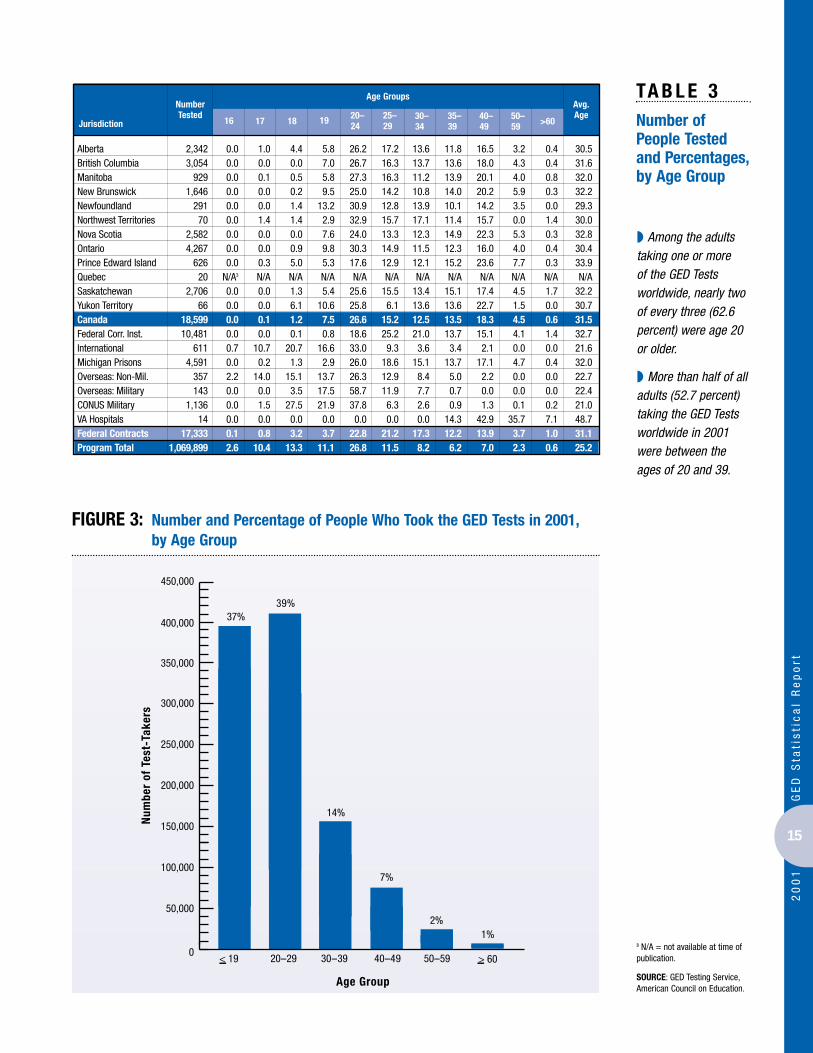
◗Among the adults taking oneor more of the GED Tests world-wide, nearly two of every three(62.6 percent) were age 20 orolder (Table 3).
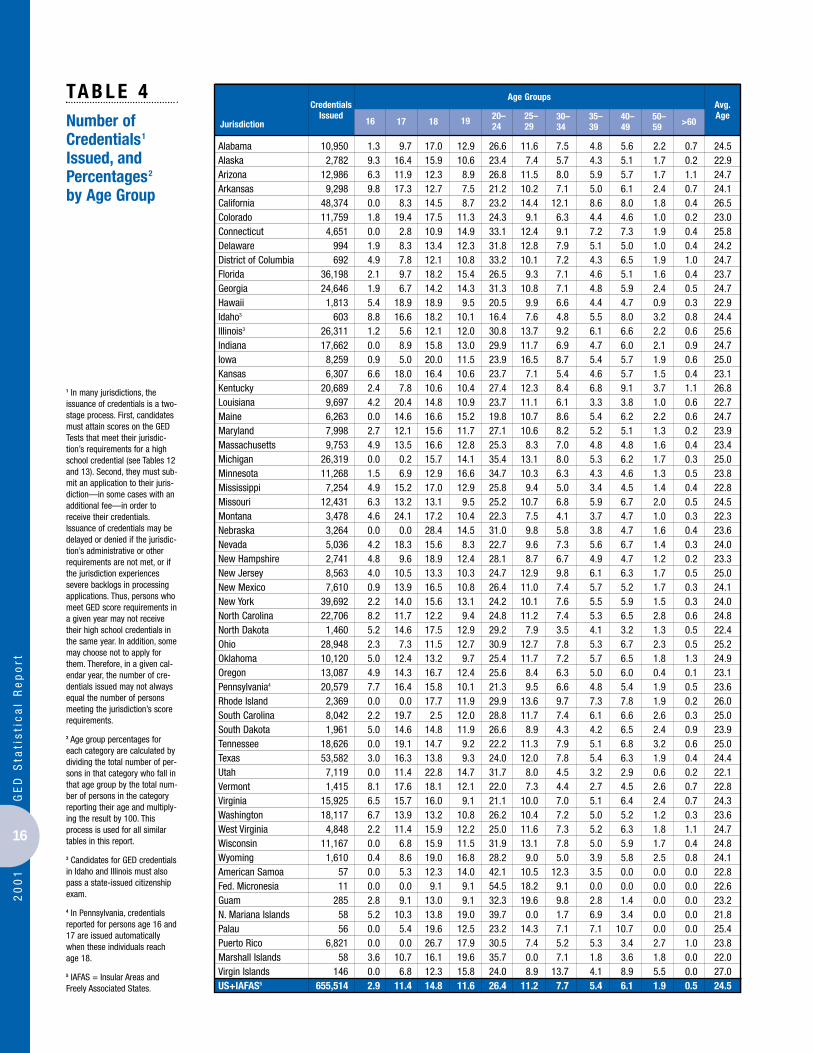
◗The average age of the adultsawarded a credential worldwidewas 24.6 years—an increase of sixmonths over the average age of24.1 in 2000 (Table 4).
◗One of every three adults world-wide (32.9 percent) earning GEDcredentials in 2001 was betweenthe ages of 25 and 59 (Table 4).
◗As in the previous year, morethan one in three adults (37.2 per-cent) who took the tests in 2001reported completing the 11th or12th grade before leaving highschool.Two of every three adultstested (66.5 percent) reportedcompleting the 10th grade orhigher before leaving high school(Table 7).
◗Nearly two of every three adultsworldwide (65.5 percent) tested in2001 reported that they took theGED Tests to qualify for furthertraining and education beyond thehigh school level.Among the three
subgroups reported, the percentagewho say that varies significantly (inthe United States and Insular Areasand Freely Associated States, 65.5percent; in Canada, 53.2 percent;and in Federal Contracts programs,77.0 percent).The overall rate is 18percentage points higher than in1988, when this series of tests wasintroduced (47.5 percent) (Table8).
OTHER EDITIONS AND SPECIALTESTING ACCOMMODATIONS◗Even with unprecedented num-bers of candidates testing in 2001,GED Administrators and Examin-ers at the jurisdictional and locallevels advanced the GEDTS com-mitment to access and meeting thespecial needs of the candidates.The2001 numbers show a dramaticincrease across the board in all cat-egories of accommodations—significantly exceeding the meanincrease in test volume.
◗Since 1989, the number of adultstaking other editions of the GEDTests has more than tripled, risingfrom 1,169 in 1989 to 4,084 in2001 (a 249.4 percent increase).
◗The number of adults takingother editions of the GED Testsincreased by 98.7 percent, from2,055 in 2000 to 4,084 in 2001(Table 5).
◗The overall number of requestsfor specific learning disability(SLD) accommodations in 2001increased by 162 percent over2000 (Table 6).
◗The number of adults worldwidereceiving accommodations in 2001(15,782) increased by 95.5 percentover 2000 and by 767 percent over1989 (Table 6).
◗The number of adults worldwidetaking all other editions of theGED Tests increased significantlyover 2000 totals: audiocassette(187.9 percent), Braille (102.3 per-cent), and large print (71.4 per-cent) (Table 5).
◗Twenty jurisdictions worldwidemore than tripled their overallnumber of SLD requests between2000 and 2001:Arkansas, Califor-nia, Connecticut, Illinois, Indiana,Maryland, Massachusetts, Nevada,New Hampshire, New Mexico,Ohio, Oklahoma, South Carolina,South Dakota,Tennessee,Texas,Utah,Vermont,Washington, andMichigan Prisons. New York, thejurisdiction with the largest num-ber of SLD requests, went up by196 percent.
◗Nearly 95 percent of adult candidates worldwide took theEnglish-language print edition ofthe GED Tests. However, morethan 50,000 candidates took theSpanish-language print edition of the GED Tests in 2001—anincrease of 9.7 percent from 2000to 2001, with about one in threeSpanish-language candidates (31.8percent) having tested in PuertoRico. California saw a 56.1 per-cent increase in the number of itsadults taking the Spanish-languageedition (4,162 in 2000 and 6,498in 2001) (Table 5).

10
20
01
GE
D S
tati
sti
ca
l R
ep
ort
1 Percent change is calculatedby subtracting the numberreported for 2000 from thenumber reported for 2001, thendividing the difference by thenumber reported for 2000.
2 During the 1999 calendaryear, credentialing for GEDgraduates testing through Pro-metric (see 7 below) was trans-ferred from Iowa to Maine.
3 N/A = not available at time ofpublication.
4 Prior to 1998, data for theFederated States of Micronesia,the Republic of Palau, and theRepublic of the Marshall Islandswere reported under Microne-sia. All three jurisdictions areself-governing and have free-association status with theUnited States.
5 For all tables in this report,note that the Northern MarianaIslands is a self-governingcommonwealth of the UnitedStates.
6 IAFAS = Insular Areas andFreely Associated States.
7 Federal contracts categories(Tables 1–3; 5–8): Successfulcandidates taking the GEDTests through these venues areawarded credentials by a juris-diction based on their addressof record, current residencystatus, or through a priorarrangement.
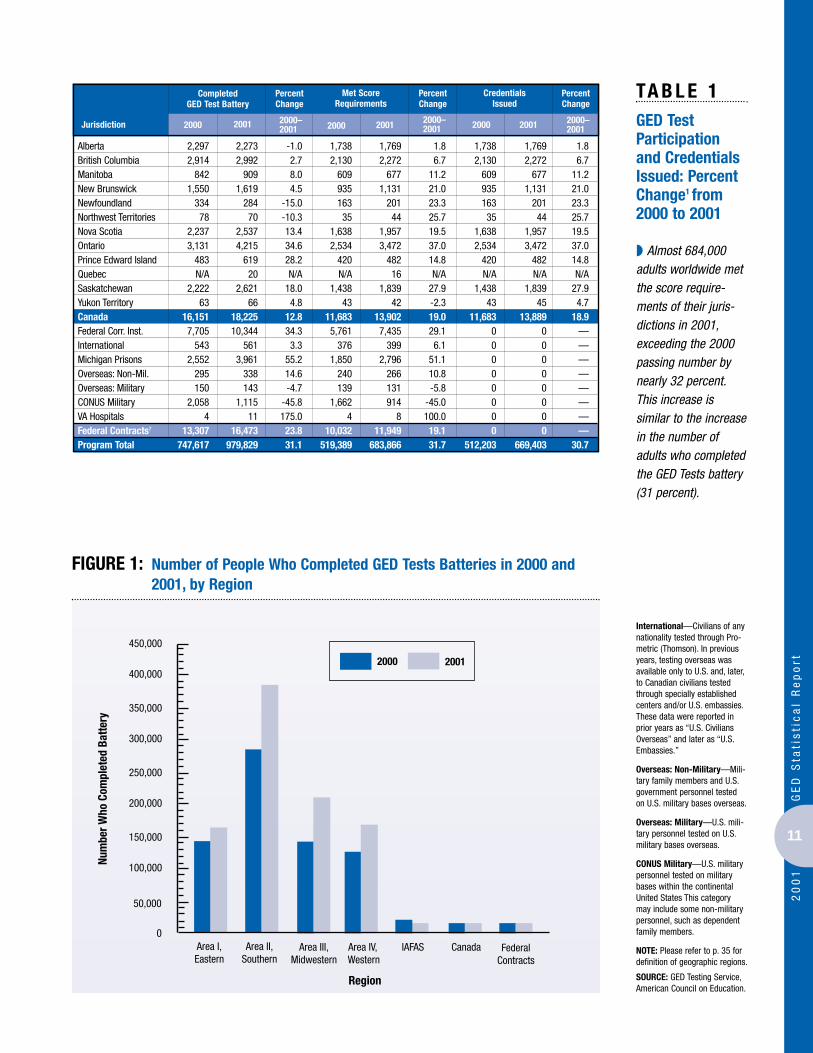
TA B L E 1GED Test Participationand CredentialsIssued: PercentChange1 from2000 to 2001
Alabama 11,646 19,681 69.0 7,092 10,950 54.4 7,092 10,950 54.4Alaska 2,397 3,215 34.1 2,071 2,783 34.4 2,156 2,782 29.0Arizona 13,449 18,321 36.2 9,687 12,986 34.1 9,687 12,986 34.1Arkansas 8,578 11,205 30.6 6,909 9,141 32.3 7,105 9,298 30.9California 44,760 60,719 35.7 33,882 47,672 40.7 34,379 48,374 40.7Colorado 9,780 12,579 28.6 9,688 11,473 18.4 9,875 11,759 19.1Connecticut 6,018 7,190 19.5 3,675 4,585 24.8 3,761 4,651 23.7Delaware 829 1,134 36.8 661 994 50.4 661 994 50.4District of Columbia 1,216 1,596 31.3 495 692 39.8 495 692 39.8Florida 43,557 59,507 36.6 28,039 36,100 28.7 29,312 36,198 23.5Georgia 30,025 37,889 26.2 18,030 24,646 36.7 18,703 24,646 31.8Hawaii 1,895 2,774 46.4 1,374 1,944 41.5 1,367 1,813 32.6Idaho 4,558 6,509 42.8 3,948 5,603 41.9 466 603 29.4Illinois 32,282 43,199 33.8 19,796 26,648 34.6 19,629 26,311 34.0Indiana 17,362 23,102 33.1 13,184 17,662 34.0 13,184 17,662 34.0Iowa2 4,905 8,447 72.2 4,680 7,996 70.9 4,983 8,259 65.7Kansas 6,871 7,044 2.5 5,830 6,307 8.2 5,830 6,307 8.2Kentucky 16,705 26,646 59.5 12,264 19,250 57.0 13,211 20,689 56.6Louisiana 11,051 13,150 19.0 8,360 9,685 15.8 8,373 9,697 15.8Maine2 2,978 3,971 33.3 2,774 3,736 34.7 5,418 6,263 15.6Maryland 11,361 16,272 43.2 6,200 7,998 29.0 6,200 7,998 29.0Massachusetts 11,479 13,425 17.0 7,955 8,882 11.7 8,046 9,753 21.2Michigan 22,542 35,008 55.3 14,988 25,155 67.8 12,574 26,319 109.3Minnesota 8,126 13,244 63.0 6,919 11,268 62.9 6,885 11,268 63.7Mississippi 12,779 15,330 20.0 6,660 7,254 8.9 6,660 7,254 8.9Missouri 13,677 16,352 19.6 10,356 12,365 19.4 10,411 12,431 19.4Montana 3,063 4,232 38.2 2,411 3,478 44.3 2,411 3,478 44.3Nebraska 2,703 4,304 59.2 2,485 4,042 62.7 2,080 3,264 56.9Nevada 5,318 6,735 26.6 4,089 4,968 21.5 4,121 5,036 22.2New Hampshire 2,406 3,069 27.6 1,969 2,710 37.6 1,995 2,741 37.4New Jersey 13,524 14,812 9.5 7,582 8,561 12.9 8,090 8,563 5.8New Mexico 6,709 8,408 25.3 4,494 7,610 69.3 4,494 7,610 69.3New York 63,560 70,682 11.2 35,181 39,099 11.1 35,302 39,692 12.4North Carolina 17,503 26,347 50.5 14,858 22,706 52.8 14,858 22,706 52.8North Dakota 1,257 1,757 39.8 1,028 1,460 42.0 1,028 1,460 42.0Ohio 25,076 40,686 62.3 18,898 28,948 53.2 18,898 28,948 53.2Oklahoma 11,374 14,373 26.4 8,096 10,120 25.0 8,096 10,120 25.0Oregon 10,686 14,759 38.1 8,885 13,087 47.3 8,885 13,087 47.3Pennsylvania 23,930 25,068 4.8 17,487 20,579 17.7 17,487 20,579 17.7Rhode Island 2,687 4,017 49.5 2,058 2,912 41.5 1,907 2,369 24.2South Carolina 8,392 11,718 39.6 5,511 7,895 43.3 5,654 8,042 42.2South Dakota 1,803 2,510 39.2 1,425 1,961 37.6 1,477 1,961 32.8Tennessee 20,798 27,460 32.0 13,584 18,626 37.1 13,742 18,626 35.5Texas 71,493 90,685 26.8 44,904 58,637 30.6 46,148 53,582 16.1Utah 6,509 8,660 33.0 5,208 7,119 36.7 5,208 7,119 36.7Vermont 1,001 1,654 65.2 870 1,294 48.7 1,019 1,415 38.9Virginia 17,485 24,310 39.0 11,380 15,896 39.7 11,386 15,925 39.9Washington 15,861 20,882 31.7 13,064 17,457 33.6 13,061 18,117 38.7West Virginia 5,481 7,083 29.2 3,546 4,836 36.4 3,554 4,848 36.4Wisconsin 8,510 13,877 63.1 8,377 11,167 33.3 8,377 11,167 33.3Wyoming 1,413 1,877 32.8 1,280 1,631 27.4 1,256 1,610 28.2American Samoa N/A3 111 N/A N/A 57 N/A N/A 57 N/AFed. Micronesia4 N/A 40 N/A N/A 11 N/A N/A 11 N/AGuam 372 436 17.2 231 285 23.4 221 285 29.0N. Mariana Islands5 44 105 138.6 26 58 123.1 26 58 123.1Palau4 100 92 -8.0 37 56 51.4 37 56 51.4Puerto Rico 17,828 16,595 -6.9 12,986 6,821 -47.5 12,986 6,821 -47.5Marshall Islands4 109 76 -30.3 12 10 -16.7 58 58 0.0Virgin Islands 338 202 -40.2 195 143 -26.7 195 146 -25.1US+IAFAS6 718,159 945,131 31.6 497,674 658,015 32.2 500,520 655,514 31.0
Completed GED Test Battery
Met Score Requirements
Credentials Issued
PercentChange
PercentChange
PercentChange
2000 2001 20012000–2001
2000–2001
2000–20012000 20012000Jurisdiction
◗ Nearly 980,000adults worldwidecompleted the GEDTests battery in2001—about 31 per-cent more than in2000. This numberrepresents the largestsingle-year total andpercentage increasein the program’s 60-year history.
11
20
01
GE
D S
tati
sti
ca
l R
ep
ort
TA B L E 1GED Test Participationand CredentialsIssued: PercentChange1 from2000 to 2001
International—Civilians of anynationality tested through Pro-metric (Thomson). In previousyears, testing overseas wasavailable only to U.S. and, later,to Canadian civilians testedthrough specially establishedcenters and/or U.S. embassies.These data were reported inprior years as “U.S. CiviliansOverseas” and later as “U.S.Embassies.”
Overseas: Non-Military—Mili-tary family members and U.S.government personnel testedon U.S. military bases overseas.
Overseas: Military—U.S. mili-tary personnel tested on U.S.military bases overseas.
CONUS Military—U.S. militarypersonnel tested on militarybases within the continentalUnited States This categorymay include some non-militarypersonnel, such as dependentfamily members.
NOTE: Please refer to p. 35 fordefinition of geographic regions.
SOURCE: GED Testing Service,American Council on Education.
◗ Almost 684,000adults worldwide metthe score require-ments of their juris-dictions in 2001,exceeding the 2000passing number bynearly 32 percent.This increase is similar to the increasein the number ofadults who completedthe GED Tests battery(31 percent).
0
100,000
150,000
200,000
250,000
300,000
350,000
400,000
450,000
50,000
Num
ber W
ho C
ompl
eted
Bat
tery
20012000
FederalContracts
CanadaIAFASArea IV, Western
Area III,Midwestern
Area II, Southern
Area I, Eastern
Region
FIGURE 1: Number of People Who Completed GED Tests Batteries in 2000 and2001, by Region
Completed GED Test Battery
Met Score Requirements
Credentials Issued
PercentChange
PercentChange
PercentChange
2000 2001 20012000–2001
2000–2001
2000–20012000 20012000Jurisdiction
Alberta 2,297 2,273 -1.0 1,738 1,769 1.8 1,738 1,769 1.8British Columbia 2,914 2,992 2.7 2,130 2,272 6.7 2,130 2,272 6.7Manitoba 842 909 8.0 609 677 11.2 609 677 11.2New Brunswick 1,550 1,619 4.5 935 1,131 21.0 935 1,131 21.0Newfoundland 334 284 -15.0 163 201 23.3 163 201 23.3Northwest Territories 78 70 -10.3 35 44 25.7 35 44 25.7Nova Scotia 2,237 2,537 13.4 1,638 1,957 19.5 1,638 1,957 19.5Ontario 3,131 4,215 34.6 2,534 3,472 37.0 2,534 3,472 37.0Prince Edward Island 483 619 28.2 420 482 14.8 420 482 14.8Quebec N/A 20 N/A N/A 16 N/A N/A N/A N/ASaskatchewan 2,222 2,621 18.0 1,438 1,839 27.9 1,438 1,839 27.9Yukon Territory 63 66 4.8 43 42 -2.3 43 45 4.7Canada 16,151 18,225 12.8 11,683 13,902 19.0 11,683 13,889 18.9Federal Corr. Inst. 7,705 10,344 34.3 5,761 7,435 29.1 0 0 —International 543 561 3.3 376 399 6.1 0 0 —Michigan Prisons 2,552 3,961 55.2 1,850 2,796 51.1 0 0 —Overseas: Non-Mil. 295 338 14.6 240 266 10.8 0 0 —Overseas: Military 150 143 -4.7 139 131 -5.8 0 0 —CONUS Military 2,058 1,115 -45.8 1,662 914 -45.0 0 0 —VA Hospitals 4 11 175.0 4 8 100.0 0 0 —Federal Contracts7 13,307 16,473 23.8 10,032 11,949 19.1 0 0 —Program Total 747,617 979,829 31.1 519,389 683,866 31.7 512,203 669,403 30.7
12
20
01
GE
D S
tati
sti
ca
l R
ep
ort
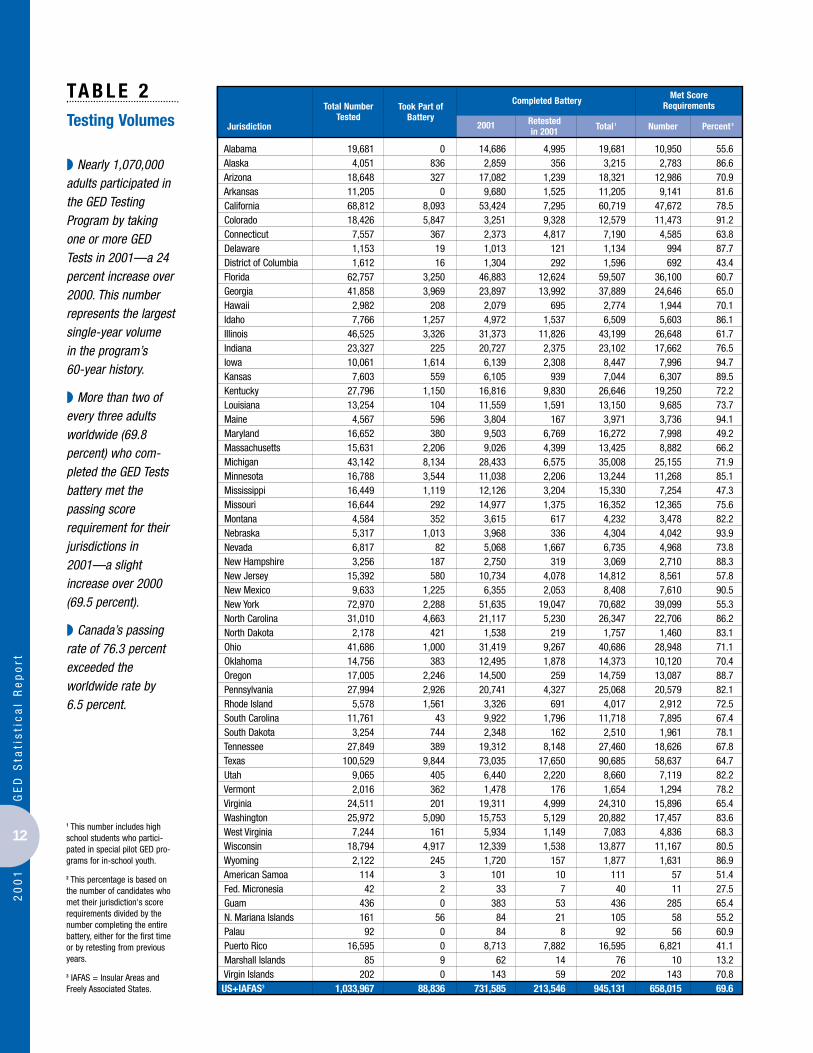
TA B L E 2Testing Volumes
1 This number includes highschool students who partici-pated in special pilot GED pro-grams for in-school youth.
2 This percentage is based onthe number of candidates whomet their jurisdiction's scorerequirements divided by thenumber completing the entirebattery, either for the first timeor by retesting from previousyears.
3 IAFAS = Insular Areas andFreely Associated States.
Total Number Tested
Completed BatteryMet Score
RequirementsTook Part ofBattery
Percent 22001 NumberRetestedin 2001 Total 1Jurisdiction
Alabama 19,681 0 14,686 4,995 19,681 10,950 55.6Alaska 4,051 836 2,859 356 3,215 2,783 86.6Arizona 18,648 327 17,082 1,239 18,321 12,986 70.9Arkansas 11,205 0 9,680 1,525 11,205 9,141 81.6California 68,812 8,093 53,424 7,295 60,719 47,672 78.5Colorado 18,426 5,847 3,251 9,328 12,579 11,473 91.2Connecticut 7,557 367 2,373 4,817 7,190 4,585 63.8Delaware 1,153 19 1,013 121 1,134 994 87.7District of Columbia 1,612 16 1,304 292 1,596 692 43.4Florida 62,757 3,250 46,883 12,624 59,507 36,100 60.7Georgia 41,858 3,969 23,897 13,992 37,889 24,646 65.0Hawaii 2,982 208 2,079 695 2,774 1,944 70.1Idaho 7,766 1,257 4,972 1,537 6,509 5,603 86.1Illinois 46,525 3,326 31,373 11,826 43,199 26,648 61.7Indiana 23,327 225 20,727 2,375 23,102 17,662 76.5Iowa 10,061 1,614 6,139 2,308 8,447 7,996 94.7Kansas 7,603 559 6,105 939 7,044 6,307 89.5Kentucky 27,796 1,150 16,816 9,830 26,646 19,250 72.2Louisiana 13,254 104 11,559 1,591 13,150 9,685 73.7Maine 4,567 596 3,804 167 3,971 3,736 94.1Maryland 16,652 380 9,503 6,769 16,272 7,998 49.2Massachusetts 15,631 2,206 9,026 4,399 13,425 8,882 66.2Michigan 43,142 8,134 28,433 6,575 35,008 25,155 71.9Minnesota 16,788 3,544 11,038 2,206 13,244 11,268 85.1Mississippi 16,449 1,119 12,126 3,204 15,330 7,254 47.3Missouri 16,644 292 14,977 1,375 16,352 12,365 75.6Montana 4,584 352 3,615 617 4,232 3,478 82.2Nebraska 5,317 1,013 3,968 336 4,304 4,042 93.9Nevada 6,817 82 5,068 1,667 6,735 4,968 73.8New Hampshire 3,256 187 2,750 319 3,069 2,710 88.3New Jersey 15,392 580 10,734 4,078 14,812 8,561 57.8New Mexico 9,633 1,225 6,355 2,053 8,408 7,610 90.5New York 72,970 2,288 51,635 19,047 70,682 39,099 55.3North Carolina 31,010 4,663 21,117 5,230 26,347 22,706 86.2North Dakota 2,178 421 1,538 219 1,757 1,460 83.1Ohio 41,686 1,000 31,419 9,267 40,686 28,948 71.1Oklahoma 14,756 383 12,495 1,878 14,373 10,120 70.4Oregon 17,005 2,246 14,500 259 14,759 13,087 88.7Pennsylvania 27,994 2,926 20,741 4,327 25,068 20,579 82.1Rhode Island 5,578 1,561 3,326 691 4,017 2,912 72.5South Carolina 11,761 43 9,922 1,796 11,718 7,895 67.4South Dakota 3,254 744 2,348 162 2,510 1,961 78.1Tennessee 27,849 389 19,312 8,148 27,460 18,626 67.8Texas 100,529 9,844 73,035 17,650 90,685 58,637 64.7Utah 9,065 405 6,440 2,220 8,660 7,119 82.2Vermont 2,016 362 1,478 176 1,654 1,294 78.2Virginia 24,511 201 19,311 4,999 24,310 15,896 65.4Washington 25,972 5,090 15,753 5,129 20,882 17,457 83.6West Virginia 7,244 161 5,934 1,149 7,083 4,836 68.3Wisconsin 18,794 4,917 12,339 1,538 13,877 11,167 80.5Wyoming 2,122 245 1,720 157 1,877 1,631 86.9American Samoa 114 3 101 10 111 57 51.4Fed. Micronesia 42 2 33 7 40 11 27.5Guam 436 0 383 53 436 285 65.4N. Mariana Islands 161 56 84 21 105 58 55.2Palau 92 0 84 8 92 56 60.9Puerto Rico 16,595 0 8,713 7,882 16,595 6,821 41.1Marshall Islands 85 9 62 14 76 10 13.2Virgin Islands 202 0 143 59 202 143 70.8US+IAFAS3 1,033,967 88,836 731,585 213,546 945,131 658,015 69.6
◗ Nearly 1,070,000adults participated inthe GED Testing Program by takingone or more GEDTests in 2001—a 24percent increase over2000. This numberrepresents the largestsingle-year volumein the program’s60-year history.
◗ More than two ofevery three adultsworldwide (69.8percent) who com-pleted the GED Testsbattery met thepassing scorerequirement for theirjurisdictions in2001—a slightincrease over 2000(69.5 percent).
◗ Canada’s passingrate of 76.3 percentexceeded the worldwide rate by6.5 percent.

13
20
01
GE
D S
tati
sti
ca
l R
ep
ort
TA B L E 2Testing Volumes
SOURCE: GED Testing Service,American Council on Education.
Area I, Eastern (162,890)
17%
Area II, Southern(385,384)
39%
Area IV, Western (169,670)
17%
IAFAS (17,657)
2%
Canada (18,225)
2%
Federal Contracts (16,473)
2%
Area III, Midwestern(209,530)
21%
FIGURE 2: Percentage and Number of People Who Completed the GED TestsBatteries in 2001, by Region
Total Number Tested
Completed BatteryMet Score
RequirementsTook Part ofBattery
Percent 22001 NumberRetestedin 2001 Total 1Jurisdiction
Alberta 2,342 69 1,925 348 2,273 1,769 77.8British Columbia 3,054 62 2,600 392 2,992 2,272 75.9Manitoba 929 20 658 251 909 677 74.5New Brunswick 1,646 27 1,187 432 1,619 1,131 69.9Newfoundland 291 7 230 54 284 201 70.8Northwest Territories 70 0 54 16 70 44 62.9Nova Scotia 2,582 45 1,790 747 2,537 1,957 77.1Ontario 4,267 52 3,438 777 4,215 3,472 82.4Prince Edward Island 626 7 417 202 619 482 77.9Quebec 20 0 20 0 20 16 80.0Saskatchewan 2,706 85 1,977 644 2,621 1,839 70.2Yukon Territory 66 0 59 7 66 42 63.6Canada 18,599 374 14,355 3,870 18,225 13,902 76.3Federal Corr. Inst. 10,481 137 9,081 1,263 10,344 7,435 71.9International 611 50 523 38 561 399 71.1Michigan Prisons 4,591 630 3,323 638 3,961 2,796 70.6Overseas: Non-Mil. 357 19 320 18 338 266 78.7Overseas: Military 143 0 125 18 143 131 91.6CONUS Military 1,136 21 1,079 36 1,115 914 82.0VA Hospitals 14 3 11 0 11 8 72.7Federal Contracts 17,333 860 14,462 2,011 16,473 11,949 72.5Program Total 1,069,899 90,070 760,402 219,427 979,829 683,866 69.8
◗ About one of every10 adults (100,529)who took one or moreof the GED Tests in2001 tested in thestate of Texas.
◗ One of every fiveadults (20.5 percent)tested in 2001 hadcompleted the GEDTests battery in prioryears but had notearned a credential.These adults retestedin 2001 in an attemptto meet the scorerequirements of theirjurisdictions beforethe December 31,2001, deadline forcompleting the 1988Series GED Tests. Thisnumber represents a51 percent increaseover the number whoretested in 2000, theyear before the rushto complete the 1988Series Tests.
◗ Seven of every 10adult candidatesworldwide (71.1 per-cent) tested for thefirst time in 2001 andcompleted the GEDTests battery.

14
20
01
GE
D S
tati
sti
ca
l R
ep
ort
◗ The average age ofthe adults taking theGED Tests worldwidewas 25.2 years—anincrease of six monthsover the average ageof 24.7 in 2000. Thepercentage testeddecreased slightly forall age groups 19 andyounger andincreased slightly forall age groups from20–24 through 60years of age.
Alabama 19,681 0.9 8.5 16.5 13.6 27.4 11.6 7.4 5.0 5.7 2.4 0.9 24.8Alaska 4,051 9.2 14.2 15.2 10.3 23.8 7.9 6.1 5.2 5.8 1.9 0.4 23.6Arizona 18,648 5.6 11.7 11.7 8.8 26.6 11.5 8.4 6.2 6.2 2.0 1.3 25.1Arkansas 11,205 9.3 16.8 12.7 7.5 21.5 10.5 7.1 5.4 6.3 2.3 0.7 24.3California 68,812 0.0 7.7 14.3 9.0 23.3 13.9 12.0 8.8 8.6 2.0 0.4 26.7Colorado 18,426 2.0 19.4 16.7 11.0 24.4 9.2 6.4 4.7 4.8 1.2 0.3 23.2Connecticut 7,557 0.1 2.1 8.6 12.3 32.5 13.2 10.5 8.8 8.7 2.5 0.6 27.1Delaware 1,153 1.9 8.2 13.6 12.2 31.7 12.9 7.8 5.2 5.0 1.0 0.4 24.3District of Columbia 1,612 3.7 7.3 12.0 10.7 29.7 10.0 7.4 5.2 8.5 3.4 1.9 26.3Florida 62,757 1.9 8.1 16.4 15.0 27.7 9.9 7.3 5.1 6.0 2.0 0.5 24.4Georgia 41,858 1.3 5.6 12.6 13.5 32.3 11.3 7.5 5.5 6.8 2.9 0.7 25.4Hawaii 2,982 4.2 15.8 18.0 10.3 23.1 10.6 7.0 4.5 5.1 1.0 0.3 23.3Idaho 7,766 9.1 16.8 13.8 8.8 21.8 9.4 6.2 5.8 6.2 1.6 0.5 23.8Illinois 46,525 1.2 5.4 11.2 11.4 29.9 13.5 9.1 6.6 8.2 2.8 0.8 26.4Indiana 23,327 0.0 7.8 14.9 13.0 30.1 12.0 7.0 5.0 6.6 2.5 1.0 25.2Iowa 10,061 2.1 15.7 14.1 12.0 28.6 9.2 6.3 4.6 5.3 1.6 0.5 23.7Kansas 7,603 7.9 17.7 16.5 10.1 23.6 8.0 5.1 4.5 5.0 1.3 0.4 22.8Kentucky 27,796 2.5 8.3 10.9 10.8 28.3 11.8 7.8 6.4 8.5 3.6 1.1 26.4Louisiana 13,254 3.5 18.3 13.8 12.0 25.3 11.1 6.2 3.9 4.1 1.2 0.7 23.1Maine 4,567 0.0 15.6 18.9 13.0 25.7 7.5 6.2 4.4 5.5 2.4 0.7 23.9Maryland 16,652 2.3 9.9 13.3 10.5 26.0 10.9 9.4 6.7 7.7 2.7 0.7 25.8Massachusetts 15,631 3.5 10.7 14.1 12.5 26.6 10.0 8.4 6.1 5.9 1.7 0.4 24.5Michigan 43,142 1.4 5.0 13.8 12.5 35.0 12.2 8.3 5.6 4.4 1.5 0.3 24.4Minnesota 16,788 1.7 6.9 12.2 16.5 33.5 11.1 6.8 4.9 4.6 1.3 0.4 24.0Mississippi 16,449 3.6 12.5 16.0 13.2 28.0 9.9 5.5 4.0 5.0 1.7 0.5 23.5Missouri 16,644 6.1 12.7 12.5 9.4 24.9 10.9 7.0 6.4 7.4 2.3 0.6 25.0Montana 4,584 3.9 22.0 16.1 10.3 23.1 8.1 5.3 4.4 5.1 1.2 0.4 22.9Nebraska 5,317 4.3 13.5 17.6 12.3 28.3 9.3 5.5 3.7 4.2 1.1 0.4 22.8Nevada 6,817 3.8 17.5 15.8 9.0 23.0 9.8 7.3 5.7 6.3 1.3 0.4 24.0New Hampshire 3,256 4.5 9.4 18.4 12.3 27.4 9.2 7.2 5.2 5.1 1.2 0.3 23.6New Jersey 15,392 2.9 8.4 11.3 9.6 24.9 13.3 10.9 7.4 8.0 2.4 0.9 26.4New Mexico 9,633 0.7 17.1 18.4 11.2 25.4 9.6 6.2 4.7 4.8 1.5 0.3 23.4New York 72,970 1.6 10.4 12.6 12.2 25.4 10.9 8.8 7.2 8.2 2.3 0.5 25.7North Carolina 31,010 7.7 11.2 12.0 9.4 24.8 10.9 7.6 5.6 7.1 3.1 0.7 25.1North Dakota 2,178 7.4 14.7 14.3 12.5 27.5 8.3 4.6 4.8 4.3 1.3 0.4 22.8Ohio 41,686 2.1 7.0 10.7 11.9 30.3 12.9 8.2 5.8 7.7 2.8 0.8 25.9Oklahoma 14,756 4.8 12.5 13.1 9.4 25.2 11.4 7.4 5.9 6.6 2.1 1.8 25.2Oregon 17,005 4.6 13.4 16.3 12.4 25.8 8.9 6.7 5.1 6.3 0.4 0.1 23.3Pennsylvania 27,994 6.9 15.1 14.7 9.9 21.8 10.1 7.2 5.5 6.1 2.2 0.6 24.2Rhode Island 5,578 0.3 7.6 13.1 11.7 29.3 13.8 10.3 6.9 5.5 1.4 0.2 25.1South Carolina 11,761 1.8 16.9 13.3 11.3 24.5 10.2 6.8 5.2 6.6 2.9 0.5 24.7South Dakota 3,254 4.0 12.6 13.6 11.3 28.4 9.7 5.9 5.0 6.2 2.2 1.2 24.5Tennessee 27,849 0.0 17.4 14.3 9.0 22.4 11.1 8.0 5.8 7.5 3.7 0.7 25.6Texas 100,529 3.2 15.1 12.8 9.2 23.9 11.9 8.1 6.1 7.1 2.2 0.4 25.0Utah 9,065 0.0 11.4 21.7 14.7 29.8 8.5 5.3 3.8 3.6 0.7 0.4 22.7Vermont 2,016 12.0 18.3 18.0 10.0 21.4 6.6 4.4 2.8 3.7 1.7 0.5 22.0Virginia 24,511 5.6 14.1 15.0 9.1 20.4 9.8 7.5 6.1 8.1 3.2 1.1 25.5Washington 25,972 5.7 12.6 12.2 10.9 26.3 11.0 8.1 5.6 5.8 1.3 0.4 24.2West Virginia 7,244 2.0 10.2 14.8 11.3 25.4 11.6 7.9 6.2 7.3 2.3 1.2 25.5Wisconsin 18,794 0.0 7.0 14.0 11.0 31.2 13.4 8.4 5.9 6.4 1.8 0.9 25.4Wyoming 2,122 1.2 16.8 18.9 11.9 25.6 7.7 5.4 4.4 5.6 2.2 0.4 23.6American Samoa 114 0.0 4.4 21.1 14.9 36.0 12.3 8.8 1.8 0.9 0.0 0.0 22.1Fed. Micronesia 42 0.0 2.4 11.9 4.8 59.5 16.7 0.0 2.4 2.4 0.0 0.0 22.8Guam 436 1.8 8.0 11.7 9.9 32.2 20.0 11.0 3.0 1.8 0.5 0.0 23.7N. Mariana Islands 161 2.5 6.9 13.8 14.5 36.5 11.3 7.5 3.8 2.5 0.6 0.0 22.9Palau 92 0.0 5.4 18.5 9.8 28.3 15.2 7.6 7.6 7.6 0.0 0.0 24.9Puerto Rico 16,595 0.0 0.0 15.1 17.0 39.4 11.5 6.7 4.1 3.2 2.4 0.5 24.3Marshall Islands 85 5.1 7.7 12.8 5.1 50.0 5.1 3.8 5.1 3.8 1.3 0.0 22.9Virgin Islands 202 0.0 5.4 9.9 12.9 24.3 10.4 13.9 9.4 9.4 4.5 0.0 27.8US+IAFAS2 1,033,967 2.7 10.7 13.7 11.3 26.9 11.3 8.0 5.9 6.7 2.2 0.6 25.0
1 Age group percentages foreach category are calculated bydividing the total number of persons in that category whofall in that age group by thetotal number of persons in thecategory reporting their age and multiplying the result by 100.This process is used for all similar tables in this report.
2 IAFAS = Insular Areas andFreely Associated States.
TA B L E 3Number of People Testedand Percentages,by Age Group
Number Tested
Age Groups 1
Avg.Age
16 17 18 19 20–24
25–29
30–34
35–39
40–49
50–59 >60Jurisdiction
15
20
01
GE
D S
tati
sti
ca
l R
ep
ort
TA B L E 3Number of People Testedand Percentages,by Age Group
3 N/A = not available at time ofpublication.
SOURCE: GED Testing Service,American Council on Education.
◗ Among the adultstaking one or moreof the GED Testsworldwide, nearly twoof every three (62.6percent) were age 20or older.
◗ More than half of alladults (52.7 percent)taking the GED Testsworldwide in 2001were between theages of 20 and 39.
Age Group
Num
ber
of T
est-
Take
rs
0
50,000
100,000
150,000
200,000
250,000
300,000
400,000
< 19 20–29 30–39 40–49 50–59 > 60
37%39%
14%
7%
2%1%
350,000
450,000
FIGURE 3: Number and Percentage of People Who Took the GED Tests in 2001,by Age Group
Number Tested
Age GroupsAvg.Age
16 17 18 19 20–24
25–29
30–34
35–39
40–49
50–59 >60Jurisdiction
Alberta 2,342 0.0 1.0 4.4 5.8 26.2 17.2 13.6 11.8 16.5 3.2 0.4 30.5British Columbia 3,054 0.0 0.0 0.0 7.0 26.7 16.3 13.7 13.6 18.0 4.3 0.4 31.6Manitoba 929 0.0 0.1 0.5 5.8 27.3 16.3 11.2 13.9 20.1 4.0 0.8 32.0New Brunswick 1,646 0.0 0.0 0.2 9.5 25.0 14.2 10.8 14.0 20.2 5.9 0.3 32.2Newfoundland 291 0.0 0.0 1.4 13.2 30.9 12.8 13.9 10.1 14.2 3.5 0.0 29.3Northwest Territories 70 0.0 1.4 1.4 2.9 32.9 15.7 17.1 11.4 15.7 0.0 1.4 30.0Nova Scotia 2,582 0.0 0.0 0.0 7.6 24.0 13.3 12.3 14.9 22.3 5.3 0.3 32.8Ontario 4,267 0.0 0.0 0.9 9.8 30.3 14.9 11.5 12.3 16.0 4.0 0.4 30.4Prince Edward Island 626 0.0 0.3 5.0 5.3 17.6 12.9 12.1 15.2 23.6 7.7 0.3 33.9Quebec 20 N/A3 N/A N/A N/A N/A N/A N/A N/A N/A N/A N/A N/ASaskatchewan 2,706 0.0 0.0 1.3 5.4 25.6 15.5 13.4 15.1 17.4 4.5 1.7 32.2Yukon Territory 66 0.0 0.0 6.1 10.6 25.8 6.1 13.6 13.6 22.7 1.5 0.0 30.7Canada 18,599 0.0 0.1 1.2 7.5 26.6 15.2 12.5 13.5 18.3 4.5 0.6 31.5Federal Corr. Inst. 10,481 0.0 0.0 0.1 0.8 18.6 25.2 21.0 13.7 15.1 4.1 1.4 32.7International 611 0.7 10.7 20.7 16.6 33.0 9.3 3.6 3.4 2.1 0.0 0.0 21.6Michigan Prisons 4,591 0.0 0.2 1.3 2.9 26.0 18.6 15.1 13.7 17.1 4.7 0.4 32.0Overseas: Non-Mil. 357 2.2 14.0 15.1 13.7 26.3 12.9 8.4 5.0 2.2 0.0 0.0 22.7Overseas: Military 143 0.0 0.0 3.5 17.5 58.7 11.9 7.7 0.7 0.0 0.0 0.0 22.4CONUS Military 1,136 0.0 1.5 27.5 21.9 37.8 6.3 2.6 0.9 1.3 0.1 0.2 21.0VA Hospitals 14 0.0 0.0 0.0 0.0 0.0 0.0 0.0 14.3 42.9 35.7 7.1 48.7Federal Contracts 17,333 0.1 0.8 3.2 3.7 22.8 21.2 17.3 12.2 13.9 3.7 1.0 31.1Program Total 1,069,899 2.6 10.4 13.3 11.1 26.8 11.5 8.2 6.2 7.0 2.3 0.6 25.2
16
20
01
GE
D S
tati
sti
ca
l R
ep
ort
1 In many jurisdictions, theissuance of credentials is a two-stage process. First, candidatesmust attain scores on the GEDTests that meet their jurisdic-tion’s requirements for a highschool credential (see Tables 12and 13). Second, they must sub-mit an application to their juris-diction—in some cases with anadditional fee—in order toreceive their credentials.Issuance of credentials may bedelayed or denied if the jurisdic-tion’s administrative or otherrequirements are not met, or ifthe jurisdiction experiencessevere backlogs in processingapplications. Thus, persons whomeet GED score requirements ina given year may not receivetheir high school credentials inthe same year. In addition, somemay choose not to apply forthem. Therefore, in a given cal-endar year, the number of cre-dentials issued may not alwaysequal the number of personsmeeting the jurisdiction’s scorerequirements.
2 Age group percentages foreach category are calculated bydividing the total number of per-sons in that category who fall inthat age group by the total num-ber of persons in the categoryreporting their age and multiply-ing the result by 100. Thisprocess is used for all similartables in this report.
3 Candidates for GED credentialsin Idaho and Illinois must alsopass a state-issued citizenshipexam.
4 In Pennsylvania, credentialsreported for persons age 16 and17 are issued automaticallywhen these individuals reachage 18.
5 IAFAS = Insular Areas andFreely Associated States.
TA B L E 4Number of Credentials1
Issued, and Percentages2
by Age Group
CredentialsIssued
Age GroupsAvg.Age
16 17 18 19 20–24
25–29
30–34
35–39
40–49
50–59 >60Jurisdiction
Alabama 10,950 1.3 9.7 17.0 12.9 26.6 11.6 7.5 4.8 5.6 2.2 0.7 24.5Alaska 2,782 9.3 16.4 15.9 10.6 23.4 7.4 5.7 4.3 5.1 1.7 0.2 22.9Arizona 12,986 6.3 11.9 12.3 8.9 26.8 11.5 8.0 5.9 5.7 1.7 1.1 24.7Arkansas 9,298 9.8 17.3 12.7 7.5 21.2 10.2 7.1 5.0 6.1 2.4 0.7 24.1California 48,374 0.0 8.3 14.5 8.7 23.2 14.4 12.1 8.6 8.0 1.8 0.4 26.5Colorado 11,759 1.8 19.4 17.5 11.3 24.3 9.1 6.3 4.4 4.6 1.0 0.2 23.0Connecticut 4,651 0.0 2.8 10.9 14.9 33.1 12.4 9.1 7.2 7.3 1.9 0.4 25.8Delaware 994 1.9 8.3 13.4 12.3 31.8 12.8 7.9 5.1 5.0 1.0 0.4 24.2District of Columbia 692 4.9 7.8 12.1 10.8 33.2 10.1 7.2 4.3 6.5 1.9 1.0 24.7Florida 36,198 2.1 9.7 18.2 15.4 26.5 9.3 7.1 4.6 5.1 1.6 0.4 23.7Georgia 24,646 1.9 6.7 14.2 14.3 31.3 10.8 7.1 4.8 5.9 2.4 0.5 24.7Hawaii 1,813 5.4 18.9 18.9 9.5 20.5 9.9 6.6 4.4 4.7 0.9 0.3 22.9Idaho3 603 8.8 16.6 18.2 10.1 16.4 7.6 4.8 5.5 8.0 3.2 0.8 24.4Illinois3 26,311 1.2 5.6 12.1 12.0 30.8 13.7 9.2 6.1 6.6 2.2 0.6 25.6Indiana 17,662 0.0 8.9 15.8 13.0 29.9 11.7 6.9 4.7 6.0 2.1 0.9 24.7Iowa 8,259 0.9 5.0 20.0 11.5 23.9 16.5 8.7 5.4 5.7 1.9 0.6 25.0Kansas 6,307 6.6 18.0 16.4 10.6 23.7 7.1 5.4 4.6 5.7 1.5 0.4 23.1Kentucky 20,689 2.4 7.8 10.6 10.4 27.4 12.3 8.4 6.8 9.1 3.7 1.1 26.8Louisiana 9,697 4.2 20.4 14.8 10.9 23.7 11.1 6.1 3.3 3.8 1.0 0.6 22.7Maine 6,263 0.0 14.6 16.6 15.2 19.8 10.7 8.6 5.4 6.2 2.2 0.6 24.7Maryland 7,998 2.7 12.1 15.6 11.7 27.1 10.6 8.2 5.2 5.1 1.3 0.2 23.9Massachusetts 9,753 4.9 13.5 16.6 12.8 25.3 8.3 7.0 4.8 4.8 1.6 0.4 23.4Michigan 26,319 0.0 0.2 15.7 14.1 35.4 13.1 8.0 5.3 6.2 1.7 0.3 25.0Minnesota 11,268 1.5 6.9 12.9 16.6 34.7 10.3 6.3 4.3 4.6 1.3 0.5 23.8Mississippi 7,254 4.9 15.2 17.0 12.9 25.8 9.4 5.0 3.4 4.5 1.4 0.4 22.8Missouri 12,431 6.3 13.2 13.1 9.5 25.2 10.7 6.8 5.9 6.7 2.0 0.5 24.5Montana 3,478 4.6 24.1 17.2 10.4 22.3 7.5 4.1 3.7 4.7 1.0 0.3 22.3Nebraska 3,264 0.0 0.0 28.4 14.5 31.0 9.8 5.8 3.8 4.7 1.6 0.4 23.6Nevada 5,036 4.2 18.3 15.6 8.3 22.7 9.6 7.3 5.6 6.7 1.4 0.3 24.0New Hampshire 2,741 4.8 9.6 18.9 12.4 28.1 8.7 6.7 4.9 4.7 1.2 0.2 23.3New Jersey 8,563 4.0 10.5 13.3 10.3 24.7 12.9 9.8 6.1 6.3 1.7 0.5 25.0New Mexico 7,610 0.9 13.9 16.5 10.8 26.4 11.0 7.4 5.7 5.2 1.7 0.3 24.1New York 39,692 2.2 14.0 15.6 13.1 24.2 10.1 7.6 5.5 5.9 1.5 0.3 24.0North Carolina 22,706 8.2 11.7 12.2 9.4 24.8 11.2 7.4 5.3 6.5 2.8 0.6 24.8North Dakota 1,460 5.2 14.6 17.5 12.9 29.2 7.9 3.5 4.1 3.2 1.3 0.5 22.4Ohio 28,948 2.3 7.3 11.5 12.7 30.9 12.7 7.8 5.3 6.7 2.3 0.5 25.2Oklahoma 10,120 5.0 12.4 13.2 9.7 25.4 11.7 7.2 5.7 6.5 1.8 1.3 24.9Oregon 13,087 4.9 14.3 16.7 12.4 25.6 8.4 6.3 5.0 6.0 0.4 0.1 23.1Pennsylvania4 20,579 7.7 16.4 15.8 10.1 21.3 9.5 6.6 4.8 5.4 1.9 0.5 23.6Rhode Island 2,369 0.0 0.0 17.7 11.9 29.9 13.6 9.7 7.3 7.8 1.9 0.2 26.0South Carolina 8,042 2.2 19.7 2.5 12.0 28.8 11.7 7.4 6.1 6.6 2.6 0.3 25.0South Dakota 1,961 5.0 14.6 14.8 11.9 26.6 8.9 4.3 4.2 6.5 2.4 0.9 23.9Tennessee 18,626 0.0 19.1 14.7 9.2 22.2 11.3 7.9 5.1 6.8 3.2 0.6 25.0Texas 53,582 3.0 16.3 13.8 9.3 24.0 12.0 7.8 5.4 6.3 1.9 0.4 24.4Utah 7,119 0.0 11.4 22.8 14.7 31.7 8.0 4.5 3.2 2.9 0.6 0.2 22.1Vermont 1,415 8.1 17.6 18.1 12.1 22.0 7.3 4.4 2.7 4.5 2.6 0.7 22.8Virginia 15,925 6.5 15.7 16.0 9.1 21.1 10.0 7.0 5.1 6.4 2.4 0.7 24.3Washington 18,117 6.7 13.9 13.2 10.8 26.2 10.4 7.2 5.0 5.2 1.2 0.3 23.6West Virginia 4,848 2.2 11.4 15.9 12.2 25.0 11.6 7.3 5.2 6.3 1.8 1.1 24.7Wisconsin 11,167 0.0 6.8 15.9 11.5 31.9 13.1 7.8 5.0 5.9 1.7 0.4 24.8Wyoming 1,610 0.4 8.6 19.0 16.8 28.2 9.0 5.0 3.9 5.8 2.5 0.8 24.1American Samoa 57 0.0 5.3 12.3 14.0 42.1 10.5 12.3 3.5 0.0 0.0 0.0 22.8Fed. Micronesia 11 0.0 0.0 9.1 9.1 54.5 18.2 9.1 0.0 0.0 0.0 0.0 22.6Guam 285 2.8 9.1 13.0 9.1 32.3 19.6 9.8 2.8 1.4 0.0 0.0 23.2N. Mariana Islands 58 5.2 10.3 13.8 19.0 39.7 0.0 1.7 6.9 3.4 0.0 0.0 21.8Palau 56 0.0 5.4 19.6 12.5 23.2 14.3 7.1 7.1 10.7 0.0 0.0 25.4Puerto Rico 6,821 0.0 0.0 26.7 17.9 30.5 7.4 5.2 5.3 3.4 2.7 1.0 23.8Marshall Islands 58 3.6 10.7 16.1 19.6 35.7 0.0 7.1 1.8 3.6 1.8 0.0 22.0Virgin Islands 146 0.0 6.8 12.3 15.8 24.0 8.9 13.7 4.1 8.9 5.5 0.0 27.0US+IAFAS5 655,514 2.9 11.4 14.8 11.6 26.4 11.2 7.7 5.4 6.1 1.9 0.5 24.5

17
20
01
GE
D S
tati
sti
ca
l R
ep
ort
TA B L E 4Number of Credentials1
Issued, and Percentages2
by Age Group
6 N/A = not available at time ofpublication.
7 Candidates tested at FederalContracts sites receive theirGED credentials from their homejurisdictions.
SOURCE: GED Testing Service,American Council on Education.
◗ The average age ofthe adults awarded acredential worldwidewas 24.6 years—anincrease of six monthsover the average ageof 24.1 in 2000.
◗ Approximately halfof the adults (49.2percent) earning GEDcredentials in 2001were between theages of 19 and 29.
◗ One of everythree adults world-wide (32.9 percent)earning GED creden-tials in 2001 wasbetween the ages of25 and 59.
◗ Only 14.1 percentof adult candidatesworldwide earnedcredentials before theage of 18, the agewhen their traditionalhigh school class-mates earn diplomas.Only 2.9 percent ofthe credentials issuedwent to young adultsaged 16.
0
5
10
15
20
25
30
35
40
45
50CanadaUS + IAFAS
Age Group
Cred
enti
als
Issu
ed (
Perc
enta
ge)
< 19 30–39 40–4920–29 50–59 > 60
41%
8%
38%
41%
13%
26%
6%
19%
2%
5%
0.5% 0.5%
FIGURE 4: Percentage of GED Credentials Issued in 2001,in the United States, Insular Areas and Freely Associated States,and Canada, by Age Group
CredentialsIssued
Age GroupsAvg.Age
16 17 18 19 20–24
25–29
30–34
35–39
40–49
50–59 >60Jurisdiction
Alberta 1,769 0.1 1.0 4.4 6.0 26.7 17.4 12.9 10.8 17.3 3.0 0.5 30.4British Columbia 2,272 0.0 0.0 0.0 6.6 26.2 17.2 13.8 13.8 17.7 4.3 0.4 31.7Manitoba 677 0.0 0.1 0.7 6.5 28.8 15.4 9.9 14.1 19.5 4.0 0.9 31.7New Brunswick 1,131 0.0 0.0 0.1 9.7 25.3 15.7 11.3 13.0 19.1 5.6 0.2 31.8Newfoundland 201 0.0 0.0 1.0 12.0 28.0 15.5 15.0 9.5 14.0 5.0 0.0 30.0Northwest Territories 44 0.0 2.3 2.3 4.5 40.9 13.6 9.1 9.1 15.9 0.0 2.3 29.0Nova Scotia 1,957 0.0 0.0 0.0 7.7 23.6 13.8 12.3 14.9 22.5 4.9 0.3 32.7Ontario 3,472 N/A6 N/A N/A N/A N/A N/A N/A N/A N/A N/A N/A N/APrince Edward Island 482 0.0 0.2 5.0 5.0 17.0 14.1 12.9 16.0 21.8 7.9 0.2 33.8Quebec N/A N/A N/A N/A N/A N/A N/A N/A N/A N/A N/A N/A N/ASaskatchewan 1,839 0.0 0.0 1.4 5.7 25.0 15.4 12.4 15.3 18.6 5.1 1.1 32.4Yukon Territory 45 0.0 0.0 4.4 8.9 24.4 11.1 13.3 13.3 22.2 2.2 0.0 30.9Canada 13,889 0.0 0.2 1.3 6.9 25.3 15.8 12.6 13.7 19.1 4.6 0.5 31.9Program Total7 669,403 2.9 11.2 14.6 11.5 26.4 11.3 7.8 5.5 6.3 2.0 0.5 24.6

18
20
01
GE
D S
tati
sti
ca
l R
ep
ort
1 IAFAS = Insular Areas andFreely Associated States.
TA B L E 5Number of People Tested,by Edition
Number Tested
Language Other Edition
Large PrintFrenchEnglish Spanish BrailleAudio Cass.Jurisdiction
Alabama 19,681 19,578 27 0 30 6 40Alaska 4,051 3,957 86 1 2 0 5Arizona 18,648 17,141 1,215 2 13 2 275Arkansas 11,205 11,075 113 2 9 2 4California 68,812 62,288 6,498 4 6 0 16Colorado 18,426 17,923 470 0 30 1 2Connecticut 7,557 7,010 524 0 10 0 13Delaware 1,153 1,123 28 0 0 0 2District of Columbia 1,612 1,368 72 14 0 0 158Florida 62,757 61,595 1,038 0 27 28 69Georgia 41,858 41,638 131 11 23 3 52Hawaii 2,982 2,981 1 0 0 0 0Idaho 7,766 7,637 121 1 5 0 2Illinois 46,525 43,059 3,362 1 44 1 58Indiana 23,327 23,095 128 5 55 0 44Iowa 10,061 9,959 87 0 7 0 8Kansas 7,603 7,342 246 0 3 1 11Kentucky 27,796 27,524 127 0 21 0 124Louisiana 13,254 13,191 49 4 5 0 5Maine 4,567 4,544 11 7 4 0 1Maryland 16,652 16,524 102 0 8 0 18Massachusetts 15,631 14,753 850 0 4 4 20Michigan 43,142 42,623 428 7 19 5 60Minnesota 16,788 16,595 171 0 13 1 8Mississippi 16,449 16,370 28 0 13 5 33Missouri 16,644 16,540 25 3 27 2 47Montana 4,584 4,545 3 0 12 0 24Nebraska 5,317 5,298 12 0 5 0 2Nevada 6,817 6,651 159 0 5 0 2New Hampshire 3,256 3,222 26 3 1 0 4New Jersey 15,392 14,258 1,121 8 0 0 5New Mexico 9,633 9,072 544 0 12 0 5New York 72,970 66,190 5,065 1,245 389 10 71North Carolina 31,010 30,588 345 1 54 2 20North Dakota 2,178 2,151 5 0 21 0 1Ohio 41,686 41,426 57 13 44 5 141Oklahoma 14,756 14,528 206 0 6 1 15Oregon 17,005 16,260 598 3 122 1 21Pennsylvania 27,994 27,185 597 42 32 0 138Rhode Island 5,578 5,113 465 0 0 0 0South Carolina 11,761 11,589 50 0 13 1 108South Dakota 3,254 3,234 5 0 14 0 1Tennessee 27,849 27,584 160 5 10 0 90Texas 100,529 94,552 5,750 3 70 0 154Utah 9,065 8,964 94 1 3 2 1Vermont 2,016 2,009 1 0 3 0 3Virginia 24,511 24,040 186 0 30 0 255Washington 25,972 25,102 798 1 25 2 44West Virginia 7,244 7,179 6 0 6 0 53Wisconsin 18,794 18,355 374 0 46 0 19Wyoming 2,122 2,075 35 0 11 1 0American Samoa 114 114 0 0 0 0 0Fed. Micronesia 42 42 0 0 0 0 0Guam 436 436 0 0 0 0 0N. Mariana Islands 161 161 0 0 0 0 0Palau 92 92 0 0 0 0 0Puerto Rico 16,595 674 15,921 0 0 0 0Marshall Islands 85 85 0 0 0 0 0Virgin Islands 202 186 10 6 0 0 0US+IAFAS1 1,033,967 980,393 48,531 1,393 1,312 86 2,252
◗ The number ofadults taking specialeditions of the GEDTests increased by98.7 percent, from2,055 in 2000 to4,084 in 2001.
◗ The number ofadults worldwidetaking all specialeditions of the GEDTests increased signif-icantly over 2000totals: audiocassette(187.9 percent),Braille (102.3 per-cent), and large print(71.4 percent).
◗ Nearly 95 percentof adult candidatesworldwide took theEnglish-languageprint edition of theGED Tests.

19
20
01
GE
D S
tati
sti
ca
l R
ep
ort
0
500
1,000
1,500
2,000
2,500
3,000
200019991998199719961995199419931992199119901989
Year
Num
ber o
f Tes
t-Ta
kers
2,367
1,169
1,404
1,230
1,6851,785
1,941
2,305 2,305
2,503
2,198
2,055
2001
3,500
4,084
4,500
4,000
TA B L E 5Number of People Tested,by Edition
SOURCE: GED Testing Service,American Council on Education.
Number Tested
Language Other Edition
Large PrintFrenchEnglish Spanish BrailleAudio Cass.Jurisdiction
Alberta 2,342 2,335 0 3 3 0 1British Columbia 3,054 3,042 0 7 1 0 4Manitoba 929 928 0 1 0 0 0New Brunswick 1,646 1,321 0 271 3 0 51Newfoundland 291 290 0 1 0 0 0Northwest Territories 70 70 0 0 0 0 0Nova Scotia 2,582 2,571 0 5 2 0 4Ontario 4,267 4,191 0 23 0 0 53Prince Edward Island 626 625 0 1 0 0 0Quebec 20 12 0 8 0 0 0Saskatchewan 2,706 2,670 0 0 27 0 9Yukon Territory 66 66 0 0 0 0 0Canada 18,599 18,121 0 320 36 0 122Federal Corr. Inst. 10,481 8,995 1,464 3 0 0 19International 611 611 0 0 0 0 0Michigan Prisons 4,591 4,301 35 0 8 0 247Overseas: Non-Mil. 357 350 5 0 0 1 1Overseas: Military 143 143 0 0 0 0 0CONUS Military 1,136 1,135 1 0 0 0 0VA Hospitals 14 14 0 0 0 0 0Federal Contracts 17,333 15,549 1,505 3 8 1 267Program Total 1,069,899 1,014,063 50,036 1,716 1,356 87 2,641
FIGURE 5: Number of People Who Took Other Editions (Audiocassette, Braille, and Large Print) of the GED Tests, 1989–2001
◗ More than 50,000adults took the Span-ish-language printedition of the GEDTests in 2001—anincrease of nearly 10percent from 2000 to2001, with about onein three Spanish-language candidates(31.8 percent) havingtested in Puerto Rico.California saw a 56.1percent increase inthe number of itsadults taking theSpanish-languageedition (4,162 in 2000and 6,498 in 2001).
◗ Since 1989, thenumber of adultstaking othereditions of theGED Tests hasmore than tripled,rising from 1,169in 1989 to 4,084in 2001 (a 249.4percent increase).

20
20
01
GE
D S
tati
sti
ca
l R
ep
ort
Alabama 27 17 3 5 37Alaska 7 6 2 3 12Arizona 53 30 9 30 81Arkansas 50 19 16 47 65California 52 5 8 16 278Colorado 36 4 3 78 69Connecticut 68 1 7 136 93Delaware 1 1 0 1 1District of Columbia 11 0 3 7 6Florida 293 7 38 453 205Georgia 62 0 20 56 88Hawaii 3 3 3 1 3Idaho 7 5 0 4 11Illinois 242 31 62 961 179Indiana 140 73 47 81 169Iowa 62 2 4 13 12Kansas 24 5 4 8 23Kentucky 82 18 20 66 69Louisiana 42 8 11 23 41Maine 45 4 6 15 28Maryland 94 0 16 115 115Massachusetts 35 4 10 25 61Michigan 194 16 27 29 37Minnesota 61 9 11 41 73Mississippi 49 2 0 0 77Missouri 97 63 19 12 137Montana 12 0 4 12 12Nebraska 21 7 8 7 23Nevada 8 0 1 18 9New Hampshire 31 0 1 9 33New Jersey 9 0 0 4 6New Mexico 54 22 15 29 47New York 1,476 86 789 2,642 1,554North Carolina 230 0 49 174 78North Dakota 36 15 5 18 30Ohio 105 36 26 211 285Oklahoma 30 11 8 34 54Oregon 404 99 61 200 267Pennsylvania 70 31 12 42 52Rhode Island 69 0 0 1 10South Carolina 93 26 15 40 106South Dakota 8 0 0 0 17Tennessee 43 22 8 24 36Texas 311 205 34 88 271Utah 15 0 5 12 28Vermont 18 6 7 6 14Virginia 200 147 23 67 277Washington 183 27 56 66 310West Virginia 29 12 10 17 27Wisconsin 185 2 10 27 195Wyoming 25 10 5 16 4American Samoa 0 0 0 0 0Fed. Micronesia 42 0 0 0 0Guam 0 0 0 0 0N. Mariana Islands 0 0 0 0 0Palau 10 0 0 0 0Puerto Rico 29 0 0 0 0Marshall Islands 0 0 0 0 0Virgin Islands 0 0 0 0 0US+IAFAS3 5,583 1,097 1,501 5,990 5,715
1 Accommodations to standardtesting conditions includeextended testing time, use ofspecial reading or opticaldevices, alternative answer-recording methods, and miscel-laneous other adaptations tostandard testing conditions. Acandidate may be granted acombination of these adapta-tions as described in the GEDExaminer’s Manual and the GEDTesting Service brochure,“Accommodating Accommoda-tions.”
2 These numbers representrequests to jurisdictions foradaptations to standard testingconditions based on specificlearning disabilities (SLD).
3 IAFAS = Insular Areas andFreely Associated States.
NOTE: “Special Testing Accom-modations” refers to the numberof adaptations to standard test-ing conditions. “SLD Requests”refers to the number of personsrequesting accommodationsbased on specific learning dis-abilities. Some candidates mayrequire multiple accommoda-tions to be tested fairly. An addi-tional method of accommoda-tion is the use of other editionsof the GED Tests—Audiocas-sette, Braille, and Large Print(please refer to Table 5).
TA B L E 6Volume of Special TestingAccommodations1
Special Testing Accommodations 1
Requests for SLDAccommodations 2
Answer MarkingTime Reading Device OtherJurisdiction
◗ The number ofadults receiving otheraccommodations in2001 (i.e., a privateroom or additionalbreaks) increased bymore than 135 per-cent from 2000.
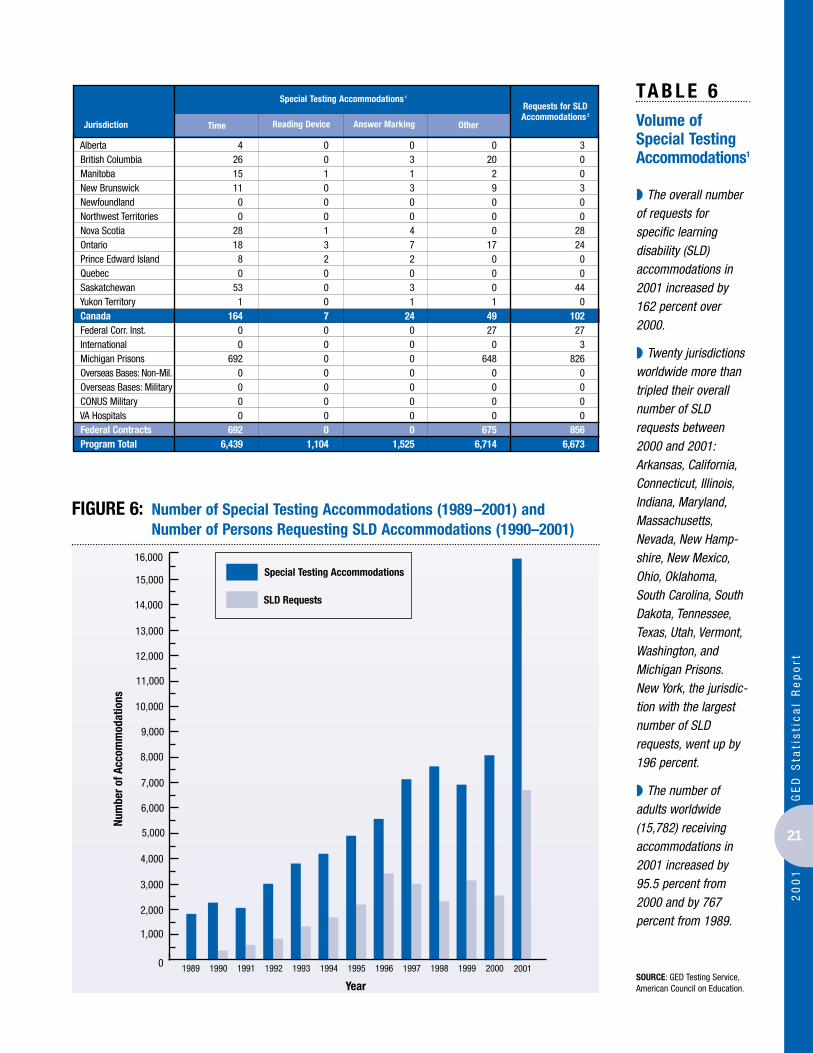
21
20
01
GE
D S
tati
sti
ca
l R
ep
ort
0
2,000
4,000
6,000
8,000
10,000
SLD Requests
Special Testing Accommodations
200019991998199719961995199419931992199119901989
Year
Num
ber o
f Acc
omm
odat
ions
9,000
7,000
5,000
3,000
1,000
2001
12,000
14,000
16,000
15,000
13,000
11,000
TA B L E 6Volume of Special TestingAccommodations1
SOURCE: GED Testing Service,American Council on Education.
FIGURE 6: Number of Special Testing Accommodations (1989–2001) and Number of Persons Requesting SLD Accommodations (1990–2001)
Special Testing Accommodations 1
Requests for SLDAccommodations 2
Answer MarkingTime Reading Device OtherJurisdiction
Alberta 4 0 0 0 3British Columbia 26 0 3 20 0Manitoba 15 1 1 2 0New Brunswick 11 0 3 9 3Newfoundland 0 0 0 0 0Northwest Territories 0 0 0 0 0Nova Scotia 28 1 4 0 28Ontario 18 3 7 17 24Prince Edward Island 8 2 2 0 0Quebec 0 0 0 0 0Saskatchewan 53 0 3 0 44Yukon Territory 1 0 1 1 0Canada 164 7 24 49 102Federal Corr. Inst. 0 0 0 27 27International 0 0 0 0 3Michigan Prisons 692 0 0 648 826Overseas Bases: Non-Mil. 0 0 0 0 0Overseas Bases: Military 0 0 0 0 0CONUS Military 0 0 0 0 0VA Hospitals 0 0 0 0 0Federal Contracts 692 0 0 675 856Program Total 6,439 1,104 1,525 6,714 6,673
◗ The overall numberof requests for specific learning disability (SLD)accommodations in2001 increased by162 percent over2000.
◗ Twenty jurisdictionsworldwide more thantripled their overallnumber of SLDrequests between2000 and 2001:Arkansas, California,Connecticut, Illinois,Indiana, Maryland,Massachusetts,Nevada, New Hamp-shire, New Mexico,Ohio, Oklahoma,South Carolina, SouthDakota, Tennessee,Texas, Utah, Vermont,Washington, andMichigan Prisons.New York, the jurisdic-tion with the largestnumber of SLDrequests, went up by196 percent.
◗ The number ofadults worldwide(15,782) receivingaccommodations in2001 increased by95.5 percent from2000 and by 767 percent from 1989.

22
20
01
GE
D S
tati
sti
ca
l R
ep
ort
1 Grade completed percentagesfor each category are calculatedby dividing the total number ofpersons in that category whocompleted the specified gradeby the total number of personsin that category reporting theirlast grade completed and multi-plying the result by 100. Thisprocess is used for all similartables in this report.
2 IAFAS = Insular Areas andFreely Associated States.
NOTE: These numbers includeboth those candidates who didand did not meet the minimumscore requirement in each juris-diction.
TA B L E 7Highest GradeCompleted
Percentage of People Tested Who Completed Grade 1
AverageGrade
9th7th 8th 12th11thJurisdiction 10th6th
Alabama 0.1 0.5 2.4 10.1 21.6 32.3 55.6 10.8Alaska 0.9 1.8 10.8 21.0 28.7 33.2 3.7 9.9Arizona 1.5 1.2 9.7 18.6 29.4 32.7 6.8 10.0Arkansas 0.9 2.1 8.6 18.8 30.3 34.2 5.1 10.0California 14.3 0.9 3.7 10.1 21.7 42.6 6.8 9.8Colorado 1.0 1.2 7.5 18.3 34.6 34.0 3.4 10.0Connecticut 1.2 1.2 9.3 21.9 30.1 31.3 5.2 9.9Delaware 0.8 1.6 14.6 24.3 30.3 26.8 1.6 9.7District of Columbia 0.9 1.8 7.8 19.7 28.1 34.8 7.0 10.0Florida 0.7 1.3 8.5 20.0 29.6 33.5 6.3 10.0Georgia 0.4 1.0 7.1 17.0 44.2 25.7 4.5 10.0Hawaii 0.6 0.7 6.2 18.2 30.8 37.3 6.3 10.1Idaho 1.1 1.6 8.1 20.7 31.2 32.0 5.3 10.0Illinois 1.5 1.3 7.7 17.6 31.0 35.6 5.3 10.0Indiana 0.5 1.1 8.5 20.2 33.1 32.9 3.7 10.0Iowa 0.3 1.6 9.1 19.6 33.9 32.7 2.7 9.9Kansas 0.7 1.0 7.5 20.3 32.8 33.9 3.8 10.0Kentucky 0.4 1.7 11.6 22.1 31.8 30.6 1.8 9.8Louisiana 73.7 0.2 13.3 27.4 1.1 22.7 2.8 8.4Maine 0.8 1.3 10.8 23.4 32.1 28.8 2.9 9.8Maryland 1.3 2.0 11.0 24.5 30.4 27.8 3.0 9.8Massachusetts 1.4 1.6 10.1 21.5 31.3 31.1 2.9 9.8Michigan 0.8 1.5 7.3 18.1 34.8 35.8 1.8 10.0Minnesota 0.5 0.6 4.4 14.1 31.9 43.4 5.2 10.3Mississippi 1.2 3.6 12.9 23.4 27.7 26.2 4.8 9.7Missouri 0.6 1.3 9.6 22.6 33.3 29.2 3.4 9.9Montana 0.8 1.2 10.4 21.1 31.7 31.5 3.4 9.9Nebraska 0.7 1.0 7.8 20.5 33.0 32.6 4.4 10.0Nevada 0.6 0.9 5.0 13.2 30.2 42.7 7.4 10.3New Hampshire 0.3 1.1 9.2 21.5 33.4 31.5 3.1 9.9New Jersey 1.0 1.4 7.5 18.6 30.7 32.4 8.3 10.1New Mexico 2.0 1.2 7.5 20.6 31.1 32.9 4.7 10.0New York 1.4 1.0 6.9 18.1 29.7 32.9 10.0 10.1North Carolina 1.6 1.6 11.1 27.0 32.7 24.0 2.1 9.7North Dakota 0.5 1.0 9.1 23.5 31.5 33.1 1.2 9.9Ohio 4.9 1.8 17.5 37.4 11.3 19.5 7.6 9.4Oklahoma 1.2 1.7 10.1 23.0 30.2 30.5 3.2 9.8Oregon 1.2 1.2 8.0 19.8 31.9 32.4 5.4 10.0Pennsylvania 3.0 1.1 7.6 20.1 32.1 32.6 3.4 9.9Rhode Island 1.3 1.5 5.9 20.2 29.4 27.5 14.2 10.1South Carolina 0.6 1.5 10.6 28.1 31.9 24.4 2.8 9.7South Dakota 0.5 1.3 12.7 23.8 29.8 29.8 2.1 9.8Tennessee 0.6 1.5 8.3 19.7 31.9 34.4 3.6 10.0Texas 15.9 1.8 8.6 19.8 24.3 24.8 5.0 9.3Utah 0.4 0.6 3.5 11.4 25.6 45.4 13.2 10.5Vermont 0.7 1.3 10.0 21.6 34.7 29.7 1.9 9.9Virginia 0.9 2.1 10.6 22.5 30.8 31.3 1.8 9.8Washington 1.6 1.4 8.2 19.5 30.2 34.1 5.1 10.0West Virginia 0.8 2.2 11.5 23.4 31.0 29.1 2.1 9.8Wisconsin 0.6 0.7 6.2 15.3 31.7 42.5 3.1 10.2Wyoming 0.8 1.3 6.0 15.7 28.1 39.0 9.2 10.2American Samoa 0.0 0.0 0.0 3.5 7.0 89.5 0.0 10.9Fed. Micronesia 0.0 0.0 2.4 29.3 36.6 31.7 0.0 10.0Guam 2.3 0.2 2.3 10.3 28.0 51.7 5.1 10.4N. Mariana Islands 3.3 1.3 5.9 19.0 34.0 34.0 2.6 9.9Palau 0.0 2.2 12.0 16.3 32.6 37.0 0.0 9.9Puerto Rico 1.9 3.6 21.1 26.7 22.2 24.1 0.4 9.4Marshall Islands 0.0 0.0 5.9 10.6 27.1 37.6 18.8 10.5Virgin Islands 0.0 2.0 3.5 16.8 21.8 20.8 35.1 10.6US+IAFAS2 4.0 1.4 8.5 19.6 29.2 31.8 5.4 9.9
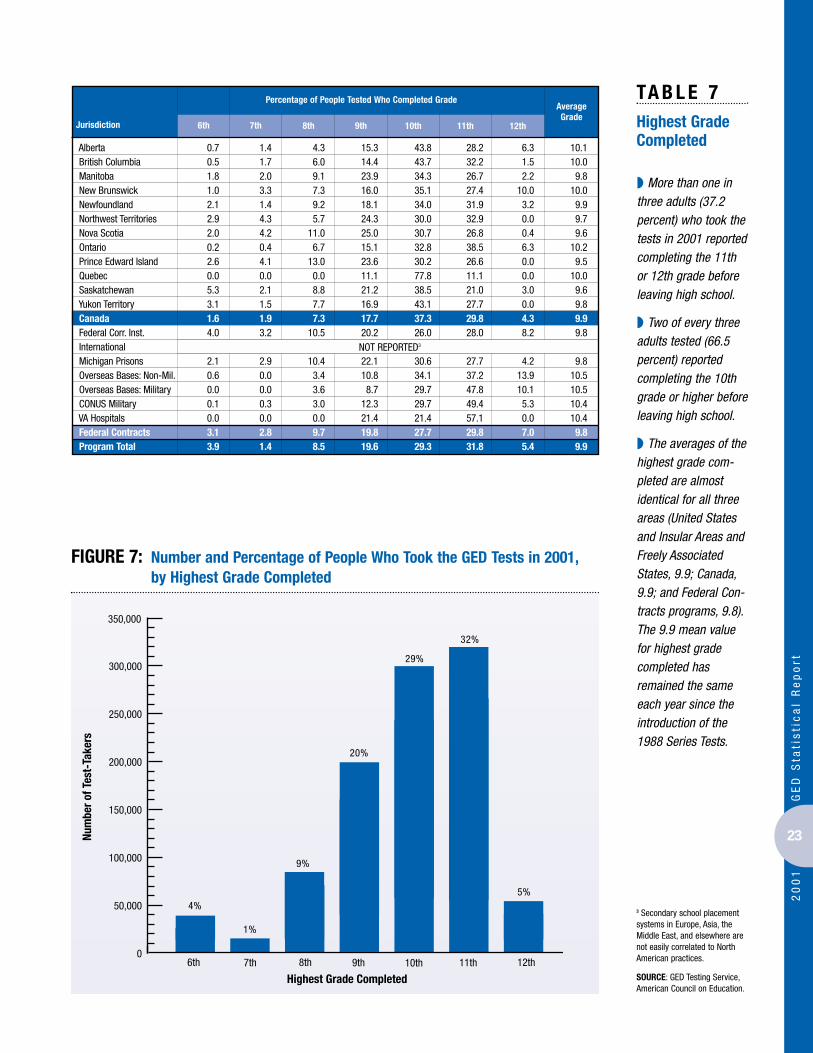
23
20
01
GE
D S
tati
sti
ca
l R
ep
ort
TA B L E 7Highest GradeCompleted
3 Secondary school placementsystems in Europe, Asia, theMiddle East, and elsewhere arenot easily correlated to NorthAmerican practices.
SOURCE: GED Testing Service,American Council on Education.
0
50,000
100,000
150,000
200,000
250,000
300,000
12th11th10th9th8th7th6th
Highest Grade Completed
Num
ber o
f Tes
t-Ta
kers
4%
1%
9%
20%
29%
32%
5%
350,000
FIGURE 7: Number and Percentage of People Who Took the GED Tests in 2001,by Highest Grade Completed
Percentage of People Tested Who Completed GradeAverageGrade
9th7th 8th 12th11thJurisdiction 10th6th
◗ More than one inthree adults (37.2percent) who took thetests in 2001 reportedcompleting the 11thor 12th grade beforeleaving high school.
◗ Two of every threeadults tested (66.5percent) reportedcompleting the 10thgrade or higher beforeleaving high school.
◗ The averages of thehighest grade com-pleted are almostidentical for all threeareas (United Statesand Insular Areas andFreely AssociatedStates, 9.9; Canada,9.9; and Federal Con-tracts programs, 9.8).The 9.9 mean valuefor highest gradecompleted hasremained the sameeach year since theintroduction of the1988 Series Tests.
NOT REPORTED3
Alberta 0.7 1.4 4.3 15.3 43.8 28.2 6.3 10.1British Columbia 0.5 1.7 6.0 14.4 43.7 32.2 1.5 10.0Manitoba 1.8 2.0 9.1 23.9 34.3 26.7 2.2 9.8New Brunswick 1.0 3.3 7.3 16.0 35.1 27.4 10.0 10.0Newfoundland 2.1 1.4 9.2 18.1 34.0 31.9 3.2 9.9Northwest Territories 2.9 4.3 5.7 24.3 30.0 32.9 0.0 9.7Nova Scotia 2.0 4.2 11.0 25.0 30.7 26.8 0.4 9.6Ontario 0.2 0.4 6.7 15.1 32.8 38.5 6.3 10.2Prince Edward Island 2.6 4.1 13.0 23.6 30.2 26.6 0.0 9.5Quebec 0.0 0.0 0.0 11.1 77.8 11.1 0.0 10.0Saskatchewan 5.3 2.1 8.8 21.2 38.5 21.0 3.0 9.6Yukon Territory 3.1 1.5 7.7 16.9 43.1 27.7 0.0 9.8Canada 1.6 1.9 7.3 17.7 37.3 29.8 4.3 9.9Federal Corr. Inst. 4.0 3.2 10.5 20.2 26.0 28.0 8.2 9.8InternationalMichigan Prisons 2.1 2.9 10.4 22.1 30.6 27.7 4.2 9.8Overseas Bases: Non-Mil. 0.6 0.0 3.4 10.8 34.1 37.2 13.9 10.5Overseas Bases: Military 0.0 0.0 3.6 8.7 29.7 47.8 10.1 10.5CONUS Military 0.1 0.3 3.0 12.3 29.7 49.4 5.3 10.4VA Hospitals 0.0 0.0 0.0 21.4 21.4 57.1 0.0 10.4Federal Contracts 3.1 2.8 9.7 19.8 27.7 29.8 7.0 9.8Program Total 3.9 1.4 8.5 19.6 29.3 31.8 5.4 9.9
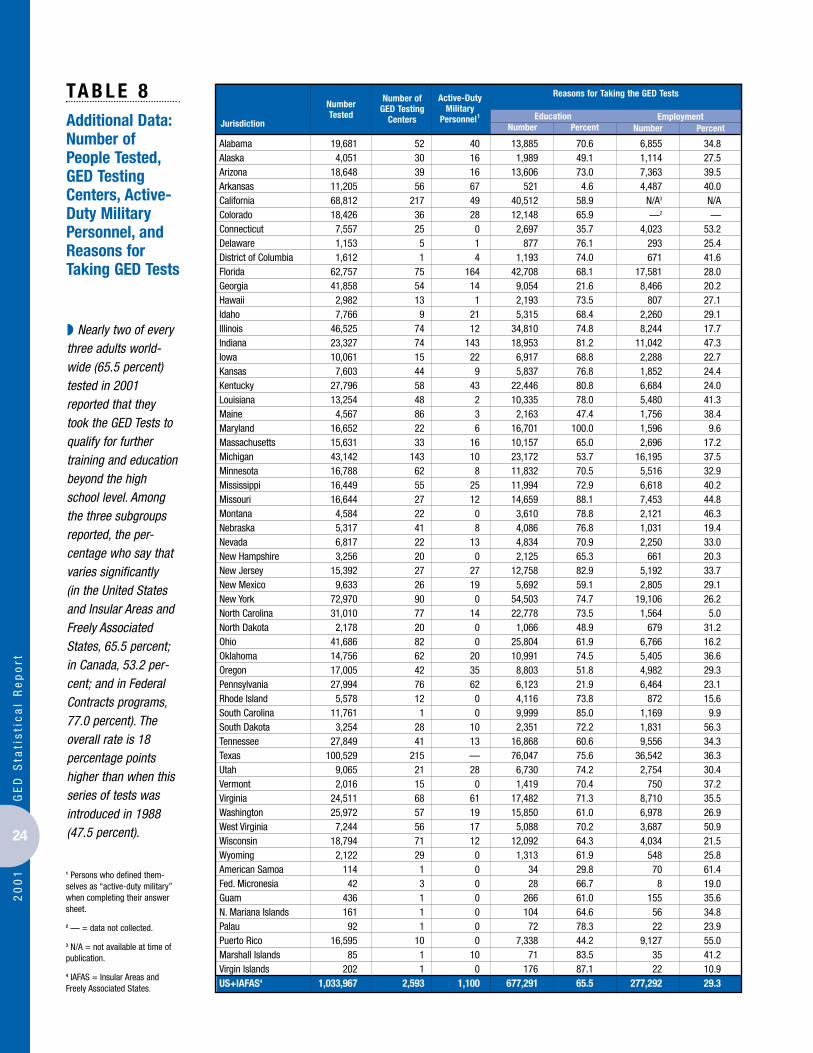
24
20
01
GE
D S
tati
sti
ca
l R
ep
ort
1 Persons who defined them-selves as “active-duty military”when completing their answersheet.
2 — = data not collected.
3 N/A = not available at time ofpublication.
4 IAFAS = Insular Areas andFreely Associated States.
TA B L E 8Additional Data:Number of People Tested,GED TestingCenters, Active-Duty MilitaryPersonnel, andReasons for Taking GED Tests
Number Tested
Reasons for Taking the GED TestsNumber ofGED Testing
Centers
Active-DutyMilitary
Personnel1
Number PercentJurisdiction Number Percent
Alabama 19,681 52 40 13,885 70.6 6,855 34.8Alaska 4,051 30 16 1,989 49.1 1,114 27.5Arizona 18,648 39 16 13,606 73.0 7,363 39.5Arkansas 11,205 56 67 521 4.6 4,487 40.0California 68,812 217 49 40,512 58.9 N/A3 N/AColorado 18,426 36 28 12,148 65.9 —2 —Connecticut 7,557 25 0 2,697 35.7 4,023 53.2Delaware 1,153 5 1 877 76.1 293 25.4District of Columbia 1,612 1 4 1,193 74.0 671 41.6Florida 62,757 75 164 42,708 68.1 17,581 28.0Georgia 41,858 54 14 9,054 21.6 8,466 20.2Hawaii 2,982 13 1 2,193 73.5 807 27.1Idaho 7,766 9 21 5,315 68.4 2,260 29.1Illinois 46,525 74 12 34,810 74.8 8,244 17.7Indiana 23,327 74 143 18,953 81.2 11,042 47.3Iowa 10,061 15 22 6,917 68.8 2,288 22.7Kansas 7,603 44 9 5,837 76.8 1,852 24.4Kentucky 27,796 58 43 22,446 80.8 6,684 24.0Louisiana 13,254 48 2 10,335 78.0 5,480 41.3Maine 4,567 86 3 2,163 47.4 1,756 38.4Maryland 16,652 22 6 16,701 100.0 1,596 9.6Massachusetts 15,631 33 16 10,157 65.0 2,696 17.2Michigan 43,142 143 10 23,172 53.7 16,195 37.5Minnesota 16,788 62 8 11,832 70.5 5,516 32.9Mississippi 16,449 55 25 11,994 72.9 6,618 40.2Missouri 16,644 27 12 14,659 88.1 7,453 44.8Montana 4,584 22 0 3,610 78.8 2,121 46.3Nebraska 5,317 41 8 4,086 76.8 1,031 19.4Nevada 6,817 22 13 4,834 70.9 2,250 33.0New Hampshire 3,256 20 0 2,125 65.3 661 20.3New Jersey 15,392 27 27 12,758 82.9 5,192 33.7New Mexico 9,633 26 19 5,692 59.1 2,805 29.1New York 72,970 90 0 54,503 74.7 19,106 26.2North Carolina 31,010 77 14 22,778 73.5 1,564 5.0North Dakota 2,178 20 0 1,066 48.9 679 31.2Ohio 41,686 82 0 25,804 61.9 6,766 16.2Oklahoma 14,756 62 20 10,991 74.5 5,405 36.6Oregon 17,005 42 35 8,803 51.8 4,982 29.3Pennsylvania 27,994 76 62 6,123 21.9 6,464 23.1Rhode Island 5,578 12 0 4,116 73.8 872 15.6South Carolina 11,761 1 0 9,999 85.0 1,169 9.9South Dakota 3,254 28 10 2,351 72.2 1,831 56.3Tennessee 27,849 41 13 16,868 60.6 9,556 34.3Texas 100,529 215 — 76,047 75.6 36,542 36.3Utah 9,065 21 28 6,730 74.2 2,754 30.4Vermont 2,016 15 0 1,419 70.4 750 37.2Virginia 24,511 68 61 17,482 71.3 8,710 35.5Washington 25,972 57 19 15,850 61.0 6,978 26.9West Virginia 7,244 56 17 5,088 70.2 3,687 50.9Wisconsin 18,794 71 12 12,092 64.3 4,034 21.5Wyoming 2,122 29 0 1,313 61.9 548 25.8American Samoa 114 1 0 34 29.8 70 61.4Fed. Micronesia 42 3 0 28 66.7 8 19.0Guam 436 1 0 266 61.0 155 35.6N. Mariana Islands 161 1 0 104 64.6 56 34.8Palau 92 1 0 72 78.3 22 23.9Puerto Rico 16,595 10 0 7,338 44.2 9,127 55.0Marshall Islands 85 1 10 71 83.5 35 41.2Virgin Islands 202 1 0 176 87.1 22 10.9US+IAFAS4 1,033,967 2,593 1,100 677,291 65.5 277,292 29.3
Education Employment
◗ Nearly two of everythree adults world-wide (65.5 percent)tested in 2001reported that theytook the GED Tests toqualify for furthertraining and educationbeyond the highschool level. Amongthe three subgroupsreported, the per-centage who say thatvaries significantly (in the United Statesand Insular Areas andFreely AssociatedStates, 65.5 percent;in Canada, 53.2 per-cent; and in FederalContracts programs,77.0 percent). Theoverall rate is 18percentage pointshigher than when thisseries of tests wasintroduced in 1988(47.5 percent).
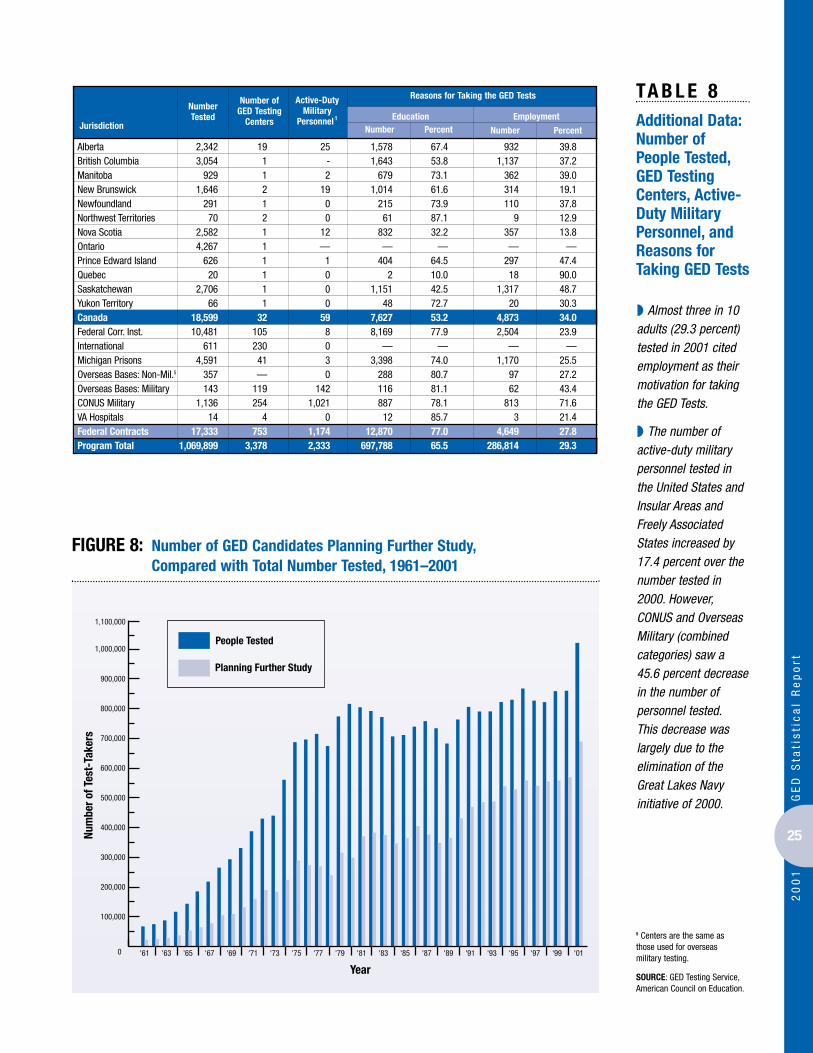
25
20
01
GE
D S
tati
sti
ca
l R
ep
ort
TA B L E 8Additional Data:Number of People Tested,GED TestingCenters, Active-Duty MilitaryPersonnel, andReasons for Taking GED Tests
5 Centers are the same asthose used for overseasmilitary testing.
SOURCE: GED Testing Service,American Council on Education.
Year
Num
ber o
f Tes
t-Ta
kers
0
100,000
200,000
300,000
400,000
500,000
600,000
700,000
800,000
900,000Planning Further Study
People Tested
'01'99'97'95'93'91'89'87'85'83'81'79'77'75'73'71'69'67’65'63'61
1,000,000
1,100,000
FIGURE 8: Number of GED Candidates Planning Further Study,Compared with Total Number Tested, 1961–2001
Number Tested
Reasons for Taking the GED TestsNumber ofGED Testing
Centers
Active-DutyMilitary
Personnel 1 Education EmploymentNumber PercentJurisdiction Number Percent
Alberta 2,342 19 25 1,578 67.4 932 39.8British Columbia 3,054 1 - 1,643 53.8 1,137 37.2Manitoba 929 1 2 679 73.1 362 39.0New Brunswick 1,646 2 19 1,014 61.6 314 19.1Newfoundland 291 1 0 215 73.9 110 37.8Northwest Territories 70 2 0 61 87.1 9 12.9Nova Scotia 2,582 1 12 832 32.2 357 13.8Ontario 4,267 1 — — — — —Prince Edward Island 626 1 1 404 64.5 297 47.4Quebec 20 1 0 2 10.0 18 90.0Saskatchewan 2,706 1 0 1,151 42.5 1,317 48.7Yukon Territory 66 1 0 48 72.7 20 30.3Canada 18,599 32 59 7,627 53.2 4,873 34.0Federal Corr. Inst. 10,481 105 8 8,169 77.9 2,504 23.9International 611 230 0 — — — —Michigan Prisons 4,591 41 3 3,398 74.0 1,170 25.5Overseas Bases: Non-Mil.5 357 — 0 288 80.7 97 27.2Overseas Bases: Military 143 119 142 116 81.1 62 43.4CONUS Military 1,136 254 1,021 887 78.1 813 71.6VA Hospitals 14 4 0 12 85.7 3 21.4Federal Contracts 17,333 753 1,174 12,870 77.0 4,649 27.8Program Total 1,069,899 3,378 2,333 697,788 65.5 286,814 29.3
◗ Almost three in 10adults (29.3 percent)tested in 2001 citedemployment as theirmotivation for takingthe GED Tests.
◗ The number ofactive-duty militarypersonnel tested inthe United States andInsular Areas andFreely AssociatedStates increased by17.4 percent over thenumber tested in2000. However,CONUS and OverseasMilitary (combinedcategories) saw a45.6 percent decreasein the number ofpersonnel tested.This decrease waslargely due to theelimination of theGreat Lakes Navyinitiative of 2000.

26
20
01
GE
D S
tati
sti
ca
l R
ep
ort
1 Changes over decade mayreflect changes in jurisdictionpolicies.
2 — = These data were not col-lected, not reported, or calcula-tions were not possible due tomissing data.
3 Utah’s cumulative number hasbeen revised since the lastreport.
4 Prior to 1998, data for the Fed-erated States of Micronesia,Republic of Palau, and Republicof the Marshall Islands werereported under the category of“Micronesia”; 1997 data for thecombined jurisdictions have beenreported under the category of“Fed. Micronesia.” All threejurisdictions are self-governingand have free-association status with the United States ofAmerica.
5 IAFAS = Insular Areas andFreely Associated States.
TA B L E 9CredentialsIssued, 1991and 1997–2001;Percent Change,1991–2001; andCumulative CredentialsIssued Since1971
Jurisdiction
Credentials Issued
1991 1997 1998 1999 2000 2001PercentChange1
1991–2001
Cum.1971–2001
Alabama 8,022 8,039 8,065 6,938 7,092 10,950 36.5 279,646Alaska 1,623 1,563 1,815 1,982 2,156 2,782 71.4 63,956Arizona 9,978 9,802 10,514 12,449 9,687 12,986 30.1 250,850Arkansas 7,891 7,998 8,134 6,839 7,105 9,298 17.8 190,452California 39,226 37,463 35,654 37,596 34,379 48,374 23.3 594,522Colorado 6,818 8,168 8,885 9,359 9,875 11,759 72.5 222,811Connecticut 5,306 4,554 4,789 4,259 3,761 4,651 -12.3 133,272Delaware 821 747 769 729 661 994 21.1 26,470District of Columbia 734 827 725 417 495 692 -5.7 32,752Florida 35,673 39,371 35,530 33,918 29,312 36,198 1.5 825,735Georgia 15,527 15,577 17,774 19,402 18,703 24,646 58.7 423,084Hawaii 1,361 1,303 1,333 1,337 1,367 1,813 33.2 44,325Idaho 983 660 611 567 466 603 -38.7 26,434Illinois 12,607 0 18,549 19,946 19,629 26,311 108.7 462,758Indiana 12,520 13,137 12,799 12,509 13,184 17,662 41.1 265,043Iowa 5,305 5,377 5,448 4,544 4,983 8,259 55.7 151,277Kansas 5,328 5,835 5,993 6,424 5,830 6,307 18.4 196,159Kentucky 12,613 10,368 10,196 11,851 13,211 20,689 64.0 347,236Louisiana 7,305 7,020 6,638 7,677 8,373 9,697 32.7 272,047Maine 3,423 2,386 2,322 4,034 5,418 6,263 83.0 86,395Maryland 6,211 5,855 6,446 5,944 6,200 7,998 28.8 203,378Massachusetts 10,849 8,208 7,873 7,494 8,046 9,753 -10.1 272,384Michigan 14,111 14,428 12,906 15,915 12,574 26,319 86.5 397,875Minnesota 6,151 6,535 7,117 7,044 6,885 11,268 83.2 187,280Mississippi 6,053 4,886 4,186 6,012 6,660 7,254 19.8 196,460Missouri 8,543 9,789 10,864 10,429 10,411 12,431 45.5 263,328Montana 1,740 1,903 2,061 2,204 2,411 3,478 99.9 63,208Nebraska 2,517 2,414 1,934 2,173 2,080 3,264 29.7 70,727Nevada 2,734 3,931 4,234 3,895 4,121 5,036 84.2 79,008New Hampshire 2,276 1,616 1,707 1,927 1,995 2,741 20.4 55,787New Jersey 8,430 8,790 8,097 9,077 8,090 8,563 1.6 333,075New Mexico 4,161 5,150 4,481 4,854 4,494 7,610 82.9 146,709New York 32,668 35,425 36,479 37,165 35,302 39,692 21.5 1,145,199North Carolina 13,331 13,871 14,580 14,525 14,858 22,706 70.3 417,562North Dakota 858 938 1,013 861 1,028 1,460 70.2 30,605Ohio 19,969 16,831 16,745 17,108 18,898 28,948 45.0 416,607Oklahoma 6,293 8,085 7,986 7,895 8,096 10,120 60.8 193,882Oregon 8,723 7,378 7,718 9,082 8,885 13,087 50.0 224,257Pennsylvania 20,378 17,440 19,658 17,313 17,487 20,579 1.0 530,803Rhode Island 2,654 2,592 2,545 2,623 1,907 2,369 -10.7 76,032South Carolina 6,060 4,801 5,285 5,839 5,654 8,042 32.7 143,234South Dakota 1,113 1,505 1,552 1,582 1,477 1,961 76.2 42,794Tennessee 11,759 13,136 13,168 13,510 13,742 18,626 58.4 320,743Texas 39,944 44,793 47,098 48,410 46,148 53,582 34.1 1,318,540Utah3 3,718 4,643 4,878 5,017 5,208 7,119 91.5 61,698Vermont 1,264 1,310 855 923 1,019 1,415 11.9 36,368Virginia 10,264 9,132 9,426 10,462 11,386 15,925 55.2 298,454Washington 9,523 11,853 10,961 13,767 13,061 18,117 90.2 297,401West Virginia 4,155 4,001 3,658 4,015 3,554 4,848 16.7 144,256Wisconsin 3,948 7,601 7,888 7,892 8,377 11,167 182.9 206,351Wyoming 1,304 1,127 1,271 1,194 1,256 1,610 23.5 38,207American Samoa 0 10 —2 15 — 57 — —Fed. Micronesia4 32 9 — 57 — 11 -65.6 —Guam 94 159 176 349 221 285 203.2 4,323N. Mariana Islands — 17 23 24 26 58 — 148Palau4 — — 26 — 37 56 — —Puerto Rico 8,947 10,502 14,404 17,055 12,986 6,821 -23.8 237,581Marshall Islands4 — — 10 8 58 58 — 134Virgin Islands 113 115 201 134 195 146 29.2 4,053US+IAFAS5 471,040 470,977 496,053 516,570 500,520 655,514 39.2 13,343,528
◗ Nearly 670,000adults worldwidepassed the GEDTests and earnedtheir jurisdictions’high school credentials in 2001.This number was thelargest for any year in the program’s 60-year history andexceeded the 1991total by 37.5 percent.
◗ By passing the GED Tests, nearly 13.7 million adultshave earned theirjurisdictions’ highschool credentialssince 1971.

27
20
01
GE
D S
tati
sti
ca
l R
ep
ort
CanadaIAFASArea IV, Western
Area III,Midwestern
Area II, Southern
Area I, Eastern
Region
Num
ber o
f Cre
dent
ials
Issu
ed
0
50,000
100,000
150,000
200,000
250,000
20011991
FIGURE 9: Changes in a Decade: Number of Credentials Issued in 1991 and 2001, by Region
TA B L E 9CredentialsIssued, 1991and 1997–2001;Percent Change,1991–2001; andCumulative CredentialsIssued Since1971
6 Cumulative data for NewBrunswick were revised in1999.
7 Ontario initiated GED testing in1996.
8 Candidates tested at FederalContracts sites receive theirGED credentials from their homejurisdictions.
SOURCE: GED Testing Service,American Council on Education.
Jurisdiction
Credentials Issued
1991 1997 1998 1999 2000 2001PercentChange1
1991–2001
Cum.1971–2001
Alberta 2,397 1,401 1,526 1,665 1,738 1,769 -26.2 42,914British Columbia 3,258 2,314 2,270 2,199 2,130 2,272 -30.3 89,572Manitoba 926 787 610 689 609 677 -26.9 41,721New Brunswick6 1,274 757 717 902 935 1,131 -11.2 28,544Newfoundland 677 302 171 166 163 201 -70.3 16,670Northwest Territories 144 43 57 50 35 44 -69.4 2,237Nova Scotia 2,115 1,322 1,215 1,440 1,638 1,957 -7.5 51,550Ontario7 — 1,547 1,755 2,154 2,534 3,472 — 12,208Prince Edward Island 164 182 236 364 420 482 193.9 7,382Quebec — — — — — — — —Saskatchewan 1,808 1,349 1,539 1,496 1,438 1,839 1.7 57,281Yukon Territory 51 56 41 28 43 45 -11.8 1,425Canada 12,814 10,060 10,137 11,153 11,683 13,889 8.4 350,911Program Total8 483,854 481,037 506,190 527,723 512,203 669,403 38.3 13,694,439
◗ From 1991 to 2001,the annual number ofGED credentialsawarded hasincreased by 70 per-cent or more in 17jurisdictions: Guam(203.2 percent),Prince Edward Island(193.9 percent), Wis-consin (182.9 per-cent), Illinois (108.7percent), Montana(99.9 percent), Utah(91.5 percent), Wash-ington (90.2 percent),Michigan (86.5 per-cent), Nevada (84.2percent), Minnesota(83.2 percent), Maine(83.0 percent), NewMexico (82.9 percent),South Dakota (76.2percent), Colorado(72.5 percent), Alaska(71.4 percent), NorthCarolina (70.3 per-cent), and NorthDakota (70.2 percent).

28
20
01
GE
D S
tati
sti
ca
l R
ep
ort
1 Population totals for the UnitedStates and Insular Areas andFreely Associated States (IAFAS)are based on 1990 U.S. Censusdata for persons ages 16 andolder, out of school, without highschool diplomas (unpublisheddocument tabulated for the U.S.Department of Education by theU.S. Bureau of the Census,1993). The numbers are esti-mates from a 20 percent sam-ple of the U.S. population andare derived from the SummaryTape File 3 (STF3), 1990 Censusof Population and Housing. Pop-ulation totals for Canadian juris-dictions are based on 1991Canada Census data forpersons ages 15 and older, outof school, without secondary-level credentials or further training (Statistics Canada, 1991Canada Census; Cat. No.93–328, Table 5).
2 Participation rate is the number of persons completingthe GED battery divided by thepopulation of out-of-schooladults without secondary-level(high school) credentials.
3 Credentialing rate is the number of persons issued GEDcredentials divided by the population of out-of-schooladults without secondary-level(high school) credentials.
4 N/A = not available.
5 — = Not reported, not possible to calculate, or notapplicable.
6 IAFAS = Insular Areas andFreely Associated States.
TA B L E 1 0Population ofAdults WithoutHigh SchoolDiplomas, GEDParticipationRate, and GEDCredentialingRate, by Jurisdiction
Population of Adults Without
Diplomas1
ParticipationRate (percent) 2
Number Completing
Battery, 2001
Credentialing Rate (percent) 3
Number of Credentials
Issued, 2001Jurisdiction
Alabama 936,269 19,681 2.1 10,950 1.2Alaska 51,195 3,215 6.3 2,782 5.4Arizona 579,369 18,321 3.2 12,986 2.2Arkansas 549,931 11,205 2.0 9,298 1.7California 5,327,621 60,719 1.1 48,374 0.9Colorado 375,970 12,579 3.3 11,759 3.1Connecticut 503,961 7,190 1.4 4,651 0.9Delaware 107,443 1,134 1.1 994 0.9District of Columbia 125,948 1,596 1.3 692 0.5Florida 2,541,872 59,507 2.3 36,198 1.4Georgia 1,329,996 37,889 2.8 24,646 1.9Hawaii 152,820 2,774 1.8 1,813 1.2Idaho 138,389 6,509 4.7 603 0.4Illinois 1,937,684 43,199 2.2 26,311 1.4Indiana 951,428 23,102 2.4 17,662 1.9Iowa 380,196 8,447 2.2 8,259 2.2Kansas 325,477 7,044 2.2 6,307 1.9Kentucky 909,162 26,646 2.9 20,689 2.3Louisiana 905,263 13,150 1.5 9,697 1.1Maine 184,979 3,971 2.1 6,263 3.4Maryland 754,722 16,272 2.2 7,998 1.1Massachusetts 882,624 13,425 1.5 9,753 1.1Michigan 1,515,421 35,008 2.3 26,319 1.7Minnesota 529,532 13,244 2.5 11,268 2.1Mississippi 610,713 15,330 2.5 7,254 1.2Missouri 944,893 16,352 1.7 12,431 1.3Montana 105,698 4,232 4.0 3,478 3.3Nebraska 196,144 4,304 2.2 3,264 1.7Nevada 195,739 6,735 3.4 5,036 2.6New Hampshire 144,234 3,069 2.1 2,741 1.9New Jersey 1,324,806 14,812 1.1 8,563 0.6New Mexico 260,091 8,408 3.2 7,610 2.9New York 3,301,373 70,682 2.1 39,692 1.2North Carolina 1,416,966 26,347 1.9 22,706 1.6North Dakota 97,028 1,757 1.8 1,460 1.5Ohio 1,851,680 40,686 2.2 28,948 1.6Oklahoma 560,140 14,373 2.6 10,120 1.8Oregon 393,844 14,759 3.7 13,087 3.3Pennsylvania 2,160,811 25,068 1.2 20,579 1.0Rhode Island 203,614 4,017 2.0 2,369 1.2South Carolina 763,897 11,718 1.5 8,042 1.1South Dakota 106,575 2,510 2.4 1,961 1.8Tennessee 1,144,588 27,460 2.4 18,626 1.6Texas 3,299,572 90,685 2.7 53,582 1.6Utah 160,799 8,660 5.4 7,119 4.4Vermont 76,341 1,654 2.2 1,415 1.9Virginia 1,099,302 24,310 2.2 15,925 1.4Washington 583,563 20,882 3.6 18,117 3.1West Virginia 432,738 7,083 1.6 4,848 1.1Wisconsin 721,374 13,877 1.9 11,167 1.5Wyoming 51,995 1,877 3.6 1,610 3.1American Samoa 11,364 111 1.0 57 0.5Fed. Micronesia N/A4 40 —5 11 —Guam 21,688 436 2.0 285 1.3N. Mariana Islands 11,025 105 1.0 58 0.5Palau 3,950 92 2.3 56 1.4Puerto Rico 1,241,864 16,595 1.3 6,821 0.5Marshall Islands N/A 76 — 58 —Virgin Islands 27,962 202 0.7 146 0.5US+IAFAS6 45,523,643 945,131 2.1 655,514 1.4

29
20
01
GE
D S
tati
sti
ca
l R
ep
ort
TA B L E 1 0Population ofAdults WithoutHigh SchoolDiplomas, GEDParticipationRate, and GEDCredentialingRate, by Jurisdiction
1 Please refer to p. 35 for defini-tion of geographic regions.
SOURCE: GED Testing Service,American Council on Education.
Area I, Eastern (9,770,856)
18.6%
Area II, Southern (16,500,409)
31.5%
Area III, Midwestern (9,557,432)
18.2%
Area IV, Western (8,377,093)
16%
IAFAS (1,317,853)
2.5%
Canada (6,925,625)
13.2%
Population of Adults Without
Diplomas 1
ParticipationRate (percent) 2
Number Completing
Battery, 2001
Credentialing Rate (percent) 3
Number of Credentials
Issued, 2001Jurisdiction
Alberta 573,165 2,273 0.4 1,769 0.3British Columbia 745,970 2,992 0.4 2,272 0.3Manitoba 323,970 909 0.3 677 0.2New Brunswick 218,190 1,619 0.7 1,131 0.5Newfoundland 182,075 284 0.2 201 0.1Northwest Territories 14,520 70 0.5 44 0.3Nova Scotia 256,545 2,537 1.0 1,957 0.8Ontario 2,399,740 4,215 0.2 3,472 0.1Prince Edward Island 36,590 619 1.7 482 1.3Quebec 1,880,525 20 0.0 N/A N/ASaskatchewan 289,740 2,621 0.9 1,839 0.6Yukon Territory 4,595 66 1.4 45 1.0Canada 6,925,625 18,225 0.3 13,889 0.2Federal Corr. Inst. N/A 10,344 — — —International N/A 561 — — —Michigan Prisons N/A 3,961 — — —Overseas: Non-Mil. N/A 338 — — —Overseas: Military N/A 143 — — —CONUS Military N/A 1,115 — — —VA Hospitals N/A 11 — — —Federal Contracts N/A 16,473 — — —Program Total 52,449,268 979,829 1.9 669,403 1.3
FIGURE 10: Number and Percentage of Adults Without High School Diplomas,by Region1 (U.S. 1990, Canada 1991)
◗ In 2001, an esti-mated 52 millionadults throughoutNorth America lackedhigh school diplomas.Among the threeareas reported, therewere more than 44million in the UnitedStates, 1 million in theIAFAS, and about 7million in Canada.
◗ In 2001, only 1.9percent of adults whohad not graduatedfrom high schoolattempted to earn ahigh school credentialby completing theGED Tests. Program-wide, only 1.3 percentof those 52 millionadults passed thetests and earned ahigh school credentialin 2001. While thepercentage of adultsmoving forward islow, the percentage ofadults who partici-pated in 2001 was thehighest in the pro-gram’s history.

30
20
01
GE
D S
tati
sti
ca
l R
ep
ort
Year
Num
ber o
f Tes
t-Ta
kers
0
100,000
200,000
300,000
400,000
500,000
600,000
700,000
800,000
Receiving CredentialsCompleting Battery
’00’99’98’97’96’95’94’93’92’91’90’89’88’87’86’85’84’83’82’81’80’79’78’77’76’75’74 ’01
900,000
1,000,000
TA B L E 1 1Trends in GEDTesting,1949–2001
1 The statistics for the 18-yearperiod were estimated by aver-aging or totaling the availablenumbers for those years. Thepercentage of people meetingscore requirements in 1949–1953 was estimated bythe average percentage in1954–1959.
2 The numbers of credentialsissued in 1949–1970 were estimated by the numbers of allGED candidates who met statescore requirements in thoseyears.
3 Numbers of credentials issuedin 1991–1995 have beenrevised since the last report.
SOURCE: GED Testing Service,American Council on Education.
◗ An estimated 15.4million adults world-wide have passed theGED Tests and earnedtheir jurisdictions’high school creden-tials since 1949.
Official GED Testing
CentersTotal
NumberTestedYear
Number
CompletedBattery
Number
Met Score
Requirements
Percent
Age
Average
Years ofSchooling
Average
Planning Further Study
Percent
CredentialsIssued
Number
FIGURE 11:Number of GEDCandidatesReceiving Credentials,Compared with NumberCompleting theTests Battery,1974–2001
1949-671 706 — 75.0 28.8 9.9 34.8 1,057,358 1,429,71419682 1,336 N/A 69.4 29.5 9.7 39.9 184,256 265,49919692 1,566 N/A 71.7 29.4 9.7 37.3 210,404 293,45119702 1,711 N/A 70.8 29.1 9.7 40.1 234,726 331,5341971 1,858 N/A 68.7 28.0 9.8 41.2 231,558 387,7331972 1,997 N/A 67.4 27.4 9.8 44.3 248,790 430,3461973 2,135 N/A 68.2 25.1 9.8 42.0 256,905 440,2161974 2,421 430,253 68.9 27.2 10.7 40.0 300,674 561,2031975 2,462 541,914 70.2 25.1 10.0 42.1 351,327 687,4261976 2,549 539,729 67.8 25.4 10.0 39.4 346,490 696,6231977 2,704 517,847 69.7 25.0 10.0 37.8 342,828 715,1161978 2,708 495,728 N/A 25.9 9.9 35.6 392,511 674,7241979 2,799 608,229 68.4 25.3 10.0 40.8 445,426 773,9961980 2,753 741,601 70.8 25.1 10.0 36.6 500,203 816,1761981 2,900 732,229 72.1 25.1 9.9 46.1 513,549 804,8131982 3,046 724,971 73.9 25.1 9.9 48.4 509,155 792,1321983 3,009 711,946 73.1 25.4 9.8 48.6 490,329 772,0801984 3,395 641,697 73.0 25.8 9.8 49.1 450,331 707,0761985 3,371 647,496 72.4 25.8 9.8 51.3 439,922 711,3921986 3,243 674,430 72.6 26.5 9.9 54.8 451,294 739,6831987 3,314 690,509 74.1 26.7 9.9 49.7 472,007 758,3671988 3,450 651,247 72.3 26.7 9.9 47.5 435,318 734,0871989 3,468 589,002 68.4 26.2 10.0 53.6 376,879 682,7281990 3,316 662,789 69.9 26.5 9.9 56.5 431,231 763,6181991 3,445 706,182 71.5 26.4 9.9 58.6 486,7713 806,0381992 3,401 688,582 71.4 26.6 9.9 61.4 482,4973 790,5651993 3,250 685,304 71.4 26.0 9.9 61.7 492,2513 790,1651994 3,300 712,421 73.0 25.6 9.9 65.6 513,4133 822,5371995 3,255 723,899 72.0 25.3 9.9 63.7 524,1663 829,9041996 3,493 758,570 71.7 25.0 9.9 64.4 524,526 867,8021997 3,287 722,461 68.6 24.7 9.9 65.4 481,037 827,1051998 3,183 718,464 70.9 24.6 9.9 67.6 506,190 822,1811999 3,682 751,637 70.2 24.6 9.9 65.0 527,723 860,0792000 3,350 747,617 69.5 24.7 9.9 66.2 512,203 860,6842001 3,378 979,829 69.8 25.2 9.9 65.5 669,403 1,069,899Total 18,796,583 15,393,652 25,316,152

31
20
01
GE
D S
tati
sti
ca
l R
ep
ort
TA B L E 1 2GED PassingScore Requirements:1
Percentage ofHigh SchoolGraduates Meeting GEDStandard andJurisdictionsRequiring GEDStandard in2001
1 Jurisdictional requirements aredescribed in Table 13 and theGED Examiner’s Manual,Sections 3.8-3 through 3.8-5.
2 Each jurisdiction that awardshigh school equivalency creden-tials based on the GED Testsestablishes its own minimumscore requirement. In January1997, the GED Testing Serviceraised the minimum scorerequirement for passing the GEDTests to a minimum of 40 pertest and a mean standard scoreof 45. In the United States, thisminimum standard was met by67 percent of graduating highschool seniors. Jurisdictionsmay set passing score require-ments that are more stringentthan this established minimum,but may not set a lower stan-dard.
3 U.S. percentages are based ondata from a national sample ofgraduating high school seniorswho took all five sections of theGED Tests in the spring of 1996.The percentage reported forCanada is an estimate based onthe performance of Canadianhigh school seniors who tookindividual GED Tests during thespring of 1996. This percentagewas estimated using a condi-tional probability method.
4 Quebec’s requirements are notyet available.
SOURCE: GED Testing Service,American Council on Education.
Percentage of High School Graduates
Meeting StandardJurisdictions Requiring GED StandardMinimum GED Score Standard 2
United States + Insular Areas and Freely Associated States (IAFAS)
Minimum 40 and Mean 45 673 Alabama, Alaska, Arizona, Arkansas, California, Colorado,Connecticut, Delaware, District of Columbia, Georgia,Hawaii, Idaho, Illinois, Indiana, Iowa, Kansas, Kentucky,Louisiana, Maine, Maryland, Massachusetts, Michigan,Minnesota, Mississippi, Missouri, Montana, Nebraska,Nevada, New Hampshire, New Mexico, New York, NorthCarolina, North Dakota, Ohio, Oklahoma, Oregon,Pennsylvania, Rhode Island, South Carolina, South Dakota,Tennessee, Texas, Utah, Vermont, Virginia, Washington,West Virginia, Wyoming, American Samoa, Commonwealthof the North Mariana Islands, Federated States of Micronesia, Guam, Puerto Rico, Republic of the MarshallIslands, Republic of Palau, Virgin Islands
Minimum 40 and Mean 46 64 Wisconsin
Minimum 45 and Mean 45 — Florida (effective 7/1/2000)
42 on Test 1, 40 on Tests 2–4,45 on Test 5, and Mean 45 — New Jersey
Canada
Minimum 45 (each test) 66 Alberta, British Columbia, Manitoba, New Brunswick,Newfoundland, Northwest Territories, Nova Scotia,Ontario, Prince Edward Island, Saskatchewan,Yukon Territory
Not Available4 Quebec
0
10
20
30
40
50
60
70
80
90
100CanadaU.S. & IAFAS
Minimum 4540 & 46 (Wisconsin)40 & 45
Perc
enta
ge
GED Passing Score Requirements
67% 64% 66%
◗ As a result of theincreased passing scorerequirement in 1997, allGED graduates mustnow meet a standardthat exceeds the per-formance of at least 33 percent of graduatinghigh school seniors.
FIGURE 12: Percentage of High School Graduates Meeting GED PassingScore Requirements in the United States, Insular Areas and Freely Associated States, and Canada

32
20
01
GE
D S
tati
sti
ca
l R
ep
ort
1 See jurisdictional requirementsin the GED Examiner’s Manualfor exceptions, limitations, andadditional fees, or contact thejurisdictional GED Administrator(listing on pages 36–39).
2 Minimum scores of “40 and45” mean that a person mustachieve a standard score of atleast 40 on each test and mustachieve an average standardscore of 45 or more on theentire battery.
3 In most—but not all—jurisdictions, exceptions to theminimum age policy are grantedon a case-by-case basis. Formore information, contact thejurisdictional GED Administrator(listing on pages 36-39).
4 Connecticut offers freeGED testing for personsunder age 21.
5 Effective July 1, 2000, throughJune 30, 2001, Florida’s scorerequirement is a minimum of 45on each test.
6 New Jersey’s requirements are42 on Test 1, 40 on Tests 2–4,45 on Test 5, and a total stan-dard score of 225.
TA B L E 1 3Policies1 forIssuing HighSchool Equivalency CredentialsBased on GED Tests, byJurisdiction
Minimum Scores 2
Residency Requirements
Testing Fee Per Battery
MinimumAge for Testing 3
MinimumAge for
Credential 3Jurisdiction
Alabama 40 min & 45 avg 30 days $30 18 18Alaska 40 min & 45 avg resident $25 max. 18 18Arizona 40 min & 45 avg none $50 max. 18 18Arkansas 40 min & 45 avg legal resident none 16 16California 40 min & 45 avg resident or armed forces1 varies 18 18Colorado 40 min & 45 avg resident or address of record $25–$50 17 17Connecticut 4 40 min & 45 avg in-state mailing address $13 age 21 and over 17 17Delaware 40 min & 45 avg resident $50 18 18District of Columbia 40 min & 45 avg valid ID showing residence $30 18 18Florida see note5 legal, current resident $50 max. 18 18Georgia 40 min & 45 avg none $45 18 18Hawaii 40 min & 45 avg none1 $50 17 17Idaho 40 min & 45 avg resident varies 18 18Illinois 40 min & 45 avg 30 days $25 18 18Indiana 40 min & 45 avg 30 days $40 max. 17 17Iowa 40 min & 45 avg none $20 17 17Kansas 40 min & 45 avg resident or last attended school in state $57 18 18Kentucky 40 min & 45 avg in-state mailing address $30 19 19Louisiana 40 min & 45 avg resident $30 max. 17 17Maine 40 min & 45 avg none none for residents 18 18Maryland 40 min & 45 avg 90 days $45 16 16Massachusetts 40 min & 45 avg resident $50 18 18Michigan 40 min & 45 avg 30 days varies 18 18Minnesota 40 min & 45 avg resident $40–$60 19 19Mississippi 40 min & 45 avg 30 days or active duty military $30 18 18Missouri 40 min & 45 avg resident or armed forces $27 18 18Montana 40 min & 45 avg resident $24 17 17Nebraska 40 min & 45 avg 30 days $25–$50 18 18Nevada 40 min & 45 avg residents of adjacent states may test $45 18 18New Hampshire 40 min & 45 avg resident $40 18 18New Jersey6 see policy listing not required $25 16 16New Mexico 40 min & 45 avg resident varies 17 17New York 40 min & 45 avg 30 days none 19 19North Carolina 40 min & 45 avg resident or armed forces; see policy1 $7.50 18 18North Dakota 40 min & 45 avg none varies 18 18Ohio 40 min & 45 avg resident $42 19 19Oklahoma 40 min & 45 avg documented resident varies 18 18Oregon 40 min & 45 avg resident or last attended school in state varies 18 18Pennsylvania 40 min & 45 avg resident varies 18 18Rhode Island 40 min & 45 avg resident or armed forces $15 18 18South Carolina 40 min & 45 avg resident or last attended school in state $40–$80 17 17South Dakota 40 min & 45 avg resident or last attended school in state $50 max. 18 18Tennessee 40 min & 45 avg resident $35–$45 18 18Texas 40 min & 45 avg resident varies 18 18Utah 40 min & 45 avg verify residence $40 18 18Vermont 40 min & 45 avg in-state mailing address $35–$40 18 18Virginia 40 min & 45 avg resident $35 18 18Washington 40 min & 45 avg bona fide resident $40 max. 19 19West Virginia 40 min & 45 avg 30 days $33 max. 18 18Wisconsin 40 min & 46 avg voting resident or migrant worker approx. $40 18.5 18.5Wyoming 40 min & 45 avg must physically reside in state varies 18 18

33
20
01
GE
D S
tati
sti
ca
l R
ep
ort
American Samoa 40 min & 45 avg bona fide resident $20 17 17Guam 40 min & 45 avg resident; see policy for exceptions $20 18 18Marshall Islands 40 min & 45 avg citizen or 30-day resident $7.50 17 17Fed. Micronesia 40 min & 45 avg citizen or current resident $7.50 17 17N. Mariana Islands 40 min & 45 avg none $25 18 18Palau 40 min & 45 avg resident $25 17 17Puerto Rico 40 min & 45 avg resident or U.S. citizen none 18 18Virgin Islands 40 min & 45 avg see policy $25 17 17
Alberta 45 minimum must have Alberta address $65–$120 18 18British Columbia 45 minimum resident, citizen or landed immigrant $45 19 19Manitoba 45 minimum not required $65 19 19New Brunswick 45 minimum none $40 19 19Newfoundland 45 minimum resident $30 19 19Northwest Territories 45 minimum 6 months $20 18 18Nova Scotia 45 minimum not required $20 (under review) 19 19Ontario 45 minimum resident $60 19 19Prince Edward Island 45 minimum resident $20 19 19Quebec7
Saskatchewan 45 minimum resident $35 19 19Yukon 45 minimum resident $25 19 19
TA B L E 1 3Policies1 forIssuing HighSchool Equivalency CredentialsBased on GED Tests, byJurisdiction
7 Quebec’s requirements are notyet available.
8 New Jersey’s requirements are42 on Test 1, 40 on Tests 2–4,45 on Test 5, and a total standard score of 225.
SOURCE: GED Testing Service,American Council on Education.
Minimum Scores 2
Residency Requirements
Testing Fee Per Battery
Min. Age for Testing 3
Min. Age for Creden-
tial 3Jurisdiction
U.S. Insular Areas and Freely Associated States Without Special Conditions
NOT AVAILABLE
0
10
20
30
40
50
60
70
80
90
100 U.S. & IAFAS
Minimum 45 Minimum(New Jersey)8
Minimum 45 (Florida, effective
7/1/00 until 6/30/01)
40 & 46 (Wisconsin)
40 & 45
Canada
Perc
enta
ge
GED Passing Score Requirements
94%100%
2% 2% 2%
◗For most U.S. jurisdic-tions, the minimum agefor issuing credentials is18. In Canada, mostjurisdictions set a minimum credentialingage of 19.
◗Residency andtesting fee requirementsare established byeach jurisdiction.
◗Only three jurisdic-tions, all in the UnitedStates, regularly test andcredential 16-year-olds:Maryland, New Jersey,and the Virgin Islands.
◗Only three U.S. statesand all the Canadianjurisdictions impose astricter GED passing-score requirement thana 40 minimum and 45average. Canada andFlorida have establisheda minimum of 45 oneach test; New Jersey,42 on Test 1 and 45 onTest 5; and Wisconsin,40 minimum on eachtest and mean batteryscore of 46.
FIGURE 13: Percentage of Jurisdictions, by Minimum GED Score Requirements, in the United States, Insular Areas and Freely Associated States, and Canada

34
20
01
GE
D S
tati
sti
ca
l R
ep
ort
Appendices

35
20
01
GE
D S
tati
sti
ca
l R
ep
ort
Definition ofGeographic Regions
Region Jurisdictions
Area I Connecticut Eastern Delaware
District of ColumbiaMaineMarylandMassachusetts
Area II AlabamaSouthern Arkansas
FloridaGeorgiaKentuckyLouisianaMississippi
Area III IllinoisMidwestern Indiana
IowaKansasMichiganMinnesota
Area IV AlaskaWestern Arizona
CaliforniaColoradoHawaiiIdahoMontana
U.S. Insular Areas and Freely American SamoaAssociated States (IAFAS) Federated States of Micronesia
GuamNorthern Mariana IslandsPuerto RicoRepublic of Marshall IslandsRepublic of PalauVirgin Islands
Canada AlbertaBritish ColumbiaManitobaNew BrunswickNewfoundlandNorthwest Territories
New HampshireNew JerseyNew YorkPennsylvaniaRhode IslandVermont
North CarolinaOklahomaSouth CarolinaTennesseeTexasVirginiaWest Virginia
MissouriNebraskaNorth DakotaOhioSouth DakotaWisconsin
NevadaNew MexicoOregonUtahWashingtonWyoming
Nova ScotiaOntarioPrince Edward IslandQuebecSaskatchewanYukon Territory

36
20
01
GE
D S
tati
sti
ca
l R
ep
ort
ALABAMAMr. Nace J. MacalusoGED AdministratorAlabama Department of Education5343 Gordon Persons BuildingMontgomery,AL 36130-2101Tel: (334) 242-8181/8182Fax: (334) 242-2236E-mail: [email protected]
ALASKAMs.Amy Iutzi-MitchellABE/GED State DirectorDOLWD—ES Division1111 West 8th StreetP.O. Box 25509Juneau,AK 99802-5509Tel: (907) 465-8714Fax: (907) 465-4537E-mail: amy_iutzi-mitchell@
labor.state.ak.us
ARIZONAMs. Karen LierschDirector,Adult EducationArizona State Department of EducationADE-Adult Ed., Bin 301535 West JeffersonPhoenix,AZ 85007Tel: (602) 542-5802Fax: (602) 542-1161E-mail: [email protected]
ARKANSASMs. Janice HanlonGED Test AdministratorArkansas Dept. of Workforce Education3 Capital Mall, Luther S. Harden BuildingRoom 305DLittle Rock,AR 72201Tel: (501) 682-1970Fax: (501) 682-1982E-mail: [email protected]
CALIFORNIAMr. Mark FetlerGED AdministratorState GED OfficeCalifornia Department of Education721 Capitol Mall, 6th FloorP.O. Box 710273Sacramento, CA 94244-0273Tel: (800) 331-6316; (916) 651-6623Fax: (916) 657-4964E-mail: [email protected]
COLORADOMs. Mary WilloughbyGED AdministratorColorado Department of EducationGED Testing Program201 East Colfax Avenue, Room 100Denver, CO 80203Tel: (303) 866-6611Fax: (303) 866-6947E-mail: [email protected]
IDAHODr. Shirley T. SpencerAdult Education Director and
GED AdministratorDepartment of EducationP.O. Box 83720Boise, ID 83720-0027Tel: (208) 332-6933Fax: (208) 334-4664E-mail: [email protected]
ILLINOISMs. Brenda CarmodyState GED AdministratorIllinois State Board of EducationCommunity & Family
Partnerships Division100 North First Street (C-418)Springfield, IL 62777Tel: (217) 782-3370Fax: (217) 782-9224E-mail: [email protected]
INDIANAMs. Paula HillGED AdministratorDivision of Adult EducationIndiana Department of EducationState House, Room 229Indianapolis, IN 46204Tel: (317) 232-0523Fax: (317) 233-0859E-mail: [email protected]
IOWADr. John HartwigGED AdministratorDivision of Community CollegesDepartment of EducationGrimes State Office Building, 3rd FloorDes Moines, IA 50319-0146Tel: (515) 281-3636Fax: (515) 281-6544E-mail: [email protected]
KANSASDr. Patricia M.AndersonAssociate Director,Academic AffairsKansas Board of Regents1000 SW Jackson Street, Suite 520Topeka, KS 66612-1368Tel: (785) 296-4917Fax: (785) 296-3353E-mail: [email protected]
KENTUCKYMs. Lisa K. FortGED AdministratorDepartment for Adult Education
and LiteracyCapitol Plaza Tower500 Mero Street, 3rd FloorFrankfort, KY 40601Tel: (502) 564-5117, ext. 110Fax: (502) 564-5436E-mail: [email protected]
CONNECTICUTMr. Carl PaternostroGED AdministratorBureau of Career and Adult EducationConnecticut Department of Education25 Industrial Park RoadMiddletown, CT 6457Tel: (860) 807-2110Fax: (860) 807-2112E-mail: [email protected]
DELAWAREDr. Fran Tracy-MumfordEducation Associate for Adult EducationAdult and Community EducationDepartment of EducationJ. G.Townsend Building, P.O. Box 1402Dover, DE 19903Tel: (302) 739-1318Fax: (302) 739-3744E-mail: [email protected]
DISTRICT OF COLUMBIAMr.Amaate NeilGED AdministratorUniversity of the District of ColumbiaGED Office, Lower Level4200 Connecticut Ave. NW, MB 1005Washington, DC 20008Tel: (202) 274-7173/7175Fax: (202) 274-7188E-mail: [email protected]
FLORIDAMs. Nancy CordillGED AdministratorBureau of Program Planning and Development325 West Gaines Street, Room 714,
Turlington BuildingTallahassee, FL 32399-0400Tel: (850) 488-7153Fax: (850) 487-1735E-mail: [email protected]
GEORGIAMs. Kimberly LeeDirector,Assessment, Evaluation and
GED AdministratorGeorgia Department of Technical and
Adult Education 1800 Century Place NE, Suite 555Atlanta, GA 30345-4304Tel: (404) 679-1621Fax: (404) 679-4911E-mail: [email protected]
HAWAIIMr. Glenn HondaGED AdministratorSchool Improvement/Community Leadership
Branch, Department of Education634 Pensacola Street, Room 222Honolulu, HI 96814Tel: (808) 594-0170Fax: (808) 594-0181E-mail: [email protected]
GEDAdministrators

37
20
01
GE
D S
tati
sti
ca
l R
ep
ort
LOUISIANAMs. Debi FaucetteActing Director,Adult Education
and TrainingLouisiana Department of Education626 North Fourth StreetBaton Rouge, LA 70802Tel: (225) 342-0444Fax: (225) 219-4439E-mail: [email protected]
MAINEMr. J.Andrew McMahanGED AdministratorMaine Department of Education23 State House StationAugusta, ME 04333-0023Tel: (207) 624-6754Fax: (207) 624-6731E-mail: [email protected]
MARYLANDMs. Patricia BennettInterim GED AdministratorMaryland State Department of Education200 West Baltimore StreetBaltimore, MD 21201Tel: (410) 767-0168Fax: (410) 333-8435E-mail: [email protected]
MASSACHUSETTSMr. Frank SheaGED AdministratorOffice of CertificationMassachusetts Department of Education350 Main Street, P.O. Box 9120Malden, MA 02148-9120Tel: (781) 338-6651Fax: (781) 388-3391E-mail: [email protected]
MICHIGANMr.William KingState GED AdministratorMichigan Department of Career DevelopmentOffice of Adult Education GED Testing201 North Washington SquareVictor Building, First FloorP.O. Box 30714Lansing, MI 48909-8214Tel: (517) 373-1692Fax: (517) 335-3461E-mail: [email protected]
MINNESOTAMr. Patrick RuppGED AdministratorMinnesota Department of Children,
Families, and Learning1500 Hwy. 36 WestRoseville, MN 55113Tel: (651) 582-8437Fax: (651) 634-8458E-mail: [email protected]
NEW JERSEYDr.Thomas A. HenryDirector, Office of School-to-Career
and College InitiativesNew Jersey Department of Education100 River View PlazaP. O. Box 500Trenton, NJ 08625-0500Tel: (609) 633-0665Fax: (609) 984-5328E-mail:[email protected]
NEW MEXICOMr. Jim TravelsteadInterim GED AdministratorState Department of EducationEducation Building300 Don Gaspar, Room 122Santa Fe, NM 87501-2786Tel: (505) 827-6631Fax: (505) 827-6616E-mail: [email protected]
NEW YORK (CHIEF EXAMINER)Dr. Patricia M. Mooney-GonzalezThe New York State Education Department
Office of Workforce Preparation and Continuing Education
P.O. Box 7348, Room 775 EBAAlbany, NY 12224Tel: (518) 486-5746Fax: (518) 402-5203E-mail: [email protected] site: www.emsc.nysed.gov/
workforce/gedHotline: (518) 474-5906
NORTH CAROLINAMr. Patrick PittmanGED AdministratorState Board of Community CollegesThe Caswell Building200 West Jones StreetRaleigh, NC 27603-1379Tel: (919) 733-7051, ext. 720Fax: (919) 715-5351E-mail: [email protected]
NORTH DAKOTAMr. G. David MasseyAssistant State SuperintendentAdult Education and LiteracyNorth Dakota Department of Public
Instruction600 East Boulevard AvenueState Capital BuildingBismarck, ND 58505-0440Tel: (701) 328-2393Fax: (701) 328-4770E-mail: [email protected]
MISSISSIPPIMs. Eloise RichardsonGED AdministratorState Board for Community and
Junior Colleges3825 Ridgewood RoadJackson, MS 39211Tel: (601) 432-6481Fax: (601) 432-6365E-mail: [email protected]
MISSOURIMr.William PoteetAdministratorState Department of Elementary and
Secondary Education402 Dix Road, P.O. Box 480Jefferson City, MO 65102Tel: (573) 751-3504Fax: (573) 526-5710E-mail: [email protected]
MONTANAMr. David StrongGED AdministratorOffice of Public Instruction1300 11th AvenueBox 202501 Helena, MT 59620-2501Tel: (406) 444-4438Fax: (406) 444-1373E-mail: [email protected]
NEBRASKAMs.Vicki L. BauerDirector,Adult EducationNebraska Department of Education301 Centennial Mall SouthP.O. Box 94987Lincoln, NE 68509-4987Tel: (402) 471-4807Fax: (402) 471-8127E-mail: [email protected]
NEVADAMs. Mary Katherine MoenGED AdministratorWorkforce Education Nevada Department of Education700 East Fifth StreetCarson City, NV 89701-5096Tel: (775) 687-9167 or 9104Fax: (775) 687-9114E-mail: [email protected]
NEW HAMPSHIREMs. Deborah TaskerGED AdministratorNew Hampshire Department of EducationState Office Park South101 Pleasant StreetConcord, NH 03301Tel: (603) 271-6698Fax: (603) 271-1953E-mail: [email protected]

38
20
01
GE
D S
tati
sti
ca
l R
ep
ort
OHIOMs. Joan MyersGED AdministratorState Department of Education25 South Front Street, Mailstop 106,
First FloorColumbus, OH 43215-4183Tel: (614) 466-1577; (800) 334-6679Fax: (614) 752-9445E-mail: [email protected]
OKLAHOMAMs. Linda YoungDirector, Lifelong Learning SectionOklahoma State Department of Education2500 North Lincoln BoulevardOklahoma City, OK 73105-4599Tel: (405) 521-3321Fax: (405) 572-5394E-mail: [email protected]
OREGONMs. Sharlene WalkerUnit Leader,Adult Basic Skills and
Family Literacy UnitOregon Department of Community Colleges
and Workforce Development255 Capitol Street, NESalem, OR 97310-1341Tel: (503) 378-8648, ext. 368Fax: (503) 378-8434E-mail: [email protected]
PENNSYLVANIAMr. James ShindledeckerGED AdministratorState Department of Education333 Market Street, 12th FloorHarrisburg, PA 17126-0333Tel: (717) 787-6747Fax: (717) 783-0583E-mail: [email protected]
RHODE ISLANDMr. Robert MasonGED AdministratorDepartment of Elementary and
Secondary EducationOffice of Career and Technical EducationShepard Building, 255 Westminster StreetProvidence, RI 02903-3414Tel: (401) 222-4600, ext. 2180/2181/2183Fax: (401) 222-2537E-mail: [email protected]
SOUTH CAROLINAMr. David StoutGED AdministratorState Department of Education402 Rutledge Building1429 Senate StreetColumbia, SC 29201Tel: (803) 734-8347Fax: (803) 734-8336E-mail: [email protected]
SOUTH DAKOTAMs. Marcia HessGED AdministratorAdult Education and Literacy/GED OfficeDepartment of Labor700 Governors DrivePierre, SD 57501Tel: (605) 773-3101Fax: (605) 773-6184E-mail: [email protected]
WEST VIRGINIAMs. Pam AbstonGED AdministratorWest Virgina Department of EducationGED Office, 1900 Kanawha Boulevard EastBuilding 6, Room 250Charleston,WV 25305-0330Tel: (304) 558-6315Fax: (304) 558-4874E-mail: [email protected]
WISCONSINMr. Robert EnghagenGED AdministratorWisconsin High School Equivalency ProgramDepartment of Public InstructionP.O. Box 7841125 South Webster StreetMadison,WI 53707-7841Tel: (608) 267-2402; (800) 441-4563Fax: (608) 264-9553E-mail: [email protected]
WYOMINGMs. Karen Ross-MilmontGED AdministratorWyoming Community College Commission2020 Carey Avenue, 8th FloorCheyenne,WY 82002Tel: (307) 777-3545Fax: (307) 777-6567E-mail: [email protected]
AMERICAN SAMOAMr. Mike HimphillGED AdministratorGovernment of American SamoaPago Pago,AS 96799Tel: 011 (684) 633-5237Fax: 011 (684)633-4240
GUAMMs. Lolita C. ReyesGED AdministratorGuam Community CollegeP.O. Box 23069Main Postal FacilityGuam, GU 96921Tel: 011 (671) 735-6511Fax: 011 (671) 734-8324E-mail: [email protected]
MARSHALL ISLANDSMr. John TuthillInterim President and GED AdministratorCollege of the Marshall IslandsP.O. Box 1258Republic of Marshall IslandsMajuro, MH 96960Tel: 011 (692) 625-3394Fax: 011 (692) 625-7203E-mail: [email protected]
MICRONESIAMr.Wehns BillenGED AdministratorFederated States of Micronesia
National GovernmentP.O. Box PS 87, Palikir StationPalikir, Pohnpei, FM 96941Tel: 011 (691) 320-2647Fax: 011 (691) 320-5500E-mail: [email protected]
TENNESSEEMs. Phyllis PardueGED AdministratorTennessee Department of Labor and
Workforce Development11th Floor, Davy Crockett Tower500 James Robertson ParkwayNashville,TN 37245Tel: (615) 741-7054; (615) 532-5057Fax: (615) 532-4899E-mail: [email protected]
TEXASDr.Walter H.TillmanManager III for Continuing EducationTexas Education AgencyWilliam B.Travis Building1701 North Congress AvenueAustin,TX 78701Tel: (512) 463-9292Fax: (512) 305-9493E-mail: [email protected]
UTAHMr. Murray MeszarosGED AdministratorAdult Education ServicesUtah State Office of Education250 East 500 SouthP.O. Box 144200Salt Lake City, UT 84114-4200Tel: (801) 538-7870Fax: (801) 538-7868E-mail: [email protected]
VERMONTMs. Bari GladstoneVermont GED AdministratorCareer and Workforce DevelopmentVermont State Department of Education120 State StreetMontpelier, VT 05620-2501Tel: (802) 828-3132Fax: (802) 828-3146E-mail: [email protected]
VIRGINIAMr. Robert MacGillivrayGED AdministratorVirginia Office of Adult EducationDepartment of EducationP.O. Box 2120Richmond,VA 23218-2120Tel: (804) 371-2333Fax: (804) 786-7243E-mail: [email protected]
WASHINGTONMs.Alleyne BruchState GED AdministratorState Board for Community and
Technical Colleges319 7th Avenue, P.O. Box 42495Olympia,WA 98504-2495Tel: (360) 664-0288Fax: (360) 664-8808E-mail: [email protected]

39
20
01
GE
D S
tati
sti
ca
l R
ep
ort
NORTHERN MARIANA ISLANDSMs. Fe Y. CalixterioABE Director/GED AdministratorNorthern Marianas CollegeP.O. Box 501250,As Terlaje CampusCommonwealth of Northern
Mariana IslandsSaipan, MP 96950Tel: 011 (670) 234-5498Fax: 011 (670) 235-4940E-mail: [email protected]
PALAUMr. Paulino EriichGED AdministratorMinistry of EducationBureau of Curriculum & InstructionP.O. Box 189Koror, PW 96940Tel: 011 (680) 488-5452Fax: 011 (680) 488-2830
PUERTO RICOMrs. Myrna Gonzalez VazquezGED AdministratorAdministration Adult Education ServicesDepartment of EducationP.O. Box 190759San Juan, PR 00919-0759Tel: (787) 765-3972, ext. 4567Fax: (787) 765-3972; 282-6312E-mail: [email protected]
VIRGIN ISLANDSMs.Anna L. LewisDirector and GED AdministratorState Office of Vocational-Technical and
Adult EducationDepartment of EducationSt.Thomas,VI 00802Tel: (340) 776-3484Fax: (340) 776-3488E-mail: [email protected]
DANTESMr. Steve BeckmanDANTES AdministratorAttention: Code 20B6490 Saufley Field RoadPensacola, FL 32509-5243Tel: (850) 452-1089Fax: (850) 452-1160E-mail: [email protected]
FEDERAL PRISONSMr. Perry AyalaEducation SpecialistFederal Bureau of PrisonsDepartment of Justice320 First Street NW, Room 7026Washington, DC 20534Tel: (202) 305-3810Fax: (202) 305-7363E-mail: [email protected]
INTERNATIONALMs. Dana ReederAccount ManagerPrometric1100 Lancaster StreetBaltimore, MD 21202Tel: (443) 923-6405Fax: (443) 923-8569E-mail: [email protected]
NORTHWEST TERRITORIESMs. Bonnie KoslowskiGED AdministratorEducation, Culture and DevelopmentLahm Ridge Tower, 2nd FloorFranklin AvenueYellowknife, NT X1A 2L9Tel: (867) 920-8939Fax: (867) 873-0338E-mail: [email protected]
NOVA SCOTIAMs. Jean Fiona SmythManager, Development,Adult EducationNova Scotia Department of Education2021 Brunswick Street, P.O. Box 578Halifax, NS B3J 2S9Tel: (902) 424-5162Fax: (902) 424-0666E-mail: [email protected]
ONTARIOMr. Ronald PellandGED Administrator and Chief ExaminerIndependent Learning CentreMinistry of Education20 Bay Street, Suite 300 Toronto, ON M5J 2W1Tel: (416) 325-6512Fax: (416) 325-3383E-mail: [email protected]
PRINCE EDWARD ISLANDMs. Barbara MacnuttDepartment of Education16 FitzroyP.O. Box 2000Charlottetown, PE C1A 7N8Tel: (902) 368-6286Fax: (902) 368-6144E-mail: [email protected]
QUEBECMr. Marc LeducGED Administrator1035 De LaChevrotiere, 17th FloorQuebec, QC G1R 5A5Tel: (418) 646-8363Fax: (418) 528-7454E-mail: [email protected]
SASKATCHEWANMr. Ernie LipinskiGED AdministratorSaskatchewan Post-Secondary Education and
Skills Training2151 Scarth Sreet, Room 410Regina, SK S4P 3V7Tel: (306) 787-8131Fax: (306) 787-7182E-mail: [email protected]
YUKON TERRITORYMs. Shelagh BeairstoDean, Developmental StudiesYukon CollegeP.O. Box 2799Whitehorse,YT Y1A 5K4Tel: (867) 668-8741Fax: (867) 668-8828E-mail: [email protected]
MICHIGAN PRISONSMs. Diane SpenceEducation DirectorMichigan Department of CorrectionsGrand View PlazaP.O. Box 30003, 206 East Michigan AvenueLansing, MI 48909Tel: (517) 373-3642Fax: (517) 373-8776E-mail: [email protected]
ALBERTAMr. Ross NewtonGED AdministratorLearner Assessment Branch,Alberta Learning11160 Jasper Avenue, P.O. Box 43Devonian Building,West TowerEdmonton,AB T5K 0L2Tel: (780) 427-0010Fax: (780) 422-4889E-mail: [email protected]
BRITISH COLUMBIAMs. Caroline PonsfordA/Manager, Student Certification Ministry
of EducationBox 9886 STN PROV GOVTUPS/FEDEX: BC Mail Plus 615 Discovery
Street,V8T 5G4Victoria, BC V8W 9T6Tel: (250) 356-8133Fax: (250) 356-0277E-mail: [email protected]
MANITOBAMr. Mark GavardCoordinator and GED AdministratorDistance Delivery Unit555 Main StreetWinkler, MB R6W 1C4Tel: (204) 325-1711Fax: (204) 325-1719E-mail: [email protected]
NEW BRUNSWICK (ENGLISH)Mr. Richard CoreyDirector, College ServicesDepartment of EducationP.O. Box 6000500 Beaverbrook Court, Fifth FloorFredericton, NB E3B 5H1Tel: (506) 453-2000Fax: (506) 444-4960E-mail: [email protected]
NEW BRUNSWICK (FRENCH)Mr. Bernard-Marie TheriaultDirector, College ServicesDepartment of EducationP.O. Box 6000500 Beaverbrook Court, Fifth FloorFredericton, NB E3B 5H1Tel: (506) 453-8237Fax: (506) 444-4960E-mail: [email protected]
NEWFOUNDLANDMs. Marian FushellGED Administrator and Chief ExaminerEvaluation,Testing and CertificationDepartment of EducationP.O. Box 8700St. John’s, NF A1B 4J6Tel: (709) 729-4310Fax: (709) 729-3669E-mail: [email protected]

40
20
01
GE
D S
tati
sti
ca
l R
ep
ort
Jane ArabianAssistant Director, Enlistment
Standards PolicyOffice of the Assistant Secretary of Defense,
Force Management Policy (MPP) APWashington, DC
Allyn Sue BarkerVice President for Economic and
Community DevelopmentSouthern West Virginia Community and
Technical CollegeMount Gay,WV
Hans BosSenior Research AssociateManpower Demonstration Research
CorporationSan Francisco, CA
Patricia Bennett**GED AdministratorMaryland State Department of EducationBaltimore, MD
Ryan ChampeauHigh School PrincipalNational Association of Secondary School
PrincipalsWaukesha,WI
Marian FushellGED Administrator and Chief ExaminerDepartment of EducationSt. John’s, Newfoundland, Canada
Roy EricksonDirector, Justice Education ProgramCenter for Civic EducationFair Oaks, CA
Gary A. EyrePresidentAdvance Associates & ConsultantsPhoenix,AZ
Robert MacGillivray**GED AdministratorVirginia Office of Adult EducationDepartment of EducationRichmond,VA
Thomas MacLellanPolicy AnalystNational Governors AssociationWashington, DC
Wayne H. MartinDirectorState Education Assessment CenterCouncil of Chief State School OfficersWashington, DC
G. David MasseyDirectorAdult Education and LiteracyDepartment of Public InstructionBismarck, ND
Amaate Neil**GED AdministratorUniversity of the District of ColumbiaGED Office, Lower LevelWashington, DC
James W. RumplerDepartment HeadEducation ProgramsDANTESPensacola, FL
Tony PeytonPolicy SpecialistNational Center for Family LiteracyLouisville, KY
Anthony Sarmiento*Executive DirectorNational Senior Citizens Education and
Resource CenterSilver Spring, MD
Leatricia WilliamsProgram DirectorAdult Education and GEDFlorida Department of EducationTallahassee, FL
Kwok-Sze Richard WongExecutive DirectorAmerican School Counselor AssociationAlexandria,VA
Staff OfficerJoan Chikos AuchterExecutive DirectorGED Testing Service
* Chair** Ex-Officio
American Council onEducation Governing BodiesGED ADVISORY COMMITTEE

41
20
01
GE
D S
tati
sti
ca
l R
ep
ort
Terms Ending June 30, 2002Mercy CooganDirector, Public RelationsGallaudet University
Ernest L. HollowayPresidentLangston University
John L. LaheyPresidentQuinnipiac University
Gail O. MellowPresidentLaGuardia Community College
Richard R. RushPresidentCalifornia State University, Channel Islands
Beverly SimonePresidentMadison Area Technical College
Terms Ending June 30, 2003Elnora DanielPresidentCalifornia State University, Channel Islands
Mark B. DreyfusPresidentECPI College of Technology
Phyllis EisenExecutive DirectorNational Association of Manufacturers
Thomas A. FlintVice President for Lifelong LearningCouncil for Adult and Experiential Learning
Diane LampeVice President for Academic CounselingUniversity of Maryland University College
Harmon LisnowExecutive DirectorUSWA/Institute for Career Development
Scott D. MillerPresidentWesley College
Paula PeinovichExecutive Vice President and ProvostWalden University
Kevin Reilly*ChancellorUniversity of Wisconsin-Extension
Charles RuchPresidentBoise State University
Patricia M. RyanPresidentHarcum College
Terms Ending June 30, 2004Fred GaskinChancellorMaricopa County Community College
David M. GippPresidentUnited Tribes Technical College
Mamie Howard GolladayPresidentSullivan County Community College
Sebetha JenkinsPresidentJarvis Christian College
Sheila KaplanPresidentMetropolitan State College of Denver
Arthur F. Kirk Jr.PresidentSaint Leo University
Harold L. MartinChancellorWinston-Salem State University
Patricia A. McGuirePresidentTrinity College
Carl V. PattonPresidentGeorgia State University
Ricardo RomoPresidentUniversity of Texas at San Antonio
Ned J. SifferlenPresidentSinclair Community College
Ex-OfficioNina OmelchenkoVice President for University ServicesUniversity of Phoenix
Anthony SarmientoExecutive DirectorNational Senior Citizens Education and
Resource Center
Jerome H. SullivanExecutive DirectorAmerican Association of Collegiate
Registrars and Admissions Officers
Staff OfficerSusan Porter RobinsonVice President and DirectorCenter for Adult Learning and
Educational Credentials
* Chair
COMMISSION ON ADULT LEARNING AND EDUCATIONAL CREDENTIALS

42
20
01
GE
D S
tati
sti
ca
l R
ep
ort
OfficersAugustine P. GallegoChair
William E.TrouttVice Chair/Chair-elect
Janet L. HolmgrenImmediate Past Chair
James A. HefnerSecretary
David Ward, PresidentAmerican Council on Education
Class of 2002Nancy S. DyePresidentOberlin College
Wayne E. GilesChancellorMetropolitan Community Colleges, MO
James A. HefnerPresidentTennessee State University
Janet L. HolmgrenPresidentMills College
Anne H. HopkinsPresidentUniversity of North Florida
William E. KirwanPresidentThe Ohio State University
Michael S. McPhersonPresidentMacalester College
Peggy R.WilliamsPresidentIthaca College
Class of 2003Scott S. CowenPresidentTulane University
Norman C. FrancisPresidentXavier University
Augustine P. GallegoChancellorSan Diego Community College District
Zelema M. HarrisPresidentParkland College
Robert E. HemenwayChancellorUniversity of Kansas
M. Lee PeltonPresidentWillamette University
Steven B. SamplePresidentUniversity of Southern California
Marlene SpringerPresidentCollege of Staten Island
Class of 2004Max CastilloPresidentUniversity of Houston-Downtown
Mary Sue ColemanPresidentUniversity of Iowa
Judith L. KuipersPresidentFielding Graduate Institute
Ronald Mason Jr.PresidentJackson State University
Joseph J. McGowanPresidentBellarmine University
Piedad F. RobertsonPresident/SuperintendantSanta Monica College
William E.TrouttPresidentRhodes College
J.William WenrichChancellorDallas County Community College
Elected Officers of AssociationsEx-Officio for Three-Year TermsAmerican Association of Community
CollegesCarolyn WilliamsPresidentBronx Community College
American Association of State Collegesand Universities
David G. CarterPresidentEastern Connecticut State University
Association of American Colleges andUniversities
Thomas F. FlynnPresidentMillikin University
Association of American UniversitiesFrancis L. LawrencePresidentRutgers,The State University of NJ
Association of Catholic Colleges andUniversities
Thomas Scanlan, FSCPresidentManhattan College
Association of Jesuit Colleges and Universities
Edward Glynn, S.J.PresidentJohn Carroll University
Council of Independent CollegesRichard A. DetweilerPresidentHartwick College
National Association for Equal Opportunity in Higher Education
John T. GibsonPresidentAlabama A&M University
National Association of IndependentColleges and Universities
Lawrence J. DeNardisPresidentUniversity of New Haven
National Association of State Universitiesand Land-Grant Colleges
Lattie F. CoorPresidentArizona State University
Elected Officers of AssociationsEx-Officio for One-Year TermsAmerican Association for Teacher
EducationLouis A. Castenell Jr.Dean, College of EducationUniversity of Georgia
League for Innovation in the Community College
Mark D. MillironPresident and Chief Executive OfficerLeague for Innovation in the Community
College
Washington Higher Education Secretariat
Debra W. StewartPresidentCouncil of Graduate Schools
ACE BOARD OF DIRECTORS

43
20
01
GE
D S
tati
sti
ca
l R
ep
ort
Front Row (left to right): Charles Bedore, Director, Program Operations; Kim Mullin,Administrative Assistant; Juliana Jones, Federal Contracts Coordinator; Joan ChikosAuchter, Executive Director; George Anderson, Customer Service and Federal ContractManager; Kati Niemi, Customer Service Manager.
Second Row (left to right): Sen Qi, Policy and Research Analyst; Patricia Jones, Manager,Partner Outreach;Tara Gross, Customer Service Assistant; David Kuhn, Science TestSpecialist; Kyle Malone, Field Service Manager; Pamela Hall,Administrative Assistant;Mary Grace Snyder, Reading Test Specialist;Anna Jones, Customer Service Coordina-tor; Zenitta Jones, Special Projects Manager.
Third Row (left to right): Debra Louallen-Cole,Test Development Manager; Lyn Schaefer,Director,Test Development; David Messersmith, Manager, Information Technology;Joyce D. Hoover, Social Studies Test Specialist; Cassandra Alston Cook, Program Coordi-nator; Kenn Pendleton, Mathematics Test Specialist.
Fourth Row (left to right): Cherryl Donahue, Information Technology Coordinator;AdoraBeard, Project Manager, Psychometrics; Carol George, Manager, Psychometrics; JohnReier,Writing Test Specialist; Ben Justesen, Director, Special Projects; Mario Payne,Manager, GED Options Program.
Not pictured: Judy Allen, Production Manager; Fred Edwards, Director, Partner Outreach;Jocelyn Jolley, Program Manager;Timothy E. Lara, Production Coordinator; RodolfoMason, Materials Management Coordinator; Chhaya Rao, Editorial Project Manager;Cheryl Roberts, Client Services Coordinator.
GEDTS Staff

44
20
01
GE
D S
tati
sti
ca
l R
ep
ort
Selected GED Publications
Who Took the GED? GED 2000 Annual Statistical Report (2001) $15.00; Item 250700.Who Took the GED? GED 1999 Annual Statistical Report (2000) $10.00; Item 250799.Who Took the GED? GED 1998 Annual Statistical Report (1999) $10.00; Item 250798.Who Took the GED? GED 1997 Annual Statistical Report (1998) $10.00; Item 250797.Who Took the GED? GED 1996 Annual Statistical Report (1997) $5.00; Item 250796.Who Took the GED? GED 1995 Annual Statistical Report (1996) $5.00; Item 250795.Who Took the GED? GED 1994 Annual Statistical Report (1995) $5.00; Item 250794.Who Took the GED? GED 1993 Annual Statistical Report (1994) $5.00; Item 250793.GED 1992 Annual Statistical Report (1993) $5.00; Item 250792.GED 1991 Annual Statistical Report (1992) $5.00; Item 250791.GED 1990 Annual Statistical Report (1991) $5.00; Item 250790.GED 1989 Annual Statistical Report (1990) $5.00; Item 250789.GED Annual Statistical Report Set: 1980–1988 $105.00; Item 250780–88.
Alignment of National and State Standards:A Report by the GED Testing Service (1999) $22.99; K.Woodward, editor; Item 261418.Compares national and state secondary school standards in the four core academic areas.This report informs educators and thepublic about the new GED Tests scheduled for release in January 2002 and synthesizes the standards in each discipline. Includes anExecutive Summary, also available online at http://www.gedtest.org.
The Literacy Proficiencies of GED Examinees: Results from the GED-NALS Study (1996) $20.00; Baldwin, J., Kirsch, I., Rock, D.,and Yamamoto, K.; Item 250802.Presents findings about the literacy proficiencies of adults who take the GED Tests as compared to others evaluated in theNational Adult Literacy Survey.The report also explores the skills measured in common by the GED Tests and the National AdultLiteracy Survey scale.
GED Profiles:Adults in Transition 1990–1994 (1990) $55.00; Item 250706.Seven policy-relevant research reports, based on a 1989 survey of GED candidates, cover a range of findings related to educationalbackground and goals; employment status; demographic, economic, and social factors; and performance of GED candidates.
ACE Fulfillment Service— (301) 632-6758Official GED Testing Service Web Site—http://www.gedtest.org