2001 Calgary Region EXTERNAL TRUCK SURVEY STUDY
15
EXTERNAL TRUCK SURVEY STUDY Forecasting Division November 2001 2001 Calgary Region
Transcript of 2001 Calgary Region EXTERNAL TRUCK SURVEY STUDY

EXTERNALTRUCK SURVEY
STUDY
Forecasting DivisionNovember 2001
2001 Calgary Region

12001 Calgary Region External Truck Survey Study
1.0 Introduction
The External Truck Survey was undertaken, in the Fall 2000, to obtain information onthe movement of goods to and from the Calgary Region. This survey supplements amore extensive survey of commodity flow conducted within Calgary and region, from2000 October to 2001 January.
The external survey was administered at 16 different highway locations toapproximately 5,000 trucks. Truck traffic in both directions of travel was surveyedduring the hours of 8:00 a.m. to 4:00 p.m. The surveys were supplemented with 24hour vehicle classification counts. Approximately 77% of all truck drivers wereinterviewed during the survey period.
The study was designed and administered in association with Alberta Transportationand the City of Calgary.
2.0 Survey Methodology
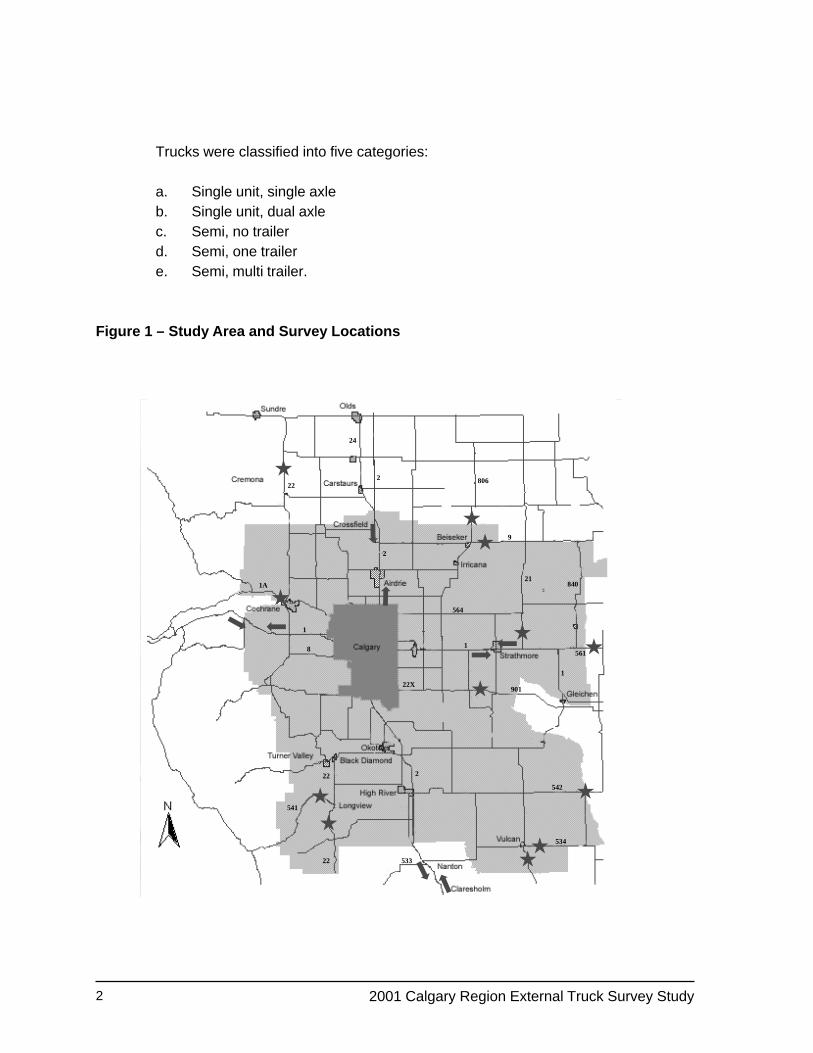
The survey was administered via an interview with a stopped truck driver. Truckswere pulled off the highway into vehicle inspection stations, rest areas, or other areasdeemed by Alberta Transportation to be safe for the survey activities. All signing andenforcement was handled by Inspection Service of Alberta Transportation. Figure 1shows the region with the interview locations.
The survey form (Appendix A) obtained information on:
• type of truck• truck information (type, # axles, GVW)• occupancy• ownership (owned, leased, for hire)• origin(today’s and original)• destination(today’s and final)• commodity quantity and value• stops(location, reason, commodity/amount/value delivered/picked up).
The interview required between 60-90 seconds to administer. Lost time for trucksincluding deceleration from and acceleration to the highway was approximately 8-12minutes.
2 2001 Calgary Region External Truck Survey Study
Trucks were classified into five categories:
a. Single unit, single axleb. Single unit, dual axlec. Semi, no trailerd. Semi, one trailere. Semi, multi trailer.
Figure 1 – Study Area and Survey Locations
22
22 2
22X
1A
1
1
9
21
901
542
22
533
534
541
840
1
2
24
2
564
8
806
561

32001 Calgary Region External Truck Survey Study
Table 1 shows the completed interviews for each survey location. Approximately 77%of all truck drivers were interviewed during the survey period.
Table 1: Survey Completions (8:00 AM to 4:00 PM)
Highway Locations Completed Interviews
TCH East 700TCH West 6321A 1232 South 5322 North 1,5979 13321 17322 South 9722 North 16023 204534 39541 253542 30561 59806 114901 123Total 4,969
Completion Rate 76.9%
TCH: Trans Canada Highway

4 2001 Calgary Region External Truck Survey Study
3.0 Survey Results
3.1 Total Number of Trips on Highways
The total number of trucks inbound to and outbound from the Calgary region is13,360 vehicles/day. The primary highways (Highway 2 North and South, andTrans Canada Highway East and West) accounted for 70% of the trucks on thehighway system. Highway 2 North accounted for one third of all the trucksreflecting the link it provides between the two largest urban centres in Alberta –Calgary and Edmonton.
Table 2: 24 Hour Truck Volumes
Highway Location Vehicles
1A 23421 48922 North 33722 South 45723 5172 North 4,5312 South 1,416534 77541 566542 66561 191806 3049 326901 380TCH East 1,870TCH West 1,599
Total 13,360
Figure 2 shows the distribution of trucks by time of day. Unlike urban road systemswhere there is a distinctive peak hour, either in the AM or PM peak periods, trucktravel on the highway system does not have a high peak hour and the profiles forinbound/outbound are very similar.

52001 Calgary Region External Truck Survey Study
Figure 2 – Distribution of External Trucks by Time of Day
For inbound truck traffic the peak hour is 2:00 PM to 3:00 PM with 3.0% of the truckswhile the outbound peak hour is 11:00 AM to 12:00 Noon with 3.4% of the trucks.
Table 3 shows the total number of trucks by type for the 8 hour and 24 hour periods.Nearly 50% of trucks of the 24 hour truck volume occurs between the hours of 8:00AM and 4:00 PM. Although over 70% of the trucks on the highway system are semitrailer trucks, these units have the lowest percentage occurring between 8:00 AM and4:00 PM. This may be due to a desire to travel during periods of less congestion.
Table 3: Trucks types by Time Period
Time Period (8:00 AM ~ 4:00 PM) 24 Hour RateVehicle Type (8hour/24hour)
Single Axle, Single Unit 914 1,396 65.4%Dual Axle, Single Unit 1,081 2,136 50.6%Semi, No Trailer 91 200 45.5%Semi, One Trailer 3,069 6,400 47.9%Semi, Multi Trailer 1,285 3,228 39.8%Total 6,440 13,360 48.2%
0.0
0.5
1.0
1.5
2.0
2.5
3.0
3.5
4.0
1 2 3 4 5 6 7 8 9 10 11 12 13 14 15 16 17 18 19 20 21 22 23 24
Time of Day (Hours)
%
OUTBOUND INBOUND
6 2001 Calgary Region External Truck Survey Study
3.2 Distribution Patterns for Truck Trips
The survey recorded truck origins and destinations based on today’s travel andalso based on the original/final origin and destination. These can be distinguishedas follows:
Today’s origin/destination:
This records where the truck was located at the start of the survey day (origin)and at the end of the day (destination). It is possible for todays origin anddestination to be the same. This occurs for a truck that starts the day at a businessin Calgary or a town in the region and ultimately returns after deliveries at theend of the day. The truck driver in this case would provide the stop(s) made onthe trip and these stops would be recorded on the survey form.
Original origin/ Final destination:
For a long distance truck this information provides where the trip began andwhere it will ultimately end. Therefore as an example a truck may have an originalorigin of Toronto and a final destination of Seattle.
Again, it is possible for this origin and destination to be the same. An example ofthis is a truck that started at a business located in the study area (Calgary,Airdrie, High River etc.) and makes a delivery to an out of region location(eg. Edmonton, Lethbridge, Canmore etc.) and returns to its origin by the end ofday. The survey will have the same location name in both origin and destinationcategories with the stop locations, for deliveries and pickups documented.
Table 4 provides the distribution of trucks based on today’s origin anddestination.
The areas are defined as follows:
1. Calgary includes the area within Calgary corporate limits.2. Calgary Region (excluding Calgary) includes the Municipal District of Rocky
View and Foothills, part of the County of Vulcan (to Vulcan), and the Countyof Wheatland ( to Standard). (see Figure 1)
3. Edmonton region includes the City of Edmonton, all cities/towns in thevicinity (eg. Sherwood Park, Leduc, Fort Saskatchewan etc) and Nisku.

72001 Calgary Region External Truck Survey Study
4. Rest of Alberta represents the balance of the Province not included in theabove previously defined areas.
5. Rest of Canada excludes British Columbia, Saskatchewan and Manitobawhich are aggregated seperatlely.
The objective was to interview truck drivers at the perimeter of the study areacordon. However, for reasons of safety, some of the survey locations had to belocated within the study area. As an example the weigh station for Highway 2North is located south of Airdrie, however a location closer to Crossfield wouldhave been more desirable. The consequence of this is the reader will noticesome trucks have origins in Calgary and destinations in the regional study area,and vice versa. This is a result of survey locations and does not represent thetotal of intra-regional truck trips. The larger Commodity Flow survey will providea more complete picture of these trips.
Table 4 shows that about 49% of the trucks on the highway system originate orwere destined to Calgary or Calgary Region, and nearly one third of all trucksoriginate or are destined to locations in the Rest of Alberta. Overall 77% of thetrucks on the highway system are involved in the movements of goods withinthe Province of Alberta.
On an average day 1714 trucks from Calgary and 791 trucks from the CalgaryRegion are round tripping. This indicates the role these locations are playing asdistribution centres to surrounding areas as near as Canmore and as far asEdmonton.
CALGARY CALGARY EDMONTON REST BRITISH SASK REST UNITED
ORIGIN REGION REGION ALBERTA COLUMBIA MNTBA CANADA STATES TOTAL
CALGARY 1714 366 453 1318 349 275 17 116 4608
CALGARY REGION 99 791 30 777 41 46 11 36 1831
EDMONTON REGION 465 52 158 170 38 19 . 57 959
REST OF ALBERTA 1254 666 165 1766 209 88 10 80 4238
BRITISH COLUMBIA 485 20 49 100 50 170 30 7 911
REST OF CANADA 14 . . 3 17 . . . 34
SASK AND MANITOBA 310 31 16 57 113 17 . 6 550
UNITED STATES 61 26 66 51 13 4 . 8 229
TOTAL 4402 1952 937 4242 830 619 68 310 13360
DESTINATION
Table 4: Todays Origin/Destination for Trucks

8 2001 Calgary Region External Truck Survey Study
Outside of Alberta, the adjacent provinces of British Columbia and Saskatchewanare the largest origin/destination areas followed by the United States.Approximately 2400 (18%) of all trucks pass through Calgary and region withoutstopping
Although the movement of goods from the Rest of Canada to Calgary is relativelysmall it must be remembered that the rail system also plays a significant role ingoods movement and Calgary is the location of major intermodal rail terminals.
Table 5 shows original origin and final destination truck table. This table furtheremphazises the role of Calgary and the Calgary Region in the distribution ofgoods. Table 5 shows that 25% (3324) of the trucks were actually based inCalgary and 11% (1405) were based in the Calgary Region. This representstrucks that are travelling outside the Calgary area for more than one day that willeventually be returning to Calgary.
Table 5: Original Origin and Final Destination of Trucks
CALGARY CALGARY EDMONTON REST OF BRITISH SASK AND REST OF UNITED TOTAL
ORIGIN REGION REGION ALBERTA COLUMBIA MANITOBA CANADA STATES
CALGARY 3324 83 117 283 195 160 43 121 4326
CALGARY REGION 72 1405 24 160 21 40 15 23 1760
EDMONTON REGION 90 17 555 71 61 35 8 95 932
REST OF ALBERTA 260 117 91 2643 118 89 12 134 3464
BRITISH COLUMBIA 301 9 87 85 315 205 106 55 1163
SASK AND MANITOBA 135 19 42 39 106 336 . 60 737
REST OF CANADA 71 . 22 31 158 15 71 26 394
UNITED STATES 103 4 179 33 40 19 13 193 584
TOTAL 4356 1654 1117 3345 1014 899 268 707 13360
DESTINATION
Of special interest is the trade corridor between the United States and Alberta.Table 5 indicates that 584 trucks have an original origin in the United States.The following summarizes the percentage distribution of trucks from the UnitedStates, to the highways accessing the Calgary region:
Highway 2 South 27.3%Highway 22 South 23.0%Highway 23 South 22.4%Highway 1 East 24.8%Highway 1 West 2.5%
100%

92001 Calgary Region External Truck Survey Study
3.3 Truck Modal Split/ Occupancy
Table 6 shows the percent of trucks of all vehicles (truck modal split) by eachhighway location. Overall trucks comprise over 15% of all vehicles on the highwaysystem. The primary highways have truck percentages ranging from 22.3% (TCHEast) to 9.7% (TCH West). The table shows that a number of the secondaryhighways – 21, 22 South, 23 South, 541, 806 and 901 - have truck percentagesexceeding 20%.
Table 6: Percent Trucks of All Vehicles
Highway Location Modal Split (%)
TCH East 22.3TCH West 9.71A 6.52 North 13.52 South 18.89 19.421 33.122 North 10.722 South 24.623 South 27.2534 10.3541 45.1542 13.6561 14.3806 20.0901 31.5Average for All Locations 15.3%
10 2001 Calgary Region External Truck Survey Study
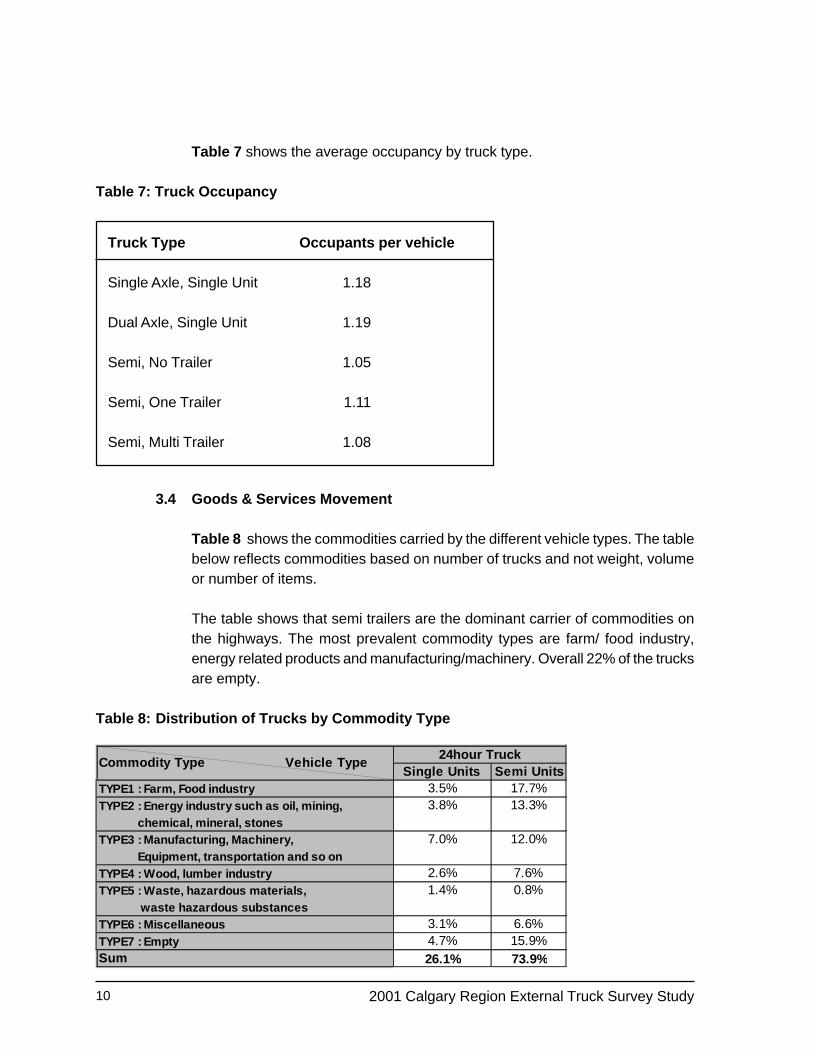
Table 7 shows the average occupancy by truck type.
Table 7: Truck Occupancy
3.4 Goods & Services Movement
Table 8 shows the commodities carried by the different vehicle types. The tablebelow reflects commodities based on number of trucks and not weight, volumeor number of items.
The table shows that semi trailers are the dominant carrier of commodities onthe highways. The most prevalent commodity types are farm/ food industry,energy related products and manufacturing/machinery. Overall 22% of the trucksare empty.
Table 8: Distribution of Trucks by Commodity Type
Single Units TYPE1 : Farm, Food industryTYPE2 : Energy industry such as oil, mining,
TYPE3 : Manufacturing, Machinery,
TYPE5 : Waste, hazardous materials,
TYPE6 : MiscellaneousTYPE7 : EmptySum
waste hazardous substances
chemical, mineral, stones
TYPE4 : Wood, lumber industry Equipment, transportation and so on
Commodity Type Vehicle Type24hour Truck
Semi Units3.5% 17.7%3.8% 13.3%
7.0% 12.0%
2.6% 7.6%1.4% 0.8%
3.1% 6.6%4.7% 15.9%26.1% 73.9%
Truck Type Occupants per vehicle
Single Axle, Single Unit 1.18
Dual Axle, Single Unit 1.19
Semi, No Trailer 1.05
Semi, One Trailer 1.11
Semi, Multi Trailer 1.08

112001 Calgary Region External Truck Survey Study
3.5 Truck Ownership
Table 9 shows that nearly 61% of total trucks are owned by the companiesproducing goods being shipped and 25% of trucks are owned by a differentcompany or driver.
Table 9: Distribution of Truck Ownership
Ownership 24 HourVehicle %
Owned by company producing goods being shipped 8,146 60.9
Leased and operated by company producing 1,822 13.6
goods being shipped
For Hire: Owned by a different company or driver 3,392 25.4
4.0 Conclusion
Trucks are critical to the economic vitality of urban centres. They distribute goodsproduced by industries and supply the materials to maintain production activities.Planning infrastructure for goods movement on the external highway system requiresknowledge of the types of trucks and the origin destination patterns of these trucks.Although the highway system serves interprovincial and international goods movement,the external truck study showed the trucks on the Calgary region highway system areprimarily involved in the movement of goods within Alberta.

12 2001 Calgary Region External Truck Survey Study
5.0 Appendix
5.1 Survey FormLocation:Interviewer: Page #:
Direction: Direction:
Time: Time:
Truck Type Truck Type
# Axles: # Axles:
Gross Vehicle Weight(kg): Gross Vehicle Weight(kg):
Occupancy Occupancy
Vehicle Ownership:� Owned by company producing
Goods being shipped� Leased and operated by company
Producing goods being shipped� For HIRE: Owned by a different company or driver
Vehicle Ownership:� Owned by company producing
Goods being shipped� Leased and operated by company
Producing goods being shipped� For HIRE: Owned by a different company or driver
Today’s Origin: Today’s Origin:
Today’s Destination Today’s Destination
Original Origin: Original Origin:
Final Destination: Final Destination:
Commodities Carried at point of interviewCommodity Quantity $ Value
Commodities Carried at point of interviewCommodity Quantity $ Value
Stop Section : Fill Out for Each Vehicle Stop made inCalgary and Region or Planned to be in Calgary andRegion
Stop Section : Fill Out for Each Vehicle Stop made inCalgary and Region or Planned to be in Calgary andRegion
Stop1:Location of Stop:Reason for Stop:Arrival time:Departure Time:Commodity Delivered:Quantity Delivered:Value of commodity Delivered:Commodity Picked Up:Quantity Picked Up:$ Value of Commodity Picked Up
Stop1:Location of Stop:Reason for Stop:Arrival time:Departure Time:Commodity Delivered:Quantity Delivered:Value of commodity Delivered:Commodity Picked Up:Quantity Picked Up:$ Value of Commodity Picked Up
Stop2:Location of Stop:Reason for Stop:Arrival time:Departure Time:Commodity Delivered:Quantity Delivered:Value of commodity Delivered:Commodity Picked Up:Quantity Picked Up:$ Value of Commodity Picked Up
Stop2:Location of Stop:Reason for Stop:Arrival time:Departure Time:Commodity Delivered:Quantity Delivered:Value of commodity Delivered:Commodity Picked Up:Quantity Picked Up:$ Value of Commodity Picked Up

132001 Calgary Region External Truck Survey Study
5.2 Vehicle Types
Single unit, single axle:
Single unit, dual axle:
Semi, no trailer:
Semi, one trailer:
Semi, multi-trailer: