2001 Annual Report
100
2001 Annual Report 2001 was an extraordinary year, a year of tests around the globe: Investors faced turbulent markets; businesses encountered many challenges; consumer confidence ebbed with the economy. And in the United States, a moment of history shook—and then strengthened—our collective resolve. At Lehman Brothers, we faced these tests and passed them. We confirmed that our strategy works, in good times and bad. We remain strong, focused and determined to be the best operator in the marketplace. Together with our clients, we continue to build vision.
Transcript of 2001 Annual Report

2001 Annual Report
2001 was an extraordinary year, a year of tests around the globe: Investors faced turbulent
markets; businesses encountered many challenges; consumer confidence ebbed with the
economy.And in the United States, a moment of history shook—and then strengthened—our
collective resolve. At Lehman Brothers, we faced these tests and passed them. We confirmed
that our strategy works, in good times and bad. We remain strong, focused and determined to
be the best operator in the marketplace. Together with our clients, we continue to build vision.
CONTENTS X
Financial Highlights 1
Letter to Stockholders and Clients 2
The Year in Review 10
Financial Review 37
Board Members and Officers 95
Locations Worldwide 95
Other Stockholder Information 961997 1998 1999 2000 2001
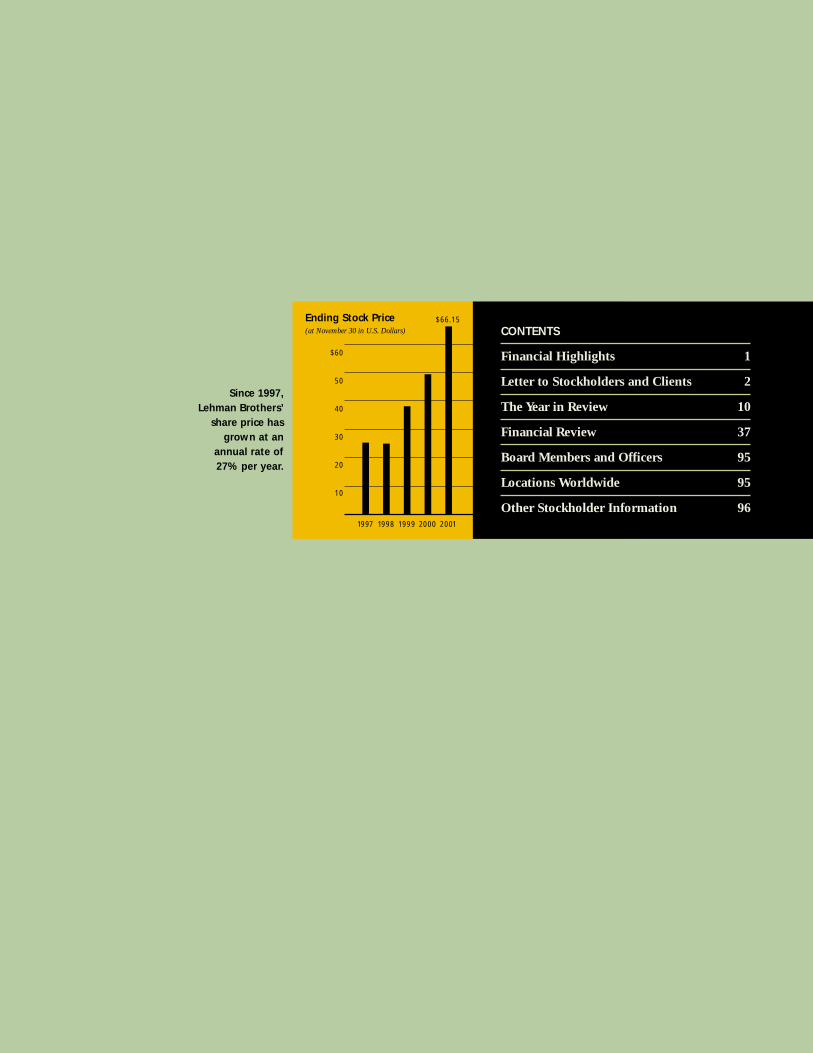
Ending Stock Price(at November 30 in U.S. Dollars)
Since 1997, Lehman Brothers’
share price has grown at an
annual rate of 27% per year.
$60
50
40
30
20
10
$66.15
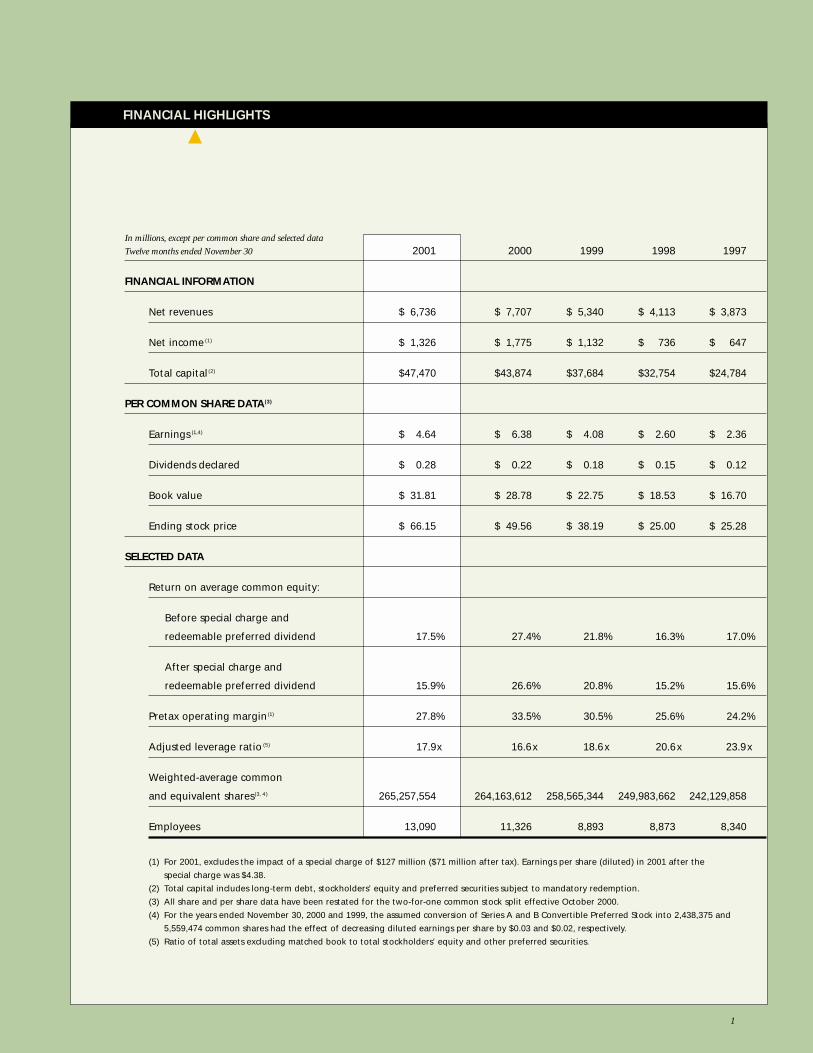
In millions, except per common share and selected data
Twelve months ended November 30 2001 2000 1999 1998 1997
FINANCIAL INFORMATION
Net revenues $ 6,736 $ 7,707 $ 5,340 $ 4,113 $ 3,873
Net income (1) $ 1,326 $ 1,775 $ 1,132 $ 736 $ 647
Total capital(2) $47,470 $43,874 $37,684 $32,754 $24,784
PER COMMON SHARE DATA(3)
Earnings (1,4) $ 4.64 $ 6.38 $ 4.08 $ 2.60 $ 2.36
Dividends declared $ 0.28 $ 0.22 $ 0.18 $ 0.15 $ 0.12
Book value $ 31.81 $ 28.78 $ 22.75 $ 18.53 $ 16.70
Ending stock price $ 66.15 $ 49.56 $ 38.19 $ 25.00 $ 25.28
SELECTED DATA
Return on average common equity:
Before special charge and
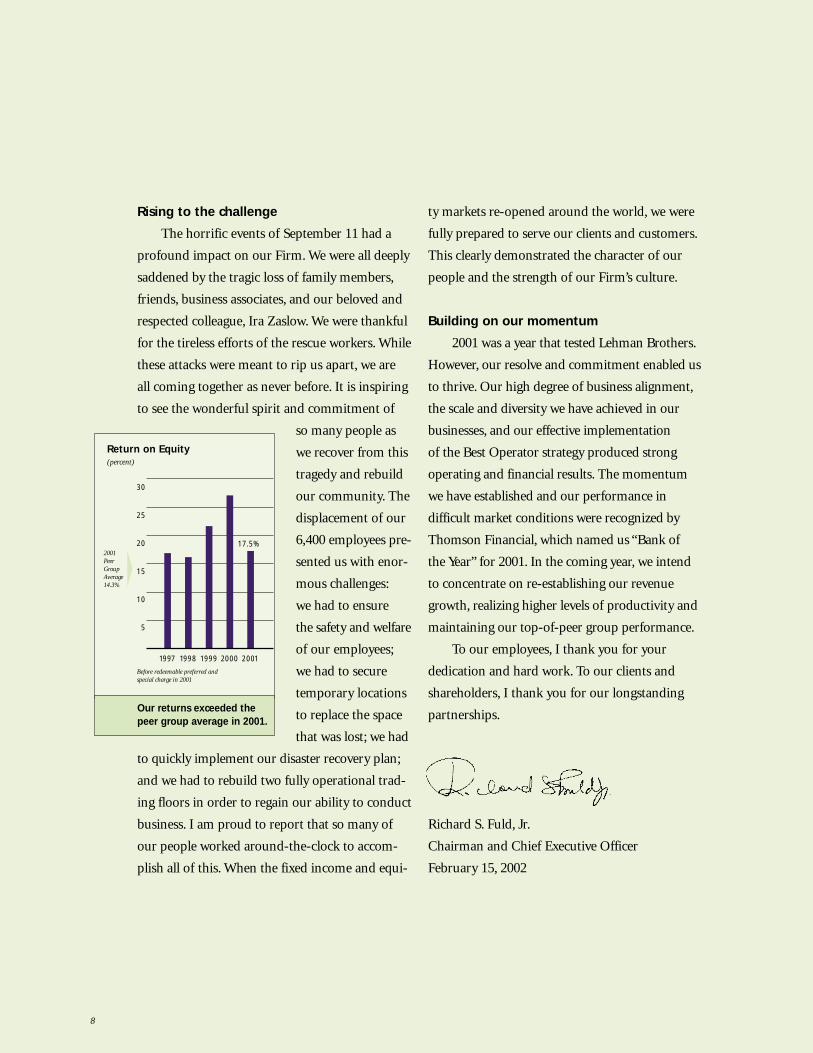
redeemable preferred dividend 17.5% 27.4% 21.8% 16.3% 17.0%
After special charge and
redeemable preferred dividend 15.9% 26.6% 20.8% 15.2% 15.6%
Pretax operating margin(1) 27.8% 33.5% 30.5% 25.6% 24.2%
Adjusted leverage ratio (5) 17.9x 16.6x 18.6x 20.6x 23.9x
Weighted-average common
and equivalent shares(3, 4) 265,257,554 264,163,612 258,565,344 249,983,662 242,129,858
Employees 13,090 11,326 8,893 8,873 8,340
(1) For 2001, excludes the impact of a special charge of $127 million ($71 million after tax). Earnings per share (diluted) in 2001 after the
special charge was $4.38.
(2) Total capital includes long-term debt, stockholders’ equity and preferred securities subject to mandatory redemption.
(3) All share and per share data have been restated for the two-for-one common stock split effective October 2000.
(4) For the years ended November 30, 2000 and 1999, the assumed conversion of Series A and B Convertible Preferred Stock into 2,438,375 and
5,559,474 common shares had the effect of decreasing diluted earnings per share by $0.03 and $0.02, respectively.
(5) Ratio of total assets excluding matched book to total stockholders’ equity and other preferred securities.
FINANCIAL HIGHLIGHTS
1

our strategy isbe the best operator
2

Dear stockholders and clients
In 2001, Lehman Brothers had a great year in
the face of tremendous challenges, reporting its
second best results ever. Additionally, we achieved
significant gains in market share in virtually all
major investment banking and capital markets
product categories. Increasingly, our clients
turned to us as their provider of choice.
Our results in 2001 exemplified the strength,
resiliency and momentum of our franchise.
The difficult economic environment reduced
the demand for equity underwriting, mergers
and acquisitions advice and caused institutional
investors to become much more risk averse. The
tragic events of September 11 clearly worsened
the market environment. These horrible events
also raised another unique set of challenges for
our Firm, given the necessity of relocating all
of our New York City employees based in lower
Manhattan. Despite these challenges, the Firm
reported net revenues of $6.7 billion and net
income of $1.3 billion (before taking into account
a $71 million after tax special charge to reflect
the costs and write-offs associated with the events
of September 11). These results have contributed
to the Firm’s strong track record of growth, as we
have increased our earnings at a rate of 20 percent
per year over the last five years. Additionally,
over this same period, our stock price has appre-
ciated at a rate of 27 percent per year. In 2001,
we continued to benefit from the scale and diver-
sification of our businesses, achieving a pretax
operating margin of 28 percent and a return on
equity of 18 percent, before the special charge
and preferred dividend. We reported earnings
per share of $4.64 before the special charge, and
in January 2002, raised our common stock divi-
dend to $0.36 per share, a 29 percent increase.
The strength of our business platform, the disci-
plines we have applied in managing our operations,
and our culture of excellence and teamwork were
all intrinsic to our solid performance for the year.
Achieving scale in our businesses
We have successfully built a diversified set
of high margin global businesses, each with strong
cross-cycle returns, that when taken together,
give us the ability to deliver attractive results
across varying market environments. This past
year, we were able to take advantage of the lower
interest rate environment to expand our Fixed
Income origination and sales and trading activi-
ties. Increased revenues from Fixed Income served
to partially offset the lower revenues we realized
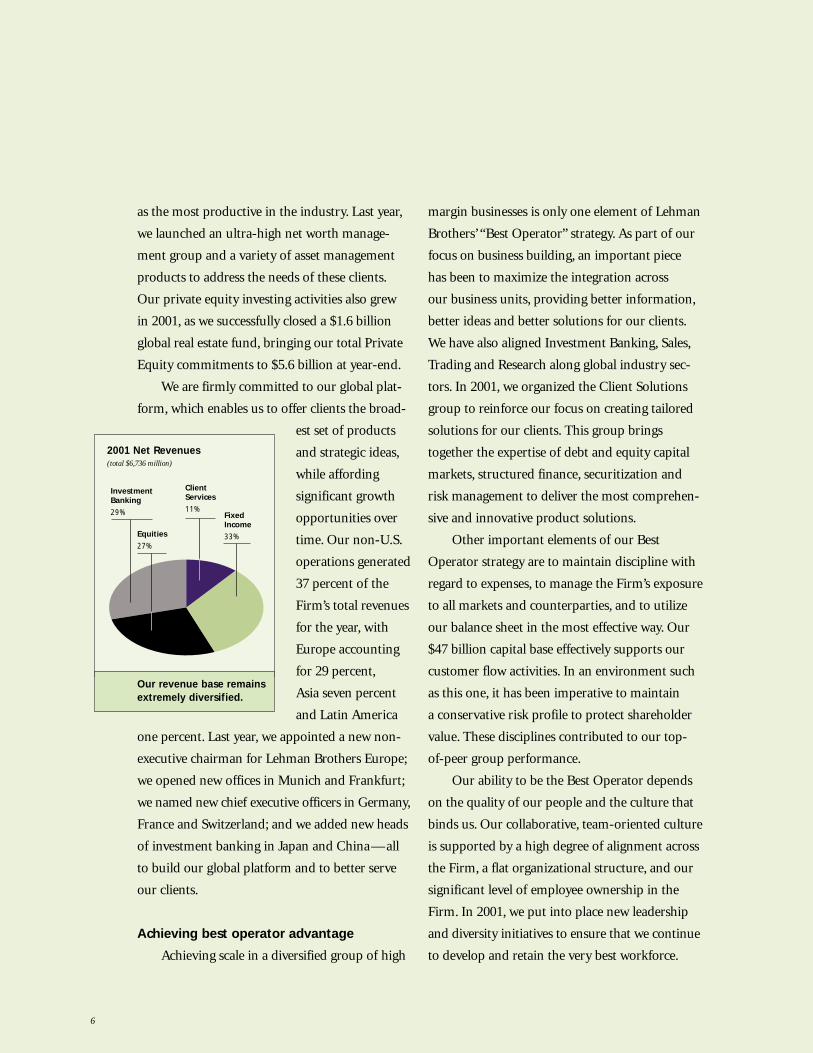
from Investment Banking and Equities. Despite
this shift in revenue composition, our revenues
remained highly diversified: Investment Banking
fees accounted for 29 percent of the total; Equities
produced 27 percent; Fixed Income accounted
for 33 percent; and Client Services produced
the remaining 11 percent. Our capital markets
and high net worth client revenues were highly
sustainable throughout the year, as institutions
remained fully invested even as they shifted to
more defensive asset classes.
During the year, we continued to broaden
the scale of our individual business units. In
Investment Banking, we have breadth and depth
across our global industry groups, which enabled
us to increase our overall share of banking fees,
while realizing transaction volume growth that
3
exceeded overall industry growth. While equity
issuance for the industry declined by 28 percent
last year, our underwriting volumes increased
by three percent. Our worldwide Fixed Income
origination volume increased by 52 percent in
2001 versus a 36 percent growth rate for the
industry. Part of this growth came from our
enhanced client targeting process, where those
targeted clients accounted for more than 75
percent of our total investment banking fees.
When you look
at market share in
2001, we realized
significant increases
in our announced
advisory transaction
volumes in the U.S.,
in worldwide equity
underwriting and
in worldwide debt
origination. Going
forward, we want
to continue to drive
further market share
gains by building
on our global capabilities and deepening the
relationships with our targeted clients.
Despite the challenges presented by the mar-
kets and September 11, Lehman Brothers also
gained market share in virtually all capital mar-
kets products during 2001. This was a remarkable
achievement, given the initial capacity and client
connectivity issues we faced post-September 11.
Fixed Income had a record revenue year in 2001,
as we continued to excel in the development of
structured products tailored to our clients’ needs.
Underscoring the strength of our Fixed Income
franchise, we recently placed second in Institu-
tional Investor’s 2001 ranking of fixed income
trading firms, moving up from fourth place the
year before. We achieved similar progress during
the year in our Equities Division, as we institu-
tionalized our global industry sectors across prod-
ucts to enhance the market intelligence we provide
to customers. Our Equities trading businesses
gained significant market share, with a 59 percent
increase in the listed business, a 39 percent rise
in Nasdaq share, and a 24 percent increase in
pan-European share through year-end 2001.
We ranked fifth in the Institutional Investor 2001
poll of equity trading firms, moving up strongly
from the prior year.
Research continues to be an important com-
ponent of our world-class platform. We sustained
our dominance in Fixed Income research, again
placing number one in the Institutional Investor
poll. In U.S. Equity research, we improved from
eighth to fifth place, as we achieved the largest
increase in the number of ranked analysts among
investment banks for the second year in a row.
We also made strong progress in Europe, where
we improved five places to the number eight
position in those research rankings.
In 2001, we also continued to broaden our
franchise through the expansion of our Client
Services Division. The largest group in this divi-
sion is Private Client Services, our high net worth
retail business, where we increased the total num-
ber of financial consultants to 475 by year-end.
Private Client Services has retained its standing
4
1997 1998 1999 2000 2001
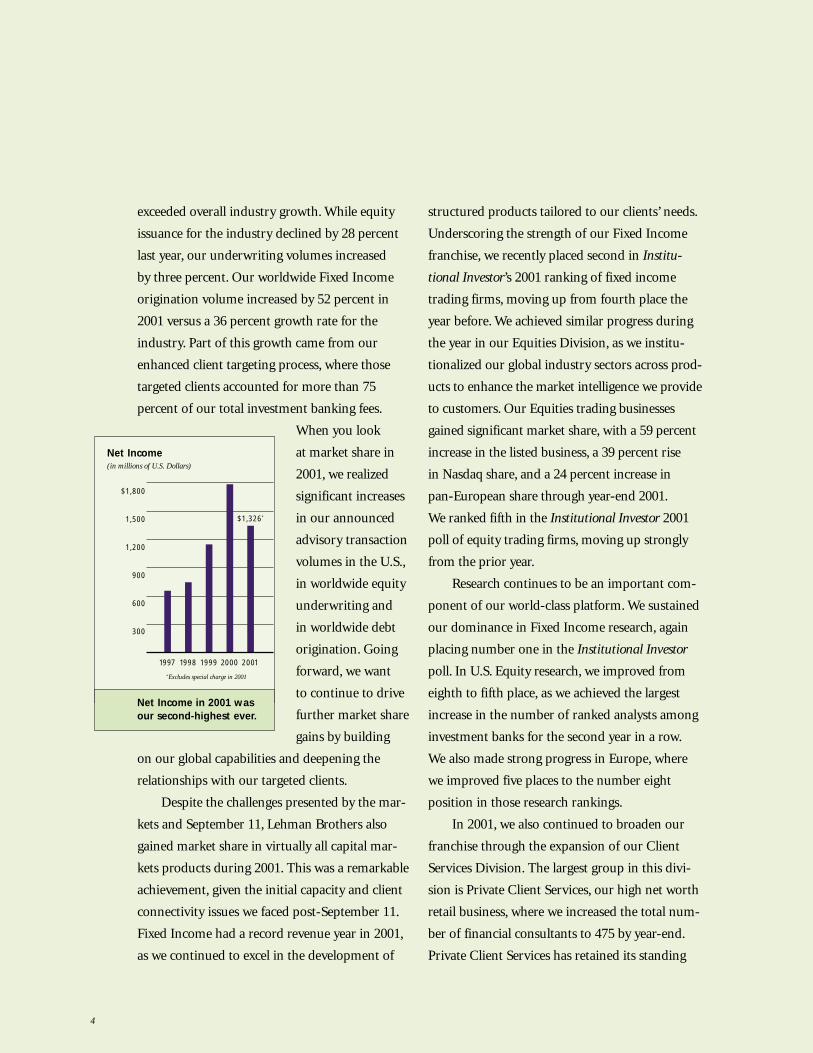
Net Income(in millions of U.S. Dollars)
Net Income in 2001 wasour second-highest ever.
$1,800
1,500
1,200
900
600
300
$1,326*
*Excludes special charge in 2001

by constantly reinforcingour One Firm culture
by getting thousands ofType-A people to function as a think-tank every day
by putting clients at thecenter of everything we do
we maintain exceptional
client focus
We bring together smart,
motivated people, and we
challenge them to out-think
the competition, to find cre-
ative and efficient solutions
for our clients. Our business
moves quickly, changing
every day, and it changes on
the currency of ideas. At
Lehman Brothers, we know
we’re only as good as our
next idea, that our competi-
tive advantage is the brain-
power—the creativity, the
mental agility—we bring to
every transaction.
The client is at the heart of
Lehman Brothers. Our fore-
most goal, our constant
focus, is finding new and
better ways of serving
clients: making ourselves
faster and nimbler, more
capable of real innovation.
And while we strive for
progress, we maintain and
build long-standing relation-
ships. To us, clients are not
transactions; they are work-
ing partners with whom we
are always in contact.
No one at Lehman Brothers
“owns” a client. No single
investment banker or trader
or broker serves a client
alone. We come together as a
firm to solve problems and
meet needs. Because we
understand that teams of
good-thinking people are
better than good-thinking
individuals, we bring the
considerable power of team-
work to bear on everything
we do, from sales and trad-
ing to underwriting, to
structured finance, to client
strategy and advisory services.
5
6
as the most productive in the industry. Last year,
we launched an ultra-high net worth manage-
ment group and a variety of asset management
products to address the needs of these clients.
Our private equity investing activities also grew
in 2001, as we successfully closed a $1.6 billion
global real estate fund, bringing our total Private
Equity commitments to $5.6 billion at year-end.
We are firmly committed to our global plat-
form, which enables us to offer clients the broad-
est set of products
and strategic ideas,
while affording
significant growth
opportunities over
time. Our non-U.S.
operations generated
37 percent of the
Firm’s total revenues
for the year, with
Europe accounting
for 29 percent,
Asia seven percent
and Latin America
one percent. Last year, we appointed a new non-
executive chairman for Lehman Brothers Europe;
we opened new offices in Munich and Frankfurt;
we named new chief executive officers in Germany,
France and Switzerland; and we added new heads
of investment banking in Japan and China—all
to build our global platform and to better serve
our clients.
Achieving best operator advantage
Achieving scale in a diversified group of high
margin businesses is only one element of Lehman
Brothers’ “Best Operator” strategy. As part of our
focus on business building, an important piece
has been to maximize the integration across
our business units, providing better information,
better ideas and better solutions for our clients.
We have also aligned Investment Banking, Sales,
Trading and Research along global industry sec-
tors. In 2001, we organized the Client Solutions
group to reinforce our focus on creating tailored
solutions for our clients. This group brings
together the expertise of debt and equity capital
markets, structured finance, securitization and
risk management to deliver the most comprehen-
sive and innovative product solutions.
Other important elements of our Best
Operator strategy are to maintain discipline with
regard to expenses, to manage the Firm’s exposure
to all markets and counterparties, and to utilize
our balance sheet in the most effective way. Our
$47 billion capital base effectively supports our
customer flow activities. In an environment such
as this one, it has been imperative to maintain
a conservative risk profile to protect shareholder
value. These disciplines contributed to our top-
of-peer group performance.
Our ability to be the Best Operator depends
on the quality of our people and the culture that
binds us. Our collaborative, team-oriented culture
is supported by a high degree of alignment across
the Firm, a flat organizational structure, and our
significant level of employee ownership in the
Firm. In 2001, we put into place new leadership
and diversity initiatives to ensure that we continue
to develop and retain the very best workforce.
2001 Net Revenues(total $6,736 million)
Our revenue base remainsextremely diversified.
ClientServices
11%Fixed Income
33%Equities
27%
InvestmentBanking
29%

to our response to challenge
to the continuity atthe top of the firm
to our high percentageof employee ownership
Every Lehman Brothers
employee is also a share-
holder. Thirty-three percent
of the Firm’s common stock
and equivalents is owned by
employees. Members of the
Executive Committee are
paid identically. Business
units are rewarded based
on the profits and returns
they contribute to the Firm.
So Lehman Brothers people
are motivated by the success
of the whole Firm. They
understand that the Firm
succeeds best when at its
most efficient, with the pos-
itive force of team-
work driving our
momentum.
This year brought challenges
expected and unexpected.
The global economy stag-
gered through its worst year
in a decade; equity markets
fell; unemployment rose.
And the events of September
11 presented the financial
community in the U.S. with
a new set of tests, to which
no manual could provide a
solution. Through all this
turmoil, Lehman Brothers
continued to produce strong
results. In terms of net
revenues and earnings, 2001
was our second-best year
ever, providing proof that
our strategy is working.
Our senior management
team has been together
through many stages of
Lehman Brothers’ evolution,
most of them rising to their
current roles from the
Lehman trading desks and
banking offices where they
began their careers in the
industry. This long-term
continuity, coupled with
the team’s steadfast concen-
tration on the Firm’s culture,
creates an environment in
which collaboration—
contribution to the Firm’s
mission—is a constant.
7
we attribute the success of our strategy to
teamwork
Rising to the challenge
The horrific events of September 11 had a
profound impact on our Firm. We were all deeply
saddened by the tragic loss of family members,
friends, business associates, and our beloved and
respected colleague, Ira Zaslow. We were thankful
for the tireless efforts of the rescue workers. While
these attacks were meant to rip us apart, we are
all coming together as never before. It is inspiring
to see the wonderful spirit and commitment of
so many people as
we recover from this
tragedy and rebuild
our community. The
displacement of our
6,400 employees pre-
sented us with enor-
mous challenges:
we had to ensure
the safety and welfare
of our employees;
we had to secure
temporary locations
to replace the space
that was lost; we had
to quickly implement our disaster recovery plan;
and we had to rebuild two fully operational trad-
ing floors in order to regain our ability to conduct
business. I am proud to report that so many of
our people worked around-the-clock to accom-
plish all of this. When the fixed income and equi-
ty markets re-opened around the world, we were
fully prepared to serve our clients and customers.
This clearly demonstrated the character of our
people and the strength of our Firm’s culture.
Building on our momentum
2001 was a year that tested Lehman Brothers.
However, our resolve and commitment enabled us
to thrive. Our high degree of business alignment,
the scale and diversity we have achieved in our
businesses, and our effective implementation
of the Best Operator strategy produced strong
operating and financial results. The momentum
we have established and our performance in
difficult market conditions were recognized by
Thomson Financial, which named us “Bank of
the Year” for 2001. In the coming year, we intend
to concentrate on re-establishing our revenue
growth, realizing higher levels of productivity and
maintaining our top-of-peer group performance.
To our employees, I thank you for your
dedication and hard work. To our clients and
shareholders, I thank you for our longstanding
partnerships.
Richard S. Fuld, Jr.
Chairman and Chief Executive Officer
February 15, 2002
8
1997 1998 1999 2000 2001
Return on Equity(percent)
Our returns exceeded thepeer group average in 2001.
30
25
20
15
10
5
17.5%
Before redeemable preferred and special charge in 2001
2001 PeerGroupAverage14.3%

this was an extraordinary
year
9

1Q 2001
this year was
DEC 2000 . . . . . . . . . . . . . S&P 1320 . . . . . . . . . . . .NASDAQ 2471 . . . . . . . . . . . .FTSE 100 6223 . . . . . . . . . . .DAX 6439 . . . . . . . . . . . NIKKEI 13786 . . . . . . . . . . .
10
dramatic confirmation of our core strategy
Best operator
In December, Lehman Brothers entered
the S&P100 index, providing confirmation
of our rapid growth. In just eight years
as a public company, Lehman Brothers
has transformed itself into one of the
best performing organizations in the
industry by focusing on client service,
building a diverse mix of businesses, and
developing core competencies in expense,
liquidity and risk management.
At the outset of fiscal 2001, we
embarked on a plan—the Best Operator
Strategy—to impel the Firm still further
forward. By focusing on building our higher
margin businesses, pursuing the strong
promise of growing European markets,
and constantly streamlining back-office
and corporate functions, we intend to
be the best operator in our industry,
producing best-in-class returns and
operating margins.
Client solutions Recognizing the increasing complexity
of capital markets and corporate finance,
we established the Client Solutions group
to broaden our thinking on behalf of
investment banking clients. The group
formalizes channels of communication
among specialized product and industry
areas so that the Firm can deliver the
most comprehensive solution possible
to meet a client’s needs.
When, for example, Micron Tech-
nology Inc., the leading DRAM chip
maker, wanted to monetize the volatility
in its stock and raise equity capital at a
premium, Lehman Brothers developed
an innovative structure that was designed
to attract a broad group of investors.
This $500 million landmark transaction
combined an offering of call warrants as
stand-alone securities with an offering of
custodial receipts that packaged the war-
rants with a Fannie Mae principal strip,
appealing to both equity and convertible
investors. This transaction brought
together teams from Investment Bank-
ing, Equity Capital Markets, Equity
and Convertible trading, Debt Capital
Markets and Agency trading to develop
this unique solution for Micron.
The Client Solutions group will con-
tinue to foster teamwork across Lehman
Brothers—by building on the One Firm
approach—in order to focus the full
effort of the Firm’s thinking on behalf
of our most important clients.
. . . . . . . . . . . . . . LEHMAN 67.63
11

S&P 1366 . . . . . . . . . . . NASDAQ 2773 . . . . . . . . . . . JAN 2001 . . . . . . . . . . . FTSE 100 6298 . . . . . . . . . . . DAX 6795 . . . . . . . . . . . NIKKEI 13844 . . . . . . . . . . .
1Q 2001
building scale one trade at a time
“Lehman Brothers has been
a good partner for Fidelity
across our businesses around
the world. As an innovative
firm with excellent technology
and strong execution, Lehman
Brothers gives us what we need.”
Bob Reynolds
Vice Chairman and
Chief Operating Officer,
Fidelity Investments

. . . . . . . . . . . LEHMAN 82.28
We’re always thereLehman Brothers and Fidelity
Investments® formed a strategic alliance
in 1999 across a broad spectrum of
investment products, research and distri-
bution channels. Since then, we have
provided Fidelity’s retail clients with
access to the full range
of Lehman Brothers
equity and fixed income
products, such as initial
public offerings and
equity and debt research.
The arrangement strengthens Lehman
Brothers’ distribution capabilities and
provides us with a significant advantage
by combining the breadth and depth of
Fidelity’s retail and Internet brokerage
network with our product network.
This alliance is a logical progression
from Lehman Brothers’ close working
relationship with Fidelity’s mutual fund
organization in the areas of sales, trading
and research, and it underscores the
ability of the two organizations to work
together and add significant value for
our respective clients.
Equities rising
Lehman Brothers’ Equities Division
commands fast-growing market share,
finishing 2001 at 3.9% of trading volume
on Nasdaq and 7.3% on the New York
Stock Exchange. A year ago, Lehman
Brothers accounted for just 2.8% on
Nasdaq and 4.6% on the NYSE.
Given the exceptionally competitive
nature of the equity trading business,
especially in an era of sharply tightened
spreads on equity trades, we realized
we could grow only by offering value our
competitors did not. We win by providing
our clients with superior information,
innovative ideas, smart derivative strate-
gies, better technology and outstanding
research. We win with creative thinking
on behalf of our clients.
13
Secondary Trading Market Share NYSENasdaq
N D J F M A M J J A S O N D
6%
4%
2%

S&P 1240 . . . . . . . . . . . NASDAQ 2152 . . . . . . . . . . FTSE 100 5918 . . . . . . . . . . . DAX 6208 . . . . . . . . . . FEB 2001 . . . . . . . . . . NIKKEI 12884 . . . . . . . . . . . .
1Q 2001
Constantly creativeIn February, Lehman Brothers’ Financial
Institutions banking team found an
innovative financing opportunity for
long-time client Washington Mutual
(WAMU), one of the nation’s largest
residential lenders and consumer finan-
cial services firms. By developing a
unique structure specifically tailored to
Washington Mutual’s needs as an issuer,
Lehman Brothers brought to market a
$1.15 billion offering of Trust PIERS
units. The transaction was constructed
to provide the issuer with substantial
economic benefits, while satisfying both
ratings agencies and regulators. Marketing
the issue as a Rule 144A transaction,
Lehman Brothers was able to target both
convertible and stock investors. The issue
brought such strong investor interest
that the marketing period lasted just two
days, and demand for the PIERS greatly
exceeded the offering amount. Lehman
Brothers was sole manager of the offering.
WAMU’s Trust PIERS offering reflects
the continuation of a long-term client
relationship that illustrates Lehman
Brothers’ constant attention and commit-
ment to its clients. From the time we
lead-managed Washington Mutual’s
initial debt financing in 1995, Lehman
Brothers Financial Institutions group has
played a key role in Washington Mutual’s
franchise growth and its access to the
capital markets. Over the course of the
relationship, Lehman Brothers has lead-
managed over $4.6 billion in debt and
equity securities offerings on behalf of
Washington Mutual, and has advised
the Company on six major acquisitions,
totaling $26 billion, in the consumer
banking and specialty finance sectors.
During the same period, Washington
Mutual has increased its market capital-
ization and earnings more than fourfold,
improving its market capitalization to
over $30 billion at the end of 2001.
“Lehman Brothers has helped us create
a careful—and very successful—funding
strategy for many years. We know that
we can count on Lehman to be respon-
sive to our needs, to find creative and
cost-effective financing structures, and
to market and execute our offerings flaw-
lessly. More generally, the Firm has been
a unique partner in our growth, having
brought us quality advice and execution
in every element of our strategy.”
Kerry Killinger
Chairman and CEO,
Washington Mutual
by helping clients build their vision
14

. . . . . . . . . . LEHMAN 68.65
we build value
15

we continue to be a fixed income powerhouse
MAR 2001 . . . . . . . . . . . . S&P 1160 . . . . . . . . . . NASDAQ 1840 . . . . . . . . . . .
2Q 2001“BlackRock has benefited significantly
from our relationship with Lehman
Brothers. Our firm manages more than
$135 billion in fixed income assets, and
we view Lehman Brothers as an impor-
tant intermediary across a broad range
of fixed income products. The input of
Lehman salespeople, traders, analysts,
strategists and senior managers has been
a valuable element of our success in
meeting our clients’ expectations.”
Robert KapitoVice Chairman, BlackRock
Keith AndersonChief Investment Officer, BlackRock
“Since BlackRock’s inception, the
overriding objective of our fixed
income effort has been to achieve returns
in excess of our performance benchmarks,
while assuming equal or lower levels
of risk. Our relationship with Lehman
Brothers has contributed to our success
in achieving this objective consistently
over time. Lehman’s bond indices, top
research teams, ability to bring new prod-
ucts to market and secondary liquidity
have helped us manage our portfolios
more effectively.”
16

. . . . . . . . . . . FTSE 100 5634 . . . . . . . . . . . DAX 5830 . . . . . . . . . . . NIKKEI 13000 . . . . . . . . . . . LEHMAN 62.70
Bond House of the Year 2001 was a record year in many parts
of the fixed income business, with new
corporate debt issuance at an all-time
high, significant fund flows into bond
products, record mortgage activity and
unprecedented strength in municipal
debt. And Lehman Brothers was ideally
positioned to capitalize on these strong
markets in an otherwise difficult eco-
nomic year—so well positioned, in fact,
that Lehman Brothers was named the
2001 “Investment Grade Bond House
of the Year” by International Financing
Review and was ranked second in a
survey of fixed income trading clients
by Institutional Investor. Both surveys
cited the Firm’s market-leading expertise
in newer asset classes, such as collateral-
ized debt and bond obligations, as a
defining advantage.
17
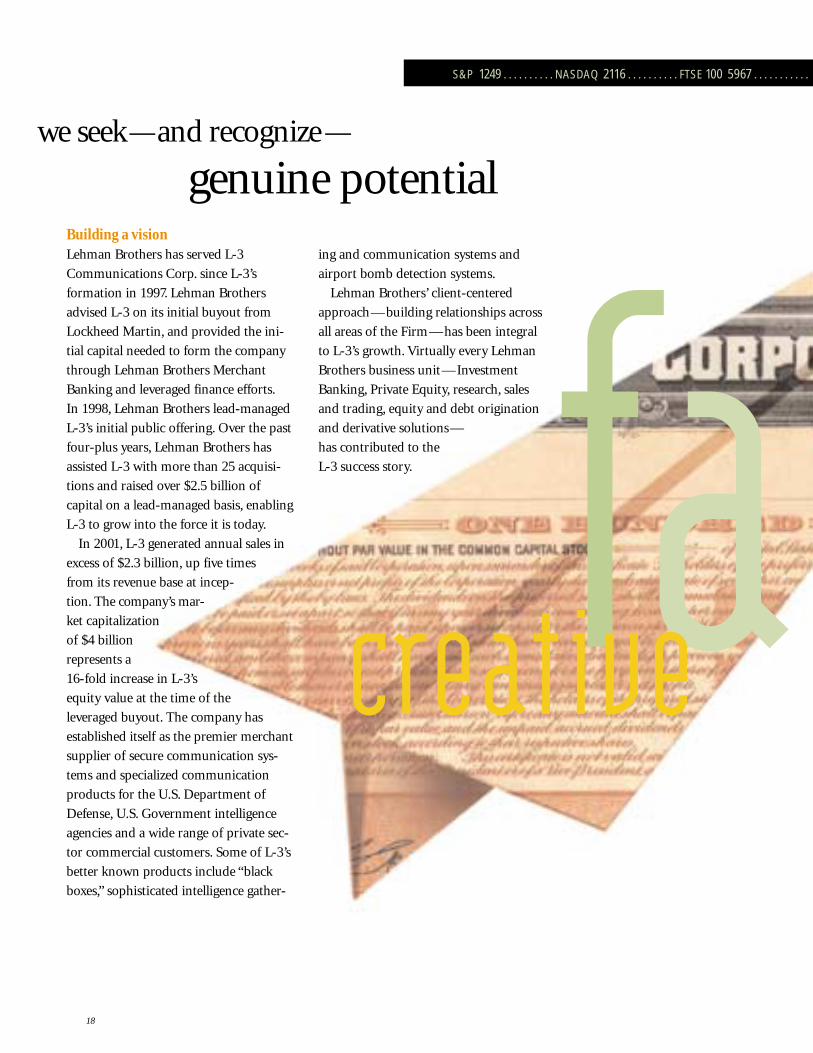
Building a vision Lehman Brothers has served L-3
Communications Corp. since L-3’s
formation in 1997. Lehman Brothers
advised L-3 on its initial buyout from
Lockheed Martin, and provided the ini-
tial capital needed to form the company
through Lehman Brothers Merchant
Banking and leveraged finance efforts.
In 1998, Lehman Brothers lead-managed
L-3’s initial public offering. Over the past
four-plus years, Lehman Brothers has
assisted L-3 with more than 25 acquisi-
tions and raised over $2.5 billion of
capital on a lead-managed basis, enabling
L-3 to grow into the force it is today.
In 2001, L-3 generated annual sales in
excess of $2.3 billion, up five times
from its revenue base at incep-
tion. The company’s mar-
ket capitalization
of $4 billion
represents a
16-fold increase in L-3’s
equity value at the time of the
leveraged buyout. The company has
established itself as the premier merchant
supplier of secure communication sys-
tems and specialized communication
products for the U.S. Department of
Defense, U.S. Government intelligence
agencies and a wide range of private sec-
tor commercial customers. Some of L-3’s
better known products include “black
boxes,” sophisticated intelligence gather-
ing and communication systems and
airport bomb detection systems.
Lehman Brothers’ client-centered
approach—building relationships across
all areas of the Firm—has been integral
to L-3’s growth. Virtually every Lehman
Brothers business unit—Investment
Banking, Private Equity, research, sales
and trading, equity and debt origination
and derivative solutions—
has contributed to the
L-3 success story.
we seek—and recognize —
genuine potential
S&P 1249 . . . . . . . . . . NASDAQ 2116 . . . . . . . . . . FTSE 100 5967 . . . . . . . . . . .
18
facreative

2Q 2001
. . . . . . . . . . . . APR 2001 . . . . . . . . . . . DAX 6265 . . . . . . . . . . NIKKEI 13934 . . . . . . . . . . LEHMAN 72.75
“Lehman Brothers has been with us from
the start — helping our team build and
grow the business, providing us with
invaluable strategic advice and innovative
financing solutions, while continuing
to provide strong execution and market-
making in our securities. The Lehman
Brothers team continually gives us out-
standing advice and premium execution,
often in challenging markets, and always
with utmost integrity. We are pleased to
have Lehman Brothers at our side as we
continue to build L-3 into a leading diver-
sified merchant supplier of high-tech
defense products, and look forward to
continuing our partnership in the future.”
Frank C. Lanza
Chairman and CEO
Robert V. LaPenta
President and CFO,
L-3 Communicationsst19
nimble

S&P 1256 . . . . . . . . . . NASDAQ 2110 . . . . . . . . . . FTSE 100 5796 . . . . . . . . . . . .

A multifaceted successIn a blockbuster transaction, Lehman
Brothers helped U.K. client Morgan
Grenfell Private Equity (MGPE) win
an extremely competitive auction
for Whitbread’s Pubs & Bars division.
The £1.625 billion acquisition was
the largest leveraged buyout and LBO
debt financing in Europe’s history.
The synergies of the One Firm philos-
ophy brought this transaction to fruition.
The Firm’s Mergers and Acquisitions
and Principal Transactions groups drew
on their substantial brewing and pub
industry experience to advise MGPE on
the acquisition and recapitalization of
the pubs and bars business; and innova-
tive bridge financing provided MGPE
with significant flexibility and long-term
protection against refinancing risk.
Shortly after completion of the buyout,
Lehman Brothers went on to advise
MGPE on the sale of 493 of the pubs
to Enterprise Inns for £262.5 million,
the third transaction Lehman Brothers
executed for MGPE in 24 months.
2Q 2001
. . . . . . . . . . . . DAX 6123 . . . . . . . . . . . NIKKEI 13262 . . . . . . . . . . . MAY 2001 . . . . . . . . . . . LEHMAN 71.61
local expertise,
around the world
On the ground
Lehman Brothers pursues business
around the globe by being there—
by putting professionals with local
expertise in front of management
teams. This strategy has enabled us
to grow our European and Asian
franchises, with leading business
units in Italy, Germany, France, the
United Kingdom and many other
countries. While the Firm already gen-
erates 37% of its revenues overseas,
we see extraordinary opportunity in
the future, as the European and Asian
capital markets continue to mature
and grow. Lehman Brothers will be
there to help spur that growth.
21
Schlumberger fills a needWhen Schlumberger, the French-American
oil services company, sought to acquire
information technology expertise,
Lehman Brothers brought the best idea.
Believing that Sema plc, an Anglo-French
company of 20,000 professionals, would
provide the optimal strategic fit as well as
a close cultural combination, Lehman
Brothers worked closely with Schlumberger
management on a tie-up with Sema. The
result was a $5.3 billion acquisition, the
largest ever public bid in the European
technology sector.
The transaction required expert
coordination to deal with Sema’s equity
listings in London, Paris and New York.
Lehman Brothers bankers overcame the
many complexities associated with the
Sema transaction, enabling Schlumberger
to gain critical mass in the area of exper-
tise in which it wished to expand.

Building and protecting wealth
At Lehman Brothers, we believe in the
value of a retail business catering to the
high net worth client, and the strategy is
working for us. Our investment advisors
—now 475 strong—produce the top per
capita commission income in the industry
at $1.5 million.
We choose to serve high net worth
clients because we believe in the value
we provide them. Our advisors set full
wealth management strategies for their
clients, including retirement and tax plan-
ning, and they perform sophisticated
money management techniques to help
clients protect and grow their wealth.
In return, we at Lehman Brothers like
what high net worth individuals do for
us: They don’t leave markets when times
are difficult, they continue to pursue
multilayered strategies for managing their
wealth, and they push us to think better
—to find more innovative ways to meet
their financial needs — every day.
Innovative products
Lehman Brothers’ Private Equity, with over
$5.6 billion in committed capital at the end
of fiscal 2001, closed Lehman Brothers’
$1.6 billion commercial real estate fund
this year. The fund, like previous Lehman
private equity and venture capital funds,
will seek investments with strong potential
around the world.
Lehman Brothers Private Equity has
grown quickly since its inception in 1997,
and we aim to continue this growth by
raising additional funds in existing and
new asset classes.
JUNE 2001 . . . . . . . . . . . S&P 1224 . . . . . . . . . . . NASDAQ 2161 . . . . . . . . . . . .
3Q 2001
22
we provide
unique solutionsfor the private client
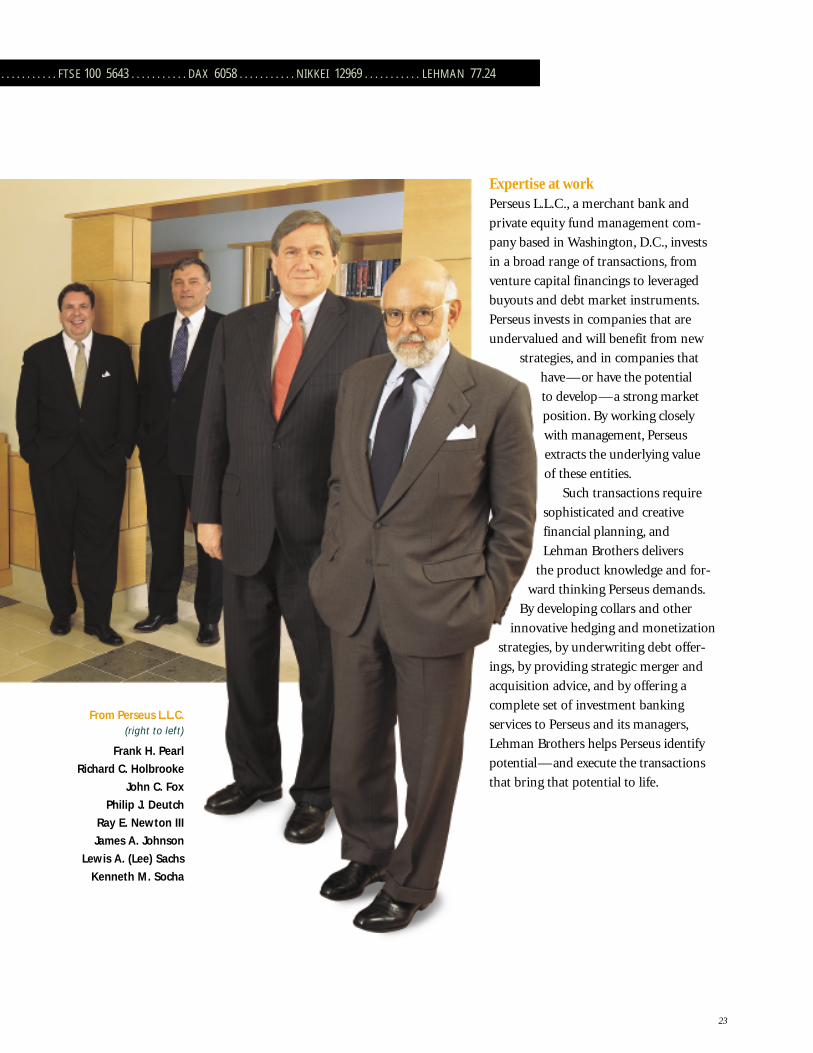
Expertise at workPerseus L.L.C., a merchant bank and
private equity fund management com-
pany based in Washington, D.C., invests
in a broad range of transactions, from
venture capital financings to leveraged
buyouts and debt market instruments.
Perseus invests in companies that are
undervalued and will benefit from new
strategies, and in companies that
have—or have the potential
to develop—a strong market
position. By working closely
with management, Perseus
extracts the underlying value
of these entities.
Such transactions require
sophisticated and creative
financial planning, and
Lehman Brothers delivers
the product knowledge and for-
ward thinking Perseus demands.
By developing collars and other
innovative hedging and monetization
strategies, by underwriting debt offer-
ings, by providing strategic merger and
acquisition advice, and by offering a
complete set of investment banking
services to Perseus and its managers,
Lehman Brothers helps Perseus identify
potential—and execute the transactions
that bring that potential to life.
. . . . . . . . . . . FTSE 100 5643 . . . . . . . . . . . DAX 6058 . . . . . . . . . . . NIKKEI 12969 . . . . . . . . . . . LEHMAN 77.24
From Perseus L.L.C.(right to left)
Frank H. Pearl
Richard C. Holbrooke
John C. Fox
Philip J. Deutch
Ray E. Newton III
James A. Johnson
Lewis A. (Lee) Sachs
Kenneth M. Socha
23

S&P 1211 . . . . . . . . . . . NASDAQ 2027 . . . . . . . . . . . FTSE 100 5529 . . . . . . . . . . .
. . . . . . . . . . . JULY 2001 . . . . . . . . . . . DAX 5861 . . . . . . . . . . . NIKKEI 11861 . . . . . . . . . . . LEHMAN 72.00
3Q 2001
Securitizing assetsLehman Brothers’ sole-lead managed
$5 billion asset-backed security (ABS)
issuance for Ford Motor Credit, named
“Structured Finance Deal of the Year” by
Investment Dealers Digest, illustrates one
of the Firm’s greatest strengths: creating
innovative structures for raising capital
through securitization. The deal is
considered a breakthrough due to its
innovative structure, size and execution
levels achieved.
The innovative structure developed
by Lehman Brothers allowed Ford
Motor Credit to efficiently securitize
its portfolio of loans to dealers through
one securitization platform. Increased
from an original size of $3 billion due
to strong investor demand, the Ford
transaction was the largest-ever single-
day issuance of securities by a single
ABS issuer. The transaction consisted of
both three- and five-year maturities and
priced at the low end of the targeted
price range, providing Ford a lower-cost
of funding than it would have received
from the corporate bond market.
creating value and disseminating risk
Facilitating creditLehman Brothers’ securitization
strengths allow us to raise capital for
clients in a myriad of asset classes—
from collateralized debt obligations to
mortgage-backed securities to a variety
of synthetic structures—without either
committing the Firm’s own capital
or creating undue risk for individual
investors. By carving offerings into
tranches of different ratings and sizes,
and then re-marketing them to the
investing public, we fulfill all parties’
needs: issuers get their capital; investors
get attractive securities; and Lehman
Brothers avoids the risk associated with
directly providing credit to clients.
The Firm led a great many creative
issues throughout the year, highlighted
by a $2.5 billion rate reduction bond
transaction for Public Service Electric
and Gas, the first commercial mort-
gage-backed securities transaction in
Thailand and a €2 billion synthetic
collateralized loan obligation for
Credit Lyonnais.
25
One-stop solutionsScottish Provident, one of the last large
mutual life insurers remaining in the United
Kingdom, announced in May 2000 that
it was seeking a buyer and wanted to
demutualize. Abbey National plc selected
Lehman Brothers to advise it in the auc-
tion. By providing Abbey’s management
with all aspects of acquisition advice, by
helping Abbey raise the funding necessary
to complete the deal, and by providing
insightful guidance on tactics for winning
the auction, Lehman Brothers’ U.K. bank-
ing team helped Abbey National acquire
Scottish Provident and achieve an impor-
tant step forward in its business diversifica-
tion objectives.
On the day the £1.8 billion acquisition
was announced, Lehman Brothers also led
£1 billion and €400 million debt offerings
for Abbey National, which found a high
level of investor interest. The transaction
was well-received by the market, with
Abbey National’s stock price rising strongly
following the transaction.
( )S&P 1134 . . . . . . . . . . NASDAQ 1805 . . . . . . . . . . FTSE 100 5345 . . . . . . . . . . . . . . .
Equity Research at Lehman Brothers
continued its meteoric rise in 2001,
placing 42 analysts —more analysts than
ever before—in the annual U.S. Institutional
Investor survey, and improving from
13th place to 8th in Europe. Equity research
underpins our success across the equity
business, and our analysts continue
to provide some of the most insightful,
forward thinking on Wall Street.
26
our Equity Research department continued its robust
placing a record 5th in the U.S. in 2001, and our Fixed Income
ranking number one for the 6th year in the last 10,
( )Lehman Brothers’ Fixed Income
Research has long been regarded
as the industry leader in analytical
tools and market forecasting. Bond
market participants worldwide have long
relied on the Lehman Brothers Bond
Indices for their peerless understanding
of market forces and their in-depth
coverage of hundreds
of asset classes.
. . . . . . . . . . . DAX 5188 . . . . . . . . . . . NIKKEI 10714 . . . . . . . . . . . LEHMAN 65.65 . . . . . . . . . . . AUG 2001
3Q 2001
27
growth and rapid ascent up the Institutional Investor rankings,
Research department continued its dominance,
while our bond indices remain trusted industry standards.

September 11
Lehman Brothers occupied some 1.4
million square feet of office space in
close proximity to the terrorist attack,
including two floors of the North Tower
of the World Trade Center and our
global headquarters in the World
Financial Center. When terrorists struck,
6,400 of our people—nearly half of
our worldwide employees—fled their
offices, leaving behind the entirety of
the Firm’s New York–based infrastructure.
We mourn Ira Zaslow, our colleague
who perished in the attack. Our mem-
ory of those lost, and our witness to a
moment of such horrible history, will
never fade.
Still, business called. Our senior man-
agers convened at our contingency site
in Jersey City, New Jersey, that after-
noon, and by the end of the day, they
had set in motion the necessary steps
to keep Lehman Brothers running in
all markets and products.
September 12
Extraordinary times demand—and
beget—extraordinary responses.
Lehman Brothers people came together,
volunteering for any duty that could
help, working days at a stretch from
anywhere they could find a working
telephone. Human Resources verified
the safety of our New York–based
employees. Our technology people
began refitting our Jersey City space
to accommodate far greater capacity.
Real estate people canvassed the area
for office space.
Throughout, our competitors showed
remarkable generosity, offering space
and, often, an open invitation to call
upon them for assistance. We thank them.
Recovery, the only choice, was well
underway. Soon we had secured space
in two midtown Manhattan hotels for
our Investment Banking and Equity
Research professionals. Some 3,000
people were reporting for work in Jersey
City, where days earlier just 800 people
had worked.
When trading resumed in the U.S.
debt markets 24 hours later, Lehman
Brothers was trading in every asset class.
Our investment bankers, on cell phones
and city pay phones, were in contact
with all of their clients. And when New
York City firefighters and police officers
rang the bell at the New York Stock
Exchange on September 17, all the
wheels of Lehman Brothers were
turning once again.
When Lehman Brothers employees were
dislocated from their offices in lower
Manhattan, they were separated from the
lifeblood of the securities industry, their
technology. Lehman Brothers information
technology staffers immediately set out to
reconstruct the platform, to get us back to
business with the necessary capacity. Working
around the clock, they installed thousands of
computer devices and miles of new cable; they
reconstructed our telephone and data connec-
tivity with the exchanges and clients; they
restored and updated our website to give
employees information; they rescued crucial
data. From the most senior to the most junior,
our technology people performed Herculean
tasks to get us up and running.
28

SEPT 2001
4Q 2001
we had only
one option:back to
business

S&P 1041 . . . . . . . . . . . . .
we were fully prepared to serve our clients
Clients servedLehman Brothers got back to business
everywhere, in everything we do. We
advised on the first major post–Septem-
ber 11 M&A transaction; brought the
first significant debt offerings to market;
underwrote billions of dollars in asset-
backed and mortgage-backed transac-
tions; and advised on several debt
restructurings, rate locks and other
derivative transactions.
Lehman Brothers lead-managed a
$1.5 billion issue of notes for Kerr-
McGee Corp., $300 million of bonds for
AvalonBay Communities, $4 billion of
debt for General Electric Capital Corp.
(GECC)—the first major U.S. offering
after the terrorist attack, and $150 million
of bonds for Nevada Power.
We led a major cross-currency swap
for La Fondiaria, an interest rate swap
for GECC, a Treasury rate lock for
Liberty Financial Cos., a rate lock for
Campbell’s Soup, and advised the
Government of Indonesia.
We led a bridge financing of $137 mil-
lion for Inner City Broadcasting, advised
BankAtlantic Bancorp on its acquisition
of Community Savings Bankshares, led a
$5.7 billion issue of revenue anticipation
notes for the State of Calilfornia, led a
$26 million secondary equity offering for
Telik, Inc., and advised Ente Nazionale
Energia Elettrica on the sale of Elettrogen
SpA to Endesa SA.
Trading resumed Crammed into hastily constructed
trading floors at our Jersey City offices,
Lehman Brothers equity and fixed
income traders were back at work and
trading in every asset class when the U.S.
markets re-opened. Although we fought
through decreased connectivity with our
clients, by the end of 2001 our share of
secondary trading volume in all markets
had returned to pre–September 11 levels.
Elettrogen SASale to Endesa SA
General Electric Capital Corp.$4 billion of floating-rate notes
BankAtlantic BancorpAcquisition of Community Savings Bankshares WESCO; distribution swap
Government of IndonesiaFinancial advisory
New York Life Insurance Co.Acquisition of McMorgan Co.
La Fondiaria Assicurazoni SpAInterest rate swap
Campbell’s Soup$300 million of fixed-rate notes; rate lock
Vitesse Semiconductor Corp.Convertible debt buyback
Nevada Power$150 million of fixed-rate notes
30

. . . . . . . . . . . NASDAQ 1499 . . . . . . . . . . FTSE 100 4903 . . . . . . . . . . SEPT 2001 . . . . . . . . . . DAX 4308 . . . . . . . . . . NIKKEI 9775 . . . . . . . . . . LEHMAN 56.85
4Q 2001
State of California$5.7 billion revenue anticipation notes
Tesoro Petroleum Corp.$677 million acquisition ofrefineries and pipelines
AvalonBay Communities, Inc.$300 million of fixed-rate notes
GMAC$6 billion of fixed-rate notes
Kerr-McGee Corp.$1.5 billion of fixed-rate notes
Liberty Financial Cos.Treasury rate lock
31
LehmanLive thrives
LehmanLive, the Web portal for all
Lehman Brothers clients, was rolled out
in the fourth quarter of 2000. We started
2001 with approximately 3,000 individual
client users; by the end of the year, more
than 20,000 had access to our full suite
of pre-trade, trade and post-trade services.
The Firm decided early in the year to
develop a global employee Intranet within
LehmanLive. The power of this strategy
was demonstrated vividly in September,
when the site became a key tool in
restoring business functionality, linking
employees at numerous temporary
locations via Tocket, a proprietary
remote-access technology.
LehmanLive played a critical role in
allowing our employees to continue to
serve clients in a seamless fashion regard-
less of their location. The vast majority of
our employees and more than 5,000 of our
customers now use LehmanLive every day.
The Fixed Income portion of the site
was recognized by clients in the
Institutional Investor Fixed Income survey
as the best offering on the Street for
fixed income. The Equities portion has
seen a high adoption rate from clients
who use it to access research, portfolio
analytics and specific account informa-
tion. It also received honorable mention
in the Euromoney Internet Awards, with
particularly high marks given to our con-
vertible bond product. High net worth
private clients have made frequent use
of the site to retrieve account informa-
tion, statements and proprietary research.

S&P 1060. . . . . . . . . . . . . . .
“We knew testing the IPO waters
in October 2001 would be
difficult, but Lehman Brothers,
through vigorous marketing
and careful market-monitoring,
gave us confidence that
we could successfully raise
equity.”
Dr. Gavriel D. Meron
President and CEO,
Given Imaging Ltd.
Given Imaging goes public Given Imaging Ltd., an Israeli
diagnostics company that produces
a revolutionary non-invasive tech-
nology for diagnosis of gastroin-
testinal disorders, brought life back
to the initial public offering market
in October. Lehman Brothers led
the first IPO—a $60 million, five
million share offering—in seven
weeks, the longest hiatus in IPOs
in 26 years.
Though equity markets contin-
ued to experience turbulence, the
Given Imaging offering was three
times over-subscribed. Further
displaying the market’s confidence
in the IPO, significant investments
in the shares were made by dedicat-
ed healthcare hedge funds and top-
tier mutual funds. The offering
priced at $12 per share; the stock
opened at $12.25 and closed its first
day at $12.47, a 4% rise in choppy
equity markets.
More importantly, the success
of the Given Imaging IPO demon-
strated that investors were pre-
pared, for the first time in weeks,
to welcome new equity issues into
the market.
32
we reopened the IPO market . . .

Bringing people back together Though commercial real estate transac-
tions often take months to negotiate,
Lehman Brothers senior management
reached an agreement to purchase a new
32-story tower from Morgan Stanley in
New York City’s Times Square in a week.
The new Lehman Brothers corporate
headquarters building, at 745 Seventh
Avenue, represents a significant step in the
evolution of Lehman Brothers: At a time
of uncertainty in the New York real estate
market, the purchase displayed the Firm’s
steadfast commitment to remaining in
Manhattan; and, importantly, allowed
us to bring our businesses and our
people back together. Teamwork
is at the core of Lehman
Brothers’ success, and our
team operates more effi-
ciently when we are
together.
. . . . . . . . . . . .NASDAQ 1690 . . . . . . . . . FTSE 100 5040 . . . . . . . . . . DAX 4559 . . . . . . . . . . NIKKEI 10366 . . . . . . . . . . .OCT 2001 . . . . . . . . . . .LEHMAN 62.46
. . . and acquired a new corporate
headquarters
4Q 2001

Industry expertise Two deals—ChevronTexaco and PTT—
are a world apart but united by Lehman
Brothers’ global experience and expertise
in energy-sector banking.
Borders mean little these days, so to
succeed on a global scale in investment
banking, we at Lehman Brothers know
that we must have an encompassing view
of the competitive landscape in each
industry we cover and a deep knowledge
of every locale in which we do business.
Instead of just building investment
banking teams by region, we also build
global teams by industry. The banking
teams that advised on these transactions
brought to their clients a far-reaching
knowledge of the energy industry, and
relationship bankers in each country
brought a similarly intimate knowledge
of local exigencies to these transactions.
A “super major” transaction The $43.2 billion merger of Chevron
and Texaco, among the year’s largest
M&A transactions, altered the land-
scape of major international integrated
oil and gas companies. Lehman Brothers
advised Chevron on the acquisition.
The deal created a U.S.–based global
energy company with enhanced scale,
allowing it to compete more effectively
worldwide. ChevronTexaco is now
a powerhouse in the global energy
we’re building vision
on a global scale
S&P 1139 . . . . . . . . . . . . . .
34

. . . . . . . . . . . NASDAQ 1931 . . . . . . . . . . FTSE 100 5204 . . . . . . . . . . DAX 4990 . . . . . . . . . . NIKKEI 10697. . . . . . . . . . LEHMAN 66.15 . . . . . . . . . . NOV 2001
T H A I L A N D
PTT Existing Projects
Gas Pipeline Master Plan 3
TTM Pipeline
Power Plant
Natural Gas Fields
PTT Existing Pipeline
An Asian IPO In November, despite difficult market
conditions in Asia, Lehman Brothers
successfully brought to market PTT
Public Company Limited, a Thai energy
company, in an initial public offering.
Valued at 28 billion Thai baht, the PTT
offering represents the largest-ever Thai
IPO and Thai privatization to date, and
it was the second-largest IPO in Asia, ex-
Japan, in 2001.
The offering met with investor enthu-
siasm, with the international book six
times over-subscribed and demand split
evenly across regions of the world. The
U.S. portion of the IPO, which priced at
the top end of its indicated range, sold
out in a record 85 seconds.
4Q 2001
markets, ranking third in production and
reserves in the U.S. and first in several
regions of the world, including Angola,
the Caspian Sea and the Gulf of Mexico.
35

36

LEHMAN BROTHERS FINANCIAL REVIEW 2001
MANAGEMENT’S DISCUSSION & ANALYSIS of financial condition and results of operations
Financial Summary Fiscal 2001 39
Business Environment 39
Results of Operations 40
Geographic Diversification 44
Non-Interest Expenses 44
Income Taxes 45
Liquidity, Funding and Capital Resources 45
LIQUIDITY RISK MANAGEMENT 45MANAGING LIQUIDITY, FUNDING AND CAPITAL RESOURCES 47TOTAL CAPITAL 48BACK-UP CREDIT FACILITIES 48BALANCE SHEET 49FINANCIAL LEVERAGE 49CREDIT RATINGS 49HIGH YIELD SECURITIES 49PRIVATE EQUITY 50
Summary of Contractual Obligations 50
Off-Balance Sheet Financial Instruments and Derivatives 51
OVERVIEW 51LEHMAN BROTHERS’ USE OF DERIVATIVE INSTRUMENTS 52
Risk Management 53
CREDIT RISK 53MARKET RISK 53VALUE-AT-RISK 54
Significant Accounting Policies 56
New Accounting Developments 57
Effects of Inflation 57
Report of Independent Auditors 58
Consolidated Financial Statements 59
Notes to Consolidated Financial Statements 65
Selected Financial Data 94
TABLE OF CONTENTS
38
39MANAGEMENT’S DISCUSSION & ANALYSIS of financial condition and results of operations
MANAGEMENT’S DISCUSSION & ANALYSISof financial condition and results of operations
Financial Summary Fiscal 2001
In 2001, Lehman Brothers Holdings Inc. (“Holdings”) and
subsidiaries (collectively, the “Company” or “Lehman
Brothers”) reported its second best year of financial results,
surpassed only by last year’s record results. This performance,
in an extremely difficult market environment and coupled
with the direct effects of the September 11 terrorist attack,
demonstrates the depth and resiliency of the Company’s fran-
chise. During the year, the Company continued to strengthen
the depth and breadth of its businesses, achieving top of peer
group financial results and making strategic market share
gains. Market share for global equity origination increased by
41% and global debt origination increased by 14% year-over-
year, respectively, according to Thomson Financial Securities
Data Corp. (“TFSD”). Market share gains were also realized
in key capital markets’ products in 2001, as the Company’s
market share for listed and NASDAQ average trading volumes
increased by 44% and 31%, respectively. The Company also
continued to maintain a strict discipline with regard to its core
competencies of managing expenses, risk management and
capital deployment during the year.
Business Environment
The principal business activities of the Company are investment
banking and securities sales and trading, which by their nature
are subject to volatility, primarily due to changes in interest
and foreign exchange rates and security valuations, global
economic and political trends and industry competition.
As a result, revenues and earnings may vary significantly from
quarter to quarter and from year to year.
Marketplace uncertainties experienced in the second half of
2000 continued into 2001, as lower corporate profits and a
slower pace of economic growth resulted in generally weak
market conditions. The September 11 terrorist attack hastened
the global economic slowdown. In response to these conditions,
the Federal Reserve lowered interest rates ten times during the
fiscal year, bringing the Federal Funds rate to 2.0%. Reductions
in the Federal Funds rate for the fiscal year totaled 450 basis
points. In December 2001, the Federal Reserve again cut the
Federal Funds rate another 25 basis points, bringing the over-
night bank lending rate to its lowest level in nearly 40 years.
As a result of these economic conditions, all of the major
equity markets posted lower returns when compared to the
previous several years. The Dow Jones Industrial Average
(“DJIA”) finished the year at 9,852, down 5% from fiscal
year-end 2000. The NASDAQ Composite and the S&P 500
decreased 26% and 13%, respectively, from the fiscal year-end
of 2000.
Globally, other world markets experienced the same slowing of
economic growth, recessionary fears and declines in equity mar-
ket indexes. The FTSE 100 decreased 15% during the fiscal year
while the DAX decreased 22%. In Asia, the Nikkei was down
almost 30%, resulting in its lowest level in the past two decades.
To help spur economic growth, stabilize markets and boost con-
sumer confidence, major central banks throughout the world
made numerous cuts to their respective lending rates during the
year. The European Central Bank and the Bank of England cut
rates four and seven times, respectively, during the fiscal year.
Equity origination markets continued to feel the effects of the
uncertain economic outlook. Market volume for global initial
public offerings (“IPOs”) was down over 60%, and global equity
origination market volume was down over 25% when compared
to 2000, according to TFSD.
Some of the statements contained in this Management’s Discussion and Analysis of Financial Condition and Results of Operations, including those relating to theCompany’s strategy and other statements that are predictive in nature, that depend upon or refer to future events or conditions or that include words such as “expects,” “anticipates,” “intends,” “plans,” “believes,” “estimates” and similar expressions, are forward-looking statements within the meaning of Section 21E ofthe Securities Exchange Act of 1934. These statements are not historical facts but instead represent only the Company’s expectations, estimates and projectionsregarding future events. These statements are not guarantees of future performance and involve certain risks and uncertainties that are difficult to predict, whichmay include market, credit or counterparty, liquidity, legal and operational risks. Market and liquidity risks include changes in interest and foreign exchange ratesand securities and commodities valuations, the availability and cost of capital and credit, changes in investor sentiment, global economic and political trends and industry competition. Legal risks include legislative and regulatory developments in the U.S. and throughout the world. The Company’s actual results andfinancial condition may differ, perhaps materially, from the anticipated results and financial condition in any such forward-looking statements and, accordingly,readers are cautioned not to place undue reliance on such statements. The Company undertakes no obligation to update any forward-looking statements, whetheras a result of new information, future events or otherwise.
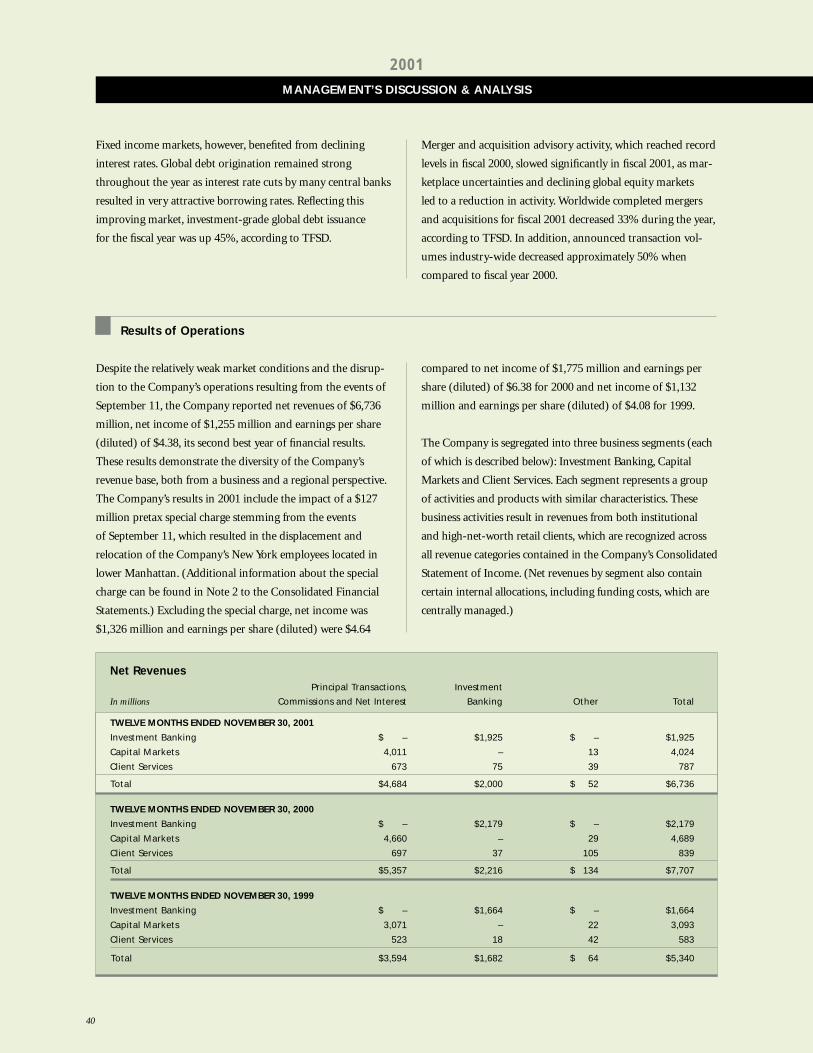
Net RevenuesPrincipal Transactions, Investment
In millions Commissions and Net Interest Banking Other Total
TWELVE MONTHS ENDED NOVEMBER 30, 2001
Investment Banking $ – $1,925 $ – $1,925
Capital Markets 4,011 – 13 4,024
Client Services 673 75 39 787
Total $4,684 $2,000 $ 52 $6,736
TWELVE MONTHS ENDED NOVEMBER 30, 2000
Investment Banking $ – $2,179 $ – $2,179
Capital Markets 4,660 – 29 4,689
Client Services 697 37 105 839
Total $5,357 $2,216 $ 134 $7,707
TWELVE MONTHS ENDED NOVEMBER 30, 1999
Investment Banking $ – $1,664 $ – $1,664
Capital Markets 3,071 – 22 3,093
Client Services 523 18 42 583
Total $3,594 $1,682 $ 64 $5,340
MANAGEMENT’S DISCUSSION & ANALYSIS
2001
40
Fixed income markets, however, benefited from declining
interest rates. Global debt origination remained strong
throughout the year as interest rate cuts by many central banks
resulted in very attractive borrowing rates. Reflecting this
improving market, investment-grade global debt issuance
for the fiscal year was up 45%, according to TFSD.
Merger and acquisition advisory activity, which reached record
levels in fiscal 2000, slowed significantly in fiscal 2001, as mar-
ketplace uncertainties and declining global equity markets
led to a reduction in activity. Worldwide completed mergers
and acquisitions for fiscal 2001 decreased 33% during the year,
according to TFSD. In addition, announced transaction vol-
umes industry-wide decreased approximately 50% when
compared to fiscal year 2000.
Results of Operations
Despite the relatively weak market conditions and the disrup-
tion to the Company’s operations resulting from the events of
September 11, the Company reported net revenues of $6,736
million, net income of $1,255 million and earnings per share
(diluted) of $4.38, its second best year of financial results.
These results demonstrate the diversity of the Company’s
revenue base, both from a business and a regional perspective.
The Company’s results in 2001 include the impact of a $127
million pretax special charge stemming from the events
of September 11, which resulted in the displacement and
relocation of the Company’s New York employees located in
lower Manhattan. (Additional information about the special
charge can be found in Note 2 to the Consolidated Financial
Statements.) Excluding the special charge, net income was
$1,326 million and earnings per share (diluted) were $4.64
compared to net income of $1,775 million and earnings per
share (diluted) of $6.38 for 2000 and net income of $1,132
million and earnings per share (diluted) of $4.08 for 1999.
The Company is segregated into three business segments (each
of which is described below): Investment Banking, Capital
Markets and Client Services. Each segment represents a group
of activities and products with similar characteristics. These
business activities result in revenues from both institutional
and high-net-worth retail clients, which are recognized across
all revenue categories contained in the Company’s Consolidated
Statement of Income. (Net revenues by segment also contain
certain internal allocations, including funding costs, which are
centrally managed.)
41MANAGEMENT’S DISCUSSION & ANALYSIS of financial condition and results of operations
principal international securities and commodities exchanges,
including the London, Tokyo, Hong Kong, Frankfurt, Milan
and Paris stock exchanges. As part of its market-making
customer flow activities, the Company maintains inventory
positions of varying amounts across a broad range of financial
instruments, which are marked-to-market on a daily basis
and, along with any proprietary trading positions, give rise
to principal transactions revenues.
Net revenues from the Company’s market-making, sales and
trading activities are recorded as either principal transactions,
commissions or net interest revenues in the Consolidated
Statement of Income, depending upon the method of execu-
tion, financing and/or hedging related to specific inventory
positions. The majority of these Income Statement categories
combine to comprise the Company’s capital market business.
As such, the Company evaluates its capital markets activities
on an overall basis, combining principal transactions revenues,
commissions and net interest.
Lehman Brothers provides a full array of capital market prod-
ucts and advisory services worldwide. Through the Company’s
banking, research, trading, structuring and distribution capabili-
ties in equity and fixed income products, the Company continues
to effectively build its client/customer business model. This
model focuses on “customer flow” activities, which represent
a majority of the Company’s revenues. In addition to its
customer flow activities, the Company also takes proprietary
positions, the success of which is dependent upon its ability to
anticipate economic and market trends. The Company believes
its customer flow orientation helps to mitigate its overall
revenue volatility.
The Company, through its subsidiaries, is a market-maker
in all major equity and fixed income products in both the
domestic and international markets. In order to facilitate its
trading activities, the Company is a member of all principal
securities and commodities exchanges in the United States
and holds memberships or associate memberships on several
Investment Banking
This segment’s net revenues result from fees earned by the
Company for underwriting public and private offerings of
fixed income and equity securities, and advising clients on
merger and acquisition activities and other services. The
division is structured into global industry groups—
Communications & Media, Consumer/Retailing, Financial
Institutions, Financial Sponsors, Healthcare, Industrial, Natural
Resources, Power, Real Estate and Technology—where senior
bankers deliver industry knowledge and the resources to meet
clients’ objectives. Specialized product groups within Mergers
and Acquisitions, Equity Capital Markets, Debt Capital Markets,
Leveraged Finance and Private Placements are partnered with
global relationship managers in the industry groups to provide
comprehensive solutions for clients. The Firm’s specialists in
new product development, tax and derivatives also are utilized
to offer the expertise to tailor specific structures for clients.
During 2001, the Investment Banking division increased its
headcount by approximately 11%.
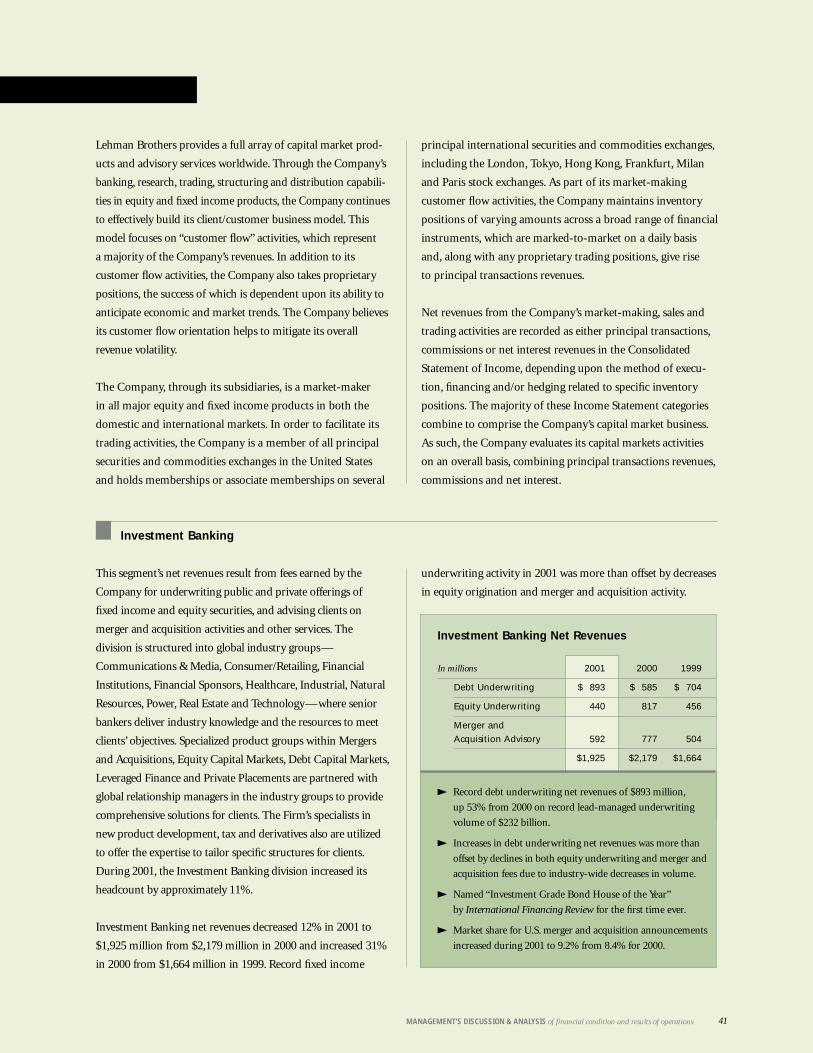
Investment Banking net revenues decreased 12% in 2001 to
$1,925 million from $2,179 million in 2000 and increased 31%
in 2000 from $1,664 million in 1999. Record fixed income
underwriting activity in 2001 was more than offset by decreases
in equity origination and merger and acquisition activity.
Record debt underwriting net revenues of $893 million,
up 53% from 2000 on record lead-managed underwriting
volume of $232 billion.
Increases in debt underwriting net revenues was more than
offset by declines in both equity underwriting and merger and
acquisition fees due to industry-wide decreases in volume.
Named “Investment Grade Bond House of the Year”
by International Financing Review for the first time ever.
Market share for U.S. merger and acquisition announcements
increased during 2001 to 9.2% from 8.4% for 2000.
Investment Banking Net Revenues
In millions 2001 2000 1999
Debt Underwriting $ 893 $ 585 $ 704
Equity Underwriting 440 817 456
Merger andAcquisition Advisory 592 777 504
$1,925 $2,179 $1,664
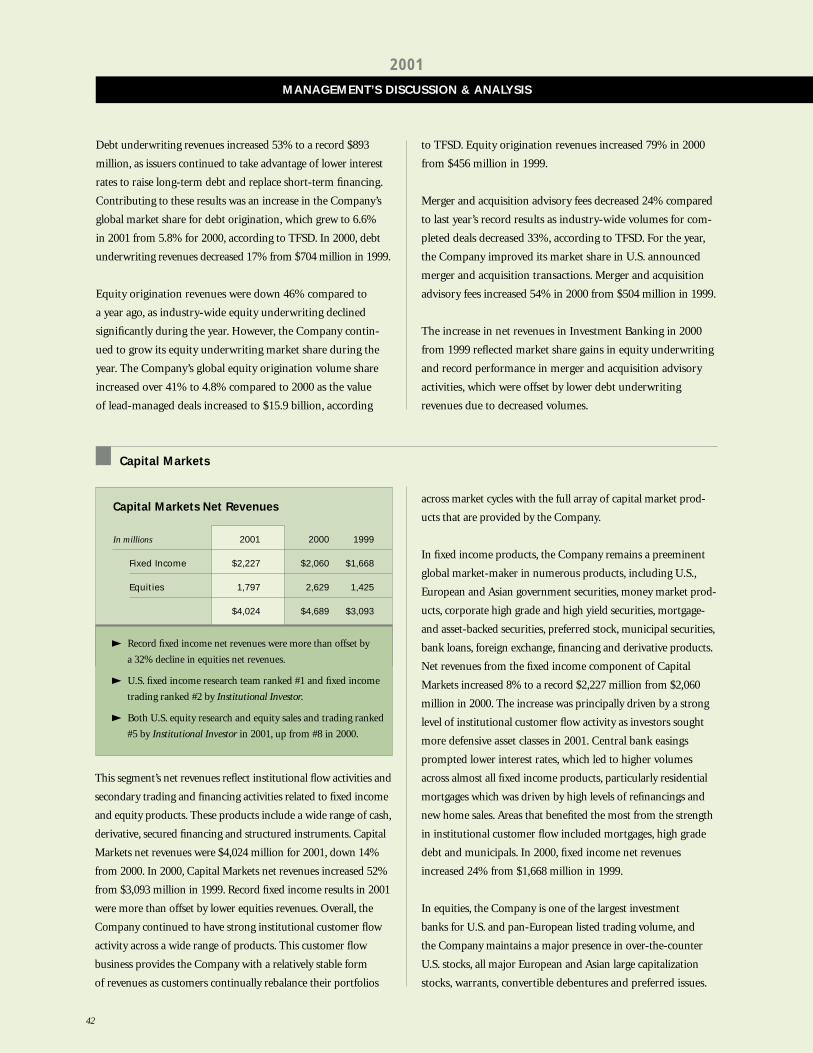
Capital Markets
This segment’s net revenues reflect institutional flow activities and
secondary trading and financing activities related to fixed income
and equity products. These products include a wide range of cash,
derivative, secured financing and structured instruments. Capital
Markets net revenues were $4,024 million for 2001, down 14%
from 2000. In 2000, Capital Markets net revenues increased 52%
from $3,093 million in 1999. Record fixed income results in 2001
were more than offset by lower equities revenues. Overall, the
Company continued to have strong institutional customer flow
activity across a wide range of products. This customer flow
business provides the Company with a relatively stable form
of revenues as customers continually rebalance their portfolios
MANAGEMENT’S DISCUSSION & ANALYSIS
2001
42
across market cycles with the full array of capital market prod-
ucts that are provided by the Company.
In fixed income products, the Company remains a preeminent
global market-maker in numerous products, including U.S.,
European and Asian government securities, money market prod-
ucts, corporate high grade and high yield securities, mortgage-
and asset-backed securities, preferred stock, municipal securities,
bank loans, foreign exchange, financing and derivative products.
Net revenues from the fixed income component of Capital
Markets increased 8% to a record $2,227 million from $2,060
million in 2000. The increase was principally driven by a strong
level of institutional customer flow activity as investors sought
more defensive asset classes in 2001. Central bank easings
prompted lower interest rates, which led to higher volumes
across almost all fixed income products, particularly residential
mortgages which was driven by high levels of refinancings and
new home sales. Areas that benefited the most from the strength
in institutional customer flow included mortgages, high grade
debt and municipals. In 2000, fixed income net revenues
increased 24% from $1,668 million in 1999.
In equities, the Company is one of the largest investment
banks for U.S. and pan-European listed trading volume, and
the Company maintains a major presence in over-the-counter
U.S. stocks, all major European and Asian large capitalization
stocks, warrants, convertible debentures and preferred issues.
Capital Markets Net Revenues
In millions 2001 2000 1999
Fixed Income $2,227 $2,060 $1,668
Equities 1,797 2,629 1,425
$4,024 $4,689 $3,093
Record fixed income net revenues were more than offset by
a 32% decline in equities net revenues.
U.S. fixed income research team ranked #1 and fixed income
trading ranked #2 by Institutional Investor.
Both U.S. equity research and equity sales and trading ranked
#5 by Institutional Investor in 2001, up from #8 in 2000.
Debt underwriting revenues increased 53% to a record $893
million, as issuers continued to take advantage of lower interest
rates to raise long-term debt and replace short-term financing.
Contributing to these results was an increase in the Company’s
global market share for debt origination, which grew to 6.6%
in 2001 from 5.8% for 2000, according to TFSD. In 2000, debt
underwriting revenues decreased 17% from $704 million in 1999.
Equity origination revenues were down 46% compared to
a year ago, as industry-wide equity underwriting declined
significantly during the year. However, the Company contin-
ued to grow its equity underwriting market share during the
year. The Company’s global equity origination volume share
increased over 41% to 4.8% compared to 2000 as the value
of lead-managed deals increased to $15.9 billion, according
to TFSD. Equity origination revenues increased 79% in 2000
from $456 million in 1999.
Merger and acquisition advisory fees decreased 24% compared
to last year’s record results as industry-wide volumes for com-
pleted deals decreased 33%, according to TFSD. For the year,
the Company improved its market share in U.S. announced
merger and acquisition transactions. Merger and acquisition
advisory fees increased 54% in 2000 from $504 million in 1999.
The increase in net revenues in Investment Banking in 2000
from 1999 reflected market share gains in equity underwriting
and record performance in merger and acquisition advisory
activities, which were offset by lower debt underwriting
revenues due to decreased volumes.
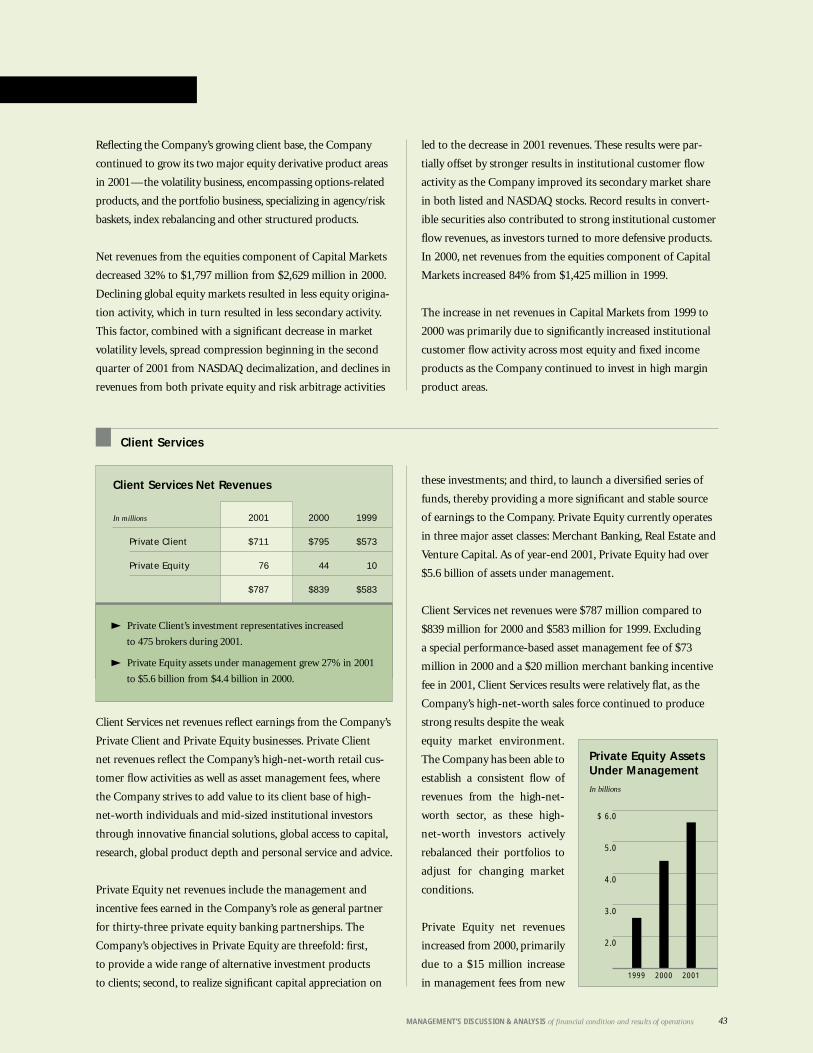
43MANAGEMENT’S DISCUSSION & ANALYSIS of financial condition and results of operations
Reflecting the Company’s growing client base, the Company
continued to grow its two major equity derivative product areas
in 2001—the volatility business, encompassing options-related
products, and the portfolio business, specializing in agency/risk
baskets, index rebalancing and other structured products.
Net revenues from the equities component of Capital Markets
decreased 32% to $1,797 million from $2,629 million in 2000.
Declining global equity markets resulted in less equity origina-
tion activity, which in turn resulted in less secondary activity.
This factor, combined with a significant decrease in market
volatility levels, spread compression beginning in the second
quarter of 2001 from NASDAQ decimalization, and declines in
revenues from both private equity and risk arbitrage activities
led to the decrease in 2001 revenues. These results were par-
tially offset by stronger results in institutional customer flow
activity as the Company improved its secondary market share
in both listed and NASDAQ stocks. Record results in convert-
ible securities also contributed to strong institutional customer
flow revenues, as investors turned to more defensive products.
In 2000, net revenues from the equities component of Capital
Markets increased 84% from $1,425 million in 1999.
The increase in net revenues in Capital Markets from 1999 to
2000 was primarily due to significantly increased institutional
customer flow activity across most equity and fixed income
products as the Company continued to invest in high margin
product areas.
Client Services net revenues reflect earnings from the Company’s
Private Client and Private Equity businesses. Private Client
net revenues reflect the Company’s high-net-worth retail cus-
tomer flow activities as well as asset management fees, where
the Company strives to add value to its client base of high-
net-worth individuals and mid-sized institutional investors
through innovative financial solutions, global access to capital,
research, global product depth and personal service and advice.
Private Equity net revenues include the management and
incentive fees earned in the Company’s role as general partner
for thirty-three private equity banking partnerships. The
Company’s objectives in Private Equity are threefold: first,
to provide a wide range of alternative investment products
to clients; second, to realize significant capital appreciation on
these investments; and third, to launch a diversified series of
funds, thereby providing a more significant and stable source
of earnings to the Company. Private Equity currently operates
in three major asset classes: Merchant Banking, Real Estate and
Venture Capital. As of year-end 2001, Private Equity had over
$5.6 billion of assets under management.
Client Services net revenues were $787 million compared to
$839 million for 2000 and $583 million for 1999. Excluding
a special performance-based asset management fee of $73
million in 2000 and a $20 million merchant banking incentive
fee in 2001, Client Services results were relatively flat, as the
Company’s high-net-worth sales force continued to produce
strong results despite the weak
equity market environment.
The Company has been able to
establish a consistent flow of
revenues from the high-net-
worth sector, as these high-
net-worth investors actively
rebalanced their portfolios to
adjust for changing market
conditions.
Private Equity net revenues
increased from 2000, primarily
due to a $15 million increase
in management fees from new
Client Services
Private Client’s investment representatives increased
to 475 brokers during 2001.
Private Equity assets under management grew 27% in 2001
to $5.6 billion from $4.4 billion in 2000.
Private Equity AssetsUnder ManagementIn billions
$ 6.0
5.0
4.0
3.0
2.0
1999 2000 2001
Client Services Net Revenues
In millions 2001 2000 1999
Private Client $711 $795 $573
Private Equity 76 44 10
$787 $839 $583
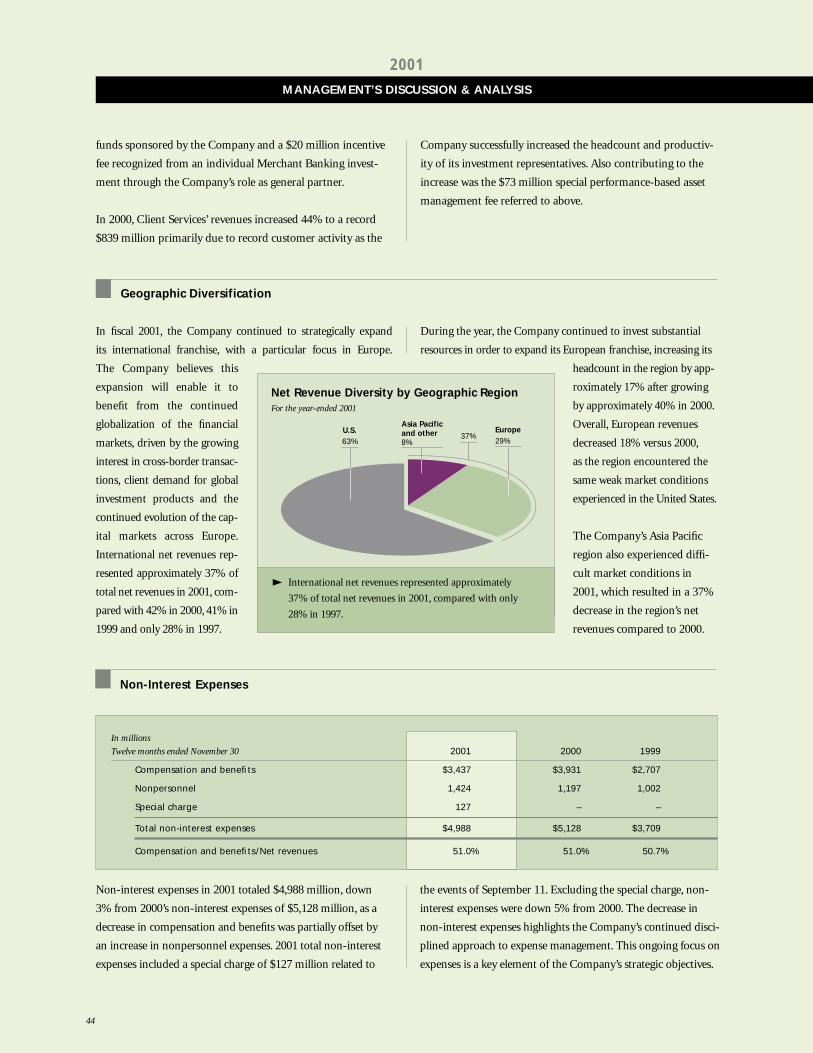
MANAGEMENT’S DISCUSSION & ANALYSIS
2001
In millions
Twelve months ended November 30 2001 2000 1999
Compensation and benefits $3,437 $3,931 $2,707
Nonpersonnel 1,424 1,197 1,002
Special charge 127 – –
Total non-interest expenses $4,988 $5,128 $3,709
Compensation and benefits /Net revenues 51.0% 51.0% 50.7%
44
Geographic Diversification
In fiscal 2001, the Company continued to strategically expand
its international franchise, with a particular focus in Europe.
The Company believes this
expansion will enable it to
benefit from the continued
globalization of the financial
markets, driven by the growing
interest in cross-border transac-
tions, client demand for global
investment products and the
continued evolution of the cap-
ital markets across Europe.
International net revenues rep-
resented approximately 37% of
total net revenues in 2001, com-
pared with 42% in 2000, 41% in
1999 and only 28% in 1997.
funds sponsored by the Company and a $20 million incentive
fee recognized from an individual Merchant Banking invest-
ment through the Company’s role as general partner.
In 2000, Client Services’ revenues increased 44% to a record
$839 million primarily due to record customer activity as the
During the year, the Company continued to invest substantial
resources in order to expand its European franchise, increasing its
headcount in the region by app-
roximately 17% after growing
by approximately 40% in 2000.
Overall, European revenues
decreased 18% versus 2000,
as the region encountered the
same weak market conditions
experienced in the United States.
The Company’s Asia Pacific
region also experienced diffi-
cult market conditions in
2001, which resulted in a 37%
decrease in the region’s net
revenues compared to 2000.
Company successfully increased the headcount and productiv-
ity of its investment representatives. Also contributing to the
increase was the $73 million special performance-based asset
management fee referred to above.
Non-Interest Expenses
Net Revenue Diversity by Geographic RegionFor the year-ended 2001
U.S.63%
Non-interest expenses in 2001 totaled $4,988 million, down
3% from 2000’s non-interest expenses of $5,128 million, as a
decrease in compensation and benefits was partially offset by
an increase in nonpersonnel expenses. 2001 total non-interest
expenses included a special charge of $127 million related to
the events of September 11. Excluding the special charge, non-
interest expenses were down 5% from 2000. The decrease in
non-interest expenses highlights the Company’s continued disci-
plined approach to expense management. This ongoing focus on
expenses is a key element of the Company’s strategic objectives.
International net revenues represented approximately
37% of total net revenues in 2001, compared with only
28% in 1997.
Europe29%
Asia Pacificand other8%
37%
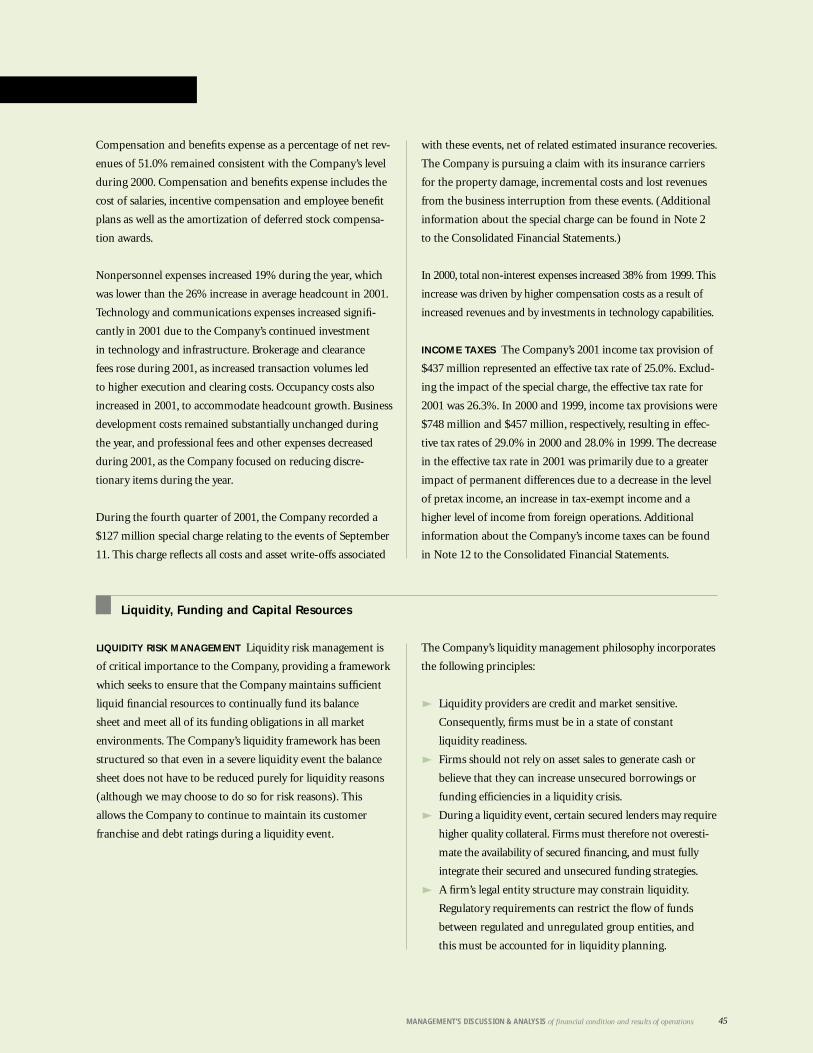
45MANAGEMENT’S DISCUSSION & ANALYSIS of financial condition and results of operations
Compensation and benefits expense as a percentage of net rev-
enues of 51.0% remained consistent with the Company’s level
during 2000. Compensation and benefits expense includes the
cost of salaries, incentive compensation and employee benefit
plans as well as the amortization of deferred stock compensa-
tion awards.
Nonpersonnel expenses increased 19% during the year, which
was lower than the 26% increase in average headcount in 2001.
Technology and communications expenses increased signifi-
cantly in 2001 due to the Company’s continued investment
in technology and infrastructure. Brokerage and clearance
fees rose during 2001, as increased transaction volumes led
to higher execution and clearing costs. Occupancy costs also
increased in 2001, to accommodate headcount growth. Business
development costs remained substantially unchanged during
the year, and professional fees and other expenses decreased
during 2001, as the Company focused on reducing discre-
tionary items during the year.
During the fourth quarter of 2001, the Company recorded a
$127 million special charge relating to the events of September
11. This charge reflects all costs and asset write-offs associated
with these events, net of related estimated insurance recoveries.
The Company is pursuing a claim with its insurance carriers
for the property damage, incremental costs and lost revenues
from the business interruption from these events. (Additional
information about the special charge can be found in Note 2
to the Consolidated Financial Statements.)
In 2000, total non-interest expenses increased 38% from 1999. This
increase was driven by higher compensation costs as a result of
increased revenues and by investments in technology capabilities.
INCOME TAXES The Company’s 2001 income tax provision of
$437 million represented an effective tax rate of 25.0%. Exclud-
ing the impact of the special charge, the effective tax rate for
2001 was 26.3%. In 2000 and 1999, income tax provisions were
$748 million and $457 million, respectively, resulting in effec-
tive tax rates of 29.0% in 2000 and 28.0% in 1999. The decrease
in the effective tax rate in 2001 was primarily due to a greater
impact of permanent differences due to a decrease in the level
of pretax income, an increase in tax-exempt income and a
higher level of income from foreign operations. Additional
information about the Company’s income taxes can be found
in Note 12 to the Consolidated Financial Statements.
Liquidity, Funding and Capital Resources
LIQUIDITY RISK MANAGEMENT Liquidity risk management is
of critical importance to the Company, providing a framework
which seeks to ensure that the Company maintains sufficient
liquid financial resources to continually fund its balance
sheet and meet all of its funding obligations in all market
environments. The Company’s liquidity framework has been
structured so that even in a severe liquidity event the balance
sheet does not have to be reduced purely for liquidity reasons
(although we may choose to do so for risk reasons). This
allows the Company to continue to maintain its customer
franchise and debt ratings during a liquidity event.
The Company’s liquidity management philosophy incorporates
the following principles:
Liquidity providers are credit and market sensitive.
Consequently, firms must be in a state of constant
liquidity readiness.
Firms should not rely on asset sales to generate cash or
believe that they can increase unsecured borrowings or
funding efficiencies in a liquidity crisis.
During a liquidity event, certain secured lenders may require
higher quality collateral. Firms must therefore not overesti-
mate the availability of secured financing, and must fully
integrate their secured and unsecured funding strategies.
A firm’s legal entity structure may constrain liquidity.
Regulatory requirements can restrict the flow of funds
between regulated and unregulated group entities, and
this must be accounted for in liquidity planning.

MANAGEMENT’S DISCUSSION & ANALYSIS
2001
46
The Company’s Funding Framework incorporates these
principles and mitigates liquidity risk wherever possible.
This Framework is comprised of four major components:
The Cash Capital Model—which evaluates the amount
of long-term liabilities—with remaining maturities of
over one year—that are required to fund the Company.
The model requires that the following must be funded with
cash capital:
Secured funding “haircuts,” to reflect the estimated value
of cash that would be advanced to the Company by coun-
terparties against available inventory.
Fixed assets and goodwill.
Operational cash at banks and unpledged assets independ-
ent of collateral quality; the Company assumes that it will
not be able to operate with lower requirements in a stress
environment than the Company currently operates with
in a normal environment.
The Company operates with a surplus of cash capital sources
over cash capital uses. To ensure that the Company is always
operating “within its means,” the businesses operate within
strict cash capital limits. This limit culture has been institu-
tionalized, and this policy engages the entire Company in
managing liquidity.
1
The Reliable Secured Funding Model (“RSFM”)—which
forecasts the reliable sources of overnight secured funding
available to the Company.
The RSFM represents our assessment of the reliable secured
funding capacity, by asset class, that we would anticipate
in a liquidity event. The Company pays careful attention
to validating this capacity through a periodic counterparty
by counterparty, product by product review, which draws upon
the Company’s understanding of the financing franchise
and experience.
In cases where a business has inventory at a level above its
RSFM, the Company requires the excess to be funded on a
term basis with a maturity in excess of three months. If this
is not feasible, the Company will then provide for this in its
liquidity cushion—a cash amount with a remaining term in
excess of 90 days. The cost of maintaining the liquidity cushion
is borne by the business and encourages the development of
secured funding capacity in line with balance sheet growth.
The Company has increased the RSFM for certain asset classes
through the use of favorable legal entity structures, such as
Lehman Brothers Bank (Thrift) and Lehman Brothers
Bankhaus. These entities operate in a deposit protected envi-
ronment and are therefore able to source low cost unsecured
funds that are insulated from a company-wide or market
specific event, while providing reliable funding for mortgage
products and other loan assets.
2
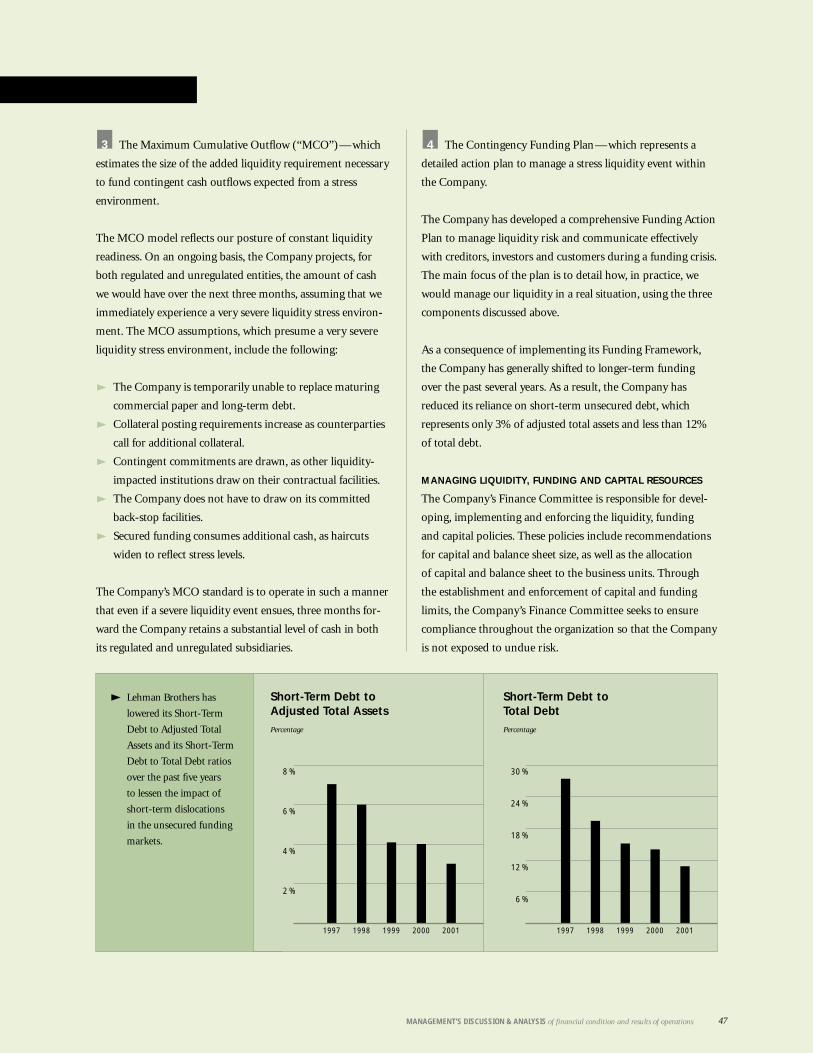
47MANAGEMENT’S DISCUSSION & ANALYSIS of financial condition and results of operations
Short-Term Debt toAdjusted Total AssetsPercentage
8 %
6 %
4 %
2 %
199919981997 2000 2001
Short-Term Debt to Total DebtPercentage
30 %
24 %
18 %
12 %
6 %
Lehman Brothers has
lowered its Short-Term
Debt to Adjusted Total
Assets and its Short-Term
Debt to Total Debt ratios
over the past five years
to lessen the impact of
short-term dislocations
in the unsecured funding
markets.
199919981997 2000 2001
The Maximum Cumulative Outflow (“MCO”)—which
estimates the size of the added liquidity requirement necessary
to fund contingent cash outflows expected from a stress
environment.
The MCO model reflects our posture of constant liquidity
readiness. On an ongoing basis, the Company projects, for
both regulated and unregulated entities, the amount of cash
we would have over the next three months, assuming that we
immediately experience a very severe liquidity stress environ-
ment. The MCO assumptions, which presume a very severe
liquidity stress environment, include the following:
The Company is temporarily unable to replace maturing
commercial paper and long-term debt.
Collateral posting requirements increase as counterparties
call for additional collateral.
Contingent commitments are drawn, as other liquidity-
impacted institutions draw on their contractual facilities.
The Company does not have to draw on its committed
back-stop facilities.
Secured funding consumes additional cash, as haircuts
widen to reflect stress levels.
The Company’s MCO standard is to operate in such a manner
that even if a severe liquidity event ensues, three months for-
ward the Company retains a substantial level of cash in both
its regulated and unregulated subsidiaries.
3 The Contingency Funding Plan—which represents a
detailed action plan to manage a stress liquidity event within
the Company.
The Company has developed a comprehensive Funding Action
Plan to manage liquidity risk and communicate effectively
with creditors, investors and customers during a funding crisis.
The main focus of the plan is to detail how, in practice, we
would manage our liquidity in a real situation, using the three
components discussed above.
As a consequence of implementing its Funding Framework,
the Company has generally shifted to longer-term funding
over the past several years. As a result, the Company has
reduced its reliance on short-term unsecured debt, which
represents only 3% of adjusted total assets and less than 12%
of total debt.
MANAGING LIQUIDITY, FUNDING AND CAPITAL RESOURCES
The Company’s Finance Committee is responsible for devel-
oping, implementing and enforcing the liquidity, funding
and capital policies. These policies include recommendations
for capital and balance sheet size, as well as the allocation
of capital and balance sheet to the business units. Through
the establishment and enforcement of capital and funding
limits, the Company’s Finance Committee seeks to ensure
compliance throughout the organization so that the Company
is not exposed to undue risk.
4
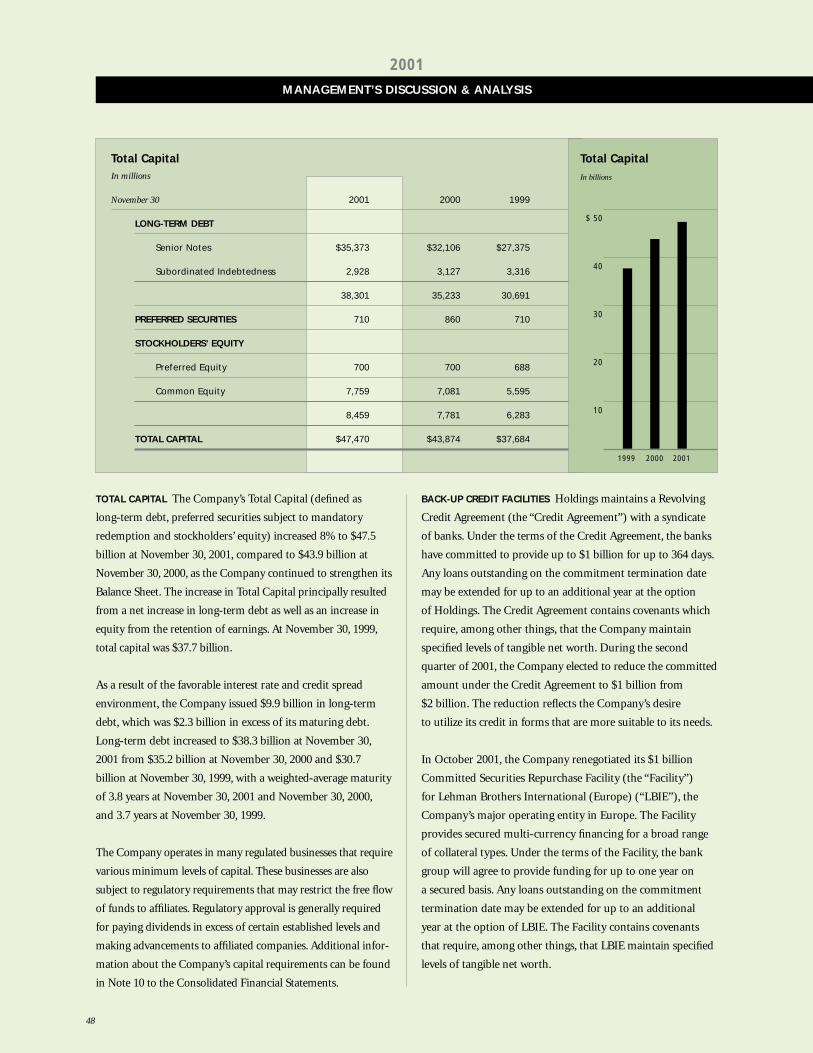
MANAGEMENT’S DISCUSSION & ANALYSIS
2001
48
TOTAL CAPITAL The Company’s Total Capital (defined as
long-term debt, preferred securities subject to mandatory
redemption and stockholders’ equity) increased 8% to $47.5
billion at November 30, 2001, compared to $43.9 billion at
November 30, 2000, as the Company continued to strengthen its
Balance Sheet. The increase in Total Capital principally resulted
from a net increase in long-term debt as well as an increase in
equity from the retention of earnings. At November 30, 1999,
total capital was $37.7 billion.
As a result of the favorable interest rate and credit spread
environment, the Company issued $9.9 billion in long-term
debt, which was $2.3 billion in excess of its maturing debt.
Long-term debt increased to $38.3 billion at November 30,
2001 from $35.2 billion at November 30, 2000 and $30.7
billion at November 30, 1999, with a weighted-average maturity
of 3.8 years at November 30, 2001 and November 30, 2000,
and 3.7 years at November 30, 1999.
The Company operates in many regulated businesses that require
various minimum levels of capital. These businesses are also
subject to regulatory requirements that may restrict the free flow
of funds to affiliates. Regulatory approval is generally required
for paying dividends in excess of certain established levels and
making advancements to affiliated companies. Additional infor-
mation about the Company’s capital requirements can be found
in Note 10 to the Consolidated Financial Statements.
BACK-UP CREDIT FACILITIES Holdings maintains a Revolving
Credit Agreement (the “Credit Agreement”) with a syndicate
of banks. Under the terms of the Credit Agreement, the banks
have committed to provide up to $1 billion for up to 364 days.
Any loans outstanding on the commitment termination date
may be extended for up to an additional year at the option
of Holdings. The Credit Agreement contains covenants which
require, among other things, that the Company maintain
specified levels of tangible net worth. During the second
quarter of 2001, the Company elected to reduce the committed
amount under the Credit Agreement to $1 billion from
$2 billion. The reduction reflects the Company’s desire
to utilize its credit in forms that are more suitable to its needs.
In October 2001, the Company renegotiated its $1 billion
Committed Securities Repurchase Facility (the “Facility”)
for Lehman Brothers International (Europe) (“LBIE”), the
Company’s major operating entity in Europe. The Facility
provides secured multi-currency financing for a broad range
of collateral types. Under the terms of the Facility, the bank
group will agree to provide funding for up to one year on
a secured basis. Any loans outstanding on the commitment
termination date may be extended for up to an additional
year at the option of LBIE. The Facility contains covenants
that require, among other things, that LBIE maintain specified
levels of tangible net worth.
Total CapitalIn millions
November 30 2001 2000 1999
LONG-TERM DEBT
Senior Notes $35,373 $32,106 $27,375
Subordinated Indebtedness 2,928 3,127 3,316
38,301 35,233 30,691
PREFERRED SECURITIES 710 860 710
STOCKHOLDERS’ EQUITY
Preferred Equity 700 700 688
Common Equity 7,759 7,081 5,595
8,459 7,781 6,283
TOTAL CAPITAL $47,470 $43,874 $37,684
Total CapitalIn billions
$ 50
40
30
20
10
1999 2000 2001
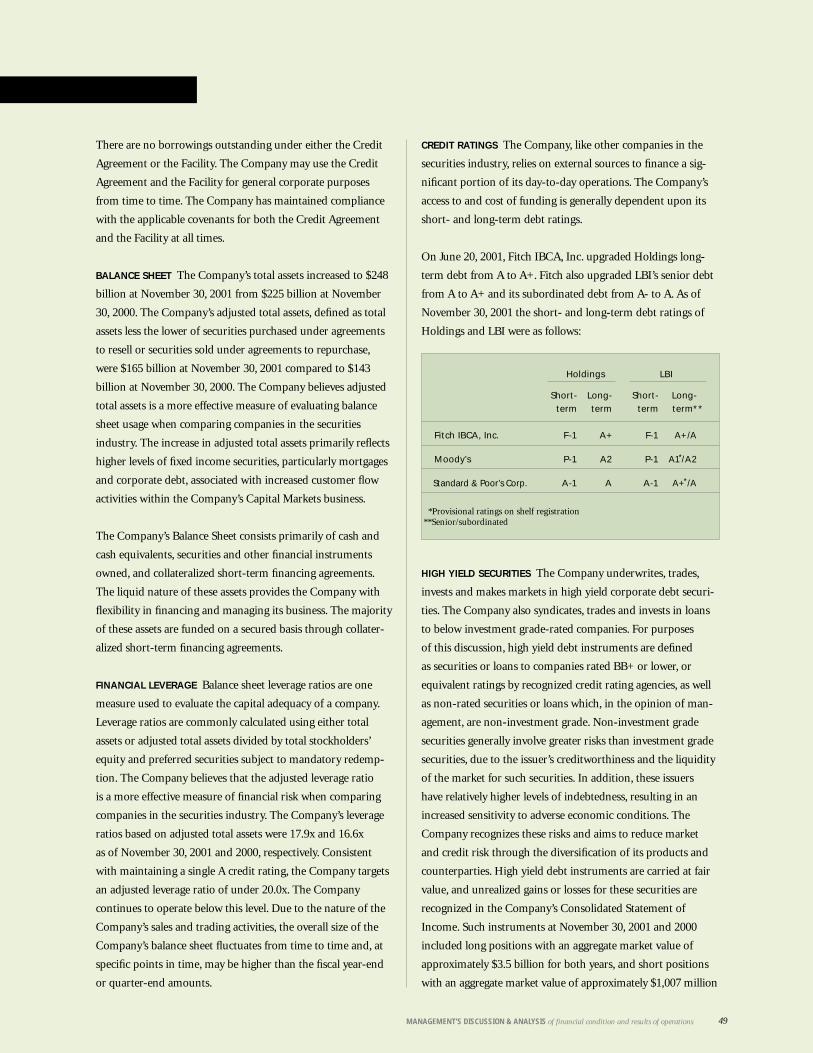
49MANAGEMENT’S DISCUSSION & ANALYSIS of financial condition and results of operations
There are no borrowings outstanding under either the Credit
Agreement or the Facility. The Company may use the Credit
Agreement and the Facility for general corporate purposes
from time to time. The Company has maintained compliance
with the applicable covenants for both the Credit Agreement
and the Facility at all times.
BALANCE SHEET The Company’s total assets increased to $248
billion at November 30, 2001 from $225 billion at November
30, 2000. The Company’s adjusted total assets, defined as total
assets less the lower of securities purchased under agreements
to resell or securities sold under agreements to repurchase,
were $165 billion at November 30, 2001 compared to $143
billion at November 30, 2000. The Company believes adjusted
total assets is a more effective measure of evaluating balance
sheet usage when comparing companies in the securities
industry. The increase in adjusted total assets primarily reflects
higher levels of fixed income securities, particularly mortgages
and corporate debt, associated with increased customer flow
activities within the Company’s Capital Markets business.
The Company’s Balance Sheet consists primarily of cash and
cash equivalents, securities and other financial instruments
owned, and collateralized short-term financing agreements.
The liquid nature of these assets provides the Company with
flexibility in financing and managing its business. The majority
of these assets are funded on a secured basis through collater-
alized short-term financing agreements.
FINANCIAL LEVERAGE Balance sheet leverage ratios are one
measure used to evaluate the capital adequacy of a company.
Leverage ratios are commonly calculated using either total
assets or adjusted total assets divided by total stockholders’
equity and preferred securities subject to mandatory redemp-
tion. The Company believes that the adjusted leverage ratio
is a more effective measure of financial risk when comparing
companies in the securities industry. The Company’s leverage
ratios based on adjusted total assets were 17.9x and 16.6x
as of November 30, 2001 and 2000, respectively. Consistent
with maintaining a single A credit rating, the Company targets
an adjusted leverage ratio of under 20.0x. The Company
continues to operate below this level. Due to the nature of the
Company’s sales and trading activities, the overall size of the
Company’s balance sheet fluctuates from time to time and, at
specific points in time, may be higher than the fiscal year-end
or quarter-end amounts.
CREDIT RATINGS The Company, like other companies in the
securities industry, relies on external sources to finance a sig-
nificant portion of its day-to-day operations. The Company’s
access to and cost of funding is generally dependent upon its
short- and long-term debt ratings.
On June 20, 2001, Fitch IBCA, Inc. upgraded Holdings long-
term debt from A to A+. Fitch also upgraded LBI’s senior debt
from A to A+ and its subordinated debt from A- to A. As of
November 30, 2001 the short- and long-term debt ratings of
Holdings and LBI were as follows:
HIGH YIELD SECURITIES The Company underwrites, trades,
invests and makes markets in high yield corporate debt securi-
ties. The Company also syndicates, trades and invests in loans
to below investment grade-rated companies. For purposes
of this discussion, high yield debt instruments are defined
as securities or loans to companies rated BB+ or lower, or
equivalent ratings by recognized credit rating agencies, as well
as non-rated securities or loans which, in the opinion of man-
agement, are non-investment grade. Non-investment grade
securities generally involve greater risks than investment grade
securities, due to the issuer’s creditworthiness and the liquidity
of the market for such securities. In addition, these issuers
have relatively higher levels of indebtedness, resulting in an
increased sensitivity to adverse economic conditions. The
Company recognizes these risks and aims to reduce market
and credit risk through the diversification of its products and
counterparties. High yield debt instruments are carried at fair
value, and unrealized gains or losses for these securities are
recognized in the Company’s Consolidated Statement of
Income. Such instruments at November 30, 2001 and 2000
included long positions with an aggregate market value of
approximately $3.5 billion for both years, and short positions
with an aggregate market value of approximately $1,007 million
Holdings LBI
Short- Long- Short- Long-term term term term**
Fitch IBCA, Inc. F-1 A+ F-1 A+/A
Moody’s P-1 A2 P-1 A1*/A2
Standard & Poor’s Corp. A-1 A A-1 A+*/A
*Provisional ratings on shelf registration **Senior/subordinated
MANAGEMENT’S DISCUSSION & ANALYSIS
2001
50
As of November 30, 2001 and 2000, the Company was contin-
gently liable for $1.1 billion and $2.1 billion, respectively, of
letters of credit, primarily used to provide collateral for securi-
ties and commodities borrowed and to satisfy margin deposits
at option and commodity exchanges, and other guarantees.
In connection with its financing activities, the Company had
outstanding commitments under certain lending arrangements
of approximately $2.1 billion and $3.2 billion, at November 30,
2001 and 2000, respectively. These commitments require
borrowers to provide acceptable collateral, as defined in the
agreements, when amounts are drawn under the lending facili-
ties. Advances made under the above lending arrangements
are typically at variable interest rates and generally provide
for over-collateralization based upon the borrowers’ creditwor-
thiness. In addition, at November 30, 2001 the Company had
commitments to enter into forward starting secured resale
and repurchase agreements of $52.3 billion and $26.5 billion,
respectively, as compared to $51.9 billion and $17.0 billion,
respectively, at November 30, 2000.
In addition, the Company, through its high grade and high yield
sales, trading and underwriting activities, makes commitments
to extend credit in loan syndication transactions. The Company
utilizes various hedging and funding strategies to actively man-
age its market, credit and liquidity exposures on these commit-
ments. In addition, total commitments are not indicative of
Summary of Contractual Obligations
actual risk or funding requirements, as the commitments may
not be drawn or fully utilized. These commitments and any
related draw downs of these facilities typically have fixed matu-
rity dates and are contingent upon certain representations, war-
ranties and contractual conditions applicable to the borrower.
At November 30, 2001 and 2000, the Company had net
lending commitments to investment grade borrowers of $4.1
billion (gross commitments of $5.9 billion less $1.8 billion of
associated hedges) and $4.3 billion ($4.4 billion of gross com-
mitments and $0.1 billion of associated hedges), respectively.
Lending commitments to non-investment grade borrowers
totaled $1.4 billion and $1.3 billion at November 30, 2001
and 2000, respectively. In addition, at November 30, 2001 and
2000, the Company has pre-arranged funding facilities with
third party lenders of $4.9 billion and $3.8 billion, respectively,
available to it to fund draw downs against these commitments.
These funding facilities contain limits for certain concentra-
tions of counterparty, industry or credit ratings of the under-
lying loans.
As of November 30, 2001 and 2000, the Company had
commitments to invest up to $555 million and $357 million,
respectively, directly and through partnerships in private
equity related investments. These commitments will be funded
as required through the end of the respective investment
periods, principally expiring in 2004.
and $745 million, respectively. The Company mitigates its
aggregate and single-issuer net exposure through the use of
derivatives, sole-recourse securitization financing, and other
financial instruments.
PRIVATE EQUITY The Company has investments in thirty-three
private equity-related partnerships, for which the Company
acts as general partner, as well as related direct investments.
At November 30, 2001 and 2000, the Company’s investment in
these partnerships totaled $229 million and $149 million,
respectively, and direct investments totaled $597 million and
$678 million, respectively. The Company’s policy is to carry its
investments, including the appreciation of its general partner-
ship interests, at fair value based upon the Company’s assess-
ment of the underlying investments. Additional information
about the Company’s private equity activities, including related
commitments, can be found in Note 16 to the Consolidated
Financial Statements.
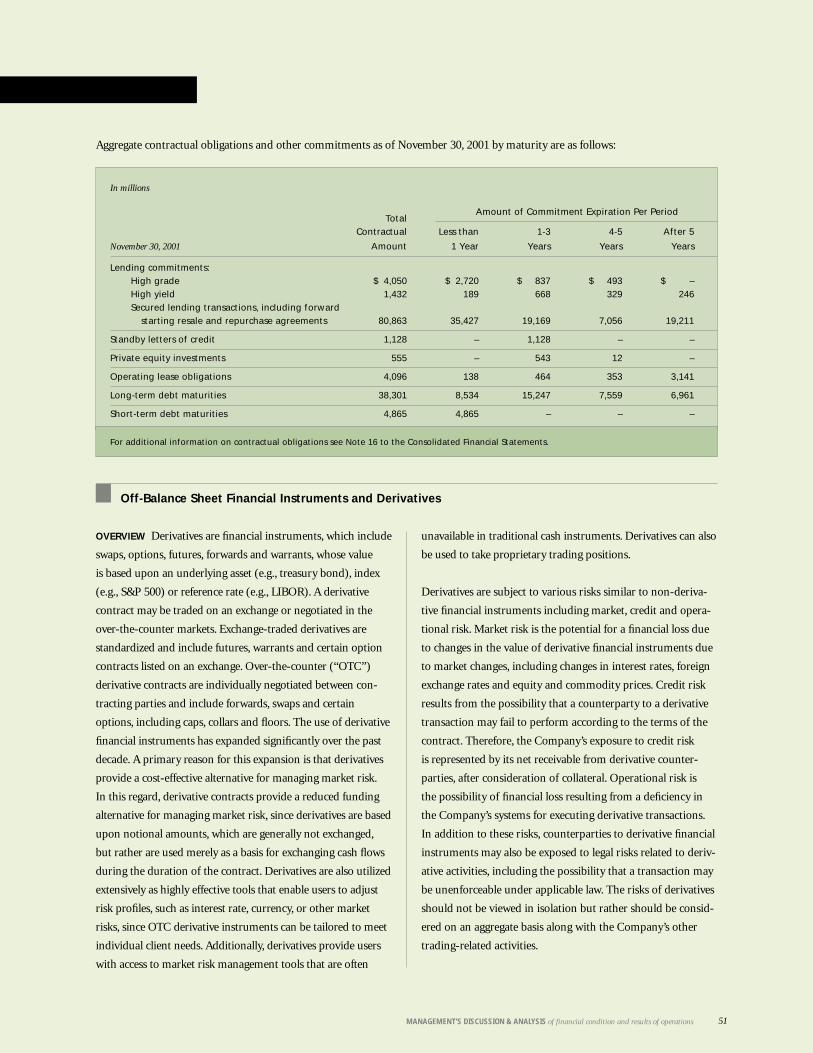
51MANAGEMENT’S DISCUSSION & ANALYSIS of financial condition and results of operations
Aggregate contractual obligations and other commitments as of November 30, 2001 by maturity are as follows:
OVERVIEW Derivatives are financial instruments, which include
swaps, options, futures, forwards and warrants, whose value
is based upon an underlying asset (e.g., treasury bond), index
(e.g., S&P 500) or reference rate (e.g., LIBOR). A derivative
contract may be traded on an exchange or negotiated in the
over-the-counter markets. Exchange-traded derivatives are
standardized and include futures, warrants and certain option
contracts listed on an exchange. Over-the-counter (“OTC”)
derivative contracts are individually negotiated between con-
tracting parties and include forwards, swaps and certain
options, including caps, collars and floors. The use of derivative
financial instruments has expanded significantly over the past
decade. A primary reason for this expansion is that derivatives
provide a cost-effective alternative for managing market risk.
In this regard, derivative contracts provide a reduced funding
alternative for managing market risk, since derivatives are based
upon notional amounts, which are generally not exchanged,
but rather are used merely as a basis for exchanging cash flows
during the duration of the contract. Derivatives are also utilized
extensively as highly effective tools that enable users to adjust
risk profiles, such as interest rate, currency, or other market
risks, since OTC derivative instruments can be tailored to meet
individual client needs. Additionally, derivatives provide users
with access to market risk management tools that are often
Off-Balance Sheet Financial Instruments and Derivatives
unavailable in traditional cash instruments. Derivatives can also
be used to take proprietary trading positions.
Derivatives are subject to various risks similar to non-deriva-
tive financial instruments including market, credit and opera-
tional risk. Market risk is the potential for a financial loss due
to changes in the value of derivative financial instruments due
to market changes, including changes in interest rates, foreign
exchange rates and equity and commodity prices. Credit risk
results from the possibility that a counterparty to a derivative
transaction may fail to perform according to the terms of the
contract. Therefore, the Company’s exposure to credit risk
is represented by its net receivable from derivative counter-
parties, after consideration of collateral. Operational risk is
the possibility of financial loss resulting from a deficiency in
the Company’s systems for executing derivative transactions.
In addition to these risks, counterparties to derivative financial
instruments may also be exposed to legal risks related to deriv-
ative activities, including the possibility that a transaction may
be unenforceable under applicable law. The risks of derivatives
should not be viewed in isolation but rather should be consid-
ered on an aggregate basis along with the Company’s other
trading-related activities.
In millions
TotalAmount of Commitment Expiration Per Period
Contractual Less than 1-3 4-5 After 5
November 30, 2001 Amount 1 Year Years Years Years
Lending commitments:High grade $ 4,050 $ 2,720 $ 837 $ 493 $ –High yield 1,432 189 668 329 246Secured lending transactions, including forward
starting resale and repurchase agreements 80,863 35,427 19,169 7,056 19,211
Standby letters of credit 1,128 – 1,128 – –
Private equity investments 555 – 543 12 –
Operating lease obligations 4,096 138 464 353 3,141
Long-term debt maturities 38,301 8,534 15,247 7,559 6,961
Short-term debt maturities 4,865 4,865 – – –
For additional information on contractual obligations see Note 16 to the Consolidated Financial Statements.
MANAGEMENT’S DISCUSSION & ANALYSIS
2001
52
As derivative products have continued to expand in volume,
so has market participation and competition. As a result,
additional liquidity has been added into the markets for
conventional derivative products, such as interest rate swaps.
Competition has also contributed to the development of more
complex products structured for specific clients. It is this rapid
growth and complexity of certain derivative products which
has led to the perception, by some, that derivative products are
unduly risky to users and the financial markets.
In order to remove the public perception that derivatives may
be unduly risky and to ensure ongoing liquidity of derivatives
in the marketplace, the Company supports the efforts of the
regulators in striving for enhanced risk management disclo-
sures which consider the effects of both derivative products
and cash instruments. In addition, the Company supports the
activities of regulators that are designed to ensure that users
of derivatives are fully aware of the nature of risks inherent
within derivative transactions. As evidence of this support, the
Company has been actively involved with the various regula-
tory and accounting authorities in the development of addi-
tional enhanced reporting requirements related to derivatives.
The Company strongly believes that derivatives provide signifi-
cant value to the financial markets and is committed to pro-
viding its clients with innovative products to meet their
financial needs.
LEHMAN BROTHERS’ USE OF DERIVATIVE INSTRUMENTS In the
normal course of business, the Company enters into derivative
transactions both in a trading capacity and as an end-user.
As an end-user, the Company utilizes derivative products to
adjust the interest rate nature of its funding sources from fixed
to floating interest rates, and to change the index upon which
floating interest rates are based (e.g., Prime to LIBOR) (collec-
tively, “End-User Derivative Activities”). For a further discus-
sion of the Company’s End-User Derivative Activities, see Note
14 to the Consolidated Financial Statements.
The Company utilizes derivative products in a trading capacity
both as a dealer, to satisfy the financial needs of its clients, and
in each of its trading businesses (collectively, “Trading-Related
Derivative Activities”). The Company’s use of derivative prod-
ucts in its trading businesses is combined with cash instru-
ments to allow for the execution of various trading strategies.
The Company conducts its derivative activities through a
number of wholly-owned subsidiaries. The Company’s fixed
income derivative products business is conducted through
its subsidiary, Lehman Brothers Special Financing Inc.,
and separately capitalized “AAA” rated subsidiaries, Lehman
Brothers Financial Products Inc. and Lehman Brothers
Derivative Products Inc. The Company’s equity derivative
product business is conducted through Lehman Brothers
Finance S.A. In addition, as a global investment bank, the
Company is also a market-maker in a number of foreign
currencies and actively trades in the global commodity
markets. Counterparties to the Company’s derivative product
transactions are primarily financial intermediaries (U.S. and
foreign banks), securities firms, corporations, governments
and their agencies, finance companies, insurance companies,
investment companies and pension funds.
The Company manages the risks associated with derivatives
on an aggregate basis, along with the risks associated with its
non-derivative trading and market-making activities in cash
instruments, as part of its firmwide risk management policies.
The Company utilizes industry standard derivative contracts
whenever appropriate. These contracts may contain provisions
requiring the posting of additional collateral by the Company
in certain events, including a downgrade in the Company’s
credit rating. The Company believes that its funding frame-
work incorporates all reasonably likely collateral requirements
related to these provisions. For a further discussion of the
Company’s risk management policies, refer to the discussion
which follows. For a discussion of the Company’s liquidity
management policies see page 45.
See the Notes to the Consolidated Financial Statements for a
description of the Company’s accounting policies and further
discussion of the Company’s Trading-Related Derivative
Activities.
53MANAGEMENT’S DISCUSSION & ANALYSIS of financial condition and results of operations
Risk Management
As a leading global investment banking company, risk is an
inherent part of the Company’s businesses. Global markets,
by their nature, are prone to uncertainty and subject partici-
pants to a variety of risks. The Company has developed
policies and procedures to identify, measure and monitor each
of the risks involved in its trading, brokerage and investment
banking activities on a global basis. The principal risks of
Lehman Brothers are market, credit, liquidity, legal and opera-
tional risks. Risk Management is considered to be of para-
mount importance in the Company’s day-to-day operations.
Consequently, the Company devotes significant resources
across all of its worldwide trading operations to the measure-
ment, management and analysis of risk, including investments
in personnel and technology.
The Company seeks to reduce risk through the diversification
of its businesses, counterparties and activities in geographic
regions. The Company accomplishes this objective by allocat-
ing the usage of capital to each of its businesses, establishing
trading limits for individual products and traders, and setting
credit limits for individual counterparties, including regional
concentrations. The Company seeks to achieve adequate
returns from each of its businesses commensurate with the
risks that they assume.
Overall risk management policy is established by a Risk
Management Committee (the “Committee”) comprised of
the Chief Executive Officer, the Global Risk Manager, the
Chief Financial Officer, the Chief Administrative Officer
and the Heads of Capital Markets and Investment Banking.
The Committee brings together senior management with the
sole intent of discussing risk-related issues and provides an
effective forum for managing risk at the highest levels within
the Company. The Committee meets on a weekly basis, or
more frequently if required, to discuss, among other matters,
significant market exposures, concentrations of positions
(e.g., counterparty, market risk), potential new transactions
or positions and risk limit exceptions.
The Global Risk Management Group (the “Group”) supports
the Committee, but remains independent of the trading areas
and reports directly to the Chief Executive Officer. The Group
combines two departments, credit risk management and
market risk management, into one unit. This combination
facilitates the analysis of counterparty credit and market risk
exposures, while leveraging personnel and information
technology resources in a cost-efficient manner. The Group
maintains staff in each of the Company’s regional trading
centers and has daily contact with trading staff at all levels
within the Company. These discussions include a review of
trading positions and risk exposures.
CREDIT RISK Credit risk represents the possibility that a coun-
terparty will be unable to honor its contractual obligations to
the Company. Credit risk management is therefore an integral
component of the Company’s overall risk management frame-
work. The Credit Risk Management Department (“CRM
Department”) has global responsibility for implementing
the Company’s overall credit risk management framework.
The CRM Department manages the credit exposure related
to trading activities by giving initial credit approval for counter-
parties, establishing credit limits by counterparty, country
and industry group, and by requiring collateral in appropriate
circumstances. In addition, the CRM Department strives to
ensure that master netting agreements are obtained whenever
possible. The CRM Department also considers the duration
of transactions in making its credit decisions, along with the
potential credit exposure for complex derivative transactions.
The CRM Department is responsible for the continuous
monitoring and review of counterparty credit exposure and
creditworthiness and recommending valuation adjustments,
where appropriate. Credit limits are reviewed periodically to
ensure that they remain appropriate in light of market events
or the counterparty’s financial condition.
MARKET RISK Market risk represents the potential change in
value of a portfolio of financial instruments due to changes in
market rates, prices and volatilities. Market risk management
also is an essential component of the Company’s overall risk
management framework. The Market Risk Management
Department (“MRM Department”) has global responsibility
for implementing the Company’s overall market risk manage-
ment framework. It is responsible for the preparation and
dissemination of risk reports, developing and implementing
the firmwide Risk Management Guidelines, and evaluating
adherence to these guidelines. These guidelines provide a clear
framework for risk management decision making. To that end,

MANAGEMENT’S DISCUSSION & ANALYSIS
2001
54
the MRM Department identifies and quantifies risk exposures,
develops limits, and reports and monitors these risks with
respect to the approved limits. The identification of material
market risks inherent in positions includes, but is not limited
to, interest rate, equity and foreign exchange risk exposures. In
addition to these risks, the MRM Department also evaluates
liquidity risks, credit and sovereign concentrations.
The MRM Department utilizes qualitative as well as quantita-
tive information in managing trading risk, believing that a
combination of the two approaches results in a more robust
and complete approach to the management of trading risk.
Quantitative information is developed from a variety of risk
methodologies based upon established statistical principles.
To ensure high standards of qualitative analysis, the MRM
Department has retained seasoned risk managers with the req-
uisite experience and academic and professional credentials.
Market risk is present in cash products, derivatives and contin-
gent claim structures that exhibit linear as well as non-linear
profit and loss sensitivity. The Company’s exposure to market
risk varies in accordance with the volume of client-driven mar-
ket-making transactions, the size of the Company’s proprietary
and arbitrage positions, and the volatility of financial instru-
ments traded. The Company seeks to mitigate, whenever possi-
ble, excess market risk exposures through the use of futures
and option contracts and offsetting cash market instruments.
The Company participates globally in interest rate, equity
and foreign exchange markets. The Company’s Fixed Income
division has a broadly diversified market presence in U.S. and
foreign government bond trading, emerging market securities,
corporate debt (investment and non-investment grade),
money market instruments, mortgages and mortgage-backed
securities, asset-backed securities, municipal bonds and inter-
est rate derivatives. The Company’s Equities division facilitates
domestic and foreign trading in equity instruments, indices
and related derivatives. The Company’s foreign exchange busi-
nesses are involved in trading currencies on a spot and forward
basis as well as through derivative products and contracts.
The Company incurs short-term interest rate risk when facili-
tating the orderly flow of customer transactions through the
maintenance of government and high-grade corporate bond
inventories. Market-making in high yield instruments exposes
the Company to additional risk due to potential variations in
credit spreads. Trading in international markets exposes the
Company to spread risk between the term structure of interest
rates in different countries. Mortgages and mortgage-related
securities are subject to prepayment risk and changes in the
level of interest rates. Trading in derivatives and structured
products exposes the Company to changes in the level and
volatility of interest rates. The Company actively manages
interest rate risk through the use of interest rate futures,
options, swaps, forwards and offsetting cash market instru-
ments. Inventory holdings, concentrations and agings are
monitored closely and used by management to selectively
hedge or liquidate undesirable exposures.
The Company is a significant intermediary in the global equity
markets through its market-making in U.S. and non-U.S.
equity securities, including common stock, convertible debt,
exchange-traded and OTC equity options, equity swaps and
warrants. These activities expose the Company to market
risk as a result of price and volatility changes in its equity
inventory. Inventory holdings are also subject to market risk
resulting from concentrations and liquidity that may adversely
impact market valuation. Equity market risk is actively man-
aged through the use of index futures, exchange-traded and
OTC options, swaps and cash instruments.
The Company enters into foreign exchange transactions in
order to facilitate the purchase and sale of non-dollar instru-
ments, including equity and interest rate securities. The
Company is exposed to foreign exchange risk on its holdings
of non-dollar assets and liabilities. The Company is active in
many foreign exchange markets and has exposure to the euro,
Japanese yen, British pound, Swiss franc and Canadian dollar,
as well as a variety of developed and emerging market curren-
cies. The Company hedges its risk exposures primarily through
the use of currency forwards, swaps, futures and options.
VALUE-AT-RISK For purposes of Securities and Exchange
Commission (“SEC”) risk disclosure requirements, the
Company discloses an entity-wide value-at-risk for virtually
all of its trading activities. In general, the Company’s value-at-
risk measures potential loss of revenues at a given confidence
level over a specified time horizon. Value-at-risk over a one-
day holding period measured at a 95% confidence level implies
that the potential loss of daily trading revenue will be at least
as large as the value-at-risk amount on one out of every 20
trading days.
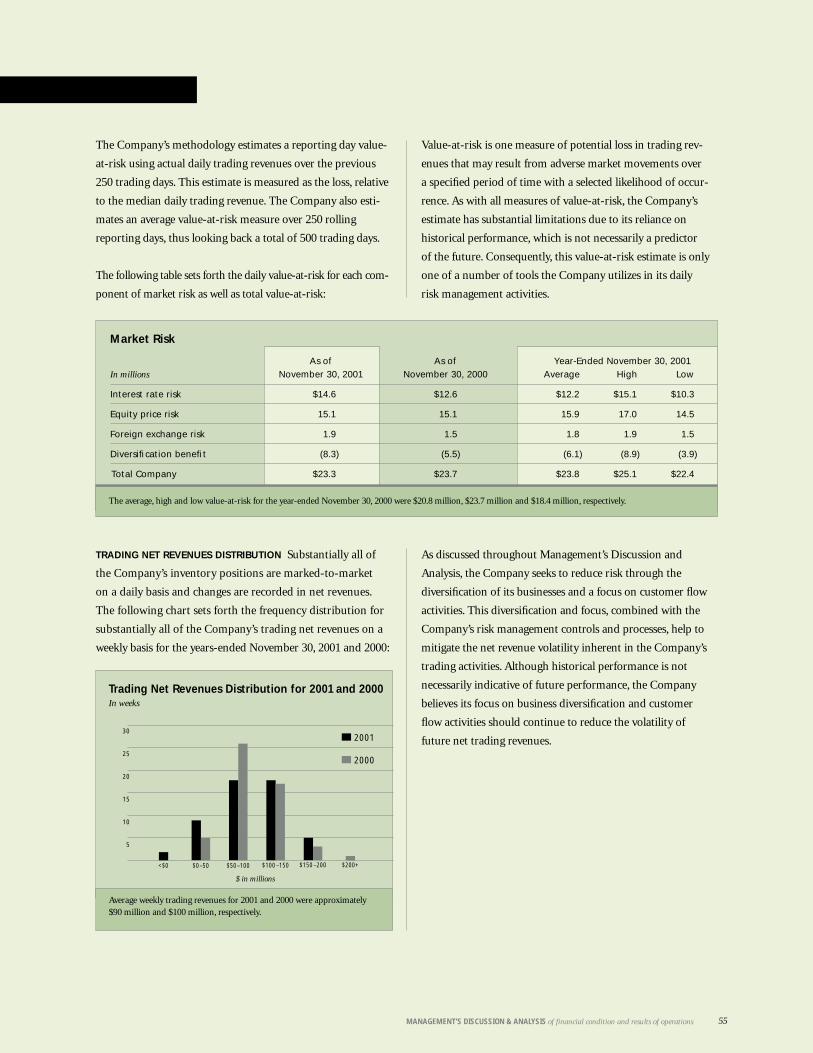
55MANAGEMENT’S DISCUSSION & ANALYSIS of financial condition and results of operations
The Company’s methodology estimates a reporting day value-
at-risk using actual daily trading revenues over the previous
250 trading days. This estimate is measured as the loss, relative
to the median daily trading revenue. The Company also esti-
mates an average value-at-risk measure over 250 rolling
reporting days, thus looking back a total of 500 trading days.
The following table sets forth the daily value-at-risk for each com-
ponent of market risk as well as total value-at-risk:
TRADING NET REVENUES DISTRIBUTION Substantially all of
the Company’s inventory positions are marked-to-market
on a daily basis and changes are recorded in net revenues.
The following chart sets forth the frequency distribution for
substantially all of the Company’s trading net revenues on a
weekly basis for the years-ended November 30, 2001 and 2000:
Value-at-risk is one measure of potential loss in trading rev-
enues that may result from adverse market movements over
a specified period of time with a selected likelihood of occur-
rence. As with all measures of value-at-risk, the Company’s
estimate has substantial limitations due to its reliance on
historical performance, which is not necessarily a predictor
of the future. Consequently, this value-at-risk estimate is only
one of a number of tools the Company utilizes in its daily
risk management activities.
As discussed throughout Management’s Discussion and
Analysis, the Company seeks to reduce risk through the
diversification of its businesses and a focus on customer flow
activities. This diversification and focus, combined with the
Company’s risk management controls and processes, help to
mitigate the net revenue volatility inherent in the Company’s
trading activities. Although historical performance is not
necessarily indicative of future performance, the Company
believes its focus on business diversification and customer
flow activities should continue to reduce the volatility of
future net trading revenues.
Trading Net Revenues Distribution for 2001 and 2000In weeks
$ in millions
30
25
20
15
10
5
$50–100$0–50<$0 $100–150 $200+$150–200
Market Risk
As of As of Year-Ended November 30, 2001In millions November 30, 2001 November 30, 2000 Average High Low
Interest rate risk $14.6 $12.6 $12.2 $15.1 $10.3
Equity price risk 15.1 15.1 15.9 17.0 14.5
Foreign exchange risk 1.9 1.5 1.8 1.9 1.5
Diversification benefit (8.3) (5.5) (6.1) (8.9) (3.9)
Total Company $23.3 $23.7 $23.8 $25.1 $22.4
The average, high and low value-at-risk for the year-ended November 30, 2000 were $20.8 million, $23.7 million and $18.4 million, respectively.
Average weekly trading revenues for 2001 and 2000 were approximately $90 million and $100 million, respectively.
2001
2000
56
MANAGEMENT’S DISCUSSION & ANALYSIS
2001
Significant Accounting Policies
The Company’s financial statements are prepared in conform-
ity with generally accepted accounting principles many of
which require the use of management estimates and assump-
tions. Management believes that the estimates utilized in
preparing its financial statements are reasonable and prudent.
Actual results could differ from these estimates.
FAIR VALUE The Company records its inventory positions
including Securities and Other Financial Instruments Owned
and Securities Sold but not yet Purchased at fair value with
unrealized gains and losses reflected in Principal transactions
in the Consolidated Statement of Income. Market value is
generally based on listed prices. If listed market prices are not
available, or if liquidating the Company’s position is reason-
ably expected to affect market prices, fair value is either deter-
mined based on internal valuation pricing models which
take into account time value and volatility factors underlying
the financial instruments, or management’s estimate of the
amounts that could be realized under current market condi-
tions, assuming an orderly liquidation over a reasonable period
of time.
TRANSFERS OF FINANCIAL ASSETS The Company accounts for
the transfer of financial assets in accordance with Statement of
Financial Accounting Standards (“SFAS”) No. 140, “Accounting
for Transfers and Servicing of Financial Assets and Extinguish-
ments of Liabilities—a replacement of FASB No. 125” (“SFAS
No. 140”). This statement requires that the transfer of financial
assets be accounted for as a sale when control over the asset
has been relinquished. Control is deemed to be relinquished
when the following conditions are met: i.) the assets have
been isolated from the transferor (even in bankruptcy or other
receivership), ii.) the transferee has the right to pledge or
exchange the assets received and iii.) the transferor has not
maintained effective control over the transferred assets. The
Company is a market leader in mortgage- and asset-backed
securitizations and other structured financing arrangements.
In connection with these activities, the Company utilizes spe-
cial purposes entities principally for (but not limited to) the
securitization of commercial and residential mortgages, home
equity loans, government and corporate bonds, and lease and
trade receivables. The Company derecognizes financial assets
transferred in securitizations provided that the Company has
relinquished control over such assets.
The Company may retain an interest in the financial assets
it securitizes (“Retained Interests”) which may include
assets in the form of residual interests in the special purpose
entities established to facilitate the securitization. Any Retained
Interests are included in Securities and Other Financial
Instruments Owned within the Company’s Statement of
Financial Condition. The Company records its Securities
and Other Financial Instruments Owned, including Retained
Interests, at fair value with changes in fair value reported
in earnings.
For additional information on the Company’s significant
accounting policies see Note 1 to the Consolidated Financial
Statements.

57MANAGEMENT’S DISCUSSION & ANALYSIS of financial condition and results of operations
New Accounting Developments
Effective December 1, 2000, the Company adopted SFAS No.
133, “Accounting for Derivative Instruments and Hedging
Activities,” as amended by SFAS No. 138, “Accounting for
Certain Derivative Instruments and Certain Hedging
Activities” (collectively, “SFAS 133”), which requires that all
derivative instruments be reported on the Consolidated
Statement of Financial Condition at fair value. SFAS 133
changed the Company’s accounting methodology applied to
its end-user derivative activities, however, the adoption of
SFAS 133 had an immaterial effect on the Company as the
majority of the Company’s derivatives are trading related and
were already recorded on a fair value basis.
In addition, the Company adopted SFAS No. 140, which
carries over the fundamental control premise of SFAS 125,
that requires an entity to recognize only assets it controls and
derecognize assets only when control has been surrendered.
SFAS 140 also changed the accounting for collateral. SFAS 140
no longer requires entities to recognize controlled collateral as
an asset on the balance sheet. Rather, SFAS 140 requires enti-
ties to separately classify financial assets owned and pledged.
The adoption of SFAS 140 did not have a material impact to
the Company’s financial position or results of operations.
In July 2001, the Financial Accounting Standards Board
(“FASB”) issued SFAS No. 141, “Business Combinations”
and SFAS No. 142, “Goodwill and Other Intangible Assets.”
SFAS 141 requires all business combinations initiated after
June 30, 2001 to be accounted for using the purchase method.
Under SFAS 142, intangible assets with indefinite lives and
goodwill will no longer be required to be amortized. Instead,
these assets will be evaluated annually for impairment. The
Company will adopt the provisions of SFAS 142 at the begin-
ning of fiscal year 2002 and does not expect the adoption to
have a material impact to the Company’s financial position
or its results of operations.
Effects of Inflation
Because the Company’s assets are, to a large extent, liquid
in nature, they are not significantly affected by inflation.
However, the rate of inflation affects the Company’s expenses,
such as employee compensation, office space leasing costs
and communications charges, which may not be readily
recoverable in the price of services offered by the Company.
To the extent inflation results in rising interest rates and has
other adverse effects upon the securities markets, it may
adversely affect the Company’s financial position and results
of operations in certain businesses.
The Board of Directors and Stockholders ofLehman Brothers Holdings Inc.
We have audited the accompanying consolidated statement of financial condition of Lehman Brothers Holdings
Inc. and Subsidiaries (the “Company”) as of November 30, 2001 and 2000, and the related consolidated
statements of income, changes in stockholders’ equity and cash flows for each of the three years in the period
ended November 30, 2001. These financial statements are the responsibility of the Company’s management. Our
responsibility is to express an opinion on these financial statements based on our audits.
We conducted our audits in accordance with auditing standards generally accepted in the United States. Those
standards require that we plan and perform the audit to obtain reasonable assurance about whether the financial
statements are free of material misstatement. An audit includes examining, on a test basis, evidence supporting
the amounts and disclosures in the financial statements. An audit also includes assessing the accounting principles
used and significant estimates made by management, as well as evaluating the overall financial statement
presentation. We believe that our audits provide a reasonable basis for our opinion.
In our opinion, the financial statements referred to above present fairly, in all material respects, the consolidated
financial position of Lehman Brothers Holdings Inc. and Subsidiaries at November 30, 2001 and 2000, and
the consolidated results of its operations and its cash flows for each of the three years in the period ended
November 30, 2001, in conformity with accounting principles generally accepted in the United States.
New York, New York
January 4, 2002
REPORT OF INDEPENDENT AUDITORS
58
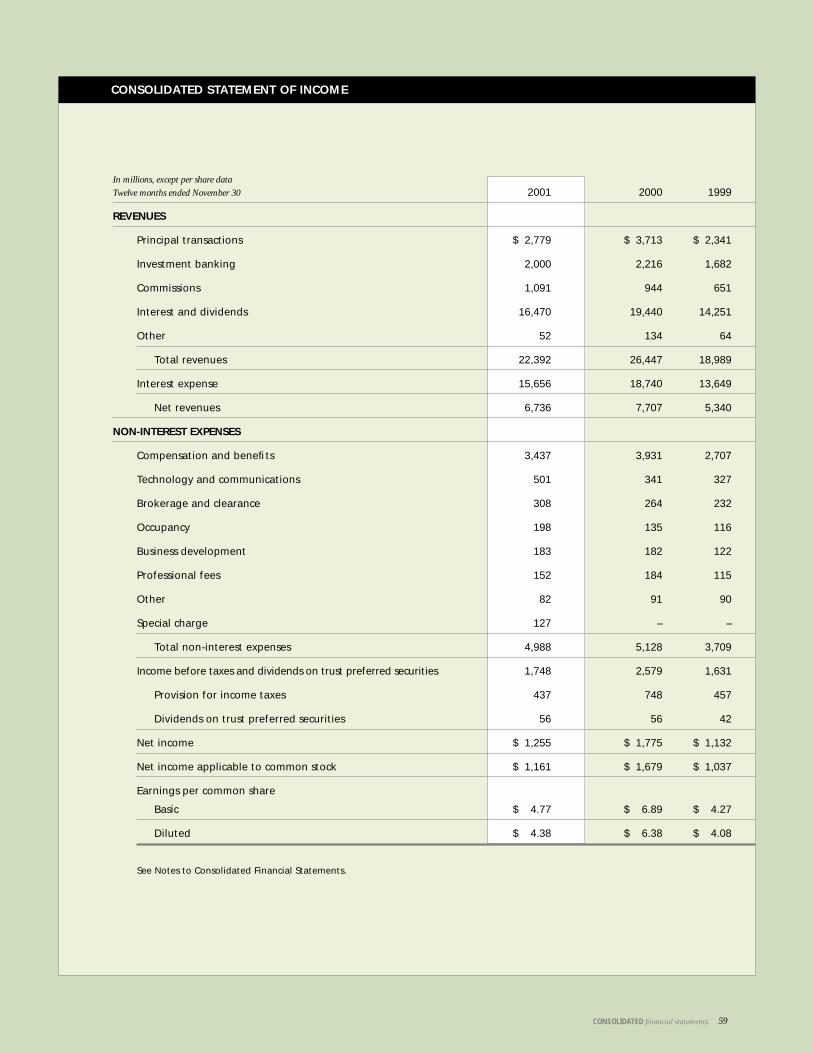
CONSOLIDATED STATEMENT OF INCOME
In millions, except per share data
Twelve months ended November 30 2001 2000 1999
REVENUES
Principal transactions $ 2,779 $ 3,713 $ 2,341
Investment banking 2,000 2,216 1,682
Commissions 1,091 944 651
Interest and dividends 16,470 19,440 14,251
Other 52 134 64
Total revenues 22,392 26,447 18,989
Interest expense 15,656 18,740 13,649
Net revenues 6,736 7,707 5,340
NON-INTEREST EXPENSES
Compensation and benefits 3,437 3,931 2,707
Technology and communications 501 341 327
Brokerage and clearance 308 264 232
Occupancy 198 135 116
Business development 183 182 122
Professional fees 152 184 115
Other 82 91 90
Special charge 127 – –
Total non-interest expenses 4,988 5,128 3,709
Income before taxes and dividends on trust preferred securities 1,748 2,579 1,631
Provision for income taxes 437 748 457
Dividends on trust preferred securities 56 56 42
Net income $ 1,255 $ 1,775 $ 1,132
Net income applicable to common stock $ 1,161 $ 1,679 $ 1,037
Earnings per common share
Basic $ 4.77 $ 6.89 $ 4.27
Diluted $ 4.38 $ 6.38 $ 4.08
See Notes to Consolidated Financial Statements.
59CONSOLIDATED financial statements
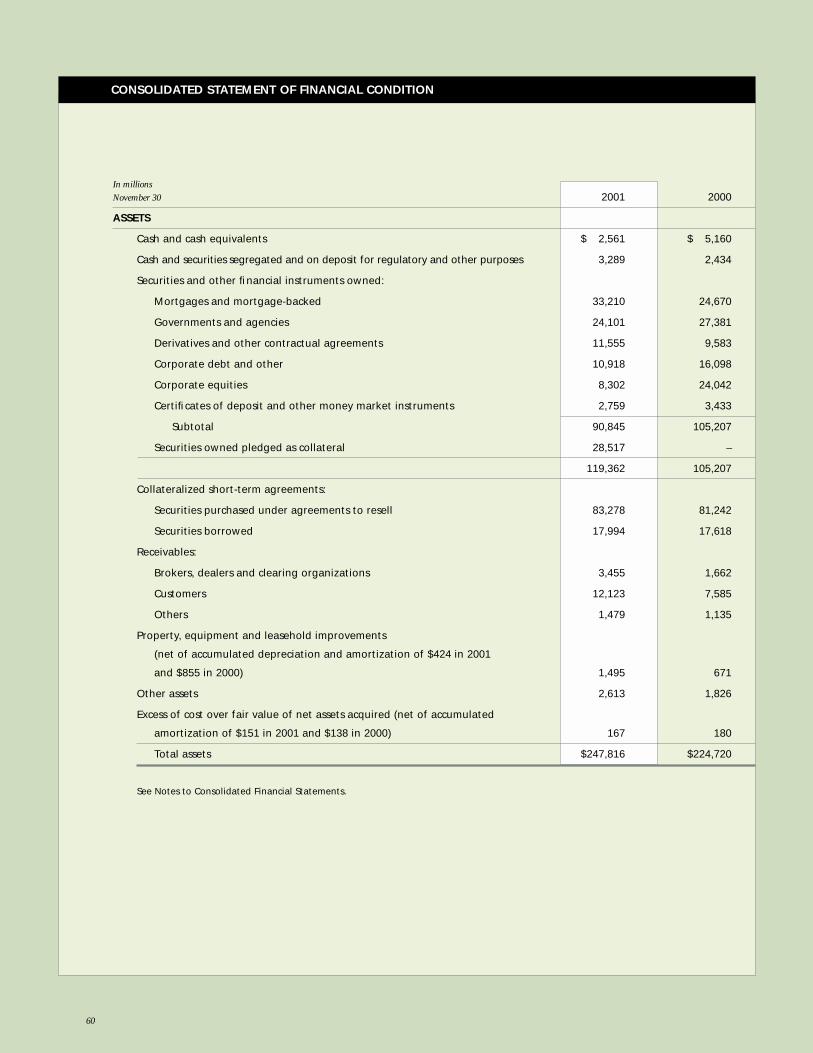
In millions
November 30 2001 2000
ASSETS
Cash and cash equivalents $ 2,561 $ 5,160
Cash and securities segregated and on deposit for regulatory and other purposes 3,289 2,434
Securities and other financial instruments owned:
Mortgages and mortgage-backed 33,210 24,670
Governments and agencies 24,101 27,381
Derivatives and other contractual agreements 11,555 9,583
Corporate debt and other 10,918 16,098
Corporate equities 8,302 24,042
Certificates of deposit and other money market instruments 2,759 3,433
Subtotal 90,845 105,207
Securities owned pledged as collateral 28,517 –
119,362 105,207
Collateralized short-term agreements:
Securities purchased under agreements to resell 83,278 81,242
Securities borrowed 17,994 17,618
Receivables:
Brokers, dealers and clearing organizations 3,455 1,662
Customers 12,123 7,585
Others 1,479 1,135
Property, equipment and leasehold improvements
(net of accumulated depreciation and amortization of $424 in 2001
and $855 in 2000) 1,495 671
Other assets 2,613 1,826
Excess of cost over fair value of net assets acquired (net of accumulated
amortization of $151 in 2001 and $138 in 2000) 167 180
Total assets $247,816 $224,720
See Notes to Consolidated Financial Statements.
CONSOLIDATED STATEMENT OF FINANCIAL CONDITION
60
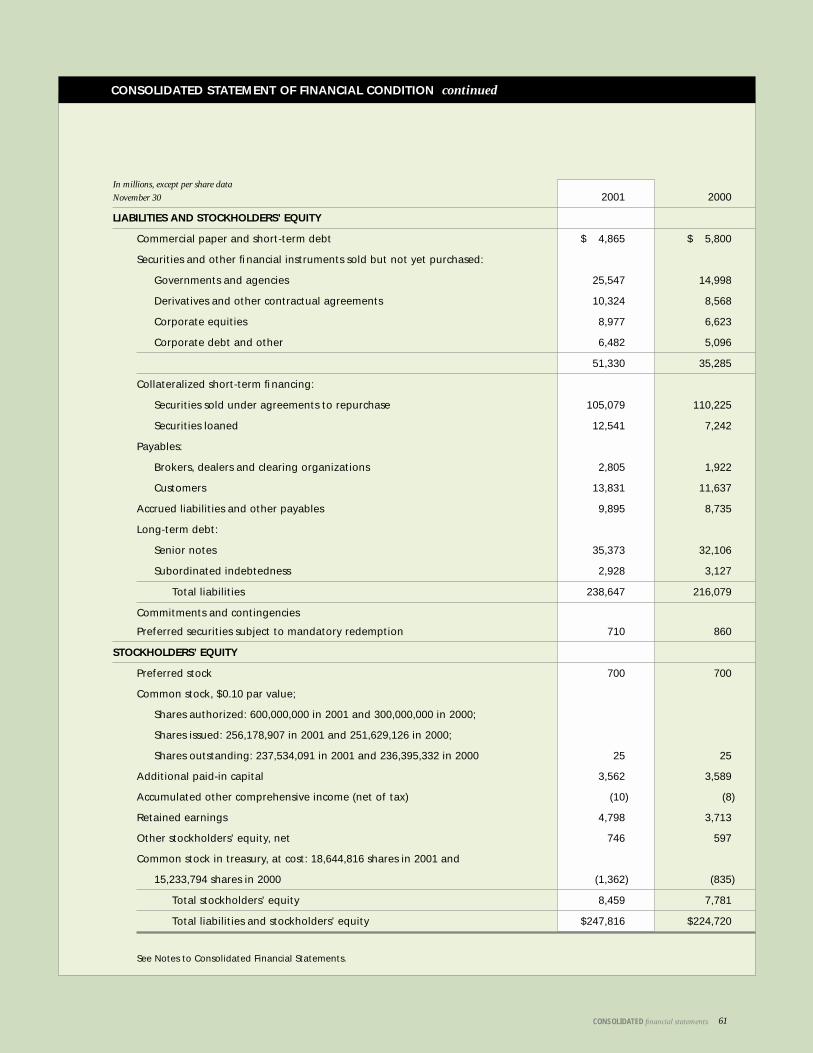
In millions, except per share data
November 30 2001 2000
LIABILITIES AND STOCKHOLDERS’ EQUITY
Commercial paper and short-term debt $ 4,865 $ 5,800
Securities and other financial instruments sold but not yet purchased:
Governments and agencies 25,547 14,998
Derivatives and other contractual agreements 10,324 8,568
Corporate equities 8,977 6,623
Corporate debt and other 6,482 5,096
51,330 35,285
Collateralized short-term financing:
Securities sold under agreements to repurchase 105,079 110,225
Securities loaned 12,541 7,242
Payables:
Brokers, dealers and clearing organizations 2,805 1,922
Customers 13,831 11,637
Accrued liabilities and other payables 9,895 8,735
Long-term debt:
Senior notes 35,373 32,106
Subordinated indebtedness 2,928 3,127
Total liabilities 238,647 216,079
Commitments and contingencies
Preferred securities subject to mandatory redemption 710 860
STOCKHOLDERS’ EQUITY
Preferred stock 700 700
Common stock, $0.10 par value;
Shares authorized: 600,000,000 in 2001 and 300,000,000 in 2000;
Shares issued: 256,178,907 in 2001 and 251,629,126 in 2000;
Shares outstanding: 237,534,091 in 2001 and 236,395,332 in 2000 25 25
Additional paid-in capital 3,562 3,589
Accumulated other comprehensive income (net of tax) (10) (8)
Retained earnings 4,798 3,713
Other stockholders’ equity, net 746 597
Common stock in treasury, at cost: 18,644,816 shares in 2001 and
15,233,794 shares in 2000 (1,362) (835)
Total stockholders’ equity 8,459 7,781
Total liabilities and stockholders’ equity $247,816 $224,720
See Notes to Consolidated Financial Statements.
CONSOLIDATED STATEMENT OF FINANCIAL CONDITION continued
61CONSOLIDATED financial statements
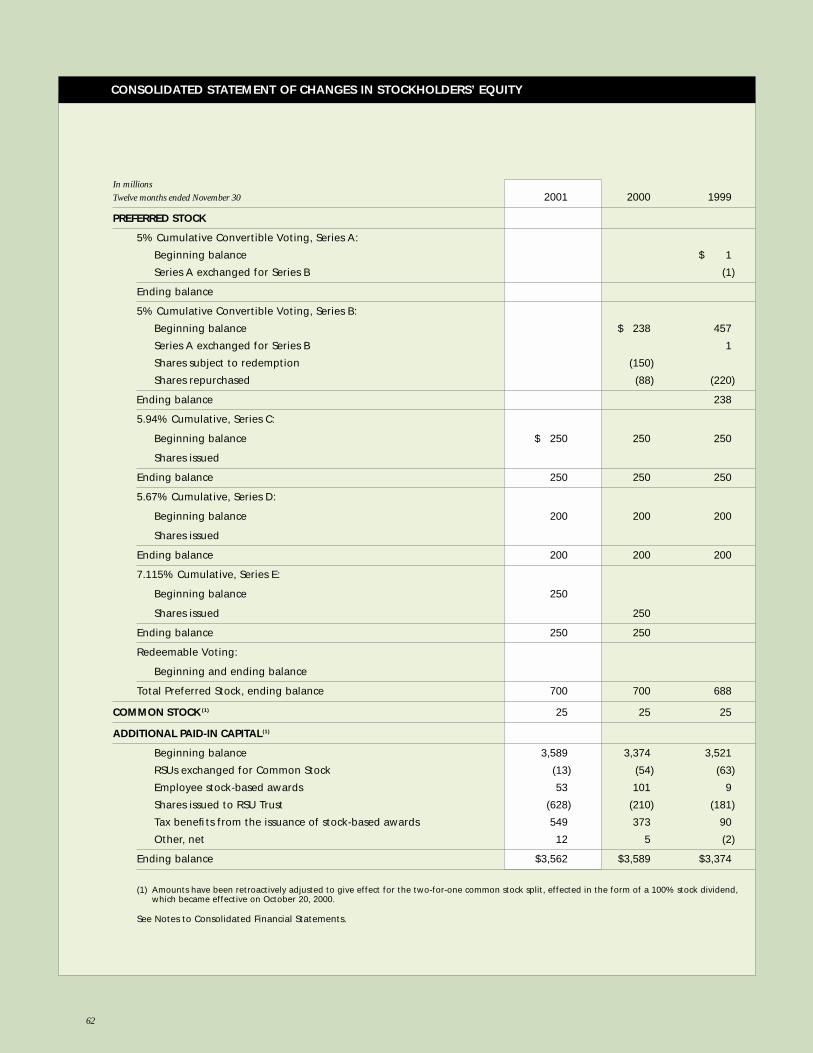
CONSOLIDATED STATEMENT OF CHANGES IN STOCKHOLDERS’ EQUITY
In millions
Twelve months ended November 30 2001 2000 1999
PREFERRED STOCK
5% Cumulative Convertible Voting, Series A:
Beginning balance $ 1
Series A exchanged for Series B (1)
Ending balance
5% Cumulative Convertible Voting, Series B:
Beginning balance $ 238 457
Series A exchanged for Series B 1
Shares subject to redemption (150)
Shares repurchased (88) (220)
Ending balance 238
5.94% Cumulative, Series C:
Beginning balance $ 250 250 250
Shares issued
Ending balance 250 250 250
5.67% Cumulative, Series D:
Beginning balance 200 200 200
Shares issued
Ending balance 200 200 200
7.115% Cumulative, Series E:
Beginning balance 250
Shares issued 250
Ending balance 250 250
Redeemable Voting:
Beginning and ending balance
Total Preferred Stock, ending balance 700 700 688
COMMON STOCK (1) 25 25 25
ADDITIONAL PAID-IN CAPITAL(1)
Beginning balance 3,589 3,374 3,521
RSUs exchanged for Common Stock (13) (54) (63)
Employee stock-based awards 53 101 9
Shares issued to RSU Trust (628) (210) (181)
Tax benefits from the issuance of stock-based awards 549 373 90
Other, net 12 5 (2)
Ending balance $3,562 $3,589 $3,374
(1) Amounts have been retroactively adjusted to give effect for the two-for-one common stock split, effected in the form of a 100% stock dividend,which became effective on October 20, 2000.
See Notes to Consolidated Financial Statements.
62
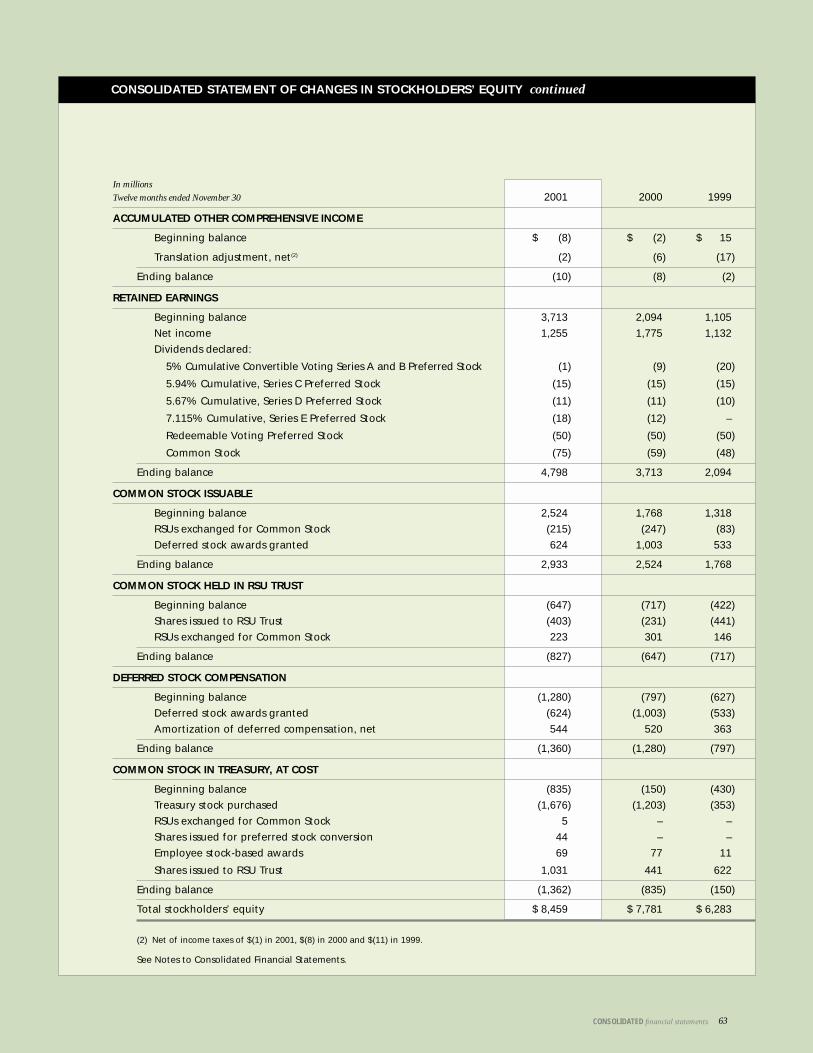
In millions
Twelve months ended November 30 2001 2000 1999
ACCUMULATED OTHER COMPREHENSIVE INCOME
Beginning balance $ (8) $ (2) $ 15
Translation adjustment, net(2) (2) (6) (17)
Ending balance (10) (8) (2)
RETAINED EARNINGS
Beginning balance 3,713 2,094 1,105
Net income 1,255 1,775 1,132
Dividends declared:
5% Cumulative Convertible Voting Series A and B Preferred Stock (1) (9) (20)
5.94% Cumulative, Series C Preferred Stock (15) (15) (15)
5.67% Cumulative, Series D Preferred Stock (11) (11) (10)
7.115% Cumulative, Series E Preferred Stock (18) (12) –
Redeemable Voting Preferred Stock (50) (50) (50)
Common Stock (75) (59) (48)
Ending balance 4,798 3,713 2,094
COMMON STOCK ISSUABLE
Beginning balance 2,524 1,768 1,318
RSUs exchanged for Common Stock (215) (247) (83)
Deferred stock awards granted 624 1,003 533
Ending balance 2,933 2,524 1,768
COMMON STOCK HELD IN RSU TRUST
Beginning balance (647) (717) (422)
Shares issued to RSU Trust (403) (231) (441)
RSUs exchanged for Common Stock 223 301 146
Ending balance (827) (647) (717)
DEFERRED STOCK COMPENSATION
Beginning balance (1,280) (797) (627)
Deferred stock awards granted (624) (1,003) (533)
Amortization of deferred compensation, net 544 520 363
Ending balance (1,360) (1,280) (797)
COMMON STOCK IN TREASURY, AT COST
Beginning balance (835) (150) (430)
Treasury stock purchased (1,676) (1,203) (353)
RSUs exchanged for Common Stock 5 – –
Shares issued for preferred stock conversion 44 – –
Employee stock-based awards 69 77 11
Shares issued to RSU Trust 1,031 441 622
Ending balance (1,362) (835) (150)
Total stockholders’ equity $ 8,459 $ 7,781 $ 6,283
(2) Net of income taxes of $(1) in 2001, $(8) in 2000 and $(11) in 1999.
See Notes to Consolidated Financial Statements.
CONSOLIDATED STATEMENT OF CHANGES IN STOCKHOLDERS’ EQUITY continued
63CONSOLIDATED financial statements
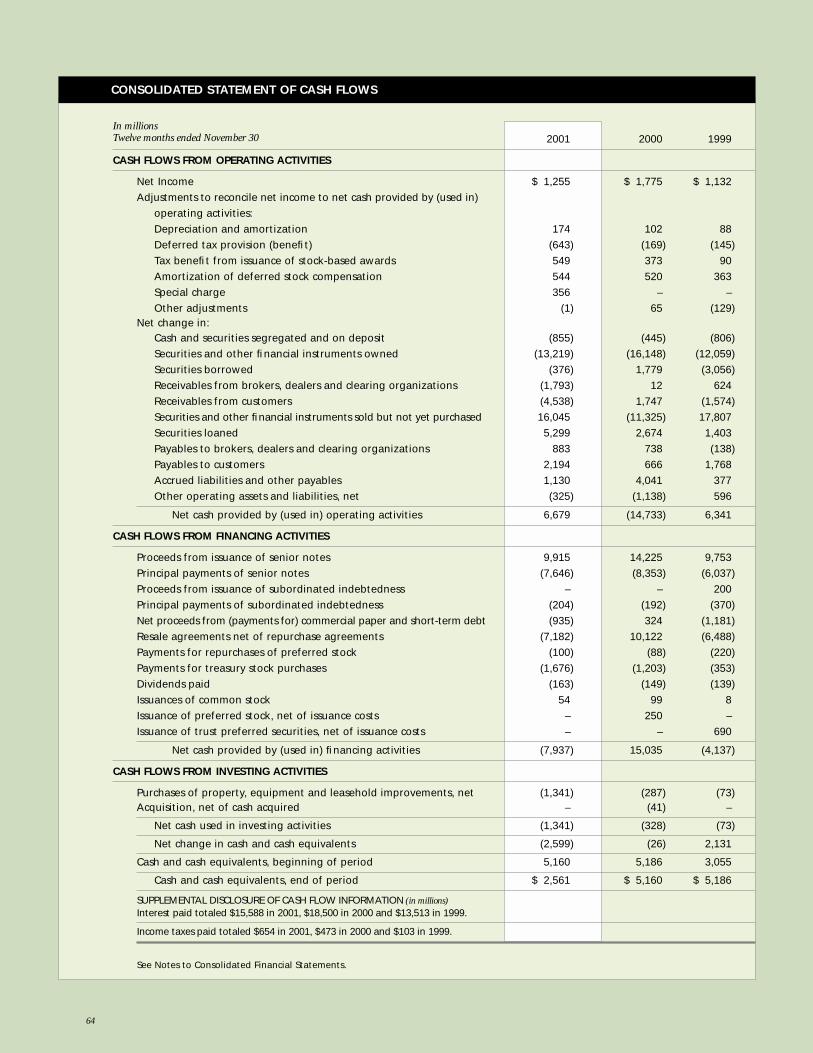
CONSOLIDATED STATEMENT OF CASH FLOWS
In millionsTwelve months ended November 30 2001 2000 1999
CASH FLOWS FROM OPERATING ACTIVITIES
Net Income $ 1,255 $ 1,775 $ 1,132
Adjustments to reconcile net income to net cash provided by (used in)
operating activities:
Depreciation and amortization 174 102 88
Deferred tax provision (benefit) (643) (169) (145)
Tax benefit from issuance of stock-based awards 549 373 90
Amortization of deferred stock compensation 544 520 363
Special charge 356 – –
Other adjustments (1) 65 (129)Net change in:
Cash and securities segregated and on deposit (855) (445) (806)
Securities and other financial instruments owned (13,219) (16,148) (12,059)
Securities borrowed (376) 1,779 (3,056)
Receivables from brokers, dealers and clearing organizations (1,793) 12 624
Receivables from customers (4,538) 1,747 (1,574)
Securities and other financial instruments sold but not yet purchased 16,045 (11,325) 17,807
Securities loaned 5,299 2,674 1,403
Payables to brokers, dealers and clearing organizations 883 738 (138)
Payables to customers 2,194 666 1,768
Accrued liabilities and other payables 1,130 4,041 377
Other operating assets and liabilities, net (325) (1,138) 596
Net cash provided by (used in) operating activities 6,679 (14,733) 6,341
CASH FLOWS FROM FINANCING ACTIVITIES
Proceeds from issuance of senior notes 9,915 14,225 9,753
Principal payments of senior notes (7,646) (8,353) (6,037)
Proceeds from issuance of subordinated indebtedness – – 200
Principal payments of subordinated indebtedness (204) (192) (370)
Net proceeds from (payments for) commercial paper and short-term debt (935) 324 (1,181)
Resale agreements net of repurchase agreements (7,182) 10,122 (6,488)
Payments for repurchases of preferred stock (100) (88) (220)
Payments for treasury stock purchases (1,676) (1,203) (353)
Dividends paid (163) (149) (139)
Issuances of common stock 54 99 8
Issuance of preferred stock, net of issuance costs – 250 –
Issuance of trust preferred securities, net of issuance costs – – 690
Net cash provided by (used in) financing activities (7,937) 15,035 (4,137)
CASH FLOWS FROM INVESTING ACTIVITIES
Purchases of property, equipment and leasehold improvements, net (1,341) (287) (73)Acquisition, net of cash acquired – (41) –
Net cash used in investing activities (1,341) (328) (73)
Net change in cash and cash equivalents (2,599) (26) 2,131
Cash and cash equivalents, beginning of period 5,160 5,186 3,055
Cash and cash equivalents, end of period $ 2,561 $ 5,160 $ 5,186
SUPPLEMENTAL DISCLOSURE OF CASH FLOW INFORMATION (in millions)
Interest paid totaled $15,588 in 2001, $18,500 in 2000 and $13,513 in 1999.
Income taxes paid totaled $654 in 2001, $473 in 2000 and $103 in 1999.
See Notes to Consolidated Financial Statements.
64

Note Summary of Significant Accounting Policies 66
Note Special Charge 69
Note Short-Term Financings 70
Note Long-Term Debt 71
Note Preferred Securities Subject to Mandatory Redemption 73
Note Preferred Stock 74
Note Common Stock 75
Note Incentive Plans 76
Note Earnings Per Common Share 79
Note Capital Requirements 80
Note Employee Benefit Plans 81
Note Income Taxes 82
Note Securities Pledged as Collateral 84
Note Derivative Financial Instruments 84
Note Fair Value of Financial Instruments 88
Note Other Commitments and Contingencies 89
Note Segments 91
Note Quarterly Information (unaudited) 93
1
2
3
4
5
6
7
8
9
10
11
12
13
14
15
16
17
18
TABLE OF CONTENTS
65

66
Summary of Significant Accounting Policies
internal valuation pricing models which take into account time
value and volatility factors underlying the financial instruments,
or management’s estimate of the amounts that could be
realized under current market conditions, assuming an orderly
liquidation over a reasonable period of time.
As of November 30, 2001, all firm-owned securities pledged to
counterparties where the counterparty has the right, by contract or
custom, to sell or repledge the securities are classified as Securities
Owned Pledged as Collateral as required by Statement of Financial
Accounting Standards (“SFAS”) No. 140, “Accounting for Transfers
and Servicing of Financial Assets and Extinguishments of
Liabilities.” SFAS 140 does not require the restatement of prior
year balances, therefore, such securities as of November 30, 2000
are classified within their respective inventory categories.
DERIVATIVE FINANCIAL INSTRUMENTS A derivative is typically
defined as an instrument whose value is “derived” from an under-
lying instrument, index or rate, such as a future, forward, swap,
or option contract, or other financial instrument with similar
characteristics. A derivative contract generally represents future
commitments to exchange interest payment streams or currencies
based on the contract or notional amount or to purchase or sell
other financial instruments at specified terms on a specified date.
Derivatives utilized for trading purposes are recorded at market or
fair value in the Consolidated Statement of Financial Condition
on a net by counterparty basis where a legal right of set-off exists
and are netted across products when such provisions are stated in
the master netting agreement. Derivatives are often referred to as
off-balance-sheet instruments since neither their notional
amounts nor the underlying instruments are reflected as assets or
liabilities of the Company. Instead, the market or fair value related
to the derivative transactions is reported in the Consolidated
Statement of Financial Condition as an asset or liability in
Derivatives and other contractual agreements, as applicable.
Margin on futures contracts is included in receivables and payables
from/to brokers, dealers and clearing organizations, as applicable.
Changes in fair values of derivatives are recorded as principal
transactions revenues in the current period. Market or fair value
for trading-related instruments is generally determined by either
quoted market prices (for exchange-traded futures and options) or
pricing models (for over-the-counter swaps, forwards and options).
Pricing models utilize a series of market inputs to determine the
BASIS OF PRESENTATION The consolidated financial statements
include the accounts of Lehman Brothers Holdings Inc.
(“Holdings”) and subsidiaries (collectively, the “Company” or
“Lehman Brothers”). Lehman Brothers is one of the leading
global investment banks serving institutional, corporate, govern-
ment and high-net-worth individual clients and customers. The
Company’s worldwide headquarters in New York and regional
headquarters in London and Tokyo are complemented by offices
in additional locations in North America, Europe, the Middle
East, Latin America and the Asia Pacific Region. The Company
is engaged primarily in providing financial services. The princi-
pal U.S. subsidiary of Holdings is Lehman Brothers Inc. (“LBI”),
a registered broker-dealer. All material intercompany accounts
and transactions have been eliminated in consolidation.
The consolidated financial statements are prepared in con-
formity with generally accepted accounting principles which
require management to make estimates and assumptions that
affect the amounts reported in the financial statements and
accompanying notes. Management estimates are required to
be utilized in determining the valuation of trading inventory
particularly in the area of OTC derivatives and private equity
securities. Additionally, management estimates are required in
assessing the realizability of deferred tax assets, the outcome of
litigation and determining the components of the 2001 special
charge. Management believes that the estimates utilized in
preparing its financial statements are reasonable and prudent.
Actual results could differ from these estimates.
The Company uses the trade date basis of accounting for
securities transactions.
Certain prior period amounts reflect reclassifications to con-
form to the current year’s presentation.
SECURITIES AND OTHER FINANCIAL INSTRUMENTS Securities
and other financial instruments owned and securities and other
financial instruments sold but not yet purchased are valued at
market or fair value, as appropriate, with unrealized gains and
losses reflected in Principal transactions in the Consolidated
Statement of Income. Market value is generally based on listed
market prices. If listed market prices are not available, or if
liquidating the Company’s position is reasonably expected to
affect market prices, fair value is either determined based on
1
NOTES to consolidated financial statements

present value of future cash flows, with adjustments, as required
for credit risk and liquidity risk. Further valuation adjustments
may be recorded, as deemed appropriate for new or complex
products or for positions with significant concentrations. These
adjustments are integral components of the mark-to-market
process. Credit-related valuation adjustments incorporate busi-
ness and economic conditions, historical experience, concentra-
tions, estimates of expected losses and the character, quality and
performance of credit sensitive financial instruments.
As an end-user, the Company primarily utilizes derivatives
to modify the interest rate characteristics of its long-term debt
and secured financing activities. The Company also utilizes
equity derivatives to hedge its exposure to equity price risk
embedded in certain of its debt obligations and foreign
exchange forwards to manage the currency exposure related to
its net monetary investment in non-U.S. dollar functional cur-
rency operations (collectively, “end-user derivative activities”).
Effective December 1, 2000, the Company adopted SFAS No.
133, “Accounting for Derivative Instruments and Hedging
Activities,” as amended by SFAS No. 138, “Accounting for
Certain Derivative Instruments and Certain Hedging Activities”
(collectively, “SFAS 133”), which requires that all derivative
instruments be reported on the consolidated statement of finan-
cial condition at fair value. SFAS 133 changed the Company’s
accounting methodology applied to its end-user derivative activ-
ities, however the adoption of SFAS 133 had no effect on the
accounting for the Company’s trading-related derivative activities,
as such derivatives were already recorded on a fair value basis.
Under SFAS 133, the accounting for end-user derivative activi-
ties is dependent upon the nature of the hedging relationship. In
certain hedging relationships, both the derivative and the hedged
item will be marked-to-market through earnings for changes in
fair value (“fair value hedge”). In many instances the hedge rela-
tionship is fully effective so that the mark-to-market on the
derivative and the hedged item will offset. In other hedging rela-
tionships, the derivative will be marked-to-market with the off-
setting gains or losses recorded in Accumulated Other
Comprehensive Income, a component of Stockholder’s Equity,
until the hedged item is realized in earnings (“cash flow hedge”).
SFAS 133 also requires certain derivatives embedded in long-term
debt to be bifurcated and marked-to-market through earnings.
SFAS 133 changed the accounting treatment for the hedged item
in a fair value hedge (e.g., long-term debt or secured financing
activities) from what was an accrual basis to a modified mark-to-
market value. The hedged item’s carrying value may differ from a
full mark-to-market value since SFAS 133 requires that the
hedged item be adjusted only for changes in fair value associated
with the designated risks being hedged during the hedge period.
The Company principally utilizes fair value hedges to convert a
substantial portion of the Company’s fixed rate debt and certain
long-term secured financing activities to floating interest rates.
Any hedge ineffectiveness in these relationships is recorded as
a component of interest expense on the Company’s Statement
of Income. Gains or losses from revaluing foreign exchange
contracts associated with hedging the Company’s net investments
in foreign affiliates are reported within Accumulated Other
Comprehensive Income in Stockholder’s Equity. Unrealized
receivables/payables resulting from the mark-to-market on end-
user derivatives are included in Securities and Other Financial
Instruments Owned or Sold but not yet Purchased.
The adoption of SFAS 133, as of December 1, 2000, did not have
a material effect on the Company’s consolidated statement of
financial condition or the results of operations, as most of the
Company’s derivative transactions are entered into for trading-
related activities for which the adoption of SFAS 133 had no
impact. Prior year amounts have not been restated to conform
with the current SFAS 133 accounting treatment. Therefore,
end-user derivative activities for all periods prior to December 1,
2001 are recorded on an accrual basis provided that the deriva-
tive was designated and deemed to be a highly effective hedge.
For periods prior to 2001, realized gains or losses on early termi-
nations of derivatives that were designated as hedges were
deferred and amortized to interest income or interest expense
over the remaining life of the instrument being hedged.
SECURED FINANCING ACTIVITIES
Repurchase and Resale Agreements Securities purchased under
agreements to resell and securities sold under agreements to
repurchase, which are treated as financing transactions for finan-
cial reporting purposes, are collateralized primarily by govern-
ment and government agency securities and are carried net by
counterparty, when permitted, at the amounts at which the secu-
rities will be subsequently resold or repurchased plus accrued
67NOTES to consolidated financial statements

NOTES TO CONSOLIDATED FINANCIAL STATEMENTS
2001
68
interest. It is the policy of the Company to take possession of
securities purchased under agreements to resell. The Company
monitors the market value of the underlying positions on a daily
basis as compared to the related receivable or payable balances,
including accrued interest. The Company requires counterparties
to deposit additional collateral or return collateral pledged as
necessary, to ensure that the market value of the underlying col-
lateral remains sufficient. Securities and other financial instru-
ments owned that are financed under repurchase agreements are
carried at market value with changes in market value reflected in
the Consolidated Statement of Income.
The Company utilizes interest rate swaps as an end-user to modify
the interest rate exposure associated with certain fixed rate resale
and repurchase agreements. In 2001, and in accordance with SFAS
No. 133, the Company adjusted the carrying value of these secured
financing transactions that had been designated as the hedge.
Securities Borrowed and Loaned Securities borrowed and securi-
ties loaned are carried at the amount of cash collateral
advanced or received plus accrued interest. It is the Company’s
policy to value the securities borrowed and loaned on a daily
basis, and to obtain additional cash as necessary to ensure such
transactions are adequately collateralized.
PRIVATE EQUITY INVESTMENTS The Company carries its
private equity investments, including its partnership interests,
at fair value based upon the Company’s assessment of each
underlying investment. As the general partner in its private
equity funds, the Company may be entitled to receive a pre-
ferred distribution of realized profits.
INVESTMENT BANKING Underwriting revenues and fees for
merger and acquisition advisory services are recognized when
services for the transactions are determined to be completed.
Underwriting expenses are deferred and recognized at the time
the related revenues are recorded.
INCOME TAXES The Company accounts for income taxes under
the provisions of SFAS No. 109, “Accounting for Income Taxes.”
The Company recognizes the current and deferred tax conse-
quences of all transactions that have been recognized in the
financial statements using the provisions of the enacted tax laws.
In this regard, deferred tax assets are recognized for temporary
differences that will result in deductible amounts in future years
and for tax loss carry-forwards, if in the opinion of management,
it is more likely than not that the deferred tax asset will be real-
ized. SFAS 109 requires companies to set up a valuation allowance
for that component of net deferred tax assets which does
not meet the “more likely than not” criterion for realization.
Deferred tax liabilities are recognized for temporary differences
that will result in taxable income in future years.
SECURITIZATIONS The Company is a market leader in mortgage-
and asset-backed securitizations and other structured financing
arrangements. In connection with these activities, the Company
utilizes special purpose entities principally for (but not limited to)
the securitization of commercial and residential mortgages, home
equity loans, government and corporate bonds, and lease and trade
receivables. The Company derecognizes financial assets transferred
in securitizations provided that the Company has relinquished
control over such assets. The Company may retain an interest
in the financial assets it securitizes (“Retained Interests”) which
may include assets in the form of residual interests in the special
purpose entities established to facilitate the securitization. Any
Retained Interests are included in Securities and Other Financial
Instruments Owned within the Company’s Statement of Financial
Condition. The Company records its Securities and Other
Financial Instruments Owned, including Retained Interests, at fair
value with changes in fair value reported in earnings. Fair value
is determined based upon listed market prices, if available. When
listed market prices are not available, fair value is determined based
on other relevant factors, including broker or dealer price quota-
tions and valuation pricing models which take into account time
value and volatility factors underlying the financial instruments
among other factors. During the fiscal year-ended 2001, the
Company securitized approximately $110 billion of financial assets.
As of November 30, 2001, the Company had approximately
$1.6 billion of non-investment grade retained interests from
its securitization activities. The Company records its Retained
Interests at fair value and actively manages market risk expo-
sures associated with Retained Interests.
TRANSLATION OF FOREIGN CURRENCIES Assets and liabilities
of foreign subsidiaries having non-U.S. dollar functional cur-
rencies are translated at exchange rates at the statement of
financial condition date. Revenues and expenses are translated
at average exchange rates during the period. The gains or losses
resulting from translating foreign currency financial statements
into U.S. dollars, net of hedging gains or losses and taxes, are
included in Accumulated Other Comprehensive Income, a
separate component of Stockholders’ Equity. Gains or losses
resulting from foreign currency transactions are included in
the Consolidated Statement of Income.
PROPERTY, EQUIPMENT AND LEASEHOLD IMPROVEMENTS
Property, equipment and leasehold improvements are recorded
at historical cost, net of accumulated depreciation and amortiza-
tion. Depreciation is recognized on a straight-line basis over the
estimated useful lives of the related assets. Leasehold improve-
ments are amortized over the lesser of their economic useful lives
or the terms of the underlying leases. Internal use software which
qualifies for capitalization under AICPA Statement of Position
98-1, “Accounting for the Costs of Computer Software Developed
or Obtained for Internal Use,” is capitalized and subsequently
amortized over the estimated useful life of the software.
GOODWILL Excess of cost over fair value of net assets acquired
(“goodwill”) is amortized using the straight-line method over
periods not exceeding 35 years. Goodwill is evaluated periodi-
cally for impairment and also is reduced upon the recognition
of certain acquired net operating loss carryforward benefits.
STOCK-BASED AWARDS SFAS No. 123, “Accounting for Stock-
Based Compensation,” established financial accounting and report-
ing standards for stock-based employee compensation plans. SFAS
No. 123 permits companies to either continue accounting for stock-
based compensation using the intrinsic value method prescribed by
Accounting Principles Board Opinion No. 25 (“APB 25”) or using
the fair value method prescribed by SFAS No. 123. The Company
continues to follow APB 25 and its related interpretations in
accounting for its stock-based compensation plans. Accordingly, no
compensation expense has been recognized for stock option
awards because the exercise price was at or above the fair market
value of the Company’s common stock on the grant date.
STATEMENT OF CASH FLOWS For purposes of the Consolidated
Statement of Cash Flows, the Company defines cash equiva-
lents as highly liquid investments with original maturities of
three months or less, other than those held for sale in the ordi-
nary course of business.
EARNINGS PER COMMON SHARE The Company computes earnings
per common share in accordance with SFAS No. 128,“Earnings per
Share.” Basic earnings per share is computed by dividing income
available to common stockholders by the weighted-average number
of common shares outstanding for the period. Diluted EPS reflects
the assumed conversion of all dilutive securities. All share and per
share amounts have been restated for the two-for-one common
stock split, effected in the form of a 100% stock dividend, which
became effective October 20, 2000. See Notes 7 and 9 of Notes to
Consolidated Financial Statements for more information.
69NOTES to consolidated financial statements
Special Charge
As a result of the September 11, 2001 terrorist attack, the
Company’s leased facilities in the World Trade Center were
destroyed and its leased and owned facilities in the World
Financial Center (“WFC”) complex (including the 3 World
Financial Center building owned jointly with American
Express) were significantly damaged. All employees and
operations in the downtown New York area were displaced.
Key business activities and necessary support functions were
quickly relocated to the Company’s back-up facilities in New
Jersey and to various other temporary sites.
The Company has been informed that the facilities in the World
Financial Center complex can be repaired; however, the damage
to many of the floors that had been occupied by the Company at
the 3 WFC location is significant. A repair and remediation plan
is currently under way although a completion date has not been
finalized. Consequently, the Company purchased a new one mil-
lion-square-foot building at 745 Seventh Avenue in New York
City during the fourth quarter of 2001 and is relocating its prin-
cipal executive and operating offices to this site in 2002. New
long-term lease agreements were also executed for other space in
midtown Manhattan. As a result, the Company is currently eval-
uating its space needs and exploring its alternatives with respect
to 3 WFC and the other downtown New York facilities.
The Company has significant levels of insurance in place to
cover the losses resulting from the terrorist attack including
a policy covering damage to the core and shell of the 3 WFC
building and a separate policy covering the property damage
of the WTC and WFC facilities, losses resulting from business
interruption and extra expenses associated with the Company’s
relocation to, and occupancy of, the temporary facilities.
2
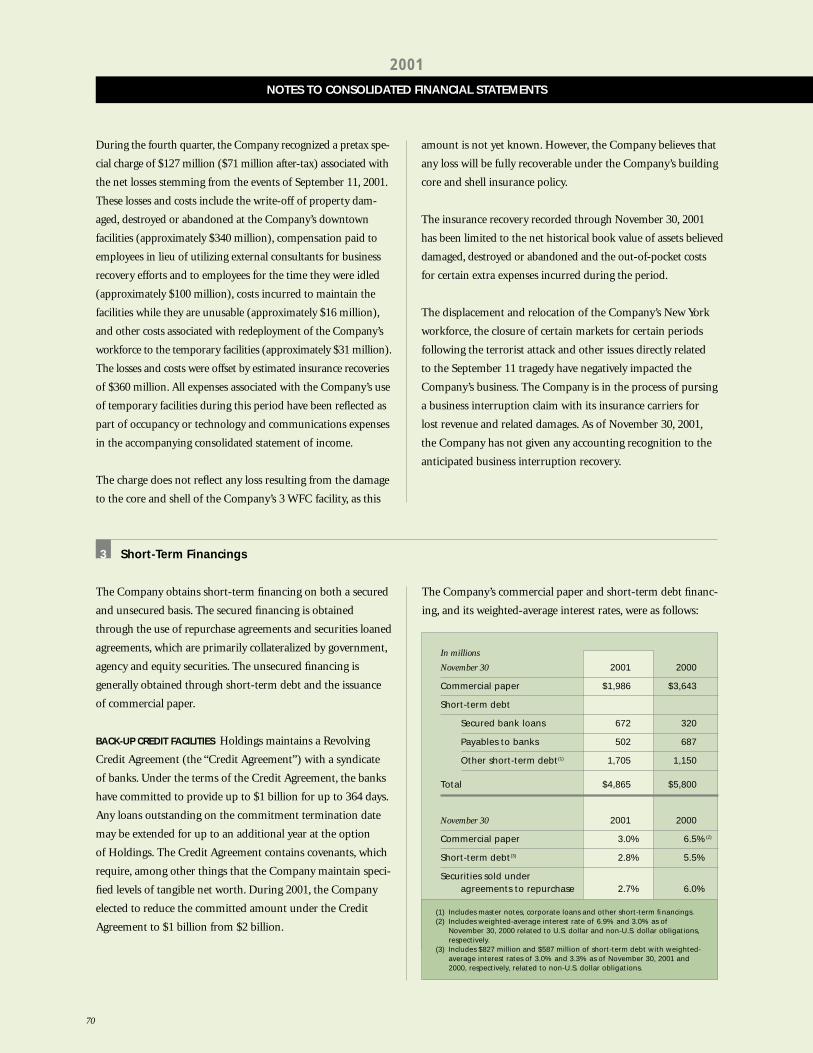
NOTES TO CONSOLIDATED FINANCIAL STATEMENTS
2001
In millions
November 30 2001 2000
Commercial paper $1,986 $3,643
Short-term debt
Secured bank loans 672 320
Payables to banks 502 687
Other short-term debt(1) 1,705 1,150
Total $4,865 $5,800
November 30 2001 2000
Commercial paper 3.0% 6.5%(2)
Short-term debt(3) 2.8% 5.5%
Securities sold under agreements to repurchase 2.7% 6.0%
(1) Includes master notes, corporate loans and other short-term financings.(2) Includes weighted-average interest rate of 6.9% and 3.0% as of
November 30, 2000 related to U.S. dollar and non-U.S. dollar obligations,respectively.
(3) Includes $827 million and $587 million of short-term debt with weighted-average interest rates of 3.0% and 3.3% as of November 30, 2001 and2000, respectively, related to non-U.S. dollar obligations.
70
During the fourth quarter, the Company recognized a pretax spe-
cial charge of $127 million ($71 million after-tax) associated with
the net losses stemming from the events of September 11, 2001.
These losses and costs include the write-off of property dam-
aged, destroyed or abandoned at the Company’s downtown
facilities (approximately $340 million), compensation paid to
employees in lieu of utilizing external consultants for business
recovery efforts and to employees for the time they were idled
(approximately $100 million), costs incurred to maintain the
facilities while they are unusable (approximately $16 million),
and other costs associated with redeployment of the Company’s
workforce to the temporary facilities (approximately $31 million).
The losses and costs were offset by estimated insurance recoveries
of $360 million. All expenses associated with the Company’s use
of temporary facilities during this period have been reflected as
part of occupancy or technology and communications expenses
in the accompanying consolidated statement of income.
The charge does not reflect any loss resulting from the damage
to the core and shell of the Company’s 3 WFC facility, as this
amount is not yet known. However, the Company believes that
any loss will be fully recoverable under the Company’s building
core and shell insurance policy.
The insurance recovery recorded through November 30, 2001
has been limited to the net historical book value of assets believed
damaged, destroyed or abandoned and the out-of-pocket costs
for certain extra expenses incurred during the period.
The displacement and relocation of the Company’s New York
workforce, the closure of certain markets for certain periods
following the terrorist attack and other issues directly related
to the September 11 tragedy have negatively impacted the
Company’s business. The Company is in the process of pursing
a business interruption claim with its insurance carriers for
lost revenue and related damages. As of November 30, 2001,
the Company has not given any accounting recognition to the
anticipated business interruption recovery.
Short-Term Financings
The Company obtains short-term financing on both a secured
and unsecured basis. The secured financing is obtained
through the use of repurchase agreements and securities loaned
agreements, which are primarily collateralized by government,
agency and equity securities. The unsecured financing is
generally obtained through short-term debt and the issuance
of commercial paper.
BACK-UP CREDIT FACILITIES Holdings maintains a Revolving
Credit Agreement (the “Credit Agreement”) with a syndicate
of banks. Under the terms of the Credit Agreement, the banks
have committed to provide up to $1 billion for up to 364 days.
Any loans outstanding on the commitment termination date
may be extended for up to an additional year at the option
of Holdings. The Credit Agreement contains covenants, which
require, among other things that the Company maintain speci-
fied levels of tangible net worth. During 2001, the Company
elected to reduce the committed amount under the Credit
Agreement to $1 billion from $2 billion.
The Company’s commercial paper and short-term debt financ-
ing, and its weighted-average interest rates, were as follows:
3
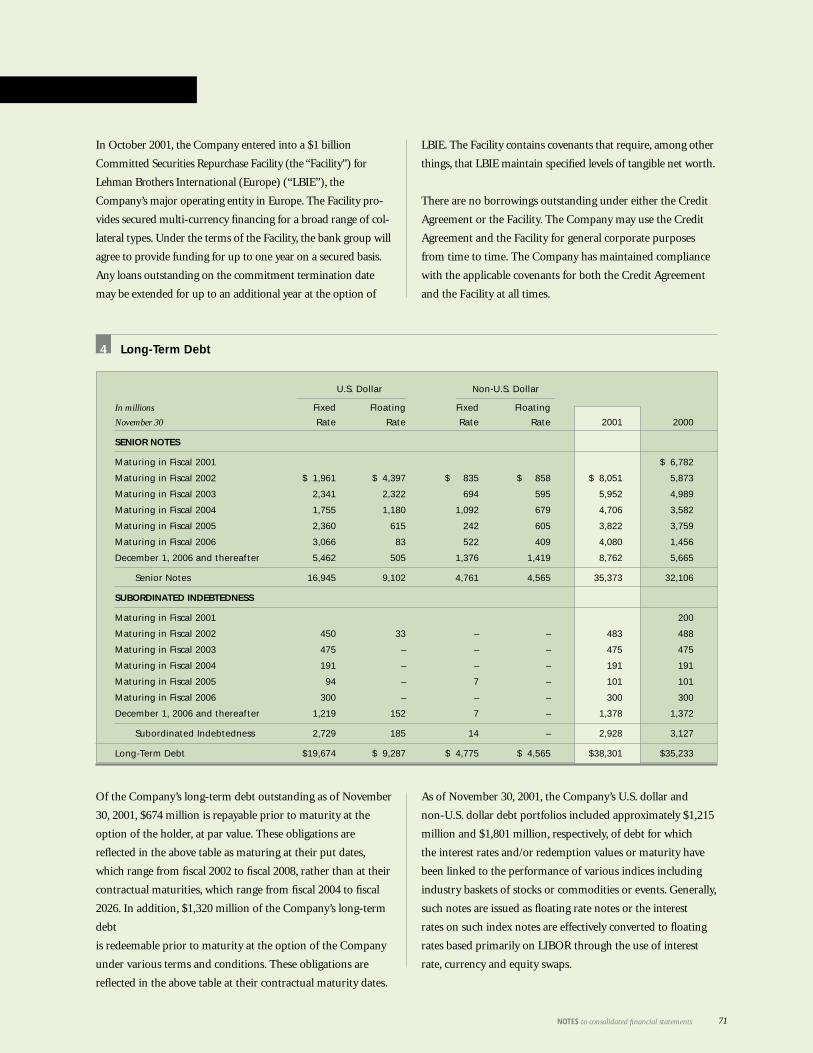
71NOTES to consolidated financial statements
LBIE. The Facility contains covenants that require, among other
things, that LBIE maintain specified levels of tangible net worth.
There are no borrowings outstanding under either the Credit
Agreement or the Facility. The Company may use the Credit
Agreement and the Facility for general corporate purposes
from time to time. The Company has maintained compliance
with the applicable covenants for both the Credit Agreement
and the Facility at all times.
As of November 30, 2001, the Company’s U.S. dollar and
non-U.S. dollar debt portfolios included approximately $1,215
million and $1,801 million, respectively, of debt for which
the interest rates and/or redemption values or maturity have
been linked to the performance of various indices including
industry baskets of stocks or commodities or events. Generally,
such notes are issued as floating rate notes or the interest
rates on such index notes are effectively converted to floating
rates based primarily on LIBOR through the use of interest
rate, currency and equity swaps.
In October 2001, the Company entered into a $1 billion
Committed Securities Repurchase Facility (the “Facility”) for
Lehman Brothers International (Europe) (“LBIE”), the
Company’s major operating entity in Europe. The Facility pro-
vides secured multi-currency financing for a broad range of col-
lateral types. Under the terms of the Facility, the bank group will
agree to provide funding for up to one year on a secured basis.
Any loans outstanding on the commitment termination date
may be extended for up to an additional year at the option of
Of the Company’s long-term debt outstanding as of November
30, 2001, $674 million is repayable prior to maturity at the
option of the holder, at par value. These obligations are
reflected in the above table as maturing at their put dates,
which range from fiscal 2002 to fiscal 2008, rather than at their
contractual maturities, which range from fiscal 2004 to fiscal
2026. In addition, $1,320 million of the Company’s long-term
debt
is redeemable prior to maturity at the option of the Company
under various terms and conditions. These obligations are
reflected in the above table at their contractual maturity dates.
U.S. Dollar Non-U.S. Dollar
In millions Fixed Floating Fixed Floating
November 30 Rate Rate Rate Rate 2001 2000
SENIOR NOTES
Maturing in Fiscal 2001 $ 6,782
Maturing in Fiscal 2002 $ 1,961 $ 4,397 $ 835 $ 858 $ 8,051 5,873
Maturing in Fiscal 2003 2,341 2,322 694 595 5,952 4,989
Maturing in Fiscal 2004 1,755 1,180 1,092 679 4,706 3,582
Maturing in Fiscal 2005 2,360 615 242 605 3,822 3,759
Maturing in Fiscal 2006 3,066 83 522 409 4,080 1,456
December 1, 2006 and thereafter 5,462 505 1,376 1,419 8,762 5,665
Senior Notes 16,945 9,102 4,761 4,565 35,373 32,106
SUBORDINATED INDEBTEDNESS
Maturing in Fiscal 2001 200
Maturing in Fiscal 2002 450 33 – – 483 488
Maturing in Fiscal 2003 475 – – – 475 475
Maturing in Fiscal 2004 191 – – – 191 191
Maturing in Fiscal 2005 94 – 7 – 101 101
Maturing in Fiscal 2006 300 – – – 300 300
December 1, 2006 and thereafter 1,219 152 7 – 1,378 1,372
Subordinated Indebtedness 2,729 185 14 – 2,928 3,127
Long-Term Debt $19,674 $ 9,287 $ 4,775 $ 4,565 $38,301 $35,233
4 Long-Term Debt
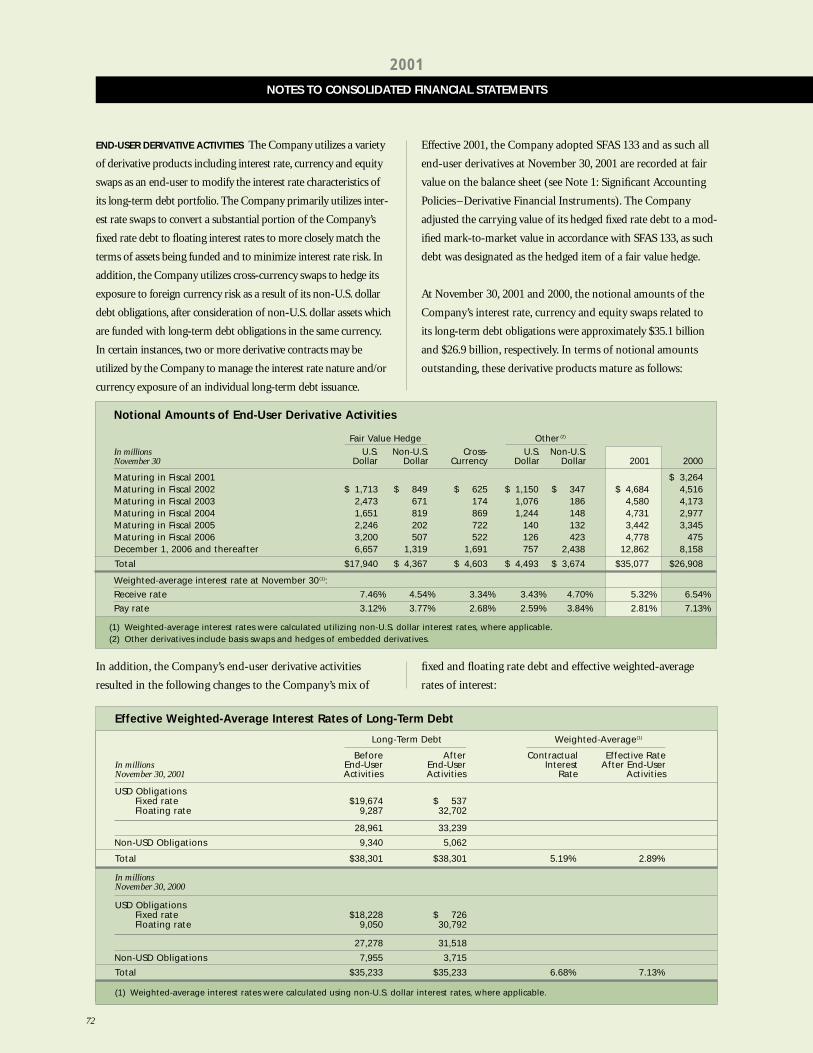
Effective Weighted-Average Interest Rates of Long-Term Debt
Long-Term Debt Weighted-Average(1)
Before After Contractual Effective RateIn millions End-User End-User Interest After End-UserNovember 30, 2001 Activities Activities Rate Activities
USD ObligationsFixed rate $19,674 $ 537Floating rate 9,287 32,702
28,961 33,239
Non-USD Obligations 9,340 5,062
Total $38,301 $38,301 5.19% 2.89%
In millionsNovember 30, 2000
USD ObligationsFixed rate $18,228 $ 726Floating rate 9,050 30,792
27,278 31,518
Non-USD Obligations 7,955 3,715
Total $35,233 $35,233 6.68% 7.13%
(1) Weighted-average interest rates were calculated using non-U.S. dollar interest rates, where applicable.
In addition, the Company’s end-user derivative activities
resulted in the following changes to the Company’s mix of
fixed and floating rate debt and effective weighted-average
rates of interest:
END-USER DERIVATIVE ACTIVITIES The Company utilizes a variety
of derivative products including interest rate, currency and equity
swaps as an end-user to modify the interest rate characteristics of
its long-term debt portfolio. The Company primarily utilizes inter-
est rate swaps to convert a substantial portion of the Company’s
fixed rate debt to floating interest rates to more closely match the
terms of assets being funded and to minimize interest rate risk. In
addition, the Company utilizes cross-currency swaps to hedge its
exposure to foreign currency risk as a result of its non-U.S. dollar
debt obligations, after consideration of non-U.S. dollar assets which
are funded with long-term debt obligations in the same currency.
In certain instances, two or more derivative contracts may be
utilized by the Company to manage the interest rate nature and/or
currency exposure of an individual long-term debt issuance.
Effective 2001, the Company adopted SFAS 133 and as such all
end-user derivatives at November 30, 2001 are recorded at fair
value on the balance sheet (see Note 1: Significant Accounting
Policies–Derivative Financial Instruments). The Company
adjusted the carrying value of its hedged fixed rate debt to a mod-
ified mark-to-market value in accordance with SFAS 133, as such
debt was designated as the hedged item of a fair value hedge.
At November 30, 2001 and 2000, the notional amounts of the
Company’s interest rate, currency and equity swaps related to
its long-term debt obligations were approximately $35.1 billion
and $26.9 billion, respectively. In terms of notional amounts
outstanding, these derivative products mature as follows:
72
NOTES TO CONSOLIDATED FINANCIAL STATEMENTS
2001
Notional Amounts of End-User Derivative Activities
Fair Value Hedge Other (2)
In millions U.S. Non-U.S. Cross- U.S. Non-U.S.November 30 Dollar Dollar Currency Dollar Dollar 2001 2000
Maturing in Fiscal 2001 $ 3,264Maturing in Fiscal 2002 $ 1,713 $ 849 $ 625 $ 1,150 $ 347 $ 4,684 4,516Maturing in Fiscal 2003 2,473 671 174 1,076 186 4,580 4,173Maturing in Fiscal 2004 1,651 819 869 1,244 148 4,731 2,977Maturing in Fiscal 2005 2,246 202 722 140 132 3,442 3,345Maturing in Fiscal 2006 3,200 507 522 126 423 4,778 475December 1, 2006 and thereafter 6,657 1,319 1,691 757 2,438 12,862 8,158
Total $17,940 $ 4,367 $ 4,603 $ 4,493 $ 3,674 $35,077 $26,908
Weighted-average interest rate at November 30(1):
Receive rate 7.46% 4.54% 3.34% 3.43% 4.70% 5.32% 6.54%
Pay rate 3.12% 3.77% 2.68% 2.59% 3.84% 2.81% 7.13%
(1) Weighted-average interest rates were calculated utilizing non-U.S. dollar interest rates, where applicable.(2) Other derivatives include basis swaps and hedges of embedded derivatives.
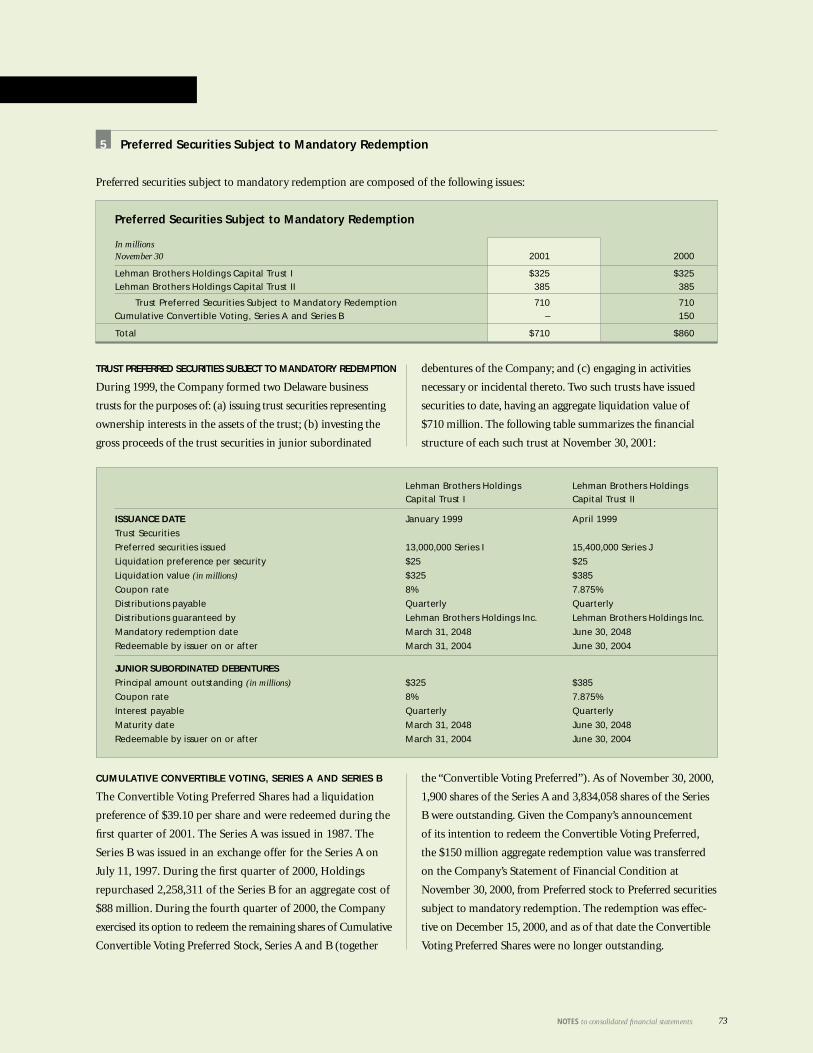
73NOTES to consolidated financial statements
Preferred Securities Subject to Mandatory Redemption
Preferred securities subject to mandatory redemption are composed of the following issues:
Preferred Securities Subject to Mandatory Redemption
In millionsNovember 30 2001 2000
Lehman Brothers Holdings Capital Trust I $325 $325Lehman Brothers Holdings Capital Trust II 385 385
Trust Preferred Securities Subject to Mandatory Redemption 710 710Cumulative Convertible Voting, Series A and Series B – 150
Total $710 $860
Lehman Brothers Holdings Lehman Brothers Holdings Capital Trust I Capital Trust II
ISSUANCE DATE January 1999 April 1999
Trust Securities
Preferred securities issued 13,000,000 Series I 15,400,000 Series J
Liquidation preference per security $25 $25
Liquidation value (in millions) $325 $385
Coupon rate 8% 7.875%
Distributions payable Quarterly Quarterly
Distributions guaranteed by Lehman Brothers Holdings Inc. Lehman Brothers Holdings Inc.
Mandatory redemption date March 31, 2048 June 30, 2048
Redeemable by issuer on or after March 31, 2004 June 30, 2004
JUNIOR SUBORDINATED DEBENTURES
Principal amount outstanding (in millions) $325 $385
Coupon rate 8% 7.875%
Interest payable Quarterly Quarterly
Maturity date March 31, 2048 June 30, 2048
Redeemable by issuer on or after March 31, 2004 June 30, 2004
5
TRUST PREFERRED SECURITIES SUBJECT TO MANDATORY REDEMPTION
During 1999, the Company formed two Delaware business
trusts for the purposes of: (a) issuing trust securities representing
ownership interests in the assets of the trust; (b) investing the
gross proceeds of the trust securities in junior subordinated
debentures of the Company; and (c) engaging in activities
necessary or incidental thereto. Two such trusts have issued
securities to date, having an aggregate liquidation value of
$710 million. The following table summarizes the financial
structure of each such trust at November 30, 2001:
CUMULATIVE CONVERTIBLE VOTING, SERIES A AND SERIES B
The Convertible Voting Preferred Shares had a liquidation
preference of $39.10 per share and were redeemed during the
first quarter of 2001. The Series A was issued in 1987. The
Series B was issued in an exchange offer for the Series A on
July 11, 1997. During the first quarter of 2000, Holdings
repurchased 2,258,311 of the Series B for an aggregate cost of
$88 million. During the fourth quarter of 2000, the Company
exercised its option to redeem the remaining shares of Cumulative
Convertible Voting Preferred Stock, Series A and B (together
the “Convertible Voting Preferred”). As of November 30, 2000,
1,900 shares of the Series A and 3,834,058 shares of the Series
B were outstanding. Given the Company’s announcement
of its intention to redeem the Convertible Voting Preferred,
the $150 million aggregate redemption value was transferred
on the Company’s Statement of Financial Condition at
November 30, 2000, from Preferred stock to Preferred securities
subject to mandatory redemption. The redemption was effec-
tive on December 15, 2000, and as of that date the Convertible
Voting Preferred Shares were no longer outstanding.

74
NOTES TO CONSOLIDATED FINANCIAL STATEMENTS
2001
Preferred Stock
Holdings is authorized to issue a total of 38,000,000 shares
of preferred stock. At November 30, 2001, Holdings had
591,000 shares issued and outstanding under various series as
described below. All preferred stock has a dividend preference
over Holdings’ common stock in the paying of dividends and
a preference in the liquidation of assets.
SERIES C On May 11, 1998, Holdings issued 5,000,000
Depository Shares, each representing 1/10th of a share
of 5.94% Cumulative Preferred Stock, Series C (“Series C
Preferred Stock”), $1.00 par value. These shares have a
redemption price of $500 per share, together with accrued
and unpaid dividends. Holdings may redeem any or all of
the outstanding shares of Series C Preferred Stock beginning
on May 31, 2008. The $250 million redemption value of the
shares outstanding at November 30, 2001 is classified on the
Company’s Consolidated Statement of Financial Condition
as a component of Preferred stock.
SERIES D On July 21, 1998, Holdings issued 4,000,000
Depository Shares, each representing 1/100th of a share
of 5.67% Cumulative Preferred Stock, Series D (“Series D
Preferred Stock”), $1.00 par value. These shares have a
redemption price of $5,000 per share, together with accrued
and unpaid dividends. Holdings may redeem any or all of
the outstanding shares of Series D Preferred Stock beginning
on August 31, 2008. The $200 million redemption value
of the shares outstanding at November 30, 2001 is classified
on the Company’s Consolidated Statement of Financial
Condition as a component of Preferred stock.
SERIES E On March 28, 2000, Holdings issued 5,000,000
Depository Shares, each representing 1/100th of a share of
Fixed/Adjustable Rate Cumulative Preferred Stock, Series E
(“Series E Preferred Stock”), $1.00 par value. The initial cumu-
lative dividend rate on the Series E Preferred Stock is 7.115%
per annum through May 31, 2005; thereafter the rate will be
the higher of either the three-month U.S. Treasury Bill rate, the
10-year Treasury constant maturity rate or the 30-year U.S.
Treasury constant maturity rate, in each case plus 1.15%,
but in any event not less than 7.615% nor greater than
13.615%. These shares have a redemption price of $5,000
per share, together with accrued and unpaid dividends.
Holdings may redeem any or all of the outstanding shares of
Series E Preferred Stock beginning on May 31, 2005. The
$250 million redemption value of the shares outstanding
at November 30, 2001 is classified on the Company’s
Consolidated Statement of Financial Condition as a compo-
nent of Preferred stock.
REDEEMABLE VOTING In 1994, Holdings issued the Redeemable
Voting Preferred Stock to American Express and Nippon Life
for $1,000. The holders of the Redeemable Voting Preferred
Stock are entitled to receive annual dividends through
May 31, 2002, in an amount equal to 50% of the amount,
if any, by which the Company’s net income for each fiscal
year exceeds $400 million, up to a maximum of $50 million
per year. For the last dividend period, which runs from
December 1, 2001 to May 31, 2002, holders are entitled to
receive a dividend equal to 50% of the amount, if any, by
which the Company’s net income for the first six months
of fiscal 2002 exceeds $200 million, up to a maximum of $25
million. For the years ended November 30, 2001, 2000 and
1999, the Company’s net income resulted in the recognition
of dividends in each year in the amount of $50 million on the
Redeemable Voting Preferred Stock.
Holdings is required to redeem all of the Redeemable Preferred
Stock on the final dividend payment, July 15, 2002, for a total
of $1,000. In the event of a change of control of the Company,
holders of the Redeemable Preferred Stock had the right to
require Holdings to redeem all of the stock for an aggregate
redemption price equal to $50 million if such change of
control occurred prior to November 30, 2001. If a change of
control was not approved by a majority of Holdings’ Board
of Directors, the funds for redemption would have had to be
raised by an offering of Holdings’ equity securities, which
were not redeemable. The Redeemable Preferred Stock is not
convertible into common stock.
6
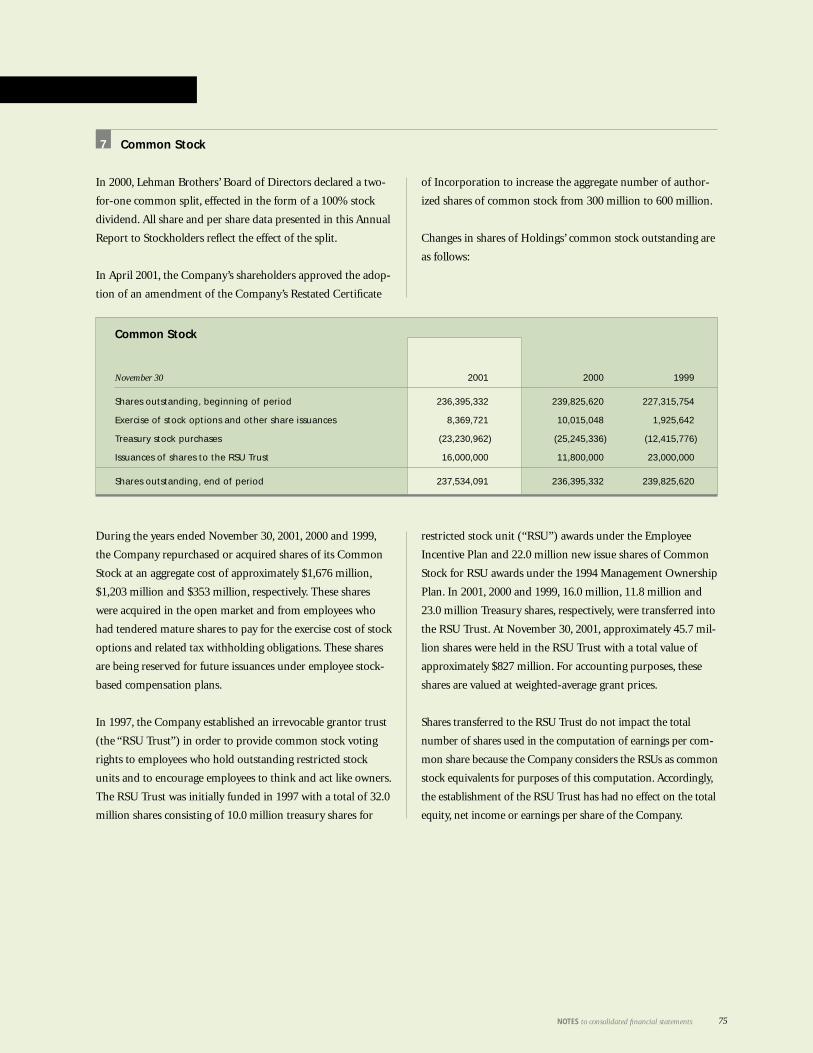
75NOTES to consolidated financial statements
Common Stock
In 2000, Lehman Brothers’ Board of Directors declared a two-
for-one common split, effected in the form of a 100% stock
dividend. All share and per share data presented in this Annual
Report to Stockholders reflect the effect of the split.
In April 2001, the Company’s shareholders approved the adop-
tion of an amendment of the Company’s Restated Certificate
of Incorporation to increase the aggregate number of author-
ized shares of common stock from 300 million to 600 million.
Changes in shares of Holdings’ common stock outstanding are
as follows:
During the years ended November 30, 2001, 2000 and 1999,
the Company repurchased or acquired shares of its Common
Stock at an aggregate cost of approximately $1,676 million,
$1,203 million and $353 million, respectively. These shares
were acquired in the open market and from employees who
had tendered mature shares to pay for the exercise cost of stock
options and related tax withholding obligations. These shares
are being reserved for future issuances under employee stock-
based compensation plans.
In 1997, the Company established an irrevocable grantor trust
(the “RSU Trust”) in order to provide common stock voting
rights to employees who hold outstanding restricted stock
units and to encourage employees to think and act like owners.
The RSU Trust was initially funded in 1997 with a total of 32.0
million shares consisting of 10.0 million treasury shares for
restricted stock unit (“RSU”) awards under the Employee
Incentive Plan and 22.0 million new issue shares of Common
Stock for RSU awards under the 1994 Management Ownership
Plan. In 2001, 2000 and 1999, 16.0 million, 11.8 million and
23.0 million Treasury shares, respectively, were transferred into
the RSU Trust. At November 30, 2001, approximately 45.7 mil-
lion shares were held in the RSU Trust with a total value of
approximately $827 million. For accounting purposes, these
shares are valued at weighted-average grant prices.
Shares transferred to the RSU Trust do not impact the total
number of shares used in the computation of earnings per com-
mon share because the Company considers the RSUs as common
stock equivalents for purposes of this computation. Accordingly,
the establishment of the RSU Trust has had no effect on the total
equity, net income or earnings per share of the Company.
Common Stock
November 30 2001 2000 1999
Shares outstanding, beginning of period 236,395,332 239,825,620 227,315,754
Exercise of stock options and other share issuances 8,369,721 10,015,048 1,925,642
Treasury stock purchases (23,230,962) (25,245,336) (12,415,776)
Issuances of shares to the RSU Trust 16,000,000 11,800,000 23,000,000
Shares outstanding, end of period 237,534,091 236,395,332 239,825,620
7

Incentive Plans
EMPLOYEE STOCK PURCHASE PLAN The Employee Stock
Purchase Plan (the “ESPP”) allows employees to purchase
Common Stock at a 15% discount from market value, with a
maximum of $25,000 in annual aggregate purchases by any
one individual. The number of shares of Common Stock
authorized for purchase by eligible employees is 12.0 million.
As of November 30, 2001 and 2000, 5.5 million shares and
5.2 million shares, respectively, of Common Stock had cumula-
tively been purchased by eligible employees through the ESPP.
1994 INCENTIVE PLANS The 1994 Management Replacement
Plan (the “Replacement Plan”) provided awards similar to the
American Express common shares granted to Company
employees which were canceled as of the date of the spin-off
from American Express. Through November 30, 2001, a total
of 3.9 million awards had been granted under the Replacement
Plan, including both stock options and restricted stock; 0.1
million shares were outstanding at November 30, 2001. No
future awards will be granted under this plan.
The Lehman Brothers Holdings Inc. 1994 Management
Ownership Plan (the “1994 Plan”) provides for the issuance of
RSUs, performance stock units (“PSUs”), stock options and other
equity awards for a period of up to ten years to eligible employees.
A total of 33.3 million shares of Common Stock may be granted
under the 1994 Plan. At November 30, 2001, RSU, PSU and stock
option awards with respect to 31.1 million shares of Common
Stock have been made under the 1994 Plan of which 1.5 million
are outstanding and 29.6 million have been converted to freely
transferable Common Stock. The Company will utilize the
remaining authorization of 2.2 million shares to satisfy dividend
reinvestment requirements for outstanding awards and to fund the
annual RSU awards for the Company’s non-employee directors.
1996 MANAGEMENT OWNERSHIP PLAN During 1996, the
Company’s stockholders approved the 1996 Management
Ownership Plan (the “1996 Plan”) under which awards similar
to those of the 1994 Plan may be granted, and under which
up to 42.0 million shares of Common Stock may be subject
to awards. At November 30, 2001, RSU, PSU and stock option
awards with respect to 31.4 million shares of Common Stock
have been made under the 1996 Plan of which 18.9 million
are outstanding and 12.5 million have been converted to freely
transferable Common Stock.
EMPLOYEE INCENTIVE PLAN The Employee Incentive Plan
(“EIP”) has provisions similar to the 1994 Plan and the 1996
Plan, and authorization from the Board of Directors for the
issuance of up to 196.0 million shares of Common Stock
which may be subject to awards. At November 30, 2001,
awards with respect to 157.8 million shares of Common Stock
have been made under the EIP of which 124.3 million are out-
standing and 33.5 million have been converted to freely trans-
ferable Common Stock.
76
NOTES TO CONSOLIDATED FINANCIAL STATEMENTS
2001
8
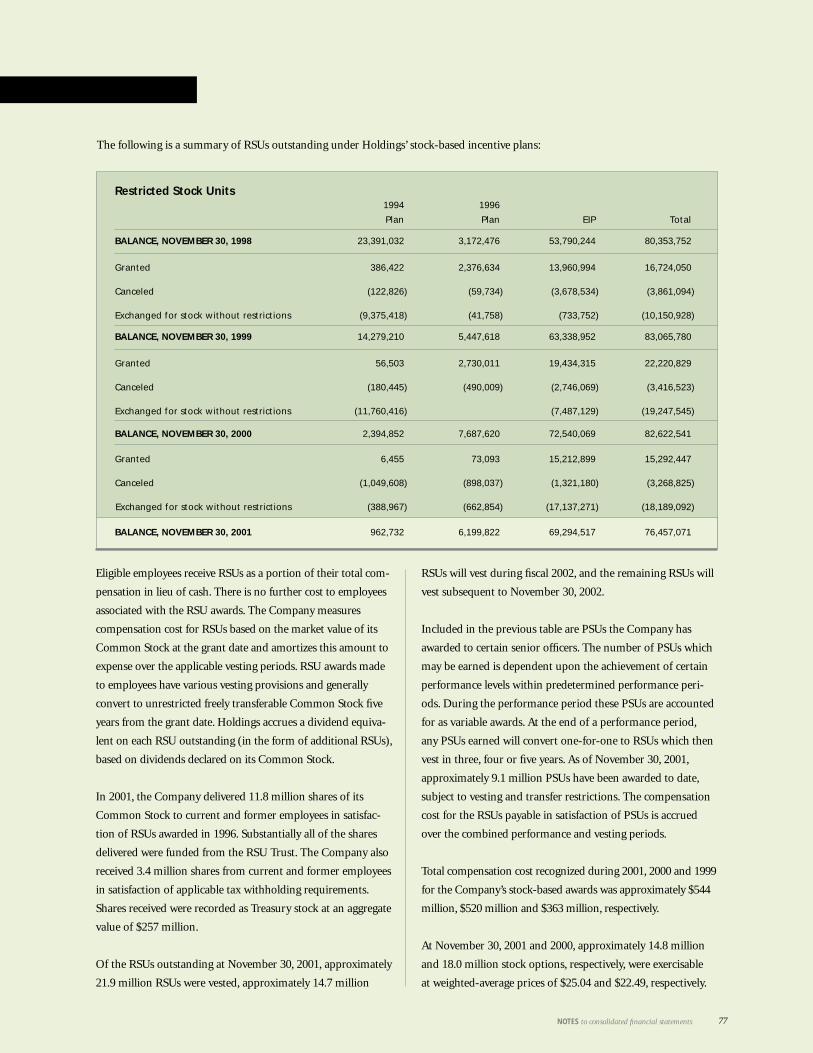
Restricted Stock Units1994 1996
Plan Plan EIP Total
BALANCE, NOVEMBER 30, 1998 23,391,032 3,172,476 53,790,244 80,353,752
Granted 386,422 2,376,634 13,960,994 16,724,050
Canceled (122,826) (59,734) (3,678,534) (3,861,094)
Exchanged for stock without restrictions (9,375,418) (41,758) (733,752) (10,150,928)
BALANCE, NOVEMBER 30, 1999 14,279,210 5,447,618 63,338,952 83,065,780
Granted 56,503 2,730,011 19,434,315 22,220,829
Canceled (180,445) (490,009) (2,746,069) (3,416,523)
Exchanged for stock without restrictions (11,760,416) (7,487,129) (19,247,545)
BALANCE, NOVEMBER 30, 2000 2,394,852 7,687,620 72,540,069 82,622,541
Granted 6,455 73,093 15,212,899 15,292,447
Canceled (1,049,608) (898,037) (1,321,180) (3,268,825)
Exchanged for stock without restrictions (388,967) (662,854) (17,137,271) (18,189,092)
BALANCE, NOVEMBER 30, 2001 962,732 6,199,822 69,294,517 76,457,071
77NOTES to consolidated financial statements
Eligible employees receive RSUs as a portion of their total com-
pensation in lieu of cash. There is no further cost to employees
associated with the RSU awards. The Company measures
compensation cost for RSUs based on the market value of its
Common Stock at the grant date and amortizes this amount to
expense over the applicable vesting periods. RSU awards made
to employees have various vesting provisions and generally
convert to unrestricted freely transferable Common Stock five
years from the grant date. Holdings accrues a dividend equiva-
lent on each RSU outstanding (in the form of additional RSUs),
based on dividends declared on its Common Stock.
In 2001, the Company delivered 11.8 million shares of its
Common Stock to current and former employees in satisfac-
tion of RSUs awarded in 1996. Substantially all of the shares
delivered were funded from the RSU Trust. The Company also
received 3.4 million shares from current and former employees
in satisfaction of applicable tax withholding requirements.
Shares received were recorded as Treasury stock at an aggregate
value of $257 million.
Of the RSUs outstanding at November 30, 2001, approximately
21.9 million RSUs were vested, approximately 14.7 million
The following is a summary of RSUs outstanding under Holdings’ stock-based incentive plans:
RSUs will vest during fiscal 2002, and the remaining RSUs will
vest subsequent to November 30, 2002.
Included in the previous table are PSUs the Company has
awarded to certain senior officers. The number of PSUs which
may be earned is dependent upon the achievement of certain
performance levels within predetermined performance peri-
ods. During the performance period these PSUs are accounted
for as variable awards. At the end of a performance period,
any PSUs earned will convert one-for-one to RSUs which then
vest in three, four or five years. As of November 30, 2001,
approximately 9.1 million PSUs have been awarded to date,
subject to vesting and transfer restrictions. The compensation
cost for the RSUs payable in satisfaction of PSUs is accrued
over the combined performance and vesting periods.
Total compensation cost recognized during 2001, 2000 and 1999
for the Company’s stock-based awards was approximately $544
million, $520 million and $363 million, respectively.
At November 30, 2001 and 2000, approximately 14.8 million
and 18.0 million stock options, respectively, were exercisable
at weighted-average prices of $25.04 and $22.49, respectively.
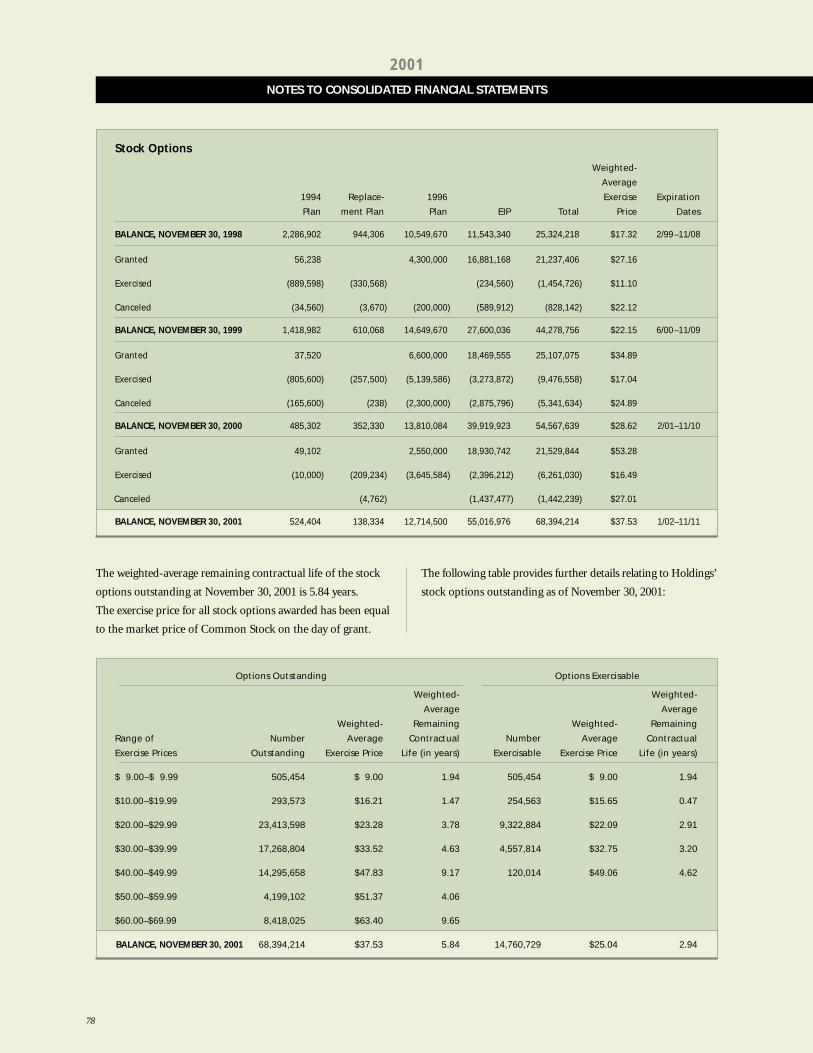
78
NOTES TO CONSOLIDATED FINANCIAL STATEMENTS
2001
The weighted-average remaining contractual life of the stock
options outstanding at November 30, 2001 is 5.84 years.
The exercise price for all stock options awarded has been equal
to the market price of Common Stock on the day of grant.
The following table provides further details relating to Holdings’
stock options outstanding as of November 30, 2001:
Options Outstanding Options Exercisable
Weighted- Weighted-
Average Average
Weighted- Remaining Weighted- Remaining
Range of Number Average Contractual Number Average Contractual
Exercise Prices Outstanding Exercise Price Life (in years) Exercisable Exercise Price Life (in years)
$ 9.00–$ 9.99 505,454 $ 9.00 1.94 505,454 $ 9.00 1.94
$10.00–$19.99 293,573 $16.21 1.47 254,563 $15.65 0.47
$20.00–$29.99 23,413,598 $23.28 3.78 9,322,884 $22.09 2.91
$30.00–$39.99 17,268,804 $33.52 4.63 4,557,814 $32.75 3.20
$40.00–$49.99 14,295,658 $47.83 9.17 120,014 $49.06 4.62
$50.00–$59.99 4,199,102 $51.37 4.06
$60.00–$69.99 8,418,025 $63.40 9.65
BALANCE, NOVEMBER 30, 2001 68,394,214 $37.53 5.84 14,760,729 $25.04 2.94
Stock Options
Weighted-
Average
1994 Replace- 1996 Exercise Expiration
Plan ment Plan Plan EIP Total Price Dates
BALANCE, NOVEMBER 30, 1998 2,286,902 944,306 10,549,670 11,543,340 25,324,218 $17.32 2/99–11/08
Granted 56,238 4,300,000 16,881,168 21,237,406 $27.16
Exercised (889,598) (330,568) (234,560) (1,454,726) $11.10
Canceled (34,560) (3,670) (200,000) (589,912) (828,142) $22.12
BALANCE, NOVEMBER 30, 1999 1,418,982 610,068 14,649,670 27,600,036 44,278,756 $22.15 6/00–11/09
Granted 37,520 6,600,000 18,469,555 25,107,075 $34.89
Exercised (805,600) (257,500) (5,139,586) (3,273,872) (9,476,558) $17.04
Canceled (165,600) (238) (2,300,000) (2,875,796) (5,341,634) $24.89
BALANCE, NOVEMBER 30, 2000 485,302 352,330 13,810,084 39,919,923 54,567,639 $28.62 2/01–11/10
Granted 49,102 2,550,000 18,930,742 21,529,844 $53.28
Exercised (10,000) (209,234) (3,645,584) (2,396,212) (6,261,030) $16.49
Canceled (4,762) (1,437,477) (1,442,239) $27.01
BALANCE, NOVEMBER 30, 2001 524,404 138,334 12,714,500 55,016,976 68,394,214 $37.53 1/02–11/11
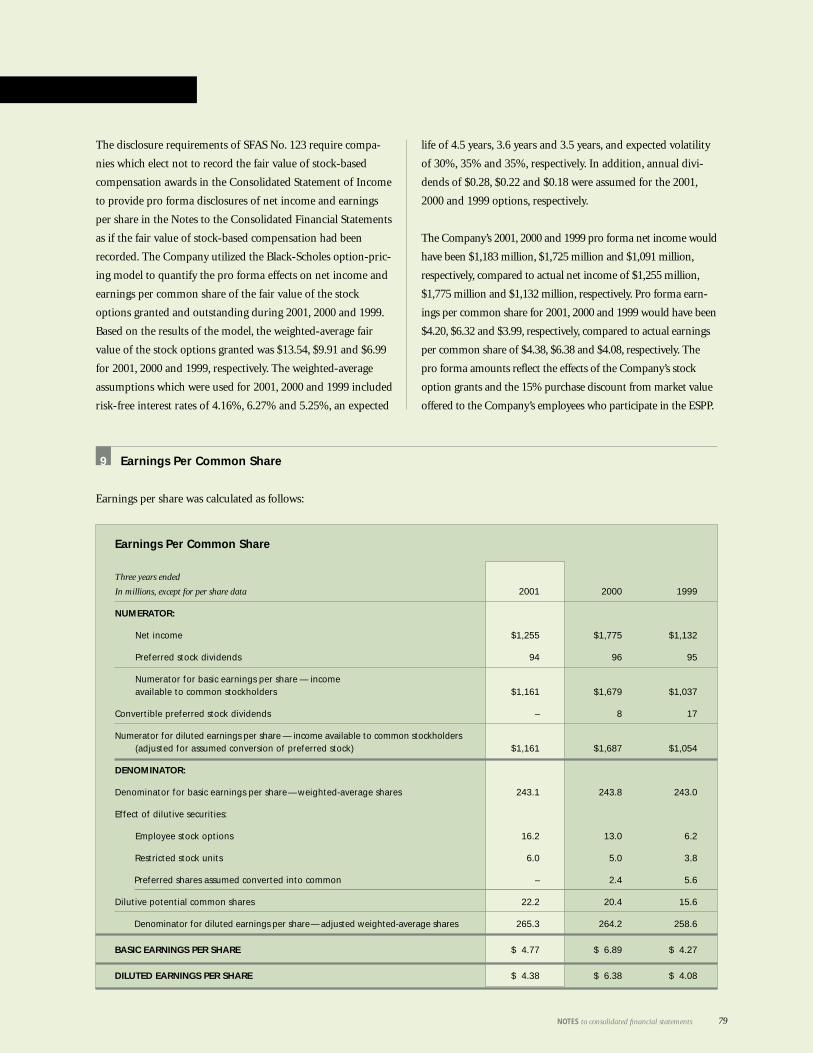
79NOTES to consolidated financial statements
The disclosure requirements of SFAS No. 123 require compa-
nies which elect not to record the fair value of stock-based
compensation awards in the Consolidated Statement of Income
to provide pro forma disclosures of net income and earnings
per share in the Notes to the Consolidated Financial Statements
as if the fair value of stock-based compensation had been
recorded. The Company utilized the Black-Scholes option-pric-
ing model to quantify the pro forma effects on net income and
earnings per common share of the fair value of the stock
options granted and outstanding during 2001, 2000 and 1999.
Based on the results of the model, the weighted-average fair
value of the stock options granted was $13.54, $9.91 and $6.99
for 2001, 2000 and 1999, respectively. The weighted-average
assumptions which were used for 2001, 2000 and 1999 included
risk-free interest rates of 4.16%, 6.27% and 5.25%, an expected
life of 4.5 years, 3.6 years and 3.5 years, and expected volatility
of 30%, 35% and 35%, respectively. In addition, annual divi-
dends of $0.28, $0.22 and $0.18 were assumed for the 2001,
2000 and 1999 options, respectively.
The Company’s 2001, 2000 and 1999 pro forma net income would
have been $1,183 million, $1,725 million and $1,091 million,
respectively, compared to actual net income of $1,255 million,
$1,775 million and $1,132 million, respectively. Pro forma earn-
ings per common share for 2001, 2000 and 1999 would have been
$4.20, $6.32 and $3.99, respectively, compared to actual earnings
per common share of $4.38, $6.38 and $4.08, respectively. The
pro forma amounts reflect the effects of the Company’s stock
option grants and the 15% purchase discount from market value
offered to the Company’s employees who participate in the ESPP.
Earnings Per Common Share
Earnings per share was calculated as follows:
9
Earnings Per Common Share
Three years ended
In millions, except for per share data 2001 2000 1999
NUMERATOR:
Net income $1,255 $1,775 $1,132
Preferred stock dividends 94 96 95
Numerator for basic earnings per share — incomeavailable to common stockholders $1,161 $1,679 $1,037
Convertible preferred stock dividends – 8 17
Numerator for diluted earnings per share — income available to common stockholders (adjusted for assumed conversion of preferred stock) $1,161 $1,687 $1,054
DENOMINATOR:
Denominator for basic earnings per share—weighted-average shares 243.1 243.8 243.0
Effect of dilutive securities:
Employee stock options 16.2 13.0 6.2
Restricted stock units 6.0 5.0 3.8
Preferred shares assumed converted into common – 2.4 5.6
Dilutive potential common shares 22.2 20.4 15.6
Denominator for diluted earnings per share— adjusted weighted-average shares 265.3 264.2 258.6
BASIC EARNINGS PER SHARE $ 4.77 $ 6.89 $ 4.27
DILUTED EARNINGS PER SHARE $ 4.38 $ 6.38 $ 4.08
80
NOTES TO CONSOLIDATED FINANCIAL STATEMENTS
2001
For 2000 and 1999, Convertible Voting Preferred Shares were
convertible into common shares at a conversion price of
approximately $61.50 per share. However, for purposes of
calculating dilutive earnings per share, preferred shares were
assumed to be converted into common shares when basic
earnings per share exceed preferred dividends per share
obtainable upon conversion (approximately $3.08 on an
annualized basis).
Capital Requirements
The Company operates globally through a network of sub-
sidiaries, with several subject to regulatory requirements. In the
United States, LBI, as a registered broker-dealer, is subject to
the Securities and Exchange Commission (“SEC”) Rule 15c3-1,
the Net Capital Rule, which requires LBI to maintain net
capital of not less than the greater of 2% of aggregate debit
items arising from customer transactions, as defined, or 4% of
funds required to be segregated for customers’ regulated
commodity accounts, as defined. At November 30, 2001, LBI’s
regulatory net capital, as defined, of $1,771 million exceeded
the minimum requirement by $1,589 million.
LBIE, a United Kingdom registered broker-dealer and sub-
sidiary of Holdings, is subject to the capital requirements of
the Securities and Futures Authority (“SFA”) of the United
Kingdom. Financial resources, as defined, must exceed the total
financial resources requirement of the SFA. At November 30,
2001, LBIE’s financial resources of approximately $2,389
million exceeded the minimum requirement by approximately
$703 million. Lehman Brothers Japan Inc.’s Tokyo branch, a
regulated broker-dealer, is subject to the capital requirements
of the Financial Services Agency and at November 30, 2001,
had net capital of approximately $302 million which was
approximately $129 million in excess of the specified levels
required. Lehman Brothers Bank, FSB (the “Bank”), the
Company’s thrift subsidiary, is regulated by the Office of
Thrift Supervision (“OTS”). The Bank exceeds all regulatory
capital requirements and is considered well capitalized by the
OTS. Certain other non-U.S. subsidiaries are subject to various
securities, commodities and banking regulations and capital
adequacy requirements promulgated by the regulatory and
exchange authorities of the countries in which they operate.
At November 30, 2001, these other subsidiaries were in compli-
ance with their applicable local capital adequacy requirements.
In addition, the Company’s “AAA” rated derivatives sub-
sidiaries, Lehman Brothers Financial Products Inc. (“LBFP”)
and Lehman Brothers Derivative Products Inc. (“LBDP”), have
established certain capital and operating restrictions which
are reviewed by various rating agencies. At November 30, 2001,
LBFP and LBDP each had capital which exceeded the require-
ment of the most stringent rating agency by approximately
$68 million and $27 million, respectively.
The regulatory rules referred to above, and certain covenants
contained in various debt agreements, may restrict Holdings’
ability to withdraw capital from its regulated subsidiaries,
which in turn could limit its ability to pay dividends to share-
holders. At November 30, 2001, approximately $5.3 billion
of net assets of subsidiaries were restricted as to the payment
of dividends to Holdings.
10
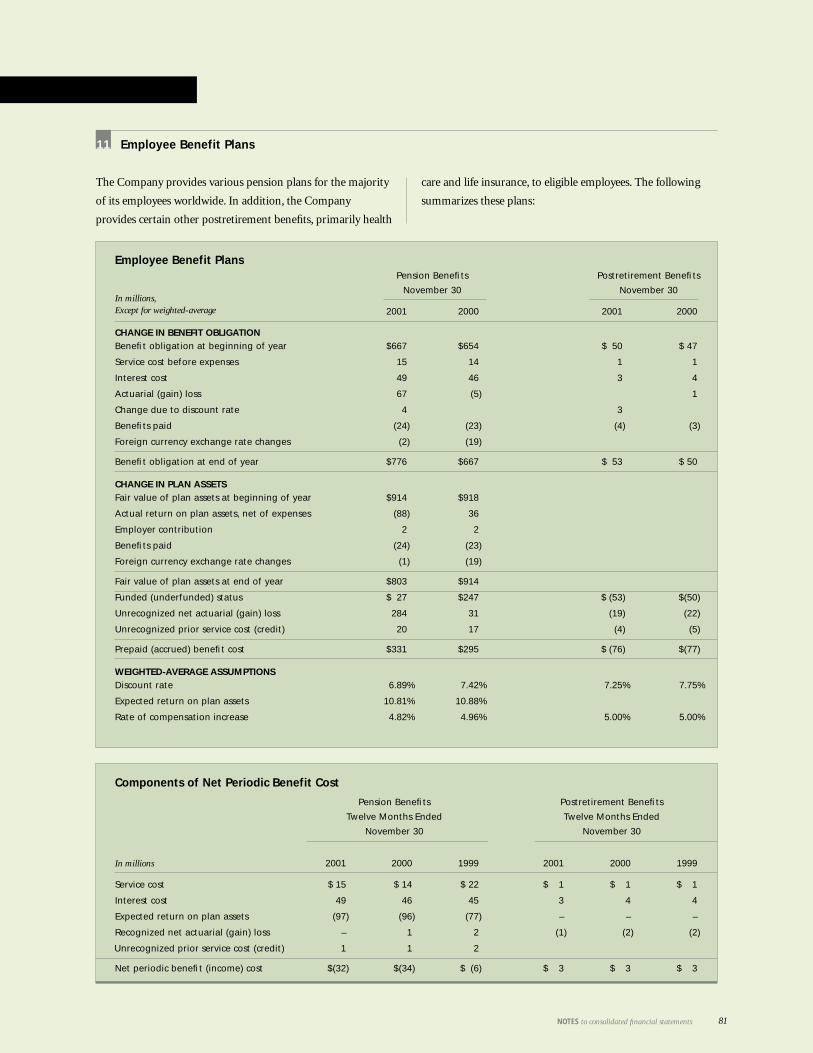
81NOTES to consolidated financial statements
Employee Benefit Plans
The Company provides various pension plans for the majority
of its employees worldwide. In addition, the Company
provides certain other postretirement benefits, primarily health
care and life insurance, to eligible employees. The following
summarizes these plans:
Employee Benefit PlansPension Benefits Postretirement Benefits
November 30 November 30In millions,Except for weighted-average 2001 2000 2001 2000
CHANGE IN BENEFIT OBLIGATIONBenefit obligation at beginning of year $667 $654 $ 50 $ 47
Service cost before expenses 15 14 1 1
Interest cost 49 46 3 4
Actuarial (gain) loss 67 (5) 1
Change due to discount rate 4 3
Benefits paid (24) (23) (4) (3)
Foreign currency exchange rate changes (2) (19)
Benefit obligation at end of year $776 $667 $ 53 $ 50
CHANGE IN PLAN ASSETSFair value of plan assets at beginning of year $914 $918
Actual return on plan assets, net of expenses (88) 36
Employer contribution 2 2
Benefits paid (24) (23)
Foreign currency exchange rate changes (1) (19)
Fair value of plan assets at end of year $803 $914
Funded (underfunded) status $ 27 $247 $ (53) $(50)
Unrecognized net actuarial (gain) loss 284 31 (19) (22)
Unrecognized prior service cost (credit) 20 17 (4) (5)
Prepaid (accrued) benefit cost $331 $295 $ (76) $(77)
WEIGHTED-AVERAGE ASSUMPTIONSDiscount rate 6.89% 7.42% 7.25% 7.75%
Expected return on plan assets 10.81% 10.88%
Rate of compensation increase 4.82% 4.96% 5.00% 5.00%
11
Components of Net Periodic Benefit Cost
Pension Benefits Postretirement Benefits
Twelve Months Ended Twelve Months Ended
November 30 November 30
In millions 2001 2000 1999 2001 2000 1999
Service cost $ 15 $ 14 $ 22 $ 1 $ 1 $ 1
Interest cost 49 46 45 3 4 4
Expected return on plan assets (97) (96) (77) – – –
Recognized net actuarial (gain) loss – 1 2 (1) (2) (2)
Unrecognized prior service cost (credit) 1 1 2
Net periodic benefit (income) cost $(32) $(34) $ (6) $ 3 $ 3 $ 3
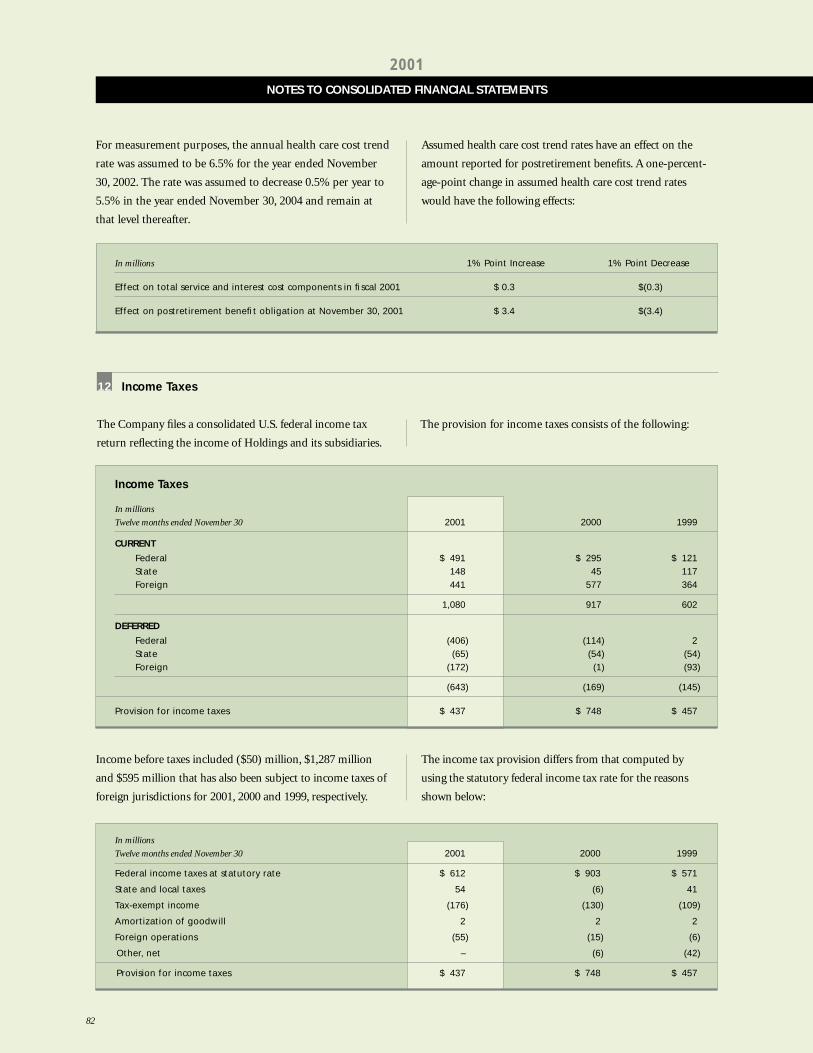
82
NOTES TO CONSOLIDATED FINANCIAL STATEMENTS
2001
12
In millions
Twelve months ended November 30 2001 2000 1999
Federal income taxes at statutory rate $ 612 $ 903 $ 571
State and local taxes 54 (6) 41
Tax-exempt income (176) (130) (109)
Amortization of goodwill 2 2 2
Foreign operations (55) (15) (6)
Other, net – (6) (42)
Provision for income taxes $ 437 $ 748 $ 457
The provision for income taxes consists of the following:
Income Taxes
The Company files a consolidated U.S. federal income tax
return reflecting the income of Holdings and its subsidiaries.
The income tax provision differs from that computed by
using the statutory federal income tax rate for the reasons
shown below:
Income before taxes included ($50) million, $1,287 million
and $595 million that has also been subject to income taxes of
foreign jurisdictions for 2001, 2000 and 1999, respectively.
In millions 1% Point Increase 1% Point Decrease
Effect on total service and interest cost components in fiscal 2001 $ 0.3 $(0.3)
Effect on postretirement benefit obligation at November 30, 2001 $ 3.4 $(3.4)
For measurement purposes, the annual health care cost trend
rate was assumed to be 6.5% for the year ended November
30, 2002. The rate was assumed to decrease 0.5% per year to
5.5% in the year ended November 30, 2004 and remain at
that level thereafter.
Assumed health care cost trend rates have an effect on the
amount reported for postretirement benefits. A one-percent-
age-point change in assumed health care cost trend rates
would have the following effects:
Income Taxes
In millions
Twelve months ended November 30 2001 2000 1999
CURRENT
Federal $ 491 $ 295 $ 121State 148 45 117Foreign 441 577 364
1,080 917 602
DEFERRED
Federal (406) (114) 2State (65) (54) (54)Foreign (172) (1) (93)
(643) (169) (145)
Provision for income taxes $ 437 $ 748 $ 457
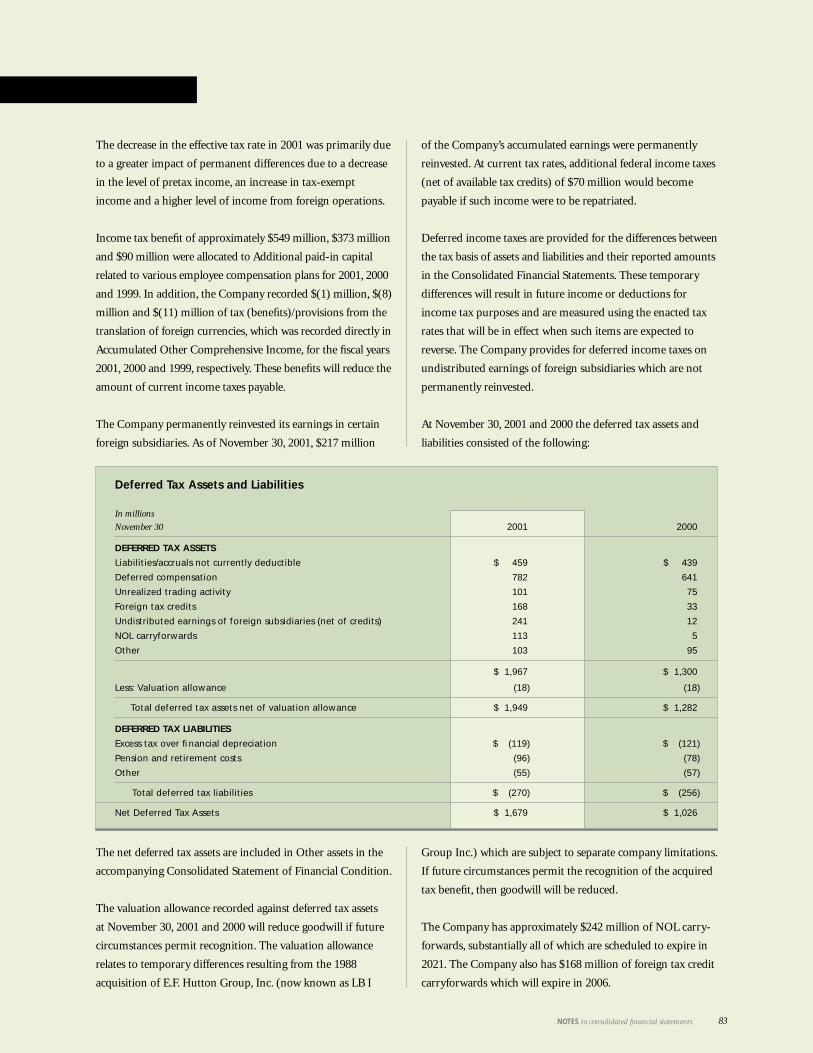
83NOTES to consolidated financial statements
The decrease in the effective tax rate in 2001 was primarily due
to a greater impact of permanent differences due to a decrease
in the level of pretax income, an increase in tax-exempt
income and a higher level of income from foreign operations.
Income tax benefit of approximately $549 million, $373 million
and $90 million were allocated to Additional paid-in capital
related to various employee compensation plans for 2001, 2000
and 1999. In addition, the Company recorded $(1) million, $(8)
million and $(11) million of tax (benefits)/provisions from the
translation of foreign currencies, which was recorded directly in
Accumulated Other Comprehensive Income, for the fiscal years
2001, 2000 and 1999, respectively. These benefits will reduce the
amount of current income taxes payable.
The Company permanently reinvested its earnings in certain
foreign subsidiaries. As of November 30, 2001, $217 million
of the Company’s accumulated earnings were permanently
reinvested. At current tax rates, additional federal income taxes
(net of available tax credits) of $70 million would become
payable if such income were to be repatriated.
Deferred income taxes are provided for the differences between
the tax basis of assets and liabilities and their reported amounts
in the Consolidated Financial Statements. These temporary
differences will result in future income or deductions for
income tax purposes and are measured using the enacted tax
rates that will be in effect when such items are expected to
reverse. The Company provides for deferred income taxes on
undistributed earnings of foreign subsidiaries which are not
permanently reinvested.
At November 30, 2001 and 2000 the deferred tax assets and
liabilities consisted of the following:
Deferred Tax Assets and Liabilities
In millions
November 30 2001 2000
DEFERRED TAX ASSETS
Liabilities/accruals not currently deductible $ 459 $ 439
Deferred compensation 782 641
Unrealized trading activity 101 75
Foreign tax credits 168 33
Undistributed earnings of foreign subsidiaries (net of credits) 241 12
NOL carryforwards 113 5
Other 103 95
$ 1,967 $ 1,300
Less: Valuation allowance (18) (18)
Total deferred tax assets net of valuation allowance $ 1,949 $ 1,282
DEFERRED TAX LIABILITIES
Excess tax over financial depreciation $ (119) $ (121)
Pension and retirement costs (96) (78)
Other (55) (57)
Total deferred tax liabilities $ (270) $ (256)
Net Deferred Tax Assets $ 1,679 $ 1,026
The net deferred tax assets are included in Other assets in the
accompanying Consolidated Statement of Financial Condition.
The valuation allowance recorded against deferred tax assets
at November 30, 2001 and 2000 will reduce goodwill if future
circumstances permit recognition. The valuation allowance
relates to temporary differences resulting from the 1988
acquisition of E.F. Hutton Group, Inc. (now known as LB I
Group Inc.) which are subject to separate company limitations.
If future circumstances permit the recognition of the acquired
tax benefit, then goodwill will be reduced.
The Company has approximately $242 million of NOL carry-
forwards, substantially all of which are scheduled to expire in
2021. The Company also has $168 million of foreign tax credit
carryforwards which will expire in 2006.
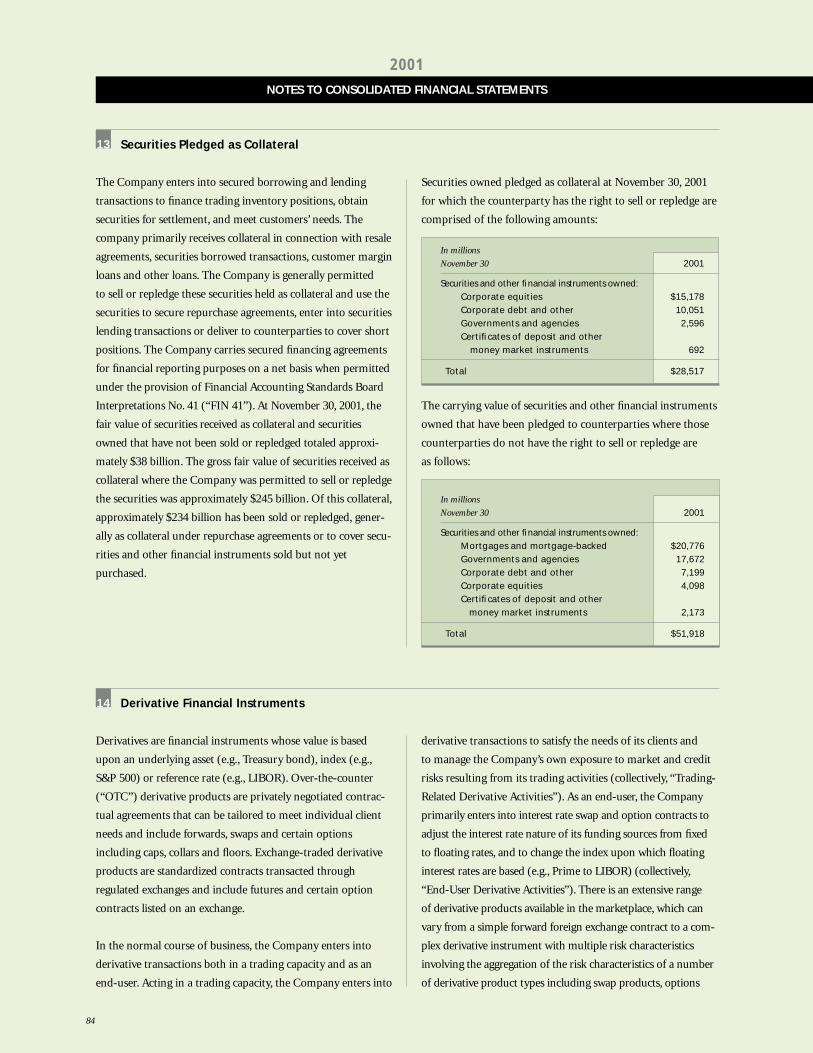
84
NOTES TO CONSOLIDATED FINANCIAL STATEMENTS
2001
Derivative Financial Instruments
Derivatives are financial instruments whose value is based
upon an underlying asset (e.g., Treasury bond), index (e.g.,
S&P 500) or reference rate (e.g., LIBOR). Over-the-counter
(“OTC”) derivative products are privately negotiated contrac-
tual agreements that can be tailored to meet individual client
needs and include forwards, swaps and certain options
including caps, collars and floors. Exchange-traded derivative
products are standardized contracts transacted through
regulated exchanges and include futures and certain option
contracts listed on an exchange.
In the normal course of business, the Company enters into
derivative transactions both in a trading capacity and as an
end-user. Acting in a trading capacity, the Company enters into
derivative transactions to satisfy the needs of its clients and
to manage the Company’s own exposure to market and credit
risks resulting from its trading activities (collectively, “Trading-
Related Derivative Activities”). As an end-user, the Company
primarily enters into interest rate swap and option contracts to
adjust the interest rate nature of its funding sources from fixed
to floating rates, and to change the index upon which floating
interest rates are based (e.g., Prime to LIBOR) (collectively,
“End-User Derivative Activities”). There is an extensive range
of derivative products available in the marketplace, which can
vary from a simple forward foreign exchange contract to a com-
plex derivative instrument with multiple risk characteristics
involving the aggregation of the risk characteristics of a number
of derivative product types including swap products, options
14
Securities Pledged as Collateral
The Company enters into secured borrowing and lending
transactions to finance trading inventory positions, obtain
securities for settlement, and meet customers’ needs. The
company primarily receives collateral in connection with resale
agreements, securities borrowed transactions, customer margin
loans and other loans. The Company is generally permitted
to sell or repledge these securities held as collateral and use the
securities to secure repurchase agreements, enter into securities
lending transactions or deliver to counterparties to cover short
positions. The Company carries secured financing agreements
for financial reporting purposes on a net basis when permitted
under the provision of Financial Accounting Standards Board
Interpretations No. 41 (“FIN 41”). At November 30, 2001, the
fair value of securities received as collateral and securities
owned that have not been sold or repledged totaled approxi-
mately $38 billion. The gross fair value of securities received as
collateral where the Company was permitted to sell or repledge
the securities was approximately $245 billion. Of this collateral,
approximately $234 billion has been sold or repledged, gener-
ally as collateral under repurchase agreements or to cover secu-
rities and other financial instruments sold but not yet
purchased.
The carrying value of securities and other financial instruments
owned that have been pledged to counterparties where those
counterparties do not have the right to sell or repledge are
as follows:
Securities owned pledged as collateral at November 30, 2001
for which the counterparty has the right to sell or repledge are
comprised of the following amounts:
In millions
November 30 2001
Securities and other financial instruments owned:Corporate equities $15,178Corporate debt and other 10,051Governments and agencies 2,596Certificates of deposit and other
money market instruments 692
Total $28,517
In millions
November 30 2001
Securities and other financial instruments owned:Mortgages and mortgage-backed $20,776Governments and agencies 17,672Corporate debt and other 7,199Corporate equities 4,098Certificates of deposit and other
money market instruments 2,173
Total $51,918
13

85NOTES to consolidated financial statements
mined exercise price (strike price) during a defined period
(American Option) or at a specified date (European Option).
The option purchaser pays a premium to the option seller
(writer) for the right to exercise the option. The option seller is
obligated to buy (put) or sell (call) the item underlying the
contract at a set price, if the option purchaser chooses to exer-
cise. Option contracts also exist for various indices and are
similar to options on a security or other instrument except
that, rather than physical settling with delivery of the underly-
ing instrument, they are cash settled. As a purchaser of an
option contract, the Company is subject to credit risk, since
the counterparty is obligated to make payments under the
terms of the option contract, if the Company exercises the
option. As the writer of an option contract, the Company is
not subject to credit risk but is subject to market risk, since the
Company is obligated to make payments under the terms of
the option contract if exercised.
Option contracts may be exchange-traded or OTC. Exchange-
traded options are the obligations of the exchange and
generally have standardized terms and performance mechanics.
In contrast, all of the terms of an OTC option including the
method of settlement, term, strike price, premium and security
are determined by negotiation of the parties.
FUTURES AND FORWARDS Futures contracts are exchange-
traded contractual commitments to either receive (purchase)
or deliver (sell) a standard amount or value of a financial
instrument or commodity at a specified future date and price.
Maintaining a futures contract requires the Company to
deposit with the exchange an amount of cash or other speci-
fied assets as security for its obligation. Therefore, the potential
for losses from exchange-traded products is limited. As of
November 30, 2001 the Company had approximately $2.6 bil-
lion on deposit with futures exchanges consisting of cash and
securities (customer and proprietary). Additionally, futures
exchanges generally require the daily cash settlement of unreal-
ized gains/losses on open contracts with the futures exchange.
Therefore, futures contracts provide a reduced funding alterna-
tive to purchasing the underlying cash position in the market-
place. Futures contracts may be settled by physical delivery of
the underlying asset or cash settlement (for index futures) on
the settlement date or by entering into an offsetting futures
contract with the futures exchange prior to the settlement date.
and forwards. Listed below are examples of various derivative
product types along with a brief discussion of the performance
mechanics of certain specific derivative instruments.
SWAP PRODUCTS Interest rate swap products include interest rate
and currency swaps, leveraged swaps, swap options, other interest
rate option products including caps, collars and floors, and credit
default swaps. An interest rate swap is a negotiated OTC contract
in which two parties agree to exchange periodic interest payments
for a defined period, calculated based upon a predetermined
notional amount. Interest payments are usually exchanged on a
net basis throughout the duration of the swap contract. A cur-
rency swap is an OTC agreement to exchange a fixed amount of
one currency for a specified amount of a second currency at the
outset and completion of the swap term. Leveraged swaps involve
the multiplication of the interest rate factor upon which the inter-
est payment streams are based (e.g., Party A pays three times the
six-month LIBOR). Caps are contractual commitments that
require the writer to pay the purchaser the amount by which an
interest reference rate exceeds a defined contractual rate, if any, at
specified times during the contract. Conversely, a floor is a con-
tractual commitment that requires the writer to pay the amount
by which a defined contractual rate exceeds an interest reference
rate at specified times over the life of the contract, if any. Equity
swaps are contractual agreements whereby one party agrees to
receive the appreciation (or depreciation) value over a strike price
on an equity investment in return for paying another rate, which
is usually based upon equity index movements or interest rates.
Commodity swaps are contractual commitments to exchange the
fixed price of a commodity for a floating price (which is usually
the prevailing spot price) throughout the swap term. Credit deriv-
atives are contractual agreements that provide insurance against a
credit event of one or more referenced credits. The nature of the
credit event is established by the buyer and seller at the inception
of the transaction, and such events include bankruptcy, insol-
vency, rating agency downgrade and failure to meet payment
obligations when due. The buyer of the credit derivative pays a
periodic fee in return for a contingent payment by the seller
(insurer) following a credit event. The Company acts as both a
buyer and seller of credit derivatives.
OPTIONS Option contracts provide the option purchaser
(holder) with the right but not the obligation to buy or sell a
financial instrument, commodity or currency at a predeter-
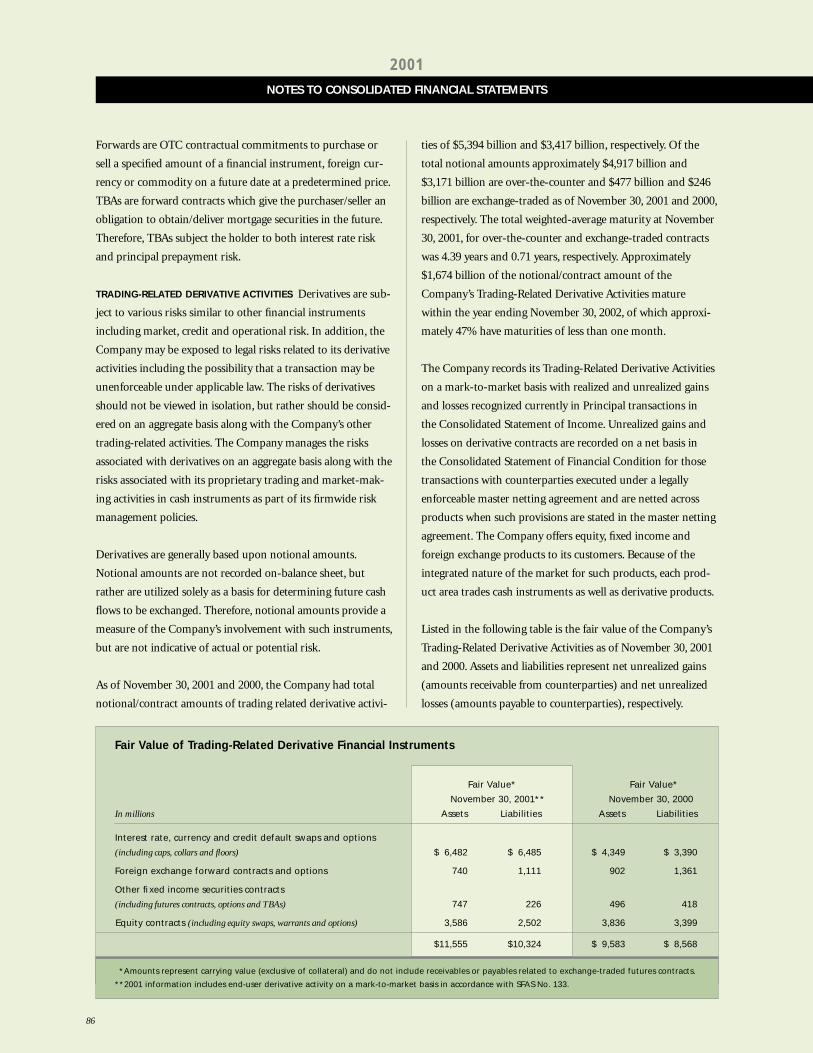
86
NOTES TO CONSOLIDATED FINANCIAL STATEMENTS
2001
Fair Value of Trading-Related Derivative Financial Instruments
Fair Value* Fair Value*
November 30, 2001** November 30, 2000
In millions Assets Liabilities Assets Liabilities
Interest rate, currency and credit default swaps and options
(including caps, collars and floors) $ 6,482 $ 6,485 $ 4,349 $ 3,390
Foreign exchange forward contracts and options 740 1,111 902 1,361
Other fixed income securities contracts
(including futures contracts, options and TBAs) 747 226 496 418
Equity contracts (including equity swaps, warrants and options) 3,586 2,502 3,836 3,399
$11,555 $10,324 $ 9,583 $ 8,568
*Amounts represent carrying value (exclusive of collateral) and do not include receivables or payables related to exchange-traded futures contracts.
**2001 information includes end-user derivative activity on a mark-to-market basis in accordance with SFAS No. 133.
Forwards are OTC contractual commitments to purchase or
sell a specified amount of a financial instrument, foreign cur-
rency or commodity on a future date at a predetermined price.
TBAs are forward contracts which give the purchaser/seller an
obligation to obtain/deliver mortgage securities in the future.
Therefore, TBAs subject the holder to both interest rate risk
and principal prepayment risk.
TRADING-RELATED DERIVATIVE ACTIVITIES Derivatives are sub-
ject to various risks similar to other financial instruments
including market, credit and operational risk. In addition, the
Company may be exposed to legal risks related to its derivative
activities including the possibility that a transaction may be
unenforceable under applicable law. The risks of derivatives
should not be viewed in isolation, but rather should be consid-
ered on an aggregate basis along with the Company’s other
trading-related activities. The Company manages the risks
associated with derivatives on an aggregate basis along with the
risks associated with its proprietary trading and market-mak-
ing activities in cash instruments as part of its firmwide risk
management policies.
Derivatives are generally based upon notional amounts.
Notional amounts are not recorded on-balance sheet, but
rather are utilized solely as a basis for determining future cash
flows to be exchanged. Therefore, notional amounts provide a
measure of the Company’s involvement with such instruments,
but are not indicative of actual or potential risk.
As of November 30, 2001 and 2000, the Company had total
notional/contract amounts of trading related derivative activi-
ties of $5,394 billion and $3,417 billion, respectively. Of the
total notional amounts approximately $4,917 billion and
$3,171 billion are over-the-counter and $477 billion and $246
billion are exchange-traded as of November 30, 2001 and 2000,
respectively. The total weighted-average maturity at November
30, 2001, for over-the-counter and exchange-traded contracts
was 4.39 years and 0.71 years, respectively. Approximately
$1,674 billion of the notional/contract amount of the
Company’s Trading-Related Derivative Activities mature
within the year ending November 30, 2002, of which approxi-
mately 47% have maturities of less than one month.
The Company records its Trading-Related Derivative Activities
on a mark-to-market basis with realized and unrealized gains
and losses recognized currently in Principal transactions in
the Consolidated Statement of Income. Unrealized gains and
losses on derivative contracts are recorded on a net basis in
the Consolidated Statement of Financial Condition for those
transactions with counterparties executed under a legally
enforceable master netting agreement and are netted across
products when such provisions are stated in the master netting
agreement. The Company offers equity, fixed income and
foreign exchange products to its customers. Because of the
integrated nature of the market for such products, each prod-
uct area trades cash instruments as well as derivative products.
Listed in the following table is the fair value of the Company’s
Trading-Related Derivative Activities as of November 30, 2001
and 2000. Assets and liabilities represent net unrealized gains
(amounts receivable from counterparties) and net unrealized
losses (amounts payable to counterparties), respectively.
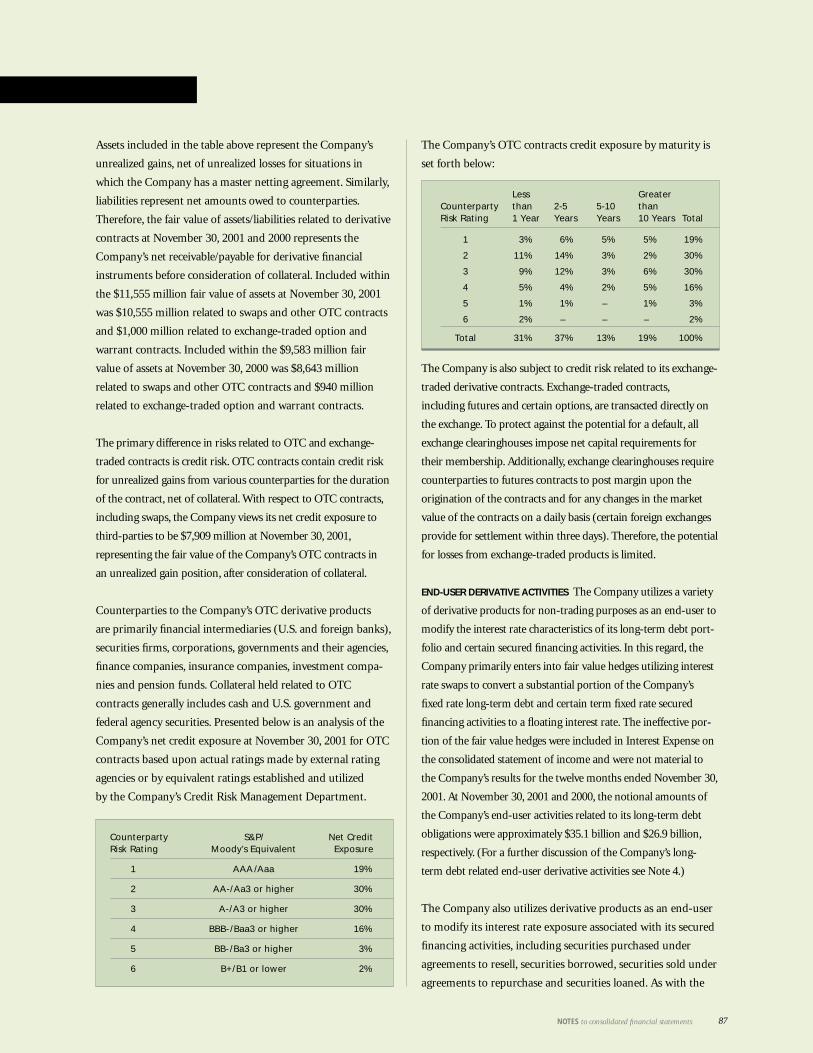
87NOTES to consolidated financial statements
Assets included in the table above represent the Company’s
unrealized gains, net of unrealized losses for situations in
which the Company has a master netting agreement. Similarly,
liabilities represent net amounts owed to counterparties.
Therefore, the fair value of assets/liabilities related to derivative
contracts at November 30, 2001 and 2000 represents the
Company’s net receivable/payable for derivative financial
instruments before consideration of collateral. Included within
the $11,555 million fair value of assets at November 30, 2001
was $10,555 million related to swaps and other OTC contracts
and $1,000 million related to exchange-traded option and
warrant contracts. Included within the $9,583 million fair
value of assets at November 30, 2000 was $8,643 million
related to swaps and other OTC contracts and $940 million
related to exchange-traded option and warrant contracts.
The primary difference in risks related to OTC and exchange-
traded contracts is credit risk. OTC contracts contain credit risk
for unrealized gains from various counterparties for the duration
of the contract, net of collateral. With respect to OTC contracts,
including swaps, the Company views its net credit exposure to
third-parties to be $7,909 million at November 30, 2001,
representing the fair value of the Company’s OTC contracts in
an unrealized gain position, after consideration of collateral.
Counterparties to the Company’s OTC derivative products
are primarily financial intermediaries (U.S. and foreign banks),
securities firms, corporations, governments and their agencies,
finance companies, insurance companies, investment compa-
nies and pension funds. Collateral held related to OTC
contracts generally includes cash and U.S. government and
federal agency securities. Presented below is an analysis of the
Company’s net credit exposure at November 30, 2001 for OTC
contracts based upon actual ratings made by external rating
agencies or by equivalent ratings established and utilized
by the Company’s Credit Risk Management Department.
Counterparty S&P/ Net CreditRisk Rating Moody’s Equivalent Exposure
1 AAA/Aaa 19%
2 AA-/Aa3 or higher 30%
3 A-/A3 or higher 30%
4 BBB-/Baa3 or higher 16%
5 BB-/Ba3 or higher 3%
6 B+/B1 or lower 2%
The Company’s OTC contracts credit exposure by maturity is
set forth below:
The Company is also subject to credit risk related to its exchange-
traded derivative contracts. Exchange-traded contracts,
including futures and certain options, are transacted directly on
the exchange. To protect against the potential for a default, all
exchange clearinghouses impose net capital requirements for
their membership. Additionally, exchange clearinghouses require
counterparties to futures contracts to post margin upon the
origination of the contracts and for any changes in the market
value of the contracts on a daily basis (certain foreign exchanges
provide for settlement within three days). Therefore, the potential
for losses from exchange-traded products is limited.
END-USER DERIVATIVE ACTIVITIES The Company utilizes a variety
of derivative products for non-trading purposes as an end-user to
modify the interest rate characteristics of its long-term debt port-
folio and certain secured financing activities. In this regard, the
Company primarily enters into fair value hedges utilizing interest
rate swaps to convert a substantial portion of the Company’s
fixed rate long-term debt and certain term fixed rate secured
financing activities to a floating interest rate. The ineffective por-
tion of the fair value hedges were included in Interest Expense on
the consolidated statement of income and were not material to
the Company’s results for the twelve months ended November 30,
2001. At November 30, 2001 and 2000, the notional amounts of
the Company’s end-user activities related to its long-term debt
obligations were approximately $35.1 billion and $26.9 billion,
respectively. (For a further discussion of the Company’s long-
term debt related end-user derivative activities see Note 4.)
The Company also utilizes derivative products as an end-user
to modify its interest rate exposure associated with its secured
financing activities, including securities purchased under
agreements to resell, securities borrowed, securities sold under
agreements to repurchase and securities loaned. As with the
Less Greater Counterparty than 2-5 5-10 thanRisk Rating 1 Year Years Years 10 Years Total
1 3% 6% 5% 5% 19%
2 11% 14% 3% 2% 30%
3 9% 12% 3% 6% 30%
4 5% 4% 2% 5% 16%
5 1% 1% – 1% 3%
6 2% – – – 2%
Total 31% 37% 13% 19% 100%
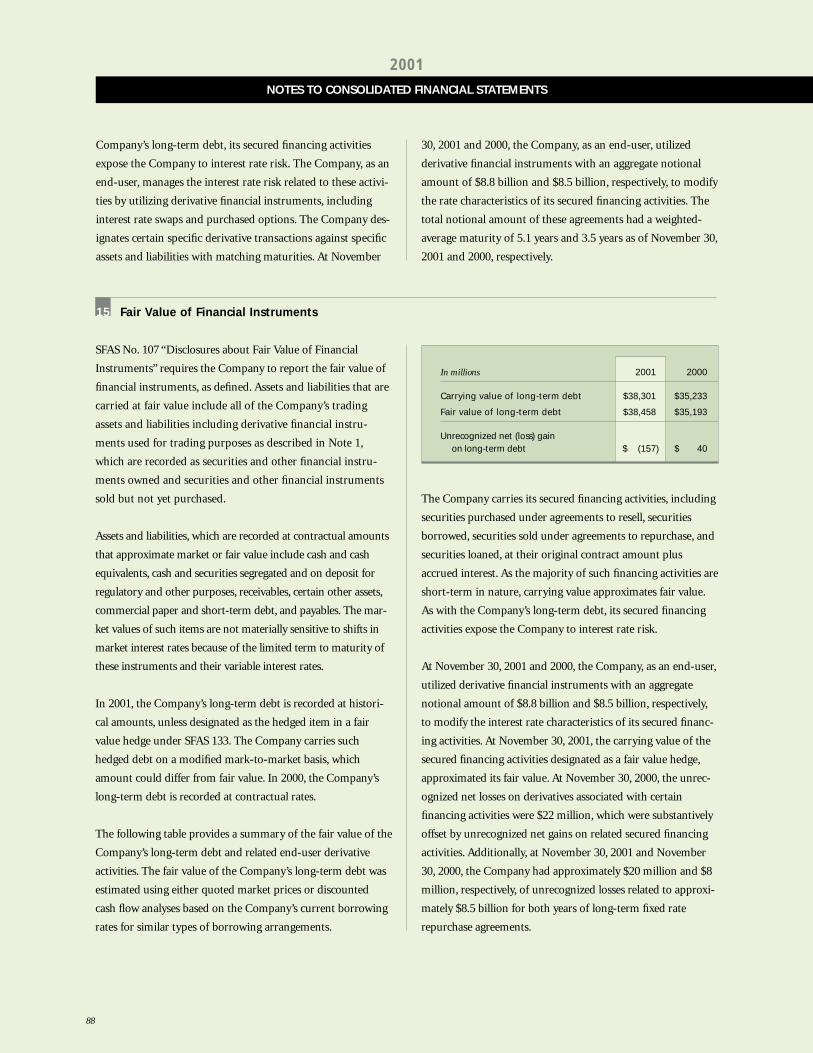
88
NOTES TO CONSOLIDATED FINANCIAL STATEMENTS
2001
In millions 2001 2000
Carrying value of long-term debt $38,301 $35,233
Fair value of long-term debt $38,458 $35,193
Unrecognized net (loss) gainon long-term debt $ (157) $ 40
30, 2001 and 2000, the Company, as an end-user, utilized
derivative financial instruments with an aggregate notional
amount of $8.8 billion and $8.5 billion, respectively, to modify
the rate characteristics of its secured financing activities. The
total notional amount of these agreements had a weighted-
average maturity of 5.1 years and 3.5 years as of November 30,
2001 and 2000, respectively.
Company’s long-term debt, its secured financing activities
expose the Company to interest rate risk. The Company, as an
end-user, manages the interest rate risk related to these activi-
ties by utilizing derivative financial instruments, including
interest rate swaps and purchased options. The Company des-
ignates certain specific derivative transactions against specific
assets and liabilities with matching maturities. At November
Fair Value of Financial Instruments
SFAS No. 107 “Disclosures about Fair Value of Financial
Instruments” requires the Company to report the fair value of
financial instruments, as defined. Assets and liabilities that are
carried at fair value include all of the Company’s trading
assets and liabilities including derivative financial instru-
ments used for trading purposes as described in Note 1,
which are recorded as securities and other financial instru-
ments owned and securities and other financial instruments
sold but not yet purchased.
Assets and liabilities, which are recorded at contractual amounts
that approximate market or fair value include cash and cash
equivalents, cash and securities segregated and on deposit for
regulatory and other purposes, receivables, certain other assets,
commercial paper and short-term debt, and payables. The mar-
ket values of such items are not materially sensitive to shifts in
market interest rates because of the limited term to maturity of
these instruments and their variable interest rates.
In 2001, the Company’s long-term debt is recorded at histori-
cal amounts, unless designated as the hedged item in a fair
value hedge under SFAS 133. The Company carries such
hedged debt on a modified mark-to-market basis, which
amount could differ from fair value. In 2000, the Company’s
long-term debt is recorded at contractual rates.
The following table provides a summary of the fair value of the
Company’s long-term debt and related end-user derivative
activities. The fair value of the Company’s long-term debt was
estimated using either quoted market prices or discounted
cash flow analyses based on the Company’s current borrowing
rates for similar types of borrowing arrangements.
The Company carries its secured financing activities, including
securities purchased under agreements to resell, securities
borrowed, securities sold under agreements to repurchase, and
securities loaned, at their original contract amount plus
accrued interest. As the majority of such financing activities are
short-term in nature, carrying value approximates fair value.
As with the Company’s long-term debt, its secured financing
activities expose the Company to interest rate risk.
At November 30, 2001 and 2000, the Company, as an end-user,
utilized derivative financial instruments with an aggregate
notional amount of $8.8 billion and $8.5 billion, respectively,
to modify the interest rate characteristics of its secured financ-
ing activities. At November 30, 2001, the carrying value of the
secured financing activities designated as a fair value hedge,
approximated its fair value. At November 30, 2000, the unrec-
ognized net losses on derivatives associated with certain
financing activities were $22 million, which were substantively
offset by unrecognized net gains on related secured financing
activities. Additionally, at November 30, 2001 and November
30, 2000, the Company had approximately $20 million and $8
million, respectively, of unrecognized losses related to approxi-
mately $8.5 billion for both years of long-term fixed rate
repurchase agreements.
15

89NOTES to consolidated financial statements
Other Commitments And Contingencies
As of November 30, 2001 and 2000, the Company was contin-
gently liable for $1.1 billion and $2.1 billion, respectively, of
letters of credit, primarily used to provide collateral for securi-
ties and commodities borrowed and to satisfy margin deposits
at option and commodity exchanges, and other guarantees.
In connection with its financing activities, the Company had
outstanding commitments under certain lending arrangements
of approximately $2.1 billion and $3.2 billion, at November 30,
2001 and 2000, respectively. These commitments require
borrowers to provide acceptable collateral, as defined in the
agreements, when amounts are drawn under the lending facili-
ties. Advances made under the above lending arrangements are
typically at variable interest rates and generally provide for over-
collateralization based upon the borrowers’ creditworthiness.
In addition, the Company, through its high grade and high
yield sales, trading and underwriting activities, makes commit-
ments to extend credit in loan syndication transactions. The
Company utilizes various hedging and funding strategies to
actively manage its market, credit and liquidity exposures on
these commitments. In addition, total commitments are not
indicative of actual risk or funding requirements, as the com-
mitments may not be drawn or fully utilized. These commit-
ments and any related draw downs of these facilities typically
have fixed maturity dates and are contingent upon certain rep-
resentations, warranties and contractual conditions applicable
to the borrower.
At November 30, 2001 and 2000, the Company had net lending
commitments to investment grade borrowers of $4.1 billion
(gross commitments of $5.9 billion less $1.8 billion of associ-
ated hedges) and $4.3 billion ($4.4 billion of gross commit-
ments and $0.1 billion of associated hedges), respectively.
Lending
commitments to non-investment grade borrowers totaled
$1.4 billion and $1.3 billion at November 30, 2001 and 2000,
respectively. In addition, at November 30, 2001 and 2000, the
Company has pre-arranged funding facilities with third party
lenders of $4.9 billion and $3.8 billion, respectively, available
to it to fund draw downs against these commitments. These
funding facilities contain limits for certain concentrations of
counterparty, industry or credit ratings of the underlying loans.
As of November 30, 2001, the Company had pledged securities,
primarily fixed income, having a market value of approximately
$31.8 billion, as collateral for securities borrowed having a mar-
ket value of approximately $31.2 billion.
At November 30, 2001, the Company had commitments to enter
into forward starting secured resale and repurchase agreements
of $52.3 billion and $26.5 billion, respectively, as compared to
secured resale and repurchase agreements of $51.9 billion and
$17.0 billion, respectively, as of November 30, 2000.
Securities and other financial instruments sold but not yet
purchased represent obligations of the Company to purchase
the securities at prevailing market prices. Therefore, the future
satisfaction of such obligations may be for an amount greater
or less than the amount recorded. The ultimate gain or loss
is dependent upon the price at which the underlying financial
instrument is purchased to settle the Company’s obligation
under the sale commitment.
In the normal course of business, the Company is exposed to
off-balance sheet credit and market risk as a result of executing,
financing and settling various customer security and commod-
ity transactions. Off-balance sheet risk arises from the potential
that customers or counterparties fail to satisfy their obligations
and that the collateral obtained is insufficient. In such instances,
the Company may be required to purchase or sell financial
instruments at unfavorable market prices. The Company seeks
to control these risks by obtaining margin balances and other
collateral in accordance with regulatory and internal guidelines.
At November 30, 2001 and 2000, the Company had commit-
ments to invest up to $555 million and $357 million, respec-
tively, directly and through partnerships in private equity
related investments. These commitments will be funded as
required through the end of the respective investment
periods, principally expiring in 2004.
Subsidiaries of the Company, as general partner, are contin-
gently liable for the obligations of certain public and private
16
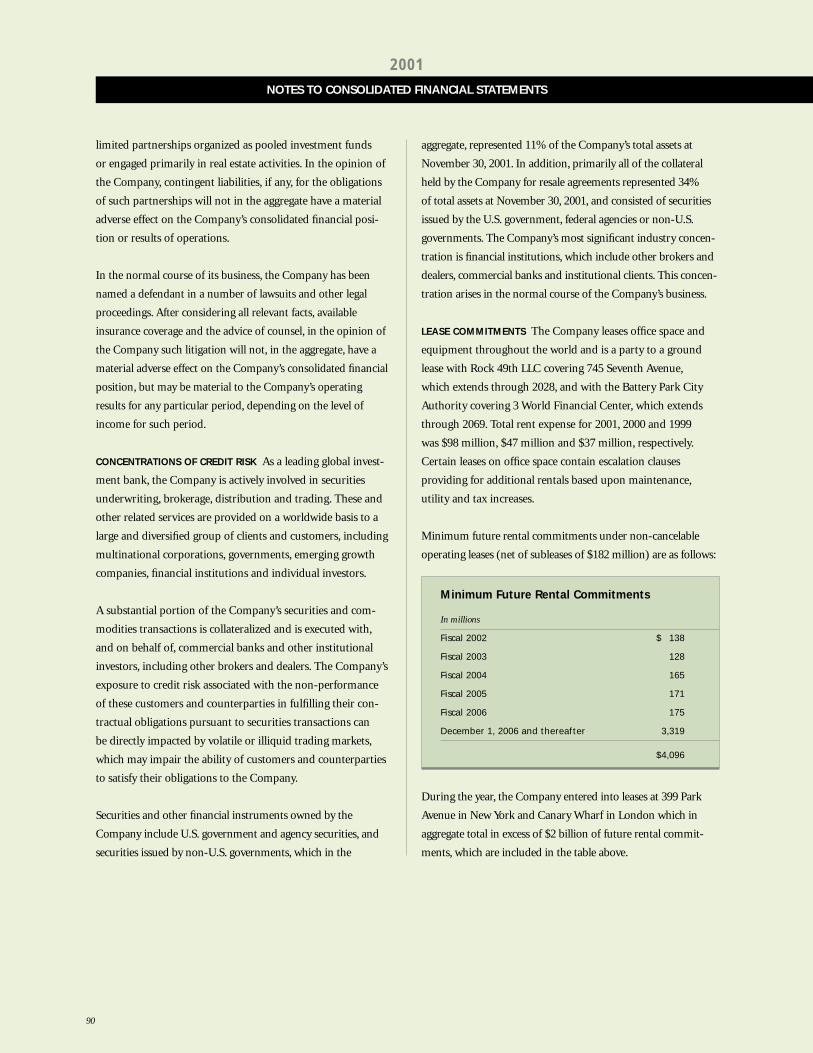
90
NOTES TO CONSOLIDATED FINANCIAL STATEMENTS
2001
Minimum Future Rental Commitments
In millions
Fiscal 2002 $ 138
Fiscal 2003 128
Fiscal 2004 165
Fiscal 2005 171
Fiscal 2006 175
December 1, 2006 and thereafter 3,319
$4,096
limited partnerships organized as pooled investment funds
or engaged primarily in real estate activities. In the opinion of
the Company, contingent liabilities, if any, for the obligations
of such partnerships will not in the aggregate have a material
adverse effect on the Company’s consolidated financial posi-
tion or results of operations.
In the normal course of its business, the Company has been
named a defendant in a number of lawsuits and other legal
proceedings. After considering all relevant facts, available
insurance coverage and the advice of counsel, in the opinion of
the Company such litigation will not, in the aggregate, have a
material adverse effect on the Company’s consolidated financial
position, but may be material to the Company’s operating
results for any particular period, depending on the level of
income for such period.
CONCENTRATIONS OF CREDIT RISK As a leading global invest-
ment bank, the Company is actively involved in securities
underwriting, brokerage, distribution and trading. These and
other related services are provided on a worldwide basis to a
large and diversified group of clients and customers, including
multinational corporations, governments, emerging growth
companies, financial institutions and individual investors.
A substantial portion of the Company’s securities and com-
modities transactions is collateralized and is executed with,
and on behalf of, commercial banks and other institutional
investors, including other brokers and dealers. The Company’s
exposure to credit risk associated with the non-performance
of these customers and counterparties in fulfilling their con-
tractual obligations pursuant to securities transactions can
be directly impacted by volatile or illiquid trading markets,
which may impair the ability of customers and counterparties
to satisfy their obligations to the Company.
Securities and other financial instruments owned by the
Company include U.S. government and agency securities, and
securities issued by non-U.S. governments, which in the
aggregate, represented 11% of the Company’s total assets at
November 30, 2001. In addition, primarily all of the collateral
held by the Company for resale agreements represented 34%
of total assets at November 30, 2001, and consisted of securities
issued by the U.S. government, federal agencies or non-U.S.
governments. The Company’s most significant industry concen-
tration is financial institutions, which include other brokers and
dealers, commercial banks and institutional clients. This concen-
tration arises in the normal course of the Company’s business.
LEASE COMMITMENTS The Company leases office space and
equipment throughout the world and is a party to a ground
lease with Rock 49th LLC covering 745 Seventh Avenue,
which extends through 2028, and with the Battery Park City
Authority covering 3 World Financial Center, which extends
through 2069. Total rent expense for 2001, 2000 and 1999
was $98 million, $47 million and $37 million, respectively.
Certain leases on office space contain escalation clauses
providing for additional rentals based upon maintenance,
utility and tax increases.
Minimum future rental commitments under non-cancelable
operating leases (net of subleases of $182 million) are as follows:
During the year, the Company entered into leases at 399 Park
Avenue in New York and Canary Wharf in London which in
aggregate total in excess of $2 billion of future rental commit-
ments, which are included in the table above.
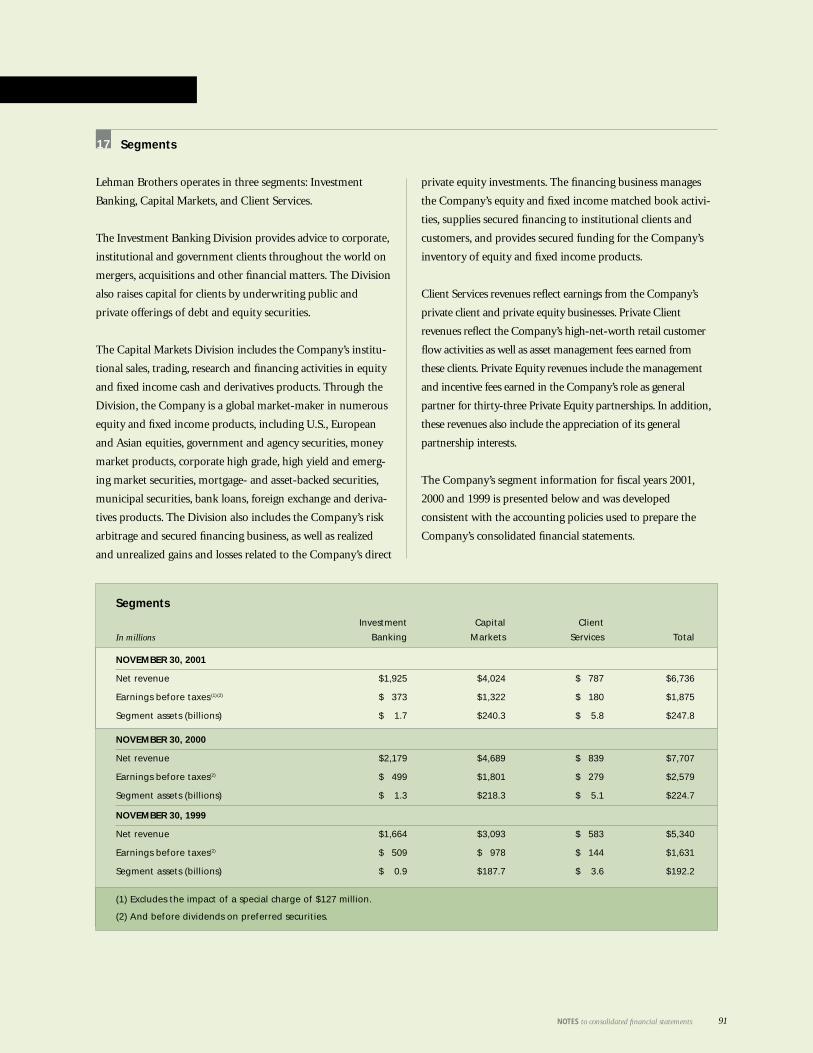
Segments
Investment Capital Client
In millions Banking Markets Services Total
NOVEMBER 30, 2001
Net revenue $1,925 $4,024 $ 787 $6,736
Earnings before taxes (1)(2) $ 373 $1,322 $ 180 $1,875
Segment assets (billions) $ 1.7 $240.3 $ 5.8 $247.8
NOVEMBER 30, 2000
Net revenue $2,179 $4,689 $ 839 $7,707
Earnings before taxes(2) $ 499 $1,801 $ 279 $2,579
Segment assets (billions) $ 1.3 $218.3 $ 5.1 $224.7
NOVEMBER 30, 1999
Net revenue $1,664 $3,093 $ 583 $5,340
Earnings before taxes(2) $ 509 $ 978 $ 144 $1,631
Segment assets (billions) $ 0.9 $187.7 $ 3.6 $192.2
(1) Excludes the impact of a special charge of $127 million.
(2) And before dividends on preferred securities.
91NOTES to consolidated financial statements
Segments
Lehman Brothers operates in three segments: Investment
Banking, Capital Markets, and Client Services.
The Investment Banking Division provides advice to corporate,
institutional and government clients throughout the world on
mergers, acquisitions and other financial matters. The Division
also raises capital for clients by underwriting public and
private offerings of debt and equity securities.
The Capital Markets Division includes the Company’s institu-
tional sales, trading, research and financing activities in equity
and fixed income cash and derivatives products. Through the
Division, the Company is a global market-maker in numerous
equity and fixed income products, including U.S., European
and Asian equities, government and agency securities, money
market products, corporate high grade, high yield and emerg-
ing market securities, mortgage- and asset-backed securities,
municipal securities, bank loans, foreign exchange and deriva-
tives products. The Division also includes the Company’s risk
arbitrage and secured financing business, as well as realized
and unrealized gains and losses related to the Company’s direct
private equity investments. The financing business manages
the Company’s equity and fixed income matched book activi-
ties, supplies secured financing to institutional clients and
customers, and provides secured funding for the Company’s
inventory of equity and fixed income products.
Client Services revenues reflect earnings from the Company’s
private client and private equity businesses. Private Client
revenues reflect the Company’s high-net-worth retail customer
flow activities as well as asset management fees earned from
these clients. Private Equity revenues include the management
and incentive fees earned in the Company’s role as general
partner for thirty-three Private Equity partnerships. In addition,
these revenues also include the appreciation of its general
partnership interests.
The Company’s segment information for fiscal years 2001,
2000 and 1999 is presented below and was developed
consistent with the accounting policies used to prepare the
Company’s consolidated financial statements.
17
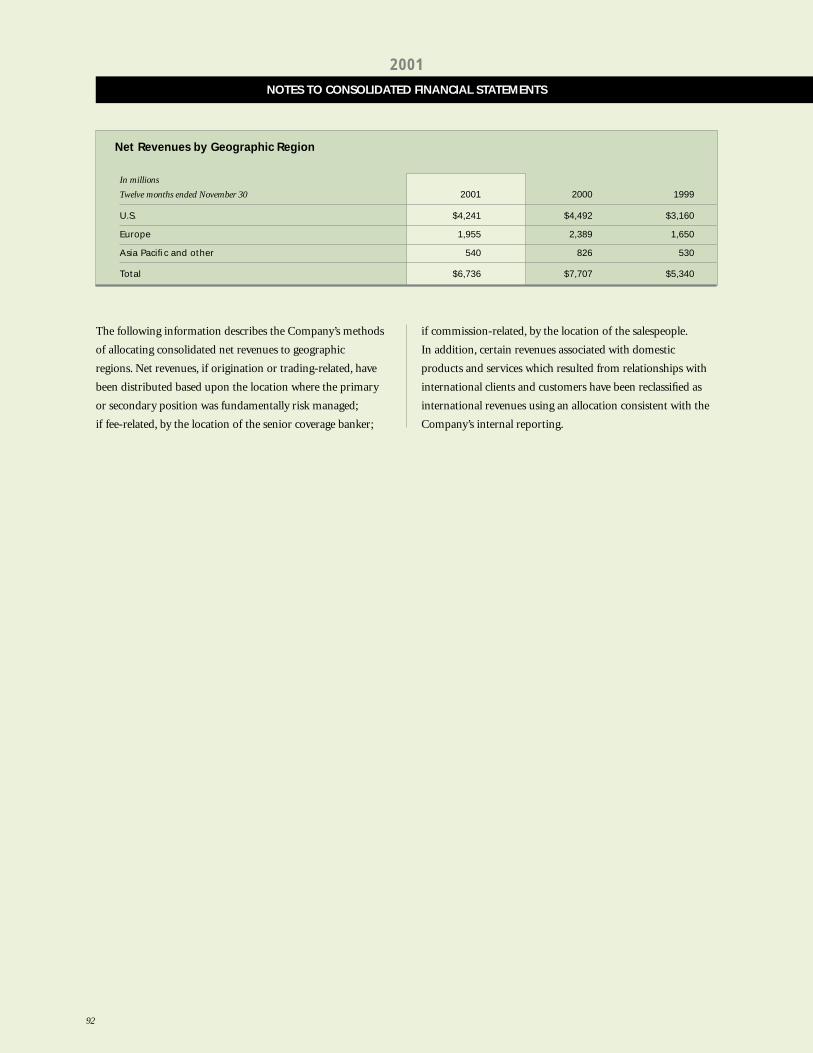
92
NOTES TO CONSOLIDATED FINANCIAL STATEMENTS
2001
The following information describes the Company’s methods
of allocating consolidated net revenues to geographic
regions. Net revenues, if origination or trading-related, have
been distributed based upon the location where the primary
or secondary position was fundamentally risk managed;
if fee-related, by the location of the senior coverage banker;
if commission-related, by the location of the salespeople.
In addition, certain revenues associated with domestic
products and services which resulted from relationships with
international clients and customers have been reclassified as
international revenues using an allocation consistent with the
Company’s internal reporting.
Net Revenues by Geographic Region
In millions
Twelve months ended November 30 2001 2000 1999
U.S. $4,241 $4,492 $3,160
Europe 1,955 2,389 1,650
Asia Pacific and other 540 826 530
Total $6,736 $7,707 $5,340
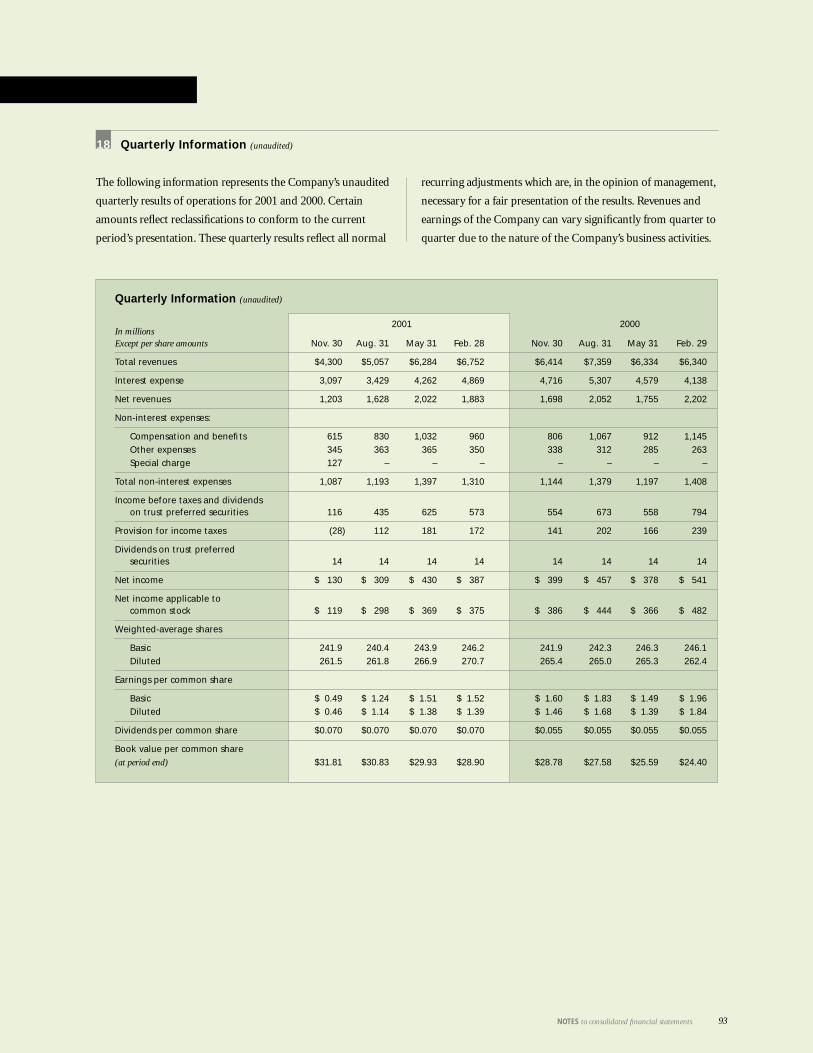
93NOTES to consolidated financial statements
Quarterly Information (unaudited)
The following information represents the Company’s unaudited
quarterly results of operations for 2001 and 2000. Certain
amounts reflect reclassifications to conform to the current
period’s presentation. These quarterly results reflect all normal
recurring adjustments which are, in the opinion of management,
necessary for a fair presentation of the results. Revenues and
earnings of the Company can vary significantly from quarter to
quarter due to the nature of the Company’s business activities.
18
Quarterly Information (unaudited)
In millions2001 2000
Except per share amounts Nov. 30 Aug. 31 May 31 Feb. 28 Nov. 30 Aug. 31 May 31 Feb. 29
Total revenues $4,300 $5,057 $6,284 $6,752 $6,414 $7,359 $6,334 $6,340
Interest expense 3,097 3,429 4,262 4,869 4,716 5,307 4,579 4,138
Net revenues 1,203 1,628 2,022 1,883 1,698 2,052 1,755 2,202
Non-interest expenses:
Compensation and benefits 615 830 1,032 960 806 1,067 912 1,145Other expenses 345 363 365 350 338 312 285 263Special charge 127 – – – – – – –
Total non-interest expenses 1,087 1,193 1,397 1,310 1,144 1,379 1,197 1,408
Income before taxes and dividends on trust preferred securities 116 435 625 573 554 673 558 794
Provision for income taxes (28) 112 181 172 141 202 166 239
Dividends on trust preferred securities 14 14 14 14 14 14 14 14
Net income $ 130 $ 309 $ 430 $ 387 $ 399 $ 457 $ 378 $ 541
Net income applicable to common stock $ 119 $ 298 $ 369 $ 375 $ 386 $ 444 $ 366 $ 482
Weighted-average shares
Basic 241.9 240.4 243.9 246.2 241.9 242.3 246.3 246.1Diluted 261.5 261.8 266.9 270.7 265.4 265.0 265.3 262.4
Earnings per common share
Basic $ 0.49 $ 1.24 $ 1.51 $ 1.52 $ 1.60 $ 1.83 $ 1.49 $ 1.96Diluted $ 0.46 $ 1.14 $ 1.38 $ 1.39 $ 1.46 $ 1.68 $ 1.39 $ 1.84
Dividends per common share $0.070 $0.070 $0.070 $0.070 $0.055 $0.055 $0.055 $0.055
Book value per common share(at period end) $31.81 $30.83 $29.93 $28.90 $28.78 $27.58 $25.59 $24.40
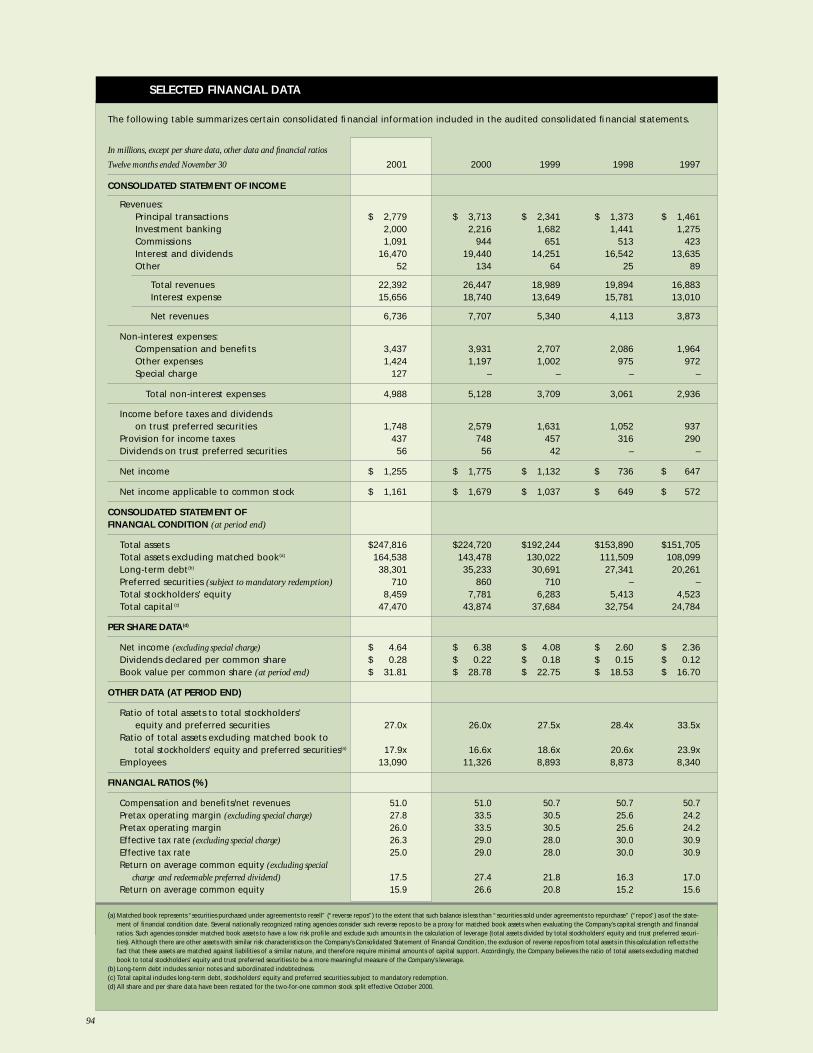
The following table summarizes certain consolidated financial information included in the audited consolidated financial statements.
In millions, except per share data, other data and financial ratios
Twelve months ended November 30 2001 2000 1999 1998 1997
CONSOLIDATED STATEMENT OF INCOME
Revenues:Principal transactions $ 2,779 $ 3,713 $ 2,341 $ 1,373 $ 1,461Investment banking 2,000 2,216 1,682 1,441 1,275Commissions 1,091 944 651 513 423Interest and dividends 16,470 19,440 14,251 16,542 13,635Other 52 134 64 25 89
Total revenues 22,392 26,447 18,989 19,894 16,883Interest expense 15,656 18,740 13,649 15,781 13,010
Net revenues 6,736 7,707 5,340 4,113 3,873
Non-interest expenses:Compensation and benefits 3,437 3,931 2,707 2,086 1,964Other expenses 1,424 1,197 1,002 975 972Special charge 127 – – – –
Total non-interest expenses 4,988 5,128 3,709 3,061 2,936
Income before taxes and dividends on trust preferred securities 1,748 2,579 1,631 1,052 937
Provision for income taxes 437 748 457 316 290Dividends on trust preferred securities 56 56 42 – –
Net income $ 1,255 $ 1,775 $ 1,132 $ 736 $ 647
Net income applicable to common stock $ 1,161 $ 1,679 $ 1,037 $ 649 $ 572
CONSOLIDATED STATEMENT OF FINANCIAL CONDITION (at period end)
Total assets $247,816 $224,720 $192,244 $153,890 $151,705Total assets excluding matched book(a) 164,538 143,478 130,022 111,509 108,099Long-term debt(b) 38,301 35,233 30,691 27,341 20,261Preferred securities (subject to mandatory redemption) 710 860 710 – –Total stockholders’ equity 8,459 7,781 6,283 5,413 4,523Total capital (c) 47,470 43,874 37,684 32,754 24,784
PER SHARE DATA(d)
Net income (excluding special charge) $ 4.64 $ 6.38 $ 4.08 $ 2.60 $ 2.36Dividends declared per common share $ 0.28 $ 0.22 $ 0.18 $ 0.15 $ 0.12Book value per common share (at period end) $ 31.81 $ 28.78 $ 22.75 $ 18.53 $ 16.70
OTHER DATA (AT PERIOD END)
Ratio of total assets to total stockholders’ equity and preferred securities 27.0x 26.0x 27.5x 28.4x 33.5x
Ratio of total assets excluding matched book to total stockholders’ equity and preferred securities(a) 17.9x 16.6x 18.6x 20.6x 23.9x
Employees 13,090 11,326 8,893 8,873 8,340
FINANCIAL RATIOS (%)
Compensation and benefits/net revenues 51.0 51.0 50.7 50.7 50.7Pretax operating margin (excluding special charge) 27.8 33.5 30.5 25.6 24.2Pretax operating margin 26.0 33.5 30.5 25.6 24.2Effective tax rate (excluding special charge) 26.3 29.0 28.0 30.0 30.9Effective tax rate 25.0 29.0 28.0 30.0 30.9Return on average common equity (excluding special
charge and redeemable preferred dividend) 17.5 27.4 21.8 16.3 17.0Return on average common equity 15.9 26.6 20.8 15.2 15.6
(a) Matched book represents “securities purchased under agreements to resell” (“reverse repos”) to the extent that such balance is less than “securities sold under agreements to repurchase” (“repos”) as of the state-ment of financial condition date. Several nationally recognized rating agencies consider such reverse repos to be a proxy for matched book assets when evaluating the Company’s capital strength and financialratios. Such agencies consider matched book assets to have a low risk profile and exclude such amounts in the calculation of leverage (total assets divided by total stockholders’ equity and trust preferred securi-ties). Although there are other assets with similar risk characteristics on the Company’s Consolidated Statement of Financial Condition, the exclusion of reverse repos from total assets in this calculation reflects thefact that these assets are matched against liabilities of a similar nature, and therefore require minimal amounts of capital support. Accordingly, the Company believes the ratio of total assets excluding matchedbook to total stockholders’ equity and trust preferred securities to be a more meaningful measure of the Company’s leverage.
(b) Long-term debt includes senior notes and subordinated indebtedness.(c) Total capital includes long-term debt, stockholders’ equity and preferred securities subject to mandatory redemption.(d) All share and per share data have been restated for the two-for-one common stock split effective October 2000.
94
SELECTED FINANCIAL DATA

RICHARD S. FULD, JR.Chairman andChief Executive Officer
MICHAEL L. AINSLIEFormer President andChief Executive Officer ofSotheby’s Holdings
JOHN F. AKERSRetired Chairman of InternationalBusiness Machines Corporation
ROGER S. BERLINDTheatrical Producer
THOMAS H. CRUIKSHANKRetired Chairman andChief Executive Officer ofHalliburton Company
DR. HENRY KAUFMANPresident of Henry Kaufman &Company, Inc.
JOHN D. MACOMBERPrincipal of JDM Investment Group
DINA MERRILLDirector and Vice Chairman ofRKO Pictures, Inc. and Actress
*Member of Lehman Brothers’ Executive Committee
RICHARD S. FULD, JR.*Chairman andChief Executive Officer
JASJIT S. BHATTALManaging DirectorChief Executive Officer,Lehman Brothers Asia
J. STUART FRANCISManaging DirectorInvestment Banking
DAVE GOLDFARBManaging DirectorChief Financial Officer
JOSEPH M. GREGORY*Managing DirectorChief Administrative Officer
JEREMY M. ISAACS*Managing DirectorChief Executive Officer,Lehman Brothers Europe & Asia
BRADLEY H. JACK*Managing DirectorHead of Investment Banking
THEODORE P. JANULISManaging DirectorCo-Head of Fixed Income
STEPHEN M. LESSING*Managing DirectorSenior ClientRelationship Manager& Head of Private Client Group
ROBERTO LLAMASManaging DirectorChief Human Resources Officer
HERBERT H. McDADE, IIIManaging DirectorCo-Head of Fixed Income
ROGER B. NAGIOFFManaging DirectorCo-Head of Equities
MICHAEL J. ODRICHManaging DirectorHead of Private Equity
JAMES A. ROSENTHALManaging Director Head of Strategy and Recruiting,Co-Head of Global E-Commerce
THOMAS A. RUSSOVice ChairmanChief Legal Officer
ROBERT S. SHAFIRManaging DirectorCo-Head of Equities
JEFFREY VANDERBEEK*Managing DirectorHead of Capital Markets
JARETT F. WAITManaging DirectorCo-Head of Global E-Commerce
PAUL G. ZOIDISManaging DirectorInvestment Banking
AMERICASNew York(Global Headquarters)
745 Seventh AvenueNew York, NY 10019(212) 526-7000
Albany, NYAtlanta, GABoston, MABuenos AiresChicago, ILCleveland, OHColumbus, OHDallas, TXDayton, OHFrederick, MD
Hamilton, BermudaHato Rey, Puerto RicoHouston, TXJersey City, NJLos Angeles, CAMenlo Park, CAMexico CityMiami, FLMontevideoNashville, TN
Palm Beach, FLPhiladelphia, PASan Francisco, CASão PaoloSeattle, WATorontoWashington, DCWilmington, DE
EUROPELondon (Regional Headquarters)
One BroadgateLondon EC2M 7HAEngland44-207-601-0011
AmsterdamFrankfurtMadridMilanMunichParisRome StockholmTel AvivZurich
ASIA PACIFICTokyo(Regional Headquarters)
Ark Mori Building12-32 Akasaka 1 ChomeMinato-KuTokyo 107-6036, Japan813-5571-7000
BangkokBeijingHong KongJakartaMelbourneSeoulSingaporeTaipei
HOWARD L. CLARK, JR.Vice Chairman andMember of Board of DirectorsLehman Brothers Inc.
FREDERICK FRANKVice Chairman andMember of Board of DirectorsLehman Brothers Inc.
ALLAN S. KAPLANVice ChairmanLehman Brothers Inc.
HARVEY M. KRUEGERVice Chairman andMember of Board of DirectorsLehman Brothers Inc.
SHERMAN R. LEWIS, JR.Vice Chairman andMember of Board of DirectorsLehman Brothers Inc.
RUGGERO F. MAGNONIVice Chairman andMember of Board of DirectorsLehman Brothers Int’l (Europe)
THOMAS A. RUSSOVice ChairmanLehman Brothers Inc.
RAYMOND G.H. SEITZVice Chairman andMember of Board of DirectorsLehman Brothers Int’l (Europe)
PHILLIPE VILLINVice Chairman andMember of Board of DirectorsLehman Brothers Int’l (Europe)
Operating Committee
Board of Directors
Vice Chairmen
Lehman Brothers Offices Worldwide
95

OTHER STOCKHOLDER INFORMATION
Three months ended Three months ended
2001 2000
Nov. 30 Aug. 31 May 31 Feb. 28 Nov. 30 Aug. 31 May 31 Feb. 29
High $71.93 $78.26 $82.25 $85.72 $80.00 $72.51 $51.72 $47.50
Low $46.64 $63.90 $55.35 $51.13 $49.50 $40.81 $36.25 $31.06
PRICE RANGE OF COMMON STOCK
COMMON STOCK
Ticker Symbol: LEH
The common stock of Lehman Brothers Holdings Inc. is listed
on the New York Stock Exchange and on the Pacific Exchange.
As of January 31, 2002, there were 23,072 holders of record
of the Company’s common stock. On January 31, 2002, the
last reported sales price of Lehman Brothers’ common stock
was $64.77.
ANNUAL MEETING
Lehman Brothers’ annual meeting of stockholders will be held
on Tuesday, April 9, 2002 at 10:30 a.m. at 399 Park Avenue,
12th Floor Auditorium, New York, New York 10022.
DIVIDENDS
Effective January 2002, Lehman Brothers’ Board of Directors
increased the fiscal 2002 dividend rate to $0.36 per common
share from an annual dividend rate of $0.28 per share in fiscal
2001. Dividends on the Company’s common stock are generally
payable, following declaration by the Board of Directors, on the
last business day of February, May, August and November.
REGISTRAR AND TRANSFER AGENT FOR COMMON STOCK
Questions regarding dividends, transfer requirements, lost
certificates, changes of address, direct deposit of dividends,
the direct purchase and dividend reinvestment plan, or other
inquiries should be directed to:
The Bank of New York
Shareholders Services Department
P.O. Box 11258
Church Street Station
New York, New York 10286-1258
Telephone: (800) 824-5707 (U.S.)
(610) 312-5303 (non-U.S.)
E-mail: [email protected]
Website: http://www.stockbny.com
DIRECT PURCHASE AND DIVIDEND REINVESTMENT PLAN
Lehman Brothers’ Direct Purchase and Dividend Reinvestment
Plan provides both existing stockholders and first-time investors
with an alternative means of purchasing the Company’s stock.
The plan has no minimum stock ownership requirements for
eligibility and enrollment. Plan participants may reinvest all or
a portion of cash dividends and/or make optional cash purchases
up to a maximum of $175,000 per year without incurring
commissions or service charges. Additional information and
enrollment forms can be obtained from the Company’s Transfer
Agent listed above.
ANNUAL REPORT AND FORM 10-K
Lehman Brothers will make available upon request, without
charge, copies of this Annual Report and the Annual Report
on Form 10-K as filed with the Securities and Exchange
Commission. Requests may be directed to:
Jeffrey A. Welikson
Corporate Secretary
Lehman Brothers Holdings Inc.
399 Park Avenue
New York, New York 10022
Telephone: (212) 526-0858
INDEPENDENT AUDITORS
Ernst & Young LLP
787 Seventh Avenue
New York, New York 10019
Telephone: (212) 773-3000
INVESTOR RELATIONS
(212) 526-8381
MEDIA RELATIONS
(212) 526-4379
WEBSITE ADDRESS
http://www.lehman.com
96

Lehman Brothers. The Mission.
Our Firm.We are a rapidly growing global institutional investment bank with a heritage
of over 150 years of success. As a growth company in a growth industry, our
atmosphere is charged with entrepreneurial energy. We are a culture of “we’s”,
not “I’s”, with a commitment to access and teamwork. The hallmark of our
success will be our reputation as a firm that generates and supports excep-
tional levels of opportunity and initiative.
Our Clients.Our One-Firm culture allows us to team up and bring together the best of
Lehman Brothers to meet our clients’ most important needs. We do this by
taking the initiative to reach out to our clients; by listening carefully to under-
stand their needs; by developing innovative and tailored solutions; and by
delivering the full resources and strength of the Firm to provide superb execu-
tion of those solutions. The hallmark of our success will be that our clients
look to us first as their lead investment bank.
Our People.Our success depends on the strength of our people. Our goal is to attract and
develop exceptionally talented people who share our passion for individual
excellence and our commitment to teamwork. We do this by attracting the
best person to fill every role within the Firm; by developing everyone to reach
their full potential; by fostering the mindset that finishing second is unaccept-
able; and by working together in an environment of integrity, respect and
trust as One Firm. The hallmark of our success will be our wide recognition
as a unique firm in which exceptional people build rewarding careers.
Our Shareholders.As employees, we are all shareholders of Lehman Brothers and are deeply
committed to building the value of the Firm. Our goal is to deliver superior
returns to all of our shareholders. We do this by committing to opportunities
that offer exceptional returns; by focusing on productivity, expense discipline
and profitability; by managing our risks and maintaining our financial strength;
and by preserving our reputation. The hallmark of our success will be the
strength of our long-term record of value creation for our shareholders.
In memory of our
friend and colleague,
Ira Zaslow,
whom we lost
September 11, 2001.
Des
ign
ed b
y R
oss
Cu
lber
t &
Lav
ery,
NY
C
Il
lust
rati
on
an
d p
ho
tog
rap
hy
by
Ro
ber
t B
urk
e, W
illia
m C
arte
r, C
ind
y C
har
les,
Cla
ud
e C
har
lier,
Ed D
anie
ls, M
ich
ael F
abia
n, R
ich
ard
Fra
nk,
Mar
ian
Go
ldm
an, D
ebo
rah
Har
dt,
Er
ick
Ing
rah
am, G
reg
Laf
ever
, Sh
ane
Mo
rgan
, Pet
er R
oss
, Kat
hy
Sob
b, S
ho
nn
a V
ales
ka, P
eter
Vid
or,
Will
iam
Wh
iteh
urs
t.
P
rin
tin
g b
y L.
P. T
heb
ault
.

745 Seventh Avenue, New York, NY 10019 www.lehman.com