2001-02 Annual Economic Reportyear ended 30 June 2002 of ... · of the Queensland Government ......
29
of the Queensland Government year ended 30 June 2002 Annual Economic Report 2001-02
Transcript of 2001-02 Annual Economic Reportyear ended 30 June 2002 of ... · of the Queensland Government ......

of the Queensland Governmentyear ended 30 June 2002Annual Economic Report
2001-02

AAnnnnuuaall EEccoonnoommiicc RReeppoorrtt
22000011--0022
TThhee QQuueeeennssllaanndd EEccoonnoommyy
Contents
Foreword ........................................................................................................iii
1 Overview ........................................................................................................ 1
2 External environment...................................................................................... 2
International conditions.............................................................................................................2Australian economy ..................................................................................................................4
3 Components of Queensland’s economic growth ............................................ 6
Overview...................................................................................................................................6Household final consumption....................................................................................................7Dwelling investment..................................................................................................................7Business investment.................................................................................................................8
4 Queensland’s trade sector.............................................................................. 9
Aggregate trade performance...................................................................................................9Exports......................................................................................................................................9Imports ....................................................................................................................................13
5 Labour market .............................................................................................. 15
Employment............................................................................................................................15Unemployment........................................................................................................................16Participation rate.....................................................................................................................17Labour force............................................................................................................................18
6 Wages and prices......................................................................................... 20
Consumer prices.....................................................................................................................20Other price measures .............................................................................................................21Wages.....................................................................................................................................22

© Queensland Government 2002
Excerpts from this publication may be reproduced, with appropriate acknowledgement,as permitted under the Copyright Act
Annual Economic Report 2001-02: The Queensland Economy
ISSN: 1323-0646
This publication is intended only to provide a summary of the subject matter covered and without assuming a duty of care. Although the information, including commentary, herein has
been derived from sources believed to be reliable, Queensland Treasury does not guarantee ormake any representations as to its accuracy or completeness or accept responsibility for any
loss or damage occurring as a result of its use.

Foreword
The resilience of the Queensland economy is once again a standout of the Annual Economic
Report for 2001-02.
Leading indicators in Queensland reinforced the economy’s resilience in the face of a global economic downturn which has impacted on some of our key trading partners.
Queensland recorded solid gross state product growth of 4.4 percent, outperforming the rest of Australia for the sixth consecutive year.
Contributing factors to our economic resilience in 2001-02 include an increase in private sector investment and household consumption.
Queensland also generated more than 32,000 jobs in 2001-02, the largest of any State and one third of the national average.
Exports remained strong although declines in the value of some major commodities were reflected in the economic slowdowns in Japan, the United States and Europe.
This was countered by the ingenuity of our Smart State exporters in sourcing new markets.
The report supports the Government’s key performance accountability frameworks and provides a valuable source of detailed information on Queensland’s economic performanceover the last financial year.
Those internal and external factors which have affected performance are also detailed to assist decision makers within government, business and industry.
This annual publication is one of many resources made available from Queensland Treasuryand its Office of Economic and Statistical Research. Other resources include the monthlyQueensland Economic Update and the quarterly Queensland Economic Review.
These publications and other detailed information on the Queensland economy can be viewed at http://www.oesr.qld.gov.au
The Honourable Terry Mackenroth MP Deputy Premier, Treasurer and Minister for Sport
Annual Economic Report 2001-02 iii

page intentionally blank

1 Overview
The Queensland economy rebounded strongly in 2001-02 to record robust growth following the disruption to the economic cycle associated with the introduction of Commonwealth tax reform and the Goods and Services Tax (GST) in 2000-01. Real gross state product (GSP) rose 4.4% in 2001-02 following growth of 3.2% in 2000-01. Queensland outperformedeconomic growth in the rest of Australia by 0.8 percentage point in 2001-02 (see Figure 1a).
Robust growth in private investment and public final demand more than offset a deterioration in net exports over the year. In particular, dwelling investment increased 28.1% in 2001-02, induced by the positive impacts of a 2 percentage point decline in mortgage interest rates over 2001 and the extension of the Commonwealth Government’s First Home Owner Grant (FHOG) from $7,000 to $14,000 between March and December 2001. Business investmentalso staged a solid recovery in 2001-02, rising 13.2% after falling 15.0% in 2000-01. In contrast, subdued global economic conditions and strong import growth resulted in net exports detracting 1.7 percentage points from overall economic growth in 2001-02, following a 3.9 percentage point contribution in 2000-01.
Global economic conditions continued to pose a threat to the State economy during the year, with world growth generally subdued as the anticipated recovery in the United States failed to eventuate following the events of September 11. With the usual flow-on effects to a numberof Queensland’s major trading partners, growth in exports from the State slowed to 3.7% in 2001-02 from 6.3% in the previous year.
Despite this, Queensland was again the leader with respect to employment growth generating 32,200 jobs during 2001-02, over one-third of the national rise in employment. This increase was the highest of any individual state. Strong employment growth through the year translated into a significant improvement in the trend unemployment rate which fell a fullpercentage point from 8.4% in July 2001 to 7.4% in June 2002.
Figure 1a
Overall Economic Growth(annual % change)
-1
0
1
2
3
4
5
6
7
8
1991-92 1993-94 1995-96 1997-98 1999-2000 2001-02
Queensland Rest of Australia
Source: Office of the Government Statistician, Queensland State Accounts
Annual Economic Report 2001-02 1

2 External environment
International conditions
International economic conditions weakened further in 2001-02, following a slowing in Queensland’s major trading partner economies in 2000-01. According to Consensus
Forecasts, Queensland’s trading partner growth slowed in 2001 to 1.1%, following growth of 4.6% in the previous year. The outlook for Queensland’s trading partner growth is more positive, with forecast growth of 2.0% and 2.8% in 2002 and 2003 respectively (see Figure 2a).
Figure 2a
Economic Growth: Queensland’s Major Trading Partners(annual % change)
-2
0
2
4
6
8
Non-Japan
Asia
Japan North
America
Europe Australia Total
2000 2001 2002 (e) 2003 (f)
Source: Consensus Forecasts, November 2002.
(e) Estimate (f) Forecast
The international economy was heavily dominated by events in the United States (US) over the year. According to the National Bureau of Economic Research, the US economy entered into recession in March 2001, ending one of the longest economic expansions in US history.Following growth of 1.8% in 2000-01, US gross domestic product (GDP) rose by only 0.9% in 2001-02. The US economy weakened under the weight of falling business investment and an associated sharp decline in stock prices, terrorist activity, and persistent strength in the US$ (see Figure 2b). The September 2001 terrorist attacks exacerbated the already weak economy and resulted in a sharp deterioration in both consumer and business confidence.Confidence remained subdued as the uncertainty surrounding further terrorist threats and the US military deployment in Afghanistan. In response to the subdued economy, the US Federal Reserve lowered the federal funds rate 200 basis points over the course of 2001-02, to 1.75%. Meanwhile, despite the widening trade deficit and burgeoning fiscal deficit, the strength of the US$ continued, making US$ exports increasingly expensive, while supporting import demand. Consequently, net exports continued to detract from US economic growth over the year.
2 Annual Economic Report 2001-02

With the US economy struggling, Japan found little impetus upon which to build its much needed economic recovery. Following a decade of weakness, the Japanese economy againfell into recession in 2001-02, with GDP declining 1.9% in 2001-02, after recording growth of 0.9% in the previous year. The Japanese Government implemented a range of reformpackages aimed at stimulating the economy, and while recognising such reform policies have a long-term agenda, there has been little evidence of any immediate success. Japan also continued to suffer from deflation over the year, with consumer prices declining 1.0% in 2001-02, following a 0.6% fall in 2000-01.
Asia (not including Japan), which accounts for approximately one-third of Queensland’s overseas merchandise exports, experienced a moderation in growth alongside other majorinternational economies in 2001-02. According to Consensus Forecasts, economic growth in non-Japan Asia was 2.2% in 2001, following growth of 7.2% in 2000. The individual economic performance of various countries throughout the region varied considerably in 2001-02. In general though, Asia experienced a degree of negative fallout associated with the slow pace of global industrial production during the year. South Korea, one of the region'stop performing countries, continues to increase in importance to Queensland exporters, now accounting for almost 10% of the State’s total merchandise exports. Following growth in GDP of 5.5% in 2000-01, economic growth in South Korea slowed to 4.3% in 2001-02. Of the other regional economies, Indonesia and Malaysia grew modestly, while Hong Kong, Singapore and Taiwan experienced a fall in GDP in 2001-02.
Figure 2b
Equity Market Performance(Share Price Index, Daily)
8,000
8,500
9,000
9,500
10,000
10,500
11,000
Jul-01 Sep-01 Dec-01 Mar-02 Jun-02
2,400
2,600
2,800
3,000
3,200
3,400
3,600
Dow Jones (LHS) All Ordinaries (RHS)
Source: Reuters
Economic growth in the European Union (EU) moderated in 2001-02, to 0.9%, from 2.6% in 2000-01. A combination of adverse factors including higher euro-area inflation, a sluggish US recovery, and heightened international uncertainty undermined business and consumerconfidence in the region during the year. In Germany, the region’s largest economy, GDP was largely unchanged over the year. The United Kingdom outperformed the EU, recording economic growth of 1.5% in 2001-02, while France matched overall growth in the region with a 0.9% increase in national GDP.
Annual Economic Report 2001-02 3

Australian economy
Despite a weak global economy, Australia continued to record strong growth in 2001-02.Australian GDP increased 3.9% in 2001-02, compared with growth of 1.8% in 2000-01 (see Figure 2c). Economic activity was underpinned by a turnaround in dwelling investment (up 19.5%) as low interest rates and the FHOG provided incentives for home ownership.Dwelling investment grew strongly over the first half of 2001-02, however growth eased slightly in the second half of the year.
Household consumption, which makes up around 60% of GDP, grew by 3.5% in 2001-02, compared with 3.0% growth recorded in 2000-01, and in line with the 3.6% average rate of annual growth over the past 10 years. The strength in household consumption largely reflected an improvement in consumer confidence in the second half of the year and also strong growth in purchases of household goods on the back of the increased level of dwelling investment. Business investment also experienced a turnaround over the year, growing by 5.2%. Of the main components of business investment, investment in other buildings and structures rose 10.4% following a fall of 22.6% in 2000-01, while investment in machineryand equipment rose 3.0% over the year.
Figure 2c
Gross Domestic Product and Employment - Australia (annual % change)
-2
0
2
4
6
1991-92 1993-94 1995-96 1997-98 1999-2000 2001-02
Gross Domestic Product Employment
Source: Office of the Government Statistician, Queensland State Accounts
and ABS 6202.0.
The slowdown in activity in Australia’s major trading partner economies led to a fall in exports over the year, despite the competitive value of the A$. Exports fell 1.5% in 2001-02following a rise of 7.2% in 2000-01. On the other hand, imports (which detract from GDP) rose 2.3% over the year, as strong consumption growth and high levels of domesticinvestment led to higher import demand. Overall, net exports detracted 0.9 percentage point from growth in GDP in 2001-02.
The deterioration in net exports was reflected in a widening of Australia’s current account deficit in 2001-02. At June quarter 2002, the current account deficit stood at $7.3 billion, compared with a deficit of $3.6 billion in June quarter 2001.
4 Annual Economic Report 2001-02

Despite the solid economic performance in 2001-02, national labour market conditions deteriorated over the year. Employment growth moderated 1.0 percentage point to 1.1% in 2001-02, the lowest annual growth rate in five years (see Figure 2c). A decline in full-timejobs (down 39,600) was offset by a sharp increase in part-time jobs (up 141,700) over the year. The number of persons unemployed increased 5.0% in 2001-02, following a 1.4% fall in the number of unemployed in 2000-01. The strong growth in unemployed persons more than offset the rise in employment, causing the national year-average unemployment rate to rise 0.2 percentage point to 6.6% in 2001-02.
Inflation remained at the upper-end of the Reserve Bank of Australia’s (RBA) target inflation rate of 2-3% in 2001-02. In year-average terms, consumer prices rose 2.9% in 2001-02, similar to the underlying inflation (net of GST) in 2000-01, but higher than the 10-year average inflation rate of 2.4%. The slightly higher than average inflation result reflected sharp increases in food prices combined with rises in oil prices over the year.
Annual Economic Report 2001-02 5

3 Components of Queensland’s economic growth
Overview
The Queensland economy experienced another year of strong economic growth in 2001-02, with real GSP increasing by 4.4%. Following growth of 3.2% in 2000-01, a strengthening in private investment saw State economic growth return towards the long-term average. Real GSP per capita increased 2.5% in 2001-02, slightly stronger than the long-term average rate of around 2.3%, reflecting the pick up in economic activity and steady population growth over the year.
The strongest components of growth in Queensland in 2001-02 were household consumption, dwelling investment and business investment, with private final demand contributing 5.5 percentage points to overall growth in GSP (see Table 3a). In contrast, Queensland’s net exports detracted 1.7 percentage points from growth in 2001-02, compared with a contribution to growth of 3.9 percentage points in the previous year.
The pattern of economic activity in the rest of Australia in 2001-02 was quite similar,although growth in business investment over the year was not as strong as that in Queensland.The rest of Australia recorded economic growth of 3.6% in 2001-02. Private final demandcontributed 3.6 percentage points to overall economic growth, while, like Queensland, the rest of Australia’s net export position deteriorated in 2001-02, with net exports detracting 0.9 percentage point.
Table 3a
Components of Economic Growth 1
Queensland Rest of Australia
Annual GrowthContribution to
Growth2
Annual GrowthContribution to
Growth2
% % points % % points2000-01 2001-02 2000-01 2001-02 2000-01 2001-02 2000-01 2001-02
Household consumption 4.0 3.6 2.4 2.2 2.4 3.9 1.4 2.3Private investment
3-11.4 19.3 -2.3 3.4 -9.8 7.4 -1.9 1.3
Dwellings -13.5 28.1 -0.9 1.6 -22.0 16.4 -1.4 0.8 Business investment
3-15.0 13.2 -1.6 1.2 -8.0 2.2 -0.8 0.2
Other buildings and structures3
-18.1 -2.6 -0.8 -0.1 -26.5 6.4 -1.0 0.2 Machinery and equipment -12.9 23.1 -0.8 1.2 3.2 0.4 0.2 0.0Private final demand
30.1 7.0 0.1 5.5 -0.6 4.7 -0.5 3.6
Public final demand3
-2.4 2.5 -0.6 0.6 3.4 4.5 0.7 1.0Gross state expenditure -0.7 5.9 -0.8 6.1 0.4 4.6 0.4 4.5Exports of goods and services 6.3 3.7 2.3 1.4 4.8 0.1 1.3 0.0Imports of goods and services -3.9 7.6 -1.7 3.0 -0.9 3.4 -0.2 0.9 Net exports n/a n/a 3.9 -1.7 n/a n/a 1.5 -0.9Gross state/ROA product 3.2 4.4 3.2 4.4 1.8 3.6 1.8 3.6Notes:n/a Not applicable.1. Chain volume measure, 2000-01 reference year.2. Sum of component contributions to growth may not add to totals due to rounding.3. For Queensland, excludes private sector net purchases of second-hand public sector assets.
Source: Office of the Government Statistician, Queensland State Accounts
Economic growth in Queensland has now exceeded growth in the rest of Australia in all butone of the past 11 years.
6 Annual Economic Report 2001-02
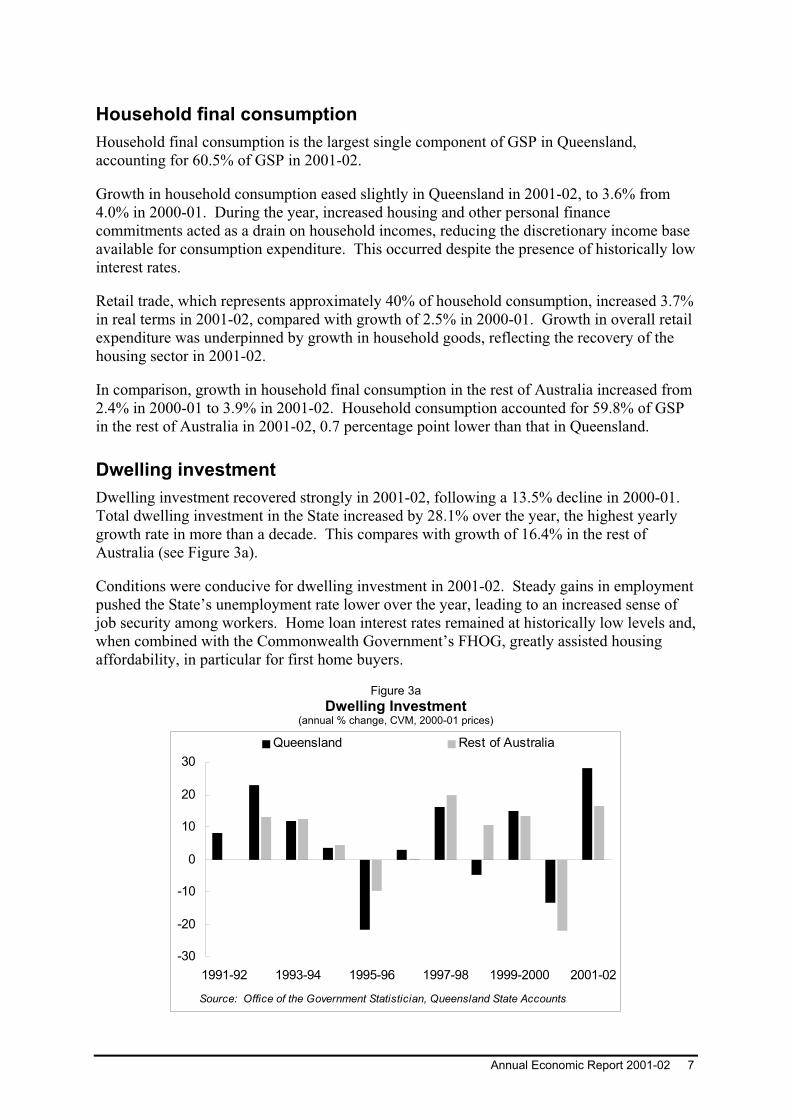
Household final consumption
Household final consumption is the largest single component of GSP in Queensland, accounting for 60.5% of GSP in 2001-02.
Growth in household consumption eased slightly in Queensland in 2001-02, to 3.6% from4.0% in 2000-01. During the year, increased housing and other personal finance commitments acted as a drain on household incomes, reducing the discretionary income base available for consumption expenditure. This occurred despite the presence of historically low interest rates.
Retail trade, which represents approximately 40% of household consumption, increased 3.7% in real terms in 2001-02, compared with growth of 2.5% in 2000-01. Growth in overall retail expenditure was underpinned by growth in household goods, reflecting the recovery of the housing sector in 2001-02.
In comparison, growth in household final consumption in the rest of Australia increased from2.4% in 2000-01 to 3.9% in 2001-02. Household consumption accounted for 59.8% of GSP in the rest of Australia in 2001-02, 0.7 percentage point lower than that in Queensland.
Dwelling investment
Dwelling investment recovered strongly in 2001-02, following a 13.5% decline in 2000-01.Total dwelling investment in the State increased by 28.1% over the year, the highest yearly growth rate in more than a decade. This compares with growth of 16.4% in the rest of Australia (see Figure 3a).
Conditions were conducive for dwelling investment in 2001-02. Steady gains in employmentpushed the State’s unemployment rate lower over the year, leading to an increased sense of job security among workers. Home loan interest rates remained at historically low levels and, when combined with the Commonwealth Government’s FHOG, greatly assisted housing affordability, in particular for first home buyers.
Figure 3a
Dwelling Investment(annual % change, CVM, 2000-01 prices)
-30
-20
-10
0
10
20
30
1991-92 1993-94 1995-96 1997-98 1999-2000 2001-02
Queensland Rest of Australia
Source: Office of the Government Statistician, Queensland State Accounts
Annual Economic Report 2001-02 7

Business investment
Business investment also performed strongly in 2001-02, increasing by 13.2%, following a 15.0% decline in 2000-01. Business investment growth was driven entirely by machineryand equipment investment which rose 23.1% over the year. In contrast, expenditure on other buildings and structures declined for a second consecutive year, falling by 2.6%.
Over the course of the year, however, the composition of business investment in Queenslandshifted. The rate of growth in machinery and equipment investment slowed through the year, rising just 1.2% in the June quarter, down from the 9.8% increase recorded in Septemberquarter 2001. Meanwhile, investment in other buildings and structures rose 5.2% in the June quarter, a strong turnaround from the 4.0% decline recorded in September quarter 2001. The recovery in other buildings and structures investment in the second half of 2001-02 was driven by the commencement of construction on a number of major private sector projects in the State.
Figure 3b
Business Investment ($m, CVM, 2000-01 prices)
0
500
1,000
1,500
2,000
2,500
3,000
3,500
Jun-92 Jun-94 Jun-96 Jun-98 Jun-2000 Jun-02
Other buildings and structures Machinery and equipment
Source: Office of the Government Statistician, Queensland State Accounts
8 Annual Economic Report 2001-02
4 Queensland’s trade sector
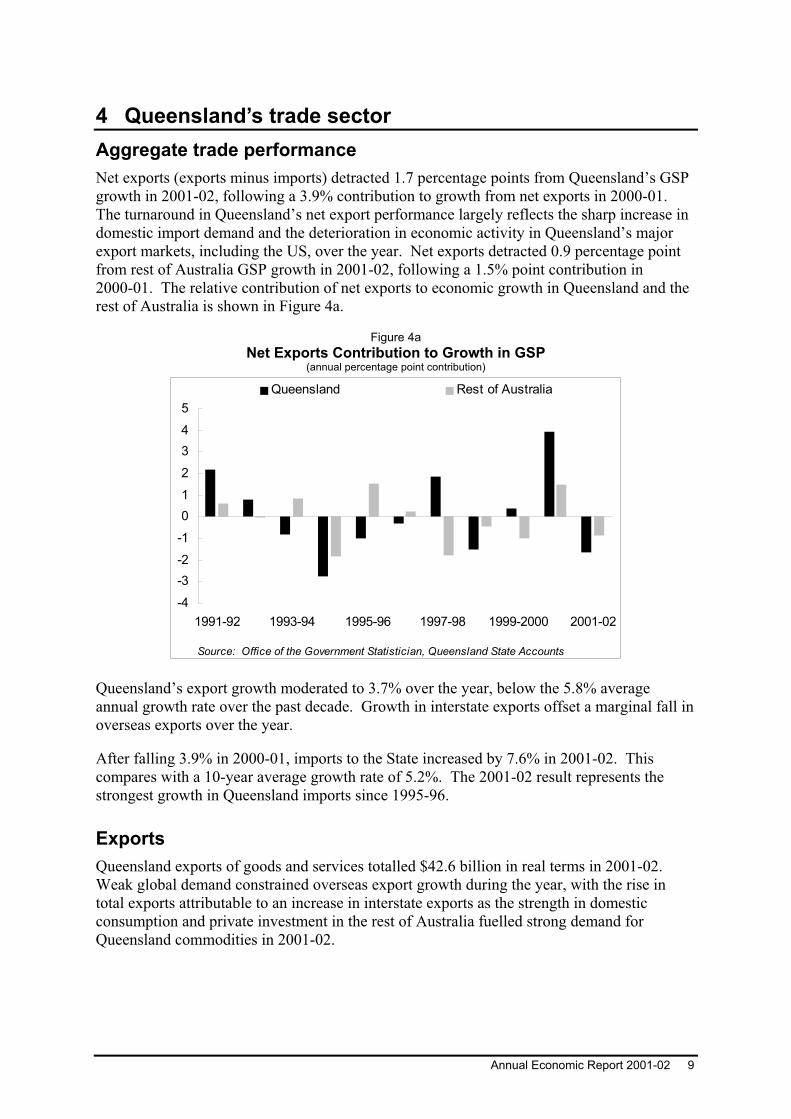
Aggregate trade performance
Net exports (exports minus imports) detracted 1.7 percentage points from Queensland’s GSP growth in 2001-02, following a 3.9% contribution to growth from net exports in 2000-01.The turnaround in Queensland’s net export performance largely reflects the sharp increase in domestic import demand and the deterioration in economic activity in Queensland’s major export markets, including the US, over the year. Net exports detracted 0.9 percentage point from rest of Australia GSP growth in 2001-02, following a 1.5% point contribution in 2000-01. The relative contribution of net exports to economic growth in Queensland and the rest of Australia is shown in Figure 4a.
Figure 4a
Net Exports Contribution to Growth in GSP (annual percentage point contribution)
-4
-3
-2
-1
0
1
2
3
4
5
1991-92 1993-94 1995-96 1997-98 1999-2000 2001-02
Queensland Rest of Australia
Source: Office of the Government Statistician, Queensland State Accounts
Queensland’s export growth moderated to 3.7% over the year, below the 5.8% average annual growth rate over the past decade. Growth in interstate exports offset a marginal fall in overseas exports over the year.
After falling 3.9% in 2000-01, imports to the State increased by 7.6% in 2001-02. This compares with a 10-year average growth rate of 5.2%. The 2001-02 result represents the strongest growth in Queensland imports since 1995-96.
Exports
Queensland exports of goods and services totalled $42.6 billion in real terms in 2001-02.Weak global demand constrained overseas export growth during the year, with the rise in total exports attributable to an increase in interstate exports as the strength in domesticconsumption and private investment in the rest of Australia fuelled strong demand for Queensland commodities in 2001-02.
Annual Economic Report 2001-02 9

The combination of economic weakness in Queensland’s major trading partner economies,including the US and Japan, terrorist threats and the geo-political tension surrounding the Middle East region led to a weakening in Queensland’s overseas trade performance in 2001-02. Queensland’s overseas merchandise exports, which account for more than 80% of the State’s total overseas exports, increased by 1.3% in 2001-02. Queensland outperformedthe rest of Australia with respect to overseas merchandise exports where a 0.2% fall was recorded in 2001-02.
Queensland’s overseas exports of services (less tourism services) fell 8.5% over the year and exports of tourism services fell 5.8% in 2001-02, as the terrorist attacks in the US dampened the global travel market.
Overseas exports of goods and services
After contributing 2.3 percentage points to GSP growth in 2000-01, exports of goods and services provided no stimulus to growth in 2001-02.
In nominal terms, the value of Queensland’s overseas merchandise exports rose by 6.8% or $1.5 billion in 2001-02. Primarily supporting this growth were substantial increases in world coal prices and the low value of the A$ throughout the year.
Detailed commodity information relating to overseas exports of goods and tourism services at current prices is presented in Table 4a. Key features of Queensland’s overseas merchandiseexports in nominal terms during 2001-02 are as follows:
Queensland rural exports fell 3.5% in 2001-02. Meat exports, which accounted for 12.5% of total goods exported, increased 1.3% over the year, well below the 26.0% growth recorded in 2000-01. Meat demand in Japan, Queensland’s largest single meat export market, fell in response to the discovery of Bovine SpongiformEncephalopathy disease in late 2001, which adversely affected aggregate beef consumption in Japan and thus Queensland meat exports. Of Queensland’s other major rural commodities, textile fibres and cereal exports also declined (down 15.2% and 9.5% respectively). In contrast, Queensland exports of vegetables and fruit (up 16.6%) recorded strong growth over the year.
Overseas exports of manufactured goods fell marginally, down 1.3% in nominalterms in 2001-02. The rise in exports of other manufactures (up 13.1%) was offset by a fall in the nominal export value of processed minerals and manufactures (down 9.4%).
In nominal terms, overseas services exports fell 4.6% in 2001-02 in response to the weak global economic environment. After strong growth in 2000-01, overseas services exports (less tourism services) fell 5.4% in 2001-02. Queensland tourismservices exports also suffered from the negative impacts of the US terrorist attack, falling 3.2% over the year.
10 Annual Economic Report 2001-02

Table 4a
Overseas Exports of Queensland Goods and Services (current prices)
2000-01 2001-02 Annual ChangeExport Categories
1
$m $m $m %
Rural Meat 2,758 2,795 37 1.3 Fish and other seafood 403 378 -25 -6.2 Cereals 313 283 -30 -9.5 Vegetables and fruit 243 283 40 16.6 Sugar and honey
2122 133 11 9.0
Textile fibres 926 785 -141 -15.2 Animal oils and fats 99 92 -7 -7.3 Other rural 828 741 -87 -10.5 Total 5,692 5,491 -201 -3.5Crude minerals Metalliferous ores 1,548 1,455 -93 -6.0 Coal, coke and briquettes
37,001 7,985 984 14.1
Petroleum, petroleum products and materials 316 303 -13 -4.1 Other crude minerals 76 72 -3 -4.3 Total 8,940 9,815 875 9.8Processed minerals and metals Non-ferrous metals 2,726 2,452 -274 -10.1 Other processed minerals and metals 231 226 -5 -2.0 Total 2,956 2,678 -278 -9.4Other manufactures Chemicals and related products 359 395 36 10.1 Road Vehicles and Transport equipment 251 308 57 22.7 Miscellaneous manufactures 1,054 1,179 125 11.9 Total 1,663 1,882 219 13.1Total manufactures
44,620 4,560 -60 -1.3
Confidential, special and re-exports 2,224 3,065 841 37.8Total overseas exports of goods 21,476 22,931 1,455 6.8ServicesTourism 2,101 2,034 -67 -3.2
Non-tourism services 3,651 3,453 -198 -5.4Total overseas exports of services 5,752 5,487 -265 -4.6Total overseas exports of good and services 27,800 29,166 1,366 4.9
Notes:1. Based on the Standard International Trade Classification (SITC2).2. Due to ABS reclassification, raw cane sugar exports are now included in the 'Confidential' export
category rather than the ‘Rural' export category.3. Due to ABS reclassification, a portion of coal exports have been included in the 'Confidential' export
category rather than the ‘Crude Minerals' export category.4. Sum of processed minerals and metals and other manufactures.Source: ABS unpublished foreign trade data; and Office of the Government Statistician, Queensland State Accounts
Overall, there was a general movement in the share of Queensland’s exports towards export markets in Europe in 2001-02, as the economic weakness in the US and Japan stifled commodity demand in those regions throughout the year.
North-East Asia continued to be the major export destination for Queensland’s overseas exports in 2001-02, accounting for 46.9% of the State’s overseas merchandise exports (see Table 4b). Japan continued to be the largest single country destination for Queensland merchandise exports, accounting for 26.9% of the State’s overseas merchandise exports in 2001-02. Meanwhile, Queensland exports to South-East Asia increased 2.8% in 2001-02, while the share of exports bound for this region declined over the year.
Annual Economic Report 2001-02 11

Table 4b
Major Overseas Markets for Queensland Exports of Goods(% of total, current prices)
1997-98 1998-99 1999-2000 2000-01 2001-02Export Region
(%) (%) (%) (%) (%)
North-East Asia 47.0 47.2 47.5 47.5 46.9 South Korea 8.7 9.3 9.2 9.0 9.9 China 2.5 3.2 3.0 4.2 4.1 Japan 28.5 28.0 28.7 28.3 26.9Taiwan 5.1 4.7 4.6 4.1 4.2
Hong Kong 2.2 2.2 2.0 1.9 1.9South-East Asia 10.7 9.5 9.9 8.9 8.6 Indonesia 3.6 2.9 2.5 2.4 2.3 Singapore 1.5 0.9 1.3 1.3 1.2 Malaysia 3.0 2.8 3.0 2.5 2.8Thailand 1.0 1.3 1.3 1.4 1.2
Other 1.6 1.7 1.8 1.3 1.1North America 8.9 9.3 9.5 10.7 9.9 Canada 2.6 2.8 1.9 2.2 2.1 United States of America 6.4 6.4 7.6 8.5 7.9European Union 13.5 14.6 14.3 14.9 16.0India 4.3 4.7 4.4 4.6 5.5New Zealand 3.4 3.4 3.5 3.3 3.2Papua New Guinea 2.5 2.5 2.2 1.7 1.6Brazil 1.4 1.5 1.7 1.5 1.4Other 8.3 7.4 7.1 6.9 6.9Total 100.0 100.0 100.0 100.0 100.0
Source: ABS unpublished foreign trade data
Queensland’s share of overseas merchandise exports bound for Europe increased in 2001-02.The export share to the European Union (including the UK) rose from 13.5% in 1997-98, to 16.0% in 2001-02. Of the major countries in this region, exports to France, Germany and Italy increased, while the share of Queensland’s exports bound for the UK remained steady.
The nominal value of Queensland’s exports to North America totalled $2.3 billion in 2001-02, falling slightly compared with a year ago. The share of Queensland exports to the US and Canada both moderated slightly, with 7.9% and 2.1% of total exports bound for each market respectively.
Interstate exports of goods
Queensland’s interstate merchandise exports grew strongly in 2001-02 as economicconditions remained firm in the rest of Australia, supported by strong levels of private consumption as well as dwelling and business investment. In real terms, interstate exports of goods rose 14.7% to $10.1 billion in 2001-02, the highest value of interstate exports on record and well above the average growth of the past decade. Significant increases in all major categories of interstate exports including chemical and related materials (up 24.1%), machinery and transport equipment (up 26.2%), manufactured goods (up 21.3%) and miscellaneous manufactures (up 17.5%) drove the sharp rise in Queensland’s interstate exports throughout the year.
12 Annual Economic Report 2001-02

Tourism exports, overseas and interstate1
Exports of Queensland’s interstate tourism services recorded growth of 8.9% in 2001-02, the highest growth since 1994-95, and above the 4.7% average annual growth over the past decade. The strong growth in interstate tourism exports compares with the 3.5% fall experienced in 2000-01, and contrasts with the 5.8% fall in overseas tourism services in 2001-02. The low value of the A$ throughout 2001-02 assisted domestic tourism by makingholidaying in Queensland relatively cheap compared with overseas travel.
In line with the subdued global economy and the negative impact of terrorism on tourism in 2001-02, the total number of short-term visitors to Australia fell by 5.1% over the year according to the Australian Bureau of Statistics Overseas Arrivals and Departures survey.Visitor numbers from Japan to Australia, the nation’s largest tourist market, fell 9.2% over the year, due to the economic weakness experienced in Japan, however, this was partially offset by increased visitors from China (up 19.8%) and South Korea (up 9.8%). Short-termvisitors from the UK rose in 2001-02 (up 2.8%), while visitors from the US fell (down 14.8%).
Imports
The strength in private investment, including both dwelling and business investment, in Queensland in 2001-02 led to a rise in import demand, despite the low A$ generally increasing the cost of imported goods. Total imports rose 7.6% in 2001-02, above the 5.2% average annual growth rate of the past decade. Imports represent a ‘leakage’ from the State economy and, hence, growth in imports detracts from overall economic growth in the State.This totalled 3.0 percentage points in 2001-02, following a positive contribution of 1.7% in 2000-01.
Overseas imports of goods and non-tourism services
Overseas imports of goods and non-tourism services rose 2.5% in real terms in 2001-02,driven by strong increases in the import of food, beverage and tobacco (up 10.6%), roadvehicles and transport equipment (up 9.2%) and other machinery and transport equipment (up 7.6%). In contrast, overseas imports of mineral fuels and other goods fell over the period (down 1.2% and 0.4% respectively).
Interstate imports of goods
Interstate imports of goods rose 13.4% in real terms in 2001-02. Imports of other goods (up 25.2%), machinery and transport equipment (up 16.2%), food and related products (up 15.5%) and iron and steel (up 14.2%) rose strongly over the year. In contrast, declines were recorded in interstate imports of mineral fuels (down 17.0%) and miscellaneous manufactures(down 4.4%) in 2001-02.
1 Exports of tourism services refer to consumption expenditure by visitors to Queensland, whether frominterstate or overseas, for the purpose of holiday or visiting friends and relatives. See Office of the Government
Statistician, Queensland State Accounts for definitions.
Annual Economic Report 2001-02 13

Tourism imports, overseas and interstate2
Overseas and interstate imports of tourism services fell 7.3% in real terms in 2001-02.Overseas imports of tourism services declined in real terms by 5.4%, reflecting the substantial increase in the cost of overseas travel resulting from the low A$. Imports of interstate tourism services also declined over the year, down 8.3%.
2 Imports of tourism services refer to consumption expenditure by Queensland residents outside of the State,whether interstate or overseas, for the purpose of holiday or visiting friends and relatives. See Office of the
Government Statistician, Queensland State Accounts for descriptions of concepts.
14 Annual Economic Report 2001-02

5 Labour market
Employment
Employment in Queensland continued to grow in 2001-02 rising by 1.9% in 2001-02, morethan double the rate of growth recorded in the rest of Australia (0.9%). Jobs growth strengthened over the second half of 2001-02, following an improvement in consumer and business confidence and strengthening growth in private consumption spending in the March and June quarters of 2002.
Queensland generated an increase in employment of 32,200 persons in 2001-02, accountingfor around one-third of the national increase in employment (102,100 persons) and representing the largest job gain of any State. Part-time employment underpinned jobs growth in the State in 2001-02, following three consecutive years where full-timeemployment led jobs growth. Part-time employment in Queensland rose by 28,200 persons over the year, while full-time employment rose by 4,100 persons. The shift toward part-timeemployment was more marked in the rest of Australia, with a rise in part-time employmentoffsetting a fall in full-time employment in 2001-02.
Figure 5a
Employment Growth(annual % change)
-3
-2
-1
0
1
2
3
4
5
6
1991-92 1993-94 1995-96 1997-98 1999-2000 2001-02
Queensland Rest of Australia
Source: ABS 6202.0
Several factors may have underpinned the shift toward part-time employment in Queenslandduring 2001-02. The year was characterised by heightened uncertainty over the domestic and global economy, a result of several domestic corporate collapses and continued geo-political tension, possibly causing employers to shift more toward part-time employmentarrangements. Coinciding with this was a slight fall in average weekly hours worked over the year (causing some full-time employees to be re-categorised as part-time workers in officialstatistics). Also, job gains were concentrated in the services sector during 2001-02, which has a greater incidence of part-time employment relative to other sectors of the economy.
Annual Economic Report 2001-02 15

Consumer spending supported job gains in the service sector in 2001-02, continuing the shift in the State’s industrial structure toward a more service-based economy. The service sector accounted for more than two thirds of overall jobs growth during the year, with job gains concentrated in government administration, health and eduction; wholesale and retail trade; accommodation cafes and restaurants; and cultural, recreational and personal services. A strengthening in retail turnover growth underpinned job gains in the trade sector in 2001-02.Accommodation, cafes and restaurants also recorded job gains over the year, with domesticspending partly offsetting the adverse impact on tourism of a subdued global economy and domestic corporate collapses such as Ansett during the year. In comparison, property and business services recorded the largest fall in employment of any industry in 2001-02, with job losses concentrated in computing, marketing and business management services.
The primary and secondary sectors accounted for the remaining third of jobs growth in 2001-02. A rise in agricultural employment saw the agriculture, forestry and fishing industry record jobs growth during the financial year. However, the timing of these job gains precedes the onset of drought conditions in rural Queensland in the second half of 2002. In comparison, jobs growth was more subdued in manufacturing and mining in 2001-02.
Table 5a
Employment by Industry, Queensland2001-02 Change (‘000 persons) Annual Growth (%)
Industry/Sector (‘000persons)
(% of total)
2001-0210 year
average2001-02
10 yearaverage
Primary and Secondary 306.8 17.8 12.8 4.5 4.4 1.6 Agriculture, forestry and fishing 105.0 6.1 9.8 1.9 10.3 2.1 Mining 19.6 1.1 2.3 -0.3 13.0 -1.4 Manufacturing 182.2 10.6 0.8 2.9 0.4 1.7Services 1,416.7 82.2 26.3 36.5 1.9 3.0 Electricity, gas and water 13.8 0.8 3.7 -0.1 36.0 -0.6
Construction 139.2 8.1 1.8 3.7 1.3 3.2 Wholesale and retail trade 359.6 20.9 7.8 6.4 2.2 2.0 Accommodation, cafes and restaurants 104.4 6.1 5.1 3.9 5.1 4.8 Transport and storage 82.0 4.8 0.2 1.4 0.3 1.9 Communication services 24.7 1.4 -1.2 0.2 -4.7 0.8 Property and business services
1218.8 12.7 -9.3 7.2 -4.1 4.1
Govt admin, education and health2
360.4 20.9 13.7 10.0 4.0 3.3 Cultural, recreational and personal
3113.8 6.6 4.7 3.7 4.3 4.0
All industries4,5
1,723.5 100.0 39.1 41.0 2.3 2.8Notes:
1. Includes finance and insurance.2. Includes defence and community services.3. Includes other services4. Industry estimates of employment are compiled on the mid-month of each quarter. Therefore, the level and growth of total industry
employment does not match aggregate estimates of employed persons derived from monthly data. 5. The sum of individual industries may not add to total due to rounding.
Source: ABS 6203.0
Unemployment
The unemployment rate in Queensland fell 0.1 percentage point to 7.9% in 2001-02. The fall in the unemployment rate in 2001-02 was the result of employment growth (1.9%) more than offsetting labour force growth (1.8%) during the year (see Figure 5b). In comparison, the unemployment rate in the rest of Australia rose 0.3 percentage point to 6.3% in 2001-02, as a result of labour force growth (1.3%) exceeding subdued employment growth (0.9%) over the year.
16 Annual Economic Report 2001-02

Figure 5b
Unemployment Rate
7
8
9
10
11
1991-92 1993-94 1995-96 1997-98 1999-2000 2001-02
(%)
-2
-1
0
1
2(%
poin
ts)
Labour force growth less Employment growth (RHS)
Unemployment rate (LHS)
Source: ABS 6202.0
In trend terms, Queensland recorded a decline in the rate of unemployment over the course of the year. Jobs growth in the State exceeded labour force growth in each month of 2001-02, allowing the unemployment rate to fall from 8.4% in July 2001 to 7.4% in June 2002. In comparison, more subdued employment growth in the rest of Australia resulted in the unemployment rate falling at a moderate pace over the year, from 6.5% to 6.0%.
Participation rate
Queensland’s participation rate fell marginally from a historical peak of 65.1% in 2000-01 to 65.0% in 2001-02. However, the State’s participation rate remained well above that in the rest of Australia, which was unchanged at 63.4%. Queensland’s participation rate first surpassed that in the rest of Australia in 1988-89, with the difference between the two rates widening to 1.6 percentage points by 2001-02 (see Figure 5c).
The rise in the overall participation rate in Queensland over the past decade and a half has largely been the result of a rise in the female participation rate more than offsetting a fall in the male participation rate. This trend has been underpinned by the shift in economic activity from the primary and secondary sectors toward service industries, and a rise in female higher education participation over this period.
A faster rise in the female participation rate in Queensland relative to the rest of Australia hasalso been the primary source of the widening differential between the participation rates in these two regions over time. Queensland’s female participation rate stood at 49.8% in 1988-89, slightly below that in the rest of Australia of 50.5%. However, Queensland’s female participation rate rose 7.2 percentage points to 57.0% by 2001-02, while a moremodest rise to 54.9% was experienced in the rest of Australia.
Annual Economic Report 2001-02 17

Figure 5c
Participation Rate (per cent, year-average)
58
60
62
64
66
68
1981-82 1985-86 1989-90 1993-94 1997-98 2001-02
Queensland Rest of Australia
Source: ABS 6202.0
Several other factors explain Queensland’s higher aggregate participation rate relative to thatin the rest of Australia. These include relatively higher labour force participation by Queensland youth and stronger jobs growth in Queensland, with the latter maintaining the share of people in the labour force and encouraging a greater share of those outside the labour force to search for employment.
Labour force
Labour force growth in Queensland eased 0.3 percentage point to 1.8% in 2001-02, below long run average growth over the past decade (2.5%). Labour force growth in Queensland continued to exceed that in the rest of Australia, where the labour force increased by 1.3%(see Figure 5d).
Figure 5d
Labour Force (annual % change)
0
1
2
3
4
5
1991-92 1993-94 1995-96 1997-98 1999-2000 2001-02
Queensland Rest of Australia
Source: ABS 6202.0
18 Annual Economic Report 2001-02

Queensland has been the nation’s fastest growing State in terms of labour force growth over the past decade. Labour force growth in Queensland exceeded that in the rest of Australia for the fourteenth year in a row in 2001-02, with the annual difference averaging around 1.4 percentage points over this period. As a result, Queensland accounted for around one quarter of the national labour force growth in 2001-02 and has accounted for over one third of the national labour force increase over the past decade.
Two main factors have underpinned historically faster labour force growth in Queensland relative to the rest of Australia. Firstly, Queensland has enjoyed faster rates of population growth, largely due to stronger inflows of interstate migrants relative to other States. Factors contributing to strong interstate migration into Queensland include the State’s competitive tax environment, a generally lower cost of living and generally greater employment growth.Also, past slowdowns in national economic activity have tended to result in higher levels of interstate migration into Queensland, as residents from southern states migrate north in search of new job opportunities. Second, Queensland has recorded a faster rise in its labour force participation rate relative to the rest of Australia over the past decade.
Annual Economic Report 2001-02 19

6 Wages and prices
Consumer prices
Headline consumer prices in Queensland, as measured by the Brisbane Consumer Price Index (CPI), rose 2.9% in 2001-02. While the inflation outcome for 2001-02 represents a significant easing from a headline rate of 5.9% recorded in 2000-01, it represents only a modest improvement compared with a GST-adjusted ongoing rate of inflation of around 3%.Nationally, headline consumer price inflation also increased by 2.9% in 2001-02.
Several temporary factors caused inflation in Queensland to remain at the top end of the RBA’s 2-3% inflation target band during 2001-02. Food prices rose strongly in 2001-02, up 6.6%, due largely to higher vegetable prices associated with drought conditions across most of rural Queensland. Prices in the education, health and alcohol and tobacco sectors also rose strongly over the year by 4.9%, 4.5% and 4.1% respectively. Recreation services also contributed to inflation in 2001-02, rising 2.4%. This was due to the collapse of Ansett Airlines which led to higher average airfares and the introduction of additional taxes and levies by the Commonwealth Government on the airline industry. Higher insurancepremiums caused by corporate failure in the insurance industry also put upward pressure on the CPI.
Figure 6a
Consumer Price Index(annual % change)
-1
0
1
2
3
4
5
6
1991-92 1993-94 1995-96 1997-98 1999-2000 2001-02
Brisbane Australia (a)
Source: ABS 6401.0
(a) Weighted average of capital cities
Impact of GST
20 Annual Economic Report 2001-02

Other price measures
Other price measures showed evidence of inflationary pressure in Queensland in 2001-02.The ABS Established House Price Index for Queensland increased 13.7% in 2001-02, the highest growth rate recorded in Queensland since 1990-91 (nationally up 16.5%). The high demand for housing in Queensland has been influenced by a number of factors, including the Commonwealth Government’s FHOG and historically low home loan interest rates. Weakreturns in other asset classes are also likely to have influenced the portfolio decisions of investors, with property relatively more attractive than equity investments.
The price of building materials in Queensland increased in 2001-02, reflecting the strong rebound in dwelling construction activity during the year. The ABS Price Index of House
Building Materials increased 1.2% (nationally, up 1.3%). The price index for materials used in buildings other than houses for Brisbane also increased in 2001-02 by 1.5% (nationally, up 1.8%).
Price increases were also recorded in a number of categories of building products in Queensland in 2001-02, including structural timber (up 3.6%), aluminium windows (up 3.0%), builder’s hardware (up 2.7%) and paint and other coatings (up 2.5%). Small price falls were experienced in several categories including steel decking and cladding (down2.2%), fabricated steel products (down 1.0%) and clay bricks (down 0.3%).
Figure 6b
Established House Price Index (annual % change)
-2
0
2
4
6
8
10
12
14
16
18
1991-92 1993-94 1995-96 1997-98 1999-2000 2001-02
Brisbane Australia (a)
Source: ABS 6416.0
(a) Weighted average of capital cities
Annual Economic Report 2001-02 21
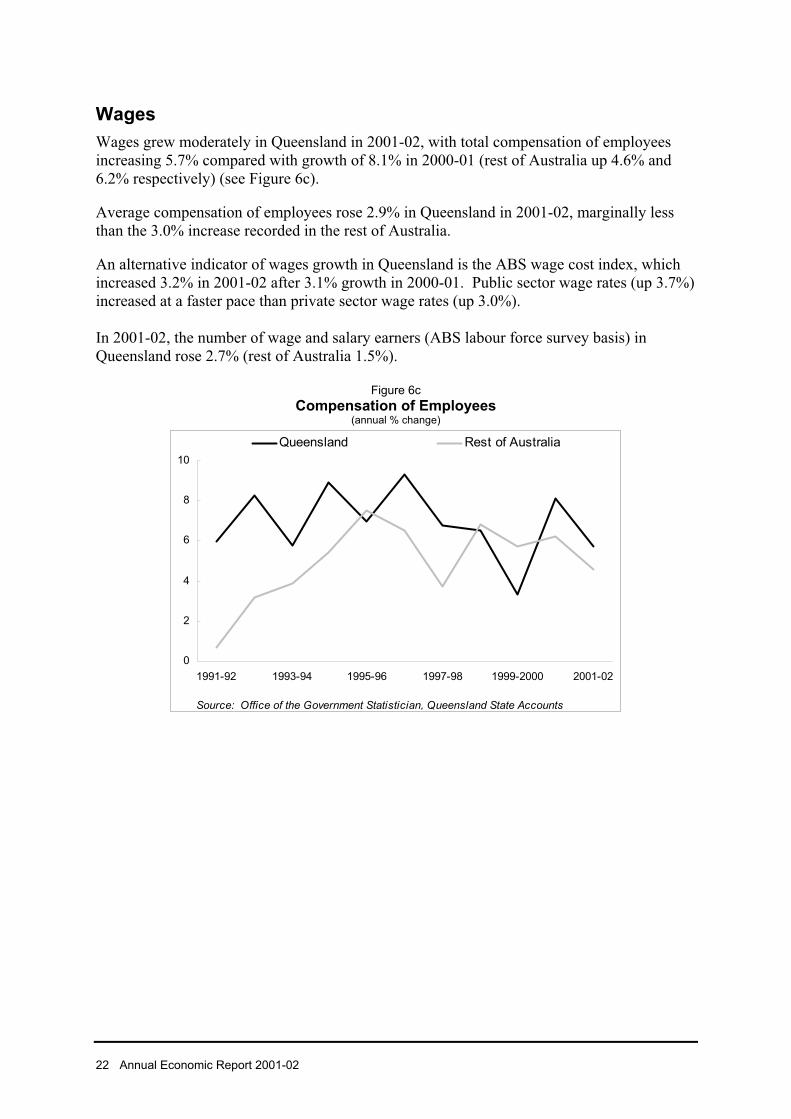
Wages
Wages grew moderately in Queensland in 2001-02, with total compensation of employeesincreasing 5.7% compared with growth of 8.1% in 2000-01 (rest of Australia up 4.6% and 6.2% respectively) (see Figure 6c).
Average compensation of employees rose 2.9% in Queensland in 2001-02, marginally less than the 3.0% increase recorded in the rest of Australia.
An alternative indicator of wages growth in Queensland is the ABS wage cost index, which increased 3.2% in 2001-02 after 3.1% growth in 2000-01. Public sector wage rates (up 3.7%) increased at a faster pace than private sector wage rates (up 3.0%).
In 2001-02, the number of wage and salary earners (ABS labour force survey basis) in Queensland rose 2.7% (rest of Australia 1.5%).
Figure 6c
Compensation of Employees(annual % change)
0
2
4
6
8
10
1991-92 1993-94 1995-96 1997-98 1999-2000 2001-02
Queensland Rest of Australia
Source: Office of the Government Statistician, Queensland State Accounts
22 Annual Economic Report 2001-02

page intentionally blank