Automic Service Orchestration - Self Service Desk Automation
Annual Report
2018
For
per
sona
l use
onl
y

DirectorsWarwick Grigor (Chairman)Craig McGuckin (Managing Director)Peter R. Youd (Executive Director)
Company SecretaryPeter R. YoudNerida Schmidt
Principal Registered Office in Australia1 Sepia CloseHendersob WA 6166
P: +61 1300 660 448E: [email protected]
Stock Exchange ListingsThe Company is listed on the Australian Securities Exchange Limited under the trading code FGR and FGROC.
The Company is listed on the Frankfurt Stock Exchange under the trading code FSE:M11.
Share RegistryAutomic Registry Services Level 2,267 St Georges Terrace,Perth WA 6000
All securityholder correspondence to:PO Box 2226, Strawberry Hills, NSW 2012
Contact:P: 1300 288 664 (within Australia)P: +61 (0)8 9324 2099 (outside Australia)E: [email protected]
AuditorBDO Audit (WA) Pty Ltd38 Station StreetSubiaco WA 6008
Solicitors AustraliaSteinepreis PaganinLawyers and ConsultantsLevel 4The Read Buildings16 Milligan StreetPerth WA 6000
Solicitors United KingdomWatson Farley & Williams LLP 15 Appold StreetLondon EC2A 2HB
Bankers AustraliaWestpac Banking CorporationLevel 6109 St Georges TerracePerth WA 6000
Corporate Directory
For
per
sona
l use
onl
y
3FIRST GRAPHENE
ANNUAL REPORT 2018
Table of Contents
Chairman’s Report 4
Review of Operations 6
Overview of Operations 6
Graphene Developments 7
Environment 9
Safety 9
Directors’ Report 11
Remuneration report (audited) 14
Auditor’s Independence Declaration 20
Consolidated Statement of Profit or Loss and Other Comprehensive Income 21
Consolidated Statement of Financial Position 23
Consolidated Statement of Changes in Equity 24
Consolidated Statement of Cash Flows 25
1. Basis of Preparation 26
2. Segment reporting 30
3. Operating profit and finance income and expense 31
4. Income tax 33
5. Earnings per share 33
6. Cash and cash equivalents 34
7. Inventories 35
8. Trade and other receivables 35
9. Exploration and evaluation assets 36
10. Property, plant and equipment 37
11. Intangible assets 39
12. Trade and other payables 40
13. Borrowings 40
14. Financial Risk Management 41
15. Issued capital 47
16. Share based payments 48
17. Reserves and accumulated losses 51
18. Statement of cash flow reconciliation 52
19. Commitments 53
20. Contingent liabilities 54
21. Results of the parent company 54
22. Events since the end of the financial year 55
23. Related party transactions 55
24. Auditors’ remuneration 56
Directors’ Declaration 57
Independent Auditor’s Report 58
Additional Securities Exchange Information 62
For
per
sona
l use
onl
y

4FIRST GRAPHENE ANNUAL REPORT 2018
Chairman’s Report
Dear Fellow ShareholderThe day prior to last year’s Annual General Meeting the Commercial Graphene Facility was opened at Henderson by Mr Josh Wilson MP, Federal Member for Fremantle. The opening event was attended by approximately forty guests, including professors from the three university partners with which FGR collaborates.
Late last year we were joined by Dr Andy Goodwin as an Advanced Materials Advisor, based in the UK. Andy makes quarterly visits to Australia and has worked closely with Craig on the development of our product range, which is being launched in September 2018. I am also pleased to confirm that Andy has now decided to join the Company full time as Chief Technology Officer.
Of particular importance is the initiative announced in June 2018 for First Graphene to become a Tier 1 participant at the University of Manchester’s newly created Graphene Engineering Innovation Centre (GEIC). This represents a major step forward for FGR, and it is a strong affirmation of the Company’s leadership in the graphene sector. Over the last three years the Company has made excellent progress in the development and refinement of its very low-cost graphene production process such that it is now one of the most economical, commercial scale graphene production methodology available. This new initiate transforms the Company from an Australian-based supplier to an international competitor in the global graphene industry. It amounts to the coming of age for FGR as a world leader in the graphene business.
GEIC is all about taking graphene into industryDuring the year several agreements were signed with potential customers for the development of graphene enhanced products. Several of these are commercially sensitive and the details of the partners could not be announced but suffice to say they are leaders in their industry, which is why they have approached a leader in the graphene industry - First Graphene Limited.
I have stated previously that in building First Graphene, and the graphene industry, one needs to have a long-term view. As such we have worked to restructure our share register with parties who have a longer term view and are not just aiming to take a profit and quickly sell the shares. We have been able to attract two large family offices who both took placements at market prices and who both approached the Company to provide the funding.
As announced this week, the Company will be looking to list on the AIM market in London. This is a logical initiative given that our UK operations will be expanding with our involvement in Manchester and British manufacturing industries. The UK investment community has had more exposure to graphene companies than has Australia’s. We are confident that the greater awareness in that market will be beneficial to the Company as it will better understand the quality that First Graphene brings to the sector.
As I write this Chairman’s Report it is satisfying to note that the Company’s share price is approximately double what it was when I wrote last year’s report. As shareholders we encourage you to stay with us on this exciting journey, looking forward to a long term, mutually beneficial relationship.
In closing I would like thank my fellow directors, Craig McGuckin and Peter Youd for their considerable efforts during the year. On the operational front, from a standing start a little over three years ago, Craig has worked on the development of production methods which now see the Company positioned as a world leading graphene company.
As a board we look forward to an even more exciting and fruitful 2018/19 financial year.
Warwick GrigorNon-Executive Chairman21 September 2018
I would like to welcome our shareholders to the annual report as members of a world’s leading graphene company. The 2018 financial year has been one of great progress, laying the foundation for what promises to be a very exciting year in 2018/19.
For
per
sona
l use
onl
y

5FIRST GRAPHENE
ANNUAL REPORT 2018
It really is no exaggeration to say that graphene will likely be one of the defining substances and technologies of the 21st century. It is wonderful that the enormous potential of graphene will be explored and enabled through a production facility here in Henderson; in the Fremantle electorate; in the state of Western Australia. It’s exactly the kind of smart, innovative, cutting-edge business that we should be in; that we need to be in.” Mr Josh Wilson MP
‘‘
FGR’s Commercial Graphene Facility at Henderson
For
per
sona
l use
onl
y

6FIRST GRAPHENE ANNUAL REPORT 2018
Moisture barrier in thermoset compositesBattery electrode materials
Rubber and composite strengtheningConcrete strengthening
Conductive inks and sensorsFire retardant coatings
Review of Operations
Overview of OperationsMission Statement: First Graphene has established a commercial graphene production facility for the bulk scale manufacture of graphene at competitive prices. The Company continues to develop graphene related intellectual property from which it intends to generate licence and royalty payments.
The Company has collaboration arrangements with four universities and is at the cutting edge of graphene and 2D related material developments. Most recently First Graphene has become a Tier 1 participant in the Graphene Engineering and Innovation Centre (GEIC) of the University of Manchester. First Graphene is working with numerous industry partners for the commercialisation of graphene and is building a sales book with these industry partners.
FGR’s Commercial Graphene Facility at Henderson has been operating since early 2018, having been officially opened by Mr Josh Wilson MP, Federal Member for Fremantle on 23 November 2017.
Mr Josh Wilson MP, Federal Member for Fremantle speaking at the November official opening.
The facility uses the electrochemical exfoliation process (ECE) developed by FGR in conjunction with the University of Adelaide. The initial test work was conducted at the University in May 2015, and by November 2017, FGR had constructed the world’s largest graphene producing ECE facility. The use of Sri Lankan graphite as a feedstock has enabled the Company to produce some unique products. For example, where competitors products have a platelet size of only 5 micron (5µm) FGR is able to consistently produce platelets of up to 20µm.
FGR has the option of being able to reduce its platelet sizes and now offers three products sizes, being PureGRAPH™ Graphene Powders in 20, 10 and 5 µm sizes. The products are characterised by their large platelet size, high aspect ratio and low defect levels and with tightly controlled platelet geometries. The powders are readily dispersed in a range of solvent and polymer media. Batch to batch consistency is ensured through leading edge quality control testing.
These larger products are, as far as we are aware, unique to FGR and provide another competitive advantage
Applications:PureGRAPH™ products are currently being used in....
For
per
sona
l use
onl
y

7FIRST GRAPHENE
ANNUAL REPORT 2018
Review of Operations
“ The GEIC is a key component of the University’s strategy for Graphene@Manchester. The centre’s aim is to accelerate the commercialisation to real-world applications to transition graphene and other 2D materials from the lab to the marketplace.” James Baker, CEO Graphene@Manchester
Graphene DevelopmentsUniversity of Manchester – Graphene Engineering Innovation Centre (GEIC)In June 2018, FGR announced it would be joining the GEIC as a Tier 1 participant. Set to open in late 2018, the £60m (GEIC) will be an international research and technology facility.
Together, the National Graphene Institute (NGI) and GEIC will provide an unrivalled critical mass of graphene expertise. The two facilities will reinforce Manchester’s position as a globally leading knowledge-base in graphene research and commercialisation. The £105m Henry Royce Institute building is set to be completed in 2019 and together with the GEIC will be crucial in maintaining the UK’s world leading position in advanced materials.
Fire Retardant - FireStop™Development of the FireStop™ product is being conducted in collaboration with the University of Adelaide as part of the Company’s participation as a Tier-1 member of the ARC Research Hub for Graphene Enabled Industry Transformation.
The Flame Retardancy market was worth $8 billion in 2016. The most valuable segment is in plastics at $5.7 billion,
followed by textiles at $1.1 billion, wood/paper at $0.33 billion and coatings/paints at $0.31 billion.
The global flame retardants market is projected to reach US$12.81 billion by 2021, at a CAGR of 6.4% between 2016 and 2021. The market is primarily driven by growth of the end-use industries and increasingly stringent fire safety regulations. The Asia/Pacific region is projected to post the fastest growth in demand of any area around the world and retain its position as the largest regional market, accounting for more than half of 2018 global flame retardant consumption.
Earlier test work, had demonstrated the effectiveness of FireStop™ in a prototype formulation confirming its performance as a fire retardant coating. The Company is now developing a robustly formulated Firestop™ product based upon commercially available intermediates. The new formulation will be weather-proof and is suitable for external use. By modifying the FGR graphene used in the fire retardant formulation the surface finish has been greatly improved delivering a much smoother finish when applied to wood. From a commercial perspective this will mean our superior fire retardant will also provide a better aesthetic finish when top coats of gloss paint are applied.
By November 2018 the Company will provide the product to an external testing laboratory (Exova Warringtonfire) for formal certification.
First GrapheneFireStop™ 450 micron2 coats
Competitor Product 700 micron3 coats
First GrapheneFireStop™ 700 micron3 coats
Competitor Product 1020 micron4 coats
CONTINUED
For
per
sona
l use
onl
y

8FIRST GRAPHENE ANNUAL REPORT 2018
Review of Operations
Polyurethane, Polymers, Carbon Fibre and FibreglassAmongst the areas where graphene is expected to have a huge impact is polyurethane, polymers and fibreglass. Small doses of graphene, usually 1% by weight or less, can lead to improvements in strength of up to 30% while adding other benefits, such as water proofing and heat conductivity.
In this area FGR is working with a Western Australian company which provides polyurethane wear lining products to major iron ore producers, such as Rio, BHP and Fortescue.
In seeking to continue its leading edge FGR has installed its own mixing unit to blend polymers, polyurethane and fibreglass for testing.
Management intends to focus attention on this area through GEIC and connections in the UK and Europe as these are products where large volumes of graphene will eventually be sold and used.
The key to a composite material like carbon fibre is that it is incredibly strong for its weight.
“ Nano-carbon materials can replace metals in many products, as a new paradigm in manufacturing, and the commercial availability of such materials by 2D Fluidics will make a big impact.” Professor Colin Raston
2D Fluidics Pty LtdIn June FGR announced the launch of its 50%-owned associate company, 2D Fluidics Pty Ltd), in collaboration with Flinders University’s newly named Flinders Institute for NanoScale Science and Technology (CNST).
The initial objective of 2D Fluidics will be the commercialisation of the Vortex Fluidic Device (VFD), invented by the CNST’s Professor Colin Raston. The VFD enables new approaches to the production of a wide range of materials such as graphene and sliced carbon nanotubes, with the bonus of not needing to use harsh or toxic chemicals in the manufacturing process.
This clean processing breakthrough will also greatly reduce the cost and improve the efficiency of manufacturing these
new high quality super-strength carbon materials. The key intellectual property used by 2D Fluidics comprises two patents around the production of carbon nanomaterials and has been assigned to 2D Fluidics by Flinders University. This adds to the portfolio of patentable technologies being owned or exclusively licenced by FGR.
2D Fluidics will use the VFD to prepare these materials for commercial sales, which will be used in the plastics industry for applications requiring new composite materials, and by the electronics industry for circuits, supercapacitors and batteries, and for research laboratories around the world. 2D Fluidics will also manufacture the VFD, which is expected to become an in-demand state-of-the-art research and teaching tool for thousands of universities worldwide, and should be a revenue source for the new company.
CONTINUED
For
per
sona
l use
onl
y

9FIRST GRAPHENE
ANNUAL REPORT 2018
Review of Operations
The BEST Battery™The objective of the BEST™ Battery Project is to take the science developed by Swinburne and scale up the manufacturing process to a point where it may be considered a viable alternative to established chemical battery technology.
The basic science involves using layers of graphene oxide which have been treated by lasers to create nanopores, storing electric ions at an energy density level 10x that of existing supercapacitors which utilise activated carbon. Thus, they represent a generational change in the structure of supercapacitors and they overcome previous limitations. Apart from the safety benefits when compared to lithium-ion batteries, the BEST™ Battery can be recharged in a fraction of the time and will potentially have a useful life of at least 10x that of lithium-ion batteries.
Progress during the 2018 financial year has seen;
• initially expanded the process circuitry from the use of single lasers to four lasers simultaneously, then further expanded the circuity design to enable use of 25 lasers simultaneously, thereby enhancing productivity in the development of an industrial scale process,
• developed vacuum deposition coating of metal as current collectors,
• improved mechanical strength by using ultrasonic w elding and
• improved the current collectors of the pouch by vacuum sealing process
• advanced the automation processes.
EnvironmentThe Directors and management are conscious of ensuring all activities are undertaken with a view to achieving the highest environmental standards that are practically possible.
The Company’s new Commercial Graphene Production facility has met the environmental standards set down by the Government of Western Australia’s Department of Environment Regulation.
The Company is actively working to establish a method of production for Graphene Oxide which will be environmentally less harmful than the existing Hummers and modified Hummers methods.
The surface footprint of the Company’s mining activities is small, and all mining activities are to be conducted underground. As a result, the impact on the surrounding area will be minimal. No processing will occur on the mining location and all mined graphite has been transported to a central processing facility.
SafetyEmployment and Training ProgramAll potential full time employees must undergo a Company funded full medical examination prior to commencing employment. All employees are also required to complete a Company funded safety first training course at the commencement of employment and annual refresher courses.
The Company will be ensuring training is provided to all machinery operators by qualified training institutions and personnel. Employees will then be signed out as competent operators for selected pieces of machinery, e.g. cranes, winches, compressors etc.
Refresher courses will be conducted to make sure competence levels are maintained.
CONTINUED
For
per
sona
l use
onl
y

10
ConsolidatedFinancial Report2018For the year ended 30 June 2017
For
per
sona
l use
onl
y

11FIRST GRAPHENE
ANNUAL REPORT 2018
Directors’ Report
The directors present their report together with the financial report of the consolidated entity (referred to hereafter as the ‘consolidated entity’) and the entities it controlled at the end of, or during, the year ended 30 June 2018.
DirectorsThe names and details of the Company’s Directors in office during the financial year and until the date of this report are as follows. The Directors were in office for this entire period unless otherwise stated.
Warwick Grigor BEc. LLB, MAusIMM, FAICD
Non-Executive Chairman
Mr Grigor is a highly respected and experienced mining analyst, with an intimate knowledge of all market related aspects of the mining industry. He is a graduate of the Australian National University having completed degrees in law and economics. His association with mining commenced with a position in the finance department of Hamersley Iron, and from there he moved to Sydney to become a mining analyst with institutional stockbrokers. Mr Grigor left County NatWest Securities in 1991 to found Far East Capital Limited which was established as a specialist mining company financier and corporate adviser, together with Andrew “Twiggy” Forrest.
In 2008, Far East Capital sponsored the formation of a stockbroking company, BGF Equities, and Mr Grigor assumed the position of Executive Chairman. This was re-badged as Canaccord Genuity Australia Limited when a 50% stake was sold to Canaccord Genuity Group Inc. Mr Grigor retired from Canaccord in October 2014, returning to Far East Capital as Director.
Special Responsibilities Member of the Audit Committee.
Former Directorships Non-executive director of Peninsular Energy Limited.
No other directorships have been held in the last three years.
Craig McGuckin Dip. Minsurv Class 1, Dip Surfmin
Managing Director
Craig McGuckin is a qualified mining professional with 32 years’ experience in the mining, drilling and petroleum industries. He has held senior positions including Senior Planning Engineer, Mine Manager and Managing Director of private and publicly listed companies.
No other directorships have been held in the last three years.
Peter Youd B Bus (Accounting), AICA
Executive Director
Peter Youd is a Chartered Accountant and has extensive experience within the resources and oil and gas services, industries. For the last 30 years Mr Youd has held a number of senior management positions and directorships for publicly listed and private companies in Australia and overseas.
Special Responsibilities Member of the Audit Committee.
Other Current Directorships Non-executive director of Haranga Resources Limited.
Chris Banasik B App Sc (Physics), MSc (Econ Geol), Grad Dip Ed, MAusIMM
Non-Executive Director
Resigned 12 February 2018
Mr Banasik was a founding Director of Exploration and Geology for the ASX listed company Silver Lake Resources Limited and held this position from May 2007 until November 2014.
Mr Banasik has a Master’s Degree in Mineral Economics from University of WA and Bachelor’s Degree in Applied Physics from Curtin University.
Prior to becoming the Director of Exploration and Geology of Silver Lake Resources, he held senior geological management positions over 12 years’ with organisations including WMC Resources Ltd, Reliance Mining Ltd, Goldfields Mine Management and Consolidated Minerals Ltd. He has gained extensive experience in every aspect of mining, mineral processing, smelting and refining primarily for gold and nickel.
Former Directorships:
Silver Lake Resources Limited until November 2014.For
per
sona
l use
onl
y

12FIRST GRAPHENE ANNUAL REPORT 2018
Directors’ Report
Company SecretariesPeter Youd B Bus (Accounting), AICA
Nerida Schmidt B Com, CPA, F Fin (GDipAFin), ACIS (GDip CSP)
Results and Dividends
The Group result for the year was a loss of $7,024,612 (2017: loss of $4,259,960).
No final dividend has been declared or recommended as at 30 June 2018 or as at the date of this report (2017: $ nil).
No interim dividends have been paid (2016: nil).
Principal ActivitiesDuring the financial year the principal continuing activities of the consolidated entity were as a developer and producer of high technology graphene materials and associated intellectual property.
Events Since the End of the Financial YearThere are no known subsequent events of a material nature.
Significant Changes in State of AffairsThere were no significant changes in the state of affairs of the consolidated entity during the financial year.
Likely Developments and expected results of operationsThe Directors have excluded from this report any further information on the likely developments in the operations of the Group and the expected results of those operations in future financial years, other than as mentioned in the Chairman’s Statement and Review of Operations as the Directors have reasonable grounds to believe the continuing market volatility makes it impractical to forecast future profitability and other material financial events.
Directors’ and other officers’ emolumentsDetails of the remuneration policy for Directors and other officers are included in Principle 8: “Remunerate fairly and responsibly” of the Remuneration Report (page 15) and the Corporate Governance Principles (page 14).
Details of the nature and amounts of emoluments for each Director of the Company and Executive Officers are included in the Remuneration Report.
Environmental RegulationsThe Group’s operations are not regulated by any significant environmental regulation under a law of the Commonwealth or of a state or territory.
Proceedings on behalf of companyNo person has applied to the Court under section 237 of the Corporations Act for leave to bring proceedings on behalf of the Company or intervene in any proceedings to which the Company is a party for the purpose of taking responsibility on behalf of the Company for all or any part of those proceedings.
The Company was not a party to any such proceedings during the year.
CONTINUED
For
per
sona
l use
onl
y
13FIRST GRAPHENE
ANNUAL REPORT 2018
Directors’ Report
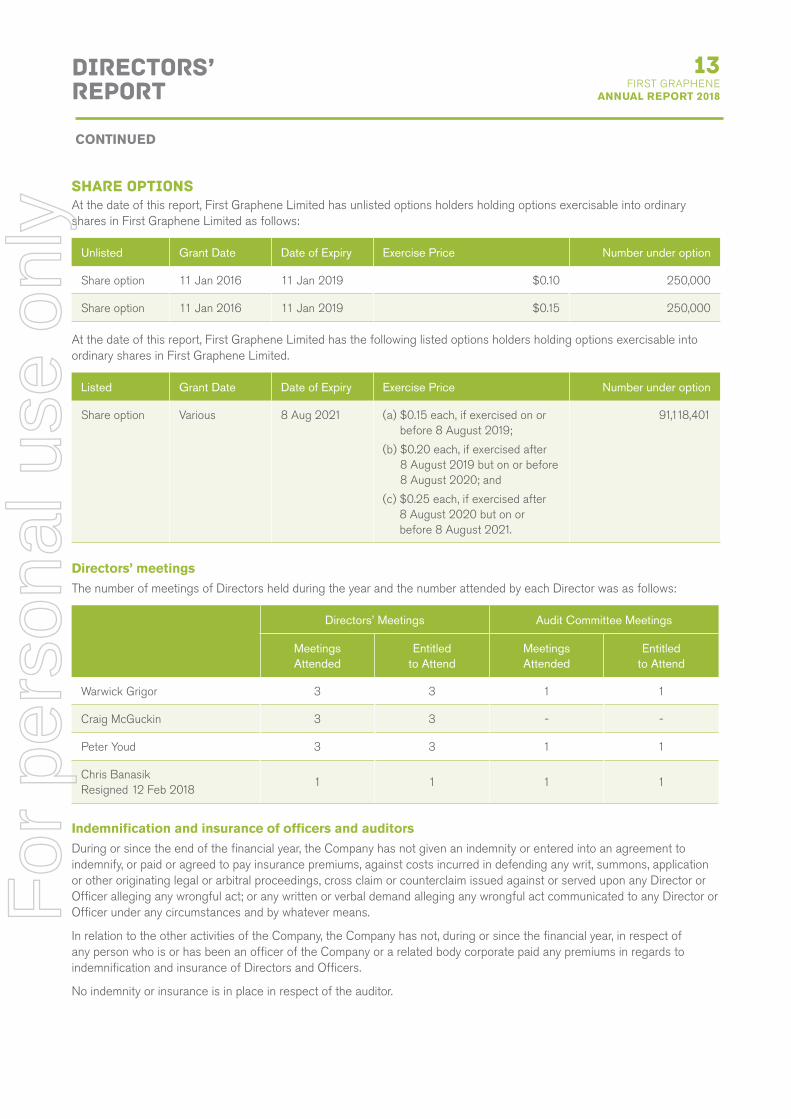
Share OptionsAt the date of this report, First Graphene Limited has unlisted options holders holding options exercisable into ordinary shares in First Graphene Limited as follows:
Unlisted Grant Date Date of Expiry Exercise Price Number under option
Share option 11 Jan 2016 11 Jan 2019 $0.10 250,000
Share option 11 Jan 2016 11 Jan 2019 $0.15 250,000
At the date of this report, First Graphene Limited has the following listed options holders holding options exercisable into ordinary shares in First Graphene Limited.
Listed Grant Date Date of Expiry Exercise Price Number under option
Share option Various 8 Aug 2021 (a) $0.15 each, if exercised on or before 8 August 2019;
(b) $0.20 each, if exercised after 8 August 2019 but on or before 8 August 2020; and
(c) $0.25 each, if exercised after 8 August 2020 but on or before 8 August 2021.
91,118,401
Directors’ meetingsThe number of meetings of Directors held during the year and the number attended by each Director was as follows:
Directors’ Meetings Audit Committee Meetings
Meetings Attended
Entitled to Attend
Meetings Attended
Entitled to Attend
Warwick Grigor 3 3 1 1
Craig McGuckin 3 3 - -
Peter Youd 3 3 1 1
Chris Banasik Resigned 12 Feb 2018
1 1 1 1
Indemnification and insurance of officers and auditorsDuring or since the end of the financial year, the Company has not given an indemnity or entered into an agreement to indemnify, or paid or agreed to pay insurance premiums, against costs incurred in defending any writ, summons, application or other originating legal or arbitral proceedings, cross claim or counterclaim issued against or served upon any Director or Officer alleging any wrongful act; or any written or verbal demand alleging any wrongful act communicated to any Director or Officer under any circumstances and by whatever means.
In relation to the other activities of the Company, the Company has not, during or since the financial year, in respect of any person who is or has been an officer of the Company or a related body corporate paid any premiums in regards to indemnification and insurance of Directors and Officers.
No indemnity or insurance is in place in respect of the auditor.
CONTINUED
For
per
sona
l use
onl
y
14FIRST GRAPHENE ANNUAL REPORT 2018
Directors’ Report
Remuneration report (audited)The information provided in this Remuneration Report has been audited as required by section 308(3C) of the Corporations Act 2001.
This report outlines the remuneration arrangements in place for Directors of First Graphene Limited and Executives of the Group.
Key Management Personnel disclosed in this report
Mr Craig McGuckin
Mr Peter Youd
Mr Warwick Grigor
Mr Chris Banasik (resigned 12 February 2018)
Remuneration PolicyEmoluments of Directors and senior executives are set by reference to payments made by other companies of similar size and industry, and by reference to the skills and experience of the Directors and Executives. Details of the nature and amounts of emoluments of each Director of the Company are disclosed annually in the Company’s annual report.
Directors and Senior Executives are prohibited from entering into transactions or arrangements which limit the economic risk of participating in unvested entitlements.
There has been no direct relationship between the Group’s financial performance and remuneration of key management personnel over the previous 5 years.
Executive Director RemunerationExecutive pay and reward consist of a base fee and short term performance incentives. Long term performance incentives may include options granted at the discretion of the Board and subject to obtaining the relevant approvals. The grant of options is designed to recognise and reward efforts as well as to provide additional incentive and may be subject to the successful completion of performance hurdles.
Executives are offered a competitive level of base pay at market rates (for comparable companies) and are reviewed annually to ensure market competitiveness.
The remuneration policy is designed to encourage superior performance and long-term commitment to FGR. At this stage of the Company’s development there is no contractual performance based remuneration.
Executive Directors do not receive any fees for being Directors of FGR or for attending Board and Board Committee meetings.
All Executive Directors, Non-Executive Directors and responsible executives of FGR are entitled to an Indemnity and Access Agreement under which, inter alia, they are indemnified as far as possible under the law for their actions as Directors and officers of FGR.
CONTINUED
For
per
sona
l use
onl
y
15FIRST GRAPHENE
ANNUAL REPORT 2018
Directors’ Report
Non-Executive Director RemunerationThe Company’s policy is to remunerate non-executive Directors at a fixed fee for time, commitment and responsibilities. Remuneration for Non-Executive Directors is not linked to individual performance. Given the Company is at its early stage of development and the financial restrictions placed on it, the Company may consider it appropriate to issue unlisted options to Non-Executive Directors, subject to obtaining the relevant approvals. This Policy is subject to annual review. All of the Directors’ option holdings are fully disclosed. From time to time the Company may grant options to non-executive Directors. The grant of options is designed to recognise and reward efforts as well as to provide Non-Executive Directors with additional incentive to continue those efforts for the benefit of the Company.
Non-Executive Directors are remunerated for their services from the maximum aggregate amount (currently $300,000 per annum) approved by shareholders for this purpose. They receive a base fee, which is currently set at $25,000 per annum per non-executive Director and $30,000 per annum for the non-executive Chairman. There are no termination payments to Non-Executive Directors on their retirement from office.
The Company’s policy for determining the nature and amounts of emoluments of Board members and Senior Executives of the Company is set out below:
Setting Remuneration ArrangementsThe full Board now carries out the role of the Remuneration Committee. The full Board did not officially convene as a Remuneration Committee during the Reporting Period, however Remuneration-related discussions occurred from time to time during the year as required.
Executive Officer Remuneration, including Executive DirectorsThe remuneration structure for Executive Officers, including Executive Directors, is based on a number of factors, including length of service, the particular experience of the individual concerned, and the overall performance of the Company. The contracts for service between the Company and specified Directors and Executives are on a continuing basis, the terms of which are not expected to change in the immediate future. Upon retirement Executive Directors and Executives are paid employee benefit entitlements accrued to the date of retirement.
As an incentive, the Company has adopted an employee share option plan. The purpose of the plan is to give employees, directors and officers of the Company an opportunity, in the form of options, to subscribe for shares. The Directors consider the plan will enable the Company to retain and attract skilled and experienced employees, board members and officers, and provide them with the motivation to make the Company more successful.
CONTINUED
For
per
sona
l use
onl
y

16FIRST GRAPHENE ANNUAL REPORT 2018
Directors’ Report
Details of remuneration for the year ended 30 June 2018The remuneration for each director and key management executives of the Group during the year was as follows:
Short term incentives & other benefits
Base consulting
feeVehicle
allowanceDirector’s
fees
Share Based
PaymentsBonus
Payment (iii)
Post- Employment Entitlements Total
Value of remuneration
which is performance
related
30 June 2018 A$ A$ A$ A$ A$ A$ A$ %
Executive Directors
Craig McGuckin (i) 479,621 12,000 - 160,000 244,000 - 895,621 -
Peter Youd (i) 417,823 12,000 - 160,000 244,000 - 833,823 -
Non-Executive Directors
Warwick Grigor 42,000 - 30,000 160,000 - - 232,000 -
Chris Banasik (ii) 12,000 - 14,579 64,000 - - 90,579 -
Total 951,444 24,000 44,579 544,000 488,000 - 2,052,023 -
i. Mr Craig McGuckin and Mr Peter Youd do not receive director’s fees however are compensated in accordance with their respective consultant agreement.
ii. Mr Banasik resigned 14 February 2018
iii. Cash payments to Messrs McGuckin and Youd were made to allow them to exercise their options expiring October 2017. These payments were not performance related.
Details of remuneration for the year ended 30 June 2017The remuneration for each director and key management executives of the Group during the year was as follows:
Short term incentives & other benefits
Base consulting
feeVehicle
allowanceDirector’s
fees
Post- Employment Entitlements Total
Value of remuneration which is performance
related
30 June 2017 A$ A$ A$ A$ A$ %
Executive Directors
Craig McGuckin (i) 412,270 12,000 - - 424,270 -
Peter Youd (i) 360,818 12,000 - - 372,818 -
Non-Executive Directors
Warwick Grigor 6,000 - 30,000 - 36,000 -
Chris Banasik 20,000 - 25,000 - 45,000 -
Total 799,088 24,000 55,000 - 872,088 -
i. Mr Craig McGuckin and Mr Peter Youd do not receive director’s fees however are compensated in accordance with their respective consultant agreement.
CONTINUED
For
per
sona
l use
onl
y
17FIRST GRAPHENE
ANNUAL REPORT 2018
Directors’ Report
Relationship between Remuneration and Company PerformanceThere is not a connection between the profitability of the Company and remuneration as the Company is not generating revenues.
Name % Fixed remuneration % Short Term Incentive % Long Term Incentive
Craig McGuckin 100 - -
Peter Youd 100 - -
Warwick Grigor 100 - -
Chris Banasik 100 - -
Service AgreementsRemuneration and other terms of employment for the executives are formalised in service agreements. These agreements specify the components of remuneration benefits and notice periods. The material terms of service agreements with the Executive Directors are noted as follows:
Name Term of agreement and notice period Base fee Termination payment (3)
Mr Craig McGuckin No fixed term; 12 months(1) 456,333(2) $ None
Mr Peter Youd No fixed term; 12 months(1) 399,293(2) $ None
1. The twelve-month notice period applies only to the Company. The executive is required to give three months’ notice.
2. Base fee quoted are for the period ended 30 June 2018 includes vehicle allowance and an additional allowance equal to 9.5% of the base fee.
3. Notice period of termination benefit in lieu of notice (on behalf of the Company), other than for gross misconduct.
There are no other service agreements in place.
Shares-based compensationShares issued as part of remuneration for the year ended 30 June 2018
No shares were issued to directors and other key management personnel as part of compensation during the year.
Options issued as part of remuneration for the year ended 30 June 2018
Options issued as part of the remuneration are disclosed in the preceding table.
CONTINUED
For
per
sona
l use
onl
y
18FIRST GRAPHENE ANNUAL REPORT 2018
Directors’ Report
Options and rights holdings held by key management personnel
DirectorsBalance 01.07.17 Granted Exercised Other i
Balance 30.06.18
Total vested 30.06.18
Vested & exercisable 30.06.18
Vested & un-
exercisable 30.06.18
C McGuckin 5,000,000 5,000,000 (5,000,000) (5,000,000) - - - -
P Youd 1,500,000 5,000,000 (1,500,000) (4,947,909) 52,091 52,091 52,091 -
W Grigor - 5,000,000 - 137,500 5,137,500 5,137,500 5,137,500 -
C Banasik - 2,000,000 - (2,000,000) - - - -
i Transfer to external parties
Shareholdings held by key management personnel
DirectorsBalance 01.07.17 Granted Acquired Other
Balance 30.06.18
C McGuckin 7,631,240 - - - 7,631,240
P Youd 6,511,521 - - - 6,511,521
W Grigor 15,605,946 - 1,500,000 - 17,105,946
C Banasik 872,727 - - (872,727) -
Transactions with other related partiesDuring the reporting period, placement fees were paid to Far East Capital Limited, a company of which Mr Grigor is a Director, for equity raisings during fiscal 2018 totalling $207,912 (2017: 211,200). There were no other payments to related parties.
There were no loans or other transactions with key management personnel.
No remuneration consultants were utilised as at this point in the Company’s development as this would be a waste of shareholders’ valuable funds.
Director Options were approved at the Annual General Meeting on 24 November 2017.
Using the Black and Scholes option pricing model and based on the assumptions set out below, the Director Options were ascribed the following value:
Assumptions:
Valuation date 24 November 2017Market price of shares $0.084Exercise price $0.15 - $0.25Expiry date (length of time from issue) 8 August 2021 – 3.71 yearsRisk free interest rate 2.13%Volatility 79.7%Indicative Value of Director Option $0.03Total Value of Director Options 544,000
- Mr Craig McGuckin 160,000- Mr Peter Youd 160,000- Mr Warwick Grigor 160,000- Mr Chris Banasik 64,000
Voting RightsAt the 2017 Annual General Meeting held on 24 November 2017 there were 42.47% of the votes against the adoption of the remuneration report.
End of audited Remuneration Report
CONTINUED
For
per
sona
l use
onl
y
19FIRST GRAPHENE
ANNUAL REPORT 2018
Auditor’s independence
The Directors received the independence declaration from the auditor of First Graphene Limited as stated on page 20.
Non-audit servicesDuring the period BDO Corporate Tax (WA) Pty Ltd was paid $23,829 for the provision of taxation services (2017: $16,875). BDO Corporate Tax (WA) Pty Ltd is an affiliate member of BDO Audit (WA) Pty Ltd. Refer to Note 24 for further details
The board of directors has considered the position and, in accordance with advice received from the audit committee, is satisfied the provision of the non-audit services is compatible with the general standard of independence for auditors imposed by the Corporations Act 2001. The directors are satisfied the provision of non-audit services by the auditor, as set out in Note 24, did not compromise the auditor independence requirements of the Corporations Act 2001 for the following reasons:
• all non-audit services have been reviewed by the audit committee to ensure they do not impact the impartiality and objectivity of the auditor
• none of the services undermine the general principles relating to auditor independence as set out in APES 110 Code of Ethics for Professional Accountants
Signed in accordance with a Resolution of the Directors.
Craig McGuckinManaging DirectorDated at Perth this 21 September 2018
Corporate Governance StatementThe Company’s full Corporate Governance Statement is available on the Company’s website, www.firstGraphene.com.au/corporate/corporate-governance.html.
A completed Appendix 4G and the full Corporate Governance Statement have been lodged with the Australian Securities Exchange as required under Listing Rules 4.7.3 and 4.7.4.
For
per
sona
l use
onl
y

20FIRST GRAPHENE ANNUAL REPORT 2018
Auditor’s Independence Declaration
BDO Audit (WA) Pty Ltd ABN 79 112 284 787 is a member of a national association of independent entities which are all members of BDO Australia Ltd ABN 77 050 110 275,an Australian company limited by guarantee. BDO Audit (WA) Pty Ltd and BDO Australia Ltd are members of BDO International Ltd, a UK company limited by guarantee, andform part of the international BDO network of independent member firms. Liability limited by a scheme approved under Professional Standards Legislation other than forthe acts or omissions of financial services licensees
Tel: +61 8 6382 4600Fax: +61 8 6382 4601www.bdo.com.au
38 Station StreetSubiaco, WA 6008PO Box 700 West Perth WA 6872Australia
DECLARATION OF INDEPENDENCE BY PHILLIP MURDOCH TO THE DIRECTORS OF FIRST GRAPHENELIMITED
As lead auditor of First Graphene Limited for the year ended 30 June 2018, I declare that, to the bestof my knowledge and belief, there have been:
1. No contraventions of the auditor independence requirements of the Corporations Act 2001 inrelation to the audit; and
2. No contraventions of any applicable code of professional conduct in relation to the audit.
This declaration is in respect of Company Name and the entities it controlled during the period.
Phillip Murdoch
Director
BDO Audit (WA) Pty Ltd
Perth, 21 September 2018
For
per
sona
l use
onl
y
21FIRST GRAPHENE
ANNUAL REPORT 2018
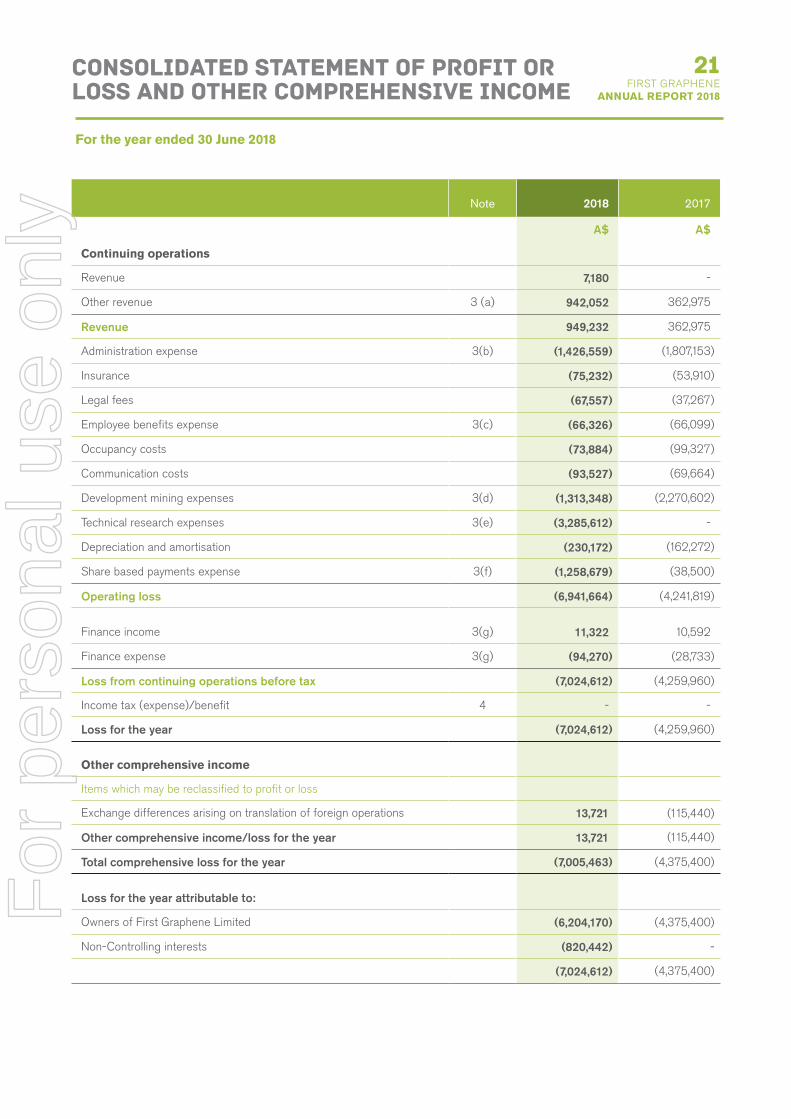
Consolidated Statement of Profit or Loss and Other Comprehensive Income
Note 2018 2017
A$ A$
Continuing operations
Revenue 7,180 -
Other revenue 3 (a) 942,052 362,975
Revenue 949,232 362,975
Administration expense 3(b) (1,426,559) (1,807,153)
Insurance (75,232) (53,910)
Legal fees (67,557) (37,267)
Employee benefits expense 3(c) (66,326) (66,099)
Occupancy costs (73,884) (99,327)
Communication costs (93,527) (69,664)
Development mining expenses 3(d) (1,313,348) (2,270,602)
Technical research expenses 3(e) (3,285,612) -
Depreciation and amortisation (230,172) (162,272)
Share based payments expense 3(f) (1,258,679) (38,500)
Operating loss (6,941,664) (4,241,819)
Finance income 3(g) 11,322 10,592
Finance expense 3(g) (94,270) (28,733)
Loss from continuing operations before tax (7,024,612) (4,259,960)
Income tax (expense)/benefit 4 - -
Loss for the year (7,024,612) (4,259,960)
Other comprehensive income
Items which may be reclassified to profit or loss
Exchange differences arising on translation of foreign operations 13,721 (115,440)
Other comprehensive income/loss for the year 13,721 (115,440)
Total comprehensive loss for the year (7,005,463) (4,375,400)
Loss for the year attributable to:
Owners of First Graphene Limited (6,204,170) (4,375,400)
Non-Controlling interests (820,442) -
(7,024,612) (4,375,400)
For the year ended 30 June 2018
For
per
sona
l use
onl
y
22FIRST GRAPHENE ANNUAL REPORT 2018
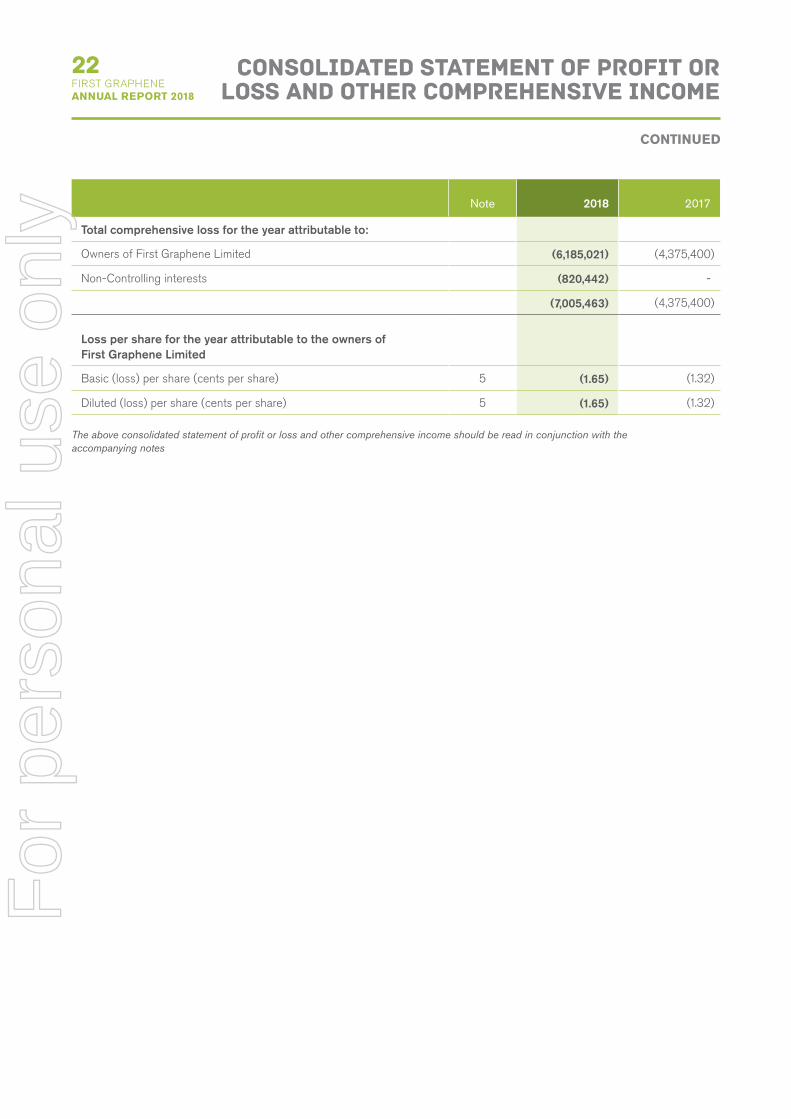
Consolidated Statement of Profit or Loss and Other Comprehensive Income
Note 2018 2017
Total comprehensive loss for the year attributable to:
Owners of First Graphene Limited (6,185,021) (4,375,400)
Non-Controlling interests (820,442) -
(7,005,463) (4,375,400)
Loss per share for the year attributable to the owners of First Graphene Limited
Basic (loss) per share (cents per share) 5 (1.65) (1.32)
Diluted (loss) per share (cents per share) 5 (1.65) (1.32)
The above consolidated statement of profit or loss and other comprehensive income should be read in conjunction with the accompanying notes
CONTINUED
For
per
sona
l use
onl
y
23FIRST GRAPHENE
ANNUAL REPORT 2018
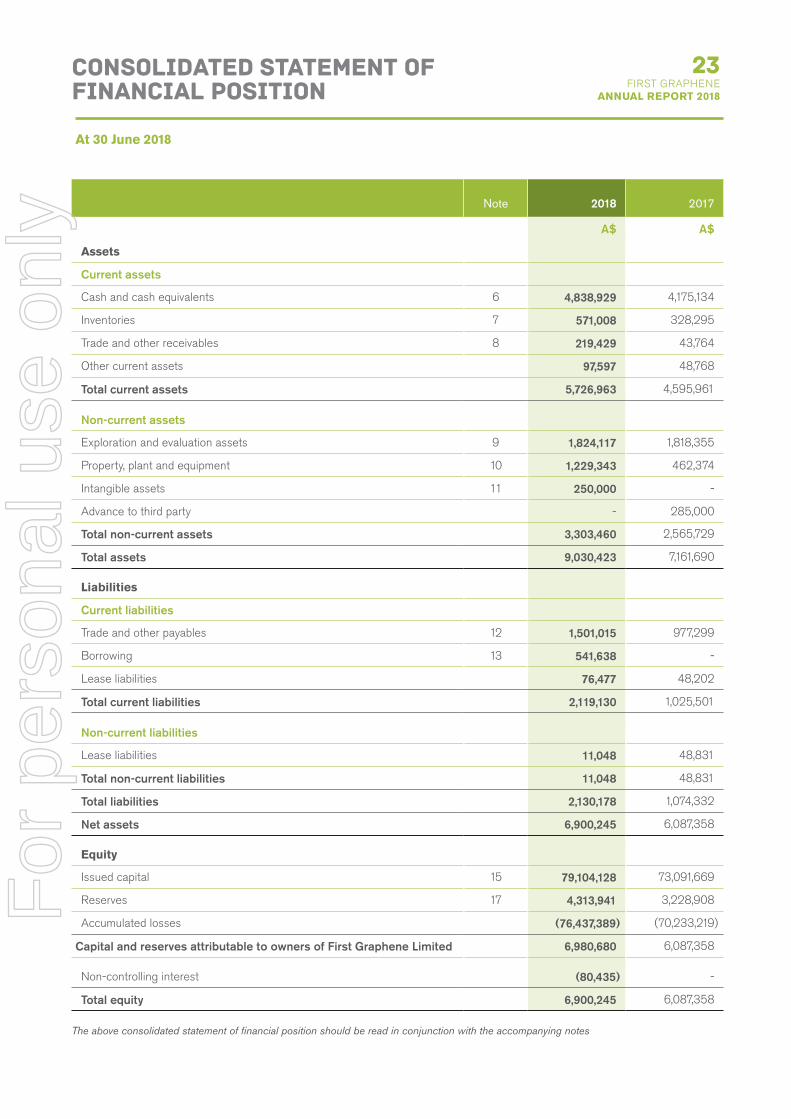
Consolidated Statement of Financial Position
Note 2018 2017
A$ A$
Assets
Current assets
Cash and cash equivalents 6 4,838,929 4,175,134
Inventories 7 571,008 328,295
Trade and other receivables 8 219,429 43,764
Other current assets 97,597 48,768
Total current assets 5,726,963 4,595,961
Non-current assets
Exploration and evaluation assets 9 1,824,117 1,818,355
Property, plant and equipment 10 1,229,343 462,374
Intangible assets 11 250,000 -
Advance to third party - 285,000
Total non-current assets 3,303,460 2,565,729
Total assets 9,030,423 7,161,690
Liabilities
Current liabilities
Trade and other payables 12 1,501,015 977,299
Borrowing 13 541,638 -
Lease liabilities 76,477 48,202
Total current liabilities 2,119,130 1,025,501
Non-current liabilities
Lease liabilities 11,048 48,831
Total non-current liabilities 11,048 48,831
Total liabilities 2,130,178 1,074,332
Net assets 6,900,245 6,087,358
Equity
Issued capital 15 79,104,128 73,091,669
Reserves 17 4,313,941 3,228,908
Accumulated losses (76,437,389) (70,233,219)
Capital and reserves attributable to owners of First Graphene Limited 6,980,680 6,087,358
Non-controlling interest (80,435) -
Total equity 6,900,245 6,087,358
The above consolidated statement of financial position should be read in conjunction with the accompanying notes
At 30 June 2018
For
per
sona
l use
onl
y

24FIRST GRAPHENE ANNUAL REPORT 2018
Consolidated Statement of Changes in Equity
Issu
ed
capi
tal
Sha
re
base
d pa
ymen
ts
rese
rve
Opt
ion
rese
rve
Tran
slat
ion
rese
rve
Oth
er
rese
rve
Acc
umul
ated
lo
sses
Non
-co
ntro
lling
in
tere
sts
Tota
l
As
at 1
Jul
y 20
1773
,091
,669
3,27
9,94
9-
(51,
041)
(70,
233,
219)
-6,
087,
358
Rec
ogni
tion
of n
on-c
ontr
ollin
g in
tere
st-
--
--
-25
0,01
025
0,01
0
Loss
for t
he y
ear
--
--
-(6
,204
,170)
(820
,442
)(7
,024
,612
)
Fore
ign
curr
ency
tran
slat
ion
--
-19
,149
--
-19
,149
Tota
l com
preh
ensi
ve lo
ss fo
r th
e ye
ar-
--
19,14
9-
(6,2
04,17
0)(5
70,4
32)
(7,0
05,4
63)
Tran
sact
ions
with
ow
ners
in th
eir
capa
city
as
ow
ners
Sha
re p
lace
men
ts d
urin
g th
e ye
ar5,
568,
000
--
--
--
5,56
8,00
0
Sha
res
issu
ed u
pon
the
conv
ersi
on o
f opt
ions
695,
162
--
--
--
695,
162
Sha
re is
sue
cost
s(2
50,7
03)
--
--
--
(250
,703
)
Tran
sact
ions
with
NC
I-
--
-(4
89,9
97)
-48
9,99
9-
Opt
ions
sol
d du
ring
the
year
--
467,
202
--
--
467,
202
Sha
re b
ased
pay
men
t tra
nsac
tions
-1,
088,
679
--
--
-1,
088,
679
30 J
une
2018
79,1
04,1
284,
368,
628
467,
202
(31,
892)
(489
,997
)(7
6,43
7,38
9)(8
0,43
3)6,
900,
245
As
at 1
Jul
y 20
1667
,328
,257
3,27
9,94
9-
64,3
99-
(65,
973,
259)
-4,
699,
346
Loss
for t
he y
ear
--
--
-(4
,259
,960
)-
(4,2
59,9
60)
Fore
ign
curr
ency
tran
slat
ion
--
-(1
15,4
40)
--
-(1
15,4
40)
Tota
l com
preh
ensi
ve lo
ss fo
r th
e ye
ar-
--
(115
,440
)-
(4,2
59,9
60)
-(4
,375
,400
)
Tran
sact
ions
with
ow
ners
in th
eir
capa
city
as
ow
ners
Sha
re p
lace
men
ts d
urin
g th
e ye
ar3,
588,
500
--
--
--
3,58
8,50
0
Sha
res
issu
ed u
pon
the
conv
ersi
on o
f opt
ions
2,45
9,39
3-
--
--
-2,
459,
393
Sha
re is
sue
cost
s(2
84,4
81)
--
--
--
(284
,481
)
30 J
une
2017
73,0
91,6
693,
279,
949
-(5
1,04
1)-
(70,
233,
219)
-6,
087,
358
The
abov
e co
nsol
idat
ed s
tate
men
t of c
hang
es in
equ
ity s
houl
d be
read
in c
onju
nctio
n w
ith th
e ac
com
pany
ing
note
s
For the year ended 30 June 2018
For
per
sona
l use
onl
y
25FIRST GRAPHENE
ANNUAL REPORT 2018
Consolidated Statement of Cash Flows
Issu
ed
capi
tal
Sha
re
base
d pa
ymen
ts
rese
rve
Opt
ion
rese
rve
Tran
slat
ion
rese
rve
Oth
er
rese
rve
Acc
umul
ated
lo
sses
Non
-co
ntro
lling
in
tere
sts
Tota
l
As
at 1
Jul
y 20
1773
,091
,669
3,27
9,94
9-
(51,
041)
(70,
233,
219)
-6,
087,
358
Rec
ogni
tion
of n
on-c
ontr
ollin
g in
tere
st-
--
--
-25
0,01
025
0,01
0
Loss
for t
he y
ear
--
--
-(6
,204
,170)
(820
,442
)(7
,024
,612
)
Fore
ign
curr
ency
tran
slat
ion
--
-19
,149
--
-19
,149
Tota
l com
preh
ensi
ve lo
ss fo
r th
e ye
ar-
--
19,14
9-
(6,2
04,17
0)(5
70,4
32)
(7,0
05,4
63)
Tran
sact
ions
with
ow
ners
in th
eir
capa
city
as
ow
ners
Sha
re p
lace
men
ts d
urin
g th
e ye
ar5,
568,
000
--
--
--
5,56
8,00
0
Sha
res
issu
ed u
pon
the
conv
ersi
on o
f opt
ions
695,
162
--
--
--
695,
162
Sha
re is
sue
cost
s(2
50,7
03)
--
--
--
(250
,703
)
Tran
sact
ions
with
NC
I-
--
-(4
89,9
97)
-48
9,99
9-
Opt
ions
sol
d du
ring
the
year
--
467,
202
--
--
467,
202
Sha
re b
ased
pay
men
t tra
nsac
tions
-1,
088,
679
--
--
-1,
088,
679
30 J
une
2018
79,1
04,1
284,
368,
628
467,
202
(31,
892)
(489
,997
)(7
6,43
7,38
9)(8
0,43
3)6,
900,
245
As
at 1
Jul
y 20
1667
,328
,257
3,27
9,94
9-
64,3
99-
(65,
973,
259)
-4,
699,
346
Loss
for t
he y
ear
--
--
-(4
,259
,960
)-
(4,2
59,9
60)
Fore
ign
curr
ency
tran
slat
ion
--
-(1
15,4
40)
--
-(1
15,4
40)
Tota
l com
preh
ensi
ve lo
ss fo
r th
e ye
ar-
--
(115
,440
)-
(4,2
59,9
60)
-(4
,375
,400
)
Tran
sact
ions
with
ow
ners
in th
eir
capa
city
as
ow
ners
Sha
re p
lace
men
ts d
urin
g th
e ye
ar3,
588,
500
--
--
--
3,58
8,50
0
Sha
res
issu
ed u
pon
the
conv
ersi
on o
f opt
ions
2,45
9,39
3-
--
--
-2,
459,
393
Sha
re is
sue
cost
s(2
84,4
81)
--
--
--
(284
,481
)
30 J
une
2017
73,0
91,6
693,
279,
949
-(5
1,04
1)-
(70,
233,
219)
-6,
087,
358
The
abov
e co
nsol
idat
ed s
tate
men
t of c
hang
es in
equ
ity s
houl
d be
read
in c
onju
nctio
n w
ith th
e ac
com
pany
ing
note
s
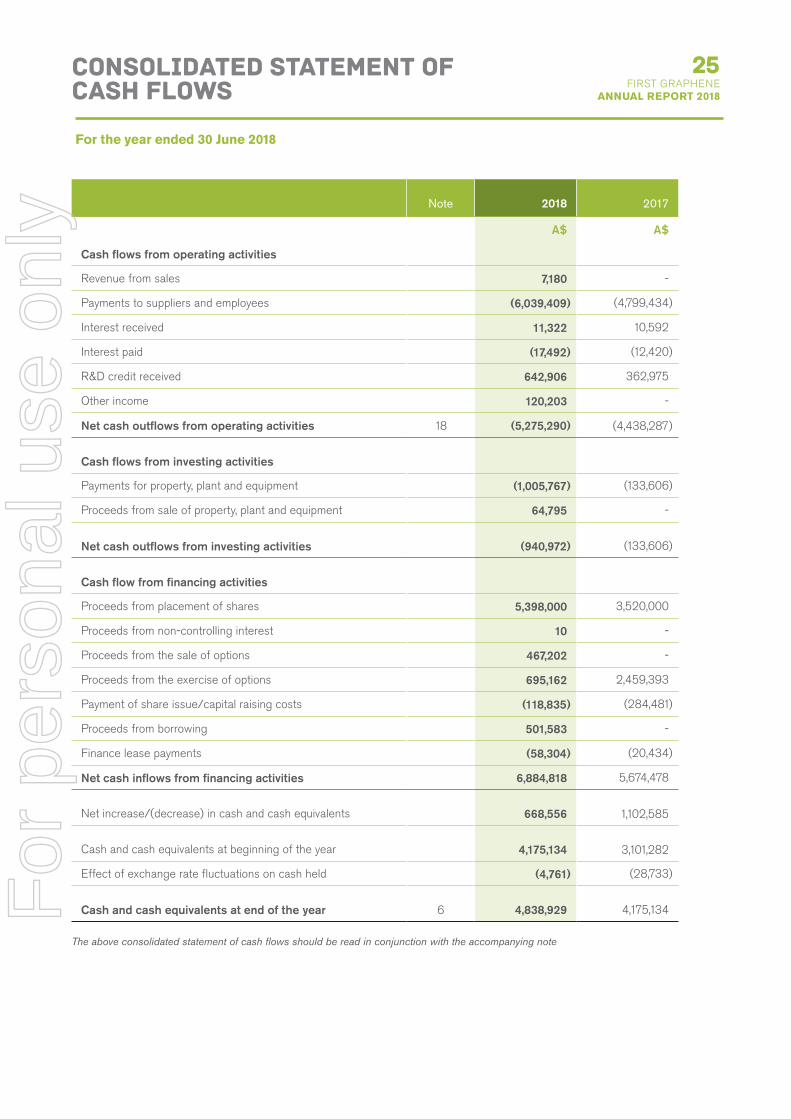
Note 2018 2017
A$ A$
Cash flows from operating activities
Revenue from sales 7,180 -
Payments to suppliers and employees (6,039,409) (4,799,434)
Interest received 11,322 10,592
Interest paid (17,492) (12,420)
R&D credit received 642,906 362,975
Other income 120,203 -
Net cash outflows from operating activities 18 (5,275,290) (4,438,287)
Cash flows from investing activities
Payments for property, plant and equipment (1,005,767) (133,606)
Proceeds from sale of property, plant and equipment 64,795 -
Net cash outflows from investing activities (940,972) (133,606)
Cash flow from financing activities
Proceeds from placement of shares 5,398,000 3,520,000
Proceeds from non-controlling interest 10 -
Proceeds from the sale of options 467,202 -
Proceeds from the exercise of options 695,162 2,459,393
Payment of share issue/capital raising costs (118,835) (284,481)
Proceeds from borrowing 501,583 -
Finance lease payments (58,304) (20,434)
Net cash inflows from financing activities 6,884,818 5,674,478
Net increase/(decrease) in cash and cash equivalents 668,556 1,102,585
Cash and cash equivalents at beginning of the year 4,175,134 3,101,282
Effect of exchange rate fluctuations on cash held (4,761) (28,733)
Cash and cash equivalents at end of the year 6 4,838,929 4,175,134
The above consolidated statement of cash flows should be read in conjunction with the accompanying note
For the year ended 30 June 2018
For
per
sona
l use
onl
y

26FIRST GRAPHENE ANNUAL REPORT 2018
Notes to the ConsolidatedFinancial Statements
1. Basis of PreparationFirst Graphene Limited (“FGR” or the “Company”) is a for-profit company limited by shares, incorporated and domiciled in Australia, whose shares are publicly traded on the Australian Securities Exchange. Its registered office and principal place of business is:
First Graphene LimitedSuite 39 Hampden RoadNedlands WA 6009
A description of the nature of operations and principal activities of FGR and its subsidiaries (collectively, the “Group”) is included in the Directors’ Report, which is not part of these financial statements.
The financial statements were authorised for issue in accordance with a resolution of the directors on 21 September 2018.
The financial report is a general purpose financial report which:
• has been prepared in accordance with the requirements of the Corporations Act 2001, Australian Accounting Standards and other authoritative pronouncements of the Australian Accounting Standards Board (AASB) and complies with International Financial Reporting Standards (IFRS) as issued by the International Accounting Standards Board (IASB);
• has been prepared on a historical cost basis except for assets and liabilities and share-based payments which are required to be measured at fair value. The basis of measurement is discussed further in the individual notes;
• is presented in Australian dollars;
• presents reclassified comparative information where required for consistency with the current year’s presentation;
• adopts all new and amended Accounting Standards and Interpretations issued by the AASB that are relevant to the operations of the Group and effective for reporting periods beginning on or after 1 July 2016.
• adopted AASB 2015-2 ‘Amendments to Australian Accounting Standards – Disclosure initiative: Amendments to AASB 1010.’
• does not early adopt Accounting Standards and Interpretations that have been issued or amended but are not yet effective with the exception of AASB 9 Financial Instruments (2014) including consequential amendments to other standards which was adopted on 1 July 2016.
CONTINUED
For
per
sona
l use
onl
y
27FIRST GRAPHENE
ANNUAL REPORT 2018
Notes to the ConsolidatedFinancial Statements
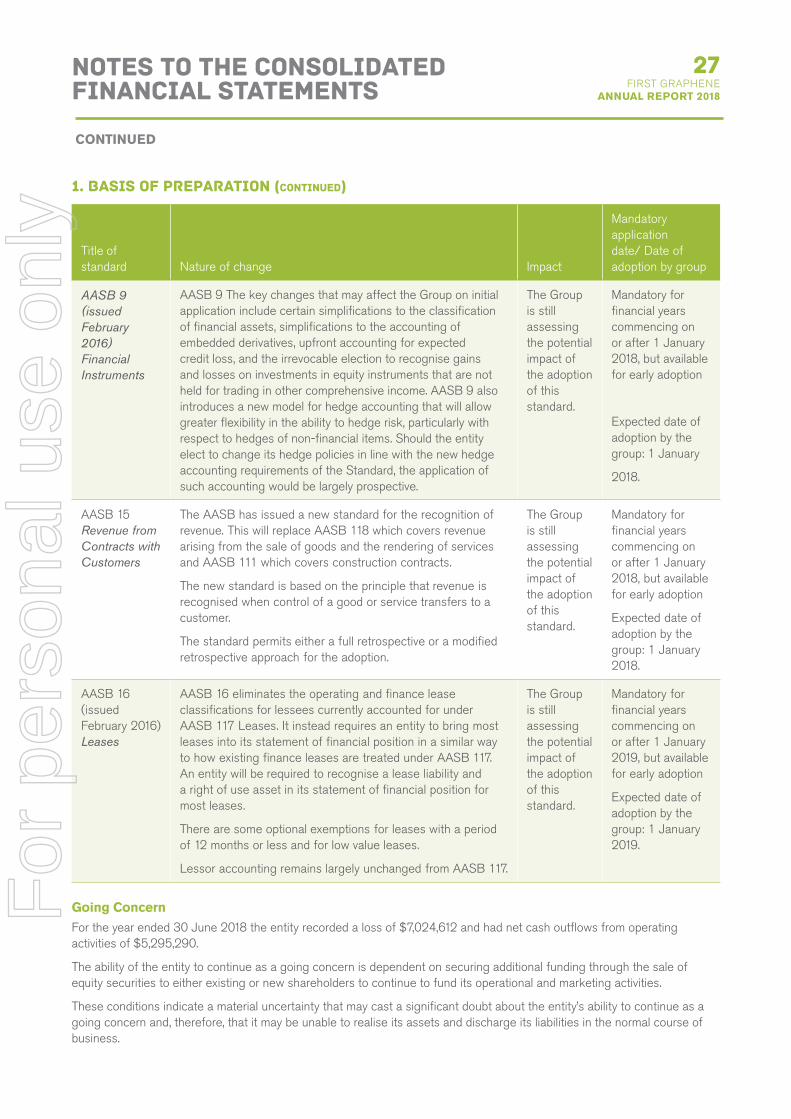
1. Basis of Preparation (continued)
Title ofstandard Nature of change Impact
Mandatory applicationdate/ Date of adoption by group
AASB 9 (issued February 2016) Financial Instruments
AASB 9 The key changes that may affect the Group on initial application include certain simplifications to the classification of financial assets, simplifications to the accounting of embedded derivatives, upfront accounting for expected credit loss, and the irrevocable election to recognise gains and losses on investments in equity instruments that are not held for trading in other comprehensive income. AASB 9 also introduces a new model for hedge accounting that will allow greater flexibility in the ability to hedge risk, particularly with respect to hedges of non-financial items. Should the entity elect to change its hedge policies in line with the new hedge accounting requirements of the Standard, the application of such accounting would be largely prospective.
The Group is still assessing the potential impact of the adoption of this standard.
Mandatory for financial years commencing on or after 1 January 2018, but available for early adoption
Expected date of adoption by the group: 1 January
2018.
AASB 15Revenue fromContracts withCustomers
The AASB has issued a new standard for the recognition of revenue. This will replace AASB 118 which covers revenue arising from the sale of goods and the rendering of services and AASB 111 which covers construction contracts.
The new standard is based on the principle that revenue is recognised when control of a good or service transfers to a customer.
The standard permits either a full retrospective or a modified retrospective approach for the adoption.
The Group is still assessing the potential impact of the adoption of this standard.
Mandatory for financial years commencing on or after 1 January 2018, but available for early adoption
Expected date of adoption by the group: 1 January 2018.
AASB 16 (issued February 2016) Leases
AASB 16 eliminates the operating and finance lease classifications for lessees currently accounted for under AASB 117 Leases. It instead requires an entity to bring most leases into its statement of financial position in a similar way to how existing finance leases are treated under AASB 117. An entity will be required to recognise a lease liability and a right of use asset in its statement of financial position for most leases.
There are some optional exemptions for leases with a period of 12 months or less and for low value leases.
Lessor accounting remains largely unchanged from AASB 117.
The Group is still assessing the potential impact of the adoption of this standard.
Mandatory for financial years commencing on or after 1 January 2019, but available for early adoption
Expected date of adoption by the group: 1 January 2019.
Going ConcernFor the year ended 30 June 2018 the entity recorded a loss of $7,024,612 and had net cash outflows from operating activities of $5,295,290.
The ability of the entity to continue as a going concern is dependent on securing additional funding through the sale of equity securities to either existing or new shareholders to continue to fund its operational and marketing activities.
These conditions indicate a material uncertainty that may cast a significant doubt about the entity’s ability to continue as a going concern and, therefore, that it may be unable to realise its assets and discharge its liabilities in the normal course of business.
CONTINUED
For
per
sona
l use
onl
y

28FIRST GRAPHENE ANNUAL REPORT 2018
Notes to the ConsolidatedFinancial Statements
Management believe there are sufficient funds to meet the entity’s working capital requirements and as at the date of this report. Subsequent to year end the entity expects to receive additional funds via the sale of equity securities to either existing or new shareholders
The financial statements have been prepared on the basis that the entity is a going concern, which contemplates the continuity of normal business activity, realisation of assets and settlement of liabilities in the normal course of business for the following reasons:
• In the event of further funds not being raised the entity’s activities would be wound back to a sustainable level.
Should the entity not be able to continue as a going concern, it may be required to realise its assets and discharge its liabilities other than in the ordinary course of business, and at amounts that differ from those stated in the financial statements and that the financial report does not include any adjustments relating to the recoverability and classification of recorded asset amounts or liabilities that might be necessary should the entity not continue as a going concern.
Principles of consolidationSubsidiaries are all entities (including structured entities) over which the Group has control. The Group controls an entity when the Group is exposed to, or has to, variable returns from its investment with the entity and has the ability to affect those returns through its power to direct the activities of the entity. Subsidiaries are fully consolidated from the date on which control is transferred to the Group. They are deconsolidated from the date when control ceases.
The acquisition method of account is used to account for business combinations by the Group.
Intercompany transactions, balance and unrealised gains on transactions between Group companies are eliminated. Unrealised losses are also eliminated unless the transaction provides evidence of an impairment of the transferred asset. Accounting policies of subsidiaries have been changed where necessary to ensure consistency with the policies adopted by the Group.
Non-controlling interests in the results and equity of subsidiaries are shown separately in the consolidated statement of profit or loss and other comprehensive income, statement of changes in equity and statement of financial position respectively.
Foreign currency translationThe financial report is presented in Australian dollars, which is First Graphene Limited’s functional and presentation currency.
Foreign currency transactionsForeign currency transactions are translated into Australian dollars using the exchange rates prevailing at the dates of the transactions. Foreign exchange gains and losses resulting from the settlement of such transactions and from the translation at financial year-end exchange rates of monetary assets and liabilities denominated in foreign currencies are recognised in profit or loss.
CONTINUED
For
per
sona
l use
onl
y
29FIRST GRAPHENE
ANNUAL REPORT 2018
Notes to the ConsolidatedFinancial Statements
1. Basis of Preparation (Continued)
Foreign currency translation (Continued)
Foreign operationsThe assets and liabilities of foreign operations are translated into Australian dollars using the exchange rates at the reporting date. The revenues and expenses of foreign operations are translated into Australian dollars using the average exchange rates, which approximate the rate at the date of the transaction, for the period. All resulting foreign exchange differences are recognised in other comprehensive income through the foreign currency reserve in equity.
The foreign currency reserve is recognised in profit or loss when the foreign operation or net investment is disposed of.
Other accounting policiesSignificant and other accounting policies that summarise the measurement basis used and are relevant to an understanding of the financial statements are provided throughout the notes to the financial statements. Where possible, wording has been simplified to provide clearer commentary on the financial report of the Group. Accounting policies determined non-significant are not included in the financial statements. There have been no changes to the Group’s accounting policies that are no longer disclosed in the financial statements.
Key estimates and judgementsIn the process of applying the Group’s accounting policies, management has made a number of judgements and applied estimates of future events. Judgements and estimates which are material to the financial report are found in the following notes.
Note 3 Expenses Page 32
Note 7 Inventories Page 35
Note 9 Exploration and evaluation assets Page 36
Note 9 Impairment Page 36
Note 16 Share-based payments Page 48
Note 25 Asset aquisition and determination of control over Graphene Solutions Pty Ltd Page 56
The notes to the financial statementsThe notes include information which is required to understand the financial statements and is material and relevant to the operations and the financial position and performance of the Group. Information is considered relevant and material if, for example:
• the amount is significant due to its size or nature;
• the amount is important for understanding the results of the Group;
• it helps to explain the impact of significant changes in the Group’s business; or
• it relates to an aspect of the Group’s operations that is important to its future performance.
The notes are organised into the following sections:
• Performance for the year;
• Operating assets and liabilities;
• Capital structure and risk;
• Other disclosures.
A brief explanation is included under each section.
CONTINUED
For
per
sona
l use
onl
y

30FIRST GRAPHENE ANNUAL REPORT 2018
Notes to the ConsolidatedFinancial Statements
Performance For the YearThis section focuses on the results and performance of the Group. This covers both profitability and the resultant return to shareholders via earnings per share combined with cash generation.
2. Segment reportingIdentification of reportable segmentsThe Group has identified its operating segments based on the internal reports which are reviewed and used by the Board (the chief operating decision makers) in assessing performance and in determining the allocation of resources.
The existing operating segments are identified by management based on the manner in which the Group’s operations were carried out during the financial year. Discrete financial information about each of these operating businesses is reported to the Board on a monthly basis.
The reportable segments are based on aggregated operating segments determined by the similarity of the asset base and revenue or income streams, as these are the sources of the Group’s major risks and have the most effect on the rates of return. The Group’s segment information for the current reporting period is reported based on the following segments:
Technical research activitiesThe Board has defined a new reportable segment for the current year, being technical research related to the graphene production facilities. As the Company expands its research inhouse and in conjunction with third parties, the Board monitors the Company based on actual verses budgeted expenditure incurred.
Mining and exploration activitiesThe Board has determined the Company previously had one reportable segment, being mineral exploration and development in Sri Lanka. As the Company is focused on mineral exploration, the Board monitors the Company based on actual verses budgeted exploration expenditure incurred by area of interest.
Corporate servicesThis segment reflects the overheads associated with maintaining the ASX listed FGR corporate structure, identification of new assets and general management of an ASX listed entity.
Business Segment
Mining and Exploration Technical Corporate Services Total
2018 2017 2018 2017 2018 2017 2018 2017
A$ A$ A$ A$ A$ A$ A$ A$
Revenue from external customers - - - - - - - -
Interest revenue 2,440 2,459 99 - 8,763 8,133 11,322 10,592
Operating loss (1,652,165) (3,091,732) (2,364,025) - (3,008,422) (1,168,228) (7,024,612) (4,259,960)
Depreciation expense 151,350 74,396 54,284 - 2,547 59,502 208,181 128,092
Amortisation expense 21,990 28,374 - - - - 21,990 34,180
Segment assets 2,214,419 2,755,458 2,143,216 - 4,672,788 4,406,232 9,030,423 7,161,690
Segment liabilities 34,522 124,596 520,953 - 1,574,704 949,736 2,130,178 1,074,332
CONTINUED
For
per
sona
l use
onl
y

31FIRST GRAPHENE
ANNUAL REPORT 2018
Notes to the ConsolidatedFinancial Statements
2. Segment reporting (Continued)
Geographical areasIn presenting the information on the basis of geographical areas, segment revenue is based on the geographical location of operations. Segment assets are based on the geographical location of the assets.
2018 2017
Geographical segments Revenue Total Assets - Total Assets
Australia - 8,714,548 - 4,207,041
Sri Lanka - 315,875 - 486,077
Total - 9,030,423 - 7,161,690
Reconciliation of segment assets and liabilities to the Statement of financial Position
Reconciliation of segment assets to the Statement of Financial Position
2018 2017
Total segments assets 10,222,216 12,815,248
Inter-segment elimination (1,191,793) (5,653,558)
Total assets per statement of financial position 9,030,423 7,161,690
Reconciliation of segment liabilities to the Statement of Financial Position
2018 2017
Total segments liabilities 9,025,748 6,973,352
Inter-segment elimination (6,895,570) (5,719,020)
Total liabilities per statement of financial position 2,130,178 1,074,332
3. Operating profit and finance income and expenseAccounting PolicyInterest revenue is recognised on a proportional basis taking into account the interest rates applicable to the financial assets.
Dividend revenue is recognised when the right to receive a dividend has been established. Dividends received from associates and joint venture entities are accounted for in accordance with the equity method of accounting.
All revenue is stated net of the amount of goods and services tax (GST).
Other revenue includes R&D credits received from the Australian tax government.
Government GrantsGrants from the government are recognised at their fair value where there is a reasonable assurance that the grant will be received and the Group satisfies all attached conditions.
When the grant relates to an expense item, it is recognised as income over the periods necessary to match the grant on a systematic basis to the costs that it is intended to compensate.
When the grant relates to an asset, the fair value is credited against the asset and is released to the Statement of Profit or Loss and Other Comprehensive Income over the expected useful life of the relevant asset by equal annual instalments.
CONTINUED
For
per
sona
l use
onl
y

32FIRST GRAPHENE ANNUAL REPORT 2018
Notes to the ConsolidatedFinancial Statements
3. Operating profit and finance income and expense (Continued)
Government Grants (Continued)Where a grant is received in relation to the tax benefit of research and development costs, the grant shall be credited to income tax expense in the Statement of Profit or Loss and Other Comprehensive Income in the year of receipt.
Depreciation is calculated on a straight-line basis to write off the net cost of each item of property, plant and equipment (excluding land) over their expected useful lives as follows:
Plant and equipment 3-7 years
The residual values, useful lives and depreciation methods are reviewed, and adjusted if appropriate, at each reporting date.
Revenue and expenses from continuing operations
Notes 2018 2017
(a) Other revenue – R&D grantR&D grant revenue 921,238 362,975
Profit on sale of motor vehicle 20,814 -
942,052 362,975
(b) Administrative expenses include:Financial administration and other consultancy 155,114 109,232
Directors fee and directors consulting fee 718,402 431,311
Audit and accounting fees 38,286 35,218
Other accounting services 23,829 18,540
ASX listing and share registry fees 167,314 105,476
Travel and accommodation 54,848 58,905
(c) Employee benefits expenseAs at 30 June 2018: 44 employees remained within the group (2017: 44) 66,326 66,099
(d) Development mining expenses includes:Director and consultants’ fees 367,811 446,777
(e) Technical research expenses include:Director and consultants’ fees 379,811 -
University research costs 1,338,000 -
(f) Share based paymentsOptions granted to directors 544,000 -
Options granted to Traxys 225,000 -
Options issued to consultants 94,679 -
Options granted to employees - 38,500
Options issued to Kremford (Vic) Pty Ltd 225,000 -
Shares issued to Kremford (Vic) Pty Ltd 170,000 -
1,258,679 38,500
(g) Finance income and expenseInterest income on bank deposits 11,322 10,592
Foreign exchange (loss)/gain – realised (4,760) (28,733)
Foreign exchange (loss)/gain – unrealised (9,723) -
Finance cost of Trayx liability (79,787) -
(82,948) (18,141)
CONTINUED
For
per
sona
l use
onl
y

33FIRST GRAPHENE
ANNUAL REPORT 2018
Notes to the ConsolidatedFinancial Statements
4. Income taxAccounting Policy
Current TaxCurrent tax is the expected tax payable on the taxable income for the year, using tax rates enacted or substantially enacted at the reporting date, and any adjustment to tax payable in respect of previous years. The major components of income tax expense are:
A reconciliation between tax expense and the product of accounting profit before income tax multiplied by the Group’s applicable income tax rate is as follows:
2018 2017
Total loss before income tax from all activities (7,024,598) (4,529,860)
Prima facie tax benefit on loss before income tax at 28.5% (2017: 30%) (2,107,380) (1,277,988)
Unrecognised temporary differences 365,464 -
Unrecognised tax losses 1,741,916 -
Income tax expense - -
Income tax expense from continuing activities - -
Total income tax expense - -
Unused tax losses for which no deferred tax has been recognised (13,338,854) (15,085,217)
Potential tax benefit at 30% (4,001,656) (4,522,565)
The Group has Australian revenue losses from previous years for which no deferred tax assets have been recognised. The availability to utilise these losses in future periods is subject to review in the relevant jurisdictions.
CONTINUED
For
per
sona
l use
onl
y

34FIRST GRAPHENE ANNUAL REPORT 2018
Notes to the ConsolidatedFinancial Statements
5. Earnings per shareAccounting PolicyEarnings per share (“EPS”) is the amount of post-tax profit attributable to each share. The group presents basic and diluted EPS data for ordinary shares. Basic EPS is calculated by dividing the profit or loss attributable to ordinary shareholders of the Company by the weighted average number of ordinary shares outstanding during the period.
Diluted EPS takes into account the dilutive effect of all potential ordinary shares, being unlisted employee share options on issue.
2018 2017
A$ A$
Loss attributable to the owners of First Graphene used in calculating basic loss per share (6,204,170) (4,259,960)
Loss attributable to the owners of First Graphene used in calculating diluted loss per share (6,204,170) (4,259,960)
Number of shares
Number of shares
Weighted average ordinary shares used in calculating basic earnings per share 376,470,853 322,686,238
Weighted average ordinary shares used in calculating diluted earnings per share 376,470,853 322,686,238
Basic loss per share - cents per share (1.65) (1.32)
Diluted loss per share - cents per share (1.65) (1.32)
There have been no transactions involving ordinary shares between the reporting date and the date of completion of these financial statements which would impact on the above EPS calculations.
6. Cash and cash equivalentsAccounting PolicyCash and cash equivalents in the balance sheet comprise cash at bank and in hand. Cash at bank earns interest at floating rates based on daily bank deposit rates.
For the purposes of the cash flow statement, cash and cash equivalents comprise the following at the end of the reporting period:
2018 2017
A$ A$
Cash at bank and in hand 4,838,929 4,175,134
4,838,929 4,175,134
The Group’s maximum exposure to financial risk is disclosed in note 14.
CONTINUED
For
per
sona
l use
onl
y
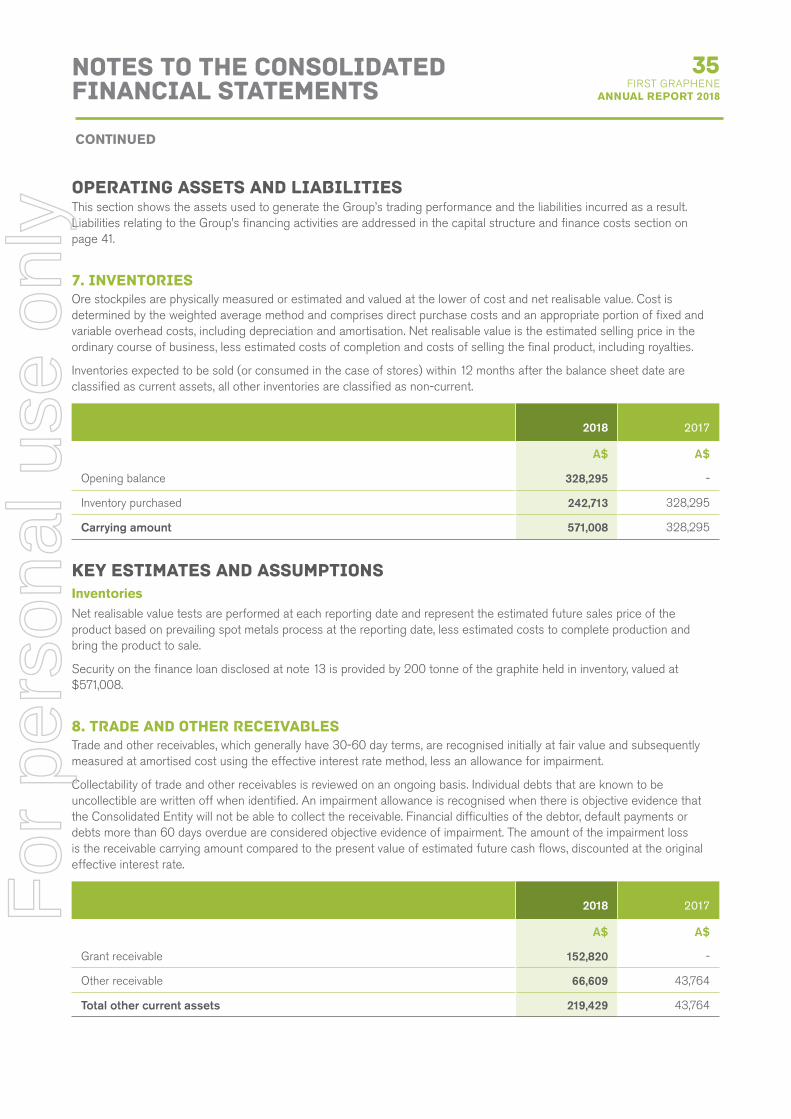
35FIRST GRAPHENE
ANNUAL REPORT 2018
Notes to the ConsolidatedFinancial Statements
OPERATING ASSETS AND LIABILITIESThis section shows the assets used to generate the Group’s trading performance and the liabilities incurred as a result. Liabilities relating to the Group’s financing activities are addressed in the capital structure and finance costs section on page 41.
7. InventoriesOre stockpiles are physically measured or estimated and valued at the lower of cost and net realisable value. Cost is determined by the weighted average method and comprises direct purchase costs and an appropriate portion of fixed and variable overhead costs, including depreciation and amortisation. Net realisable value is the estimated selling price in the ordinary course of business, less estimated costs of completion and costs of selling the final product, including royalties.
Inventories expected to be sold (or consumed in the case of stores) within 12 months after the balance sheet date are classified as current assets, all other inventories are classified as non-current.
2018 2017
A$ A$
Opening balance 328,295 -
Inventory purchased 242,713 328,295
Carrying amount 571,008 328,295
Key estimates and assumptionsInventoriesNet realisable value tests are performed at each reporting date and represent the estimated future sales price of the product based on prevailing spot metals process at the reporting date, less estimated costs to complete production and bring the product to sale.
Security on the finance loan disclosed at note 13 is provided by 200 tonne of the graphite held in inventory, valued at $571,008.
8. Trade and other receivablesTrade and other receivables, which generally have 30-60 day terms, are recognised initially at fair value and subsequently measured at amortised cost using the effective interest rate method, less an allowance for impairment.
Collectability of trade and other receivables is reviewed on an ongoing basis. Individual debts that are known to be uncollectible are written off when identified. An impairment allowance is recognised when there is objective evidence that the Consolidated Entity will not be able to collect the receivable. Financial difficulties of the debtor, default payments or debts more than 60 days overdue are considered objective evidence of impairment. The amount of the impairment loss is the receivable carrying amount compared to the present value of estimated future cash flows, discounted at the original effective interest rate.
2018 2017
A$ A$
Grant receivable 152,820 -
Other receivable 66,609 43,764
Total other current assets 219,429 43,764
CONTINUED
For
per
sona
l use
onl
y

36FIRST GRAPHENE ANNUAL REPORT 2018
Notes to the ConsolidatedFinancial Statements
9. Exploration and evaluation assetsAccounting PolicyExploration and evaluation expenditure is accumulated on an area of interest basis. Exploration and evaluation assets include the costs of acquiring licences, costs associated with exploration and evaluation activity, and the fair value (at acquisition date) of exploration and evaluation assets acquired in a business combination. Expenditure is carried forward when incurred in areas for which the Group has rights of tenure and where economic mineralisation is indicated, but activities have not yet reached a stage which permits a reasonable assessment of the existence or otherwise of economically recoverable reserves and active and significant operations in, or in relation to, the area of interest are continuing. Costs incurred before the Group has obtained the legal rights to explore an area are recognised in the statement of comprehensive income.
Once the technical feasibility and commercial viability of the extraction of mineral resources in an area of interest are demonstrable, exploration and evaluation assets attributable to that area of interest are first tested for impairment and then reclassified to mine properties under development. No amortisation is charged during the exploration and evaluation phase.
2018 2017
A$ A$
Opening balance 1,818,355 1,848,446
Foreign currency translation adjustment 5,762 (30,091)
Carrying amount 1,824,117 1,818,355
The recoverability of exploration and evaluation assets is dependent on the successful development and commercial exploitation or sale of the respective areas of interest.
ImpairmentExploration and evaluation assets are assessed for impairment if (i) sufficient data exists to determine technical feasibility and commercial viability, and (ii) facts and circumstances suggest that the carrying amount exceeds the recoverable amount. For the purposes of impairment testing, exploration and evaluation assets are allocated to cash-generating units (“CGUs”) to which the exploration activity relates. The CGU is not larger than the area of interest.
Key estimates and assumptionsImpairment of exploration and evaluation assetsThe future recoverability of capitalised exploration and evaluation expenditure is dependent upon a number of factors, including whether the Group decides to exploit the related lease itself or, if not, whether it successfully recovers the related exploration and evaluation asset through sale.
Factors that could impact future recoverability include the level of reserves and resources, future technological changes which could impact the cost of mining, future legal changes (including changes to environmental restoration obligations) and changes to commodity prices. The Company does not have a JORC compliant resource and as a result has decided not to capitalise any expenditures at this point in its development process.
To the extent that capitalised exploration and evaluation expenditure is determined not to be recoverable in the future, profits and net assets will be reduced in the period in which the determination is made.
CONTINUED
For
per
sona
l use
onl
y

37FIRST GRAPHENE
ANNUAL REPORT 2018
Notes to the ConsolidatedFinancial Statements
10. Property, plant and equipmentAccounting PolicyPlant and equipment is stated at historical cost less accumulated depreciation and impairment. Historical cost includes expenditure which is directly attributable to the acquisition of the items.
Depreciation is calculated on a straight-line basis to write off the net cost of each item of property, plant and equipment (excluding land) over their expected useful lives as follows:
Plant and equipment 3-7 years
The residual values, useful lives and depreciation methods are reviewed, and adjusted if appropriate, at each reporting date.
Leasehold improvements and plant and equipment under lease are depreciated over the unexpired period of the lease or the estimated useful life of the assets, whichever is shorter.
An item of property, plant and equipment is derecognised upon disposal or when there is no future economic benefit to the consolidated entity Gains and losses between the carrying amount and the disposal proceeds are taken to the profit or loss. Any revaluation surplus reserve relating to the item disposed of is transferred directly to retained profits.
Reconciliations of the carrying value for each class of property, plant and equipment is set out below:
CONTINUED
For
per
sona
l use
onl
y

38FIRST GRAPHENE ANNUAL REPORT 2018
Notes to the ConsolidatedFinancial Statements
2018 2017
A$ A$
Exploration equipment
Carrying amount at beginning of year 167,365 241,791
- Additions - -
- Transfer from Capital Work in Progress - -
- Depreciation (68,011) (71,434)
- Movement due to foreign exchange (415) (2,992)
Carrying amount at year end 98,939 167,365
Leasehold Improvement
Carrying amount at beginning of year 91,853 -
Additions - 110,413
Depreciation (45,566) (15,309)
Movement due to foreign exchange (721) (3,251)
Carrying amount at year end 45,566 91,853
Plant & equipment
Carrying amount at beginning of year 87,189 15,680
- Additions 941,956 104,859
- Transfer to Office Equipment (3,941)
- Depreciation (79,862) (30,506)
- Movement due to foreign exchange (509) (2,844)
Carrying amount at year end 944,833 87,189
CONTINUED
For
per
sona
l use
onl
y
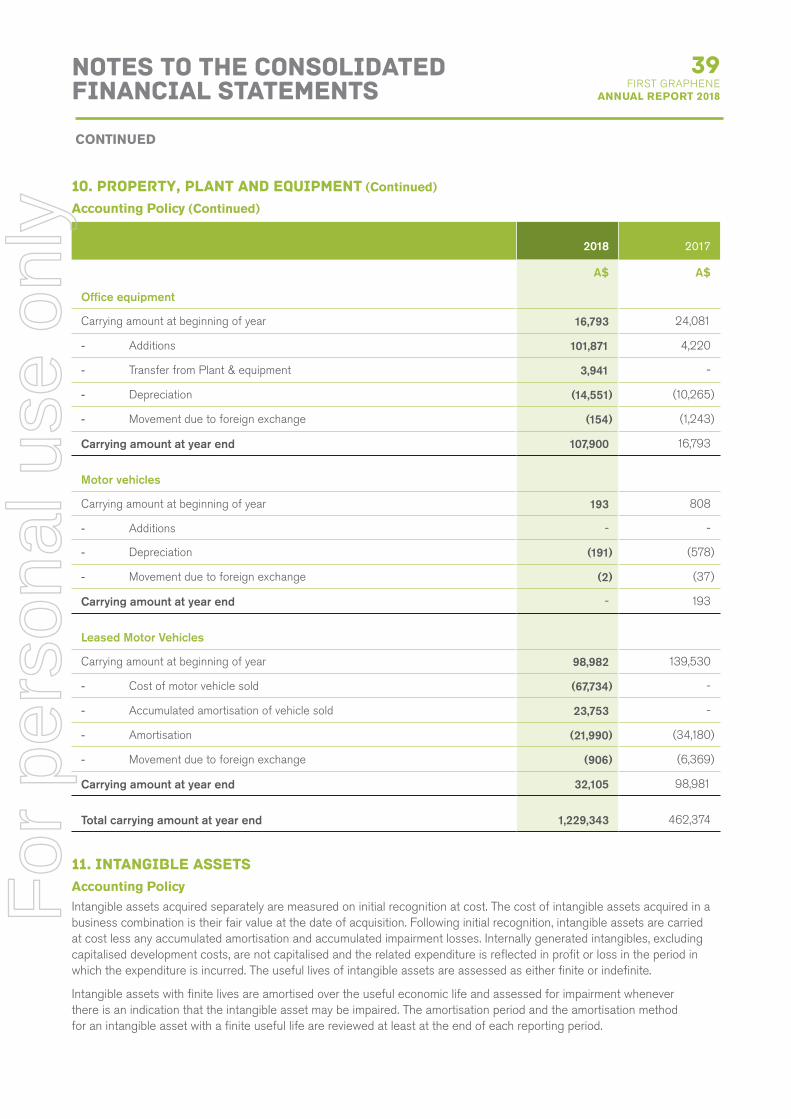
39FIRST GRAPHENE
ANNUAL REPORT 2018
Notes to the ConsolidatedFinancial Statements
10. Property, plant and equipment (Continued)
Accounting Policy (Continued)
2018 2017
A$ A$
Office equipment
Carrying amount at beginning of year 16,793 24,081
- Additions 101,871 4,220
- Transfer from Plant & equipment 3,941 -
- Depreciation (14,551) (10,265)
- Movement due to foreign exchange (154) (1,243)
Carrying amount at year end 107,900 16,793
Motor vehicles
Carrying amount at beginning of year 193 808
- Additions - -
- Depreciation (191) (578)
- Movement due to foreign exchange (2) (37)
Carrying amount at year end - 193
Leased Motor Vehicles
Carrying amount at beginning of year 98,982 139,530
- Cost of motor vehicle sold (67,734) -
- Accumulated amortisation of vehicle sold 23,753 -
- Amortisation (21,990) (34,180)
- Movement due to foreign exchange (906) (6,369)
Carrying amount at year end 32,105 98,981
Total carrying amount at year end 1,229,343 462,374
11. Intangible assetsAccounting PolicyIntangible assets acquired separately are measured on initial recognition at cost. The cost of intangible assets acquired in a business combination is their fair value at the date of acquisition. Following initial recognition, intangible assets are carried at cost less any accumulated amortisation and accumulated impairment losses. Internally generated intangibles, excluding capitalised development costs, are not capitalised and the related expenditure is reflected in profit or loss in the period in which the expenditure is incurred. The useful lives of intangible assets are assessed as either finite or indefinite.
Intangible assets with finite lives are amortised over the useful economic life and assessed for impairment whenever there is an indication that the intangible asset may be impaired. The amortisation period and the amortisation method for an intangible asset with a finite useful life are reviewed at least at the end of each reporting period.
CONTINUED
For
per
sona
l use
onl
y
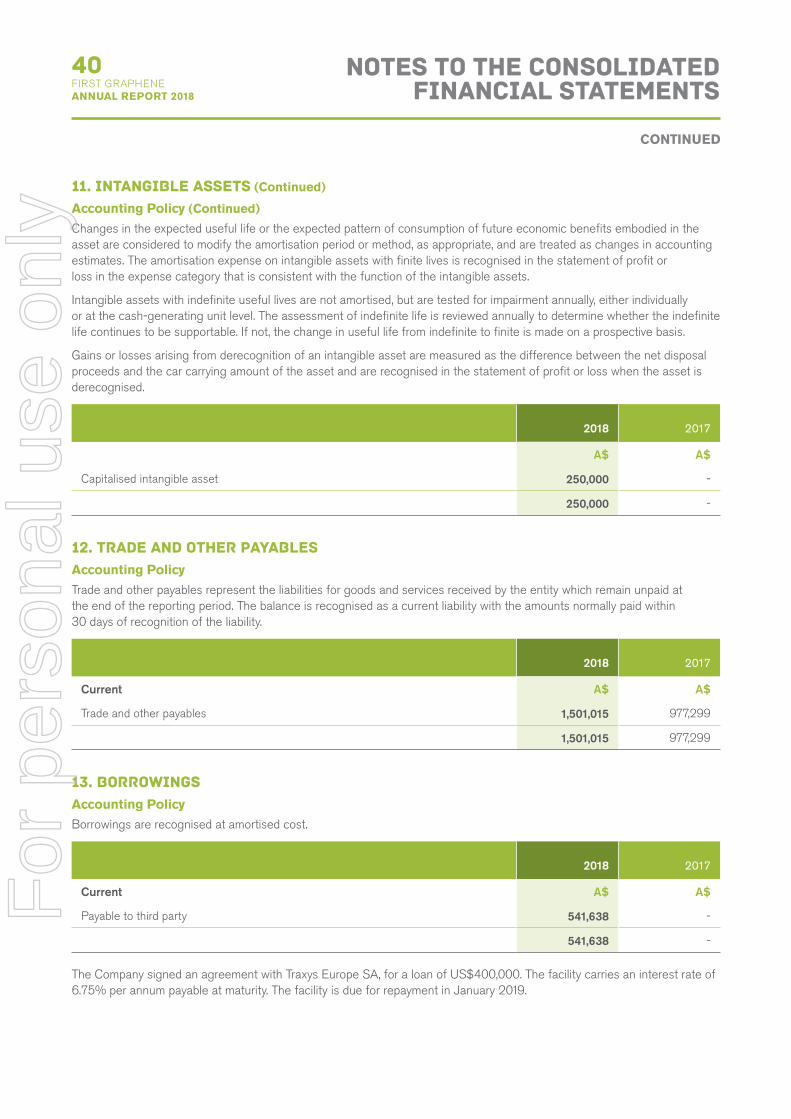
40FIRST GRAPHENE ANNUAL REPORT 2018
Notes to the ConsolidatedFinancial Statements
11. Intangible assets (Continued)
Accounting Policy (Continued)
Changes in the expected useful life or the expected pattern of consumption of future economic benefits embodied in the asset are considered to modify the amortisation period or method, as appropriate, and are treated as changes in accounting estimates. The amortisation expense on intangible assets with finite lives is recognised in the statement of profit or loss in the expense category that is consistent with the function of the intangible assets.
Intangible assets with indefinite useful lives are not amortised, but are tested for impairment annually, either individually or at the cash-generating unit level. The assessment of indefinite life is reviewed annually to determine whether the indefinite life continues to be supportable. If not, the change in useful life from indefinite to finite is made on a prospective basis.
Gains or losses arising from derecognition of an intangible asset are measured as the difference between the net disposal proceeds and the car carrying amount of the asset and are recognised in the statement of profit or loss when the asset is derecognised.
2018 2017
A$ A$
Capitalised intangible asset 250,000 -
250,000 -
12. Trade and other payablesAccounting PolicyTrade and other payables represent the liabilities for goods and services received by the entity which remain unpaid at the end of the reporting period. The balance is recognised as a current liability with the amounts normally paid within 30 days of recognition of the liability.
2018 2017
Current A$ A$
Trade and other payables 1,501,015 977,299
1,501,015 977,299
13. BorrowingsAccounting PolicyBorrowings are recognised at amortised cost.
2018 2017
Current A$ A$
Payable to third party 541,638 -
541,638 -
The Company signed an agreement with Traxys Europe SA, for a loan of US$400,000. The facility carries an interest rate of 6.75% per annum payable at maturity. The facility is due for repayment in January 2019.
CONTINUED
For
per
sona
l use
onl
y

41FIRST GRAPHENE
ANNUAL REPORT 2018
Notes to the ConsolidatedFinancial Statements
CAPITAL STRUCTURE, FINANCIAL INSTRUMENTS AND RISKThis section outlines how the Group manages its capital, related financing costs and its exposure to various financial risks. It explains how these risks affect the Group’s financial position and performance and what the Group does to manage these risks.
The Group’s objectives when managing capital are to safeguard its ability to continue as a going concern, so that it can continue to provide returns to shareholders and benefits for other stakeholders and to maintain an efficient capital structure to reduce the cost of capital.
The Board’s policy in relation to capital management is to regularly and consistently monitor future cash flows against expected expenditures for a rolling period of up to 12 months in advance. The Board determines the Group’s need for additional funding by way of either share issues or loan funds depending on market conditions at the time. The Board defines working capital in such circumstances as its excess liquid funds over liabilities, and defines capital as being the ordinary share capital of the Company, plus retained earnings, reserves and net debt. In order to maintain or adjust the capital structure, the Board may adjust the amount of dividends paid to shareholders, return capital to shareholders, issue new shares or reduce debt.
There were no changes in the Group’s approach to capital management during the year.
Neither the Company nor any of its subsidiaries are subject to externally imposed capital requirements.
14. Financial Risk Management(a) Financial risk managementThe Group’s activities expose it to a variety of financial risks: credit risk, liquidity risk and market risk (currency risk and interest rate risk). The Group’s principal financial liabilities comprise trade and other payables. The main purpose of these financial liabilities is to raise finance for the Group’s operations. The Group has various financial assets such as trade and other receivables, deposits with banks, local money market instruments and short-term investments.
Financial risk management structure:Board of DirectorsThe Board is ultimately responsible for ensuring there are adequate policies in relation to risk oversight and management and internal control systems. The Group’s policies are designed to ensure financial risks are identified, assessed, addressed and monitored to enable achievement of the Group’s business objectives.
(b) Financial risks
Credit riskCredit risk refers to the risk a counterparty will default on its contractual obligation resulting in financial loss to the Group. Credit risk is managed on a group basis and structures the levels of credit risk it accepts by placing limits on its exposure to a single counterparty or group of counterparties. The Group has no significant concentrations of credit risk.
It is the Group’s policy to place funds generated internally and from deposits with clients with high quality financial institutions. The Group does not employ a formalised internal ratings system for the assessment
of credit exposures. Amounts due from and to clients and dealers represents receivables sold and payables for securities purchased which have been contracted for but not yet settled on the reporting date, respectively. The majority of these transactions are carried out on a delivery versus payment basis, which results in securities and cash being exchanged within a very close timeframe. Settlement balances outside standard terms are monitored on a daily basis.
Exposure to credit riskThe maximum exposure to credit risk, excluding the value of any collateral or other security, at the reporting date to recognised financial assets, is the carrying amount, net of any provision for impairment of those assets, as disclosed in the statement of financial position and the notes to the financial statements. The Group does not have any material credit risk exposure to any single receivable or group of receivables under financial instruments entered into by the Group.
CONTINUED
For
per
sona
l use
onl
y

42FIRST GRAPHENE ANNUAL REPORT 2018
Notes to the ConsolidatedFinancial Statements
14. Financial Risk Management (Continued)
Exposure to credit risk (Continued)The Group’s maximum exposure to credit risk without taking account of any collateral or other credit enhancements at the reporting date was $4,838,929 (2017: $4,175,134).
The Company banks with Westpac Banking Corporation (Westpac). Moody’s has Westpac’s Long Term Counterparty Risk Rating as Aa2 and not on watch as at 15 June 2018
Group
2018 2017
Cash and cash equivalents 4,838,929 4,175,134
4,838,929 4,175,134
Impairment and provisioning policiesImpairment provisions are recognised for financial reporting purposes only for losses which have been incurred at the reporting date, based on objective evidence of impairment. All credit exposures are reviewed at least annually. Impairment allowances on credit exposures are determined by an evaluation of the incurred loss at the reporting date. For the purposes of the Group’s disclosures regarding credit quality, its financial assets have been analysed as follows:
Neither past
due nor individually
impaired
Past due but not
individually impaired
Individually impaired Total
Impairment allowance
Total carrying amount
Consolidated 30 June 2018 $ $ $ $ $ $
Cash and cash equivalents 4,838,929 - - 4,838,929 - 4,838,929
4,838,929 - - 4,838,929 - 4,838,929
Consolidated 30 June 2017 $ $ $ $ $ $
Cash and cash equivalents 4,175,134 - - 4,175,134 - 4,175,134
4,175,134 - - 4,175,134 - 4,175,134
Financial assets past due but not individually impairedFor the purpose of this analysis an asset is considered past due when any payment due under the contractual terms is received one day past the contractual due date. The majority of these transactions are carried out on a delivery versus payment basis, which results in securities and cash being exchanged within a very close timeframe. Settlement balances outside standard terms are monitored on a daily basis. Credit risk is also mitigated as securities held for the counterparty by the Group can ultimately be sold should the counterparty default. There were no renegotiated financial assets during the year.
Collateral pledged or heldThere is no collateral held as security by the Group or its controlled entities.
CONTINUED
For
per
sona
l use
onl
y

43FIRST GRAPHENE
ANNUAL REPORT 2018
Notes to the ConsolidatedFinancial Statements
14. Financial Risk Management (Continued)
Liquidity riskLiquidity risk is the risk the Group will not be able to meet its financial obligations as they fall due. The Group manages liquidity risk by monitoring forecast cash requirements and cash flows.
The primary objective of the Group is to manage short-term liquidity requirements in such a way as to minimise financial risk. The Group maintains sufficient cash resources to meet its obligations, cash deposits are repayable on demand.
The tables below present the cash flows receivable and payable by the Group under financial assets and liabilities by remaining contractual maturities at the reporting date. The amounts disclosed are the contractual, undiscounted cash flows.
Weighted average effective interest
rate
Floating interest
rateWithin one
year
Fixed interest Non-interest bearing
Within one year
1-5 years
Within one year
1-5 years Total
30 June 2018 % $ $ $ $ $ $
Financial assets
Cash and cash equivalents 0.46 4,838,929 - - - - 4,838,929
Total Financial assets at 30 June 2018 4,838,929 - - - - 4,838,929
Financial liabilities
Trade and other payables - - - 1,501,015 - 1,501,015
Borrowings - - - 541,638 - 541,638
Total financial liabilities at 30 June 2018 - - - 2,042,653 - 2,042,653
30 June 2017 % $ $ $ $ $ $
Financial assets
Cash and cash equivalents 0.49 4,175,134 - - - - 4,175,134
Total Financial assets at 30 June 2017 4,175,134 -- - - - 4,175,134
Financial liabilities
Trade and other payables - - - 977,299 - 977,299
Total financial liabilities at 30 June 2017 - - - 977,299 - 977,299
CONTINUED
For
per
sona
l use
onl
y
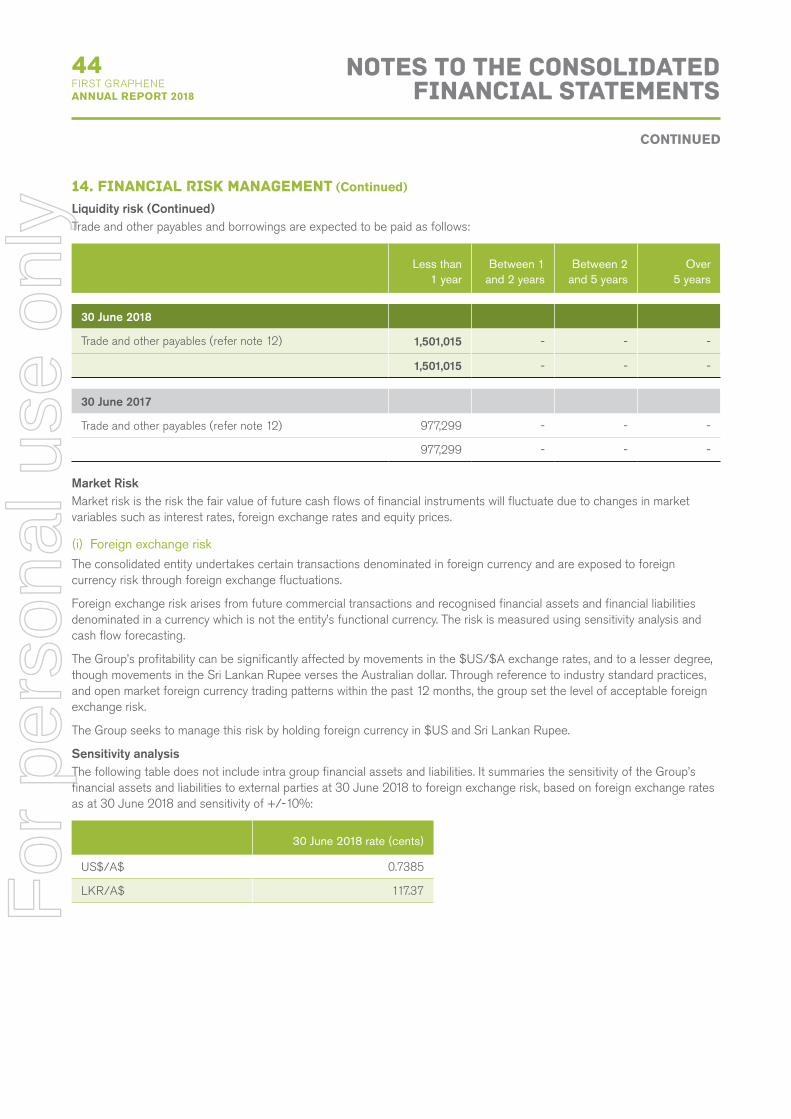
44FIRST GRAPHENE ANNUAL REPORT 2018
Notes to the ConsolidatedFinancial Statements
14. Financial Risk Management (Continued)
Liquidity risk (Continued)Trade and other payables and borrowings are expected to be paid as follows:
Less than 1 year
Between 1 and 2 years
Between 2 and 5 years
Over 5 years
30 June 2018
Trade and other payables (refer note 12) 1,501,015 - - -
1,501,015 - - -
30 June 2017
Trade and other payables (refer note 12) 977,299 - - -
977,299 - - -
Market RiskMarket risk is the risk the fair value of future cash flows of financial instruments will fluctuate due to changes in market variables such as interest rates, foreign exchange rates and equity prices.
(i) Foreign exchange riskThe consolidated entity undertakes certain transactions denominated in foreign currency and are exposed to foreign currency risk through foreign exchange fluctuations.
Foreign exchange risk arises from future commercial transactions and recognised financial assets and financial liabilities denominated in a currency which is not the entity’s functional currency. The risk is measured using sensitivity analysis and cash flow forecasting.
The Group’s profitability can be significantly affected by movements in the $US/$A exchange rates, and to a lesser degree, though movements in the Sri Lankan Rupee verses the Australian dollar. Through reference to industry standard practices, and open market foreign currency trading patterns within the past 12 months, the group set the level of acceptable foreign exchange risk.
The Group seeks to manage this risk by holding foreign currency in $US and Sri Lankan Rupee.
Sensitivity analysisThe following table does not include intra group financial assets and liabilities. It summaries the sensitivity of the Group’s financial assets and liabilities to external parties at 30 June 2018 to foreign exchange risk, based on foreign exchange rates as at 30 June 2018 and sensitivity of +/-10%:
30 June 2018 rate (cents)
US$/A$ 0.7385
LKR/A$ 117.37
CONTINUED
For
per
sona
l use
onl
y

45FIRST GRAPHENE
ANNUAL REPORT 2018
Notes to the ConsolidatedFinancial Statements
14. Financial Risk Management (Continued)
Market Risk
Foreign exchange risk
2018 2017
Change in equity due to: A$ A$
Change in profit/loss due to:
Improvement in AUD by 5% (50,138) (85,727)
Decline in AUD by 5% 50,138 85,727
Change in equity due to:
Improvement in AUD by 5% (50,138) (85,727)
Decline in AUD by 5% 50,138 85,727
(ii) Interest rate risk
GroupThe Group’s exposure to the risk of changes in market interest rates relates primarily to the Group’s cash position. A change of 100 basis points in interest rates at the reporting date would result in a change of profit or loss by the amounts shown below. This analysis assumes all other factors remain constant.
ProfileAt reporting date the interest rate profile of the Group’s financial instruments was:
Interest rate risk
-10bps +10bps
Profit Equity Profit Equity
2018
Floating rate instruments A$
Cash at bank 4,838,929 (2,229) - 2,229 -
4,838,929 (2,229) - 2,229 -
2017
Floating rate instruments A$
Cash at bank 4,175,134 (2,021) - 2,021 -
4,175,134 (2,021) - 2,021 -
CONTINUED
For
per
sona
l use
onl
y
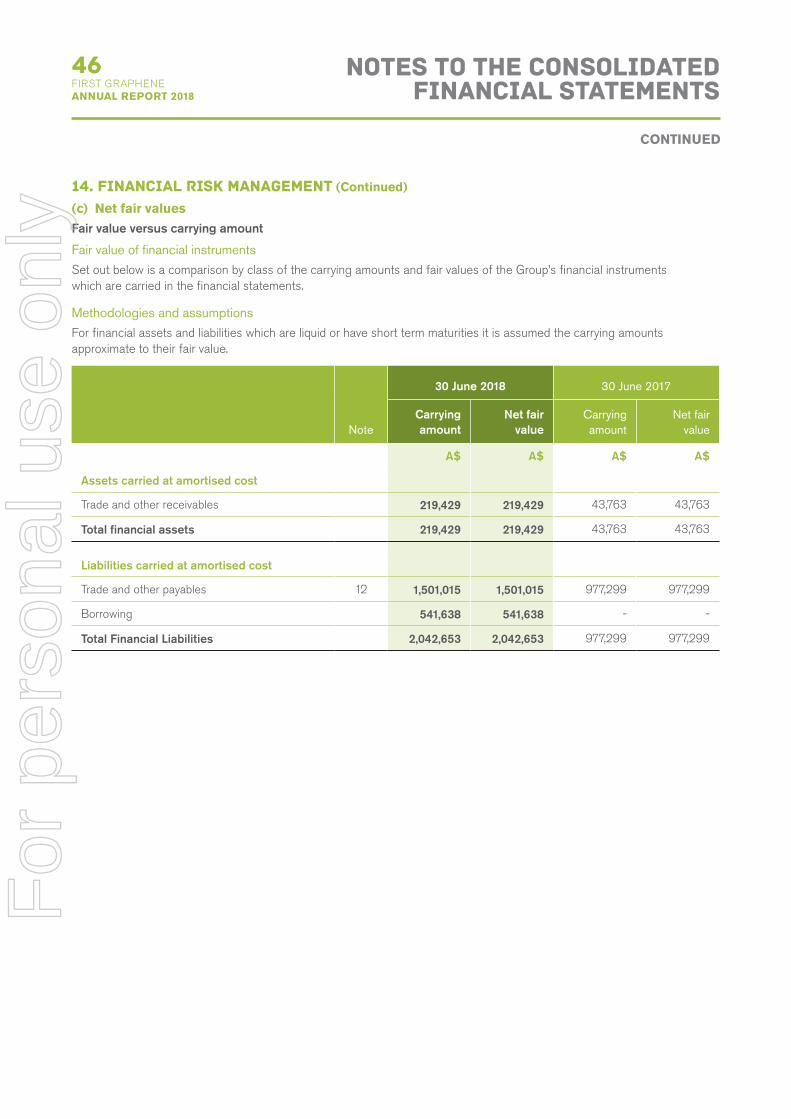
46FIRST GRAPHENE ANNUAL REPORT 2018
Notes to the ConsolidatedFinancial Statements
14. Financial Risk Management (Continued)
(c) Net fair valuesFair value versus carrying amount
Fair value of financial instrumentsSet out below is a comparison by class of the carrying amounts and fair values of the Group’s financial instruments which are carried in the financial statements.
Methodologies and assumptionsFor financial assets and liabilities which are liquid or have short term maturities it is assumed the carrying amounts approximate to their fair value.
Note
30 June 2018 30 June 2017
Carrying amount
Net fair value
Carrying amount
Net fair value
A$ A$ A$ A$
Assets carried at amortised cost
Trade and other receivables 219,429 219,429 43,763 43,763
Total financial assets 219,429 219,429 43,763 43,763
Liabilities carried at amortised cost
Trade and other payables 12 1,501,015 1,501,015 977,299 977,299
Borrowing 541,638 541,638 - -
Total Financial Liabilities 2,042,653 2,042,653 977,299 977,299
CONTINUED
For
per
sona
l use
onl
y

47FIRST GRAPHENE
ANNUAL REPORT 2018
Notes to the ConsolidatedFinancial Statements
15. Issued capitalAccounting PolicyOrdinary shares are classified as equity. Transaction costs directly attributable to the issue of shares or options are recognised as a deduction from equity, net of any related income tax effects.
(a) Ordinary shares 2018 2017 2018 2017
A$ A$ Number Number
Issued and fully paid 79,104,128 73,091,669 403,784,541 364,261,237
Movements in shares on issue
At the beginning of the period 73,091,669 67,328,257 364,261,237 306,977,307
Issue to Kremford under agreement 170,000 - 2,000,000 -
Exercise of options at $0.092 690,000 - 7,500,000 -
Exercise of options at $0.15 5,162 - 34,415 -
Placement to investors March 2018 3,400,000 - 18,888,889 -
Placement to investors June 2018 1,998,000 - 11,100,000 -
Share issue costs (250,703) (284,481) - -
Exercise of options at $0.10 - 2,321,393 - 23,213,930
Issue to supplier1 - 30,000 - 220,000
Placement to investors February 2017 - 3,520,000 - 32,000,000
Shares issued to senior employee & consultants - 38,500 - 350,000
Exercise of options at $0.092 - 138,000 - 1,500,000
At the end of the period 79,104,128 73,091,669 403,784,541 364,261,237
1 Issued to supplier at agreed value
CONTINUED
For
per
sona
l use
onl
y
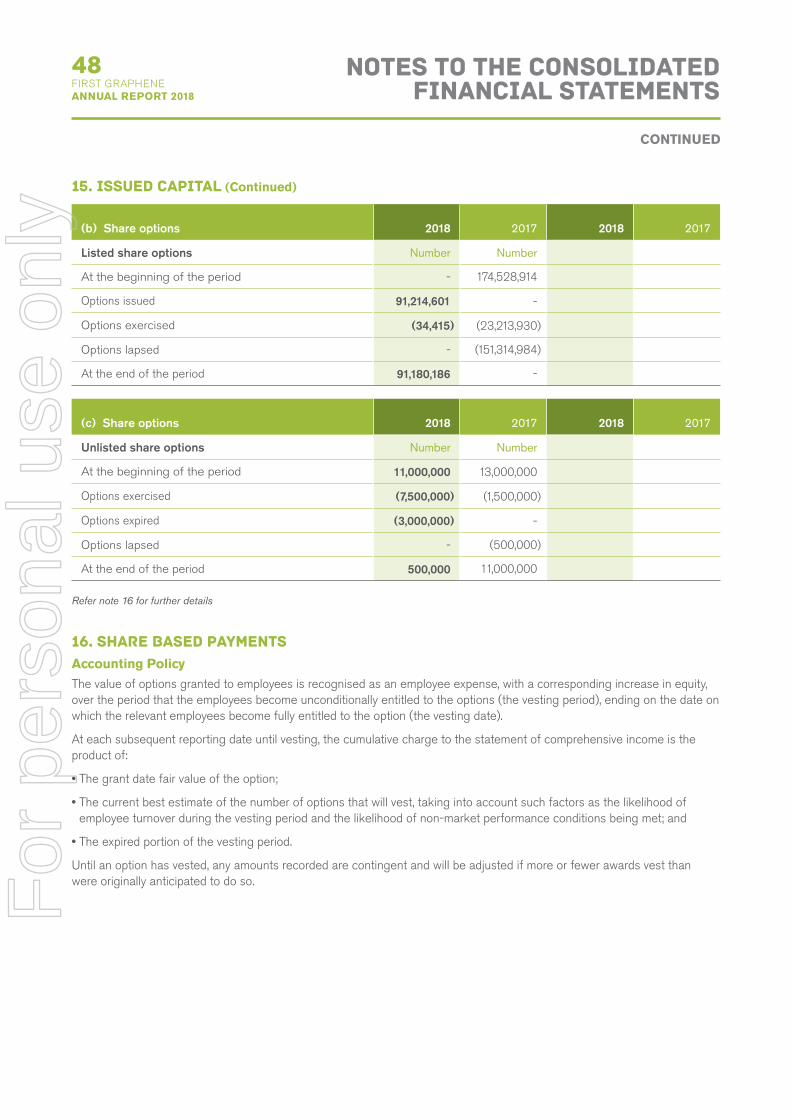
48FIRST GRAPHENE ANNUAL REPORT 2018
Notes to the ConsolidatedFinancial Statements
15. Issued capital (Continued)
(b) Share options 2018 2017 2018 2017
Listed share options Number Number
At the beginning of the period - 174,528,914
Options issued 91,214,601 -
Options exercised (34,415) (23,213,930)
Options lapsed - (151,314,984)
At the end of the period 91,180,186 -
(c) Share options 2018 2017 2018 2017
Unlisted share options Number Number
At the beginning of the period 11,000,000 13,000,000
Options exercised (7,500,000) (1,500,000)
Options expired (3,000,000) -
Options lapsed - (500,000)
At the end of the period 500,000 11,000,000
Refer note 16 for further details
16. Share based paymentsAccounting PolicyThe value of options granted to employees is recognised as an employee expense, with a corresponding increase in equity, over the period that the employees become unconditionally entitled to the options (the vesting period), ending on the date on which the relevant employees become fully entitled to the option (the vesting date).
At each subsequent reporting date until vesting, the cumulative charge to the statement of comprehensive income is the product of:
• The grant date fair value of the option;
• The current best estimate of the number of options that will vest, taking into account such factors as the likelihood of employee turnover during the vesting period and the likelihood of non-market performance conditions being met; and
• The expired portion of the vesting period.
Until an option has vested, any amounts recorded are contingent and will be adjusted if more or fewer awards vest than were originally anticipated to do so.
CONTINUED
For
per
sona
l use
onl
y
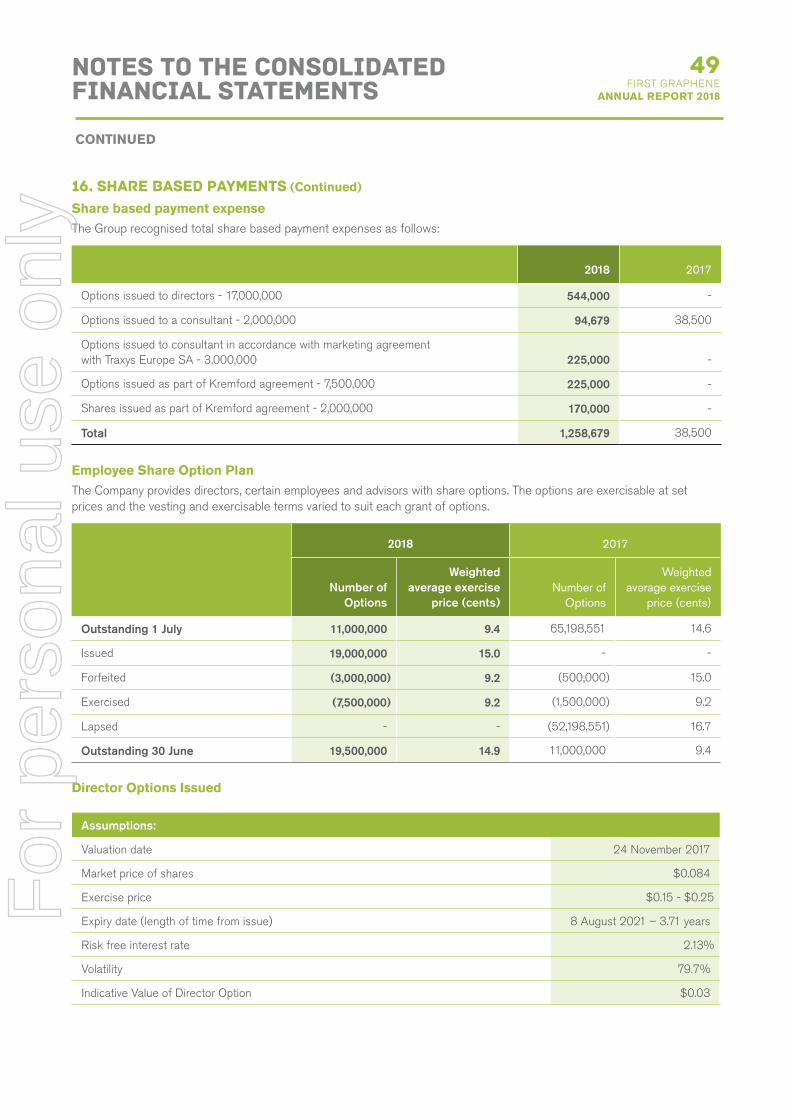
49FIRST GRAPHENE
ANNUAL REPORT 2018
Notes to the ConsolidatedFinancial Statements
16. Share based payments (Continued)
Share based payment expenseThe Group recognised total share based payment expenses as follows:
2018 2017
Options issued to directors - 17,000,000 544,000 -
Options issued to a consultant - 2,000,000 94,679 38,500
Options issued to consultant in accordance with marketing agreement with Traxys Europe SA - 3,000,000 225,000 -
Options issued as part of Kremford agreement - 7,500,000 225,000 -
Shares issued as part of Kremford agreement - 2,000,000 170,000 -
Total 1,258,679 38,500
Employee Share Option PlanThe Company provides directors, certain employees and advisors with share options. The options are exercisable at set prices and the vesting and exercisable terms varied to suit each grant of options.
2018 2017
Number of Options
Weighted average exercise
price (cents)Number of
Options
Weighted average exercise
price (cents)
Outstanding 1 July 11,000,000 9.4 65,198,551 14.6
Issued 19,000,000 15.0 - -
Forfeited (3,000,000) 9.2 (500,000) 15.0
Exercised (7,500,000) 9.2 (1,500,000) 9.2
Lapsed - - (52,198,551) 16.7
Outstanding 30 June 19,500,000 14.9 11,000,000 9.4
Director Options Issued
Assumptions:
Valuation date 24 November 2017
Market price of shares $0.084
Exercise price $0.15 - $0.25
Expiry date (length of time from issue) 8 August 2021 – 3.71 years
Risk free interest rate 2.13%
Volatility 79.7%
Indicative Value of Director Option $0.03
CONTINUED
For
per
sona
l use
onl
y

50FIRST GRAPHENE ANNUAL REPORT 2018
Notes to the ConsolidatedFinancial Statements
Total Value of Director Options 544,000
- Mr Craig McGuckin 160,000
- Mr Peter Youd 160,000
- Mr Warwick Grigor 160,000
- Mr Chris Banasik 64,000
Consultant Options Issued
Assumptions:
Valuation date 31 October 2017
Market price of shares $0.098
Exercise price $0.15 - $0.25
Expiry date (length of time from issue) 8 August 2021 – 3.71 years
Risk free interest rate 2.03%
Volatility 79.67%
Indicative Value of Director Option $0.047
Total Value of Consultant Options 94,679
CONTINUED
For
per
sona
l use
onl
y

51FIRST GRAPHENE
ANNUAL REPORT 2018
Notes to the ConsolidatedFinancial Statements
16. Share based payments (Continued)
Share-based payments and options issued.The table below summarises options granted to directors, employees and consultants:
Grant Date
Expiry Date
Exercise price
Balance at start of the year
Granted during the year
Exercised during the year
Expired/ lapsed during the year
Balance at the end of the year
Vested and exercisable during the year
Number Number Number Number Number Number
Unlisted options:
11 Jan 2016
11 Jan 2019 $0.15 250,000 - - - 250,000 250,000
11 Jan 2016
11 Jan 2019 $0.10 250,000 - - - 250,000 250,000
31 Oct 2014
31 Oct 2017 $0.092 10,500,000 7,500,000 3,000,000 - -
Listed options:
31 July 2017
8 Aug 2021 Various - 7,500,000 - - 7,500,000 7,500,000
31 Oct 2017
8 Aug 2021 Various - 2,000,000 - - 2,000,000 2,000,000
24 Nov 2017
8 Aug 2021 Various - 17,000,000 - - 17,000,000 17,000,000
10 Apr 2018
8 Aug 2021 Various - 3,000,000 - - 3,000,000 3,000,000
The weighted average remaining contractual life of the options is 3.07 years (2017: 0.39 years).
17. Reserves and accumulated lossesAccounting PolicyThe share based payments reserve holds the directly attributable cost of services provided pursuant to the options issued to corporate advisors, directors, employees and past directors of the Group.
The translation reserve comprises all foreign currency differences arising from the translation of the financial statements of foreign operations.
CONTINUED
For
per
sona
l use
onl
y

52FIRST GRAPHENE ANNUAL REPORT 2018
Notes to the ConsolidatedFinancial Statements
18. Statement of cash flow reconciliation
(a) Reconciliation of net loss after tax to net cash flows from operations 2018 2017
A$ A$
Net Loss (7,024,612) (4,259,960)
Adjusted for:
Depreciation 12,568 128,092
Amortisation 217,603 34,180
Gain on sale of property, plant and equipment (20,814) -
Share based payments expensed 863,679 38,500
Options expensed 395,000 -
Share and options issued as acquisition expense - -
Shares issued as payment for operating expense 29,916 30,000
Foreign exchange gains 79,787 (44,306)
Changes in assets/liabilities
(Increase)/decrease in trade and other receivables (169,831) (11,990)
(Increase)/decrease in inventory (242,713) (328,295)
(Increase)/decrease in prepayments (48,826) (3,211)
(Increase)/decrease in other assets 157 -
Increase/(decrease) in trade and other payables 632,956 (19,826)
Increase/(decrease) in finance liabilities - (1,471)
Net cash (used in) operating activities (5,275,290) (4,438,287)
(b) Non-cash investing and financing activities
On 8 August 2017, the Company issued 2,000,000 shares, to the value of $170,000 and 7,500,000 options, to the value of $225,000 to Kremford Pty Ltd as partial consideration for Stage 1 of the Best Battery Development Agreement.
There were no other non-cash investing and financing activities during the reporting period.
CONTINUED
For
per
sona
l use
onl
y

53FIRST GRAPHENE
ANNUAL REPORT 2018
Notes to the ConsolidatedFinancial Statements
19. Commitments Operating lease commitments – Group as lesseeThe Group leases office premises in Nedlands and the Commercial Graphene Facility at Henderson, WA under normal commercial lease arrangements. The Nedlands office lease was extended into a period of 1 year expiring on 1 April 2019. The Group is under no legal obligation to renew the lease once the lease term expires.
The Henderson lease has been renegotiated in the current year for a period of 5 years beginning 1 June 2018. The Group is under no legal obligation to renew the lease once the lease term expires.
Future minimum rentals payable under non-cancellable operating leases at 30 June are as follows:
2018 2017
Lease expenditure commitments A$ A$
Operating leases (non-cancellable)
- Within one year 98,381 119,456
- Later than one year and not later than five years 315,920 91,865
Total operating leases (non-cancellable) 414,301 211,321
The operating leases are entered into for the purposes of leasing company premises.
Finance lease commitments – Group as lesseeThe Group has lease contracts for the purchase of a Toyota Hi-lux utility in Sri Lanka and two hire purchase contracts for equipment used at the Henderson Commercial Graphene Facility. The lease contract expires on 25 March 2020 and the hire purchase contracts expire on 5 May 2020 and 21 April 2021 whereby ownership of the respective equipment passes to the Group once all contractual payments have been made.
2018 2017
A$ A$
- Within one year 43,184 41,097
- Later than one year and not later than five years 52,709 72,728
Total minimum lease payments 95,893 113,825
Less amounts representing finance charges (8,567) (16,972)
Present value of minimum lease payments 87,326 96,853
Included in the financial statements as:
Current interest-bearing liabilities 76,369 48,022
Non-current interest-bearing liabilities 10,957 48,831
87,326 96,853
CONTINUED
For
per
sona
l use
onl
y
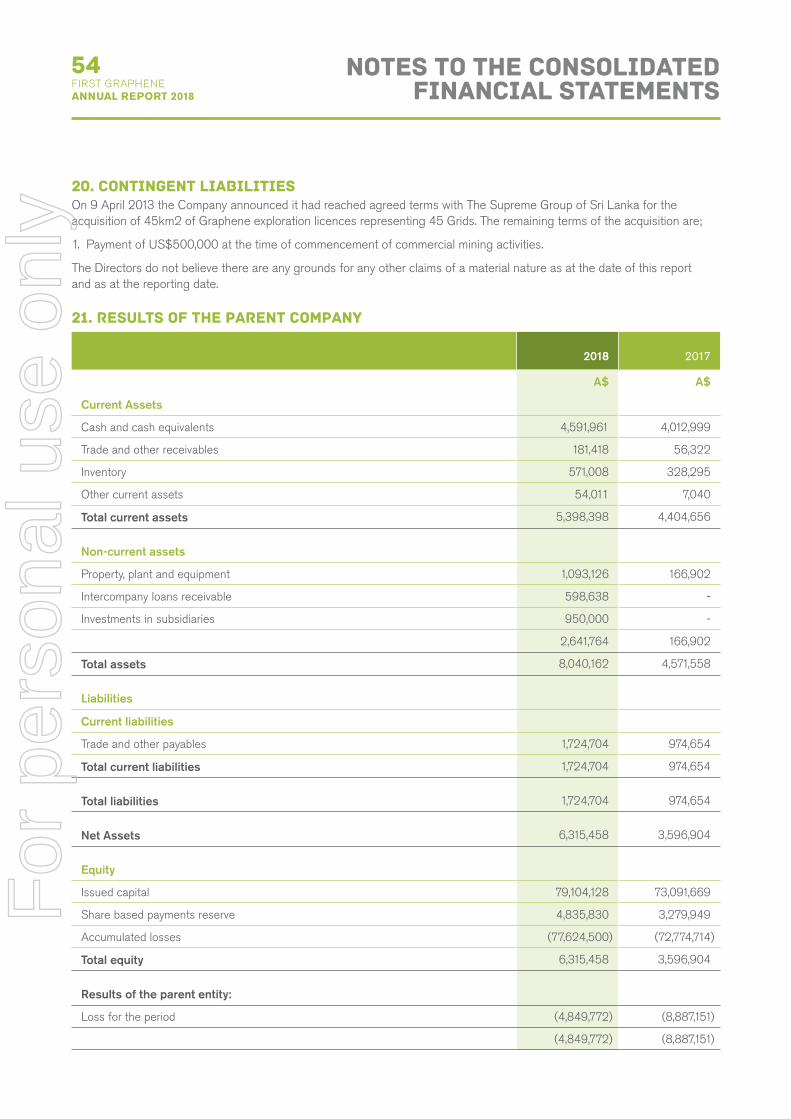
54FIRST GRAPHENE ANNUAL REPORT 2018
20. Contingent liabilitiesOn 9 April 2013 the Company announced it had reached agreed terms with The Supreme Group of Sri Lanka for the acquisition of 45km2 of Graphene exploration licences representing 45 Grids. The remaining terms of the acquisition are;
1. Payment of US$500,000 at the time of commencement of commercial mining activities.
The Directors do not believe there are any grounds for any other claims of a material nature as at the date of this report and as at the reporting date.
21. Results of the parent company
2018 2017
A$ A$
Current Assets
Cash and cash equivalents 4,591,961 4,012,999
Trade and other receivables 181,418 56,322
Inventory 571,008 328,295
Other current assets 54,011 7,040
Total current assets 5,398,398 4,404,656
Non-current assets
Property, plant and equipment 1,093,126 166,902
Intercompany loans receivable 598,638 -
Investments in subsidiaries 950,000 -
2,641,764 166,902
Total assets 8,040,162 4,571,558
Liabilities
Current liabilities
Trade and other payables 1,724,704 974,654
Total current liabilities 1,724,704 974,654
Total liabilities 1,724,704 974,654
Net Assets 6,315,458 3,596,904
Equity
Issued capital 79,104,128 73,091,669
Share based payments reserve 4,835,830 3,279,949
Accumulated losses (77,624,500) (72,774,714)
Total equity 6,315,458 3,596,904
Results of the parent entity:
Loss for the period (4,849,772) (8,887,151)
(4,849,772) (8,887,151)
Notes to the ConsolidatedFinancial Statements
For
per
sona
l use
onl
y
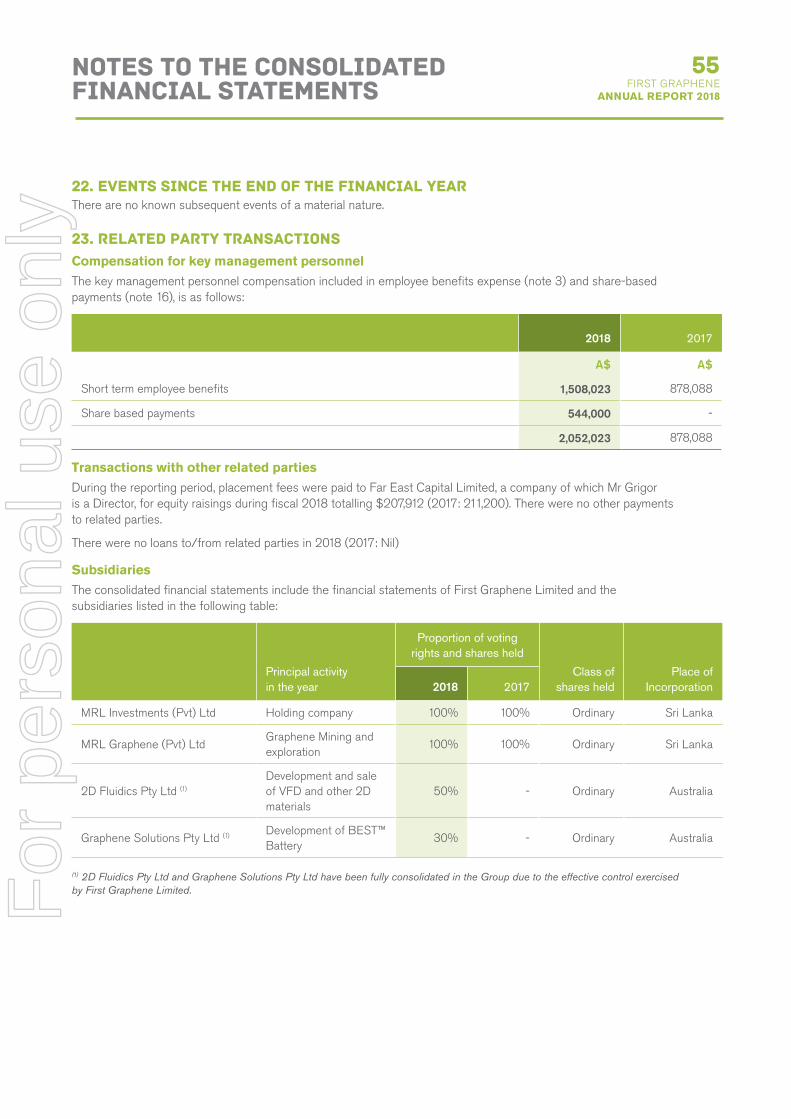
55FIRST GRAPHENE
ANNUAL REPORT 2018
22. Events since the end of the financial yearThere are no known subsequent events of a material nature.
23. Related party transactionsCompensation for key management personnelThe key management personnel compensation included in employee benefits expense (note 3) and share-based payments (note 16), is as follows:
2018 2017
A$ A$
Short term employee benefits 1,508,023 878,088
Share based payments 544,000 -
2,052,023 878,088
Transactions with other related partiesDuring the reporting period, placement fees were paid to Far East Capital Limited, a company of which Mr Grigor is a Director, for equity raisings during fiscal 2018 totalling $207,912 (2017: 211,200). There were no other payments to related parties.
There were no loans to/from related parties in 2018 (2017: Nil)
SubsidiariesThe consolidated financial statements include the financial statements of First Graphene Limited and the subsidiaries listed in the following table:
Principal activity in the year
Proportion of voting rights and shares held
Class of shares held
Place of Incorporation2018 2017
MRL Investments (Pvt) Ltd Holding company 100% 100% Ordinary Sri Lanka
MRL Graphene (Pvt) LtdGraphene Mining and exploration
100% 100% Ordinary Sri Lanka
2D Fluidics Pty Ltd (1)
Development and sale of VFD and other 2D materials
50% - Ordinary Australia
Graphene Solutions Pty Ltd (1) Development of BEST™ Battery
30% - Ordinary Australia
(1) 2D Fluidics Pty Ltd and Graphene Solutions Pty Ltd have been fully consolidated in the Group due to the effective control exercised by First Graphene Limited.
Notes to the ConsolidatedFinancial Statements
For
per
sona
l use
onl
y

56FIRST GRAPHENE ANNUAL REPORT 2018
24. Auditors’ remunerationServices provided by the Group’s auditor (in tenure as auditor) and associated firms
During the year, the Group (including its overseas subsidiaries) obtained the following services from BDO Audit (W.A.) Pty Ltd as detailed below:
Auditors’ remuneration 2018 2017
Remuneration of the auditor of the Group for: A$ A$
- Audit services – BDO Audit (WA) Pty Ltd 37,000 31,946
- Taxation services – BDO Corporate Tax (WA) Pty Ltd 23,829 16,875
60,829 48,821
25. Asset AcquisitionThe Group has determined that the acquisition of Graphene Solutions Pty Ltd is not deemed a business acquisition, the transaction has been accounted for as asset acquisition. In assessing the requirements of IFRS 3, Business Combinations, the Group has determined the assets acquired do not consist of a business. The principal assets acquired consisted of cash and licences to intellectual property. When an asset acquisition does not constitute a business combination, the assets and liabilities are assigned a carrying amount based on their relative fair values in an asset purchase transaction and no deferred tax will arise in relation to the acquired assets and assumed liabilities as the initial recognition exemption under AASB 112 applies. No goodwill will arise on the acquisition and transaction costs of the acquisition.
Identifying the acquirer in the acquisitionDuring the year the Company acquired 30% of Graphene Solutions Pty Ltd. The Company has determined that First Graphene Limited was the acquirer as:
• First Graphene Limited has board control
• First Graphene Limited exercises the management of the companies.
Significant estimate and judgment The directors have concluded that the group controls Graphene Solutions Pty Ltd even though it holds less then half the voting rights of this subsidiary. This is because the group holds a substantive option to acquire the majority of the shares in the subsidiary that is exercisable at any point.
Name of entityPlace of business/country of encorportation
Ownership interest held by the
group
Ownership interest held by non-controlling interests
Principal activities2018 2017 2018 2017
Graphene Solutions Pty Ltd Australia 30% -% 70% 100%
Research with Swinburne
University of Technology
CONTINUED
Notes to the ConsolidatedFinancial Statements
For
per
sona
l use
onl
y

57FIRST GRAPHENE
ANNUAL REPORT 2018
The Directors declare:
1. the financial statements and notes, as set out on pages 21 to 56 are in accordance with the Corporations Act 2001 and:
a. comply with Accounting Standards and the Corporations Regulations 2001 and other mandatory professional reporting requirements; and
b. give a true and fair view of the financial position as at 30 June 2018 and of the performance for the year ended on this date of the consolidated group;
2. the Chief Executive Officer and Chief Finance Officer have each declared:
a. the financial records of the consolidated group for the financial year have been properly maintained in accordance with section 286 of the Corporations Act 2001;
b. the financial statements, and the notes for the financial year comply with the accounting standards; and
c. the financial statements and notes for the financial year give a true and fair view; and
3. in the directors’ opinion, there are reasonable grounds to believe the consolidated group will be able to pay its debts as and when they become due and payable.
4. the consolidated group has included in the notes to the financial statements an explicit and unreserved statement of compliance with the International Financial Reporting Standards
5. the remuneration disclosures set out in the Directors’ Report on pages 10 to 12 (as the audited Remuneration Report) comply with section 300A of the Corporations Act 2001;
Signed in accordance with a resolution of the directors made pursuant to S295 (5) of the Corporations Act 2001. On behalf of the Directors
Craig McGuckinManaging Director21 September 2018
Directors’ Declaration
For
per
sona
l use
onl
y

58FIRST GRAPHENE ANNUAL REPORT 2018
BDO Audit (WA) Pty Ltd ABN 79 112 284 787 is a member of a national association of independent entities which are all members of BDO Australia Ltd ABN 77 050 110 275,an Australian company limited by guarantee. BDO Audit (WA) Pty Ltd and BDO Australia Ltd are members of BDO International Ltd, a UK company limited by guarantee, andform part of the international BDO network of independent member firms. Liability limited by a scheme approved under Professional Standards Legislation other than forthe acts or omissions of financial services licensees
Tel: +61 8 6382 4600Fax: +61 8 6382 4601www.bdo.com.au
38 Station StreetSubiaco, WA 6008PO Box 700 West Perth WA 6872Australia
INDEPENDENT AUDITOR'S REPORT
To the members of First Graphene Limited
Report on the Audit of the Financial Report
Opinion
We have audited the financial report of First Graphene Limited (the Company) and its subsidiaries (theGroup), which comprises the consolidated statement of financial position as at 30 June 2018, theconsolidated statement of profit or loss and other comprehensive income, the consolidated statementof changes in equity and the consolidated statement of cash flows for the year then ended, and notesto the financial report, including a summary of significant accounting policies and the directors’declaration.
In our opinion the accompanying financial report of the Group, is in accordance with the CorporationsAct 2001, including:
(i) Giving a true and fair view of the Group’s financial position as at 30 June 2018 and of itsfinancial performance for the year ended on that date; and
(ii) Complying with Australian Accounting Standards and the Corporations Regulations 2001.
Basis for opinion
We conducted our audit in accordance with Australian Auditing Standards. Our responsibilities underthose standards are further described in the Auditor’s responsibilities for the audit of the FinancialReport section of our report. We are independent of the Group in accordance with the CorporationsAct 2001 and the ethical requirements of the Accounting Professional and Ethical Standards Board’sAPES 110 Code of Ethics for Professional Accountants (the Code) that are relevant to our audit of thefinancial report in Australia. We have also fulfilled our other ethical responsibilities in accordancewith the Code.
We confirm that the independence declaration required by the Corporations Act 2001, which has beengiven to the directors of the Company, would be in the same terms if given to the directors as at thetime of this auditor’s report.
We believe that the audit evidence we have obtained is sufficient and appropriate to provide a basisfor our opinion.
Material uncertainty related to going concern
We draw attention to Note 1 in the financial report which describes the events and/or conditions whichgive rise to the existence of a material uncertainty that may cast significant doubt about the group’sability to continue as a going concern and therefore the group may be unable to realise its assets anddischarge its liabilities in the normal course of business. Our opinion is not modified in respect of thismatter.
Independent Auditor’s Report
For
per
sona
l use
onl
y
59FIRST GRAPHENE
ANNUAL REPORT 2018
Key audit matters
Key audit matters are those matters that, in our professional judgement, were of most significance inour audit of the financial report of the current period. These matters were addressed in the context ofour audit of the financial report as a whole, and in forming our opinion thereon, and we do not providea separate opinion on these matters. In addition to the matter described in the Material UncertaintyRelated to Going Concern section, we have determined the matters described below to be the keyaudit matters to be communicated in our report.
Accounting for share-based payments
Key audit matter How the matter was addressed in our audit
During the financial year ended 30 June 2018, the Group
issued equity instruments, in the form of options, to
eligible directors, consultants and Kremford (Vic) Pty
Ltd as detailed in Note 16.
The Group performed valuations of the options and
recorded the related share-based payment expense in
accordance with AASB 2 Share-based Payments in the
consolidated statement of profit or loss and other
comprehensive income.
Due to the complex and judgemental estimates used in
determining the value of the options, we consider the
accounting for the share-based payment expense to be a
key audit matter.
Our audit procedures included, but were not limited
to the following:
reviewing the relevant agreements to
obtain an understanding of the contractual
nature of the share-based payment
arrangements;
assessing management’s determination of
the fair value of the options issued,
considering the appropriateness of the
valuation model used and involving our
internal valuation specialists to assess the
inputs used in the models; and
assessing the adequacy of the related
disclosures in Notes 16 to the financial
statements.
Independent Auditor’s Report
CONTINUED
For
per
sona
l use
onl
y

60FIRST GRAPHENE ANNUAL REPORT 2018
CONTINUED
Independent Auditor’s Report
Accounting for the acquisition of Graphene Solutions Pty Ltd
Key audit matter How the matter was addressed in our audit
During the financial year ended 30 June 2018, the
Group obtained a 30% controlling interest in
Graphene Solutions Pty Ltd.
The Group treated the transaction as an asset
acquisition rather than a business combination.
Accounting for this transaction is complex and
requires management to exercise judgement to
determine the appropriate accounting treatment
including whether the acquisition should be classed
as an asset or business acquisition, estimating the
fair value of net assets acquired and determining
whether the Group has control.
Our audit procedures included, but were not limited to
the following:
reviewing the earn-in and joint venture
agreement to understand the key terms and
conditions;
obtaining an understanding of the transaction,
including an assessment of whether the
transaction constituted an asset or business;
obtaining an understanding of the shareholder’s
agreement and collaborative research
agreement, including an assessment of whether
the Group has control;
assessing management’s determination of the
fair value of consideration paid and agreeing
this to supporting documentation;
reviewing the accounting for non-controlling
interests; and
assessing the adequacy of the related
disclosures in Note 25 to the financial
statements.
Other information
The directors are responsible for the other information. The other information comprises theinformation in the Group’s annual report for the year ended 30 June 2018, but does not include thefinancial report and the auditor’s report thereon.
Our opinion on the financial report does not cover the other information and we do not express anyform of assurance conclusion thereon.
In connection with our audit of the financial report, our responsibility is to read the other informationand, in doing so, consider whether the other information is materially inconsistent with the financialreport or our knowledge obtained in the audit or otherwise appears to be materially misstated.
If, based on the work we have performed, we conclude that there is a material misstatement of thisother information, we are required to report that fact. We have nothing to report in this regard.
Responsibilities of the directors for the Financial Report
The directors of the Company are responsible for the preparation of the financial report that gives atrue and fair view in accordance with Australian Accounting Standards and the Corporations Act 2001and for such internal control as the directors determine is necessary to enable the preparation of thefinancial report that gives a true and fair view and is free from material misstatement, whether due tofraud or error.
For
per
sona
l use
onl
y
61FIRST GRAPHENE
ANNUAL REPORT 2018
In preparing the financial report, the directors are responsible for assessing the ability of the group tocontinue as a going concern, disclosing, as applicable, matters related to going concern and using thegoing concern basis of accounting unless the directors either intend to liquidate the Group or to ceaseoperations, or has no realistic alternative but to do so.
Auditor’s responsibilities for the audit of the Financial Report
Our objectives are to obtain reasonable assurance about whether the financial report as a whole is freefrom material misstatement, whether due to fraud or error, and to issue an auditor’s report thatincludes our opinion. Reasonable assurance is a high level of assurance, but is not a guarantee that anaudit conducted in accordance with the Australian Auditing Standards will always detect a materialmisstatement when it exists. Misstatements can arise from fraud or error and are considered materialif, individually or in the aggregate, they could reasonably be expected to influence the economicdecisions of users taken on the basis of this financial report.
A further description of our responsibilities for the audit of the financial report is located at theAuditing and Assurance Standards Board website (http://www.auasb.gov.au/Home.aspx) at:
http://www.auasb.gov.au/auditors_responsibilities/ar1.pdf
This description forms part of our auditor’s report.
Report on the Remuneration Report
Opinion on the Remuneration Report
We have audited the Remuneration Report included in pages 14 to 18 of the directors’ report for theyear ended 30 June 2018.
In our opinion, the Remuneration Report of First Graphene Limited, for the year ended 30 June 2018,complies with section 300A of the Corporations Act 2001.
Responsibilities
The directors of the Company are responsible for the preparation and presentation of theRemuneration Report in accordance with section 300A of the Corporations Act 2001. Our responsibilityis to express an opinion on the Remuneration Report, based on our audit conducted in accordance withAustralian Auditing Standards.
BDO Audit (WA) Pty Ltd
Phillip Murdoch
Director
Perth, 21 September 2018
CONTINUED
For
per
sona
l use
onl
y
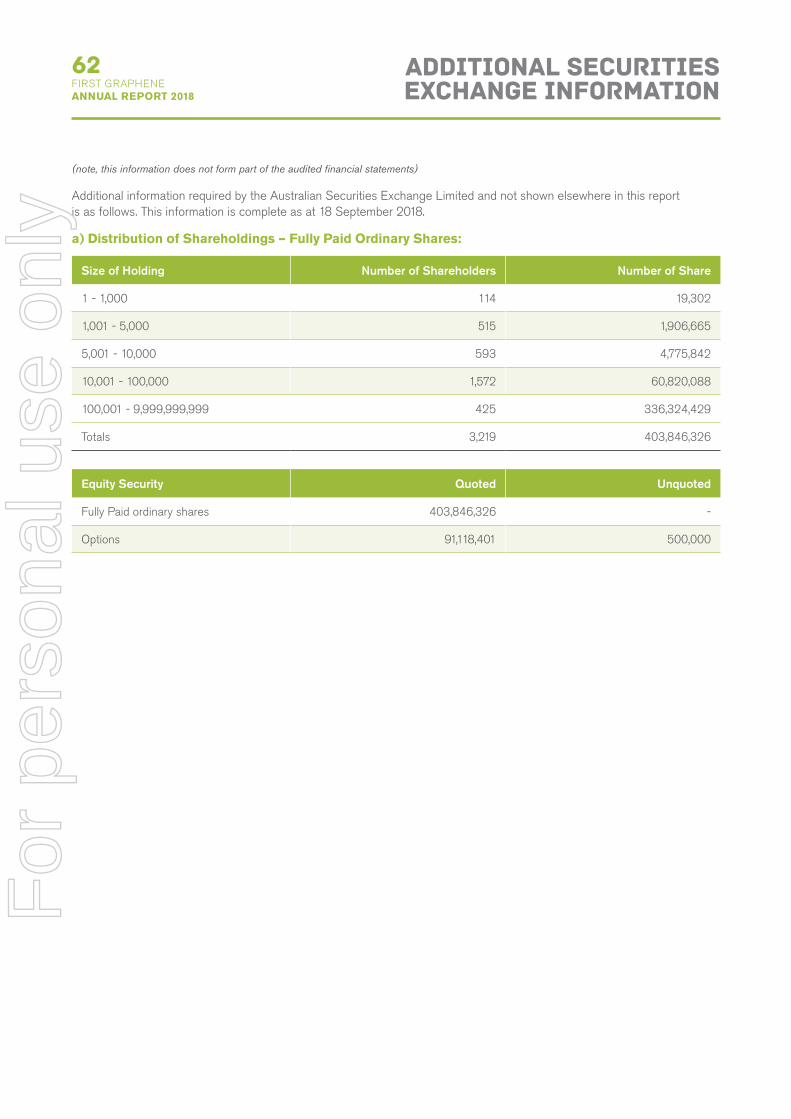
62FIRST GRAPHENE ANNUAL REPORT 2018
(note, this information does not form part of the audited financial statements)
Additional information required by the Australian Securities Exchange Limited and not shown elsewhere in this report is as follows. This information is complete as at 18 September 2018.
a) Distribution of Shareholdings – Fully Paid Ordinary Shares:
Size of Holding Number of Shareholders Number of Share
1 - 1,000 114 19,302
1,001 - 5,000 515 1,906,665
5,001 - 10,000 593 4,775,842
10,001 - 100,000 1,572 60,820,088
100,001 - 9,999,999,999 425 336,324,429
Totals 3,219 403,846,326
Equity Security Quoted Unquoted
Fully Paid ordinary shares 403,846,326 -
Options 91,118,401 500,000
Additional Securities Exchange Information
For
per
sona
l use
onl
y

63FIRST GRAPHENE
ANNUAL REPORT 2018
b) Top 20 Security Holders – Fully Paid Ordinary Shares (FGR) at 18 September 2018
Name of Holder Number of Shares %
1 J P MORGAN NOMINEES AUSTRALIA LIMITED 43,086,221 10.67%
2 TWYNAM AGRICULTURAL GROUP PTY LTD 17,729,843 4.39%
3 IPS NOMINEES LIMITED 16,781,465 4.16%
4 GREGORACH PTY LTD 14,905,946 3.69%
5 BUILDING ON THE ROCK LIMITED 11,111,111 2.75%
6 BNP PARIBAS NOMINEES PTY LTD <IB AU NOMS RETAILCLIENT DRP>
8,527,575 2.11%
7 DEBT MANAGEMENT ASIA CORPORATION 7,689,232 1.90%
8 CITICORP NOMINEES PTY LIMITED 7,371,893 1.83%
9 MR CRAIG ROBERT MCGUCKIN & MRS LEE ANN MCGUCKIN <MCGUCKIN FAMILY A/C>
6,908,513 1.71%
10 HALLIDAF MANAGEMENT LTD 6,094,794 1.51%
11 GINGA PTY LTD 5,427,811 1.34%
12 HSBC CUSTODY NOMINEES (AUSTRALIA) LIMITED 4,939,162 1.22%
13 MR RYAN JEHAN ROCKWOOD 4,500,000 1.11%
14 SUNSET CAPITAL MANAGEMENT PTY LTD <SUNSET SUPERFUND A/C>
4,212,500 1.04%
15 EMERPUS ASIA LTD 4,166,667 1.03%
16 BISSAPP SOFTWARE PTY LTD <SUPER FUND ACCOUNT>
3,540,700 0.88%
17 WILLIAM TAYLOR NOMINEES PTY LTD 3,337,530 0.83%
18 PAVARAI PTY LTD <THE SAYERS SUPER FUND A/C>
3,150,000 0.78%
19 MS FADILLAH BURHAN HASIBUAN 3,089,230 0.77%
20 MRS GAYLE TERESA CRABBE 3,084,594 0.76%
Total 179,654,787 44.49%
Total issued capital 403,846,326 100.00%
Shareholders with less than a marketable parcel
At 18 September 2018, there were 290 shareholders holding less than a marketable parcel of shares ($0.165 cents on this date) in the Company totalling 492,065 ordinary shares. This represented 0.12% of the issued capital.
CONTINUED
Additional Securities Exchange Information
For
per
sona
l use
onl
y

64FIRST GRAPHENE ANNUAL REPORT 2018
Additional Securities Exchange Information
CONTINUED
c) Top 20 Security Holders – Options (FGROC) at 18 September 2018
Name of Holder Number of Shares %
1 MRS GAYLE TERESA CRABBE 7,009,293 7.69%
2 BUILDING ON THE ROCK LIMITED 5,555,556 6.10%
3 TWYNAM AGRICULTURAL GROUP PTY LTD 5,550,000 6.09%
4 GREGORACH PTY LTD <GRIGOR SUPERFUND A/C>
5,137,500 5.64%
5 MS FADILLAH BURHAN HASIBUAN 4,722,023 5.18%
6 J P MORGAN NOMINEES AUSTRALIA LIMITED 4,161,766 4.57%
7 HSBC CUSTODY NOMINEES (AUSTRALIA) LIMITED 3,260,093 3.58%
8 UBS NOMINEES PTY LTD 2,777,778 3.05%
9 GEO BAN CONSULTING PTY LTD 2,109,091 2.31%
10 IPS NOMINEES LIMITED 2,097,683 2.30%
11 BOLAM MATERIALS RESEARCH LTD 2,000,000 2.19%
12 MR ALAN WESLEY PATTERSON-KANE 1,970,000 2.16%
13 PAVARAI PTY LTD <THE SAYERS SUPER FUND A/C>
1,893,750 2.08%
14 GREGORACH PTY LTD 1,863,244 2.04%
15 MR RONALD HAROLD KREYMBORG & MRS JENNIFER MARGUERITE KREYMBORG
1,800,000 1.98%
16 MR KIERAN JOHN HARFORD <THE HARFORD SUPER FUND A/C>
1,679,148 1.84%
17 EGAVAS CONSULTING SERVICES PTY LTD <VJ & KMS SUPER FUND A/C>
1,502,418 1.65%
18 RASL PTY LTD <THE RASL A/C>
1,220,918 1.34%
19 MRS TERRI FRANCES YOUD 1,085,343 1.19%
20 MR GREGORY JOHN KEIR 1,012,000 1.11%
Total 58,407,604 64.10%
Total issued options 91,118,401 100.00%For
per
sona
l use
onl
y
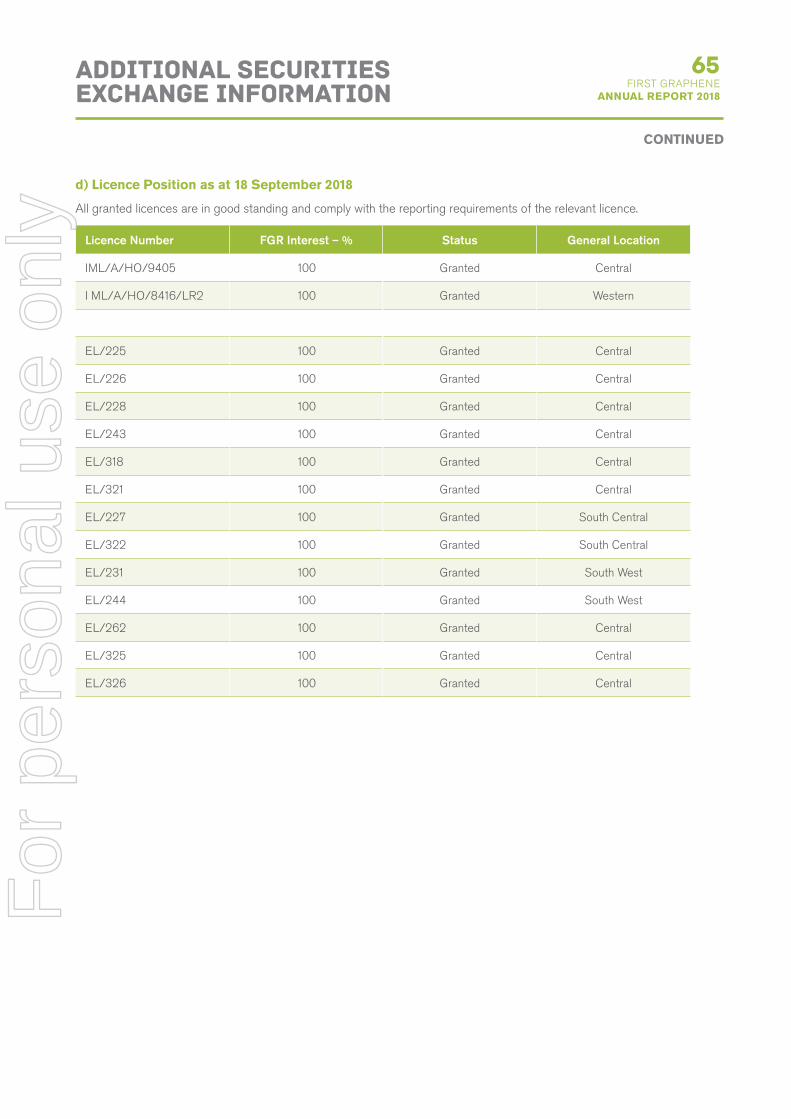
65FIRST GRAPHENE
ANNUAL REPORT 2018
d) Licence Position as at 18 September 2018
All granted licences are in good standing and comply with the reporting requirements of the relevant licence.
Licence Number FGR Interest – % Status General Location
IML/A/HO/9405 100 Granted Central
I ML/A/HO/8416/LR2 100 Granted Western
EL/225 100 Granted Central
EL/226 100 Granted Central
EL/228 100 Granted Central
EL/243 100 Granted Central
EL/318 100 Granted Central
EL/321 100 Granted Central
EL/227 100 Granted South Central
EL/322 100 Granted South Central
EL/231 100 Granted South West
EL/244 100 Granted South West
EL/262 100 Granted Central
EL/325 100 Granted Central
EL/326 100 Granted Central
CONTINUED
Additional Securities Exchange Information
For
per
sona
l use
onl
y

Suite 39 Hampden RoadNedlands WA 6009
P: +61 1300 660 448F: +61 1300 855 044E: [email protected]
www.firstgraphene.com.au
For
per
sona
l use
onl
y