20 1 7 ANNUAL REPORT - blueharborbank.com · Elliott Davis PLLC | INDEPENDENT AUDITOR’S REPORT...
39
2 0 1 7 ANNUAL REPORT
Transcript of 20 1 7 ANNUAL REPORT - blueharborbank.com · Elliott Davis PLLC | INDEPENDENT AUDITOR’S REPORT...

2 0 1 7 ANNUAL REPORT

2017 Annual Report Table of Contents Independent Auditor’s Report ............................................................................................................................................... 1 Balance Sheets ....................................................................................................................................................................... 2 Income Statements ................................................................................................................................................................ 3 Statements of Comprehensive Income ................................................................................................................................. 4 Statements of Changes in Shareholders’ Equity ................................................................................................................... 5 Statements of Cash Flows ..................................................................................................................................................... 6 Notes to Financial Statements ............................................................................................................................................... 7 Board of Directors and Employees ..................................................................................................................................... 35 Shareholders’ Information .................................................................................................................................................. 36 This Annual Report to Shareholders contains forward-looking statements. Such forward-looking statements may be identified by the use of such words as “may,” “will,” “believe,” “expect,” “anticipate,” should,” “planned,” “estimated” and “potential.” Such forward-looking statements are subject to certain risks and uncertainties that could cause actual results to differ materially from those anticipated in the forward-looking statements. Factors that might cause such a difference include, but are not limited to, changes in the interest rate environment, management’s business strategy, national, regional and local market conditions and legislative and regulatory conditions. Readers should not place undue reliance on forward-looking statements, which reflect management’s view only as of the date hereof. The Bank undertakes no obligation to publicly revise these forward-looking statements to reflect subsequent events or circumstances.

Elliott Davis PLLC | www.elliottdavis.com
INDEPENDENT AUDITOR’S REPORT Board of Directors blueharbor bank Report on the Financial Statements We have audited the accompanying financial statements of blueharbor bank (the “Bank”), which comprise the balance sheets as of December 31, 2017 and 2016, the related statements of income, comprehensive income, changes in shareholders’ equity and cash flows for the years then ended, and the related notes to the financial statements. Management’s Responsibility for the Financial Statements Management is responsible for the preparation and fair presentation of these financial statements in accordance with accounting principles generally accepted in the United States of America; this includes the design, implementation and maintenance of internal control relevant to the preparation and fair presentation of financial statements that are free from material misstatement, whether due to fraud or error. Auditor’s Responsibility Our responsibility is to express an opinion on these financial statements based on our audits. We conducted our audits in accordance with auditing standards generally accepted in the United States of America. Those standards require that we plan and perform the audit to obtain reasonable assurance about whether the financial statements are free from material misstatement. An audit involves performing procedures to obtain audit evidence about the amounts and disclosures in the financial statements. The procedures selected depend on the auditor’s judgment, including the assessment of the risks of material misstatement of the financial statements, whether due to fraud or error. In making those risk assessments, the auditor considers internal control relevant to the entity’s preparation and fair presentation of the financial statements in order to design audit procedures that are appropriate in the circumstances, but not for the purpose of expressing an opinion on the effectiveness of the entity’s internal control. Accordingly, we express no such opinion. An audit also includes evaluating the appropriateness of accounting policies used and the reasonableness of significant accounting estimates made by management, as well as evaluating the overall presentation of the financial statements. We believe that the audit evidence we have obtained is sufficient and appropriate to provide a basis for our audit opinion. Opinion In our opinion, the financial statements referred to above present fairly, in all material respects, the financial position of blueharbor bank as of December 31, 2017 and 2016, and the results of its operations and its cash flows for the years then ended in accordance with accounting principles generally accepted in the United States of America. Charlotte, North Carolina March 2, 2018

2
Balance Sheets December 31, 2017 and 2016 2017 2016 Assets Cash and due from banks $ 5,916,893 $ 4,588,801 Interest bearing deposits 488,143 519,021 Cash and cash equivalents 6,405,036 5,107,822 Investment securities available-for-sale 19,830,234 15,827,939 Federal Home Loan Bank stock 199,500 448,400 Loans held for sale - 602,500 Loans, net of allowance for loan losses of $1,717,181 for 2017 and $1,554,850 for 2016 170,000,956 145,092,703 Property and equipment, net 2,510,919 1,896,590 Accrued interest receivable 487,745 408,156 Bank owned life insurance 2,275,198 2,218,396 Other real estate owned 667,000 767,000 Other assets 1,953,114 1,975,213 Total assets $ 204,329,702 $ 174,344,719 Liabilities and Shareholders’ Equity Liabilities Deposits: Noninterest-bearing $ 32,552,826 $ 22,442,120 Interest-bearing 141,679,459 120,858,121 Total deposits 174,232,285 143,300,241 Repurchase agreements - 259,705 Other borrowings 2,990,000 5,260,800 Accrued interest payable 44,910 36,515 Other liabilities 2,026,984 1,809,271 Total liabilities 179,294,179 150,666,532 Commitments and contingencies (Notes 3, 6 and 12) Shareholders’ equity Preferred stock, 5,000,000 shares authorized: no shares issued and outstanding - - Common stock, $5 par value; 20,000,000 shares authorized: 2,718,572 issued and outstanding 13,592,860 13,592,860 Surplus 9,013,578 8,958,074 Retained earnings 2,555,395 1,227,567 Accumulated other comprehensive loss (126,310) (100,314) Total shareholders’ equity 25,035,523 23,678,187 Total liabilities and shareholders’ equity $ 204,329,702 $ 174,344,719 See Notes to Financial Statements

3
Income Statements For the years ended December 31, 2017 and 2016 2017 2016 Interest income Loans and fees on loans $ 7,221,946 $ 5,940,472 Investment securities 366,406 341,967 Interest bearing deposits 4,105 1,783 Total interest income 7,592,457 6,284,222 Interest expense Deposits 801,087 585,251 Borrowings 76,968 18,729 Total interest expense 878,055 603,980 Net interest income 6,714,402 5,680,242 Provision for loan losses 152,277 17,416 Net interest income after provision for loan losses 6,562,125 5,662,826 Noninterest income Service charges on deposit accounts 82,463 63,124 Debit card network fees 218,396 203,690 Mortgage fees 44,642 57,338 Bank owned life insurance income 56,802 60,574 Wealth management income 196,988 136,130 Other income 14,001 11,835 Total noninterest income 613,292 532,691 Noninterest expense Salaries and employee benefits 2,440,365 2,350,636 Occupancy expense 365,269 356,953 Equipment expense 81,382 89,413 Data processing expense 676,314 609,758 Professional services 179,440 164,402 Advertising expense 55,404 30,933 Regulatory expense 99,467 96,573 Other real estate expense, net 114,562 113,897 Other expense 478,847 437,680 Total noninterest expense 4,491,050 4,250,245 Net income before income taxes 2,684,367 1,945,272 Income tax expense Income tax expense related to ordinary operations 921,053 717,705 Income tax expense related to change in tax rate 435,486 - Total income tax expense 1,356,539 717,705 Net income $ 1,327,828 $ 1,227,567 Basic earnings per common share $ 0.49 $ 0.45 Diluted earnings per common share $ 0.44 $ 0.41 Weighted average common shares outstanding 2,718,572 2,717,172 Weighted average dilutive common shares outstanding 3,006,044 2,987,304 See Notes to Financial Statements

4
Statements of Comprehensive Income For the years ended December 31, 2017 and 2016 2017 2016 Net income $ 1,327,828 $ 1,227,567 Other comprehensive loss: Investment securities available-for-sale: Unrealized losses on investment securities available-for-sale arising during the period (2,303) (201,601) Tax effect 529 76,528 Tax effect of Tax Cuts and Jobs Act (24,222) - Total other comprehensive loss (25,996) (125,073) Comprehensive income $ 1,301,832 $ 1,102,494
See Notes to Financial Statements

5
Statements of Changes in Shareholders’ Equity For the years ended December 31, 2017 and 2016 Accumulated Other Common Retained Comprehensive Shares * Amount Surplus Earnings Income (Loss) Total Balance, December 31, 2015 2,719,772 $ 13,598,860 $8,910,550 $ - $ 24,759 $ 22,534,169 Net income - - - 1,227,567 - 1,227,567 Other comprehensive loss - - - - (125,073) (125,073) Stock based compensation - - 55,436 - - 55,436 Stock option exercise 3,600 18,000 5,052 - - 23,052 Share repurchase (4,800) (24,000) (12,964) - - (36,964) Balance, December 31, 2016 2,718,572 $ 13,592,860 $8,958,074 $ 1,227,567 $ (100,314) $ 23,678,187 Net income - - - 1,327,828 - 1,327,828 Other comprehensive loss - - - - (25,996) (25,996) Stock based compensation - - 55,504 - - 55,504 Balance, December 31, 2017 2,718,572 $ 13,592,860 $9,013,578 $ 2,555,395 $ (126,310) $ 25,035,523 * Share data and 2015 shareholders’ equity have been restated to reflect the 20% common stock dividend issued in March 2016. See
Note 10. See Notes to Financial Statements

6
Statements of Cash Flows For the years ended December 31, 2017 and 2016 2017 2016 Cash flows from operating activities Net income $ 1,327,828 $ 1,227,567 Adjustments to reconcile net income to net cash provided by operations: Depreciation 98,341 104,666 Provision for loan losses 152,277 17,416 Accretion of discount on securities, net of amortization 44,629 29,400 Deferred income tax expense (benefit) 228,571 (95,629) Write-downs of other real estate owned 100,000 100,000 Bank owned life insurance income (56,802) (60,574) Stock based compensation 55,504 55,436 Originations of loans held for sale (3,057,862) (1,496,608) Proceeds from sales of loans held for sale 3,702,818 913,046 Gain on sale of loans held for sale (42,456) (18,938) Changes in assets and liabilities: Increase (decrease) in accrued interest receivable (79,589) (51,141) Decrease (increase) in other assets (230,165) (162,414) Increase in accrued interest payable 8,395 7,837 Increase in other liabilities 217,713 263,753 Net cash provided by operating activities 2,469,202 833,817 Cash flows from investing activities Purchases of investment securities (5,984,235) (5,125,514) Purchases of Federal Home Loan Bank (229,700) (454,000) Redemption of Federal Home Loan Bank 478,600 127,500 Principal payments on investment securities 1,935,008 1,942,379 Proceeds from sales or calls of investment securities - 4,000,000 Net increase in loans (25,060,530) (21,112,472) Purchases of property and equipment (712,670) (70,101) Net cash used in investing activities (29,573,527) (20,692,208) Cash flows from financing activities Net increase in deposits 30,932,044 12,160,482 Proceeds from stock option exercise - 23,052 Common stock share repurchase - (36,964) Cash in lieu of fractional shares - (168) Net increase (decrease) in repurchase agreements (259,705) 259,543 Net increase (decrease) in other borrowings (2,270,800) 5,260,800 Net cash provided by financing activities 28,401,539 17,666,745 Net increase (decrease) in cash and cash equivalents 1,297,214 (2,191,646) Cash and cash equivalents, beginning 5,107,822 7,299,468 Cash and cash equivalents, ending $ 6,405,036 $ 5,107,822 Supplemental disclosure of cash flow information Interest paid $ 869,660 $ 596,143 Income taxes paid $ 1,264,000 $ 584,000 Change in unrealized gain on investment securities $ (2,303) $ (201,601) Stock dividend on common stock issued March 2016 $ - $ 4,415,123 See Notes to Financial Statements

7
Notes to Financial Statements
Note 1. Organization and Summary of Significant Accounting Policies Organization blueharbor bank (the “Bank”) was incorporated on January 3, 2008, under the laws of the State of North Carolina (NC) and commenced operations on January 8, 2008. The Bank currently serves Iredell County, NC, and northern Mecklenburg County, NC, and surrounding areas through its banking offices in Mooresville, Statesville, and Huntersville, NC. The Bank opened the Huntersville branch in November 2008, the Statesville branch in April 2015 and the Downtown Mooresville branch in October 2017. As a state chartered bank, which is not a member of the Federal Reserve, the Bank is subject to regulation by the North Carolina Commissioner of Banks and the Federal Deposit Insurance Corporation (FDIC). The accounting and reporting policies of the Bank follow generally accepted accounting principles (GAAP) and general practices within the financial services industry. Following is a summary of the more significant policies: Critical Accounting Policies Management believes the policies with respect to the methodology for the determination of the allowance for loan losses and asset impairment judgments involve a high degree of complexity. Management must make difficult and subjective judgments which require assumptions or estimates about highly uncertain matters. Changes in these judgments, assumptions or estimates could cause reported results to differ materially. These critical policies and their application are periodically reviewed with the Audit Committee and the Board of Directors. Business Segments The Bank reports its activities as a single business segment. In determining the appropriateness of segment definition, the Bank considers the materiality of a potential segment and components of the business about which financial information is available and regularly evaluated relative to resource allocation and performance assessment. Use of Estimates In preparing financial statements in conformity with GAAP, management is required to make estimates and assumptions that affect the reported amounts of assets and liabilities as of the date of the balance sheet and reported amounts of revenues and expenses during the reporting period. Actual results could differ from those estimates. Material estimates that are particularly susceptible to significant change in the near term relate to the determination of the allowance for loan losses and the valuation of deferred tax assets. Cash and Cash Equivalents For the purpose of presentation in the statement of cash flows, cash and cash equivalents are defined as those amounts included in the balance sheet caption “cash and due from banks” and “interest bearing deposits.” Securities Certain debt securities that management has the positive intent and ability to hold to maturity are classified as “held-to-maturity” and recorded at amortized costs. Trading securities are recorded at fair value with changes in fair value included in earnings. Securities not classified as held-to-maturity or trading, including equity securities with readily determinable fair values, are classified as “available-for-sale” and recorded at fair value, with unrealized gains and losses excluded from earnings and reported in other comprehensive income.

8
Notes to Financial Statements
Note 1. Organization and Summary of Significant Accounting Policies, continued Securities, continued Purchase premiums and discounts are recognized in interest income using the interest method over the terms of the securities. Declines in the fair value of held-to-maturity and available-for-sale securities below their cost that are deemed to be other-than-temporary are reflected in earnings as realized losses. In determining whether other-than-temporary impairment exists, management considers many factors, including (1) the length of time and the extent to which the fair value has been less than cost, (2) the financial condition and near-term prospects of the issuer, and (3) the intent and ability of the Bank to retain its investment in the issuer for a period of time sufficient to allow for any anticipated recovery in fair value. Gains and losses on the sale of securities are recorded on the trade date and are determined using the specific identification method. Loans Held for Sale Loans held for sale consist of residential mortgage loans, secured by one-to-four family residential properties in the markets we serve. Loans originated with the intent to sell in the secondary market are classified as held for sale. Loans held for sale are carried at cost, which is estimated to be fair value given the short period of time a loan is held for sale. The fair value of loans held for sale is impacted by changes in market interest rates; however, given that loans held for sale are generally sold within a week or two of origination, the short time they are held on the balance sheet minimizes the risk of changes in value. Mortgage loans held for sale are underwritten to the standards of the secondary market purchaser to ensure they will be purchased at cost plus the anticipated mortgage loans fee income consisting of origination fees due to blueharbor bank. The difference between the carried cost and sales price is recognized as mortgage fee income. Loans Receivable Loans receivable that management has the intent and ability to hold for the foreseeable future or until maturity or pay-off are reported at their outstanding principal amount adjusted for any charge-offs and the allowance for loan losses. Loan origination fees, net of certain direct origination costs, are deferred and recognized as an adjustment of the related loan yield using the interest method. Discounts and premiums on any purchased loans are amortized to income using the interest method over the remaining period to contractual maturity, adjusted for anticipated prepayments. Interest is accrued and credited to income based on the principal amount outstanding. The accrual of interest on impaired loans is discontinued when, in management’s opinion, the borrower may be unable to meet payments as they become due. When interest accrual is discontinued, all unpaid accrued interest for the current year is reversed. Interest income is subsequently recognized on the cash basis or cost recovery method, as appropriate. When facts and circumstances indicate the borrower has regained the ability to meet the required payments, the loan is returned to accrual status. Past due status of loans is determined based on contractual terms. Allowance for Loan Losses The allowance for loan losses is established as losses are estimated to have occurred through a provision for loan losses charged to earnings. Loan losses are charged against the allowance when management believes the uncollectibility of a loan balance is confirmed. Subsequent recoveries, if any, are credited to the allowance. The allowance for loan losses is evaluated on a regular basis by management and is based upon management’s periodic review of the collectability of the loans in light of historical experience, the nature and volume of the loan portfolio, adverse situations that may affect the borrower’s ability to repay, estimated value of any underlying collateral and prevailing economic conditions. This evaluation is inherently subjective as it requires estimates that are susceptible to significant revision as more information becomes available.

9
Notes to Financial Statements
Note 1. Organization and Summary of Significant Accounting Policies, continued Allowance for Loan Losses, continued The allowance consists of specific, general and unallocated components. The specific component relates to loans that are classified as impaired. For such loans an allowance is established when the discounted cash flows (or collateral value or observable market price) of the impaired loan is lower than the carrying value of that loan. The general component covers non-impaired loans and is based on historical loss experience adjusted for qualitative factors. An unallocated component is maintained to cover uncertainties that could affect management’s estimate of probable losses. The unallocated component of the allowance reflects the margin of imprecision inherent in the underlying assumptions used in the methodologies for estimating losses in the portfolio. A loan is considered impaired when, based on current information and events, it is probable that the Bank will be unable to collect the scheduled payments of principal or interest when due according to the contractual terms of the loan agreement. Factors considered by management in determining impairment include payment status and other circumstances impacting the probability of collecting scheduled principal and interest payments when due. Loans that experience insignificant payment delays and payment shortfalls generally are not classified as impaired. Management determines the significance of payment delays and payment shortfalls on a case-by-case basis, taking into consideration all of the circumstances surrounding the loan and the borrower, including the length of the delay, the reasons for the delay, the borrower’s prior payment record, and the amount of the shortfall in relation to the principal and interest owed. Impairment is measured on a loan-by-loan basis for commercial and construction loans by either the present value of expected future cash flows discounted at the loan’s effective interest rate, the loan’s obtainable market price, or the fair value of the collateral if the loan is collateral dependent. Large groups of smaller balance homogeneous loans are collectively evaluated for impairment. Accordingly, the Bank does not separately identify individual consumer and residential loans for impairment disclosures, unless such loans are the subject of a restructuring agreement. Property and Equipment Bank premises, furniture and equipment, and leasehold improvements are carried at cost, less accumulated depreciation and amortization computed by the straight-line method over the following estimated useful lives: Years Leasehold improvements 1-6 Furniture and equipment 2-7 Other Real Estate Owned Real estate properties acquired through, or in lieu of, loan foreclosure are to be sold and are initially recorded at fair value less anticipated cost to sell at the date of foreclosure establishing a new cost basis. After foreclosure, valuations are periodically performed by management, and the real estate is carried at the lower of carrying amount or fair value less cost to sell. Revenue and expenses from operations and changes in the valuation allowance are included in other real estate expense in the accompanying income statements. Transfers of Financial Assets Transfers of financial assets are accounted for as sales when control over the assets has been surrendered. Control over transferred assets is deemed to be surrendered when (1) the assets have been isolated from the Bank, (2) the transferee obtains the right (free of conditions that constrain it from taking advantage of that right) to pledge or exchange the transferred assets, and (3) the Bank does not maintain effective control over the transferred assets through an agreement to repurchase them before their maturity.

10
Notes to Financial Statements
Note 1. Organization and Summary of Significant Accounting Policies, continued Bank Owned Life Insurance Bank owned life insurance represents the cash surrender value of policies on a certain officer of the Bank. Advertising Expense The Bank expenses advertising costs as they are incurred. Advertising expense amounted to $55,404 and $30,933 for the years ended December 31, 2017 and 2016, respectively. Income Taxes Provision for income taxes is based on amounts reported in the income statement (after exclusion of non-taxable income such as interest on state and municipal securities) and consists of taxes currently due plus deferred taxes on temporary differences in the recognition of income and expense for tax and financial statement purposes. Deferred tax assets and liabilities are included in the financial statements at currently enacted income tax rates applicable to the period in which the deferred tax assets or liabilities are expected to be realized or settled. As changes in tax laws or rates are enacted, deferred tax assets and liabilities are adjusted through the provision for income taxes. A deferred income tax liability relating to unrealized appreciation (or the deferred tax asset in the case of unrealized depreciation) on investment securities available-for-sale is recorded in other liabilities (assets) when applicable. Such unrealized appreciation or depreciation is recorded as an adjustment to equity in the financial statements and not included in income determination until realized. Accordingly, the resulting deferred income tax liability or asset is also recorded as an adjustment to equity. Basic Earnings per Share Basic earnings per share is computed by dividing income available to common shareholders by the weighted average number of shares outstanding during the period, after giving retroactive effect to stock splits and dividends. Diluted Earnings per Share The computation of diluted earnings per share is similar to the computation of basic earnings per share except that the denominator is increased to include the number of additional common shares that would have been outstanding if dilutive potential common shares had been issued. The numerator is adjusted for any changes in income or loss that would result from the assumed conversion of those potential common shares. Comprehensive Income Annual comprehensive income reflects the change in the Bank’s equity during the year arising from transactions and events other than investment by and distributions to shareholders. It consists of net income plus certain other changes in assets and liabilities that are reported as separate components of shareholders’ equity rather than as income or expense. The components of comprehensive income are also presented in a separate Statement of Comprehensive Income.

11
Notes to Financial Statements
Note 1. Organization and Summary of Significant Accounting Policies, continued Reclassifications Some items in the prior year financial statements were reclassified to conform to the current presentation. Such reclassifications had no effect on previously reported net income or shareholders’ equity. Fair Value of Financial Instruments Fair value information about financial instruments is required to be disclosed, whether or not recognized in the balance sheet. In cases where quoted market prices are not available, fair values are based on estimates using present value or other valuation techniques. Those techniques are significantly affected by the assumptions used, including the discount rate and estimates of future cash flows. In that regard, the derived fair value estimates cannot be substantiated by comparison to independent markets and, in many cases, could not be realized in immediate settlement of the instruments. Accordingly, the aggregate fair value amounts presented do not represent the underlying value of the Bank. The following methods and assumptions were used by the Bank in estimating its fair value disclosures for financial instruments: Securities: Fair values for securities, excluding restricted equity securities, are based on quoted market prices, where available. If quoted market prices are not available, fair values are based on quoted market prices of comparable instruments. The carrying values of restricted equity securities approximate fair values. Impaired Loans: Fair values for impaired loans are estimated using discounted cash flow analysis or underlying collateral values, where applicable. The carrying amount of accrued interest receivable approximates its fair value. Recent Accounting Pronouncements
The following is a summary of recent authoritative pronouncements that may affect accounting, reporting, and disclosure of financial information by the Bank: In May 2014, the FASB issued guidance to change the recognition of revenue from contracts with customers. The core principle of the new guidance is that an entity should recognize revenue to reflect the transfer of goods and services to customers in an amount equal to the consideration the entity receives or expects to receive. In August 2015, the FASB deferred the effective date of ASU 2014-09, Revenue from Contracts with Customers. As a result of the deferral, the guidance in ASU 2014-09 will be effective for the Bank for reporting periods beginning after December 15, 2018, and interim periods within annual reporting periods beginning after December 15, 2019. The Bank does not expect these amendments to have a material effect on its financial statements. In August 2015, the FASB deferred the effective date of ASU 2014‐09, Revenue from Contracts with Customers. As a result of the deferral, the guidance in ASU 2014‐09 will be effective for the Bank for reporting periods beginning after December 15, 2017. The Bank does not expect these amendments to have a material effect on its financial statements. In November 2015, the FASB amended the Income Taxes topic of the Accounting Standards Codification simplify the presentation of deferred income taxes by requiring that deferred tax liabilities and assets be classified as noncurrent in a classified statement of financial position. The amendments will be effective for financial statements issued for annual periods beginning after December 15, 2017, and interim periods within annual periods beginning after December 15, 2018, with early adoption permitted as of the beginning of an interim or annual reporting period. The Bank does not expect these amendments to have a material effect on its financial statements.
12
Notes to Financial Statements
Note 1. Organization and Summary of Significant Accounting Policies, continued Recent Accounting Pronouncements, continued In January 2016, the FASB amended the Financial Instruments topic of the Accounting Standards Codification to address certain aspects of recognition, measurement, presentation, and disclosure of financial instruments. The amendments will be effective for fiscal years beginning after December 15, 2018, and interim periods within fiscal years beginning after December 15, 2019. The Bank will apply the guidance by means of a cumulative-effect adjustment to the balance sheet as of the beginning of the fiscal year of adoption. The amendments related to equity securities without readily determinable fair values will be applied prospectively to equity investments that exist as of the date of adoption of the amendments. The Bank does not expect these amendments to have a material effect on its financial statements. In February 2016, the FASB amended the Leases topic of the Accounting Standards Codification to require all leases with lease terms over 12 months to be capitalized as a right‐of‐use asset and lease liability on the balance sheet at the date of lease commencement. Leases will be classified as either finance leases or operating leases. This distinction will be relevant for the pattern of expense recognition in the income statement. The amendments will be effective for fiscal years beginning after December 15, 2018, including interim periods within those fiscal years. Early adoption is permitted. The Bank is currently in the process of evaluating the impact of adoption of this guidance on the financial statements. In February 2016, the FASB amended the Leases topic of the Accounting Standards Codification to revise certain aspects of recognition, measurement, presentation, and disclosure of leasing transactions. The amendments will be effective for fiscal years beginning after December 15, 2019, and interim periods within fiscal years beginning after December 15, 2020. The Bank is currently evaluating the effect that implementation of the new standard will have on its financial position, results of operations, and cash flows. The Bank expects to adopt the guidance using the modified retrospective method and practical expedients for transition. The practical expedients allow the Bank to largely account for their existing leases consistent with current guidance except for the incremental balance sheet recognition for lessees. The Bank has started an initial evaluation of their leasing contracts and activities. The Bank has also started developing their methodology to estimate the right‐of use assets and lease liabilities, which is based on the present value of lease payments. Management does not expect a material change to the timing of expense recognition, but they are early in the implementation process and will continue to evaluate the impact. The Bank is evaluating their existing disclosures and may need to provide additional information as a result of adoption of the ASU. In March 2016, the FASB amended several topics of the Accounting Standards Codification to make the guidance in all private Bank accounting alternatives effective immediately by removing their effective dates. The amendments also include transition provisions that provide that private companies are able to forgo a preferability assessment the first time they elect the private Bank accounting alternatives. The amendments were effective immediately. The Bank does not expect these amendments to have a material effect on its financial statements. In March 2016, the FASB amended the Revenue from Contracts with Customers topic of the Accounting Standards Codification to clarify the implementation guidance on principal versus agent considerations and address how an entity should assess whether it is the principal or the agent in contracts that include three or more parties. The amendments will be effective for the Bank for annual periods beginning after December 15, 2018, and interim periods within annual reporting periods beginning after December 15, 2019. The Bank does not expect these amendments to have a material effect on its financial statements.

13
Notes to Financial Statements
Note 1. Organization and Summary of Significant Accounting Policies, continued Recent Accounting Pronouncements, continued In March 2016, the FASB issued guidance to simplify several aspects of the accounting for share-based payment award transactions including the income tax consequences, the classification of awards as either equity or liabilities, and the classification on the statement of cash flows. Additionally, the guidance simplifies two areas specific to entities other than public business entities allowing them apply a practical expedient to estimate the expected term for all awards with performance or service conditions that have certain characteristics and also allowing them to make a one-time election to switch from measuring all liability-classified awards at fair value to measuring them at intrinsic value. The amendments will be effective for the Bank for annual periods beginning after December 15, 2017, and interim periods within annual reporting periods beginning after December 15, 2018. The Bank does not expect these amendments to have a material effect on its financial statements. In April 2016, the FASB amended the Revenue from Contracts with Customers topic of the Accounting Standards Codification to clarify guidance related to identifying performance obligations and accounting for licenses of intellectual property. The amendments will be effective for the Bank for reporting periods beginning after December 15, 2017. The Bank does not expect these amendments to have a material effect on its financial statements. In May 2016, the FASB amended the Revenue from Contracts with Customers topic of the Accounting Standards Codification to clarify guidance related to collectability, noncash consideration, presentation of sales tax, and transition. The amendments will be effective for the Bank for reporting periods beginning after December 15, 2017. The Bank does not expect these amendments to have a material effect on its financial statements. In June 2016, the FASB issued guidance to change the accounting for credit losses and modify the impairment model for certain debt securities. The guidance requires a financial asset (including trade receivables) measured at amortized cost basis to be presented at the net amount expected to be collected. Thus, the income statement will reflect the measurement of credit losses for newly recognized financial assets as well as the expected increases or decreases of expected credit losses that have taken place during the period. The amendments will be effective for the Bank for reporting periods beginning after December 15, 2020. Early adoption is permitted for all organizations for periods beginning after December 15, 2018. The Bank is currently in the process of evaluating the impact of adoption of this guidance on the financial statements. In August 2016, the FASB amended the Statement of Cash Flows topic of the Accounting Standards Codification to clarify how certain cash receipts and cash payments are presented and classified in the statement of cash flows. The amendments will be effective for the Bank for fiscal years beginning after December 15, 2017 including interim periods within those fiscal years. Early adoption is permitted. The Bank does not expect these amendments to have a material effect on its financial statements. In November 2016, the FASB amended the Statement of Cash Flows topic of the Accounting Standards Codification to clarify how restricted cash is presented and classified in the statement of cash flows. The amendments will be effective for the Bank for fiscal years beginning after December 15, 2017 including interim periods within those fiscal years. Early adoption is permitted. The Bank does not expect these amendments to have a material effect on its financial statements.
14
Notes to Financial Statements
Note 1. Organization and Summary of Significant Accounting Policies, continued Recent Accounting Pronouncements, continued In January 2017, the FASB issued guidance to clarify the definition of a business with the objective of adding guidance to assist entities with evaluating whether transactions should be accounted for as acquisitions (or disposals) of assets or businesses. The amendment to the Business Combinations Topic is intended to address concerns that the existing definition of a business has been applied too broadly and has resulted in many transactions being recorded as business acquisitions that in substance are more akin to asset acquisitions. The guidance will be effective for the Bank for reporting periods beginning after December 15, 2017. Early adoption is permitted. The Bank does not expect these amendments to have a material effect on its financial statements. In January 2017, the FASB amended the Goodwill and Other Topic of the Accounting Standards Codification to simplify the accounting for goodwill impairment for public business entities and other entities that have goodwill reported in their financial statements and have not elected the private Bank alternative for the subsequent measurement of goodwill. The amendment removes Step 2 of the goodwill impairment test. A goodwill impairment will now be the amount by which a reporting unit’s carrying value exceeds its fair value, not to exceed the carrying amount of goodwill. The effective date and transition requirements for the technical corrections will be effective for the Bank for reporting periods beginning after December 15, 2020. Early adoption is permitted for interim or annual goodwill impairment tests performed on testing dates after January 1, 2017. The Bank does not expect these amendments to have a material effect on its financial statements. In February 2017, the FASB amended the Other Income Topic of the Accounting Standards Codification to clarify the scope of the guidance on nonfinancial asset derecognition as well as the accounting for partial sales of nonfinancial assets. The amendments conform the derecognition guidance on nonfinancial assets with the model for transactions in the new revenue standard. The amendments will be effective for the Bank for reporting periods beginning after December 15, 2017. The Bank does not expect these amendments to have a material effect on its financial statements. In February 2018, the FASB Issued (2018-02), Income Statement (Topic 220): Reclassification of Certain Tax Effects from Accumulated Other Comprehensive Income, which requires Companies to reclassify the stranded effects in other comprehensive income to retained earnings as a result of the change in the tax rates under the Tax Cuts and Jobs Act. The Bank has opted to early adopt this pronouncement by retrospective application to each period (or periods) in which the effect of the change in the tax rate under the Tax Cuts and Jobs Act is recognized. Other accounting standards that have been issued or proposed by the FASB or other standards-setting bodies are not expected to have a material impact on the Bank’s financial position, results of operations or cash flows. Note 2. Restrictions on Cash To comply with banking regulations, the Bank is required to maintain certain cash reserve balances. The daily cash reserve requirement was $647,000 and $218,000 at December 31, 2017 and 2016, respectively.

15
Notes to Financial Statements
Note 3. Securities Debt and equity securities have been classified in the balance sheet according to management’s intent. The carrying amount of securities (all available-for-sale) and their approximate fair values at December 31, 2017 and 2016, are: Amortized Unrealized Unrealized Fair Cost Gains Losses Value 2017 Government sponsored enterprises $ 14,860,617 $ 80,618 $ 179,780 $ 14,761,455 Mortgage-backed securities 5,133,613 1,243 66,077 5,068,779 $ 19,994,230 $ 81,861 $ 245,857 $ 19,830,234 2016 Government sponsored enterprises $ 13,221,557 $ 54,959 $ 169,345 $ 13,107,171 Mortgage-backed securities 2,768,075 2,829 50,136 2,720,768 $ 15,989,632 $ 57,788 $ 219,481 $ 15,827,939 The fair value of securities pledged for agreements to repurchase and public deposits combined were $653,069 and $2,358,073 at December 31, 2017 and 2016, respectively. There were no sales of investment securities for the years ended December 31, 2017 and 2016. As of December 31, 2017, ten government backed securities with a fair value of $7,245,152 and an unrealized loss of $197,758 had been in a continuous unrealized loss position for more than 12 months. As of December 31, 2016, one government backed securities with a fair value of $811,726 and an unrealized loss of $33,002 had been in a continuous unrealized loss position for more than 12 months. The scheduled maturities of available-for-sale debt securities were as follows: December 31, 2017 Amortized Fair Cost Value Due in less than one year $ 1,000,000 $ 994,941 Due in one to three years 1,023,748 1,023,960 Due in three to five years 3,323,793 3,305,140 Due in five to ten years 4,000,243 4,010,415 Due after ten years 10,646,446 10,495,778 Total $ 19,994,230 $ 19,830,234 Management evaluates securities for other-than-temporary impairment at least on a quarterly basis, and more frequently when economic or market concerns warrant such evaluation. Consideration is given to (1) the length of time and the extent to which the fair value has been less than cost, (2) the financial condition and near-term prospects of the issuer, and (3) the intent and ability of the Bank to retain its investment in the issuer for a period of time sufficient to allow for any anticipated recovery in fair value. The unrealized losses in the Bank’s investment portfolio relate principally to current interest rates for similar types of securities. In analyzing an issuer’s financial condition, management considers whether the securities are issued by the federal government or its agencies, whether downgrades by bond rating agencies have occurred, and the results of reviews of the issuer’s financial condition. As management has the ability to hold debt securities for the foreseeable future, no declines are deemed to be other-than-temporary. At December 31, 2017, the Bank had $519,333 and $337,500 invested in Plexus Fund III and IV, respectively. The purpose of the funds are to invest in small businesses to promote growth, expansion and modernization of the sector, by working in partnership with the Small Business Administration as a source of additional funding. These investments are carried at par in other assets and are tested annually for impairment. The Bank has committed to invest a total of $1,000,000 and $1,500,000 in Plexus Fund III and IV, respectively.

16
Notes to Financial Statements
Note 4. Loans Receivable The major components of loans, excluding loans held for sale, on the balance sheet at December 31, 2017 and 2016, are as follows: 2017 2016 Commercial Real Estate $ 89,288,074 $ 74,647,086 Consumer Real Estate 63,111,157 53,636,362 Commercial and Industrial 18,296,865 17,081,466 Consumer 495,354 722,528 Total 171,191,450 146,087,442 Deferred loan fees and origination costs, net 526,687 560,111 Allowance for loan losses (1,717,181) (1,554,850) Loans, net of allowance $ 170,000,956 $ 145,092,703 As of December 31, 2017, there were $42,794,376 of loans pledged to the Federal Home Loan Bank (“FHLB”) of Atlanta to secure a $31,325,512 line of credit with no outstanding balance. As of December 31, 2016, there were $25,373,240 of loans pledged to the FHLB of Atlanta to secure a $17,836,118 line of credit, of which $5,260,800 was outstanding.

17
Notes to Financial Statements
Note 5. Allowance for Loan Losses and Credit Quality The following is an analysis of activity in the allowance for loan losses by portfolio segment in addition to the disaggregation of the allowance and outstanding loan balances, excluding loans held for sale, by impairment method as of and for the year ended December 31, 2017 and 2016:
Commercial
Real Estate
Consumer
Real Estate
Commercial
and Industrial Consumer Other Total
Allowance for loan losses:Beginning balance 685,009$ 566,227$ 177,262$ 30,693$ 95,659$ 1,554,850$
Charge-offs - - (1,638) - - (1,638) Recoveries - 6,358 5,334 - - 11,692 Provision 59,337 25,416 (23,857) 17,791 73,590 152,277
Ending balance - total 744,346$ 598,001$ 157,101$ 48,484$ 169,249$ 1,717,181$
Ending balance - individuallyevaluated for impairment 1,658$ -$ -$ 44,187$ -$ 45,845$
Ending balance - collectivelyevaluated for impairment 742,688$ 598,001$ 157,101$ 4,297$ 169,249$ 1,671,336$
Loans Receivable:Ending balance - total 89,288,074$ 63,111,157$ 18,296,865$ 495,354$ -$ 171,191,450$
Ending balance - individuallyevaluated for impairment 1,395,481$ 237,535$ 30,678$ 131,059$ -$ 1,794,753$
Ending balance - collectivelyevaluated for impairment 87,892,593$ 62,873,622$ 18,266,187$ 364,295$ -$ 169,396,697$
December 31, 2017
Commercial
Real Estate
Consumer
Real Estate
Commercial
and Industrial Consumer Other Total
Allowance for loan losses:Beginning balance 607,199$ 491,326$ 187,750$ 36,539$ 173,897$ 1,496,711$
Charge-offs - - - - - - Recoveries 37,280 - 3,443 - - 40,723 Provision 40,530 74,901 (13,931) (5,846) (78,238) 17,416
Ending balance - total 685,009$ 566,227$ 177,262$ 30,693$ 95,659$ 1,554,850$
Ending balance - individuallyevaluated for impairment 1,658$ -$ -$ 24,187$ -$ 25,845$
Ending balance - collectivelyevaluated for impairment 683,351$ 566,227$ 177,262$ 6,506$ 95,659$ 1,529,005$
Loans Receivable:Ending balance - total 74,647,086$ 53,636,362$ 17,081,466$ 722,528$ -$ 146,087,442$
Ending balance - individuallyevaluated for impairment 327,529$ 184,466$ 46,278$ 141,025$ -$ 699,298$
Ending balance - collectivelyevaluated for impairment 74,319,557$ 53,451,896$ 17,035,188$ 581,503$ -$ 145,388,144$
December 31, 2016

18
Notes to Financial Statements
Note 5. Allowance for Loan Losses and Credit Quality, continued The following is an analysis presenting impaired loan information by loan class as of December 31, 2017 and 2016:
Recorded
Investment
Unpaid
Principal
Balance
Related
Allowance
Interest Income
Recognized on
Impaired Loans
Average
Balance of
Impaired Loans
Impaired loans with no related allowance:Commercial Real Estate 1,196,354$ 1,196,354$ -$ 5,733$ 99,696$ Consumer Real Estate 237,535 347,149 - 4,055 425,357 Commercial and Industrial 30,678 30,678 - - 37,828 Consumer - - - - -
Total with no related allowance 1,464,567$ 1,574,181$ -$ 9,788$ 562,881$
Impaired loans with an allowance recorded:Commercial Real Estate 199,127$ 199,127$ 1,658$ 10,737$ 204,659$ Consumer Real Estate - - - - - Commercial and Industrial - - - - - Consumer 131,059 137,204 44,187 - 141,281
Total with related allowance 330,186$ 336,331$ 45,845$ 10,737$ 345,940$
Total impaired loansCommercial Real Estate 1,395,481$ 1,395,481$ 1,658$ 16,470$ 304,355$ Consumer Real Estate 237,535 347,149 - 4,055 425,357 Commercial and Industrial 30,678 30,678 - - 37,828 Consumer 131,059 137,204 44,187 - 141,281
Total impaired loans 1,794,753$ 1,910,512$ 45,845$ 20,525$ 908,821$
December 31, 2017
Recorded
Investment
Unpaid
Principal
Balance
Related
Allowance
Interest Income
Recognized on
Impaired Loans
Average
Balance of
Impaired Loans
Impaired loans with no related allowance:Commercial Real Estate 116,405$ 116,405$ -$ -$ 80,316$ Consumer Real Estate 184,466 300,439 - 2,216 306,995 Commercial and Industrial 46,278 46,278 - 233 51,789 Consumer - - - - -
Total with no related allowance 347,149$ 463,122$ -$ 2,449$ 439,100$
Impaired loans with an allowance recorded:Commercial Real Estate 211,124$ 211,124$ 1,658$ 8,608$ 216,053$ Consumer Real Estate - - - - - Commercial and Industrial - - - - - Consumer 141,025 147,170 24,187 - 152,077
Total with related allowance 352,149$ 358,294$ 25,845$ 8,608$ 368,130$
Total impaired loansCommercial Real Estate 327,529$ 327,529$ 1,658$ 8,608$ 296,369$ Consumer Real Estate 184,466 300,439 - 2,216 306,995 Commercial and Industrial 46,278 46,278 - 233 51,789 Consumer 141,025 147,170 24,187 - 152,077
Total impaired loans 699,298$ 821,416$ 25,845$ 11,057$ 807,230$
December 31, 2016

19
Notes to Financial Statements
Note 5. Allowance for Loan Losses and Credit Quality, continued Internally assigned risk ratings assist the Bank in determining the risk profile of each loan in the loan portfolio and changes in the internally assigned risk ratings are useful in monitoring trends in the loan portfolio quality. The four categories used by the Bank are Pass, Special mention, Substandard and Doubtful and can be generally described as follows:
Pass – these loans have a risk profile which range from superior quality with minimal credit risk to loans requiring management attention but still have an acceptable risk profile and continue to perform primarily as contracted.
Special mention – these loans generally have underwriting guideline tolerances and/or exceptions with no
identifiable mitigating factors. These loans may also be currently performing satisfactorily but with potential weaknesses that may, if not corrected, weaken the asset or inadequately protect the Bank’s position at some future date. Potential weaknesses are the result of deviations from prudent lending practices. The loans may also have adverse economic conditions that developed subsequent to the loan origination that do not jeopardize liquidation of the debt, but do substantially increase the level of risk.
Substandard – these loans are inadequately protected by the current sound net worth and paying capacity of the
obligor or of the collateral pledged, if any. Loans classified as substandard must have a well-defined weakness or weaknesses that jeopardize the liquidation of the debt; they are characterized by the distinct possibility that the Bank will sustain some loss if the deficiencies are not corrected. These loans are no longer considered to be adequately protected due to the borrower’s declining net worth, lack of earnings capacity, declining collateral margins and/or unperfected collateral positions. A possibility of loss of a portion of the loan balance cannot be ruled out. The repayment ability of the borrower is marginal or weak and the loan may have exhibited excessive overdue status or extensions and/or renewals.
Doubtful – these loans have all the weaknesses inherent in loans classified Substandard, plus the added
characteristic that the weaknesses make collection or liquidation in full on the basis of currently existing facts, conditions, and values highly questionable and improbable. The ability of the borrower to service the debt is extremely weak, overdue status is constant, the debt has been placed on nonaccrual status, and no definite repayment schedule exists. Certain events may occur which would salvage the debt including an injection of capital into the borrower, alternative financing obtained by the borrower or liquidation of assets or the pledging of additional collateral by the borrower.
An analysis of the loan portfolio, excluding loans held for sale, based upon the internally assigned risk ratings as of December 31, 2017 and 2016, is as follows:
Commercial
Real Estate
Consumer Real
Estate
Commercial
and Industrial Consumer Total
Risk rating:Pass 86,548,549$ 62,200,961$ 17,604,497$ 364,295$ 166,718,302$ Special mention 2,540,398 350,802 661,690 - 3,552,890 Substandard 199,127 559,394 30,678 131,059 920,258 Doubtful - - - - -
Total 89,288,074$ 63,111,157$ 18,296,865$ 495,354$ 171,191,450$
December 31, 2017
20
Notes to Financial Statements
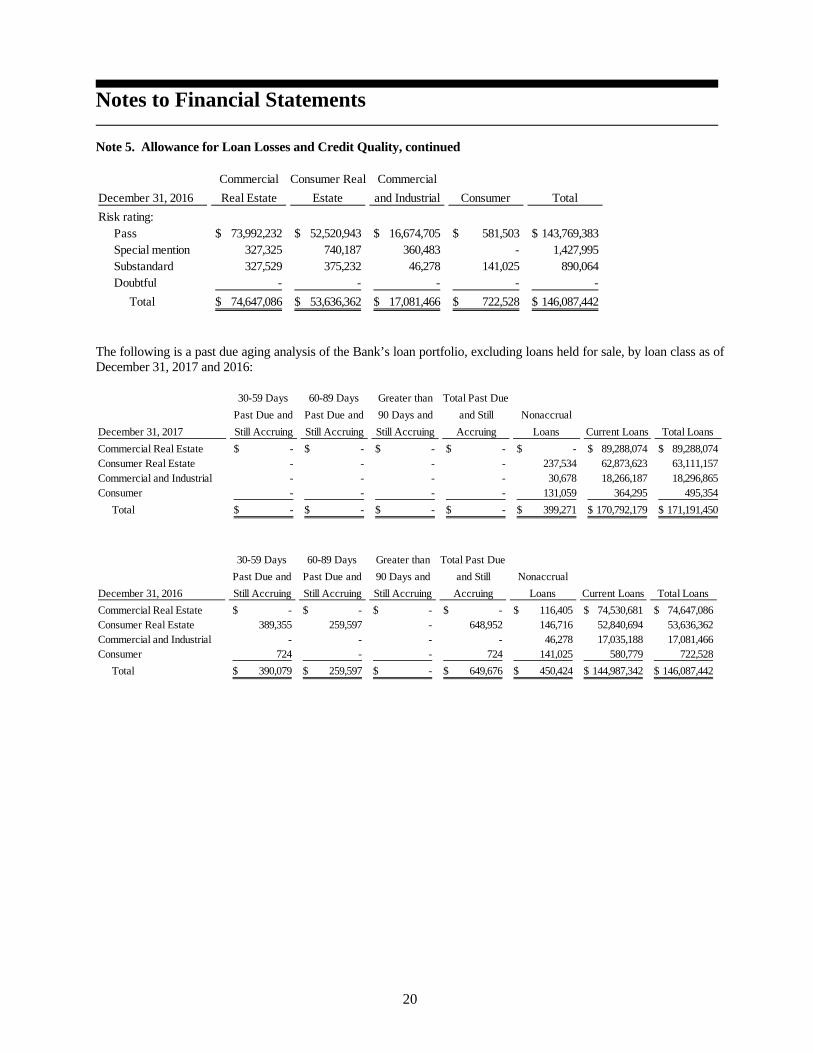
Note 5. Allowance for Loan Losses and Credit Quality, continued
The following is a past due aging analysis of the Bank’s loan portfolio, excluding loans held for sale, by loan class as of December 31, 2017 and 2016:
Commercial
Real Estate
Consumer Real
Estate
Commercial
and Industrial Consumer Total
Risk rating:Pass 73,992,232$ 52,520,943$ 16,674,705$ 581,503$ 143,769,383$ Special mention 327,325 740,187 360,483 - 1,427,995 Substandard 327,529 375,232 46,278 141,025 890,064 Doubtful - - - - -
Total 74,647,086$ 53,636,362$ 17,081,466$ 722,528$ 146,087,442$
December 31, 2016
30-59 Days
Past Due and
Still Accruing
60-89 Days
Past Due and
Still Accruing
Greater than
90 Days and
Still Accruing
Total Past Due
and Still
Accruing
Nonaccrual
Loans Current Loans Total Loans
Commercial Real Estate -$ -$ -$ -$ -$ 89,288,074$ 89,288,074$ Consumer Real Estate - - - - 237,534 62,873,623 63,111,157 Commercial and Industrial - - - - 30,678 18,266,187 18,296,865 Consumer - - - - 131,059 364,295 495,354
Total -$ -$ -$ -$ 399,271$ 170,792,179$ 171,191,450$
December 31, 2017
30-59 Days
Past Due and
Still Accruing
60-89 Days
Past Due and
Still Accruing
Greater than
90 Days and
Still Accruing
Total Past Due
and Still
Accruing
Nonaccrual
Loans Current Loans Total Loans
Commercial Real Estate -$ -$ -$ -$ 116,405$ 74,530,681$ 74,647,086$ Consumer Real Estate 389,355 259,597 - 648,952 146,716 52,840,694 53,636,362 Commercial and Industrial - - - - 46,278 17,035,188 17,081,466 Consumer 724 - - 724 141,025 580,779 722,528
Total 390,079$ 259,597$ -$ 649,676$ 450,424$ 144,987,342$ 146,087,442$
December 31, 2016

21
Notes to Financial Statements
Note 5. Allowance for Loan Losses and Credit Quality, continued During the year ended December 31, 2017, there was one loan modified by the Bank that was considered to be a troubled debt restructuring (TDR). The terms of this loan were modified upon renewal to be interest only as a result of the deteriorating financial position of the borrower. During the year ended December 31, 2016, there were no loans modified by the Bank that were considered to be TDRs. There were no TDRs that subsequently defaulted during the years ended December 31, 2017 and 2016. An analysis of the number of TDRs by loan type occurring during the year ended December 31, 2017, follows:
Troubled Debt Restructurings
For the year ended December 31, 2017
Number of Contracts
Pre-Modification Outstanding Recorded
Investment
Post-Modification Outstanding Recorded
Investment
Commercial Real Estate 1 $ 1,196,354 $ 1,196,354
Total 1 $ 1,196,354 $ 1,196,354 Note 6. Property and Equipment Components of Property and Equipment Components of property and equipment and total accumulated depreciation at December 31, 2017 and 2016, are as follows: 2017 2016 Land $ 1,677,575 $ 1,677,575 Buildings and improvements 978,151 380,773 Furniture and equipment 257,000 245,087 Property and equipment, total 2,912,726 2,303,435 Less accumulated depreciation 401,807 406,845 Property and equipment, net of depreciation $ 2,510,919 $ 1,896,590 Depreciation expense was $98,341 and $104,666 for the years ended December 31, 2017 and 2016, respectively.

22
Notes to Financial Statements
Note 6. Property and Equipment, continued Leases In September 2007, the Bank (in its pre-organizational phase) entered into an operating lease on the modular bank building in Mooresville. Total rent expense at the Mooresville location for the fiscal years ended December 31, 2017 and 2016, was $69,174 both years. In June 2008, the Bank entered into an operating lease for its branch facility in Huntersville. Total rent expense at the Huntersville location was $133,499 and $132,507 for the fiscal years ended December 31, 2017 and 2016, respectively. In February 2015, the Bank entered into an operating lease for its branch facility in Statesville. Total rent expense at the Statesville location for the fiscal years ended December 31, 2017 and 2016, was $24,000 both years. In May 2016, the Bank entered into an operating lease for its now vacated loan production office in Charlotte. Total rent expense at the Charlotte location was $6,750 and $4,550 for the fiscal years ended December 31, 2017 and 2016, respectively. In September 2017, the Bank entered into an operating lease for its branch facility in Downtown Mooresville. Total rent expense at the Downtown Mooresville location was $8,000 for the fiscal year ended December 31, 2017. Future minimum lease payments are as follows: 2018 $ 237,966 2019 166,477 2020 162,380 2021 149,749 2022 153,886 2023 77,992 $ 948,450 Note 7. Deposits The aggregate amount of time deposits in denominations that met or exceeded the FDIC insurance limit of $250,000 or more at December 31, 2017 and 2016 was $12,752,573 and $10,390,579, respectively. At December 31, 2017, the scheduled maturities of time deposits are as follows: 2018 $ 18,218,522 2019 19,508,642 2020 409,546 2021 461,305 2022 1,025,480 $ 39,623,495 Brokered deposits totaled $15,511,157 and $8,252,404 as of December 31, 2017 and 2016, respectively. Note 8. Borrowings Lines of Credit The Bank has established credit facilities to provide additional liquidity if and as needed. These credit facilities consist of unsecured lines of credit with correspondent banks for federal funds purchased totaling $29,800,000 and a secured line of credit with FHLB of Atlanta of $31,325,512 for a total of $61,125,512 available. Borrowings under these credit facilities are as follows: Maturity Interest Rate 2017 2016 FHLB of Atlanta Overnight 0.79% $ - $ 5,260,800 Correspondent banks Overnight 2.40% 2,990,000 - $ 2,990,000 $ 5,260,800

23
Notes to Financial Statements
Note 8. Borrowings, continued Repurchase Agreements The Bank had no securities sold under agreements to repurchase that mature on a daily basis at December 31, 2017. The Bank had $259,705 of securities sold under agreements to repurchase that mature on a daily basis at December 31, 2016. The weighted average interest rate on these agreements was 0.40 percent at December 31, 2016. Note 9. Fair Value of Financial Instruments
The Bank utilizes fair value measurements to record fair value adjustments to certain assets and liabilities and to determine fair value disclosures. Securities available-for-sale, trading securities and derivatives, if present, are recorded at fair value on a recurring basis. Additionally, from time to time, the Bank may be required to record at fair value other assets on a nonrecurring basis, such as loans held for sale, loans held for investment and certain other assets. Their nonrecurring fair value adjustments typically involve application of lower of cost or market accounting or write-downs of individual assets. Fair Value Hierarchy Under FASB ASC Topic 820 “Fair Value Measurements and Disclosures” (FASB ASC 820), the Bank groups assets and liabilities at fair values in three levels, based on the markets in which the assets and liabilities are traded and the reliability of the assumptions used to determine fair value. These levels are:
Level 1: Valuation is based upon quoted prices for identical instruments traded in active markets.
Level 2: Valuation is based upon quoted prices for similar instruments in active markets, quoted prices for identical or similar instruments in markets that are not active, and model-based valuation techniques for which all significant assumptions are observable in the market.
Level 3: Valuation is generated from model-based techniques that use at least one significant assumption not observable in the market. These unobservable assumptions reflect estimates of assumptions that market participants would use in pricing the asset or liability. Valuation techniques include use of option pricing models, discounted cash flow models and similar techniques.
Following is a description of valuation methodologies used for assets and liabilities recorded at fair value. Investment Securities Available-for-Sale Investment securities available-for-sale are recorded at fair value on a recurring basis. Fair value measurement is based upon quoted prices, if available. If quoted prices are not available, fair values are measured using independent pricing models or other model-based valuation techniques such as the present value of future cash flows, adjusted for the security’s credit rating, prepayment assumptions and other factors such as credit loss assumptions. Level 1 securities include those traded on an active exchange, such as the New York Stock Exchange, U. S. Treasury securities that are traded by dealers or brokers in active over-the-counter markets and money market funds. Level 2 securities include mortgage-backed securities issued by government sponsored entities, municipal bonds and corporate debt securities. Securities classified as Level 3 include asset-backed securities in less liquid markets. Impaired Loans The Bank does not record loans at fair value on a recurring basis. From time to time, a loan is considered impaired. The fair value of impaired loans is estimated using one of several methods, including collateral value, liquidation value, and discounted cash flows. When the fair value of collateral is based on an observable market price or a current appraised value, the Bank records the impaired loan as Level 2. If the fair value of the loan is based on criteria other than observable market prices or current appraised value, the loan is recorded as Level 3.
24
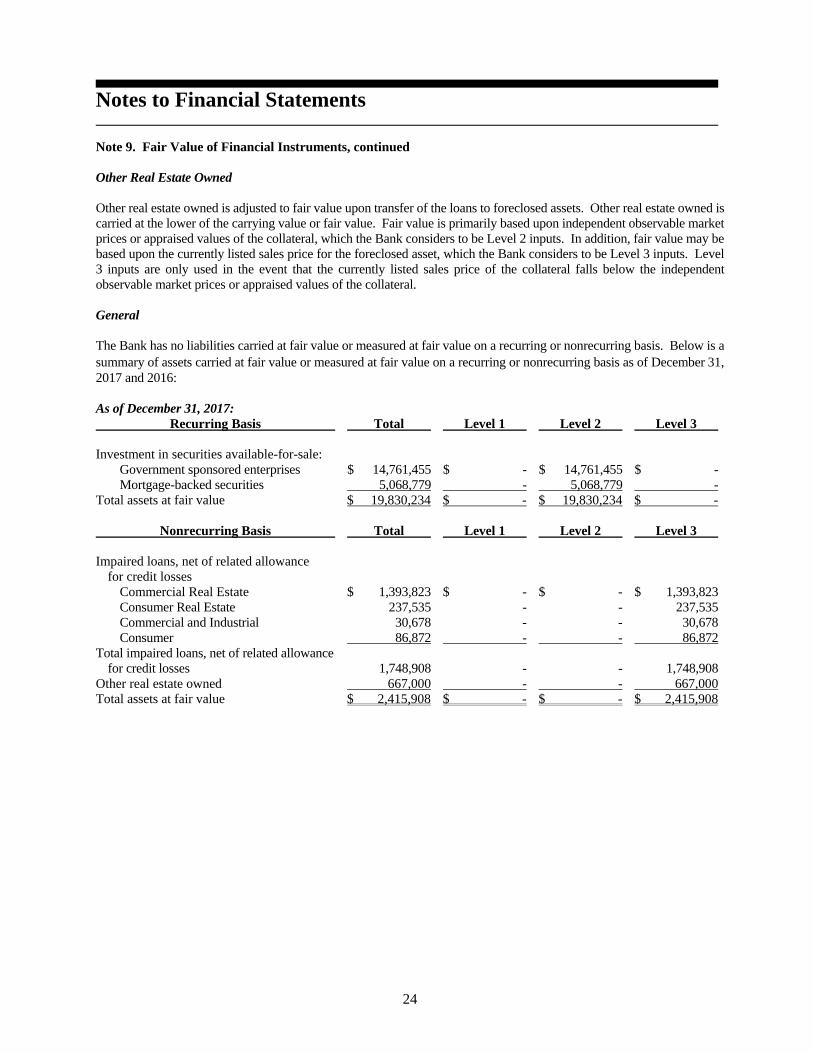
Notes to Financial Statements
Note 9. Fair Value of Financial Instruments, continued Other Real Estate Owned Other real estate owned is adjusted to fair value upon transfer of the loans to foreclosed assets. Other real estate owned is carried at the lower of the carrying value or fair value. Fair value is primarily based upon independent observable market prices or appraised values of the collateral, which the Bank considers to be Level 2 inputs. In addition, fair value may be based upon the currently listed sales price for the foreclosed asset, which the Bank considers to be Level 3 inputs. Level 3 inputs are only used in the event that the currently listed sales price of the collateral falls below the independent observable market prices or appraised values of the collateral. General The Bank has no liabilities carried at fair value or measured at fair value on a recurring or nonrecurring basis. Below is a summary of assets carried at fair value or measured at fair value on a recurring or nonrecurring basis as of December 31, 2017 and 2016: As of December 31, 2017: Recurring Basis Total Level 1 Level 2 Level 3 Investment in securities available-for-sale: Government sponsored enterprises $ 14,761,455 $ - $ 14,761,455 $ - Mortgage-backed securities 5,068,779 - 5,068,779 - Total assets at fair value $ 19,830,234 $ - $ 19,830,234 $ - Nonrecurring Basis Total Level 1 Level 2 Level 3 Impaired loans, net of related allowance for credit losses Commercial Real Estate $ 1,393,823 $ - $ - $ 1,393,823 Consumer Real Estate 237,535 - - 237,535 Commercial and Industrial 30,678 - - 30,678 Consumer 86,872 - - 86,872 Total impaired loans, net of related allowance for credit losses 1,748,908 - - 1,748,908 Other real estate owned 667,000 - - 667,000 Total assets at fair value $ 2,415,908 $ - $ - $ 2,415,908

25
Notes to Financial Statements
Note 9. Fair Value of Financial Instruments, continued As of December 31, 2016: Recurring Basis Total Level 1 Level 2 Level 3 Investment in securities available-for-sale: Government sponsored enterprises $ 13,107,171 $ - $ 13,107,171 $ - Mortgage-backed securities 2,720,768 - 2,720,768 - Total assets at fair value $ 15,827,939 $ - $ 15,827,939 $ - Nonrecurring Basis Total Level 1 Level 2 Level 3 Impaired loans, net of related allowance for credit losses Commercial Real Estate $ 325,871 $ - $ - $ 325,871 Consumer Real Estate 184,466 - - 184,466 Commercial and Industrial 46,278 - - 46,278 Consumer 116,838 - - 116,838 Total impaired loans, net of related allowance for credit losses 673,453 - - 673,453 Other real estate owned 767,000 - - 767,000 Total assets at fair value $ 1,440,453 $ - $ - $ 1,440,453 For Level 3 assets measured at fair value on a recurring or non-recurring basis as of December 31, 2017 and 2016, the significant unobservable inputs used in the fair value measurements were as follows:
Fair Value at December 31,
2017
Fair Value at December 31,
2016
Valuation Technique
Significant Unobservable
Inputs
General Range of Significant Unobservable Input Values
Impaired Loans $ 1,748,908
$ 673,453
Appraised
Value/Discounted Cash Flows/Market
Value of Note
Discounts to reflect current market
conditions, ultimate collectability, and estimated costs to
sell
0 – 18%
Other Real Estate Owned
$ 667,000
$ 767,000
Appraised Value/Comparable
Sales/Other Estimates from Independent
Sources
Discounts to reflect current market conditions and
estimated costs to sell
0 – 18%
For assets and liabilities that are not presented on the balance sheet at fair value, the Bank uses the following methods to determine fair value: Fair value estimates are made at a specific point in time, based on relevant market information and information about the financial instrument. These estimates do not reflect any premium or discount that could result from offering for sale at one time the Bank’s entire holdings of a particular financial instrument. Because no market exists for a portion of the Bank’s financial instruments, fair value estimates are based on judgments regarding future expected loss experience, current economic conditions, risk characteristics of various financial instruments, and other factors. These estimates are subjective in nature and involve uncertainties and matters of significant judgment and therefore cannot be determined with precision. Changes in assumptions could significantly affect the estimates.

26
Notes to Financial Statements
Note 9. Fair Value of Financial Instruments, continued Fair value estimates are based on existing on and off balance sheet financial instruments without attempting to estimate the value of anticipated future business and the value of assets and liabilities that are not considered financial instruments. Significant assets or liabilities not considered financial instruments include deferred tax assets and premises and equipment. In addition, the tax ramifications related to the realization of the unrealized gains and losses can have a significant effect on fair value estimates and have not been considered. The Bank’s fair value methods and assumptions for assets and liabilities that are not presented on the balance sheet at fair value are as follows: Cash and due from banks, FHLB stock, accrued interest receivable, repurchase agreements, and accrued interest
payable. The carrying value is a reasonable estimate of fair value. Loans, held for sale. The carrying value is a reasonable estimate of fair value based up the short period of time
these loans are held prior to sale in the secondary market. Loans, net. The carrying value for variable rate loans is a reasonable estimate of fair value due to contractual
interest rates based on prime. Fair value for fixed rate loans is estimated based upon discounted future cash flows using discount rates comparable to rates currently offered for such loans.
Deposit accounts. The fair value of certificates of deposit is estimated using rates currently offered for deposits of
similar remaining maturities. The fair value of all other deposit account types is the amount payable on demand at year end.
Repurchase agreements, federal funds purchased and Federal home loan bank borrowings. The carrying value of
variable rate borrowings is considered to approximate fair value.
Commitments to extend credit and standby letters of credit. The large majority of the Bank’s loan commitments are at variable rates, and therefore, are subject to minimal interest rate risk exposure. Therefore, the fair value of these financial instruments is considered to approximate the commitment amount.
Based on the limitations, methods, and assumptions noted, the estimated fair values of the Bank’s financial instruments at December 31, 2017 and 2016, are as follows: Carrying Fair Value Value December 31, 2017 Financial assets: Cash and cash equivalents $ 6,405,036 $ 6,405,036 Investment securities, available-for-sale 19,830,234 19,830,234 FHLB Stock 199,500 199,500 Loans, net 170,000,956 169,440,465 Financial liabilities: Deposit accounts 174,232,285 170,008,726 Federal funds purchased 2,990,000 2,990,000

27
Notes to Financial Statements
Note 9. Fair Value of Financial Instruments, continued Carrying Fair Value Value December 31, 2016 Financial assets: Cash and cash equivalents $ 5,107,822 $ 5,107,822 Investment securities, available-for-sale 15,827,939 15,827,939 FHLB Stock 448,400 448,400 Loans, held for sale 602,500 602,500 Loans, net 145,092,703 145,325,212 Financial liabilities: Deposit accounts 143,300,241 139,656,235 Repurchase agreements 259,705 259,705 Federal home loan bank borrowings 5,260,800 5,260,800 Note 10. Stock and Earnings per Share
Upon opening, the Bank issued 1,900,000 shares of common stock. On February 12, 2016, the Board of Directors declared a 20 percent stock dividend that was paid on March 21, 2016, to shareholders of record at the close of business on February 29, 2016. Share data for all periods reported has been restated to reflect this transaction. The Bank is authorized to issue 20,000,000 shares of common stock with a par value of $5 per share and 5,000,000 shares of preferred stock with no par value. Earnings per Share
The following table details the computation of basic and diluted earnings per common share for the years ended December 31, 2017 and 2016: 2017 2016
Net income available to common shareholders $ 1,327,828 $ 1,227,567
Weighted average shares outstanding, basic * 2,718,572 2,717,172 Effect of dilutive securities * 287,472 270,132 Weighted average shares outstanding, diluted * 3,006,044 2,987,304
Basic earnings per common share * $ 0.49 $ 0.45 Dilutive earnings per common share * $ 0.44 $ 0.41

28
Notes to Financial Statements
Note 11. Income Taxes Current and Deferred Income Tax Components On December 22, 2017, the President of the United States signed into law the Tax Cuts and Jobs Act (the “2017 Tax Act”). The 2017 Tax Act includes a number of changes to existing U.S. tax laws that impact the company, most notably a reduction of the U.S. corporate income tax rate from 34 percent to 21 percent for tax years beginning after December 31, 2017. The Bank recognized the income tax effects of the 2017 Tax Act in its 2017 financial statements in accordance with Staff Accounting Bulletin No. 118, which provides guidance for the application of ASC Topic 740, Income Taxes, in the reporting period in which the 2017 Tax Act was signed into law. As such, the Bank’s financial results reflect the income tax effects of the 2017 Tax Act for which the accounting under ASC Topic 740 is complete and provisional amounts for those specific income tax effects of the 2017 Tax Act for which the accounting under ASC Topic 740 is incomplete but a reasonable estimate could be determined. The Bank did not identify items for which the income tax effects of the 2017 Tax Act have not been completed and a reasonable estimate could not be determined as of December 31, 2017. The components of income tax expense (substantially all federal) for the years ended December 31, 2017 and 2016 are as follows: 2017 2016 Current $ 1,127,968 $ 813,334 Deferred expense (benefit) 228,571 (95,629) Income tax expense $ 1,356,539 $ 717,705 Deferred Income Tax Analysis The significant components of net deferred tax assets at December 31, 2017 and 2016 are summarized as follows: 2017 2016 Deferred tax assets Allowance for loan losses $ 284,833 $ 391,273 Unrealized losses on securities 37,686 61,378 Pre-opening expenses 79,092 148,636 Supplemental executive retirement plan accrual 389,731 524,540 Non-qualified stock option compensation expense 101,266 148,820 Other real estate owned 72,888 78,167 Depreciation 16,869 7,662 Other 39,514 40,718 Deferred tax asset 1,021,879 1,401,194 Deferred tax liabilities Deferred loan costs 206,234 323,245 Other 1,381 11,423 Deferred tax liability 207,615 334,668 Net deferred tax asset $ 814,264 $ 1,066,526 The Bank measures deferred tax assets and liabilities using enacted tax rates that will apply in the years in which the temporary differences are expected to be recovered or paid. Accordingly, the Bank’s deferred tax assets and liabilities were remeasured to reflect the reduction in the U.S. corporate income tax rate from 34 percent to 21 percent, resulting in a $435,486 increase in income tax expense for the year ended December 31, 2017 and a corresponding $435,486 decrease in net deferred tax assets as of December 31, 2017.

29
Notes to Financial Statements
Note 11. Income Taxes, continued The income tax expense for the years ended December 31, 2017 and 2016, is reconciled to the amount of income tax computed at the federal statutory rate of 34% on income before income taxes as follows: 2017 2016 Tax expense at statutory rate $ 912,685 $ 661,391 State income tax expense, net of federal expense 63,164 68,680 Increase (decrease) in taxes resulting from: Stock based compensation 9,642 9,619 Federal statutory rate change 435,486 - Other, net (64,438) (21,985) Income tax expense $ 1,356,539 $ 717,705 The Bank has analyzed the tax positions taken or expected to be taken in its tax returns and concluded it has no liability related to uncertain tax positions. The Bank files income tax returns with the federal government and the State of North Carolina. With few exceptions, the Bank is no longer subject to federal and state income tax examinations by tax authorities for tax years prior to 2014. Note 12. Commitments and Contingencies Litigation In the normal course of business, the Bank may be involved in various legal proceedings. Financial Instruments with Off-balance-sheet Risk The Bank is party to financial instruments with off-balance-sheet risk in the normal course of business to meet the financing needs of its customers. These financial instruments include commitments to extend credit and standby letters of credit. These instruments involve, to varying degrees, credit risk in excess of the amount recognized in the balance sheet. The Bank’s exposure to credit loss in the event of nonperformance by the other party to the financial instrument for commitments to extend credit and standby letters of credit is represented by the contractual amount of those instruments. The Bank uses the same credit policies in making commitments and conditional obligations as for on-balance-sheet instruments. Commitments to extend credit are agreements to lend to a customer as long as there is no violation of any condition established in the contract. Commitments generally have fixed expiration dates or other termination clauses and may require payment of a fee. Since many of the commitments are expected to expire without being drawn upon, the total commitment amounts do not necessarily represent future cash requirements. The Bank evaluates each customer’s creditworthiness on a case-by-case basis. The amount of collateral obtained, if deemed necessary by the Bank upon extension of credit, is based on management’s credit evaluation of the party. Collateral held varies but may include accounts receivable, inventory, property and equipment, residential real estate and income-producing commercial properties. Standby letters of credit are conditional financial commitments issued by the Bank to guarantee the performance of a customer to a third party. Those guarantees are primarily issued to support public and private borrowing arrangements. The credit risk involved in issuing letters of credit is essentially the same as that involved in extending loan facilities to customers. Collateral held varies as specified above and is required in instances which the Bank deems necessary.

30
Notes to Financial Statements Note 12. Commitments and Contingencies, continued Financial Instruments with Off-balance-sheet Risk, continued At December 31, 2017 and 2016, the following financial instruments were outstanding whose contract amounts represent credit risk: 2017 2016 Commitments to grant loans $ 20,003,963 $ 21,760,795 Unfunded commitments under lines of credit $ 23,712,233 $ 18,111,847 Standby letters of credit $ 177,097 $ 263,277 Concentrations of Credit Risk Substantially all of the Bank’s loans and commitments to extend credit have been granted to customers in the Bank’s market area and such customers are generally depositors of the Bank. The concentrations of credit by type of loan are set forth in Note 4. The Bank’s primary focus is toward consumer and small business transactions, and accordingly, it does not have a significant number of loans or commitments to any single borrower or group of related borrowers in excess of $2,000,000. The Bank from time to time may have cash and cash equivalents on deposit with financial institutions that exceed federally-insured limits. Note 13. Regulatory Restrictions Dividends The Bank, as a North Carolina banking corporation, may pay dividends only out of undivided profits (retained earnings) as determined pursuant to North Carolina General Statutes Section 53C. However, regulatory authorities may limit payment of dividends by any bank when it is determined that such a limitation is in the public interest and is necessary to ensure financial soundness of the bank. Capital Requirements The Bank is subject to various regulatory capital requirements administered by federal banking agencies. Failure to meet minimum capital requirements can initiate certain mandatory (and possibly additional discretionary) actions by regulators that, if undertaken, could have a direct material effect on the Bank’s financial statements. Under capital adequacy guidelines and the regulatory framework for prompt corrective action, the Bank must meet specific capital guidelines that involve quantitative measures of the Bank’s assets, liabilities, and certain off-balance-sheet items as calculated under regulatory accounting practices. The Bank’s capital amounts and classification are also subject to qualitative judgments by the regulators about components, risk weightings, and other factors. Quantitative measures established by regulation to ensure capital adequacy require the Bank to maintain minimum amounts and ratios (set forth in the table below) of total, Tier I capital, and Common Tier I capital to risk-weighted assets, and of Tier I capital to average assets, as all those terms are defined in the applicable regulations. As of December 31, 2017 and 2016, the Bank met all capital adequacy requirements to which it was subject.

31
Notes to Financial Statements
Note 13. Regulatory Restrictions, continued Capital Requirements, continued As of December 31, 2017 and 2016, the Bank met the criteria to be considered well capitalized under the regulatory framework for prompt corrective action. To be categorized as well capitalized, the Bank must maintain minimum total risk-based, Tier I risk-based, and Tier I leverage ratios. These minimum requirements as well as the Bank’s actual capital amounts and ratios are presented in the following table: Minimum To Be Well Minimum Capitalized Under Capital Prompt Corrective Actual Requirement Action Provisions Amount Ratio Amount Ratio Amount Ratio (thousands) December 31, 2017 Total Capital (to Risk-Weighted Assets) $ 26,878 15.2% $ 14,177 8.0% $ 17,721 10.0% Tier 1 Capital (to Risk-Weighted Assets) $ 25,161 14.2% $ 10,633 6.0% $ 14,177 8.0% Common Equity Tier 1 Capital (to Risk-Weighted Assets) $ 25,161 14.2% $ 7,974 4.5% $ 11,519 6.5% Tier 1 Capital (to Average Assets) $ 25,161 12.5% $ 8,026 4.0% $ 10,033 5.0% Minimum To Be Well Minimum Capitalized Under Capital Prompt Corrective Actual Requirement Action Provisions Amount Ratio Amount Ratio Amount Ratio (thousands) December 31, 2016 Total Capital (to Risk-Weighted Assets) $ 25,334 16.5% $ 12,312 8.0% $ 15,390 10.0% Tier 1 Capital (to Risk-Weighted Assets) $ 23,779 15.5% $ 9,234 6.0% $ 12,312 8.0% Common Equity Tier 1 Capital (to Risk-Weighted Assets) $ 23,779 15.5% $ 6,925 4.5% $ 10,003 6.5% Tier 1 Capital (to Average Assets) $ 23,779 13.8% $ 6,868 4.0% $ 8,585 5.0%
In July 2013, the Federal Reserve and the FDIC approved revisions to their capital adequacy guidelines and prompt corrective action rules that implement the revised standards of the Basel Committee on Banking Supervision, commonly called “Basel III,” and address relevant provision of the Dodd-Frank Act. Basel III refers to two consultative documents released by the Basel Committee on Banking Supervision in December 2009, the rules text released in December 2010, and loss absorbency rules issued in January 2011, which include significant changes to bank capital, leverage, and liquidity requirements.

32
Notes to Financial Statements Note 13. Regulatory Restrictions, continued Capital Requirements, continued The rules include new risk-based capital and leverage ratios, which became effective on January 1, 2015, and revise the definition of what constitutes “capital” for purposes of calculating those ratios. The new minimum capital level requirements applicable to the Bank are: (i) a new common equity Tier 1 capital ratio of 4.5 percent; (ii) a Tier 1 capital ratio of 6.0% (increased from 4.0 percent); (iii) a total capital ratio of 8.0 percent (unchanged from current rules); and (iv) a Tier 1 leverage ratio of 4.0 percent for all institutions. The rules eliminate the inclusion of certain instruments, such as trust preferred securities, from Tier 1 capital. Instruments issued prior to May 19, 2010, will be grandfathered for companies with consolidated assets of $15 billion or less. The rules also establish a “capital conservation buffer” of 2.5 percent above the new regulatory minimum capital requirements, which must consist entirely of common equity Tier 1 capital and result in the following minimum ratios: (i) a common equity Tier 1 capital ratio of 7.0 percent, (ii) a Tier 1 capital ratio of 8.5 percent and (iii) a total capital ratio of 10.5 percent. The new capital conservation buffer requirement will be phased in beginning in January 2016 at 0.625 percent of risk-weighted assets and will increase by that amount each year until fully implemented in January 2019. An institution will be subject to limitations on paying dividends, engaging in share repurchases, and paying discretionary bonuses if its capital level falls below the buffer amount. These limitations will establish a maximum percentage of eligible retained income that may be utilized for such actions. Note 14. Transactions with Related Parties The Bank has entered into transactions with its directors, significant shareholders and their affiliates (related parties). Such transactions were made in the ordinary course of business on substantially the same terms and conditions, including interest rates and collateral, as those prevailing at the same time for comparable transactions with other customers, and did not, in the opinion of management, involve more than normal credit risk or present other unfavorable features. Annual activity consisted of the following: 2017 2016 Beginning balance $ 737,483 $ 603,202 New loans and advances 3,364,105 545,465 Repayments (802,187) (411,184) Ending balance $ 3,299,401 $ 737,483 Deposits and repurchase agreements from related parties held by the Bank at December 31, 2017 and 2016, amounted to $8,999,425 and $3,355,862, respectively. Note 15. Employee Benefit Plans Defined Contribution Plan The Bank maintains a profit sharing plan pursuant to Section 401(k) of the Internal Revenue Code of 1986, as amended (the “Code”). The plan covers substantially all full-time employees who are 21 years of age and have completed 90 days of service. Participants may contribute a percentage of compensation, subject to a maximum allowed under the Code. In addition, the Bank matches certain contributions and may make additional contributions at the discretion of the Board of Directors. The Bank’s contributions were $60,699 and $64,487 for the years ended December 31, 2017 and 2016, respectively.
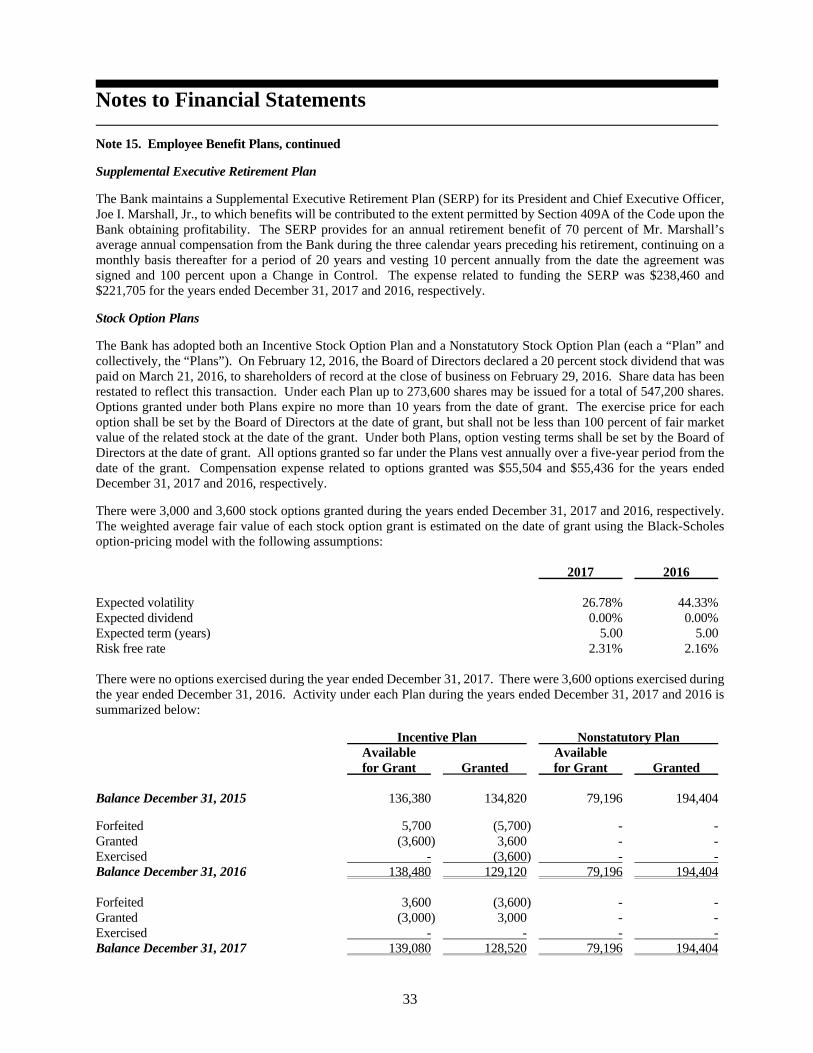
33
Notes to Financial Statements Note 15. Employee Benefit Plans, continued Supplemental Executive Retirement Plan
The Bank maintains a Supplemental Executive Retirement Plan (SERP) for its President and Chief Executive Officer, Joe I. Marshall, Jr., to which benefits will be contributed to the extent permitted by Section 409A of the Code upon the Bank obtaining profitability. The SERP provides for an annual retirement benefit of 70 percent of Mr. Marshall’s average annual compensation from the Bank during the three calendar years preceding his retirement, continuing on a monthly basis thereafter for a period of 20 years and vesting 10 percent annually from the date the agreement was signed and 100 percent upon a Change in Control. The expense related to funding the SERP was $238,460 and $221,705 for the years ended December 31, 2017 and 2016, respectively.
Stock Option Plans
The Bank has adopted both an Incentive Stock Option Plan and a Nonstatutory Stock Option Plan (each a “Plan” and collectively, the “Plans”). On February 12, 2016, the Board of Directors declared a 20 percent stock dividend that was paid on March 21, 2016, to shareholders of record at the close of business on February 29, 2016. Share data has been restated to reflect this transaction. Under each Plan up to 273,600 shares may be issued for a total of 547,200 shares. Options granted under both Plans expire no more than 10 years from the date of grant. The exercise price for each option shall be set by the Board of Directors at the date of grant, but shall not be less than 100 percent of fair market value of the related stock at the date of the grant. Under both Plans, option vesting terms shall be set by the Board of Directors at the date of grant. All options granted so far under the Plans vest annually over a five-year period from the date of the grant. Compensation expense related to options granted was $55,504 and $55,436 for the years ended December 31, 2017 and 2016, respectively.
There were 3,000 and 3,600 stock options granted during the years ended December 31, 2017 and 2016, respectively. The weighted average fair value of each stock option grant is estimated on the date of grant using the Black-Scholes option-pricing model with the following assumptions: 2017 2016 Expected volatility 26.78% 44.33% Expected dividend 0.00% 0.00% Expected term (years) 5.00 5.00 Risk free rate 2.31% 2.16% There were no options exercised during the year ended December 31, 2017. There were 3,600 options exercised during the year ended December 31, 2016. Activity under each Plan during the years ended December 31, 2017 and 2016 is summarized below:
Incentive Plan Nonstatutory Plan Available Available for Grant Granted for Grant Granted Balance December 31, 2015 136,380 134,820 79,196 194,404
Forfeited 5,700 (5,700) - - Granted (3,600) 3,600 - - Exercised - (3,600) - - Balance December 31, 2016 138,480 129,120 79,196 194,404
Forfeited 3,600 (3,600) - - Granted (3,000) 3,000 - - Exercised - - - - Balance December 31, 2017 139,080 128,520 79,196 194,404

34
Notes to Financial Statements
Note 15. Employee Benefit Plans, continued A summary of option activity under the Plans during the periods ended December 31, 2017 and 2016, is presented below: Weighted Average Average Remaining Aggregate Options Exercise Contractual Intrinsic Outstanding Price Term Value (1) Outstanding at December 31, 2015 329,224 $ 7.21 4.58 years $ 1,248,081 Exercisable at December 31, 2015 259,084 $ 7.32 3.61 years $ 952,770 Granted 3,600 7.50 Forfeited (5,700) 6.97 Exercised (3,600) 6.40 Outstanding at December 31, 2016 323,524 $ 7.23 3.56 years $ 1,221,171 Exercisable at December 31, 2016 270,844 $ 7.30 2.82 years $ 1,002,354 Granted 3,000 8.24 Forfeited (3,600) 7.59 Exercised - - Outstanding at December 31, 2017 322,924 $ 7.23 2.57 years $ 1,217,157 Exercisable at December 31, 2017 287,464 $ 7.26 2.07 years $ 1,073,829 (1) The aggregate intrinsic value of a stock option in the table above represents the total pre-tax intrinsic value (the
amount by which the current market value of the underlying stock exceeds the exercise price of the option) that would have been received by the option holders had all option holders exercised their options on December 31, 2017, 2016 and 2015. This amount changes based on changes in the market value of the Bank’s stock. The fair value (present value of the estimated future benefit to the option holder) of each option grant is estimated on the date of grant using the Black-Scholes option pricing model.
There were 17,520 options vested during both years ended December 31, 2017 and 2016. Total unrecognized compensation expense related to outstanding non-vested stock options will be recognized over the following periods: 2018 $ 56,399 2019 43,211 2020 4,777 2021 3,082 2022 1,386 Total $ 108,855 Note 16. Subsequent Events Subsequent events are events or transactions that occur after the balance sheet date, but before financial statements are issued. Recognized subsequent events are events or transactions that provide additional evidence about conditions that existed at the date of the balance sheet, including the estimates inherent in the process of preparing financial statements. Nonrecognized subsequent events are events that provide evidence about conditions that did not exist at the date of the balance sheet but arose after that date. Management has reviewed events occurring through March 2, 2018, the date the financial statements were available to be issued, and no subsequent events occurred requiring accrual or disclosure.

35
Board of Directors and Employees
Board of Directors Kyle Cerminara .................................................................................................................... blueharbor wealth advisors
Kelley Earnhardt Miller (Chairman) ....................................................................................................... JR Motorsports
Abigail Jennings .............................................................................................................................Lake Norman Realty
Jim Marshall .......................................................................................................................................... blueharbor bank
Bynum Marshall ......................................................................................................................... MSC Industrial Supply
Rock Pickard, Jr. ...................................................................................................... Central Carolina Insurance Agency
Bill Pope (Vice Chairman) ............................................................................................................ Pope McMillan, P.A.
R. B. Sloan, Jr. ............................................................................................................... Southeastern Data Cooperative
Louis Stanfield, Jr. .......................................................... Stanfield & Blackman, LLC and Stanfield & Company, LLC
Rick Teague ................................................................................................................................ Techmet Carbides, Inc.
Employees Jim Marshall ....................................................................................................... President and Chief Executive Officer
Don Flowe ............................................................................................ Senior Vice President and Chief Credit Officer
Carl Larson ...................................................................................... Senior Vice President and Chief Financial Officer
Chris Nichols ............................................................................. Senior Vice President and Senior Commercial Lender
Doug Hendrix ........................................................................................... Senior Vice President and Market Executive
Gerald Huffman ..................................................................................................... Vice President and Branch Manager
Cliff Hunnicutt ....................................................................................................... Vice President and Branch Manager
Renee Jones .................................................................................. Vice President and Treasury Management Specialist
Stan Reece ........................................................................................................ Vice President and Commercial Lender
Heather Troutman ................................................................................................. Vice President and Mortgage Lender
Danielle Johnson ................................................................................ Vice President and Deposit Operations Manager
Sandi Long ...................................................................................................... Vice President and Compliance Manager
Beth Mills ............................................................................................... Vice President and Loan Operations Manager
Dava Brown ...................................................................................... Assistant Vice President and Mortgage Specialist
Tony Cornacchione ................................................................................................................................... Credit Analyst
Dawn Bradley ......................................................................................................................... Lead Universal Associate
Michelle Hancock ................................................................................................................... Lead Universal Associate
Robin Myers ........................................................................................................................... Lead Universal Associate
Kelsey Norwood ..................................................................................................................... Lead Universal Associate
Megan Burgess ................................................................................................................................ Universal Associate
Tabatha Campbell ............................................................................................................................ Universal Associate
Christine Glidden ............................................................................................................................. Universal Associate
Shelia Lockhart ................................................................................................................................ Universal Associate
Stacie Overcash-Ingle ...................................................................................................................... Universal Associate
Angela Petrea ................................................................................................................................... Universal Associate
Carol Root ....................................................................................................................................... Universal Associate
Tara Summers .................................................................................................................................. Universal Associate

36
Shareholders’ Information Annual Meeting The 2018 Annual Meeting of Shareholders of the Bank will be held on April 23, 2018, at 2:00 p.m., Eastern Daylight Saving Time, at Langtree Plantation, 554 Langtree Road, Mooresville, North Carolina 28117.
Requests for Information
Requests for information should be directed to Mr. Carl T. Larson, Senior Vice President and Chief Financial Officer, at blueharbor bank, Post Office Box 3546, Mooresville, North Carolina 28117.
Independent Auditors Elliott Davis, PLLC 500 E. Morehead Street, Suite 700 Charlotte, NC 28202
Stock Transfer Agent Broadridge Corporate Issuer Solutions, Inc. Post Office Box 1342 Brentwood, NY 11717
Federal Deposit Insurance Corporation
The Bank is a member of the Federal Deposit Insurance Corporation. This Annual Report has not been reviewed, or confirmed for accuracy or relevance by the Federal Deposit Insurance Corporation.
Mailing Address blueharbor bank Post Office Box 3546 Mooresville, North Carolina 28117
Internet Address http://www.blueharborbank.com/
Stock Information
Market Information. The Bank’s common stock began trading on July 7, 2008. As of February 28, 2018, there were approximately 505 holders of record, not including the number of persons or entities whose stock is held in nominee or street name through various brokerage firms or banks. The Bank’s stock is traded on the Over-The-Counter Bulletin Board under the symbol BLHK. Dividend Information. As of December 31, 2017, the Bank had not paid any cash dividends to shareholders since its formation on January 3, 2008. On January 28, 2013, the Board of Directors declared a 20 percent stock dividend that was paid on March 5, 2013, to shareholders of record at the close of business on February 15, 2013. On February 12, 2016, the Board of Directors declared a 20 percent stock dividend that was paid on March 21, 2016, to shareholders of record at the close of business on February 29, 2016. In determining whether to declare future dividends, the Board of Directors will take into account the Bank’s operating results, capital requirements, financial condition, tax considerations and other relevant factors including federal and state regulatory restrictions on dividends. Also, the Bank’s ability to declare and pay future cash dividends will be dependent upon, among other things, restrictions imposed by bank regulators and capital requirements of federal and state law. Stock Buyback. On January 29, 2013, the Bank reported the approval of a stock repurchase plan to repurchase up to $250,000 of common stock over a twelve month period, representing approximately 2.5 percent of the common stock outstanding. No shares were repurchased during the approved twelve month period. On October 21, 2015, the Bank reported the approval of a stock repurchase plan to repurchase up to $400,000 of common stock over a twelve month period, representing approximately 2.4 percent of the common stock outstanding. A total of 20,300 shares of common stock were repurchased under this plan with a weighted-average per share price of $7.66.

FOUR GREAT LOCATIONS SERVING IREDELL COUNTY AND THE CHARLOTTE METRO AREA
Mooresville Branch Located in Morrison Plantation
106 Corporate Park Drive Mooresville, NC 28117
(704) 662-7700
Downtown Mooresville Branch Located in Chamber of Commerce Building
151 E. Iredell Avenue Mooresville, NC 28115
(980) 444-6670
Huntersville Branch Located in Huntersville Square
104 North Statesville Road Huntersville, NC 28078
(704) 990-7200
Statesville Branch Located in Downtown Statesville
245 East Front Street Statesville, NC 28677
(704) 380-3101
www.blueharborbank.com