2 x 3 ∫ x 2 ( ) 1 x - WHEC MATHS Mr Stewart -...
14
Integration 1. Calculate (a) ∫ x 2 (x – 5) dx (b) 2 4 x 3 x 1 + ∫ dx (c) ( ) 2 2 1 x 2 2 x ∫ − + dx y = x 2 – 6x 2. Calculate the shaded area in the diagram opposite. 3. The diagram shows part of the graph of y = 7x – 10 – x 2 . Calculate the shaded area. y = 2x 2 + 2x – 20 4. Find the area between the curves shown. y = 40 + 5x – x 2 x y x y 2 5 x y
Transcript of 2 x 3 ∫ x 2 ( ) 1 x - WHEC MATHS Mr Stewart -...

Integration
1. Calculate (a) ∫ x2(x – 5) dx (b)
24x 3
x1
+∫ dx (c) ( )22
1 x
2
2
x ∫− + dx
y = x2 – 6x
2. Calculate the shaded area in the diagram
opposite.
3. The diagram shows part of the graph of
y = 7x – 10 – x2.
Calculate the shaded area.
y = 2x2 + 2x – 20
4. Find the area between the curves shown.
y = 40 + 5x – x2
x
y
x
y
2 5
x
y

5. The diagram opposite illustrates the graph
of y = f(x) where f(x) = 2x3 – x
2 – 8x + 4.
(a) Show that x – 2 is a factor of f(x) and
hence fully factorise f(x).
(b) Calculate the shaded area.
6. The diagram shows part of y = f(x).
(a) Find a formula for f(x).
(b) Calculate the area enclosed by f(x) and
the x-axis.
7. (a) Find the equation of the parabola opposite.
(b)..Hence calculate the shaded area between
this parabola and the line y = 2x.
y = x2 – px + 12
8.In the diagram opposite the area shown
is 60. The curve has equation
y = x2 – px + 12.
Calculate the value of p.
x
y
2
x
y
-1 1
4
x
y
(4,32)
y = 2x
8O
x
y
6
12

9. The diagram opposite shows the curve
y = x3 +2x
2 – 5x – 5 and the line AB.
The line AB is a tangent to the curve
at the point A(-2,5).
(a) Find the equation of the tangent AB.
(b) Hence find the coordinates of B.
(c) Calculate the shaded area between the
curve and the line.
10. The diagram shows a tunnel 36 metres
wide by 28 metres high.
The roof of the tunnel is in the form of a
parabola with equation y = 2
61 x - 24 .
(a) Find the coordinates of A and B.
(b) Calculate the shaded area.
11. f /(x) = 3x
2 – 4x + 6 and f(2) = 17.
Find a formula for f(x).
12. f /(x) =
x
x- 2x 23
and f(6) = 100.
Find a formula for f(x).
13. f /(x) = 4x(x
2 – 1) and f(-1) = 2. Find a formula for f(x).
14. The graph of y = g(x) passes through the point (3,-1).
If 2
2
x
1 - 3x
dx
dy= , express y in terms of x.
f(x)
15. The graphs of y = f(x) and y = g(x)
intersect at the point A on the y-axis. A
If g(x) = 4x + 2 and f /(x) = 2x – 6,
find f(x).
g(x)
x
yA(-2,5)
B
X
Y
18 m 18 m
28 m
A B
x
y

Integration 2
1. Find ∫ (2x2 – 2)(x
2 + 1) dx.
2. Given ∫ ( )6- dx
1 -2x
102
= , find p.
3. The diagram shows part of the graph of y = 3x2 – x
3.
Calculate the shaded area.
4. (a) f(x) crosses the x-axis at (1,0) and (5,0) and has a
maximum turning point at (3,8).
Find a formula for f(x).
(b) Calculate the area under the curve.
y = x3 – x
2 – 6x – 2
5. The diagram shows the curve y = x3 – x
2 – 6x – 2
and the straight line AB. This line is a tangent to
the curve at the point A(1,-8).
(a) Find the equation of this tangent at A.
(b) Find the coordinates of B.
(c) Calculate the shaded area.
−1 1 2 3 4
−2
−1
1
2
3
4
y
y
1 5
(3,8)
x
y
B
A

6. The diagram shows the graph of y = x2 – 5x + 4.
Calculate the shaded area.
f(x)
7. The diagram shows the graphs of f(x) = x2 – 4 and
g(x) = 4 – x2.
(a) Find the coordinates of A and B. A B
(b) Calculate the shaded area.
g(x)
8. The graph shows the line y = 2x + 8
and the curve y = x2 + 3x – 4.
Calculate the area between the line
and the curve.
x
y
x
y
x
y

9. The diagram shows the cubic function
y = x3 and the line y = x.
Calculate the shaded area.
y = x
y = x3
y = 21 x
2 + 4
10. Shown is part of the parabola
y = 21 x
2 + 4.
Calculate the shaded area.
x
y
x
y
-2 2

The Area under a Curve
1. The diagram opposite shows the graph of
y = x2 – 5x.
Calculate the shaded area.
2. The diagram shows the graph of
y = 4x – x2.
Calculate the area between the
curve and the x-axis.
3. The diagram shows part of the graph
of y = 6x + 2x2.
(a) Find the coordinates of A.
(b) Calculate the shaded area.
4. The dagram shows part of the graph of
y = 2x2 – 18.
(a) Calculate the coordinates of P and Q.
(b) Find the shaded area.
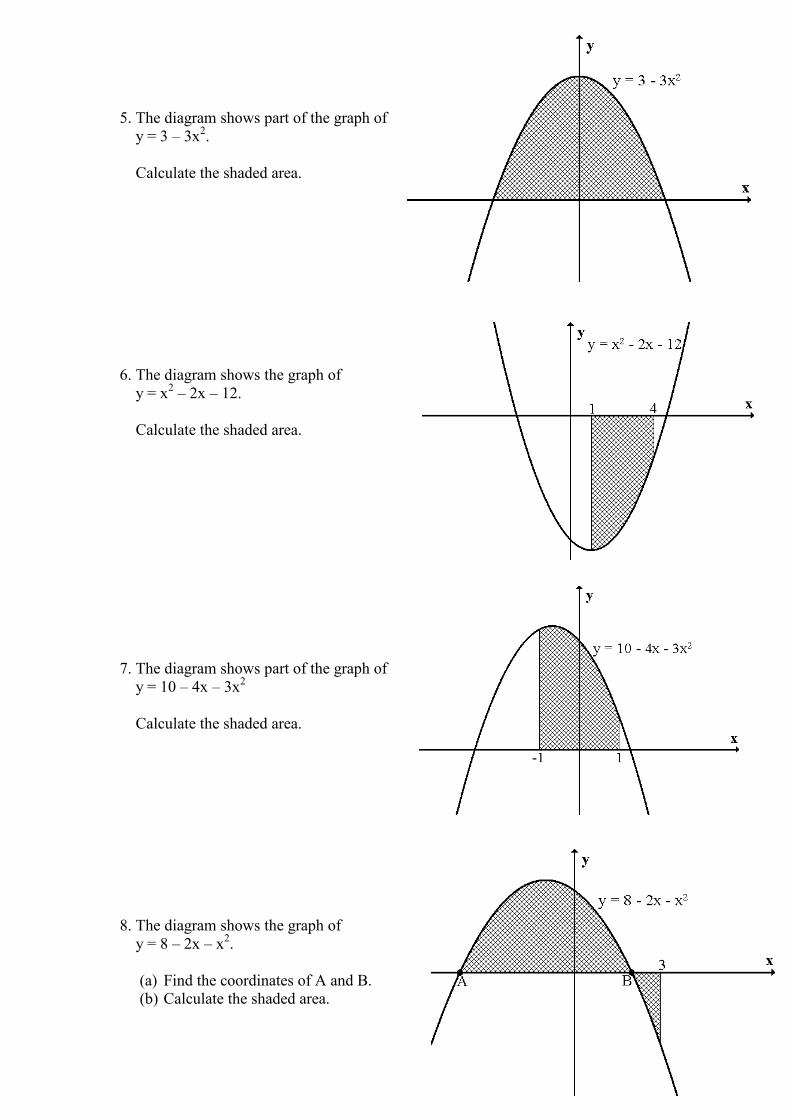
5. The diagram shows part of the graph of
y = 3 – 3x2.
Calculate the shaded area.
6. The diagram shows the graph of
y = x2 – 2x – 12.
Calculate the shaded area.
7. The diagram shows part of the graph of
y = 10 – 4x – 3x2
Calculate the shaded area.
8. The diagram shows the graph of
y = 8 – 2x – x2.
(a) Find the coordinates of A and B.
(b) Calculate the shaded area.

9. The diagram opposite shows part of the
graph of y = x3 – 3x
2 + 2x.
(a) Find the coordinates of P and Q.
(b) Calculate the shaded area.
10. The diagram shows the graph of
y = x3 – 3x
2 – 10x.
(a) Find the coordinates of A and B.
(b) Calculate the shaded area.
11. The diagram shows the graph of
y = x3 – 4x
2 – 7x + 10.
(a) Find the coordinates of A and B.
(b) Calculate the shaded area.
12. The diagram shows the graph of
y = x4 – 5x
2 + 4.
Calculate the shaded area.

Area Between two Curves
1. The diagram opposite shows the curve
y = 4x – x2 and the line y = 3.
(a) Find the coordinates of A and B.
(b) Calculate the shaded area.
2. The curves with equations y = x2 and
y = 2x2 – 25 intersect at P and Q.
Calculate the area enclosed between
the curves.
3. The diagram opposite shows the curve
y = 7x – 2x2 and the line y = 3x.
Calculate the shaded area.
4. The curves with equations y = 2x2 – 6
and y = 10 – 2x2 intersect at K and L.
Calculate the area enclosed by these two
curves.
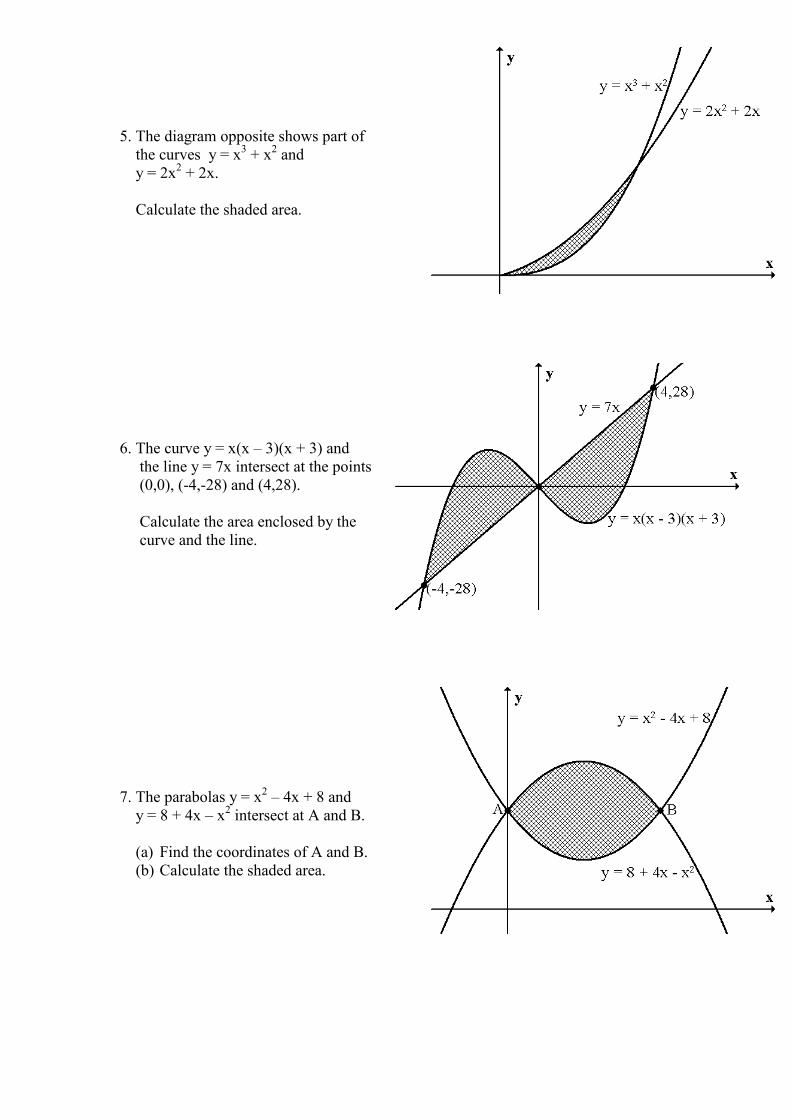
5. The diagram opposite shows part of
the curves y = x3 + x
2 and
y = 2x2 + 2x.
Calculate the shaded area.
6. The curve y = x(x – 3)(x + 3) and
the line y = 7x intersect at the points
(0,0), (-4,-28) and (4,28).
Calculate the area enclosed by the
curve and the line.
7. The parabolas y = x2 – 4x + 8 and
y = 8 + 4x – x2 intersect at A and B.
(a) Find the coordinates of A and B.
(b) Calculate the shaded area.

8. The diagram shows parts of the curves
y = x3 – 1 and y = x
2 – 1.
Calculate the shaded area.
9. The curve y = x3 – x
2 – 7x + 5 and the
line y = 2x – 4 are shown opposite.
(a) B has coordinates (1,-2). Find the
coordinates of A and C.
(b) Hence calculate the shaded area.
10. The diagram shows the line y = 3x – 5 and
the curve y = x3 – 5x
2 – 5x + 7.
(a) Find the coordinates of P and Q.
(b) Calculate the shaded area.
11. The diagram opposite shows an area
enclosed by 3 curves:
y = x(x + 3), 2x
4 y = and 2x
4
1 - x y =
(a) P and Q have coordinates (p,4) and (q,1).
Find the values of p and q.
(b) Calculate the shaded area.

Differential Equations
1. f / (x) = 6x
2 – 4x. Given f(2) = 10 find a formula for f(x).
2. f / (x) = 10x – 2x
3. Given f(2) = 0 find a formula for f(x).
3. dx
dy= 3 + 6x – x
2. When x = 3, y = 10. Find a formula for y.
4. dx
dy= 6x –
2x
5. Find a formula for the curve y given it passes through the
point (1,6).
5. dx
dy= 6x. - x3 Find a formula for y given the curve passes through (4,-30).
6. The gradient of the tangent to a curve is given by f / (x) = 6x
2 – 4. If the curve
passes through the point (2,7), find its equation.
7. The gradient of the tangent to a curve is given by dx
dy = 1
x
2+ . If the curve
passes through the point (9,10), find its equation.
8. f /(x) = 3x
2 – 4x + 6 and f(2) = 17.
Find a formula for f(x).
9. f /(x) =
x
x- 2x 23
and f(6) = 100.
Find a formula for f(x).
10. f /(x) = 4x(x
2 – 1) and f(-1) = 2. Find a formula for f(x).
11. The graph of y = g(x) passes through the point (3,-1).
If 2
2
x
1 - 3x
dx
dy= , express y in terms of x.
f(x)
12. The graphs of y = f(x) and y = g(x) A
intersect at the point A on the y-axis.
If g(x) = 4x + 2 and f /(x) = 2x – 6,
find f(x). x
y