2 THE NUTRIENT LOAD ASSESSMENT MODULE (NULAM) FOR …
34
27 2 THE NUTRIENT LOAD ASSESSMENT MODULE (NULAM) FOR THE NAREW RIVER BASIN 2.1 Introduction Diffuse sources of nutrients are especially important in the Narew River Basin due to the domination of agricultural land use in the area, the relative scarcity of industrial and urban areas and therefore, the limited size of existing point sources. This chapter describes a method for estimating the loads of nitrogen and phosphorus exported from the land to surface water. Subsequently, it presents the spatial distribution and volume of the nutrient export among different sub-catchments of the basin. The method is based on the assessment of the nutrients’ diffuse load emitted from the sub-catchment and of the load transported in surface waters. This also gives a picture of the spatial distribution and volume of both nitrogen and phosphorus emitted from a sub-catchment and transported by surface waters. In this study all emissions from sources that enter surface water in a diffuse manner and at intermittent intervals that are mainly related to meteorological events (Novotny & Chester, 1981) are defined as diffuse loads. The volume of the diffuse nutrient load is regarded as the difference between total export from a sub-catchment and the identifiable point source loads (Novotny & Olem, 1994). This implies that two main emission sources are considered: from land use and through excretion from humans and livestock. In recent years, diffuse sources have been of great concern because they are more difficult to estimate and to control than point sources (De Wit, 1999). They also add considerably to total nitrogen and phosphorus input loads (e.g. Iserman, 1990; Dojlido et al., 1994; Meinardi et at., 1995; Tonderski, 1997) and this share is gradually increasing in importance (De Wit et al., 2000) due to the strong reduction of point source emissions through the development of ‘cleaner’ production technologies, construction of more and better waste water treatment plants and upgrading of existing ones (e.g. Stanners & Bourdeau, 1995). Several other studies have investigated the impact of nutrient diffuse sources on surface water pollution. The issue has been examined for large river basins, such as the Mississippi River (Meade, 1995), the Rhine and Elbe rivers (De Wit, 1999), the Baltic Sea drainage area (Stalnacke, 1996; Arheimer & Brandt, 2000) as well as for smaller catchments (< 2000 km 2 ) (e.g. Ferrier et al., 1995; Johnes & Heathwaite, 1997; Dorioz et al., 1998; Brigault & Ruban, 2000). There have also been studies of diffuse nutrient emission and the export rate for North-east Poland. However, these either included the Narew River Basin as part of the much bigger basin of the Vistula river (Tonderski, 1997) or they concentrated on small, experimental catchments (Hillbricht-Ilkowska et al., 2000; Pinay & Burt, 2001) located within the Narew basin. Therefore, previous studies addressed the problem of nutrient emission at too coarse or too detailed scales to find the answer for the question of this study, which is the estimation of nutrient emissions to surface water in sub-catchments of the Narew River Basin. Thus, one of the challenges of the present study was to develop a method appropriate for a study area size of
Transcript of 2 THE NUTRIENT LOAD ASSESSMENT MODULE (NULAM) FOR …

27
2 THE NUTRIENT LOAD ASSESSMENT MODULE (NULAM) FOR THE NAREW RIVER BASIN
2.1 Introduction Diffuse sources of nutrients are especially important in the Narew River Basin due to the domination of agricultural land use in the area, the relative scarcity of industrial and urban areas and therefore, the limited size of existing point sources. This chapter describes a method for estimating the loads of nitrogen and phosphorus exported from the land to surface water. Subsequently, it presents the spatial distribution and volume of the nutrient export among different sub-catchments of the basin. The method is based on the assessment of the nutrients’ diffuse load emitted from the sub-catchment and of the load transported in surface waters. This also gives a picture of the spatial distribution and volume of both nitrogen and phosphorus emitted from a sub-catchment and transported by surface waters. In this study all emissions from sources that enter surface water in a diffuse manner and at intermittent intervals that are mainly related to meteorological events (Novotny & Chester, 1981) are defined as diffuse loads. The volume of the diffuse nutrient load is regarded as the difference between total export from a sub-catchment and the identifiable point source loads (Novotny & Olem, 1994). This implies that two main emission sources are considered: from land use and through excretion from humans and livestock. In recent years, diffuse sources have been of great concern because they are more difficult to estimate and to control than point sources (De Wit, 1999). They also add considerably to total nitrogen and phosphorus input loads (e.g. Iserman, 1990; Dojlido et al., 1994; Meinardi et at., 1995; Tonderski, 1997) and this share is gradually increasing in importance (De Wit et al., 2000) due to the strong reduction of point source emissions through the development of ‘cleaner’ production technologies, construction of more and better waste water treatment plants and upgrading of existing ones (e.g. Stanners & Bourdeau, 1995). Several other studies have investigated the impact of nutrient diffuse sources on surface water pollution. The issue has been examined for large river basins, such as the Mississippi River (Meade, 1995), the Rhine and Elbe rivers (De Wit, 1999), the Baltic Sea drainage area (Stalnacke, 1996; Arheimer & Brandt, 2000) as well as for smaller catchments (< 2000 km2) (e.g. Ferrier et al., 1995; Johnes & Heathwaite, 1997; Dorioz et al., 1998; Brigault & Ruban, 2000). There have also been studies of diffuse nutrient emission and the export rate for North-east Poland. However, these either included the Narew River Basin as part of the much bigger basin of the Vistula river (Tonderski, 1997) or they concentrated on small, experimental catchments (Hillbricht-Ilkowska et al., 2000; Pinay & Burt, 2001) located within the Narew basin. Therefore, previous studies addressed the problem of nutrient emission at too coarse or too detailed scales to find the answer for the question of this study, which is the estimation of nutrient emissions to surface water in sub-catchments of the Narew River Basin. Thus, one of the challenges of the present study was to develop a method appropriate for a study area size of

28
ca. 28000 km2, taking into account characteristic features such as hydrological divisions, land use and agricultural patterns. Some other preconditions which had to be met by the approach were that the method had to allow for a scenario study, that the module had to be compatible with two other modules in order to be able to build an integrated management tool (see chapter 4 for the water quality model and chapter 6 for the ecohydrological vegetation model) and yet being relatively simple and ready to implement at local decision making level. The method chosen fulfilled all the above-mentioned requirements. It is based on the concept of export coefficients (e.g. Vollenweider, 1968; Beaulac & Reckhow, 1982; Johnes, 1996) and is called the NULAM model (NUtrient Load Assessment Module). First, this chapter briefly presents the collected hydrological and statistical databases necessary for the analysis and the development of the module. Second, land use and agricultural characteristics of the basin are described against the background of its hydrological division. Then, the procedure for calculating nutrient loads is elaborated and explained, which is the core of NULAM. Subsequently, the observed loads in rivers, nutrient load export rates and the loads generated in the sub-catchments are presented with emphasis paid to their area-specific volume and spatial distribution. Finally, the results are discussed and conclusions are drawn. 2.2 Data In order to use the NULAM module, the appropriate data had to be collected. The analyses were performed for the hydrological units based on three types of data; hydrological, chemical and statistical. The hydrological units (sub-catchments) reflect the hydrological division of the basin and are distinguished mainly on the basis of the existing gauge station network, which is the required scale for this study. The hydrological and chemical data were obtained from field campaigns carried out directly at the required scale; their characteristics and methods of collecting are presented in chapter 3. Statistical data, however, were available only for administrative units, communities and voivodeships (the highest level administrative unit in the country). Thus, it was first necessary to combine and transform these data to the required hydrological units. 2.2.1 Hydrological division The part of the Narew River Basin which is the subject of analysis, (down to the gauge station of Zambski Koscielne, ca. 28000 km2) was divided into 52 different sub-catchments. These sub-catchments are the core elements on which all the calculations and analysis of nitrogen and phosphorus were performed. The division aimed to reflect the hydrological characteristics of the basin by including the major and the most important tributaries and by selecting important stretches along the main course. Additionally, the division was based on the network of gauge stations operated by the State Weather Service (IMGW) which enabled the use of available hydrological data (discharge, river profiles and river slopes). Thus, the selected set included two types of sub-catchments,
29
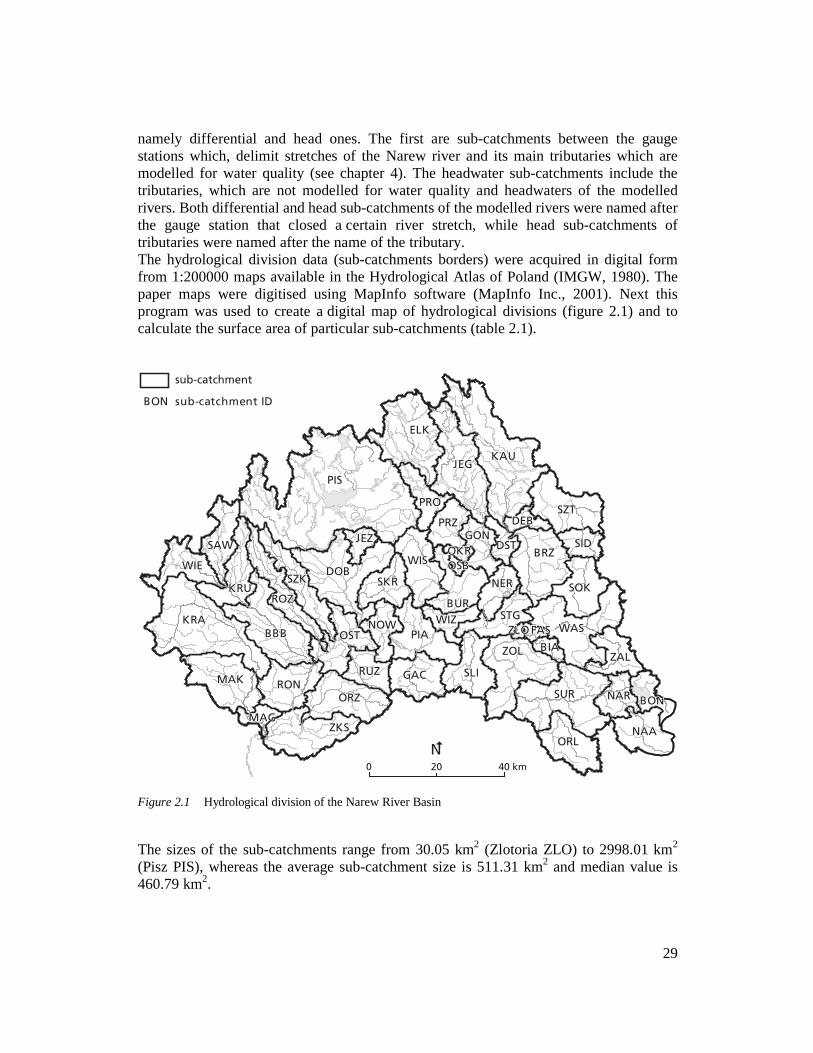
namely differential and head ones. The first are sub-catchments between the gauge stations which, delimit stretches of the Narew river and its main tributaries which are modelled for water quality (see chapter 4). The headwater sub-catchments include the tributaries, which are not modelled for water quality and headwaters of the modelled rivers. Both differential and head sub-catchments of the modelled rivers were named after the gauge station that closed a certain river stretch, while head sub-catchments of tributaries were named after the name of the tributary. The hydrological division data (sub-catchments borders) were acquired in digital form from 1:200000 maps available in the Hydrological Atlas of Poland (IMGW, 1980). The paper maps were digitised using MapInfo software (MapInfo Inc., 2001). Next this program was used to create a digital map of hydrological divisions (figure 2.1) and to calculate the surface area of particular sub-catchments (table 2.1).
Figure 2.1 Hydrological division of the Narew River Basin The sizes of the sub-catchments range from 30.05 km2 (Zlotoria ZLO) to 2998.01 km2 (Pisz PIS), whereas the average sub-catchment size is 511.31 km2 and median value is 460.79 km2.
30
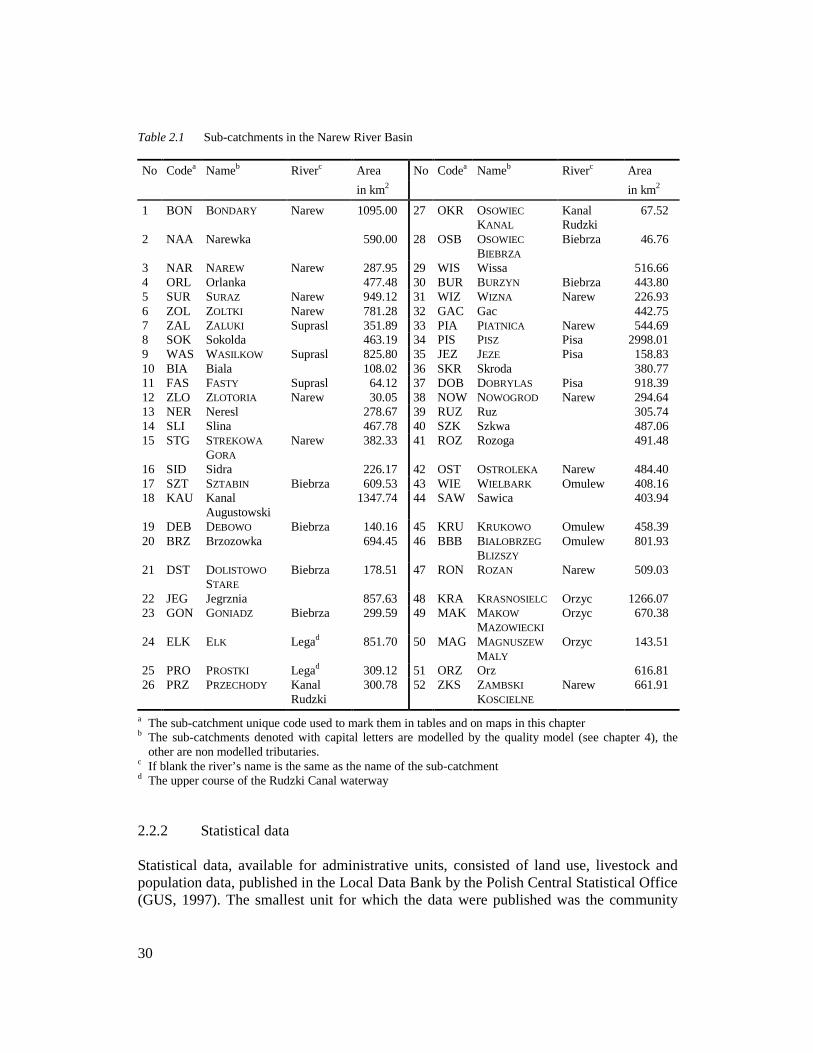
Table 2.1 Sub-catchments in the Narew River Basin
No Codea Nameb Riverc Area No Codea Nameb Riverc Area
in km2 in km2
1 BON BONDARY Narew 1095.00 27 OKR OSOWIEC
KANAL Kanal Rudzki
67.52
2 NAA Narewka 590.00 28 OSB OSOWIEC
BIEBRZA Biebrza 46.76
3 NAR NAREW Narew 287.95 29 WIS Wissa 516.66 4 ORL Orlanka 477.48 30 BUR BURZYN Biebrza 443.80 5 SUR SURAZ Narew 949.12 31 WIZ WIZNA Narew 226.93 6 ZOL ZOLTKI Narew 781.28 32 GAC Gac 442.75 7 ZAL ZALUKI Suprasl 351.89 33 PIA PIATNICA Narew 544.69 8 SOK Sokolda 463.19 34 PIS PISZ Pisa 2998.01 9 WAS WASILKOW Suprasl 825.80 35 JEZ JEZE Pisa 158.83 10 BIA Biala 108.02 36 SKR Skroda 380.77 11 FAS FASTY Suprasl 64.12 37 DOB DOBRYLAS Pisa 918.39 12 ZLO ZLOTORIA Narew 30.05 38 NOW NOWOGROD Narew 294.64 13 NER Neresl 278.67 39 RUZ Ruz 305.74 14 SLI Slina 467.78 40 SZK Szkwa 487.06 15 STG STREKOWA
GORA Narew 382.33 41 ROZ Rozoga 491.48
16 SID Sidra 226.17 42 OST OSTROLEKA Narew 484.40 17 SZT SZTABIN Biebrza 609.53 43 WIE WIELBARK Omulew 408.16 18 KAU Kanal
Augustowski 1347.74 44 SAW Sawica 403.94
19 DEB DEBOWO Biebrza 140.16 45 KRU KRUKOWO Omulew 458.39 20 BRZ Brzozowka 694.45 46 BBB BIALOBRZEG
BLIZSZY Omulew 801.93
21 DST DOLISTOWO
STARE Biebrza 178.51 47 RON ROZAN Narew 509.03
22 JEG Jegrznia 857.63 48 KRA KRASNOSIELC Orzyc 1266.07 23 GON GONIADZ Biebrza 299.59 49 MAK MAKOW
MAZOWIECKI Orzyc 670.38
24 ELK ELK Legad 851.70 50 MAG MAGNUSZEW
MALY Orzyc 143.51
25 PRO PROSTKI Legad 309.12 51 ORZ Orz 616.81 26 PRZ PRZECHODY Kanal
Rudzki 300.78 52 ZKS ZAMBSKI
KOSCIELNE Narew 661.91
a The sub-catchment unique code used to mark them in tables and on maps in this chapter b The sub-catchments denoted with capital letters are modelled by the quality model (see chapter 4), the
other are non modelled tributaries. c If blank the river’s name is the same as the name of the sub-catchment
d The upper course of the Rudzki Canal waterway 2.2.2 Statistical data Statistical data, available for administrative units, consisted of land use, livestock and population data, published in the Local Data Bank by the Polish Central Statistical Office (GUS, 1997). The smallest unit for which the data were published was the community

31
level; these were also the most detailed data available. The analysed area of the Narew River Basin is comprised of 146 communities in total of which 107 are located entirely within the basin whereas 39 are cut by the basin borders. A digital map of North-eastern Poland’s administrative division (1:200000) was obtained in MapInfo format (IMAGIS, 1997). The map contains the former division of the country, established in 1975. It consisted of two levels, communities and voivodeships. The current division into three levels (communities, counties and voivodeships) was established in 1999 and changed significantly the number of voivodeships and their borders. Communities remained the same. Since the analyses were carried out for the years 1996-1997 and some data (fertiliser usage) were available only for the former voivodeships the former division is regarded as more suitable and was used in this study. Figure 2.2 shows the Narew River Basin and the administrative units, communities and former voivodeships of North-eastern Poland. The Narew River Basin covers, entirely or partially, six voivodeships.
Figure 2.2 Narew River Basin and the administrative division of the region
32
Subsequently, the statistical data were attached to the map. The entire set of the statistical data for every community (polygon) consists of: - 8 land use characteristics (given in km2):
• forest, • meadow, • pasture, • arable land, • orchard, • waste land, • water (lakes), • built-up area;
- 5 livestock characteristics (given in head): • cattle, • pigs, • horses, • sheep, • poultry;
- 2 population characteristics (given in person number): • total population, • population connected to sewerage system.
The statistical data for one necessary characteristic, namely the amount of applied fertilisers, were not available at the community level: the most detailed level for which the data of fertiliser usage in kilograms per hectare were available (GUS, 1997b) was at the voivodeships level. 2.2.3 The recombination of the data The collection of data resulted in two maps of the basin differentiated by the way the area was divided into units. One map (figure 2.1) carries hydrological units data, the second (figure 2.2) has the statistical data linked to the administrative units (communities and voivodeships). Due to this discrepancy it was necessary to transform the statistical data from the administrative units to hydrological ones. This was done in MapInfo by overlaying the two maps and summarising the community based statistical data over the sub-catchment areas, which contained particular communities. In two cases: i) when the area of one community lies within more then one sub-catchment and ii) when a community is cut by a basin border (a part of the community is situated outside the basin) the data attributed to such a community were divided proportionally over respectively i) the sub-catchments that contain this community or ii) the part of the community located within the basin. The fertiliser data, available only for voivodeships, were transformed into hydrological units analogous to the data from communities.

33
2.2.4 Nutrient sources data The three main sources of nutrients in the sub-catchments are (Johnes, 1996): i) land use, ii) livestock production and iii) human waste deposition. The nutrient input of each source depends respectively: i) on land use for the inputs of nitrogen and phosphorus to each land use type through fertiliser applications and atmospheric deposition, ii) on livestock production for the nutrients excreted per animal for each livestock type and iii) on human waste for the nutrients deposited per head. According to one of the earlier North American studies of diffuse pollution (Rast & Lee, 1983) the validity of distinguishing more than four main land use type: agriculture, forest, urban area and wetlands in a catchment may be questionable. However, several recent studies (e.g. Jones & Heathwait, 1997; Twarog & Jarzabek, 1998; Brigault & Ruban, 2000) showed that when more detailed data are available the land use classification might be broader which enhances the precision of the results. In the Narew River Basin the combination of available statistical data and an extensive literature search on the livestock types and human excretion coefficients allowed the inclusion of population and six different land use types:
• forest, • arable land (including orchards), • grass land (meadows and pastures), • waste land, • water (lakes), • built-up area;
and five types of livestock: • cattle, • pigs, • horses, • sheep, • poultry
in the calculation of nutrient inputs in the sub-catchments. Land use The maps of figures 2.3-2.6 show the land use pattern over the basin divided into sub-catchments. Agricultural use of land dominates, with over 55% of the basin occupied by arable land (34.5%) and grass land (meadows and pastures, 20.6%). Arable land occupies more than 50% of all areas in the middle and south-western parts of the basin, reaching a maximum of 60.9% in the Makow Mazowiecki (MAK) sub-catchment (figure 2.3). It is also a major type (over 40%) in the south of the basin and in some sub-catchments in the east. In the north-western and south-eastern parts arable land occupies less and its share is below 30%, with a minimum of even less than 10% in the sub-catchment of the Narewka river (NAA). Grass land occupies relatively large parts of the sub-catchments of the west-east oriented strip going throughout the middle of almost the entire basin (figure 2.4), where its share is above 20% of total land, with a maximum of over 33% in the

34
Bialobrzeg Blizszy (BBB) sub-catchment. Less grass land is found in the outside sub-catchments in the north, south and east parts of the basin and in two middle sub-catchments dominated by arable land (Skroda river SKR and Nowogrod NOW). Its share drops below 10% in the sub-catchments of the Narewka river (NAA) and Wielbark (WIE), which are dominated by forests. Sub-catchments with more than 50% of forest cover (figure 2.5) are concentrated in three vast forest complexes: Knyszynska and Bialowieska Forests in the east and south-east, and Kurpiowska Forest in the north-west. Sub-catchments covering the cores of these complexes have the largest forest cover with almost 75% of area covered by forest in the Narewka river (NAA) sub-catchment. The other highly forested sub-catchments, over 30%, are located on the edges of those complexes and in the areas covered by smaller but compact forests in the north (Augustowska Forest) and south (Biala Forest) of the basin. The least forested sub-catchments dominated by arable land and/or green land are located in the south, middle and north-eastern parts of the basin along the Narew, Biebrza and Elk rivers. In the south and north-west forest cover is less than 30%, whereas in the middle it drops below 20%, reaching a minimum of just 6% in the Neresl river (NER), Piatnica (PIA) and Nowogrod (NOW) sub-catchments. The other three land use types distinguished cover less than 13% of the basin (figure 2.6) with waste land occupying over 7.5%, waters embracing 2.8% and built-up areas covering almost 2.5% of total land. The largest surface (over 20%) these three types occupy in i) the urban sub-catchment of the Biala river (BIA) containing the city of Bialystok, ii) sub-catchments of the Biebrza middle and lower courses having a large share of waste land and iii) sub-catchments in the north covering the Mazurian lake district. Except for the Biala river (BIA), Orlanka river (ORL) and Nowogrod (NOW) sub-catchments the built-up areas do not exceed 5% of total land and in 18 sub-catchments this figure is even below 2%. Lakes are almost restricted to the sub-catchments up north located in the Great Mazurian Lake District (7 sub-catchments) and the Bondary sub-catchment (BON) containing the Siemianowka reservoir. In the rest of the sub-catchments water covers less than 1.5% and in 17 of them lakes are not present at all.

35
Figure 2.3 Arable land (%) in sub-catchments of the Narew River Basin
Figure 2.4 Grass land (%) in sub-catchments of the Narew River Basin

36
Figure 2.5 Forest (%) in sub-catchments of the Narew River Basin
Figure 2.6 Water, waste land and built-up area (%) in sub-catchments of the Narew River Basin
37
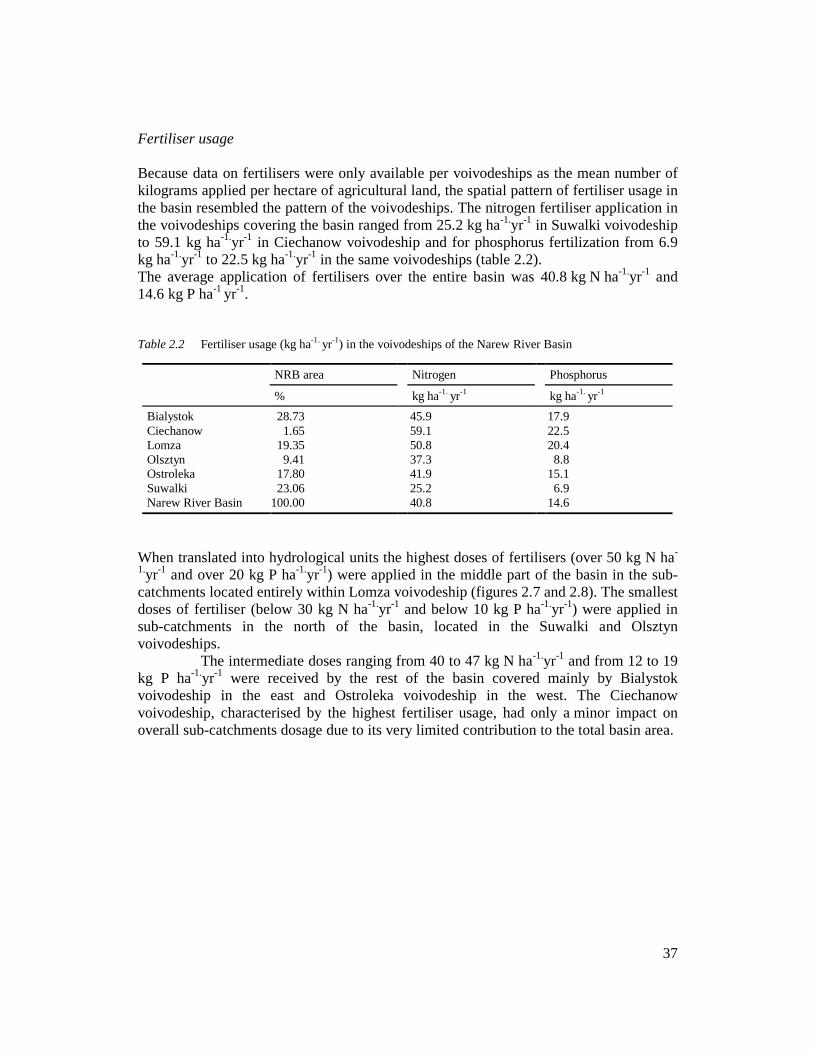
Fertiliser usage Because data on fertilisers were only available per voivodeships as the mean number of kilograms applied per hectare of agricultural land, the spatial pattern of fertiliser usage in the basin resembled the pattern of the voivodeships. The nitrogen fertiliser application in the voivodeships covering the basin ranged from 25.2 kg ha-1.yr-1 in Suwalki voivodeship to 59.1 kg ha-1.yr-1 in Ciechanow voivodeship and for phosphorus fertilization from 6.9 kg ha-1.yr-1 to 22.5 kg ha-1.yr-1 in the same voivodeships (table 2.2). The average application of fertilisers over the entire basin was 40.8 kg N ha-1.yr-1 and 14.6 kg P ha-1 yr-1. Table 2.2 Fertiliser usage (kg ha-1. yr-1) in the voivodeships of the Narew River Basin
NRB area Nitrogen Phosphorus
% kg ha-1. yr-1 kg ha-1. yr-1
Bialystok 28.73 45.9 17.9 Ciechanow 1.65 59.1 22.5 Lomza 19.35 50.8 20.4 Olsztyn 9.41 37.3 8.8 Ostroleka 17.80 41.9 15.1 Suwalki 23.06 25.2 6.9 Narew River Basin 100.00 40.8 14.6
When translated into hydrological units the highest doses of fertilisers (over 50 kg N ha-
1.yr-1 and over 20 kg P ha-1.yr-1) were applied in the middle part of the basin in the sub-catchments located entirely within Lomza voivodeship (figures 2.7 and 2.8). The smallest doses of fertiliser (below 30 kg N ha-1.yr-1 and below 10 kg P ha-1.yr-1) were applied in sub-catchments in the north of the basin, located in the Suwalki and Olsztyn voivodeships. The intermediate doses ranging from 40 to 47 kg N ha-1.yr-1 and from 12 to 19 kg P ha-1.yr-1 were received by the rest of the basin covered mainly by Bialystok voivodeship in the east and Ostroleka voivodeship in the west. The Ciechanow voivodeship, characterised by the highest fertiliser usage, had only a minor impact on overall sub-catchments dosage due to its very limited contribution to the total basin area.

38
Figure 2.7 Nitrogen fertiliser usage (kg.ha-1. yr-1) in sub-catchments of the Narew River Basin
Figure 2.8 Phosphorus fertiliser usage (kg.ha-1. yr-1) in sub-catchments of the Narew River Basin

39
Livestock In general the spatial distribution of livestock density followed the land use patterns of the basin. Two main characteristics could be distinguished i) all animal types were less dense in forest and lake dominated sub-catchments in the south-eastern and north-western parts of the basin and ii) non grazing animals (pigs and poultry) were also less frequent in sub-catchments having a large share of green land in west of the basin (figures from 2.9 to 2.12). In these sub-catchments densities were respectively below 20 head.km-2 for cattle and pigs (below 50 head.km-2 for pigs in green land dominated sub-catchments), 30 head.km-2 for poultry and 1.5 head.km-2 for horses and sheep, whereas average densities were respectively 28 head.km-2 for cattle, 40 head.km-2 for pigs, 71 head.km-2 for poultry and 3 head.km-2 for horses and sheep. All animal types except for horses and sheep were the most frequent in the south and middle sub-catchments where arable land dominated. Here figures exceeded respectively 40 head.km-2 for cattle, 80 head.km-2 for pigs, 110 head.km-2 for poultry. Additionally, such high poultry density occurred in the non-forested sub-catchments in the surroundings of the city of Bialystok. In the same sub-catchments and some other sub-catchments in the east the highest density of horses and sheep occurred, exceeding 4.5 head.km-2. The above average densities for all animal types were also recorded in the sub-catchments in the north-eastern part of the basin.
Figure 2.9 Cattle density (head.km-2) in sub-catchments of the Narew River Basin

40
Figure 2.10 Pigs density (head.km-2) in sub-catchments of the Narew River Basin
Figure 2.11 Horses and sheep density (head.km-2) in sub-catchments of the Narew River Basin

41
Figure 2.12 Poultry density (head.km-2) in sub-catchments of the Narew River Basin Population In 1997 the total population of the basin was just above 1.5 million inhabitants. This gives an average density just over 55 inhabitants.km-2, which is approximately half the country average of 118 inhabitants.km-2 (GUS, 1997b). So, the region is relatively sparsely populated with higher densities related only to a limited number of bigger towns. The highest density (figure 2.13), over 2000 inhabitants.km-2, was in the Biala river sub-catchment (BIA) covering a major part of the biggest city of the basin, Bialystok (ca. 285000 inhabitants). The other sub-catchments with density exceeding 80 inhabitants.km-2 cover; the part of the Bialystok located outside of the Biala river (BIA) sub-catchment (Fasty sub-catchment, FAS) or other major towns Lapy (Zoltki ZOL sub-catchment), Elk and Grajewo (Prostki PRO and Przechody PRZ sub-catchments), Zambrow (Gac river GAC sub-catchment), Lomza (Piatnica PIA and Nowogrod NOW sub-catchments), Ostroleka (Ostroleka OST and Rozan RON sub-catchments) and Makow Mazowiecki (Magnuszew Maly MAG sub-catchment).

42
Figure 2.13 Population density (person.km-2) in sub-catchments of the Narew River Basin The most sparsely populated sub-catchments are forest dominated areas in the south-western part of the basin and the Wielbark (WIE) sub-catchment with a population density below 18 inhabitants.km-2, reaching a minimum of less than 3 inhabitants.km-2 in the Bondary (BON) sub-catchment. For this study nine major towns (Bialystok, Lapy, Elk, Grajewo, Lomza, Piatnica, Pisz, Ostroleka and Makow Mazowiecki), which are located along the river stretches modelled in the water quality model (see chapter 4), are treated as point sources. All the other towns are treated as diffuse sources because they are too small to be included as point sources at this study scale. These nine selected town are located within 14 sub-catchments. For these sub-catchments inhabitants living in these town were assumed to be connected to sewerage. So, the population treated as diffuse source, for these sub-catchments, was reduced by number of inhabitants having their wastewater treated. The highest part of total population (88%) was connected to sewerage in the Biala river (BIA) sub-catchment. The total population of the rest 38 sub-catchments was regarded as not being connected, even though sewerage systems may be present there. Detailed data on land use, agriculture and population characteristics for all the sub-catchments are presented in Appendix A.1.

43
2.3 Method of computing nitrogen and phosphorus loads This section explains how NULAM calculates the nitrogen and phosphorus loads. The applied method is based on the export coefficient model (e.g. USEPA, 1980; Reckhow & Simpson, 1980; Beaulac & Reckhow, 1982; Rast & Lee, 1983; Delwich & Haith, 1983), originally developed in North America, which has also been frequently used in Western Europe (e.g. Vollenweider, 1968; Jorgensen, 1980; Johnes & O’Sullivan, 1989; Brigault & Ruban, 2000) as well as in Poland (Twarog & Jarzabek, 1998). It assumes that the relation between a) the total nutrient load generated in a sub-catchment (from different nutrient sources) and b) the observed nutrient load in the surface waters (draining this sub-catchment) at the point closing the area may be expressed by the export coefficient (equation 2.1). Liobs = ei * Ligen (2.1) where: Liobs – is observed load originating from sub-catchment i (kg.time-1), ei – is export coefficient for sub-catchment i, Ligen – is total load generated from the sum of all sources in sub-catchment i (kg.time-1). The export coefficients (ei) calculated for each of the sub-catchment by means of equation 2.1 describe the fate of total generated nutrients load reaching the surface water. Each of the export coefficients was assumed to be constant for the particular sub-catchment and was thus also used for the scenario study (see chapter 7). 2.3.1 Observed riverine load The combination of water quality data collected during the basin’s surface water monitoring campaigns and discharge data provided by the State Weather Service was used for assessing the nitrogen and phosphorus loads in the rivers of the basin. For every sub-catchment the mass balance equations (equations 2.2 and 2.3) at the closing point were constructed. Based on these equations the fraction of the loads originating from the particular sub-catchment was calculated. Lcp = Lup – (Liobs + Ltr) (2.2) Lx = Qx * Cx * k (2.3) where: Lcp – is the load at the closing point of the sub-catchment i (kg.time-1), Lup – is the load at the closing point of the sub-catchment upstream of sub-catchment i (kg.time-1), Ltr – is the load of the tributary which confluences to the river stretch of sub-catchment i (kg.time-1), Lx – is the load of water constituents x at certain location (kg.time-1), Qx – is the discharge measured at selected locations in September 1997 (m3.time-1),

44
Cx – is the concentration of water constituent x at certain location measured in September 1997 (mg.l-1), k – is units conversion factor. For the head sub-catchments the observed load originating from sub-catchment i (Liobs) is the load measured at the closing point of this area (Lcp). In the water quality monitoring program the two nitrogen compounds nitrate (NO3-N) and ammonium (NH4-N) were separately measured. Also the loads of these two compounds were separately calculated. Since the data for calculating generated load (Ligen) are available either only (fertiliser consumption) or predominantly (the excretion coefficients) for nitrogen the total N-load was found as the sum of the two compounds. 2.3.2 Sub-catchment generated load The nutrient load emitted in a sub-catchment originates from the three main nutrient sources: land use, livestock production and human waste deposition (see section 2.2.4). The total generated nutrient load is the sum of the loads coming from these sources and for sub-catchment i was calculated by the following equation: Ligen = Σ (Aij*Iij) + Σ (Nij*Eej) + Pi*Ep*R (2.4) where: Aij – is the area of sub-catchment i occupied by land use type j (ha), Iij – is the nutrient input coefficient for land use type j of sub-catchment i (kg.ha-1); Nij – is the number of livestock type j for sub-catchment i (animals), Eej – is the excretion coefficient for livestock type j (kg.animal-1), Pi – is the number of people for sub-catchment i (person), Ep – is the yearly emission coefficient of nutrients per person (kg.day-1), R – is the coefficient for removal of nutrients during wastewater treatment. The nutrient input coefficient (Iij) comprises of two characteristics: fertiliser application (F) and atmospheric deposition (D) and for sub-catchment i it is calculated as follows: Iij = Fij + D (2.5) where: Fij – is the fertiliser dose for land use type j of sub-catchment i (kg.ha-1), D – is the atmospheric deposition over the Narew River Basin (kg.ha-1). For sub-catchment i the area of each land use type, the number of each livestock type, the number of people and the fertiliser consumption characteristics were calculated based on statistical data and administrative and hydrological maps following the procedure described in section 2.2. The excretion coefficients and the human daily emission coefficient were derived from a literature survey (see below for sources). The variation of their values is enormous and depends very much on several reasons like the calculation method, the area they were derived from and applied to, the aim of the study, and the level of detail of the study. Therefore, the coefficients are strongly related to the

45
area of investigation, characterised predominantly by climate (Brigault & Ruban, 2000) and to calculation scheme (Beaulac & Reckhow, 1982). For this study a necessary compilation was performed in order to select a consistent set of coefficients as best estimators reflecting conditions in the Narew River Basin and suitable to be used in the chosen calculation method. Three characteristic values for each coefficient were selected. These are the so-called ‘regional’, minimum and maximum values (table 2.3). Table 2.3 Excretion coefficients and human yearly emission coefficient (kg.head-1.y-1)
Nitrogen Phosphorus
Regional Minimum Maximum Regional Minimum Maximum
Humans 3.94 1.42 7.15 0.73 0.584 3.285 Cattle 70.2 12.41 151.8 9 1 39.9 Pigs 18.7 2.37 48.36 5 1.5 15.51 Horses 36.8 8.10 76.8 2 0.438 4.2 Sheep 8.9 1.02 25.4 1 0.3 5.5 Poultry 0.3 0.09 3.04 0.1 0.03 0.79
The regional characteristics and climate are two factors supposed to be predominant for the selection of the coefficients. Therefore, the regional values were based on a number of Polish publications addressing this subject (e.g. Kajak, 1979; Dojlido, 1987; Szpindor, 1992; Sapek et al., 1997; Twarog & Jarzabek, 1998). The two other characteristics (minimum and maximum) were selected based on the extended literature survey (e.g. Loehr, 1974; Beaulac & Reckhow, 1982; Frink, 1991; Klepper et al., 1995; Johnes, 1996; CBS, 1998; Worrall & Burt, 1999) and indicate minimum and maximum values of coefficients for conditions similar to those of the Narew River Basin. The regional values were regarded as the most appropriate for the region and applied in the module calculation procedure when the minimum and maximum characteristics were used in a sensitivity analysis procedure. The excretion coefficients and the human yearly emission coefficient were not differentiated over the basin and uniformly applied to all the sub-catchments. The same approach was used for the atmospheric deposition value, which was based on data from the national study presented by Taylor et al. (1997) (6.7 kg N ha-1.y-1 and 0.14 kg P ha-1.y-1). 2.3.3 Sensitivity analysis Total generated nutrient load in the sub-catchments is the sum of inputs from several sources like agricultural and livestock production, population number and atmospheric deposition. A source’s share in an overall input depends on the source type. An input from a particular source is defined by two factors i) the size of the source and ii) the parameter specifying the nutrient input per unit of the source. The first factor is described by area in case of land use or by the number of heads in case of population and livestock. The parameters of the second factor are fertiliser consumption for land use and the

46
excretion coefficients for humans and livestock. A source’s size is in general a relatively stable feature of a certain sub-catchment and significant changes of size in general need quite some time. Consequently, the parameters specifying nutrient input may only indicate the source’s share in the overall input load. The method proposed in equations 2.4 and 2.5 contains 8 such parameters for each of the analysed nutrients nitrogen and phosphorus: fertiliser consumption, 5 excretion coefficients for different animal types, the human yearly emission coefficient and atmospheric deposition rate. The following procedure was employed to assess the impact of each parameter on changes in generated nutrient load and thus for analysing the sensitivity of the generated nutrient load for these parameters:
• each of the parameters was subjected to one at a time change when the others were kept at the original regional values (see table 2.3);
• each parameter was changed 7 times, one at a time, by +10%, +20%, +50%, +100%, -10%, -20% and –50% of the original values;
• then after every change: − for each sub-catchment the newly generated nutrient load was calculated; − for each sub-catchment a relative difference (in %) between the newly
calculated load and the one calculated for the original values was calculated;
− for the entire basin the relative difference (in %) between loads in all sub-catchments were averaged;
• after all changes were computed, the mean relative differences for all parameters were compared.
2.4 Results 2.4.1 Observed load The calculated riverine observed loads, based on measured discharges and concentrations, for every sub-catchment area were converted into area specific load in kg km-2.y-1. These loads ranged respectively from 12 kg N km-2.y-1 (Slina river SLI sub-catchment) to 4.1.103 kg N km-2.y-1in Fasty (FAS) sub-catchment and from 2.2 kg P km-2.y-1 (Jegrznia river JEG sub-catchment) to 170 kg P km-2.y-1 in Zlotoria (ZLO) sub-catchment. The average over the entire basin, calculated as the load measured at Zambski Koscielne, the most downstream observation point, divided over the total area closed by this gauge station, is 151 kg N km-2.y-1 and 12 kg P km-2.y-1. The spatial distribution of area specific loads for both nutrients did not show any obvious pattern (figures 2.14 and 2.15). However, some characteristic relations might be pointed out. In case of nitrogen (figure 2.14) the highest area specific load, over 600 kg N km-2.y-1, was estimated for sub-catchments of the middle and lower courses of the Narew river (Piatnica PIA, Nowogrod NOW. Ostroleka OST, Rozan RON and Zambski Koscielne ZKS) and/or some sub-catchments downstream from point sources (Fasty FAS, Zlotoria ZLO, Nowogrod NOW, Jeze JEZ, Rozan RON and Magnuszew Maly MAG sub-catchments). In contrast, the sub-catchments with the lowest area specific load, below 50 kg N km-2.y-1, were mainly to be found in the upper Biebrza river

47
river SID, Sztabin SZT, Brzozowka river BRZ, Dolistowo DST, Jegrznia river JEG, Prostki PRO sub-catchments) or some head sub-catchments (Neresl NER, Slina SLI, Rozoga ROZ, Omulew WIE rivers). For phosphorus the picture is even more scattered than for nitrogen (figure 2.15). Nevertheless, areas with the lowest area specific load (below 4 kg P km-2.y-1) seem to occur together in the sub-catchments located in the upper part of the basin (Suraz SUR, Slina river SLI, Sidra river SID, Sztabin SZT, Jegrznia river JEG sub-catchments). The largest area specific loads, over 70 kg P km-2.y-1, were estimated for some of the sub-catchments containing bigger towns or located downstream of them (Fasty FAS, Zlotoria ZLO, Strekowa Gora STG, Piatnica PIA, Sawica river SAW sub-catchments).
Figure 2.14 Observed N load (kg.km-2.y-1) in sub-catchments of the Narew River Basin
48
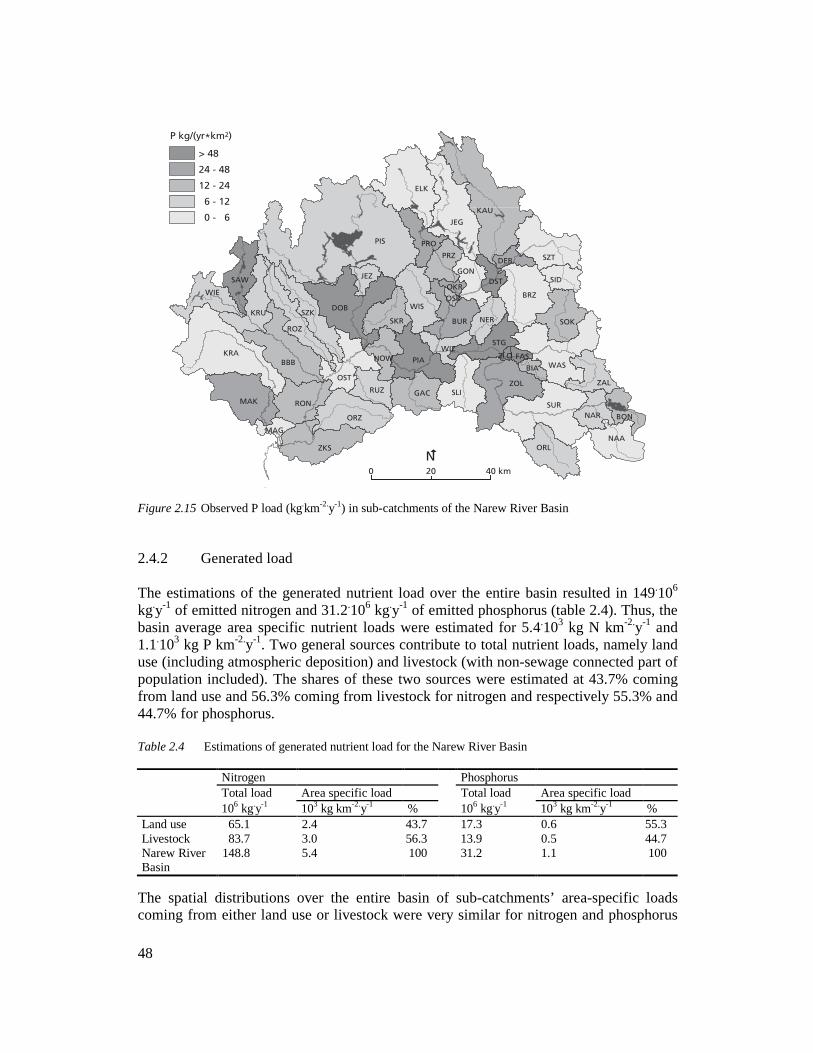
Figure 2.15 Observed P load (kg.km-2.y-1) in sub-catchments of the Narew River Basin 2.4.2 Generated load The estimations of the generated nutrient load over the entire basin resulted in 149.106 kg.y-1 of emitted nitrogen and 31.2.106 kg.y-1 of emitted phosphorus (table 2.4). Thus, the basin average area specific nutrient loads were estimated for 5.4.103 kg N km-2.y-1 and 1.1.103 kg P km-2.y-1. Two general sources contribute to total nutrient loads, namely land use (including atmospheric deposition) and livestock (with non-sewage connected part of population included). The shares of these two sources were estimated at 43.7% coming from land use and 56.3% coming from livestock for nitrogen and respectively 55.3% and 44.7% for phosphorus. Table 2.4 Estimations of generated nutrient load for the Narew River Basin Nitrogen Phosphorus Total load Area specific load Total load Area specific load 106 kg.y-1 103 kg km-2.y-1 % 106 kg.y-1 103 kg km-2.y-1 % Land use 65.1 2.4 43.7 17.3 0.6 55.3 Livestock 83.7 3.0 56.3 13.9 0.5 44.7 Narew River Basin
148.8 5.4 100 31.2 1.1 100
The spatial distributions over the entire basin of sub-catchments’ area-specific loads coming from either land use or livestock were very similar for nitrogen and phosphorus

49
(figures 2.16 and 2.17). The largest area specific loads coming from land use, with respectively over 3.2.103 kg N km-2.y-1 and 1.103 kg P km-2.y-1, were estimated for the sub-catchments in the middle, middle-south and west of the basin. Also, in the south and east parts of the basin the area specific load was relatively high, above average for the basin. The lowest emitted loads were found in the sub-catchments in the north, middle-western and south-eastern parts of the basin, with values below 2.103 kg N km-2.y-1 and 0.45.103 kg P km-2.y-1. The estimation of the components of area-specific load, coming from livestock, resembled the spatial distribution of load coming from land use. The highest values, over 4.5.103 kg N km-2.y-1 and 0.75.103 kg P km-2.y-1, were estimated for sub-catchments in the middle, middle-southern and west parts of the basin and the lowest amounts, below 2.3.103 kg N km-2.y-1 and 0.36.103 kg P km-2.y-1, were emitted in the north-western and south-eastern parts of the basin. However, there were some shifts compared to land use originating load in the middle-western and north-eastern parts of the basin, where load coming from livestock had values above basin’s averages. The spatial distribution of total generated nitrogen load was very much the same as the distribution of load originating from livestock since the latter contributed the major part of total load (figure 2.18). Therefore, (i) the highest total loads, over 8.103 kg N km-2.y-1, were estimated for sub-catchments in the middle (Neresl NER, Wissa WIS and Skroda SKR rivers and Nowogrod NOW and Piatnica PIA), middle-southern (Slina SLI, Gac GAC, Ruz RUZ and Orz ORZ rivers) and west (Makow Mazowiecki MAZ) parts of the basin, (ii) the lowest loads, below 3.5.103 kg N km-2.y-1, were calculated in sub-catchments in the south-eastern (Bondary BON, Narewka river NAA, Narew NAR, Zaluki ZAL, Wasilkow WAS and Biala river BIA) and north-western (Pisz PIS, Jeze JEZ, Wielbark WIE, Krukowo KRU and Sawica river SAW) parts of the basin and (iii) sub-catchments in the middle-western and north-eastern parts of the basin had load values above average. Land use contributed dominantly to the total generated nitrogen load in only 8 sub-catchments, which are these characterised by the lowest total load. At most land use contributed to over 90% of total load in Bondary (BON) sub-catchment. In the rest of the sub-catchments livestock originating load contributed more than 50% to the total generated load, with a maximum over 68% in Kanal Augustowski (KAU) sub-catchment. The spatial distribution of total generated phosphorus load more resembled the distribution of land use originating load, which contributed on average more than half to total load (figure 2.19). Thus, the sub-catchments in the middle-western and north-eastern parts of the basin had estimated total generated loads below average, contrary to the nitrogen pattern. The same sub-catchments as for nitrogen were characterised by both the highest area-specific load with values of over 1.75.103 kg P km-2.y-1 and the lowest one with values below 0.79.103 kg P km-2.y-1. Additionally, the total load for two other sub-catchments up north (Elk ELK and Prostki PRO) was estimated in the range of the lowest values. Livestock was a major source of total phosphorus load in only 7 sub-catchments, predominantly those characterised by the lowest total load, when in three others both sources contributed equally to total load. Livestock originating load contributed at most almost 67% in the Kanal Augustowski (KAU) sub-catchment. For the remaining 42 sub-catchments land use added more than 50% to total load, in five of them exceeding 70%.

50
a)
b) Figure 2.16 Generated N load (kg.km-2.y-1) in sub-catchments of the Narew River Basin per source:
a) land use; b) livestock

51
a)
b) Figure 2.17 Generated P load (kg.km-2.y-1) in the sub-catchments of Narew River Basin per source:
a) land use; b) livestock

52
Figure 2.18 Total generated N load (kg.km-2.y-1) in sub-catchments of the Narew River Basin
Figure 2.19 Total generated P load (kg.km-2.y-1) in sub-catchments of the Narew River Basin

53
2.4.3 Sensitivity analysis (the relative impact of sources to overall loads) The sensitivity analysis was carried out following the procedure described in section 2.3.3, with livestock and human excretion and atmospheric deposition coefficients selected for succeeding module runs according to values given in table 2.5. In every run considering fertiliser usage, the dosages were changed by the appropriate fate of the start values, which were assigned separately for every sub-catchment area based on statistical data. Table 2.5 Coefficient values (kg.head-1.y-1) used for succeeding runs in the sensitivity analysis
Nitrogen Phosphorus
-50 -20 -10 +10 +20 +50 +100 -50 -20 -10 +10 +20 +50 +100
Cattle 35.1 56.2 63.2 77.2 84.2 05.3 40.4 4.5 7.2 8.1 9.9 10.8 13.5 18.0 Pigs 9.4 15 16.8 20.6 22.4 28.0 37.4 2.5 4.0 4.5 5.5 6.0 7.5 10.0 Horses 18.4 29.4 33.1 40.5 44.2 55.2 73.6 1.0 1.6 1.8 2.2 2.4 3.0 4.0 Sheep 4.4 7.1 8.0 9.8 10.7 13.4 17.8 0.5 0.8 0.9 1.1 1.2 1.5 2.0 Poultry 0.15 0.24 0.27 0.33 0.36 0.45 0.60 0.05 .08 0.09 0.11 0.12 0.15 0.20 Atm. Dep.a 3.4 5.4 6.0 7.4 8.0 10.0 13.4 0.07 .11 0.12 0.15 0.16 0.20 0.27
a in kg.km-2.y-1 The mean relative change of load over the basin, when changing one of the coefficient types at a time, was calculated for each 8 sources of nutrients (fertilisation, population, cattle, pigs, horses, sheep, poultry and atmospheric deposition) using 7 different coefficient values. Those mean load changes were plotted against relative changes of coefficients (figure 2.10). Since, the mean changes of load, when coefficients were changed by +/- 50%, were estimated to be below +/- 2% for 4 sources (population, horses, sheep, poultry) for nitrogen the mean changes for these sources were summarised and plotted as one source. For phosphorus the mean changes of load, when coefficients were changed by +/- 50%, were estimated to be below +/- 2% for the same four sources as for nitrogen and additionally for the fifth source, namely atmospheric deposition. Thus, for phosphorus the mean changes for these five sources were summarised and plotted as one source. The two dominant sources contributing to nitrogen load, are fertilisation and cattle. A change of coefficient values by +/- 10% resulted for both of them in over +/- 3% mean change of the load over the basin. They accounted for two-thirds (67%) of total mean load change if all coefficients had been changed by the same relative value at the time. For the same assumptions pigs and atmospheric deposition are the two next sources and contributed 27% to total mean load change with changes of +/- 1.3% for pigs and +/- 1.4% for atmospheric deposition when coefficients changed by +/- 10%. The other four sources played a minor role contributing together just for 6% to total mean change. Fertilisation was the dominant source of phosphorus load and was accounted for 56% of total mean load change when all coefficients had been changed by the same relative value at the time. So, a change of fertilisation dosages by +/- 10% resulted in +/- 5.6% mean change of phosphorus load in the basin. The other two substantial sources, cattle and pigs, contributed for 37% to total mean phosphorus load change and

54
respectively a +/- 10% change of their excretion coefficients resulted in +/- 2.1% change of the mean basin’s load in case of cattle and +/- 1.6% change of this load for pigs. The remaining five sources had only a minor contribution of 7% of total mean change to phosphorus load.
a)
b) Figure 2.20 Changes in mean load (%) vs. changes of the coefficients (%): a) nitrogen, rest is the sum
of changes in population, horses, sheep and poultry; b) phosphorus, rest is the sum of changes in population, horses, sheep, poultry and atmospheric deposition

55
2.4.4 Export coefficients The export of the total nutrient load emitted from different sources into surface water for the sub-catchment areas was estimated and described by two characteristics: an area-specific load export (in kg.km-2.y-1) and an exact export coefficient (in %), specifying the part of the emitted load reaching the surface water. For both nitrogen and phosphorus area-specific load exports over the entire basin resembled the spatial distribution of their area-specific generated loads (figures 2.21 and 2.22). This means that, the middle, middle-southern and west parts of the basin are the regions where values of area specific export were estimated to be the highest with respectively over 7.8.103 kg N km-2.y-1 and 1.8.103 kg P km-2.y-1. The lowest values were similar for both nutrients estimated for sub-catchment areas in the south-eastern and north-western parts of the basin, with export rates below 3.5.103 kg N km-2.y-1 and 0.6.103 kg P km-2.y-1. For the rest of the basin the values of area-specific export were for either nitrogen or phosphorus estimated around to basin’s averages that respectively equalled to 5.1.103 kg N km-2.y-1 and 1.1.103 kg P km-2.y-1. Moreover, for both nutrients the spatial distributions of area-specific export followed the same pattern as for area-specific generated load. The north-eastern and middle-eastern parts of the basin are characterised by above average values for nitrogen and below average values for phosphorus. The fate of the generated nutrient load reaching the surface water was very varied between different sub-catchments of the Narew river basin. Thus, the estimated export coefficient for nitrogen ranged from 0.14 % in the sub-catchment of Slina river (SLI) to almost 73% in Fasty sub-catchment (FAS) and for phosphorus varied from 0.13 % also in the sub-catchment of Slina river (SLI) to 14 % in Zlotoria sub-catchment (ZLO). The average export coefficients for the entire basin were estimated for 8 % emitted nitrogen load and 1.9 % of emitted phosphorus load. The spatial distribution of export coefficients showed a very scattered picture over the basin, especially in case of phosphorus, where it was difficult to pick out any clear pattern (figures 2.23 and 2.24). For nitrogen the highest export coefficient values, over 8.5% of emitted load, were estimated for differential sub-catchments along the middle and lower courses of the Narew river and for all except one sub-catchments smaller than 160 km2 (Biala river BIA, Fasty FAS, Zlotoria ZLO, Osowiec Kanal OKR, Osowiec Biebrza OSB, Jeze JEZ and Magnuszew Maly MAG). In general the spatial distribution of export coefficients over the entire basin stayed close to the spatial distribution of the calculated observed load, especially for nitrogen. The detailed results of the estimated observed and generated loads, sensitivity analysis and export coefficients for all the sub-catchments are presented in tables in the Appendix A.1.

56
Figure 2.21 Nitrogen load export (kg.km-2.y-1) in sub-catchments of the Narew River Basin
Figure 2.22 Phosphorus load export (kg.km-2.y-1) in sub-catchments of the Narew River Basin

57
Figure 2.23 Nitrogen load export (%) in sub-catchments of the Narew River Basin
Figure 2.24 Phosphorus load export (%) in sub-catchments of the Narew River Basin

58
2.5 Discussion and conclusions As an element of an integrated management tool (IMT) NULAM has a number of advantages: the simplicity of the procedure format, operation by commonly used simple spreadsheet environment, relatively modest data requirements fulfilled by readily available databases. It allows for a relatively simple and not laborious, thus inexpensive, evaluation of the impact of land use and land management policies on water quality of surface waters. From a process point of view one might argue that the module proposed in this chapter lacks a process-based description and it is therefore questionable whether it will correctly react to changing conditions. De Wit (1999) examined the performance of several nutrient fluxes models with increasing complexity (from lumped to semi-process based) and concluded that the use of more detailed process descriptions only brings improvements if the process descriptions are valid at the scale of the analysis. Therefore, improved large scale studies of nutrient fluxes in river basins first of all require much detailed data, especially on nutrient sources. With the data available for this study I conclude that NULAM is a sufficient module to be included in the IMT, which construction and application is one of the aims of this work. From the results obtained I conclude that:
• estimates of area specific generated loads for both nitrogen and phosphorus are in acceptable agreement with values reported by other workers. For instance De Wit (1999) estimated area specific emissions from diffuse sources for Rhine and Elbe basin respectively for 4.2.103 kg N km-2.y-1; 2.2.103 kg N km-2.y-1 and 0.6.103 kg P km-2.y-1; 0.2.103 kg P km-2.y-1. The differences in methodology (e.g. including small point sources as diffuse sources in this study) and, size and location of study area limit somewhat such comparison although more comparable data were not available;
• emission from land use contributes for a major part to total phosphorus emission and accounts for as much as 55% of total generated P load at the entire basin scale;
• emission from livestock (including population) contributes for a major part to total nitrogen emission and accounts for as much as 56% of total generated N load at entire basin scale;
• the arable land dominated sub-catchment areas, in the middle and south parts of the basin, are characterised by the highest area-specific nutrient emissions;
• estimation of emitted load for nitrogen is most sensitive to changes in parameters that describe the fertiliser usage and cattle excretion; pigs excretion and atmospheric deposition parameters are less important, and other parameters are of minor influence;
• estimation of load emission of phosphorus is dominantly sensitive to changes in parameters that describe the fertiliser usage; cattle and pigs excretion parameters are of lesser importance and others are of minor influence;
• estimated export coefficients, similarly to area specific generated load, are in acceptable agreement with results reported in other studies when taking into account differences in methodology and in the size of the study area and the location. For instance Johnes (1996) estimated the export of emitted load as 15% total-N load and 3% of total-P load for two catchments in England. From

59
the estimates calculated by De Wit (1999) for the Rhine and Elbe basins it appeared that from 3 to 40% of N-load and from 1 to 9% of P-load, depending on the sub-basins, were exported. The Rhine and Elbe study and one by Skop and Sorensen (1998) for Danish catchment estimated the ranges of area specific export from 2000 – 11500 kg N km-2.y-1 and 400 – 2200 kg P km-2.y-1.