Seattle City Light Strategic Plan Survey April 2012 Strategic Plan Survey April 2012.
Upload
eep-shireeCategory
view
222download
0description
shiree
Final Report
Socio-Economic & Nutrition Baseline Survey carried out in March/April 2010
July 2010

i
Executive Summary
1. Background: This report provides information on the aims of the annual surveys, the study design and the fieldwork team and schedule. Data on the socio-economic status of families were collected through a pre-tested structured questionnaire and nutritional status was obtained by measuring the height, weight and haemoglobin level of parents and their < 5 year old children.
2. Male and Female Headed Households: 384 randomly selected households took part in the survey with 64 households from each of the 6 NGOs. Information was collected on 1273 individuals of whom 752 were adults. 40.9% of households were female headed, much higher than the most recent national figure (10.2%, Household Income and Expenditure Survey, (HIES) of 2005). The number of female headed households varied significantly between NGOs from a low of 28.1% in PAB to a high of 60.9% in DSK. Female heads were primarily widowed (60.5%) or divorced/abandoned (21.0%) while nearly all male heads were married (97.4%). Of the 157 female headed households, 43 (27.4%) lived alone compared with only 5 (2.2%) out of 227 male headed households. Mean family size was 3.32, much lower than the HIES (4.85) and female headed households were smaller by, on average, just under 1.4 family members (2.50 versus 3.88, female versus male, respectively). Female headed households had fewer adults, 5 to 15 year olds and < 5 year olds compared with male headed households.
3. Education: Overall 76.3% of the household heads had not been to school compared with 50.3% nationally. 1 in 3 male heads had attended school compared with only 1 in 9 female heads. There was considerable variation between NGOs with the highest school attendance for males in PAB (37.0%) SCF (36.1) and UTTARAN (35.9%) and females in CARE (18.2%) and SCF (17.9%) and the lowest attendance in NETZ for males (17.9%) and no females attended school in the PAB sample.
4. Chronic illness and disability: 33.6% of household heads (29.5% of all adults) had chronic illness/disability but the prevalence was much lower in 5 to 15 year olds (5.2%) and in < 5 year olds (4.8%). No significant variation was found between NGOs or between male and female headed households. The most common disability in adults was lack of mobility (36%) followed by vision and hearing (both 17%) and the disability occurred primarily after 20 years of age as a result of an accident (17%), illness (29%), ageing (21%) or the wrong treatment (7%). 4 out of 5 disabled people reported difficulty in going to the toilet, washing and dressing while 93% reported difficulty in feeding themselves.
5. Morbidity Status: The health status of family members was determined on the day of the survey and over the previous 7 and 30 days. On the day of the survey 1 in 7 household members reported passing worms. Over the previous 7 days cough, fever and eye infection were common and over the previous 30 days nearly half of all family members reported having a fever and over a third a cough. Over three-quarters of
ii
household heads reported some ill health over the previous 30 days. Children between 5 and 15 years of age had, in general, the least morbidity.
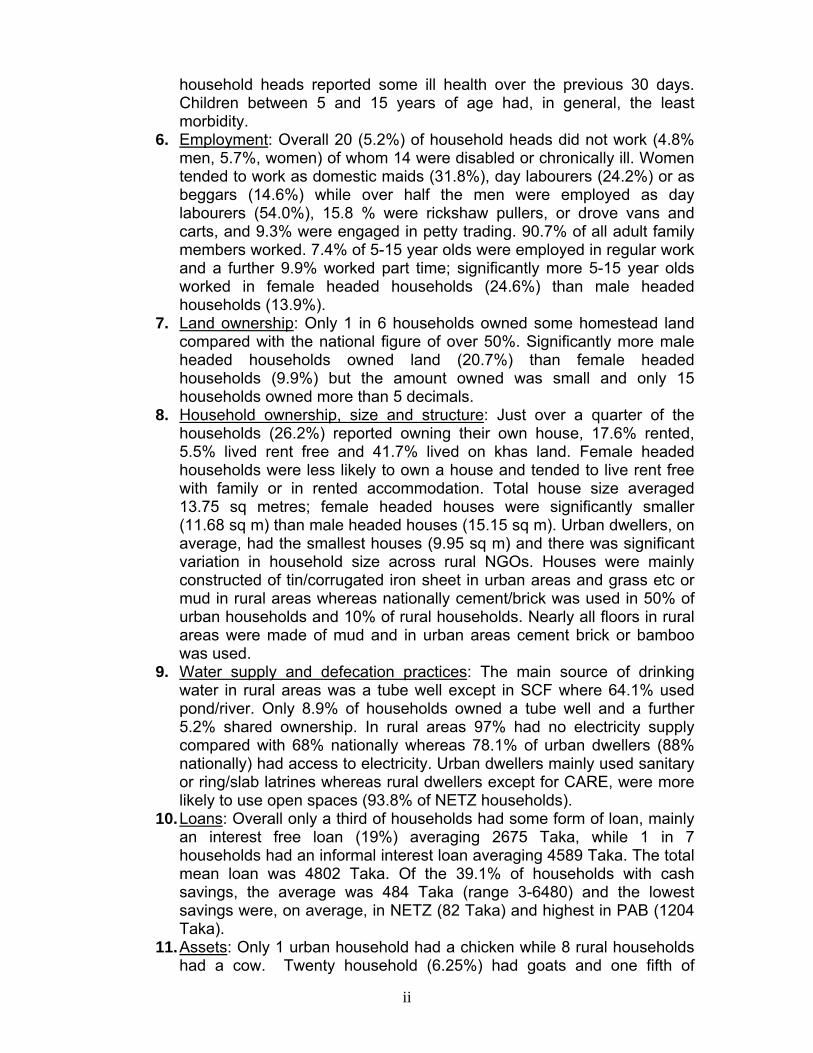
6. Employment: Overall 20 (5.2%) of household heads did not work (4.8% men, 5.7%, women) of whom 14 were disabled or chronically ill. Women tended to work as domestic maids (31.8%), day labourers (24.2%) or as beggars (14.6%) while over half the men were employed as day labourers (54.0%), 15.8 % were rickshaw pullers, or drove vans and carts, and 9.3% were engaged in petty trading. 90.7% of all adult family members worked. 7.4% of 5-15 year olds were employed in regular work and a further 9.9% worked part time; significantly more 5-15 year olds worked in female headed households (24.6%) than male headed households (13.9%).
7. Land ownership: Only 1 in 6 households owned some homestead land compared with the national figure of over 50%. Significantly more male headed households owned land (20.7%) than female headed households (9.9%) but the amount owned was small and only 15 households owned more than 5 decimals.
8. Household ownership, size and structure: Just over a quarter of the households (26.2%) reported owning their own house, 17.6% rented, 5.5% lived rent free and 41.7% lived on khas land. Female headed households were less likely to own a house and tended to live rent free with family or in rented accommodation. Total house size averaged 13.75 sq metres; female headed houses were significantly smaller (11.68 sq m) than male headed houses (15.15 sq m). Urban dwellers, on average, had the smallest houses (9.95 sq m) and there was significant variation in household size across rural NGOs. Houses were mainly constructed of tin/corrugated iron sheet in urban areas and grass etc or mud in rural areas whereas nationally cement/brick was used in 50% of urban households and 10% of rural households. Nearly all floors in rural areas were made of mud and in urban areas cement brick or bamboo was used.
9. Water supply and defecation practices: The main source of drinking water in rural areas was a tube well except in SCF where 64.1% used pond/river. Only 8.9% of households owned a tube well and a further 5.2% shared ownership. In rural areas 97% had no electricity supply compared with 68% nationally whereas 78.1% of urban dwellers (88% nationally) had access to electricity. Urban dwellers mainly used sanitary or ring/slab latrines whereas rural dwellers except for CARE, were more likely to use open spaces (93.8% of NETZ households).
10. Loans: Overall only a third of households had some form of loan, mainly an interest free loan (19%) averaging 2675 Taka, while 1 in 7 households had an informal interest loan averaging 4589 Taka. The total mean loan was 4802 Taka. Of the 39.1% of households with cash savings, the average was 484 Taka (range 3-6480) and the lowest savings were, on average, in NETZ (82 Taka) and highest in PAB (1204 Taka).
11. Assets: Only 1 urban household had a chicken while 8 rural households had a cow. Twenty household (6.25%) had goats and one fifth of

iii
households owned poultry. Working equipment was owned by 53.4% households more so by male (61.7%) than female (41.1%) headed households and the mean reported cost of purchasing equipment was 463 Taka (561 versus 252 Taka in male and female headed households, respectively). Only 4 households had a TV and 3 owned a radio. 11 households owned a bicycle, 18 a mobile phone, 19 a wardrobe, 38 households had a fan, 58 a chair, 86 households owned a table more so in CARE and PAB and ownership of a bed was very high in PAB and CARE (over 90%) and least in SCF (37.5%). Jewellery was owned by 186 households (48.4%). Male headed households were more likely to own jewellery, a wooden box, table, chair and a mattress than female headed households. The mean worth of household belongings was 1722 Taka, more so in male than female headed households (1941 versus 1405 Taka, respectively). Total worth of all assets (animals, equipment and household belongings) averaged 2286 Taka.
12. Income: 62 different income streams were identified of either cash or in-kind income. Overall mean cash income was 2718 Taka but 5.2% of households reported no cash income more so in female than male headed houses (11.5% versus 0.8%, respectively). Based on regular cash income only mean income per household per month was only1832 Taka compared with 7203 Taka nationally. In rural areas the mean income was 1640 (6095 nationally) and 2792 (10463 nationally) in urban areas. 54.4% and 45.3% of rural and urban households respectively were in the lowest income decile based on household income/month. Mean per capita income per day was 19.2 Taka (28.7 urban and 17.3 rural). 69.4% of rural households had an income of <22 Taka per capita/day (2007 prices) increasing to 78.8% with a cut-off of 26 Taka per capita/day (2009 prices). For urban households 50% had an income of <26 Taka per capita/day (2007 prices) rising to 62.5% based on 30 Taka per day per capita (2009 prices).
13. Expenditure: 44 household expenditure items were identified; 17 food items, 17 household and 10 work-related. Information was provided daily, weekly, monthly or over the past 3 months. Mean overall expenditure was 3060 Taka (compared with 3209 Taka nationally), of which 56.5% (52.3% nationally) was spent on food; over half (56.7%) of food expenditure was on rice. The cost of work-related and house items amounted to 17.8% and 25.6%, respectively, of total expenditure. Based on regular expenditure the mean expenditure per household per month was only 2320 Taka compared with 6134 Taka nationally (Table 22). In rural areas the mean expenditure was 2011 (5319 nationally) and 3864 (8533 nationally) in urban areas. Expenditure on food increased to 74.5% of total expenditure. 75.8% and 49.2% of rural and urban households respectively were in the lowest expenditure decile based on household expenditure/month. Mean per capita expenditure per day was 25.7 Taka (40.6 urban and 22.8 rural). 63% of rural households had an expenditure of <22 Taka per capita/day (2007 prices) increasing to 74% with a cut-off of 26 Taka per capita/day (2009 prices). For urban households 24% had an expenditure of <26 Taka per capita/day (2007 prices) rising to 40% based on 30 Taka per day per capita (2009 prices).

iv
14. Difference between income and expenditure: The difference between household income and expenditure (credit/debit balance) was calculated for each household and the overall mean was +214 Taka with 52.1% of households in credit. However, on average, male headed households were in debit (-174 Taka) and female headed households in credit (+775 Taka). However based on regular monthly income and expenditure, 67% of households were in debit with an overall mean of -487 Taka. Significant heterogeneity existed between NGOs but there was no difference between male and female headed households.
15. Household food intake and security: Food diversity was poor especially in rural areas and very few families consumed any meat, poultry, fruits or milk. Rice and potatoes were the foods mainly consumed on 3 or more days in week before the survey. Urban families were more likely to consume pulses, other vegetables, fruits, eggs, dried fish and poultry than rural dwellers. Households had poor food security. Eating smaller portions was more common in rural than urban households (32.8% versus 14.4%, respectively) and less than 3 meals a day (53.2% versus 28.1%, respectively). Female heads were much more likely to eat smaller portions than male heads (86% versus 60.4%, respectively).
16. Social Empowerment: Both males and females agreed that investing in child’s education was the best use of scarce resources. Significantly more males than females felt that they should decide on how to use money from a loan, males were also significantly more confident about the future and about decision making. Nearly 40% of both males and females felt that they did not have people outside their family who could be relied on. Between 60% and 70% felt they had enough information about government programmes. Just over two thirds of women did not feel frightened about moving outside their locality.
17. Adult nutritional status: Mean Body Mass Index (BMI) was similar in male and female headed households (BMI mean=18.7) but there was evidence of severe chronic energy deficiency (CED); 50.5% showed some CED (compared with 30% in the Bangladesh Demographic Health Survey, BDHS, 2007) of whom 10.3% were in the very severe CED category, 13.7% severe and 26.5% moderately severe category. Significantly more female heads were anaemic (57.2% versus 33.7%, females and males, respectively). Female heads were significantly more likely to be CED or anaemic than male heads (75.3% versus 62.9%, respectively). There was a significant positive relationship between BMI and haemoglobin level and each 1 unit increase in BMI was associated with a 0.8 g/l rise in haemoglobin. Eating smaller portions and eating < 3 meals a day were associated with lower mean BMIs. There was also a positive association between food expenditure and BMI and haemoglobin level; for each 300 Taka spent on food BMI went up by 0.1 units and haemoglobin increased by 1.2 g/l. Adults defecating in open spaces were more likely to be anaemic (36.6%) than those using a latrine (26.3%).
18. Child nutritional status: Just under half of the < 5 year old children were stunted (48.9%) or underweight (45.9%) and nearly a quarter (22.8%) were wasted. These percentages are worse than the BDHS, 2007

v
survey which found only 42% stunted, 42% underweight and 17% stunted. More boys had very severe stunting (<-3.0 HAZ) than girls (20.6% versus 8.1%, respectively) while more girls had severe stunting (-2.99 to -2.00 HAZ) than boys (43.2% versus 25.4%, respectively). Overall 64.2% of children were wasted, stunted or underweight. Nearly 20% of children were stunted and underweight and 14.2% were stunted, wasted and underweight. 51.8% of children were anaemic (no sex difference). Of those children not stunted, underweight or wasted, 56.4% were anaemic. Overall 84.8% of children were stunted, wasted, underweight or anaemic and 5.3% were suffering from all 4 conditions. There was a positive association between parental and child haemoglobin levels.
1
1. BACKGROUND EEP/shiree (www.shiree.org) is a challenge fund supported by UKaid from the Department for International Development (DFID) in partnership with the Government of Bangladesh (GoB) to lift 1 million people out of extreme poverty by 2015. Harewelle International Ltd and PMTC Bangladesh Ltd manage the fund in consultation with EEP/shiree consortium partners including the Centre for Development Studies (CDS) at Bath University, the British Council and Unnayan Shamannay. EEP/shiree is one in DFID’s portfolio of projects designed to reduce extreme poverty and vulnerability in Bangladesh. The EEP/shiree Challenge Fund is worth £65 million British Pounds (around USD$130M) and is being disbursed over a period of 8 years (2008-2015). It is also referred to as shiree (the Bengali word for steps and an acronym for "Stimulating Household Improvements Resulting in Economic Empowerment") reflecting the aim of providing households ways out of extreme poverty. In order to monitor and evaluate socio-economic, empowerment and nutritional change, longitudinal (panel) surveys are being conducted (quarterly and annually) on randomly selected households. Besides these surveys, SHIREE will also be supporting qualitative studies which will focus on key livelihood aspects of extreme poverty. The qualitative studies will provide rich longitudinal data which will be used with the surveys to gain more rounded insights into the choices and constraints facing extreme poor households. This report provides baseline information on the socio-demographic and economic characteristics of households (including household assets, income and expenditure and social empowerment) and the nutritional status of parents and their < 5 year old children collected in March and early April, 2010. The report also provides details on the geographic distribution of the sample, the aims of the annual surveys, the study design and how the fieldwork was conducted. The information contained in the report will be used to monitor the impact of the project and assess if it is reaching its stated goals which are:- (a) a 15% increase in income by 80% of individuals (b) in 50% of targeted households assets have improved by at least 50% (c) in 50% of targeted households 50% of women have achieved an increase in Body Mass Index by 1 kg/m2, 50% of women show reduced levels of anaemia and 50% of < 5 year old children with improved height-for-age z-score of 0.25 standard deviations and (d) 75% of targeted beneficiaries report a significant increase in the ability to make effective choices that affect their livelihoods.

2
Nutritional status (measured by a combination of anthropometry and haemoglobin level) and social empowerment will be monitored annually, household income and expenditure will be collected quarterly. shiree is working with 6 NGOs. 2 NGOs (CARE and PAB) are working in the far north-west of Bangladesh, NETZ in the north-west, DSK in two urban slums in Dhaka and SCF and UTTARAN in the south-west (Table 1). Table 1 Location of the 6 NGOs NGO Location CARE DSK NETZ PAB SCF (UK) UTTARAN
Gaibandha, Nilphamari, Rangpur, Lalmonirhat Dhaka slums Naogaon Gaibandha, Nilphamari, Rangpur, Lalmonirhat Khulna, Bagerhat Satkira, Khulna

3
2. AIMS OF THE ANNUAL SURVEYS Through the annual surveys the project aims to determine:-
(a) household annual change in socio-economic and empowerment status as a result of the shiree programme (b) intra-individual (primarily mother and <5 year old children) annual change in nutritional status (c) differences in nutritional, socio-economic status and empowerment between new and old recruits within the same NGO, and in the longer term (d) differences in nutrition, socio-economic status and empowerment between participants from different NGOs
3. STUDY DESIGN A longitudinal (panel) study design is being used (Figure 1) in which 384 households, 64 households from each NGO, will be randomly recruited each year (in March) between 2010 and 2012 and all households will be followed until 2016. The design allows for 10% attrition each year. The new cohort recruited each year, who will not have received any asset transfer, will act as a control group. The longitudinal design will examine (a) within subject changes (the yellow lines) (b) between cohort comparisons of old and new cohorts (purple lines) (c) recruitment homogeneity (red lines) and (d) by year 3 for differences between NGOs. Figure 1 Study Design Baseline 2010 2011 2012 2013 2014 2015 Total 384 729 1039 934 840 756 In 2010, 64 representative households were selected from each of the 6 NGOs on the basis of the variables provided by the NGOs, usually the reported monthly income, educational level of the head of household, presence of under five year old
384 345 310
384 345
384
279
310
345
251
279
310
226
251
279

4
in the household, age of the household head, household size and sex of household head. A representative back-up list was also generated in case households were absent on the day of the survey. 4. FIELD WORK The survey was completed in 4 working weeks (28 days) commencing on March 7th 2010 and finishing on April 2nd 2010. A total of 19 people were involved in conducting the survey comprising a Field Director assisted by the Senior Knowledge Manager, 2 Knowledge Managers, 2 Bengali Young Professionals and 1 Information Service Associate and 12 field assistants. A flexible survey team structure was used. In high household density areas 2 sub-teams were used, each team comprising 6 members, 4 enumerators (responsible for the questionnaire) and 2 measures (responsible for taking anthropometric measurements and haemoglobin levels). With this structure the Field Director oversaw one team and the Senior Knowledge Manager the other team. A Knowledge Manager and Young Professional was assigned to each team, the Knowledge Manager supervised the questionnaire and the Young Professional the nutrition data collection. During the time the 4 enumerators were completing the questionnaires; the measurers visited the 4 households and collected the nutrition data. In one day 16 households were visited by each team (32 households in total), so it took 2 days usually to survey each NGO. In low household density areas (SCF and UTTARAN), four teams were generated, each team with 3 members made up of 1 enumerator and 2 measurers. The timetable allowed for some slippage as well as movement from 1 NGO to the next. A trained Bengali enumerator asked a series of pre-tested questions to the head of household (or if the male head was absent, his spouse). The structured questionnaire covered 9 key areas:- a. socio-demographic characteristics b. disability, chronic illness and health status of all household members c. household land ownership d. housing size and structure, water, sanitation and electricity e. cash loans f. household assets g. household income and expenditure h. household food intake and food security i. gender and empowerment issues The interview usually lasted about 1 hour. At the same time the interviews were being carried out, the height, weight and haemoglobin levels of the mother and father (if available), and all children < 5 years of age were measured.

5
5. RESULTS 5.1 SOCIO-DEMOGRAPHIC CHARACTERISTICS OF THE SAMPLE In total 384 households took part in the survey, with equal numbers of households from each of the six NGOs. Information was collected on 1273 individuals, 752 adults, 365 children between 5 and 15 years of age and 156 < 5 year old children. More females (719) than males (554) were sampled primarily because over 40% of the households surveyed were female headed (Table 2). The overall sex ratio (male: female) was 1:1.3. The mean age of adults was 39 years and female heads were significantly older by 5.8 years, on average, than male heads (t=3.67, p<0.001) but there was no significant variation in mean ages between NGOs (Table 2) before or after taking into account differences between male and female headed households. The mean age of 5 to 15 year olds was 9.8 years and of <5 years olds, 2.4 years of age. Just over 40% of households had a female head (40.9%) compared with 10.2% nationally (Household Income and Expenditure Survey, HIES, 2005). However the number of male and female headed households differed significantly between NGOs primarily due to an excess of female headed households in the DSK and NETZ samples and male excess in the CARE and PAB samples (χ2=36.39, p<0.001). Female heads were primarily widowed (60.5%) or divorced/abandoned (21.0%) and only 17.8% were married while nearly all male heads were married (97.4%). The overall mean family size was 3.32 (range 1-8) which is much lower than the national figure of 4.85 (HIES, 2005). Female headed households had, on average, just under 1.5 less family members than male headed households (2.50 versus 3.88, t=10.02, p<0.001). The lower mean family size in female headed households was apparent in all NGOs (Table 2) and the largest mean family size was in the urban slums in both male and female headed households. There was significant heterogeneity in family size between NGOs after taking into account male and female headed households (F=3.43, p=0.005). Female headed households had significantly fewer adults, 5 to 15 year olds, as well as < 5 year olds compared with male headed households. Of the 157 female headed households, 43 (27.4%) women were living alone compared with only 5 (2.2%) out of 227 male headed households. Households with < 5 year old children made up 38.0% of the sample but only 22.3% of female headed households had an < 5 year old child compared with 48.9% in male headed households (χ2=27.95, p<0.001). There was no significant heterogeneity in the distribution of < 5 year old children in NGOs after taking into account the numbers of male and female headed households in each NGO.

6
Table 2 Basic socio-demographic characteristics
NGO Male Headed Houses
Mean age of head of house (years)
Family Size School attendance (yes, %)
% Male Female Male Female Male Female CARE 82.8 40.8 56.5 4.00 1.82 34.0 18.2 DSK 39.1 42.8 45.5 4.48 3.03 24.0 10.0 NETZ 43.8 35.4 44.7 3.64 2.39 17.9 11.1 PAB 71.9 40.7 51.4 3.76 2.00 37.0 0 SCF 56.3 44.6 48.1 3.86 2.71 36.1 17.9 UTTARAN 60.9 43.5 45.3 3.67 2.24 35.9 12.0 Total 59.1 41.4 47.2 3.88 2.50 32.2 11.5 5.2 SCHOOLING Only 23.7% of the heads of households had attended school compared with nearly 50% nationally, (49.7%, HIES, 2005) and there were significant differences in school attendance between male and female headed households. Overall 32.2% (73 of 227) of males had been to school compared with only 11.5% (18 of 157) of females. Males were more likely to have attended school across all NGOs but there was considerable heterogeneity between NGOs (Table 2) with the highest male school attendance in PAB, SCF and UTTARAN and female in CARE and UTTARAN and lowest attendance in the NETZ sample for males and PAB for females (zero attendance). Of all adult household members 29.7% had attended school, more so in male headed households (34.2%) than female headed households (24.9%, χ2=16.12, p<0.001). Significantly more adult males (35.9%) attended school than adult females (25.5%, χ2=9.25, p<0.001) and these percentages were similar in both male and female headed households. There was significant variation between NGOs with more adults from PAB and UTTARAN going to school and fewer than expected from DSK and NETZ attending school (χ2=20.32, p<0.001). Overall 74.5% of the 5 to 15 years of age attended school, slightly more girls attend (78.9%) than boys (70.2%) and more children attended from male headed (79.2%) than female headed households (64.0%, χ2=9.47, p<0.001). There was also significant variation between NGOs in school attendance (χ2=15.91, p<0.001) with greater attendance in SCF and less in DSK. Schooling was mainly paid for by the parents alone (72.5%) or in combination with a government stipend or loan (19.2%). Only 3 children were reported to be contributing to their schooling (with parental income).

7
5.3 DISABILITY AND CHRONIC ILLNESS WITHIN THE HOUSEHOLD Overall 33.6% of heads of household reported having either disability (7.8%) or chronic illness (25.8%) but no significant differences were found in the extent of disability and chronic illness (combined) between male and female headed households. For all adults 164 (21.8%) reported chronic illness and 7.7% disability making a total of 29.5% with either chronic illness or disability. The rates of chronic illness and disability were much lower among children; 2.5% and 2.7% had disability and chronic illness respectively in 5 to 15 year olds while the respective percentages were 1.4% and 3.4% for < 5 year olds. There was no significant heterogeneity in the extent of disability or chronic illness between NGOs for adults, 5 to 15 year old children or <5 year olds. In both adults and children the most common disability was lack of mobility (36% of all adult disability) followed by vision and hearing (both 17% of all adult disability). In adults 19% of disability occurred at birth, but over 60% took place after 20 years of age as a result of accident (17%), illness (29%), ageing (21%) or wrong treatment (7%). In 5 to 15 year old children most disability occurred at birth. The vast majority of disabled adults and children reported difficulty with self care; 79% in going to the toilet, 81% in washing, 82% in dressing and 93% in feeding. 5.4 MORBIDITY STATUS The morbidity status/condition (diarrhoea, fever, cough, skin infection and eye infection) of each family member was ascertained over three time periods, (a) on the day of the survey (b) over the previous 7 days and (c) over the previous 30 days. Information was also obtained on whether family members had passed worms on the day of the survey, and over the previous 7 and 30 days. Female headed households reported greater morbidity (59.1%) than male headed households (45.8%, χ2=7.34, p<0.01) only on the day of the survey, and there were no significant differences in the previous 7 or 30 days. On the day of the survey over a fifth of the household heads reported having a cough and eye infection (Table 3). In the previous 7 days 63.5% of household heads reported some ill health increasing to 75% over the previous 30 days. The main causes of ill health were fever and cough. On the day of the survey 21.0% of female headed households and 16.3% of male headed households reported suffering from 2 or more conditions, increasing to 23.8% and 35.0% in the previous 7 days and 38.3% and 52.9%, respectively, in the previous 30 days. Children between 5 and 15 years of age reported, in general, the least morbidity (Tables 4-6). On the day of the survey for all family members combined, passing

8
worms was the highest prevalence. Over the previous 7 and 30 days cough and fever were most common. Table 3 Morbidity Status (%) of Head of Household Condition Day of survey Previous 7 days Previous 30 days Diarrhoea 1.8 9.4 19.3 Fever 7.0 23.4 45.1 Cough 21.9 27.3 38.5 Skin infection 8.3 8.3 8.9 Eye infection 21.3 22.7 23.2 Passed worms 14.1 17.8 20.8 Table 4 Morbidity Status (%) of all family members on day of the survey Condition All adults 5 -15 year old children < 5 year old children TotalDiarrhoea 2.0 0.1 3.8 1.9Fever 7.4 8.8 10.9 8.2Cough 16.0 8.2 16.7 13.8Skin infection 6.6 3.6 5.8 5.7Eye infection 17.3 0.1 1.3 10.6Passed worms 14.1 16.4 18.6 15.3 Table 5 Morbidity Status (%) of all family members in the previous 7 days Condition All adults 5-15 year old children < 5 year old children Total Diarrhoea 8.1 2.5 12.2 7.0Fever 20.3 17.3 26.9 20.3Cough 20.6 12.1 26.3 18.9Skin infection 6.6 3.8 6.4 5.8Eye infection 18.5 1.1 1.9 11.5Passed worms 17.2 16.7 19.2 17.3 Table 6 Morbidity Status (%) of all family members in the previous 30 days Condition All adults 5-15 year old children < 5 year old children TotalDiarrhoea 15.8 8.8 24.4 14.8Fever 39.8 31.7 50.6 38.8Cough 29.8 18.9 39.1 27.8Skin infection 6.9 3.8 7.7 6.1Eye infection 13.4 1.6 1.9 8.6Passed worms 19.7 21.6 22.4 20.6

9
5.5 EMPLOYMENT Overall 20 household heads did not work (5.2%; 4.8% male, 5.7% female) of whom 14 were disabled or chronically ill. Nearly a third of female heads were domestic maids (31.8%), a quarter were day labourers (24.2%) and 14.6% were beggars while over half of the men were employed as day labourers (54.0%), 15.8% were rickshaw pullers, driving vans, carts or boats, and 9.3% were engaged in petty trading. Of all the adult family members 90.7% were working and this percentage was similar in male (91.4%) and female (89.2%) headed households. Of the children between 5 and 15 years of age, 63 (17.3%) were employed (unpaid, regular or irregular) of whom 7.4% were in regular work. There was a significant disparity in working practices of 5 to 15 year olds living in male and female head households; 24.6% of 5 to 15 year olds worked in female headed households compared with only 13.9% in male headed households (χ2=6.19, p<0.025). 5.6. HOUSEHOLD LAND OWNERSHIP Overall only 15.9% of households owned some homestead land compared with 94.7% nationally (HIES, 2005). Male headed households were significantly more likely to own homestead land (20.7%) than female headed households (9.9%, χ2=11.06, p=0.01). The amount owned was small and only 15 households had more than 5 decimals (Table 7). Only 5 households owned cultivatable land, 10 households sharecropped (9 male headed and only 1 female headed, χ2=4.05, p<0.05) and 10 households rented land free of charge (all male, χ2=7.10, p<0.01). It is not possible to test for differences between rural NGOs because of the small sample sizes of those with land. Table 7 Household land ownership by head of household Variable Male (%, n= 227) Female (%, n= 157) Homestead land owned (decimal) 0
0.1 – 2.49 2.50– 4.99
5.0+
79.39.75.35.7
91.13.83.81.3
Cultivatable land owned No Yes
98.21.8
99.40.6
Cultivatable land share cropped No Yes
96.04.0
99.40.6
Cultivatable land used free of charge No Yes
95.6
4.4100.0
0.0
10
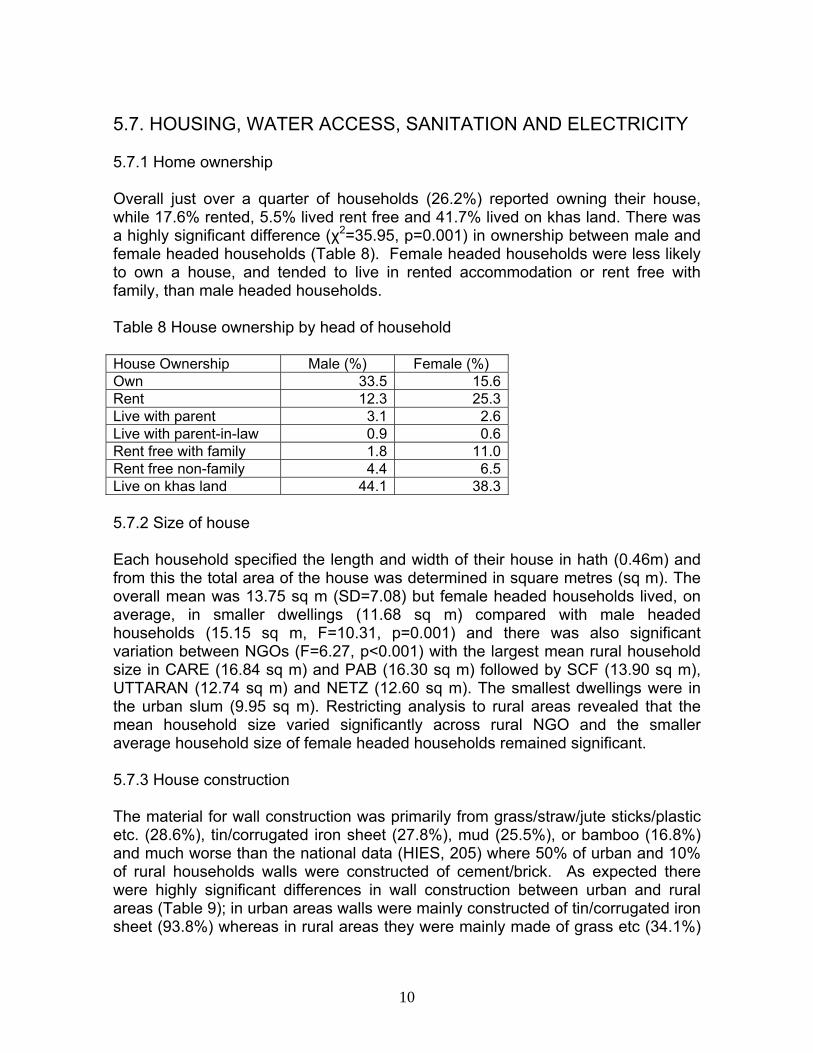
5.7. HOUSING, WATER ACCESS, SANITATION AND ELECTRICITY 5.7.1 Home ownership Overall just over a quarter of households (26.2%) reported owning their house, while 17.6% rented, 5.5% lived rent free and 41.7% lived on khas land. There was a highly significant difference (χ2=35.95, p=0.001) in ownership between male and female headed households (Table 8). Female headed households were less likely to own a house, and tended to live in rented accommodation or rent free with family, than male headed households. Table 8 House ownership by head of household House Ownership Male (%) Female (%) Own 33.5 15.6Rent 12.3 25.3Live with parent 3.1 2.6Live with parent-in-law 0.9 0.6Rent free with family 1.8 11.0Rent free non-family 4.4 6.5Live on khas land 44.1 38.3 5.7.2 Size of house Each household specified the length and width of their house in hath (0.46m) and from this the total area of the house was determined in square metres (sq m). The overall mean was 13.75 sq m (SD=7.08) but female headed households lived, on average, in smaller dwellings (11.68 sq m) compared with male headed households (15.15 sq m, F=10.31, p=0.001) and there was also significant variation between NGOs (F=6.27, p<0.001) with the largest mean rural household size in CARE (16.84 sq m) and PAB (16.30 sq m) followed by SCF (13.90 sq m), UTTARAN (12.74 sq m) and NETZ (12.60 sq m). The smallest dwellings were in the urban slum (9.95 sq m). Restricting analysis to rural areas revealed that the mean household size varied significantly across rural NGO and the smaller average household size of female headed households remained significant. 5.7.3 House construction The material for wall construction was primarily from grass/straw/jute sticks/plastic etc. (28.6%), tin/corrugated iron sheet (27.8%), mud (25.5%), or bamboo (16.8%) and much worse than the national data (HIES, 205) where 50% of urban and 10% of rural households walls were constructed of cement/brick. As expected there were highly significant differences in wall construction between urban and rural areas (Table 9); in urban areas walls were mainly constructed of tin/corrugated iron sheet (93.8%) whereas in rural areas they were mainly made of grass etc (34.1%)

11
or mud (30.3%) and to a lesser extent by bamboo (20.2%) and tin/corrugated iron sheet (14.2%, χ2=172.01, p<0.001). There was also significant variation between rural NGOs with CARE, PAB and SCF having the highest usage of grass etc., NETZ primarily mud, and UTTARAN mud and bamboo. Table 9 Wall construction by NGO (%) NGO Grass etc. Bamboo Mud Corrugated Iron Cement/BrickCARE 57.8 21.9 0 20.3 0DSK 1.6 0 1.6 93.8 3.1NETZ 7.9 0 90.5 1.6 0PAB 48.4 23.4 0 28.1 0SCF 42.9 30.2 14.3 12.7 0UTTARAN 12.7 25.4 47.6 9.5 4.8TOTAL 28.6 16.8 25.5 27.8 1.3 The material for roof construction was primarily tin/corrugated iron sheet (75.3%, Table 10) or grass/straw/jute stick/plastic (22.3%) whereas nationally corrugated tin was used in 82.3% of households, brick/cement in 7.7% and grass/straw etc. only accounted for 10%. Significant heterogeneity was found between material used for roofing construction between NGOs (χ2=160.36, p<0.001). Nearly all urban slum dwellers used tin/corrugated iron sheet for roofing as did nearly all households in PAB. Just over three-quarters of the roofs of CARE households were made of tin/corrugated sheet while nearly half of SCF and UTTARAN households were constructed with grass etc. One household in UTTARAN had no roof. No significant differences were found in material for roof construction by head of household. Table 10 Roof construction by NGO (%) NGO Grass etc. Bamboo Mud Corrugated
Iron Cement/Brick
No roof
CARE 15.6 0 1.6 82.8 0 0DSK 0 0 1.6 95.3 3.1 0NETZ 20.6 0 0 79.4 0 0PAB 3.1 1.6 0 93.8 1.6 0SCF 46.0 0 0 54.0 0 0UTTARAN 49.2 1.6 1.6 46.1 0 1.6TOTAL 22.3 0.5 0.8 75.3 0.8 0.3

12
Nearly all floors were made of mud (84.3%) or cement/brick (10.0%, Table 11). Only 2 rural households used cement/ brick compared with 56.3% in urban slums (χ2=295.11, p<0.001). No significant differences were found in material for floor construction by head of household. Table 11 Floor construction by NGO (%) NGO Grass etc. Bamboo Mud Cement/Brick CARE 0 1.6 96.9 1.6 DSK 0 28.1 15.6 56.3 NETZ 0 0 100 0 PAB 0 0 100 0 SCF 3.2 1.6 95.2 0 UTTARAN 0 0 98.4 1.6 TOTAL 0.5 5.2 84.3 10.0 5.7.4 Source of drinking water The main sources of drinking water were tube well (72.9%), pond/river etc. (14.3%) and pipe (12.2%, Table 12) whereas the corresponding national figures were 89%, 3% and 8% respectively. Highly significant differences (χ2=409.68, p<0.001) were found between NGOs source of drinking water reflecting both urban-rural differences (urban dwellers tended not to use pond/river) but also differences between rural NGOs. For example, usage of pond/river as a source of drinking water was primarily by SCF and to a much lesser extent by UTTARAN households whereas all CARE and NETZ households used a tubewell. 2 urban households purchased drinking water. Table 12 Source of drinking water by NGO (%) NGO Pipe Tubewell Pond/River Purchased CARE 0 100 0 0 DSK 67.2 28.1 1.6 3.1 NETZ 0 100 0 0 PAB 1.6 98.4 0 0 SCF 0 35.9 64.1 0 UTTARAN 4.7 75.8 20.3 0 TOTAL 12.2 72.9 14.3 0.5 Only 8.9% of households owned a tube well and a further 5.2% shared tube well ownership. There was significant variation between NGOs (χ2=300.96, p<0.001) mainly because 37.5% of CARE households owned a tube well with a further 21.9% with shared ownership. No significant differences in tube well ownership were found between male or female headed households.

13
5.7.5 Electricity supply Nearly all rural households (97.0%) had no electricity supply (nationally 68% of rural households do not have electricity) whereas 78.1% of urban dwellers (88% nationally) had an electrical supply (χ2=298.65 p<<0.001) and no significant differences in electricity supply were apparent between male or female headed households. 5.7.6 Defecation practices Overall 50.5% (Table 13) of households used a ring/slab latrine followed by open defecation (29.4%) and pit latrine (10.2%). There were very significant differences in place of defecation not entirely related to location. Over a third of urban dwellers defecated using a sanitary latrine, while a ring/slab latrine was used by most CARE households and to a lesser extent by UTTARAN and SCF households. Open defecation was practiced by nearly all NETZ households and by nearly half of the PAB households (χ2=303.84, p<0.001). Table 13 Defecation practices by NGO (%) NGO Open Hanging Pit Ring/slab Sanitary CARE 1.6 0 7.8 90.6 0 DSK 1.6 7.8 10.9 43.8 35.9 NETZ 93.8 0 0 4.7 1.6 PAB 45.3 0 12.5 42.2 0 SCF 20.3 6.3 14.1 59.4 0 UTTARAN 14.1 3.1 15.6 62.5 4.7 TOTAL 29.4 2.9 10.2 50.5 7.0 5.8. CASH LOANS AND SAVINGS Five sources of cash loan were identified (i) free informal (ii) informal loans with interest (iii) interest loans from shomiti (iv) interest loans from microfinance institutions and (v) interest loans from bank or Government of Bangladesh. A total of 73 households (19.0%) had interest free loans (range 1 to 7 loans) of whom over half (11.5%) had only 1 loan (Table 14). The percentage of households taking up an interest free loan was very similar in urban and rural areas (15.6% and 19.7%, respectively). The mean amount of Taka borrowed did not significantly increase with the number of loans because of the large variability in the amount borrowed and the overall average loan was 2675 Taka. The number of loans did not vary by NGO or by head of household and there was no significant difference in mean loans between NGOs or by household head.

14
Table 14 Number of loans, average amount of loan (Taka) and range Type of Loan Number of
Loans N Mean
(Taka)Range (Taka)
Free informal 1 2 3+ Total
44181173
2536244836032675
30-8000150-7000
100-1250030-12500
Interest informal 1 2 3+ Total
30131558
2985538571074589
100-137801000-150001500-15000100-15000
Shomiti 1+ 9 3896 600-9000Microfinance 1 18 4391 600-10000Bank 1 8 6090 835-20000Total loans 1
2 3 4+ Total
60361717
130
291051405456
101104802
30-13780700-20000100-15000300-1820030-20000
Total interest only loans 1 2 3 4+ Total
2724131478
32275883545092695499
500-13780100-20000
1000-150001500-17200100-20000
A total of 58 households (15.1%) had an informal interest loan (range 1 to 6) and the mean amount of the loan was 4589 Taka. There was a significant increase in mean loan as the number of loans increased (F=12.25, p<0.001). There were no significant differences in the number or amount of loan by NGO or head of household. The mean informal interest loan was significantly higher than the interest free loan (4589 versus 2675 Taka, t=2.62, p=0.021). The number of households taking out any other form of interest loan was 9.1% (Table 14) and the average bank loan was much higher than any other form of loan. Overall only 33.9% of households had some form of loan. The total loan number of loans did not vary by NGO or head of household. The overall mean loan was 4802 Taka and the mean loan increased with the number of loans (F=13.73, p<0.001). There were significant differences in mean loans between NGOs (F=5.81, p=0.017) with highest means in PAB and Care (6464 and 6383 Taka, respectively) and lowest in NETZ (701 Taka). Male headed households borrowed more than female headed households (5309 versus 3034 Taka, respectively) a difference of 2275 Taka (F=5.32, p=0.023) and this difference remained significant after taking into account variation between NGOs.

15
Overall 20.3% of households had some form of interest loan, mainly informal (Table 14). Those with a single loan source tend to borrow less than those with multiple sources and there was a significant increase in mean loan as the number of loans increased (F=5.64, p=0.002). There were no significant differences in means in relation head of household or NGO. In total 39.1% (n=150) had some cash savings, mean 478 Taka (range 3 – 6480 Taka) and there was significant differences in the extent of savings between NGOs (F=4.53, p=0.001) with the lowest mean savings in NETZ households (82 Taka) and highest in PAB (1204 Taka). 5.9 HOUSEHOLD ASSETS 5.9.1 Animals Only one urban household had an animal (chicken) while eight rural households owned adult cattle, two households had calves and only 2 households had a pig. Twenty households (6.25% of rural households) had goats and there was no significant heterogeneity in pig ownership between rural NGOs or by head of household. Just over one fifth (22.4%) of all households (26.9% of rural households) owned poultry. There was significant variation in poultry ownership between NGOs. About one third or more of households in CARE and UTTARAN owned poultry compared with 1 in 6 in PAB and NETZ (χ2=9.93, p=0.042). A total of 105 rural households had animals, 32.8% of all the rural NGO households. The amount spent on animals ranged from 50 to 13000 Taka and the mean was 1157 Taka. There was no significant difference by head of household but the amount spent was highest in SCF and PAB and lowest in UTTARAN (F=2.65, p=0.038, Table 15). Table 15 Mean amount spent on animals by NGO and head of household NGO Male Female Total n Mean n Mean n Mean CARE 20 783 5 760 25 778NETZ 9 607 19 595 19 600PAB 14 2319 1 200 15 2177SCF 10 2892 11 1827 21 2291UTTARAN 22 384 3 467 25 394Total 75 1201 30 1048 105 1157 5.9.2 Working equipment Only 1 urban household owned a sewing machine, 2 households had equipment for cottage industry, 3 rural households owned a boat, 16 households had a

16
rickshaw (10 from UTTARAN), 36 rural households (11.5% of rural households) owned a net. Net ownership varied significantly between rural NGOs (χ2=20.23, p=0.001); 13 households (20.3%) in the SCF sample owned a net compared with only 2 households (1.5%) in the CARE sample. Agricultural equipment was owned by 181 households but there were highly significant differences between NGOs (χ2=78.42, p<0.001) with greatest ownership in NETZ (75%) and least in SCF (39.1%). Male headed households were more likely to own a net than female headed households (13.2% versus 5.2%, χ2=9.04, p=0.002) and agricultural equipment (53.7% versus 37.6%, respectively, χ2=19.92, p<0.001). Working equipment was owned by 205 households (53.4%) but male headed households were more likely (61.7%) to own equipment than female headed households (41.4%, χ2=15.33, p<0.001). Male headed households also owned more equipment (3+ pieces, 27.3% versus 8.9% for male and female headed households, respectively, χ2 =28.98, p<0.001). There was also significant heterogeneity between NGOs (χ2 =44.76, p<0.001) which was mainly due to the lower ownership in SCF (53.1%) and greatest in NETZ (75%). Households with more adult members tended to have more equipment (χ2=73.94, p<0.001). Table 16 Mean amount spent on equipment by NGO and head of household NGO Male Female Total n Mean n Mean n Mean CARE 34 267 2 75 36 257DSK 4 64 8 973 12 670NETZ 27 192 21 80 48 143PAB 28 530 8 33 36 420SCF 21 426 13 309 34 381UTTARAN 26 1548 13 194 39 1097Total 140 561 65 252 205 463 The mean amount spent on purchasing equipment was 463 Taka (Table 16, range 4 – 6600 Taka) and male headed households spent more than double (561 versus 252 Taka) compared with female headed households (F=4.01, p=0.047). There was also significant heterogeneity in amount spent between rural NGOs (F=4.63, p<0.001) with least spending in NETZ and greatest in UTTARAN. Spending on equipment did not associate with the number of adult family members. 5.3 Household belongings Only 4 households owned a television and 3 households owned a radio. Eleven households owned a bicycle, 18 households owned a mobile phone and 19 a wardrobe (10 households in DSK). 38 households owned a fan of which 36 lived in the urban slums. In total 51 households owned a mattress and 58 a chair. There was significant variation in mattress and chair ownership between NGOs with only

17
2 households in SCF, and 4 in DSK and NETZ owning a chair compared with 16 households in CARE (χ2=45.25, p<0.001); only 1 household in SCF had a mattress, 2 in NETZ, 3 in UTTARAN and 15 in CARE (χ2=45.25, p<0.001). 86 households owned a table, more so in CARE and PAB (over 40%) and least in NETZ and SCF (both 6.3%). Ownership of a bed was very high in PAB and CARE (both over 90%) and least in SCF (37.5%, χ2=95.36, p<0.001). Just over a third of households owned a wooden trunk, more so in CARE (51.6%) than NETZ (14.6%, χ2=61.90, p<0.001). Jewellery was owned by 186 households more so in UTTARAN (60.9%) and least in NETZ (18.8%, χ2=29.40, p<0.001). Blankets were owned by nearly all households (96.9%) and there was no variation between NGOs. Male headed houses owned more jewellery than female headed (59.9% versus 31.9% respectively, χ2=29.27, p<0.001), were more likely to own a wooden box (39.6% versus 27.4%, χ2=6.16, p=0.013), table (29.1% versus 12.7%, χ2=14/25, p<0.001), chair (22.0% versus 5.1%, χ2=20.75, p<0.001) and mattress (16.3% versus 8.9%, χ2=4.39, p=0.036). Table 17 Mean amount spent on household belongings by NGO and head of household NGO Male Female Total n Mean n Mean n Mean CARE 53 2246 11 916 64 2017DSK 25 2512 39 2653 64 2598NETZ 28 779 36 835 64 810PAB 46 2763 18 1324 64 2358SCF 36 1214 28 945 64 1097UTTARAN 39 1700 25 1068 64 1453Total 227 1941 157 1405 384 1722 The mean amount spent on household goods was 1722 Taka (Table 17) and male headed households spent significantly more than female headed households (1941 versus 1405 Taka, respectively, F=10.49, p=0.001). There was also very significant variation between NGOs (F=12.35, p<0.001) with the greatest mean household expenditure by DSK and PAB and the lowest expenditure by NETZ households. 5.9.4 Total household assets The worth of animals, equipment and household belongings were summed and the mean worth of all (total) assets was 2286 Taka (Table 18). Although separate analyses revealed that male headed households assets were worth more than female headed households (2684 versus 1710 Taka, respectively, F=15.13, p=0.001) there was an increase in cost of assets with increasing number of adult members and the sex difference became insignificant after taking into account

18
variation between NGOs and number of adults. There was significant variation between NGOs (F=4.06, p<0.001) with the highest mean in PAB and lowest in NETZ. Table 18 Mean total assets by NGO and head of household NGO Male Female Total N Mean N Mean n Mean CARE 53 2713 11 1275 64 2466DSK 25 2523 39 2854 64 2724NETZ 28 1159 36 1046 64 1095PAB 46 3791 18 1349 64 3104SCF 36 2241 28 1807 64 2051UTTARAN 39 2949 25 1225 64 2276Total 227 2684 157 1710 384 2286 5.10. HOUSEHOLD INCOME Sixty two different income streams were identified, of either cash or in-kind income (Table 19). The main cash income sources were agricultural labour, other daily labour, rickshaw puller, skilled labour, industrial/garment, petty trade, transport, other sources, donations from relatives, shiree relief and taking a loan, while for in-kind income the main sources (apart from the anomaly of the rickshaw) are loan taken, industrial/garment, rag picking and other sources. Cash income was usually reported as higher than in-kind income. There was no significant variation in mean cash income or in-kind income by head of household. Overall mean total cash income was 2718 Taka and 5.2% of households reported no cash income, significantly more so in female headed households (11.5% versus 0.8%, female and male, respectively (χ2=21.06, p=0.001). Mean cash income did not vary significantly by head of household but there was significant variation between mean cash income of NGOs which was accounted for by the much higher urban mean (5637 versus 2110 Taka, urban and rural, respectively, F=0.89, p<0.001). Overall mean total in-kind income was 556 Taka and 39.6% of households reported no in-kind income. There was no significant heterogeneity between NGO means, or by head of household or by number of working adults. Combining cash and in-kind income revealed that only 1 household reported no income and the average total income was 3724 Taka. Variation in mean total income was mainly due to differences between urban and rural NGOs (urban 6270 versus 2675 Taka, t=4.95, p<0.001) but there were no significant differences by head of household or between rural NGOs.

19
Table 19 Household income in the last month Income Source Cash income In-kind income % Mean % Mean Agricultural day labourer 50.0 1842 7.8 528 Other daily labour 22.1 1316 4.7 632 Domestic work 14.8 636 17.2 492 Rickshaw etc 11.7 2174 0.3 14000 Skilled labour 3.6 1341 0.3 383 Own agricultural produce 0.5 382 0.5 382 Fishing 4.4 990 4.1 97 Livestock 1.0 365 2.6 127 Industrial/garment labour 2.6 1770 0.3 900 Petty trade 13.5 1753 3.6 819 Cottage industry 1.6 289 0.8 150 Service 0 0 0 0 Transport 0.3 2000 0 0 Begging 6.3 545 8.1 529 Rag picking/scavenger 0.5 1460 0.3 800 Motorised van 0.3 1800 0 0 Fuel sales 0.8 383 1.0 271 Child labour 4.2 1078 0.8 383 Rural maintenance programme
1.8 1551 0 0
100 day cash-for-work 0.3 720 0 0 Foreign remittance 0 0 0 0 Donation from relatives 6.0 2572 6.5 286 Fetra/Zakat 0.5 110 0.5 75 Government allowance 8.1 519 1.0 191 Training allowance 21.1 484 4.2 282 Shiree relief 0.8 2294 21.1 460 Other NGO relief 0.3 450 0 0 Loan Taken 7.0 1446 2.1 1006 Savings withdrawal 1.3 490 0 0 Other 11.7 4563 7.3 2156 Total income 94.8 2718 60.4 556 Total regular income 92.7 1832 HIES calculated income based on regular cash income only. In shiree the mean regular cash income per household per month was only1832 Taka compared with 7203 Taka nationally (Table 20). In rural areas the mean income was 1640 (6095 nationally) and 2792 (10463 nationally) in urban areas. 54.4% and 45.3% of rural and urban households respectively were in the lowest income decile based on household income/month. Mean per capita income per day was 19.2 Taka (28.7 urban and 17.3 rural). 69.4% of rural households had an income of <22 Taka per

20
capita/day (2007 prices) increasing to 78.8% with a cut-off of 26 Taka per capita/day (2009 prices). For urban households 50% had an income of <26 Taka per capita/day (2007 prices) rising to 62.5% based on 30 Taka per day per capita (2009 prices). Table 20 Regular cash income by NGO Household cash
income/month Mean cash income per
earner/month
Mean cash income per capita/month
Mean cash income per capita/day
NGO shiree HIES shiree HIES shiree HIES CARE 2231 1108 661 22.0DSK (urban)
2792 10463 1704 6975 861 2217 28.7
NETZ 1460 827 531 17.7PAB 2011 1035 629 20.9SCF 1110 684 345 11.5UTTARAN 1388 731 426 14.2Total Rural 1640 6095 4449 518 1246 17.3Total 1832 7203 1019 5145 575 1485 19.2 5.11 HOUSEHOLD EXPENDITURE Forty four household expenditure items were identified, 17 involving food items, 17 primarily concerning the house and 10 were work related. Information was provided either daily, weekly, monthly or over the past 3 months depending on the purchasing. For each item a mean monthly amount was computed (Table 21). Households did not purchase all items so the % who purchased source refers to the percentage of households who bought that item (e.g. 92.2%, 354 households purchased rice but only 0.8% 31 households purchased paddy). The mean expenditure on food was 1729 Taka and the amount spent on food varied significantly by NGO (F=12.01, p<0.001), head of household (F=6.97, p=0.009) and number of adult family members (F=31.86, p<0.001); male headed households spent more on food that female headed households (+289 Taka) and households with only 1, 2 or 3 adults spent less (1 adult -1742 Taka, 2 adults -884 Taka, 3 adults -311 Taka) than households with 4 adults. DSK spent the most on food (Table 22) and there was significant heterogeneity between rural NGOs (F=5.30, p<0.001).

21
Table 21 Household expenditure per month Expenditure Source % who purchased
source Mean of those who
purchased Overall Mean
Rice 92.2 1064 981 Paddy 0.8 606 5 Wheat 44.0 68 30 Potato 92.4 118 109 Pulses 58.3 32.7 19 Fish 69.8 90 63 Meat 16.9 119 20 Eggs 47.7 35 16 Milk 12.0 72 9 Green vegetables 60.7 60 36 Other vegetables 88.9 165 146 Fruit 15.4 46 7 Sugar 35.4 48 17 Salt 94.8 23 22 Spices 96.1 99 95 Cooking oil 96.6 74 71 Other food items 53.9 153 83 Total food 98.2 1761 1729 Kerosene 95.1 97 92 Soap 94.3 38 36 Other toiletries 4.7 373 10 Education 30.7 82 25 Transport costs 24.2 182 44 Health care 74.0 242 179 Clothing/footwear 20.6 144 30 House rent 18.5 772 143 Household furniture 1.0 178 2 Household repair 7.0 710 50 Electricity 8.9 107 9 Mobile phone 15.1 94 14 Wedding expenses 5.7 362 21 Religious event 20.1 45 9 Interest payments 11.2 990 9 Loan given 0.3 3333 110 Other household costs 2.3 76 2 Total house 99.0 793 785 Work related 4.7 373 17 Agriculture 2.9 599 17 Livestock inputs 10.9 146 16 Livestock purchase 0.3 275 1 Land/pond lease 0.3 4667 12 Business 5.5 5500 301 Rickshaw rent 9.4 493 46 Fishing inputs 0.3 133 1 Other costs 24.0 564 135 Total work 46.1 1184 546 Total expenditure 99.2 3084 3060 Total regular expenditure 99.2 2338 2320

22
The mean expenditure on household items was 785 Taka. There was no significant effect of number of adult household members or any significant difference between male and female heads on expenditure on household items. DSK spent the most and NETZ the least (F=8.36, p<0.001), but there was no significant heterogeneity in mean household expenditure among the rural NGOs. The mean expenditure on work-related items was 546 Taka and there was no significant variation by head of household or number of adult family members. The significant NGO effect (F=8.80, p<0.001) was due to the much higher mean in DSK, and no significant differences were found between rural NGOs. Of the total expenditure (Table 22) 56% was spent on food which is comparable to the national percentage. Over half (56.7%) of food expenditure was on rice. House expenditure accounted for nearly a quarter of all expenditure (25.7%) and work related items cost 17.8% of the total expenditure. The mean total expenditure was 3060 Taka and there was no significant difference by head of household. Households with 1, 2 or 3 adults spent 2321, 1072 and 405 Taka, respectively, less than households with 4 adult members (F=4.44, p=0.004). Total expenditure varied between NGOs, DSK, on average, spending the most and NETZ the least (F=20.52, p<0.001, Table 22). Expenditure varied significantly between rural NGOs (F=3.50, p=0.008). Table 22 Mean expenditure on food, house, work-related and total and regular expenditure by NGO NGO Food Household Work
relatedTotal Household
regular expenditure/month
Mean regular expenditure
per capita/day shiree HIES CARE 1995 785 495 3275 2317 22.8DSK 2212 1762 2155 6130 3864 8533 40.6NETZ 1282 250 76 1608 1480 17.6PAB 1990 673 321 2985 2337 25.0SCF 1445 619 155 2220 2045 27.9UTTARAN 1452 620 73 2145 1872 20.5Total rural 2011 5319 22.8Total 1729 785 546 3060 2320 6134 25.7 HIES calculated regular expenditure. In shiree the mean regular expenditure per household per month was only 2320 Taka compared with 6134 Taka nationally (Table 22). In rural areas the mean expenditure was 2011 (5319 nationally) and 3864 (8533 nationally) in urban areas. Expenditure on food increased to 74.5% of total expenditure. 75.8% and 49.2% of rural and urban households respectively

23
were in the lowest expenditure decile based on household expenditure/month. Mean per capita expenditure per day was 25.7 Taka (40.6 urban and 22.8 rural). 63% of rural households had an expenditure of <22 Taka per capita/day (2007 prices) increasing to 74% with a cut-off of 26 Taka per capita/day (2009 prices). For urban households 24% had an expenditure of <26 Taka per capita/day (2007 prices) rising to 40% based on 30 Taka per day per capita (2009 prices). 5.12 DIFFERENCE BETWEEN HOUSEHOLD INCOME AND EXPENDITURE The difference between household income and expenditure (credit/debit balance) was calculated for each household and the overall mean was +214 Taka (credit), and just over half of the households (52.1%) were in credit. Overall male headed households were in debit (-174 Taka) and female headed households in credit (+775 Taka, F=4.74, p=0.03) and there was no significant variation between NGOs (Table 23). However when the analyses were restricted to regular monthly income and expenditure 67% of households were in debit with an overall mean of -487 Taka. Significant heterogeneity existed between NGOs but there was no difference between male and female headed households. Table 23 Difference between reported household income and expenditure by NGO NGO Total Income – Total
Expenditure Regular Income – Regular Expenditure
CARE -247 -86 DSK +140 -1072 NETZ +241 -20 PAB +277 -325 SCF +994 -934 UTTARAN -124 -485 Total +45 -487 5.13 HOUSEHOLD FOOD INTAKE Very few families consumed cassava and over 90% of households did not consume any poultry, meat, fruits or milk (Table 24). Urban dwellers more likely to consume pulses, other vegetables, fruits, eggs, dried fish and poultry than rural dwellers. Rural NGOs consumption was similar except for flour consumption (greatest in PAB and least in NETZ, χ2=58.81, p<0.001) and fresh fish (least in NETZ, χ2=35.96, p<0.001). There were no significant differences between the number of days any food was consumed by male and female headed households.

24
Table 24 Number of days in the last week that household members consumed foodstuffs Food Number of days food consumed 0 (%) 1 (%) 2 (%) 3+ (%) Rice 0 0 0 100 Flour 72.1 10.2 8.3 9.4 Pulse 61.2 22.4 10.2 6.3 Potato 1.6 1.6 6.0 90.9 Cassava 99.7 0 0.3 0 Green vegetables 18.0 15.9 30.5 35.7 Other vegetables 5.2 4.4 22.4 68.0 Fruits 90.4 6.5 1.6 1.6 Milk 92.2 4.9 0.8 2.1 Eggs 70.6 22.1 3.9 3.4 Fresh fish 37.2 33.9 17.7 11.2 Dried fish 73.7 10.4 8.9 7.0 Poultry 95.6 3.1 0.5 0.8 Meat 91.1 6.8 1.3 0.8
5.14 HOUSEHOLD FOOD SECURITY Households had poor food security (Table 25) and during the week prior to the survey they had eaten smaller portions of food, lower quality food and less than three meals a day. Eating smaller portions and less than three meals a day was more common in rural than urban dwellers (32.8% versus 14.4%, χ2=18.71, p<0.001 for smaller portions and 53.2% versus 28.1%, χ2=20.58, p<0.001 for three meals a day). No urban/rural differences were apparent for quality of food, food gathering, sending family members elsewhere for food or of giving more food to earning household members. Female heads were much more likely to eat smaller portions than male heads (86% versus 60.4%, respectively, χ2=9.84, p=0.020). Table 25 Food strategy Food Strategy Yes (%) 3+ days (%) Eat smaller portion 82.6 45.9 Eat < 3 times a day 67.7 46.1 Eat food of less quality 63.5 20.5 Eat gathered food 19.8 2.7 Eat no food in 24 hours adult 6.5 0 Eat no food in 24 hours child 0.3 0 Borrow money to buy food 17.4 1.9 Bought food on credit 37.1 5.7 Send family member elsewhere for food 16.4 6.2 Give more food to earning household members 34.4 25.5

25
5.15 SOCIAL EMPOWERMENT Six questions were put to the male head of household (n=173, Table 26) and seven questions were put to female heads and female spouses (n=373, Table 27). Both males (combining agree strongly and agree, 96.5%) and females (93.4%) agreed that investing in children’s education was the best use of scare resources. Significantly more males (72.2%) than females (61.6%) felt that they should decide how to use the money from a loan (χ2=5.83, p<0.025). Males were significantly more confident about the future than females (72.8% versus 60.8%, χ2=7.41, p<0.01) and about decision making in the family (97.7% versus 88.7%, χ2=12.26, p<0.001). Nearly 40% of both males and females felt that they did not have people outside their family who could be relied on. Both males and females felt that they had enough information about government programmes. Just over two thirds of women (67.5%) did not feel frightened about moving outside their village. Table 25 Social empowerment (Male replies) Question Male (%) Agree
stronglyAgree Neither Disagree Disagree
strongly Investing in children’s education is the best use of my scarce resources
86.7 9.8 2.3 1.2 0
If you earn money or receive a loan, you decide how to use the money
43.9 28.3 1.7 6.4 19.7
You feel confident that you can face whatever the future brings/holds
41.0 31.8 4.6 12.7 9.8
What you say matters in decisions in your household
83.8 13.9 0.6 1.2 0.6
There are people outside your family you can rely on for help
24.3 31.8 5.2 11.0 27.7
You feel you have enough information about the government programmes to help the poor
19.7 50.3 4.0 19.7 6.4

26
Table 26 Social empowerment (Female replies) Question Female (%) Agree
stronglyAgree Neither Disagree Disagree
strongly Investing in children’s education is the best use of my scarce resources
79.9 13.4 4.6 1.6 0.5
If you earn money or receive a loan, you decide how to use the money
33.2 28.4 4.3 11.3 22.8
You feel confident that you can face whatever the future brings/holds
27.6 33.2 9.9 13.1 16.1
What you say matters in decisions in your household
49.6 39.1 1.3 5.4 4.6
There are people outside your family you can rely on for help
25.7 29.2 5.9 8.3 30.8
You feel you have enough information about the government programmes to help the poor
10.2 51.2 5.1 15.5 18.0
You feel frightened of moving alone outside your village
21.7 16.6 3.2 19.5 48.0
5.16 NUTRITIONAL STATUS 5.16.1 Head of Household 5.16.1.1 BMI (Body Mass Index) In total 171 male and 150 female heads of household had their weight and height measured from which the Body Mass Index (weight (kg)/height (m)2) was calculated. There was no significant difference in mean BMI between male and females or between NGOs (Table 28) and the overall mean BMI was 18.7. BMI was categorised into the three levels of Chronic Energy Deficiency (CED) <16.0 (CED III), 16 - 16.9 (CED II) and 17 – 18.49 (CED I) and normal (18.5+). There was no significant difference in the distribution of BMI categories by NGO and overall 50.5% of the heads of household were suffering from some degree of undernutrition (compared with 30% in the Bangladesh Demographic Survey, 2007), rising to 63.9% in NETZ.

27
Table 28 Mean BMI and levels of chronic energy deficiency by NGO and head of household NGO Mean BMI BMI categories (%) Male Female <16 16 – 16.9 17 – 18.49 18.5+ CARE 19.2 18.2 8.9 13.3 13.3 64.4DSK 18.2 19.5 15.5 8.6 31.0 44.8NETZ 18.1 18.1 13.1 14.8 36.1 36.1PAB 18.9 18.3 1.9 13.5 26.9 57.7SCF 17.8 18.8 12.0 22.0 28.0 38.0UTTARAN 18.7 19.8 9.1 10.9 20.0 60.0Total 18.5 18.9 10.3 13.7 26.5 49.5 5.16.1.2 Haemoglobin level Haemoglobin (Hb) level was obtained from a finger prick of blood using a portable haemoglobin analyser (HemoCue, HomoCue Ltd., Sweden). There was a significant negative relationship between haemoglobin and age (b=-0.46, F=52.86, p< 0.001) and a 10 year age difference was associated with a mean haemoglobin difference of 4.6 g/l. Mean haemoglobin levels varied by head of household (Table 29); males had significantly higher average haemoglobin than females by 18.0 g/l after age correction (F=110.2, p< 0.001) but there were no differences between NGOs. Haemoglobin levels are categorised as severe anaemia <70 (g/l), anaemia 70 - 129.9 in males and 70 – 119.9 in females and normal as ≥130 in males and ≥120 in females. Only two individuals had severe anaemia (Hb levels of 41 and 68 g/l), one of each sex. There was considerable variation in the extent of anaemia by head of household but not between NGOs; 57.2% of female heads were anaemic compared with 33.7% in male heads (χ2=18.05, p<0.001). The highest level of anaemia was found in NETZ in both males and females and the lowest in CARE in males and SCF and UTTARAN in females. Table 29 Mean haemoglobin and anaemic status by NGO and head of household NGO Mean Hb Hb category (%)
Anaemic Normal Male Female Male Female Male Female CARE 135.7 107.7 32.4 63.6 67.6 36.4 DSK 138.1 117.0 35.0 60.5 65.0 39.5 NETZ 132.4 112.5 48.0 66.7 52.0 33.3 PAB 138.7 116.7 20.6 61.1 79.4 38.9 SCF 130.9 118.0 37.0 44.0 63.0 56.0 UTTARAN 135.8 116.1 34.4 45.8 65.6 54.2 Total 135.3 115.2 33.7 57.2 66.3 42.8

28
5.16.1.3 BMI and haemoglobin level There was a significant positive relationship between haemoglobin level and BMI, such that for each 1 unit increase in BMI, haemoglobin level increased by 0.8g/l (Figure 2). Figure 2 Relationship between adult haemoglobin level (g/l) and BMI
The relationship between haemoglobin and BMI categories is presented in Table 30 by head of household. There were significant differences (χ2=17.31, p=002) and 75.3% of female headed households were either anaemic only, CED only, or both anaemic and CED compared with only 62.9% of male headed households. Table 30 Relationship between haemoglobin and BMI categories Hb category BMI category Male (%) Female (%) Total (%) Normal Normal 37.1 24.7 31.3Normal CED 29.4 18.7 24.4Anaemic Normal 13.5 23.3 18.1Anaemic CED 20.0 33.3 26.3 The association between haemoglobin and BMI categories by NGO is presented in Table 31 and there was some heterogeneity between NGOs (χ2=29.73, p=0.013)
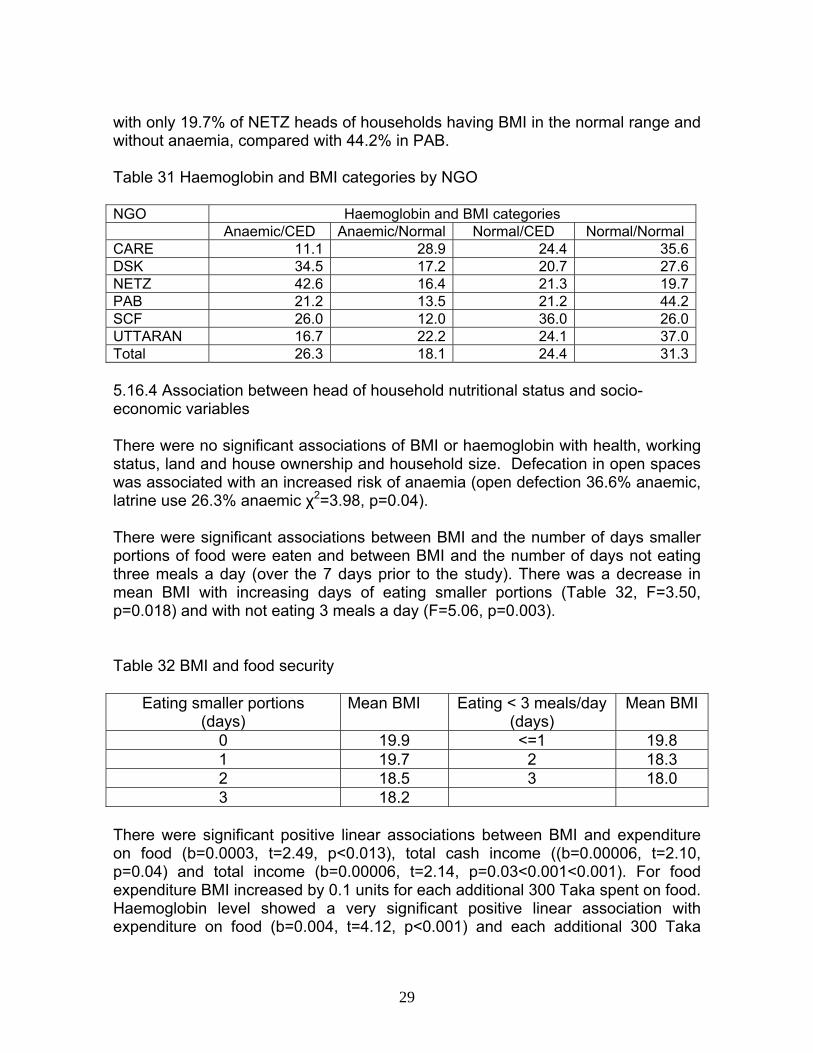
29
with only 19.7% of NETZ heads of households having BMI in the normal range and without anaemia, compared with 44.2% in PAB. Table 31 Haemoglobin and BMI categories by NGO NGO Haemoglobin and BMI categories Anaemic/CED Anaemic/Normal Normal/CED Normal/Normal CARE 11.1 28.9 24.4 35.6DSK 34.5 17.2 20.7 27.6NETZ 42.6 16.4 21.3 19.7PAB 21.2 13.5 21.2 44.2SCF 26.0 12.0 36.0 26.0UTTARAN 16.7 22.2 24.1 37.0Total 26.3 18.1 24.4 31.3 5.16.4 Association between head of household nutritional status and socio-economic variables There were no significant associations of BMI or haemoglobin with health, working status, land and house ownership and household size. Defecation in open spaces was associated with an increased risk of anaemia (open defection 36.6% anaemic, latrine use 26.3% anaemic χ2=3.98, p=0.04). There were significant associations between BMI and the number of days smaller portions of food were eaten and between BMI and the number of days not eating three meals a day (over the 7 days prior to the study). There was a decrease in mean BMI with increasing days of eating smaller portions (Table 32, F=3.50, p=0.018) and with not eating 3 meals a day (F=5.06, p=0.003). Table 32 BMI and food security
Eating smaller portions (days)
Mean BMI Eating < 3 meals/day (days)
Mean BMI
0 19.9 <=1 19.8 1 19.7 2 18.3 2 18.5 3 18.0 3 18.2
There were significant positive linear associations between BMI and expenditure on food (b=0.0003, t=2.49, p<0.013), total cash income ((b=0.00006, t=2.10, p=0.04) and total income (b=0.00006, t=2.14, p=0.03<0.001<0.001). For food expenditure BMI increased by 0.1 units for each additional 300 Taka spent on food. Haemoglobin level showed a very significant positive linear association with expenditure on food (b=0.004, t=4.12, p<0.001) and each additional 300 Taka

30
spent on food was associated with an increase of haemoglobin by 1.2g/l (Figure 3). Expenditure on food explained just over 5% of the variation in haemoglobin level. Figure 3 Relationship between adult haemoglobin level (g/l) and expenditure on food
The mean expenditure on food by anaemic heads of households was significantly lower by 389 Taka than non-anaemic head (1472 versus 1861 Taka, respectively t=3.25, p=0.001). 5.16.2 Under 5 year old children 5.16.2.1 Anthropometry From the measured height and weight of each child, the z-scores of height-for-age (HAZ), weight-for-age (WAZ) and weight-for-height (WHZ) were computed using the WHO (2006) standards. For example, z-score for height = (observed height-median standard height) standard deviation of height Low height-for-age (or length-for-age for children below 2 years of age) is a measure of past (chronic) undernutrition. Infants and children with z-scores <-2.00 are said to be stunted and those <-3.00 severely stunted. Low weight-for-age reflects both past (chronic) and present (acute) undernutrition but is unable to

31
distinguish between them. Infants and children with z-scores <-2.00 are said to be underweight and <-3.00 severely underweight. Low weight-for-height is a measure of current or acute undernutrition and infants and children with z-scores <-2.00 are said to be wasted and <-3.00 severely wasted. A total of 135 children below 5 years of age were analysed of which 63 were boys (sex ratio (1:1.14). There were significant negative relationships between WHZ and WAZ with age and there was also a significant difference in mean WHZ with a lower mean in boys (-1.39) than girls (-0.98, F= 5.29, p=0.023). Mean z-scores did not differ by NGO. Overall just under 50% of children were stunted and underweight and nearly a quarter were wasted (Table 32). There was a significant excess males with severe stunting and excess of females with severe stunting (χ2=7.13, p=0.028). Only 9 children had a positive z-score for HAZ, 5 children for WAZ and 3 children for WHZ. Table 33 Mean z-scores and severity of child undernutrition Nutritional status
Mean % Very severe (<-3)
% Severe (-2.99 - -2.00)
% Normal (≥-1. 99+)
Male Female Total Male Female Total Male Female Total Male Female Total
HAZ -1.87 -1.93 -1.90 20.6 8.1 13.9 25.4 43.2 35.0 54.0 48.6 51.1
WAZ -2.02 -1.78 -1.89 20.6 8.3 14.1 27.0 36.1 31.9 52.4 55.6 54.1
WHZ -1.39 -0.98 -1.18 7.8 5.6 6.6 21.9 11.1 16.2 70.3 83.3 77.2
The shiree child nutrition data were compared with 4 recent surveys (Table 34), the shiree pilot study conducted in October 2009, and two surveys conducted in the Chars and with the most recent national survey. The shiree 2010 nutritional status is worse than the national data but better than the other studies. Table 34 Extent of < 5 year old stunting, wasting and underweight in recent Bangladesh surveys Nutritional status
Shiree 2010 Shiree 2009 CDSP IV 2009 CLP 2009 BDHS 2007
Stunting 48.9 52.2 52.0 54.0 43.0Underweight 45.9 50.4 57.0 49.0 41.0Wasted 22.8 23.7 18.0 14.0 17.0 Only 35.8% of children had a normal HAZ, WAZ and WHZ (Table 35) and over 14.2% were stunted, underweight and wasted. Over 80% of the wasted children (acute undernutrition) also showed evidence of chronic undernutrition.
32
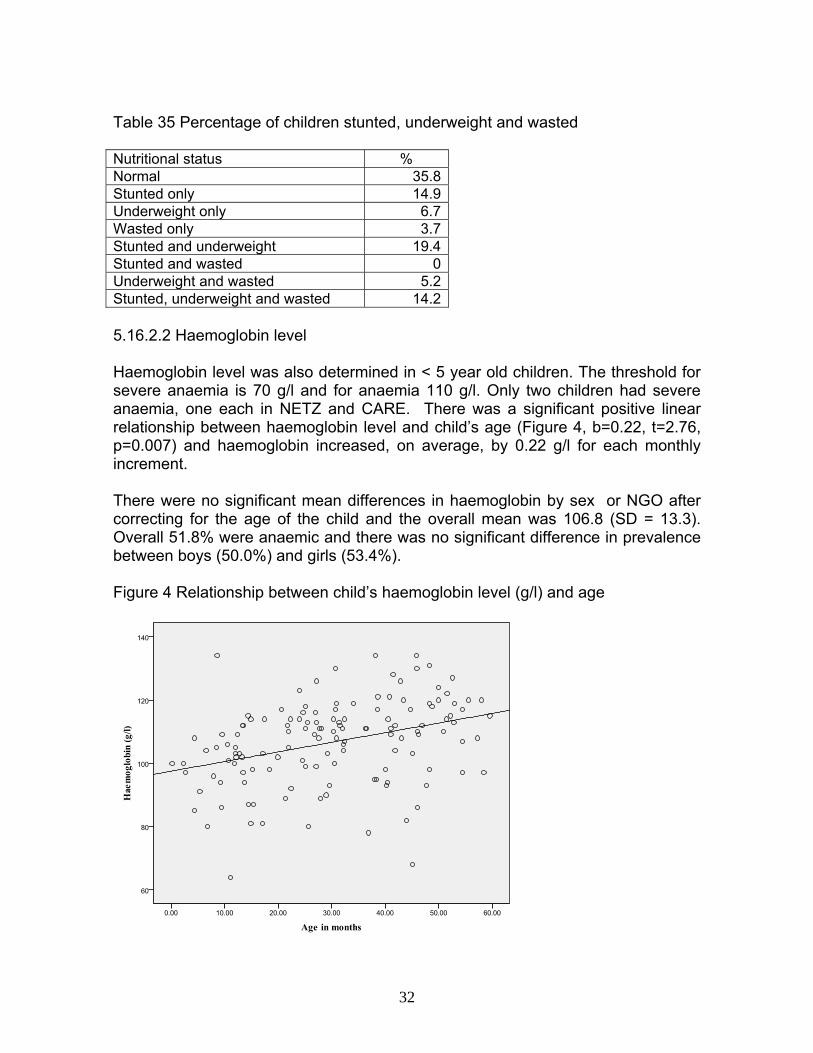
Table 35 Percentage of children stunted, underweight and wasted Nutritional status % Normal 35.8Stunted only 14.9Underweight only 6.7Wasted only 3.7Stunted and underweight 19.4Stunted and wasted 0Underweight and wasted 5.2Stunted, underweight and wasted 14.2 5.16.2.2 Haemoglobin level Haemoglobin level was also determined in < 5 year old children. The threshold for severe anaemia is 70 g/l and for anaemia 110 g/l. Only two children had severe anaemia, one each in NETZ and CARE. There was a significant positive linear relationship between haemoglobin level and child’s age (Figure 4, b=0.22, t=2.76, p=0.007) and haemoglobin increased, on average, by 0.22 g/l for each monthly increment. There were no significant mean differences in haemoglobin by sex or NGO after correcting for the age of the child and the overall mean was 106.8 (SD = 13.3). Overall 51.8% were anaemic and there was no significant difference in prevalence between boys (50.0%) and girls (53.4%). Figure 4 Relationship between child’s haemoglobin level (g/l) and age
33
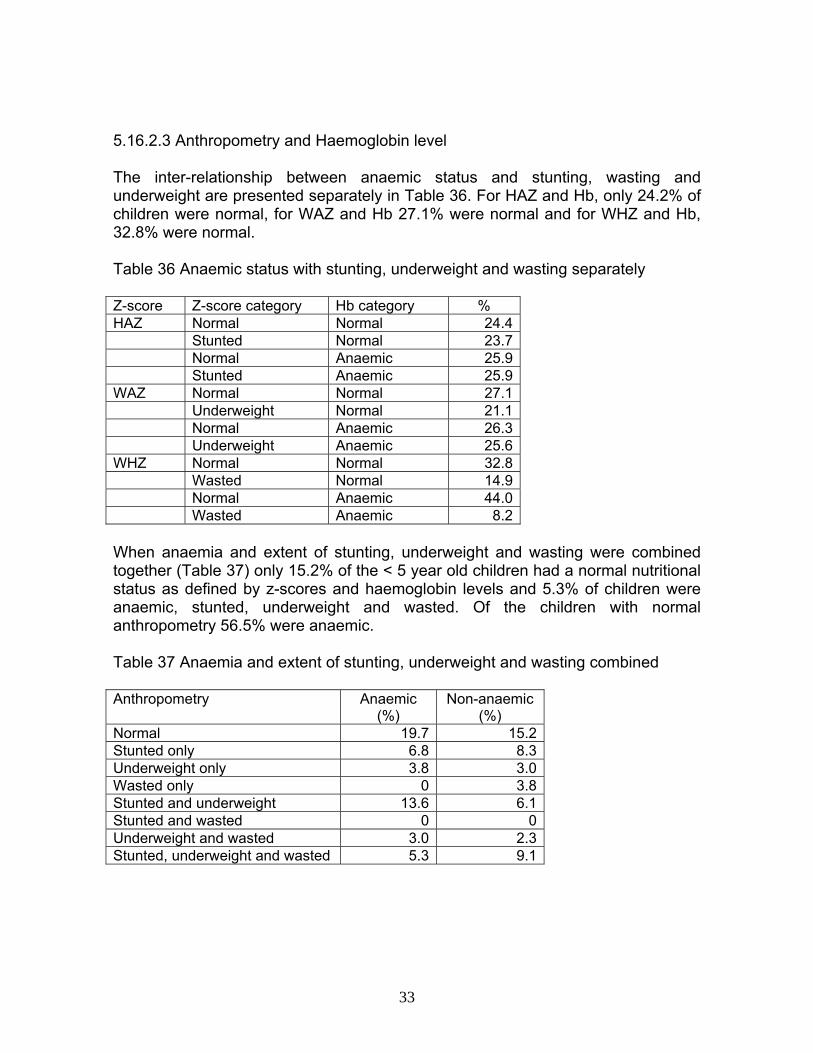
5.16.2.3 Anthropometry and Haemoglobin level The inter-relationship between anaemic status and stunting, wasting and underweight are presented separately in Table 36. For HAZ and Hb, only 24.2% of children were normal, for WAZ and Hb 27.1% were normal and for WHZ and Hb, 32.8% were normal. Table 36 Anaemic status with stunting, underweight and wasting separately Z-score Z-score category Hb category % HAZ Normal Normal 24.4 Stunted Normal 23.7 Normal Anaemic 25.9 Stunted Anaemic 25.9WAZ Normal Normal 27.1 Underweight Normal 21.1 Normal Anaemic 26.3 Underweight Anaemic 25.6WHZ Normal Normal 32.8 Wasted Normal 14.9 Normal Anaemic 44.0 Wasted Anaemic 8.2 When anaemia and extent of stunting, underweight and wasting were combined together (Table 37) only 15.2% of the < 5 year old children had a normal nutritional status as defined by z-scores and haemoglobin levels and 5.3% of children were anaemic, stunted, underweight and wasted. Of the children with normal anthropometry 56.5% were anaemic. Table 37 Anaemia and extent of stunting, underweight and wasting combined Anthropometry Anaemic
(%) Non-anaemic
(%) Normal 19.7 15.2Stunted only 6.8 8.3Underweight only 3.8 3.0Wasted only 0 3.8Stunted and underweight 13.6 6.1Stunted and wasted 0 0Underweight and wasted 3.0 2.3Stunted, underweight and wasted 5.3 9.1

34
5.16.2.4 Association between child’s nutritional status and income and expenditure No significant associations were found between any of the child’s nutritional status variables (z-scores and haemoglobin level) and the socio-economic variables including income, expenditure or with head of household. 5.16.2.5 Association between head of household and child’s nutritional status There was a significant positive association between parental and child haemoglobin (Figure 5) and for every 1 g/l increase in adult haemoglobin the child’s haemoglobin increased by +0.18 g/l. Figure 5 Association between child and adult haemoglobin levels