2. Profiles of nationalities - Home - CSO · 2020-03-23 · Profiles of nationalities . UK...
21
2. Profiles of nationalities
Transcript of 2. Profiles of nationalities - Home - CSO · 2020-03-23 · Profiles of nationalities . UK...

2. Profiles of nationalities

UK Nationals
24
16%
6%
13%
7%7%
51%
Dublin City and suburbsOther cities and their suburbsTowns 10,000 population and overTowns 5,000 - 9,999Towns 1,500 - 4,999Rural area
The snapshot A total of 112,548 UK nationals were living in Ireland in April 2006 – an increase of 9 per cent on the 2002 figure of 103,476.
Where they were living in Ireland Just over half of all UK nationals in Ireland at the time of the census were living in rural areas, while only 16 per cent lived in Dublin City and suburbs. This is a very different picture to most of the other nationality groups in this report. There was a strong presence in towns all over Ireland - only 21 of the 165 Irish towns had less than 50 UK nationals living in them. On a county basis, Cork County was the favourite with 11,993 UK nationals, followed by Dublin City (8,310). Leitrim, with 1,474, had the highest percentage of its population from the UK (5%).
Top 5 Locations
Persons from UK
Dublin City and suburbs 17,301
Other cities and their suburbs 6,740
Bray, Co Wicklow 810
Drogheda, Co Louth 719
Letterkenny, Co Donegal 641
Profile 1 – UK Nationals – 112,548
Towns with highest proportion
Persons from UK
% of Town Population
Kinsale, Co. Cork 324 9
Killorglin, Co. Kerry 117 8 Carndonagh, Co. Donegal 119 6
Virginia, Co. Cavan 99 6
Skibbereen, Co. Cork 132 6
Type of housing At the time of Census 2006 nearly 60 per cent of UK nationals were living in housing that was built before 1996. Over two thirds were in owner occupied housing, almost all in houses rather than apartments. Detached houses featured strongly, not surprisingly given the high level of rural living. Of the 34,000 UK nationals who were renting accommodation, about four out of five rented houses with the remainder renting apartments.

UK Nationals
25
Age pyramid
UK nationals living in Ireland in 2006 were well distributed across all age groups, and very evenly split between males and females. In contrast with other immigrant groups there was a high percentage (15%) aged 60 years or over, and this was reflected in their economic status where nearly one in six were retired. Their households
Nationalities in their householdsTotal UK nationals in
private households UK only UK and Irish UK and other
One person 9,918 - - 9,918
Couple 9,159 14,252 945 24,356
Couple with children 10,965 36,220 1,068 48,253
Lone parents with children 4,418 7,842 246 12,506
Couple with other persons 496 1,703 148 2,347
Couple with children and other persons 513 3,161 115 3,789
Two or more family units 291 1,928 45 2,264
Non-family households 1,481 3,723 584 5,788
Total 37,241 68,829 3,151 109,221
0 2 4 6 8
0 - 4
5 - 9
10 - 14
15 - 19
20 - 24
25 - 29
30 -44
35 - 39
40 - 44
45 - 49
50 - 54
55 - 59
60 - 64
65 - 69
70 - 74
75 - 79
80 - 84
85+
Percentage
Females
8 6 4 2 0
0 - 4
5 - 9
10 - 14
15 - 19
20 - 24
25 - 29
30 - 34
35 - 39
40 - 44
45 - 49
50 - 54
55 - 59
60 - 64
65 - 69
70 - 74
75 - 79
80 - 84
85+
Percentage
Total PopulationUK
Males
5 year age groups
UK Nationals
26
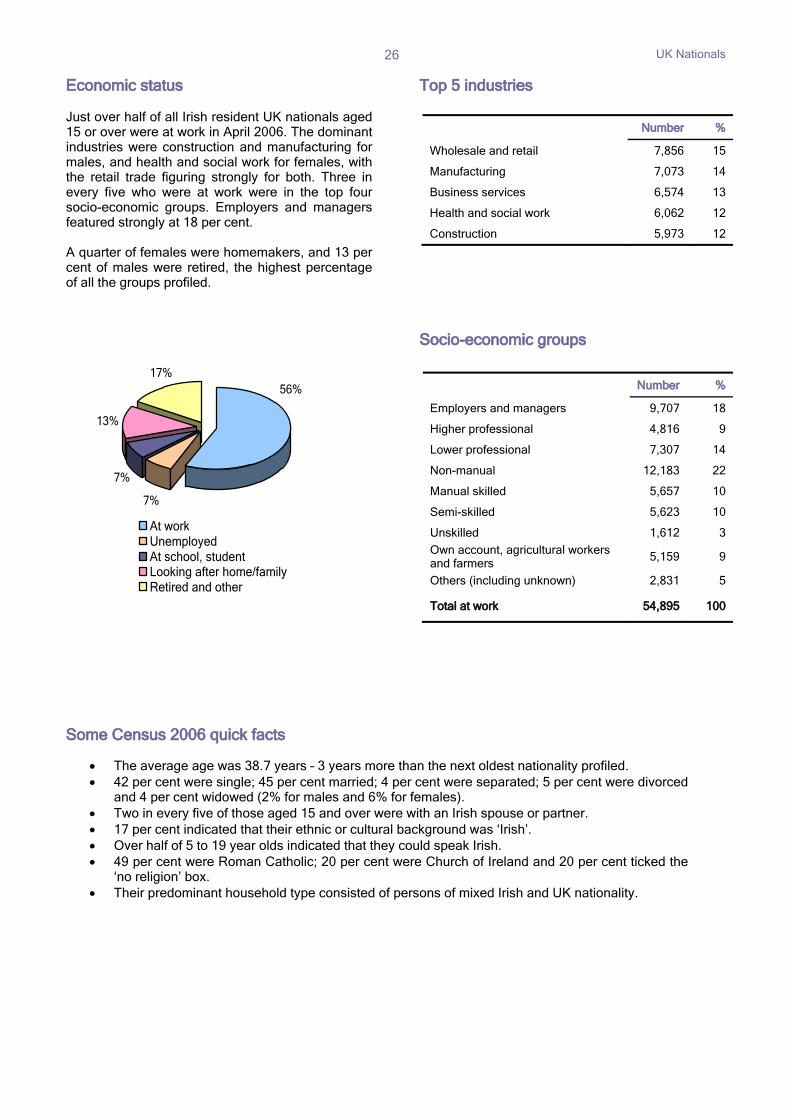
Economic status Just over half of all Irish resident UK nationals aged 15 or over were at work in April 2006. The dominant industries were construction and manufacturing for males, and health and social work for females, with the retail trade figuring strongly for both. Three in every five who were at work were in the top four socio-economic groups. Employers and managers featured strongly at 18 per cent. A quarter of females were homemakers, and 13 per cent of males were retired, the highest percentage of all the groups profiled.
Top 5 industries
Socio-economic groups
Some Census 2006 quick facts
• The average age was 38.7 years – 3 years more than the next oldest nationality profiled. • 42 per cent were single; 45 per cent married; 4 per cent were separated; 5 per cent were divorced
and 4 per cent widowed (2% for males and 6% for females). • Two in every five of those aged 15 and over were with an Irish spouse or partner. • 17 per cent indicated that their ethnic or cultural background was ‘Irish’. • Over half of 5 to 19 year olds indicated that they could speak Irish. • 49 per cent were Roman Catholic; 20 per cent were Church of Ireland and 20 per cent ticked the
‘no religion’ box. • Their predominant household type consisted of persons of mixed Irish and UK nationality.
Number %
Wholesale and retail 7,856 15
Manufacturing 7,073 14
Business services 6,574 13
Health and social work 6,062 12
Construction 5,973 12
Number %
Employers and managers 9,707 18
Higher professional 4,816 9
Lower professional 7,307 14
Non-manual 12,183 22
Manual skilled 5,657 10
Semi-skilled 5,623 10
Unskilled 1,612 3
Own account, agricultural workers and farmers 5,159 9
Others (including unknown) 2,831 5
Total at work 54,895 100
7%
13%
56%17%
7%
At workUnemployedAt school, studentLooking after home/familyRetired and other
UK Nationals
27
0 500 1000 1500 2000 2500 3000 3500 4000 4500 5000
Agriculture/Veterinary
Computing
Education
Engineering
Health
Humanities/Arts
Sciences
Multi-subject
Services
Social Science/Business/Law
Social Services
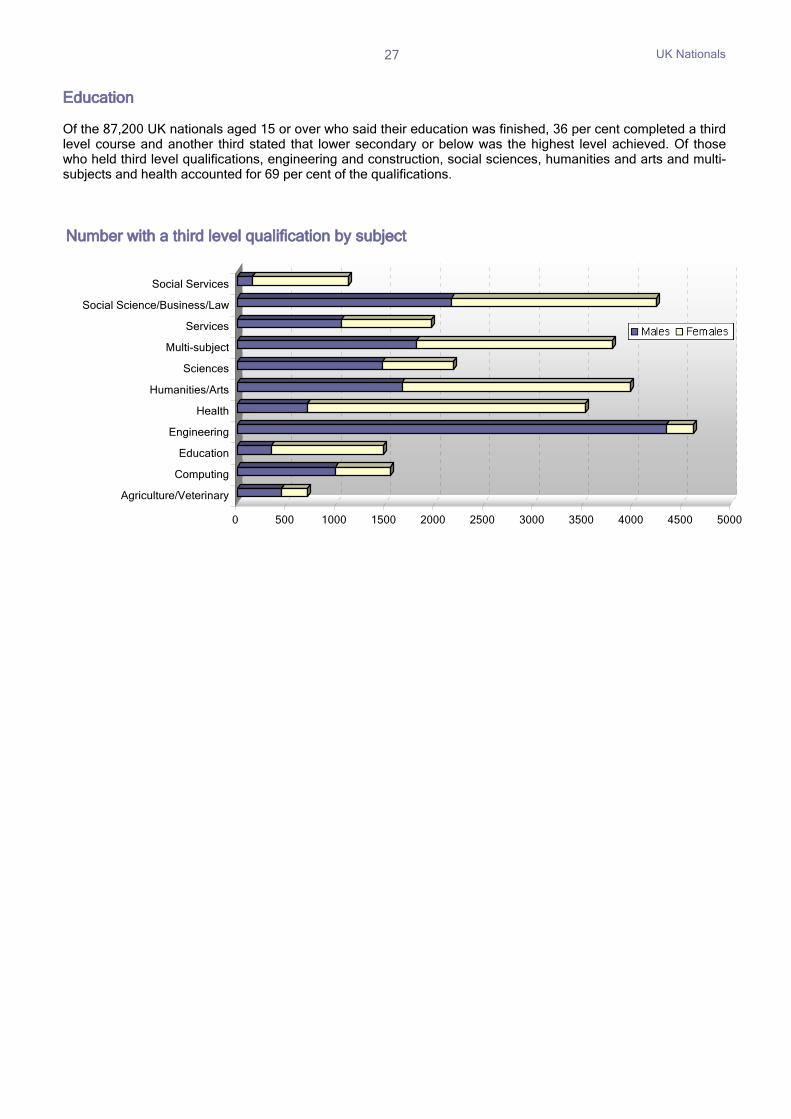
Number with a third level qualification by subject
Education Of the 87,200 UK nationals aged 15 or over who said their education was finished, 36 per cent completed a third level course and another third stated that lower secondary or below was the highest level achieved. Of those who held third level qualifications, engineering and construction, social sciences, humanities and arts and multi-subjects and health accounted for 69 per cent of the qualifications.

Polish Nationals
28
The snapshot A total of 63,276 Poles were living in Ireland in April 2006 – almost 90 per cent arrived in 2004 or later. There was an additional 10,126 Polish visitors in Ireland on census night who were not living here at the time. Where they were living in Ireland Polish people were living in every town and city in Ireland at the time of the census – the only nationality apart from the UK present in every town. In the case of some towns they made up a significant proportion of the population (see table across). While Dublin was popular, the chart below shows the fairly even distribution among cities, large and small towns, and rural areas while the map illustrates the widespread distribution across the entire country.
Top 5 locations
Profile 2 – Poles – 63,276
Towns with highest proportion
Number of Poles
% of Town Population
Bunclody, Co Wexford 171 10
Ballyjamesduff, Co Cavan 142 9
Ballinrobe, Co Mayo 177 9
Tullow, Co Carlow 246 8
New Ross, Co Wexford 608 8
Type of housing Nearly 93 per cent of Poles were living in rented accommodation, the highest percentage for any group. Of the 4,180 Polish people who were living in privately owned homes, houses were favourites over apartments by four to one. Census 2006 also found that 55 per cent of Poles were living in housing built in 1996 or later.
Number of Poles
Dublin City and suburbs 17,823
Other cities and their suburbs 9,931
Naas, Co Kildare 1,356
Killarney, Co Kerry 941
Swords, Co Dublin 773
29%
16%23%
11%
9%
12%
Dublin City and suburbsOther cities and their suburbsTowns 10,000 population and overTowns 5,000 - 9,999 Towns 1,500 - 4,999Rural area
Polish Nationals
29
Age graph
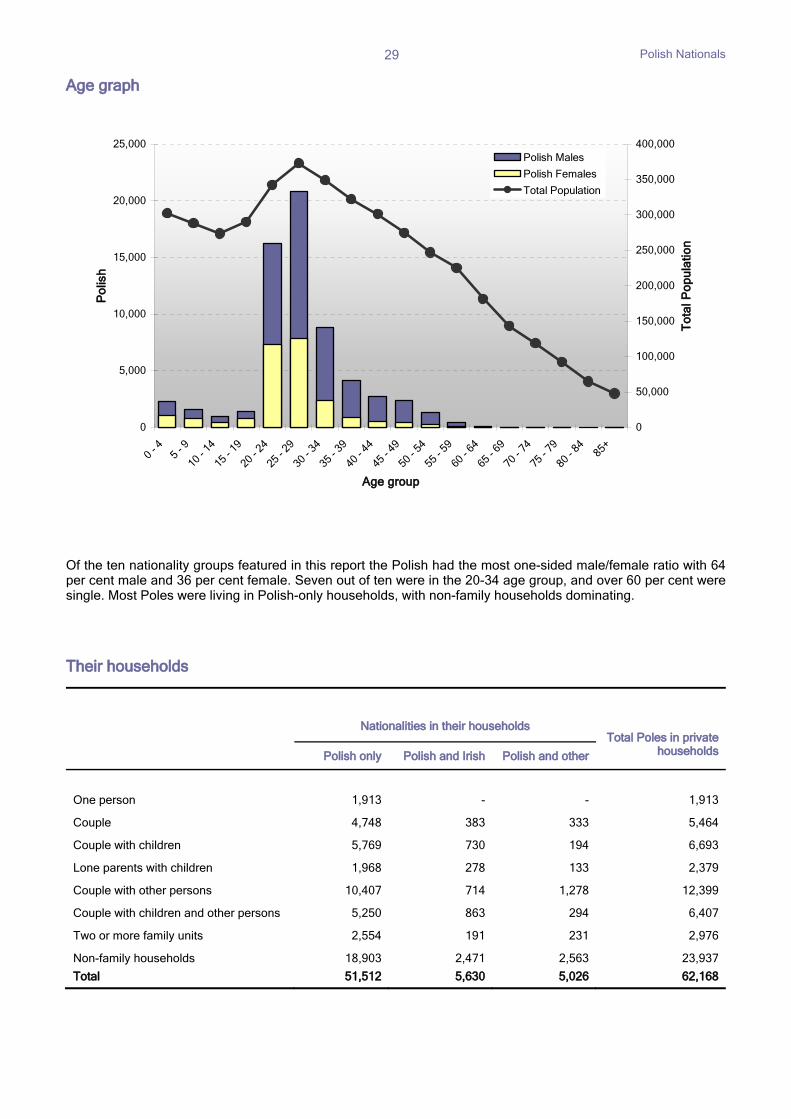
Of the ten nationality groups featured in this report the Polish had the most one-sided male/female ratio with 64 per cent male and 36 per cent female. Seven out of ten were in the 20-34 age group, and over 60 per cent were single. Most Poles were living in Polish-only households, with non-family households dominating. Their households
Nationalities in their householdsTotal Poles in private
households Polish only Polish and Irish Polish and other
One person 1,913 - - 1,913
Couple 4,748 383 333 5,464
Couple with children 5,769 730 194 6,693
Lone parents with children 1,968 278 133 2,379
Couple with other persons 10,407 714 1,278 12,399
Couple with children and other persons 5,250 863 294 6,407
Two or more family units 2,554 191 231 2,976
Non-family households 18,903 2,471 2,563 23,937
Total 51,512 5,630 5,026 62,168
0
5,000
10,000
15,000
20,000
25,000
0 -
4
5 -
9
10 -
14
15 -
19
20 -
24
25 -
29
30 -
34
35 -
39
40 -
44
45 -
49
50 -
54
55 -
59
60 -
64
65 -
69
70 -
74
75 -
79
80 -
84 8
5+
Age group
Po
lish
0
50,000
100,000
150,000
200,000
250,000
300,000
350,000
400,000
To
tal P
op
ula
tion
Polish Males
Polish Females
Total Population

Polish Nationals
30
Economic status The majority (84%) of Poles aged 15 years and over were at work, mainly as employees (only 380 males and 123 females were working as self-employed). Over half of males were in construction and manufacturing and half of all females were in shops, hotels and restaurants. Employment was mainly in the lower socio-economic groups with only 9 per cent classified to the top three groups. The predominant occupations were sales assistants (7%), building labourers (6%), cleaners and domestics (5%) and carpenters and joiners (4%). The number retired was just 125.
Top 5 industries
Socio-economic groups
Some Census 2006 quick facts
• The average age was 27.5 years (29 years for males and 25 for females). • 62 per cent were single; 34 per cent married and 4 per cent divorced or separated. • A very significant 59 per cent of married males and 18 per cent of married females were not living
with their spouse at the time of the census. • About 1 per cent of Poles were with an Irish partner (0.5% for males and 2.5% for females). • 95 per cent indicated an ethnicity of ‘Any other white background’. • Only 10 per cent of the 4,000 Poles aged 5 to 19 years indicated they could speak Irish. • 93 per cent were Roman Catholic and 5 per cent ticked the ‘no religion’ box.
Persons %
Construction 10,122 22
Manufacturing 10,095 22
Wholesale and retail 7,661 17
Hotels and restaurants 7,314 16
Business services 4,332 9
Persons %
Employers and managers 1,597 3
Higher professional 1,290 3
Lower professional 1,331 3
Non-manual 11,670 23
Manual skilled 12,885 26
Semi-skilled 10,773 22
Unskilled 6,128 12
Own account, agricultural workers and farmers 1,167 2
Others (including unknown) 2,923 6
Total at work 49,764 100
9%2% 4%1%
84%
At work
Unemployed
At school, student
Looking after home/family
Retired and other

Polish Nationals
31
Education
While only 2 per cent of Poles aged 15 and over were in school or college in Ireland, 15 per cent of those who were at work or unemployed here indicated that they had not finished their full time education. More than a quarter of the 49,014 aged 15 or over whose education was finished had completed third level courses at degree or higher level. A further 1,671 completed non-degree courses and 26,625 completed upper secondary level education. A quarter of third level qualifications among Polish males were in engineering, manufacturing or construction. The third level qualifications of a third of Polish females were in social science, business or law. 13 per cent of Poles whose education was finished said it finished when they were aged 25 years or older.
Number with a third level qualification by subject
0 500 1000 1500 2000 2500 3000 3500 4000 4500
Agriculture/Veterinary
Computing
Education
Engineering
Health
Humanities/Arts
Sciences
Multi-subject
Services
Social Science/Business/Law
Social Services
Lithuanian Nationals
32
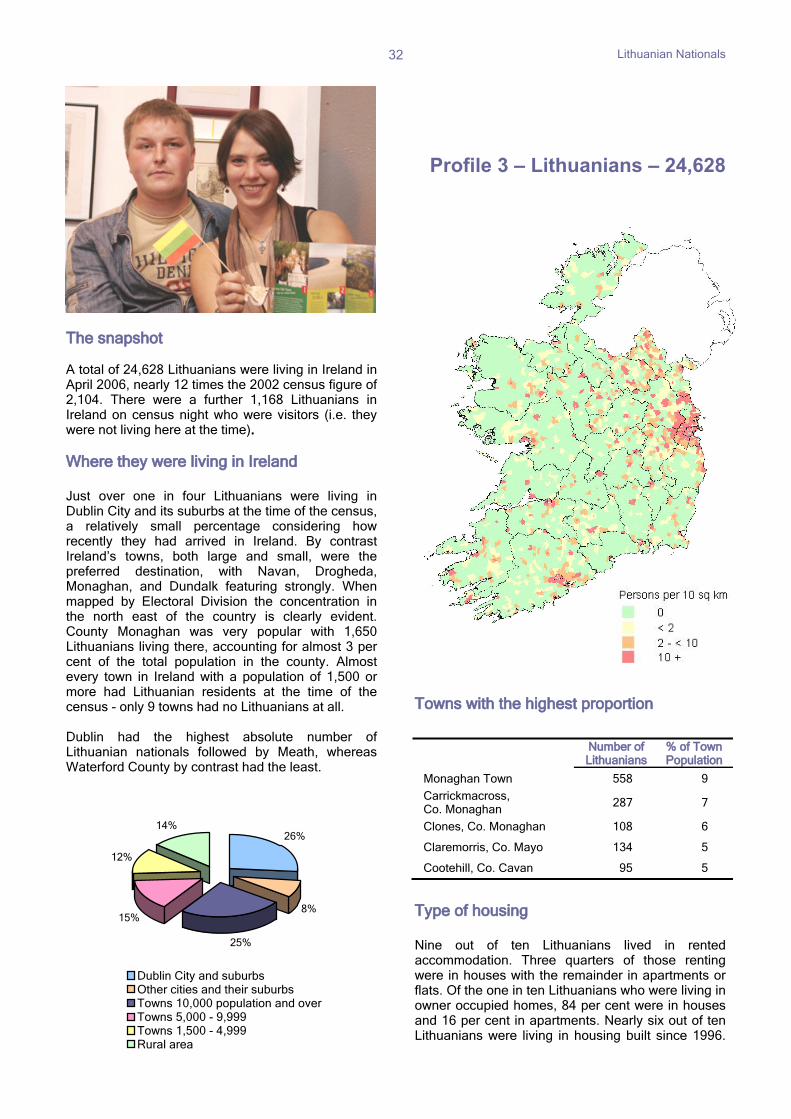
The snapshot A total of 24,628 Lithuanians were living in Ireland in April 2006, nearly 12 times the 2002 census figure of 2,104. There were a further 1,168 Lithuanians in Ireland on census night who were visitors (i.e. they were not living here at the time). Where they were living in Ireland Just over one in four Lithuanians were living in Dublin City and its suburbs at the time of the census, a relatively small percentage considering how recently they had arrived in Ireland. By contrast Ireland’s towns, both large and small, were the preferred destination, with Navan, Drogheda, Monaghan, and Dundalk featuring strongly. When mapped by Electoral Division the concentration in the north east of the country is clearly evident. County Monaghan was very popular with 1,650 Lithuanians living there, accounting for almost 3 per cent of the total population in the county. Almost every town in Ireland with a population of 1,500 or more had Lithuanian residents at the time of the census - only 9 towns had no Lithuanians at all. Dublin had the highest absolute number of Lithuanian nationals followed by Meath, whereas Waterford County by contrast had the least.
Profile 3 – Lithuanians – 24,628
Towns with the highest proportion
Type of housing Nine out of ten Lithuanians lived in rented accommodation. Three quarters of those renting were in houses with the remainder in apartments or flats. Of the one in ten Lithuanians who were living in owner occupied homes, 84 per cent were in houses and 16 per cent in apartments. Nearly six out of ten Lithuanians were living in housing built since 1996.
Number of Lithuanians
% of Town Population
Monaghan Town 558 9
Carrickmacross, Co. Monaghan 287 7
Clones, Co. Monaghan 108 6
Claremorris, Co. Mayo 134 5
Cootehill, Co. Cavan 95 5
26%
8%
25%
15%
12%
14%
Dublin City and suburbsOther cities and their suburbsTowns 10,000 population and overTowns 5,000 - 9,999 Towns 1,500 - 4,999 Rural area

Lithuanian Nationals
33
Age pyramid Like most recent immigrants to Ireland the majority of Lithuanians living here in 2006 were young and single. Of those who were married, four out of ten males and one in five females were not living with their spouse at the time of the census. The majority were living in Lithuanian-only households; where they were living in mixed nationality households it was primarily with people from other countries rather than with Irish people. Their households
Nationalities in their householdsTotal Lithuanians in private households
Lithuanian only
Lithuanian and Irish
Lithuanian and other
One person 673 - - 673
Couple 1,493 123 227 1,843
Couple with children 2,744 771 231 3,746
Lone parents with children 1,280 275 193 1,748
Couple with other persons 3,150 239 835 4,224
Couple with children and other persons 3,024 677 452 4,153
Two or more family units 1,223 181 249 1,653
Non-family households 4,283 525 1,503 6,311
Total 17,870 2,791 3,690 24,351
0 5 10 15
0 - 4
10 - 14
20 - 24
30 - 34
40 - 44
50 - 54
60 - 64
70 - 74
80 - 84
Percentage
Fem ales
15 10 5 0
0 - 4
5 - 9
10 - 14
15 - 19
20 - 24
25 - 29
30 - 34
35 - 39
40 - 44
45 - 49
50 - 54
55 - 59
60 - 64
65 - 69
70 - 74
75 - 79
80 - 84
85+
Percentage
Total Population
Lithuanians
M ales
5 year age groups

Lithuanian Nationals
34
Economic status Of the 21,850 Lithuanians aged 15 years or over almost 18,000 (82%) were at work. The numbers of unemployed, students and those looking after the home or family were relatively low at 8 per cent, 3 per cent and 5 per cent, respectively. Over half of males were working in the construction and manufacturing industries, while shop work, hotels and restaurants dominated for females. Very few were self-employed (501 persons). At an occupational level building labourers (8%), sales assistants (7%), cleaners and domestics (7%) and food and drink operatives (5%) were the most common jobs. Although 23 per cent indicated they had a third level qualification only 2 per cent were working as professionals, and only 4 per cent were employed in the highest socio-economic group of ‘employers and managers’.
Top 5 industries
Socio-economic groups
Some Census 2006 quick facts
• The male/female ratio was 56:44 among the 24,628 Lithuanians living in Ireland in 2006. • Their average age was 27.7 years and 46 per cent were in their twenties. • 55 per cent were single and 36 per cent were married. The divorce rate was 7 per cent (males
5%, females 9%). • About 1 per cent of Lithuanians had an Irish partner. • 85 per cent were Roman Catholic. • 17 per cent of 5 to 19 year olds could speak Irish.
Persons %
Construction 3,592 23
Manufacturing 3,346 21
Wholesale and retail 2,918 18
Hotels and restaurants 2,133 14
Business services 1,230 8
Persons %
Employers and managers 683 4
Higher professional 98 1
Lower professional 206 1
Non-manual 3,545 20
Manual skilled 4,069 23
Semi-skilled 3,748 21
Unskilled 2,973 17
Own account, agricultural workers and farmers
894 5
Others (incl. unknown) 1,732 10
Total at work 17,948 100
5%
83%
8%
1%3%
At workUnemployedAt school, studentLooking after home/familyRetired and other

Lithuanian Nationals
35
Number with a third level qualification by subject
Education While only 3 per cent of Lithuanians aged 15 or over were at school or college, a remarkable 38 per cent of those who were at work or unemployed indicated that their full time education was not finished. Of those aged 15 or more who stated that their education had ceased, 80 per cent had completed upper secondary or above, while 17 per cent had completed a degree or higher. 4,833 Lithuanians had a third level qualification. Social science and engineering accounted for 37 per cent of all degrees.
0 100 200 300 400 500 600 700 800 900
Agriculture/Veterinary
Computing
Education
Engineering
Health
Humanities/Arts
Sciences
Multi-subject
Services
Social Science/Business/Law
Social Services

Nigerian Nationals
36
The snapshot A total of 16,300 Nigerians were living in Ireland in April 2006 – an increase of 82 per cent on the 2002 figure of 8,969.
Where they were living in Ireland Of all the groups profiled in this report, the Nigerians were by far the most urbanised, with only 4 per cent living in rural areas at the time of the census. Small towns were also unpopular and nearly a third of all towns had no Nigerians at all. By contrast, almost a third were living in Ireland’s large towns (population of 10,000 or more), with Dundalk, Drogheda, Swords and Balbriggan having the largest populations. Four in ten lived in Dublin City and suburbs.
The picture in Dublin Over half of the Nigerians in Dublin, were living in Fingal, a further third were in South Dublin, a relatively small 18 per cent were in Dublin City while Dún Laoghaire-Rathdown accounted for only 1 per cent. The map on the right clearly shows the dominance of Dublin and the north east for the Nigerian population, while the chart above illustrates the urbanisation.
Profile 4 - Nigerians – 16,300 Top 5 locations nationwide
Type of housing Four out of five Nigerians were living in private rented accommodation in April 2006 with a 70:30 split between houses and apartments. Of the 2,500 Nigerians who lived in owner occupied accommodation, only 240 were in apartments. Three quarters of Nigerians lived in housing built in 1996 or later.
Number of Nigerians
Dublin City and suburbs 6,372
Other cities and their suburbs 2,032
Dundalk, Co Louth 664
Drogheda, Co Louth 566
Swords, Co Dublin 494
40%
13%
32%
8%3% 4%
Dublin City and suburbsOther cities and their suburbsTowns 10,000 population and overTowns 5,000 - 9,999 Towns 1,500 - 4,999 Rural area

Nigerian Nationals
37
Age pyramid
The age profile for the Nigerian population is quite different from the other nationality groups featured in this report. One in four are aged less than 15 while only 15 per cent are in their twenties There are more females than males and over half of Nigerians are married. Four out of five Nigerians lived in private households with Irish people. These were predominately in family-type households in which the children in these families were of Irish nationality. Their households
Nationalities in their households
Total Nigerians in private households
Nigerian only
Nigerian and Irish
Nigerian and other
One person 388 - - 388
Couple 191 55 112 358
Couple with children 872 7,997 198 9,067
Lone parents with children 666 3,109 72 3,847
Couple with other persons 30 46 45 121
Couple with children and other persons 108 843 37 988
Two or more family units 3 142 7 152
Non-family households 185 140 115 440
Total 2,443 12,332 586 15,361
0 5 10 15
0 - 4
10 - 14
20 - 24
30 - 24
40 - 44
50 - 54
60 - 64
70 - 74
80 - 84
Percentage
Fem ales
15 10 5 0
0 - 4
5 - 9
10 - 14
15 - 19
20 - 24
25 - 29
30 - 34
35 - 39
40 - 44
45 - 49
50 - 54
55 - 59
60 - 64
65 - 69
70 - 74
75 - 79
80 - 84
85+
Percentage
Total Population
Nigerian
Males
5 year age groups

Nigerian Nationals
38
Economic status The percentage of Nigerians aged 15 or over at work in 2006 was the lowest of all groups featured at 38 per cent, though this splits unevenly between males (50%) and females (30%). In comparison with the other nationalities profiled, a relatively high number were unemployed or looking for their first job (31%). About one in five females was looking after the home and 17 per cent were students. The dominant industry was health and social work; one in five was working as a professional. Among the top occupations were care assistants and attendants (11%), security guards (7%), sales assistants (7%) and doctors (6%).
Top 5 industries
Socio-economic groups
Some Census 2006 quick facts
• The male/female breakdown of the 16,300 Nigerians in April 2006 was 55:45. • The average age was 26.6 years. • 13 per cent of Nigerians were in the 5 to 9 year old age group. • 42 per cent were single and 52 per cent were married. • The number of married Nigerians not living with their spouse was relatively low at 8 per cent. • Roman Catholic was the main religion (26%), followed by Apostolic or Pentecostal (19%); less
than 1 per cent of Nigerians ticked the ‘no religion’ box. • Nearly half (45%) of Nigerian children aged 5 to 19 indicated they could speak Irish.
Persons %
Health and social work 1,147 29
Business services 732 18
Wholesale and retail 627 16
Manufacturing 484 12
Transport, storage, and communications
307 8
Persons %
Employers and managers 246 5
Higher professional 468 10
Lower professional 477 10
Non-manual 971 21
Manual skilled 211 5
Semi-skilled 1,309 28
Unskilled 152 3
Own account, agricultural workers and farmers
187 4
Others (including unknown) 661 14
Total at work 4,682 100
38%
31%
16%
11%4%
At workUnemployed
At school, studentLooking after home/familyRetired and other

Nigerian Nationals
39
Number with a third level qualification by subject
Education 1,890 (16%) of those aged 15 years or over were in full time education. Of the 6,578 who stated their full time education was completed, 41 per cent had completed a degree or higher level qualification, 17 per cent a non-degree third level qualification and 26 per cent completed upper secondary level. 5,432 Nigerians had a third level qualification - 31 per cent had the qualification in social sciences, business and law and 14 per cent had qualifications in health.
0 200 400 600 800 1000 1200 1400 1600 1800
Agriculture/Veterinary
Computing
Education
Engineering
Health
Humanities/Arts
Sciences
Multi-subject
Services
Social Science/Business/Law
Social Services
Latvian Nationals
40
The snapshot A total of 13,319 Latvian nationals were living in Ireland in April 2006. This was a considerable increase on the 2002 figure of 1,797.
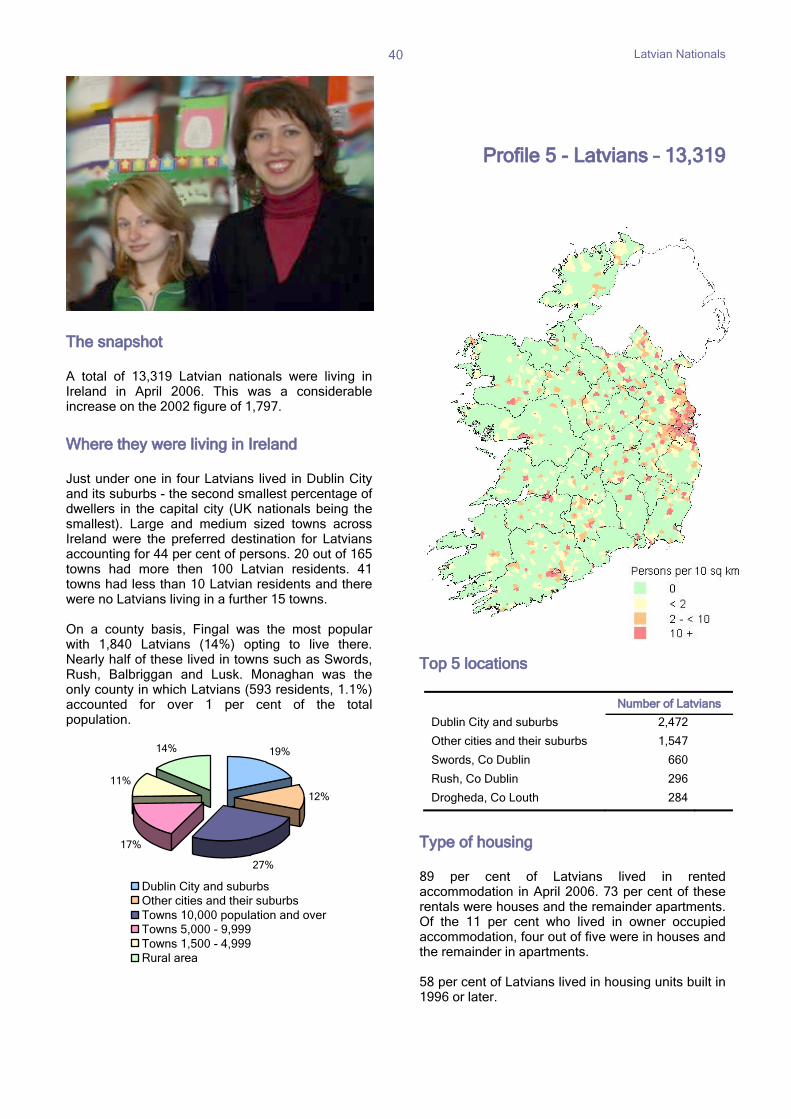
Where they were living in Ireland Just under one in four Latvians lived in Dublin City and its suburbs - the second smallest percentage of dwellers in the capital city (UK nationals being the smallest). Large and medium sized towns across Ireland were the preferred destination for Latvians accounting for 44 per cent of persons. 20 out of 165 towns had more then 100 Latvian residents. 41 towns had less than 10 Latvian residents and there were no Latvians living in a further 15 towns. On a county basis, Fingal was the most popular with 1,840 Latvians (14%) opting to live there. Nearly half of these lived in towns such as Swords, Rush, Balbriggan and Lusk. Monaghan was the only county in which Latvians (593 residents, 1.1%) accounted for over 1 per cent of the total population.
Profile 5 - Latvians – 13,319 Top 5 locations
Type of housing 89 per cent of Latvians lived in rented accommodation in April 2006. 73 per cent of these rentals were houses and the remainder apartments. Of the 11 per cent who lived in owner occupied accommodation, four out of five were in houses and the remainder in apartments. 58 per cent of Latvians lived in housing units built in 1996 or later.
Number of Latvians
Dublin City and suburbs 2,472 Other cities and their suburbs 1,547 Swords, Co Dublin 660 Rush, Co Dublin 296 Drogheda, Co Louth 284
19%
12%
27%
17%
11%
14%
Dublin City and suburbsOther cities and their suburbsTowns 10,000 population and overTowns 5,000 - 9,999Towns 1,500 - 4,999Rural area

Latvian Nationals
41
Age graph
Like their other eastern European counterparts the Latvians in Ireland in 2006 were predominantly young and single. Almost seven out of ten of them were in their twenties or thirties while only 4 per cent were aged 50 years or over. 10 per cent indicated they were separated or divorced - the highest rate of all groups profiled. Their households
Nationalities in their households
Total Latvians in private
households Latvian only Latvian and Irish Latvian and other
One person 502 - - 502
Couple 629 85 197 911
Couple with children 922 329 178 1,429
Lone parents with children 784 166 242 1,192
Couple with other persons 1,333 120 768 2,221
Couple with children and other persons 1,006 416 434 1,856
Two or more family units 363 98 213 674
Non-family households 2,465 344 1,497 4,306
Total 8,004 1,558 3,529 13,091
0
500
1,000
1,500
2,000
2,500
3,000
3,500
0 -
4
5 -
9
10 - 14
15 - 19
20 - 24
25 - 29
30 - 34
35 - 39
40 - 44
45 - 49
50 - 54
55 - 59
60 - 64
65 - 69
70 - 74
75 - 79
80 - 84
85+
Ag e g ro u p
La
tvia
n
0
50,000
100,000
150,000
200,000
250,000
300,000
350,000
400,000
To
tal
Po
pu
lati
on
Latvian Males
Latvian Females
Total Population

Latvian Nationals
42
Economic status Of the 12,081 Latvians aged 15 years or over who lived in Ireland in April 2006 more than 10,000 were at work. Among males, the labour force participation rate was 97 per cent. Agriculture featured strongly as a source of employment accounting for 9 per cent of employment (compared with 2.5 per cent for Poles and 5 per cent for Lithuanians). Manufacturing (24%) and construction (33%) were the dominant industries for males, while shop work (23%) and hotels and restaurants (24%) were important for females. The main occupations were cleaners and domestics (7%), sales assistants (7%) and building labourers (6%). Very few Latvians were working in the higher socio-economic groups. Over 1,000 Latvians were unemployed.
Top 5 industries
Socio-economic groups
Some Census 2006 quick facts
• The average age of Latvians living in Ireland was 28.4 years. • 58 per cent were single, 30 per cent married while the divorce rate for males was 8 per cent
compared with 14 per cent for females. • 48 per cent of married males and 28 per cent of married females were not living with their spouse. • 3 per cent of females and 0.5 per cent of males aged 15 or over were with an Irish partner. • One in four ticked the ‘No religion’ box, 38 per cent were Roman Catholic, while Orthodox (14%)
and Lutheran (11%) were also important. • Non-family households were the most popular.
Persons %
Manufacturing 1,877 21
Construction 1,804 20
Wholesale and retail 1,621 18
Hotels and restaurants 1,181 13
Agriculture, forestry or fisheries 891 10
Persons %
Employers and managers 321 3
Higher professional 39 0
Lower professional 123 1
Non-manual 2,003 20
Manual skilled 2,271 23
Semi-skilled 2,125 21
Unskilled 1,591 16
Own account, agricultural workers and farmers
783 8
Others (including unknown) 806 8
Total at work 10,062 100
82%
3% 5% 1%9%
At workUnemployedAt school, studentLooking after home/familyRetired and other

Latvian Nationals
43
Number with a third level qualification by subject
Education Of the 8,333 Latvians whose full time education had finished, 12 per cent had achieved a primary degree or higher level, and a further 70 per cent upper secondary or non-degree at third level. Engineering (30%) and services (19%) were the main degrees among males while social science, business and law (25%) was the top degree among females. While only 3 per cent of Latvians aged 15 or over were at school or college in Ireland, 29 per cent who were at work or unemployed indicated that they were not finished their full time education.
0 50 100 150 200 250 300 350 400 450
Agriculture/Veterinary
Computing
Education
Engineering
Health
Humanities/Arts
Sciences
Multi-subject
Services
Social Science/Business/Law
Social Services