2-Phase Refrigeration Thermal Management for High Altitude ... · 2-Phase Refrigeration Thermal...
27
TF AWS MSFC ∙ 2017 Presented By Evan Racine & Ryan Edwards 2-Phase Refrigeration Thermal Management for High Altitude Balloon Platforms Evan Racine & Ryan Edwards Thermal & Fluids Analysis Workshop TFAWS 2017 August 21-25, 2017 NASA Marshall Space Flight Center Huntsville, AL TFAWS Active Thermal Paper Session
Transcript of 2-Phase Refrigeration Thermal Management for High Altitude ... · 2-Phase Refrigeration Thermal...

TFAWSMSFC ∙ 2017
Presented By
Evan Racine & Ryan Edwards
2-Phase Refrigeration Thermal Management for
High Altitude Balloon Platforms
Evan Racine & Ryan Edwards
Thermal & Fluids Analysis Workshop
TFAWS 2017
August 21-25, 2017
NASA Marshall Space Flight Center
Huntsville, AL
TFAWS Active Thermal Paper Session
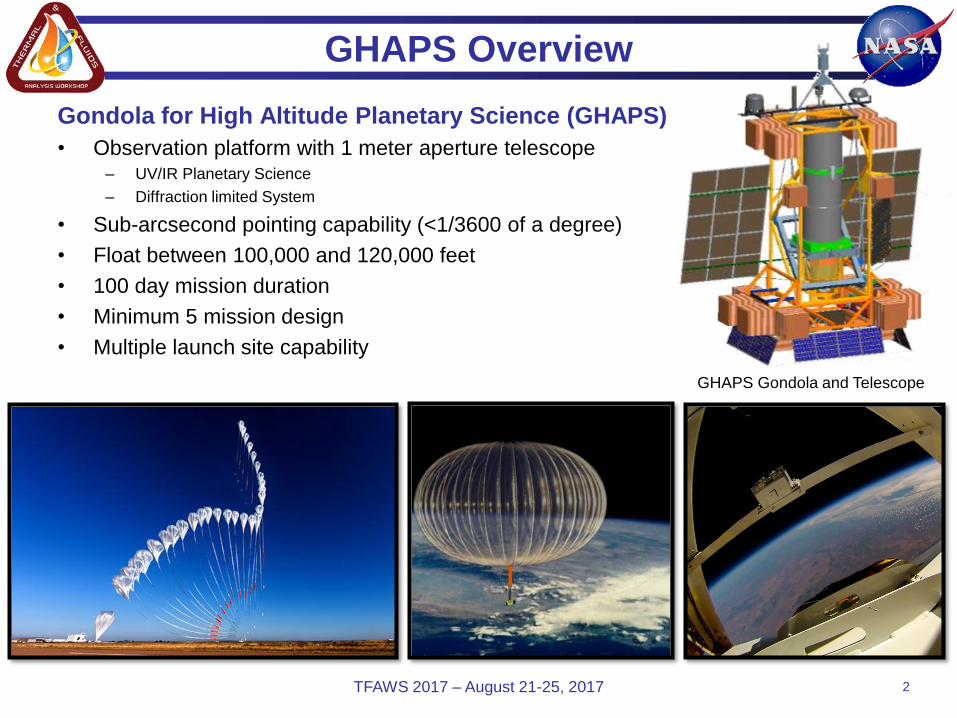
GHAPS Gondola and Telescope
GHAPS Overview
Gondola for High Altitude Planetary Science (GHAPS)
• Observation platform with 1 meter aperture telescope– UV/IR Planetary Science
– Diffraction limited System
• Sub-arcsecond pointing capability (<1/3600 of a degree)
• Float between 100,000 and 120,000 feet
• 100 day mission duration
• Minimum 5 mission design
• Multiple launch site capability
TFAWS 2017 – August 21-25, 2017 2
GHAPS Thermal Subsystem Requirements
• Remove 400W of heat from science instrument package
– Requirement generated from historical data from BRRISON &
BOPPS balloon flights, which used similar Science Instruments
• Do not adversely impact pointing capability
– Any fluid lines crossing the gimbal hubs cannot introduce
significant pointing disturbances
– Any vibrations produced shall not impact science observation
quality
TFAWS 2017 – August 21-25, 2017 3

Thermal Environments
Additional Thermal Environment Characteristics
• Ascent temperatures can reach -70ºC
• Antarctica– Up to 0.95 Albedo (Two Suns)
• New Zealand– Variable albedo based on land mass and storm/cloud formation
TFAWS 2017 – August 21-25, 2017 4
Launch Site Flight Duration Solar CycleGround
Temperature
Float
Temperature
Ft. Sumner, NM <24 Hours Day/Night 20°C -35°C
McMurdo Station, AQ <60 Days 24 Hour Sun -5°C -25°C
Wanaka, NZ <100 Days BOM: 9.5 Hours of Eclipse
EOM: 16.5 Hours of Eclipse20°C -35°C
Kiruna, SWE <7 Days Day/Night 0°C -35°C

Design Challenges
• Environmental Variations
– Diurnal Cycling
– Earth IR
– Albedo
• Mass Constraints
– Balloon Platforms have limited flight mass to maintain altitude
– All subsystems pushed to the limit on mass constraints
• Power Constraints
– Due to mass constraints, battery mass and thus, power is limited
for night time operations
• Gondola Pointing
– Telescope pointing exclusion area 80º cone around sun
• 280º of gondola rotation
• Radiator must operate facing the sun and in the shade
TFAWS 2017 – August 21-25, 2017 5

Historical Solutions
BRRISON/BOPPS Balloon Missions
• UV/IR Balloon Based Telescope Platform
• Single day missions with singular fixed targets (comets)
• Instruments similar to those expected to be used on GHAPS
• Thermal Management System
– Single phase liquid loop and single 2m2 radiator (Fluid: Galden HT)
– 2 LN2 dewars for IR instrument cooling
TFAWS 2017 – August 21-25, 2017 6
BRRISON Radiator and Heaters BRRISON Pre-Launch

Design Evolution
TFAWS 2017 – August 21-25, 2017 7
Option:Thermal Load (W)
Radiator Size (m2)
System Mass (kg)
Total Radiator Mass (kg)
Average Power Consumption (W) Battery Capacity for
17 hr Night (kW-Hr)Battery Mass for 17
hr Night (kg)
Total Comparable
Mass (kg)Rank
DIURNAL DAY NIGHT
Single Radiator, Pump Loop A 525 20 33 270 2276 1027 3525 59925 547 850 4
Dual Radiator, Pump Loop B 525 3.5 32 95 218 151 285 4845 44 171 3
Single Radiator, w/ Refrigeration
C 525 4.1 38 55 317 266 367 6246 57 151 2
Dual Radiator, w/ Refrigeration
D 525 1.8 61 47 333 493 174 2962 27 136 1
A B C D
With radiator coated with white paint (α: 0.19, ε: 0.92)
Single Radiator, Pump Loop Dual Radiator, Pump Loop Single Radiator, w/Refrigeration Dual Radiator, w/Refrigeration

Design Evolution
TFAWS 2017 – August 21-25, 2017 8
Option:Thermal Load (W)
Radiator Size (m2)
System Mass (kg)
Total Radiator Mass (kg)
Average Power Consumption (W) Battery Capacity for
17 hr Night (kW-Hr)Battery Mass for 17
hr Night (kg)
Total Comparable
Mass (kg)Rank
DIURNAL DAY NIGHT
Single Radiator, Pump Loop A 525 11 28 216 1219 475 1525 25925 237 481 4
Dual Radiator, Pump Loop B 525 3.5 32 95 177 135 195 3315 30 157 3
Single Radiator, w/ Refrigeration
C 525 2.5 38 34 196 269 166 2826 26 98 1
Dual Radiator, w/ Refrigeration
D 525 1.8 61 51 257 430 186 3158 29 141 2
A B C D
With radiator coated with silver Teflon (α: 0.06, ε: 0.80)
Single Radiator, Pump Loop Dual Radiator, Pump Loop Single Radiator, w/Refrigeration Dual Radiator, w/Refrigeration
Other Designs Considered
• Single Refrigeration Loop to the Instrument Loads
– Prohibitive Characteristics
• High pressure lines crossing the pointing gimbal
• Two phase refrigerant in COTS components designed to be water
cooled and not ideal for inducing refrigerant evaporation.
• All Passive Thermal Design
– Prohibitive Characteristics
• Not enough radiative power to cool instruments
– No clear view to space
• Reduces allowable instrument volume
TFAWS 2017 – August 21-25, 2017 9

Design Selection
Single Radiator, with Refrigeration System and Liquid Loop
Instrument Load Liquid Loop Heat Exchanger Refrigeration Loop Radiator
TFAWS 2017 – August 21-25, 2017 10
Liquid Loop• Low power circulation pump
• Low freezing point heat transfer fluid – Galden HT-70
• 100% Duty Cycle throughout flight
• Flexible Tubing Crossing Pointing Gimbal
2-Phase Refrigeration Loop• Variable Speed Compressor
– Removes need for heaters on radiator to
compensate for changing heat flux on
radiator
– Maintained constant liquid loop temperature
• Standard Refrigerant– R134a
• Radiator/Condenser– “Higher” Temperature increases radiative
power
– Silver Teflon Surface (α=0.06, ϵ=0.8)

Refrigeration Cycle Overview
TFAWS 2017 – August 21-25, 2017 11
Vapor-Compression Cycle
(1 2) A gas (R134a) is compressed to a
superheated state.
(2 3) The superheated gas is cooled and
condensed in a radiator.
(3 4) A controlled expansion of the
refrigerant in liquid phase creates
a cold 2-phase flow.
(4 1) This is used to absorbed a heat load
through evaporation.
Advantages• By superheating a medium the quality of
heat for the system is increased.
– This allows for a smaller radiator, thus
reducing weight.
• By controlling the mass flow rate of the
refrigerant, the system can very precisely
control the temperature of the heat
exchanger.
– This allows for the system to hold a
precise heat exchanger temperature.
– It also means the power consumption of
the system can be scaled proportionally to
the heat load.
R134a p-h Phase Diagram
Condenser/
Radiator
Evaporator/
Heat Exchanger
Expansion
Valve Compressor
1
23
4

Thermal Analysis
Refrigeration Loop Modeling
• Built in Microsoft Excel with REFPROP Add-on– NIST Reference Fluid Thermodynamic and Transport Properties Database
• Steady State Analysis
TFAWS 2017 – August 21-25, 2017 12
SUPERHEAT h T Density Flow Speed
Compressor Outlet 489.3101 kJ/kg 112.6204985 C 61.46205367 kg/m3 0.983668529 m/s
Sat Vap Point 426.4655 kJ/kg 59.39612916 C 85.93190107 kg/m3 0.703560461 m/s
Delta 62.84454 kJ/kg 86.00831381 Ave C 73.69697737 Ave kg/m3 0.843614495 Ave m/s
Rad desuperheat 0.311692 kJ/s*m2 0.000346324 kJ/s*cm tube Max Radiative Area 3 m2
Superheat Watt Rej 0.18801 kJ/s Max Rad Power 0.935075719 kJ/s
Length of Superheat 5.428724 m Radiator Area 0.603191504 m2 Remaining area 2.396808496 m2
CONDENSING h T Density Flow Speed
Sat Vap Point 426.4655 kJ/kg 59.39612916 C 85.93190107 kg/m3 0.703560461 m/s
Sat Liq Point 286.454 kJ/kg 59.35348257 C 1056.245728 kg/m3 0.057238847 m/s
Delta 140.0115 kJ/kg 59.37480586 Ave C 571.0888144 Ave kg/m3 0.380399654 Ave m/s
Rad Condensing power 0.199233 kJ/s*m2 0.00022137 kJ/s*cm tube Max Radiative Area 2.396808496 m2
Condensing Watt Rej 0.418868 kJ/s Max Rad Power 0.477523097 kJ/s
Req Length of condensing18.92163 m Req Radiator Area 2.102403226 m2 Remaining area 0.29440527 m2
Refrigerant Subcooled? 1
SUBCOOLING h T Density Flow Speed
Sat Liq Point 286.454 kJ/kg 59.35348257 C 1056.245728 kg/m3 0.057238847 m/s
Radiator Outlet 268.8107 kJ/kg 48.2736722 C 1114.313979 kg/m3 0.054256062 m/s
Delta 17.64332 kJ/kg 53.81357739 Ave C 1085.279853 Ave kg/m3 0.055747454 Ave m/s
Rad subcool 0.17891 kJ/s*m2 0.000198788 kJ/s*cm tube Radiative Area 0.29440527 m2
Subcool Watt Rej 0.052783 kJ/s
Length subcool 2.655232 m Radiator Area 0.295025808 SubCooling 11.07981036 C
h T Density Flow Speed Quality
Radiator Outlet 268.8107 kJ/kg 48.2736722 C 1114.313979 kg/m3 0.054256062 m/s 0 % gas
Total Length Req 27.00558 m
Total Rejection 0.659661 kJ/s
Radiator Results Section from Refrigeration REFPROP Model

Thermal Analysis
Radiator Modeling
• Written in C#– Basic Energy Balance Equations
• Ideal for Quick Transient Analysis– All parameters can be changed while running
– Temperatures and View Factors Verified in Thermal Desktop
TFAWS 2017 – August 21-25, 2017 13
Day Time Night Time
Instrument A Off
Day Time
Instrument B Off

Design Solution
TFAWS 2017 – August 21-25, 2017 14
Standard Refrigeration System
Compressor
Radiator/
Condenser
Heat Exchanger/
Evaporator
Expansion Valve
Hot Gas Bypass
Variable Speed Compressor
• Up to 800W Cooling Capacity
• Hermetically Sealed
• Can reduce speed or duty cycled during
night or periods of time with low instrument
power consumption
Radiator
• 3m2 total radiative area– Thee 0.5 x 2 m Radiators
• 60C Full Load Operating Temperature
• 2mm Thick Aluminum w/ Aluminum Tubing
• Silver Teflon tape radiative surface
• Foam insulated back surface
Controls
• Compressor speed controlled by flight
avionics (0-5V)– Based on Superheat after Evaporator and pressure
drop across Expansion Valve

Advantages vs Single Phase System
Higher Radiator Temperature
• Increased radiative power per unit area
– Reduced Mass
• Decreased impact from varying “ground” radiative environment
Radiator Heaters not required during nominal operation
• Variable speed compressor can adjust to varying loads and environments
• Saves power during night operations, low power modes, and cold cases.
– Higher power consumption during daylight operations
TFAWS 2017 – August 21-25, 2017 15
Single Phase
Liquid Loop
2- Phase
Refrigeration
Sun Pointing 0 W 240 W
Shade/Night 245 W 93 W
Power Comparison, 3m2 Radiator Sized for Sun Pointing

Compressor vibration was characterized
at GRC Structural Dynamics LabMeasured pointing error of the system
with liquid lines and insulation at WFF
TFAWS 2017 – August 21-25, 2017 16
Characterization Testing

EDU Testing
Refrigeration Model Validation
• Subscale radiator manufactured in house at GRC
• Same components as flight design
• No TVAC Testing planned at this time
TFAWS 2017 – August 21-25, 2017 17
Refrigeration Loop EDU Layout with Radiator

EDU Testing (Cont.)
Heat Load (Instrument Simulator)
• Lytron Cold Plate
• 480W Total Omega Flexible Polyimide Heaters
– Load Simulator Power Supply to vary Load
• Brazed Plate Heat Exchanger
TFAWS 2017 – August 21-25, 2017 18
Liquid Loop Test LayoutHeat Load

Next Steps
• Complete Bench Testing of EDU
– EDU testing is currently underway at GRC
• Compare Results to Model
– Expected operating temperatures and pressures
– Compressor Power Draw
• Document and Publish Results
TFAWS 2017 – August 21-25, 2017 19

Conclusions
• A 2-Phase Refrigeration System with a Radiator shows
to be a viable means of reducing the radiator mass and
night time power consumption for balloon payloads, with
large heat loads.
TFAWS 2017 – August 21-25, 2017 20

Questions…?
TFAWS 2017 – August 21-25, 2017 21

BACKUP
TFAWS 2017 – August 21-25, 2017 22

GHAPS Launch Site Matrix
TFAWS 2017 – August 21-25, 2017 23
General Launch Site Fort Sumner, NM Palestine, TX Alice Springs AUS Kiruna SWE McMurdo ANT Wanaka NZ
Flight SeasonAug - Oct
every yearMay - July
March - May
odd years 1May - July
odd years
Dec - Jan
every year
April - Aug
even years
Campaign Duration July - Oct May - July Feb - May April - July Oct - Feb Feb - May
Launch Time Morning Morning / Afternoon Morning Anytime Anytime Morning
Lat/Long34.4731° N,
104.2422° W
31.7786° N,
95.7144° W
23.80° S,
133.89° E
67.8833° N,
21.1167° E
77.8500° S,
166.6667° E
44.7222° S,
169.2455° E
Trajectory West / Turnaround WestWest / East /
TurnaroundWest West East
Latitude Range 32 N - 40 N 30 N - 33 N 17 S - 29 S 60 N - 80 N Continent29 S - 65 S (nominal)
25 S - 80 S (possible)
Longitude Range 100 W - 114 W 95.71 W - 102 W 116 E - 140 E 23 E - 120 W Continent South Hemisphere
Float Wind Speed Range 0 - 40kts 10 - 45kts 0 - 40kts 10 - 30kts 5 - 30kts 10 - 120kts
Balloon Type Zero Pressure Zero Pressure Zero Pressure ZP / SPB ZP / SPB Super Pressure
Max Science Mass 6000 lbs 6000 lbs 6000 lbs6000 lbs (ZP)
3674 lbs2 (SPB)
6000 lbs (ZP)
3674 lbs2 (SPB)3674 lbs 2
Comm Package 3 CIP CIP CIP SIP SIP SIP
Pre-flight Ready to Ship August May January March August December
Building door constraints 30' h x 15' w
(Hook Height 29.5 ')
29.5' h x 18' w
(Hook Height 30 ')
31.5 ' h x 23.6' w
(Hook height 27.4 ')See attached
30' h x 18' w
(Hook Height 25.5 ')
13.7' h x 20' w
(Hook Height 11.2 ')
Launch vehicle envelopeSuspension ht is 40',
ground clearance is 6 '
Suspension ht is 40',
ground clearance is 6 '
Suspension ht is 40',
ground clearance is 6 '
Suspension ht is 40',
ground clearance is 6 '
Suspension ht is 40',
ground clearance is 6 '
Suspension ht is 40',
ground clearance is 6 '
Pre-flight Testing 4
Flight Duration up to 24 hrs up to 12 hrs up to 36 hrs up to 7 days up to 50 days up to 100 days
Average Temp -35 C -35 C -35 C -25 C -25C -35 C
Min Temp (10mb-5mb) -50C to -25C -50C to -25C -50C to -25C -40C to -10C -30C to -5C -75C to -30C
Min Temp (ascent) -75 C -78 C -85 C -55 C -50 C -70 C
Average Pressure 7mb 7mb 7mb 7mb 7mb 7mb
Recovery
Time to complete
recoveryhrs to a few days hrs to a few days hrs to a few days
multiple trips, several
days to weeks
multiple trips, several
days to weeks
multiple trips, several
days to weeks
Typical Recovery Vehicle5 Truck / Mobile Crane /
Helo
Truck / Mobile Crane /
Helo
Truck / Mobile Crane /
HeloSmall Aircraft / Truck Small Aircraft Small Aircraft / Truck
Size constraints for
components20' L x 8' W x 10 ' H 20' L x 8' W x 10 ' H 20' L x 8' W x 10 ' H 20' L x 8' W x 10 ' H
56" x 50" plane cargo
door20' L x 8' W x 10 ' H
Mass constraints for
components
1800 lbs helicopter
sling
1800 lbs helicopter
sling
1800 lbs helicopter
sling
1800 lbs helicopter
sling
2200 lbs plane,
1800 lbs helo sling
1800 lbs helicopter
sling
Average Temp10 to 32 C
50 to 90F
21 to 38 C
70 to 100 F
10 to 21 C
50 to 70 F
-1 to 16 C
30 to 60 F
-18 to 4 C
0 to 40 F
4 to 21 C
40 to 70 F
Average Pressure 875 mb 1000 mb 955 mb 1020 mb 950 mb 1000 mb

Thermal System Wiring Diagram
TFAWS 2017 – August 21-25, 2017 24

GHAPS Thermal System Full P&ID
TFAWS 2017 – August 21-25, 2017 25

WASP Fluid Line Test Results
• The chart displays the combined pitch and yaw RMS error for each run and elevation
angle.
• The red dotted line is the average of the baseline runs, with no hoses on TF2

• The internal posts in these isolators are short circuiting their isolation
capability. The Customer needs to look at isolators that do not have this
feature.
– Could potentially remove the internal posts from the isolators that were tested,
however a force link setup would have to be used vs preloading the entire joint
which was done in this test for simplicity.
• For the isolator to be effective, the highest frequency suspension mode
needs to be at least a factor of 5 below the fundamental excitation
frequency of the Compressor Pump.
– The small isolator was not soft enough for any of the Compressor Pump
operating speeds. The rocking suspension mode is around 19 Hz, which is not
the highest frequency suspension mode, but even if it was it is only a factor of 3
below the fundamental excitation frequency of the Compressor Pump when
operating at 3,600 rpm.
• The isolation system for this compressor pump needs to be ideally designed
to isolate at no greater frequency of 5 Hz if the pump is to be run at 1800
RPM.
Compressor Vibration Testing
Compressor Pump Testing Aug
2017
Summary and Observations