2. ODP LEG 104 (NORWEGIAN SEA): EXPLANATORY NOTES1 ... · ODP LEG 104 (NORWEGIAN SEA): EXPLANATORY...
17
2. ODP LEG 104 (NORWEGIAN SEA): EXPLANATORY NOTES 1 Shipboard Scientific Party 2 INTRODUCTION In this chapter we have assembled information that will help the reader understand the basis for our preliminary conclusions and help the interested investigator select samples for further analysis. Standard procedures for both drilling operations and preliminary shipboard analyses of the material recovered have been regularly amended and upgraded since 1968 during Deep Sea Drilling Project and Ocean Drilling Program drilling. This information applies only to shipboard operations analyses and interpretations described in the site reports in Part A of the Leg 104 Proceedings of the Ocean Drilling Program. Methods used by various investigators for further shore-based analysis of Leg 104 data will be detailed in the individual scientific contribu- tions published in Part B of the volume. AUTHORSHIP OF SITE REPORTS Authorship of the site reports is shared among the entire ship- board scientific party, although the two co-chief scientists and the staff scientist edited and rewrote part of the material pre- pared by other individuals. The site chapters are organized as follows (authors in parentheses): Site Summary (Eldholm, Thiede) Background and Objectives (Eldholm, Thiede) Operations (Foss) Sediment Lithology (Desprairies, Froget, Henrich, Krissek, Viereck) Basement Lithology (LeHuray, Love, Parson, Viereck) Biostratigraphy (Bjrirklund, Ciesielski, Donnally, Goll, Jansen, Mudie, Osterman, Qvale) Paleomagnetics (Bleil, Schoenharting) Geochemistry (Kvenvolden, McDonald) Physical Properties (Pittenger, Taylor) Logging Results (Barton, Lysne) Vertical Seismic Profiling (Phillips) Seismic Correlation (Eldholm) Summary and Conclusions (Eldholm, Thiede) 1 Eldholm, O., Thiede, J., Taylor, E., et al., 1987. Proc, Init. Repts. (Pt. A), ODP, 104. 2 Olav Eldholm, (Co-Chief Scientist), University of Oslo, Oslo, Norway; Jorn Thiede (Co-Chief Scientist), Christian-Albrechts-Universitat, Kiel, FRG; Elliott Taylor (Staff Scientist), ODP, Texas A&M University, College Station, TX; Col- leen Barton, Stanford University, Stanford, CA; Kjell Bjdrklund, University of Oslo, Oslo, Norway; Ulrich Bleil, Universitat Bremen, Bremen, FRG; Paul R. Ciesielski, University of Florida, Gainesville, FL; Alain Desprairies, Universite de Paris Sud, Orsay, France; Diane Donnally, Amoco Production Co., New Orleans, LA; Claude Froget, Faculte des Sciences de Luminy, Marseilles, France; Robert Goll, IKU/SINTEF, Trondheim, Norway; Rudiger Henrich, Christian-Albrechts- Universitat, Kiel, FRG; Eystein Jansen, University of Bergen, Bergen, Norway; Larry Krissek, Ohio State University, Columbus, OH; Keith Kvenvolden, USGS, Menlo Park, CA; Anne LeHuray, Lamont-Doherty Geological Observatory, Pali- sades, NY; David Love, University of Waterloo, Ontario, Canada; Peter Lysne, Sandia National Laboratory, Albuquerque, NM; Thomas McDonald, Texas A&M University, College Station, TX; Peta Mudie, Geological Survey of Canada, Nova Scotia, Canada; Lisa Osterman, Smithsonian Institution, Washington, DC; Lind- say Parson, Institute of Oceanographic Sciences, Surrey, UK; Joseph Phillips, University of Texas, Austin, TX; Alan Pittenger, Texas A&M University, College Station, TX; Gunnbjdrg Qvale, Norsk Hydro, Oslo, Norway; Gunther Schonhart- ing, University of Copenhagen, Copenhagen, Denmark; Lothar Viereck, Ruhr Universitat, Bochum, FRG. In addition to the shipboard scientific party some members of the shore-based studies group participated in the post-cruise meeting of ODP Leg 104 and contributed to the interpretation of the drilling results. They were Ian Gibson (Basement Petrol- ogy, Univ. of Waterloo), Svein Manum (Palynology, Univ. of Oslo), and Andy Morton (Petrology, British Geological Survey, United Kingdom). Following the text are summary graphic lithologic and bio- stratigraphic logs, core descriptions (barrel sheets), and photo- graphs of each core. SURVEY AND DRILLING DATA The survey data used for specific site selections are discussed in each site chapter. En route between sites, continuous observa- tions of depth and sub-bottom structure were made. Short sur- veys using a precision echo sounder and seismic profiles were made on JOIDES Resolution before dropping the acoustic bea- con. All geophysical data collected during Leg 104 are presented in the "Underway Geophysics" chapter (this volume). The seismic profiling system on JOIDES Resolution consist- ed of two 80-in. 3 waterguns, a Scripps-designed hydrophone ar- ray, Bolt amplifiers, two band-pass filters, and two EDO re- corders, usually recording at two different filter settings. Bathymetric data were displayed on 3.5- and 12-kHz preci- sion depth recorder systems which consist of sound transceiver, transducer, and recorder. The depths were read on the basis of an assumed 1463 m/s sound velocity in water. The water depth (in meters) at each site was corrected (1) according to the Matth- ew's Tables (1939) and (2) for the depth of the hull transducer below sea level (6 m). In addition, depths referred to the drilling platform level are assumed to be 10 m above the water line. DRILLING CHARACTERISTICS Because water circulation down the hole is open, cuttings are lost onto the seafloor and cannot be examined. The only avail- able information about sedimentary stratification in uncored or unrecovered intervals, other than from seismic data or wireline logging results, is from an examination of the behavior of the drill string as observed on the drill platform. The harder the lay- er being drilled, the slower and more difficult it usually is to penetrate. There are, however, a number of other factors which determine the rate of penetration, so it is not always possible to relate rate of penetration directly to the hardness of the layers. The parameters of bit weight and revolutions per minute also in- fluence the rate of penetration. They are recorded on the drilling recorder. When cores are split, many show signs of significant sedi- ment disturbance. Such disturbance includes the concave-down- ward appearance of originally horizontal bands, the haphazard mixing of lumps of different lithologies, and the near-fluid state of some sediments recovered from tens to hundreds of meters below the seafloor. Core deformation probably occurs during one of three different steps at which the core can suffer stresses sufficient to alter its physical characteristics: retrieval (with ac- companying changes in pressure and temperature), cutting, and core handling. 27
Transcript of 2. ODP LEG 104 (NORWEGIAN SEA): EXPLANATORY NOTES1 ... · ODP LEG 104 (NORWEGIAN SEA): EXPLANATORY...

2. ODP LEG 104 (NORWEGIAN SEA): EXPLANATORY NOTES1
Shipboard Scientific Party2
INTRODUCTION
In this chapter we have assembled information that will help the reader understand the basis for our preliminary conclusions and help the interested investigator select samples for further analysis. Standard procedures for both drilling operations and preliminary shipboard analyses of the material recovered have been regularly amended and upgraded since 1968 during Deep Sea Drilling Project and Ocean Drilling Program drilling. This information applies only to shipboard operations analyses and interpretations described in the site reports in Part A of the Leg 104 Proceedings of the Ocean Drilling Program. Methods used by various investigators for further shore-based analysis of Leg 104 data will be detailed in the individual scientific contributions published in Part B of the volume.
AUTHORSHIP OF SITE REPORTS Authorship of the site reports is shared among the entire ship
board scientific party, although the two co-chief scientists and the staff scientist edited and rewrote part of the material prepared by other individuals. The site chapters are organized as follows (authors in parentheses): Site Summary (Eldholm, Thiede) Background and Objectives (Eldholm, Thiede) Operations (Foss) Sediment Lithology (Desprairies, Froget, Henrich, Krissek,
Viereck) Basement Lithology (LeHuray, Love, Parson, Viereck) Biostratigraphy (Bjrirklund, Ciesielski, Donnally, Goll, Jansen,
Mudie, Osterman, Qvale) Paleomagnetics (Bleil, Schoenharting) Geochemistry (Kvenvolden, McDonald) Physical Properties (Pittenger, Taylor) Logging Results (Barton, Lysne) Vertical Seismic Profiling (Phillips) Seismic Correlation (Eldholm) Summary and Conclusions (Eldholm, Thiede)
1 Eldholm, O., Thiede, J., Taylor, E., et al., 1987. Proc, Init. Repts. (Pt. A), ODP, 104.
2 Olav Eldholm, (Co-Chief Scientist), University of Oslo, Oslo, Norway; Jorn Thiede (Co-Chief Scientist), Christian-Albrechts-Universitat, Kiel, FRG; Elliott Taylor (Staff Scientist), ODP, Texas A&M University, College Station, TX; Colleen Barton, Stanford University, Stanford, CA; Kjell Bjdrklund, University of Oslo, Oslo, Norway; Ulrich Bleil, Universitat Bremen, Bremen, FRG; Paul R. Ciesielski, University of Florida, Gainesville, FL; Alain Desprairies, Universite de Paris Sud, Orsay, France; Diane Donnally, Amoco Production Co., New Orleans, LA; Claude Froget, Faculte des Sciences de Luminy, Marseilles, France; Robert Goll, IKU/SINTEF, Trondheim, Norway; Rudiger Henrich, Christian-Albrechts-Universitat, Kiel, FRG; Eystein Jansen, University of Bergen, Bergen, Norway; Larry Krissek, Ohio State University, Columbus, OH; Keith Kvenvolden, USGS, Menlo Park, CA; Anne LeHuray, Lamont-Doherty Geological Observatory, Palisades, NY; David Love, University of Waterloo, Ontario, Canada; Peter Lysne, Sandia National Laboratory, Albuquerque, NM; Thomas McDonald, Texas A&M University, College Station, TX; Peta Mudie, Geological Survey of Canada, Nova Scotia, Canada; Lisa Osterman, Smithsonian Institution, Washington, DC; Lindsay Parson, Institute of Oceanographic Sciences, Surrey, UK; Joseph Phillips, University of Texas, Austin, TX; Alan Pittenger, Texas A&M University, College Station, TX; Gunnbjdrg Qvale, Norsk Hydro, Oslo, Norway; Gunther Schonhart-ing, University of Copenhagen, Copenhagen, Denmark; Lothar Viereck, Ruhr Universitat, Bochum, FRG.
In addition to the shipboard scientific party some members of the shore-based studies group participated in the post-cruise meeting of ODP Leg 104 and contributed to the interpretation of the drilling results. They were Ian Gibson (Basement Petrology, Univ. of Waterloo), Svein Manum (Palynology, Univ. of Oslo), and Andy Morton (Petrology, British Geological Survey, United Kingdom).
Following the text are summary graphic lithologic and bio-stratigraphic logs, core descriptions (barrel sheets), and photographs of each core.
SURVEY AND DRILLING DATA The survey data used for specific site selections are discussed
in each site chapter. En route between sites, continuous observations of depth and sub-bottom structure were made. Short surveys using a precision echo sounder and seismic profiles were made on JOIDES Resolution before dropping the acoustic beacon. All geophysical data collected during Leg 104 are presented in the "Underway Geophysics" chapter (this volume).
The seismic profiling system on JOIDES Resolution consisted of two 80-in.3 waterguns, a Scripps-designed hydrophone array, Bolt amplifiers, two band-pass filters, and two EDO recorders, usually recording at two different filter settings.
Bathymetric data were displayed on 3.5- and 12-kHz precision depth recorder systems which consist of sound transceiver, transducer, and recorder. The depths were read on the basis of an assumed 1463 m/s sound velocity in water. The water depth (in meters) at each site was corrected (1) according to the Matthew's Tables (1939) and (2) for the depth of the hull transducer below sea level (6 m). In addition, depths referred to the drilling platform level are assumed to be 10 m above the water line.
DRILLING CHARACTERISTICS Because water circulation down the hole is open, cuttings are
lost onto the seafloor and cannot be examined. The only available information about sedimentary stratification in uncored or unrecovered intervals, other than from seismic data or wireline logging results, is from an examination of the behavior of the drill string as observed on the drill platform. The harder the layer being drilled, the slower and more difficult it usually is to penetrate. There are, however, a number of other factors which determine the rate of penetration, so it is not always possible to relate rate of penetration directly to the hardness of the layers. The parameters of bit weight and revolutions per minute also influence the rate of penetration. They are recorded on the drilling recorder.
When cores are split, many show signs of significant sediment disturbance. Such disturbance includes the concave-downward appearance of originally horizontal bands, the haphazard mixing of lumps of different lithologies, and the near-fluid state of some sediments recovered from tens to hundreds of meters below the seafloor. Core deformation probably occurs during one of three different steps at which the core can suffer stresses sufficient to alter its physical characteristics: retrieval (with accompanying changes in pressure and temperature), cutting, and core handling.
27

SHIPBOARD SCIENTIFIC PARTY
SHIPBOARD SCIENTIFIC PROCEDURES
Numbering of Sites, Holes, Cores, and Samples ODP drill sites are numbered consecutively from the first site
drilled by Glomar Challenger in 1968. Site numbers are slightly different from hole numbers. A site number refers to one or more holes drilled while the ship is positioned over a single acoustic beacon. Several holes may be drilled at a single site by pulling the drill pipe above the seafloor, moving the ship some distance from the previous hole, and then drilling another hole. For all ODP drill sites, a letter suffix distinguishes each hole drilled at the same site; the first hole being designated A and proceeding alphabetically thereafter at a given site. This procedure differs from that used by the Deep Sea Drilling Project (Sites 1-624), but prevents ambiguity between site and hole number designations.
The cored interval is measured in meters below the seafloor. The depth interval of an individual core is the depth below seafloor at which the coring operation began, to the depth at which the coring operation ended. Each coring interval is up to 9.7 m long, which is the maximum length of a core barrel. The coring interval may, however, be shorter. Cored intervals are not necessarily adjacent to each other but may be separated by drilled intervals. In soft sediment, the drill string can be "washed ahead" with the core barrel in place, but not recovering sediment, by pumping water down the pipe at high pressure to wash the sediment out of the way of the bit and up the space between the drill pipe and the hole wall; however, if thin, hard rock layers are present, it is possible to get "spotty" sampling of these resistant layers within the washed interval.
Cores taken from a hole are numbered serially from the top of the hole downward. Maximum full recovery for a single core is 9.6 m of sediment or rock in a plastic liner (6.6-cm inside diameter), plus about a 0.2-m-long sample (without a plastic liner) in a core catcher. The core catcher is a device at the bottom of the core barrel that prevents the core from sliding out when the barrel is being retrieved from the hole. The sediment core, which is in the plastic liner, is then cut into 1.5-m-long sections that are numbered serially from the top of the sediment core (Fig. 1). The routine for handling hard rocks is described later in this chapter. When full recovery is obtained, the sections are numbered from 1 through 7 (from the top of the core downward), the last section being shorter than 1.5 m. For sediments, the core-catcher sample is placed below the last section and treated as a separate section. For hard rocks, material recovered in the core catcher is included at the bottom of the last section.
When recovery is less than 100%, whether or not the recovered material is contiguous, the recovered sediment is placed at the top of the cored interval, and then 1.5-m-long sections are numbered serially, starting with Section 1 at the top. There are as many sections as needed to accommodate the length of the core recovered (Fig. 1); for example, 3 m of core sample in a plastic liner will be divided into two 1.5-m-long sections. Sections are cut starting at the top of the recovered sediment, and the last section may be shorter than the normal 1.5-m length. If, after the core has been split, fragments which are separated by a void appear to have been contiguous in situ, a note is made in the description of the section.
Samples are designated by distances in centimeters from the top of each section to the top and bottom of the sample interval in that section. A full identification number for a sample consists of the following information: (1) Leg, (2) Site, (3) Hole, (4) Core Number, (5) Core Type, (6) Section, and (7) Interval in centimeters. For example, the sample identification number "104-642B-3H-2, 98-100 cm" means that a sample was taken between 98 and 100 cm from the top of Section 2 of Core 3 (hydraulic piston core), from the second hole drilled at Site 642
Full recovery Partial
recovery
Partia recover wi th vo
Section number
l
2
__ 3
^ ^ — » 4
— 5
__ 6
^—^ 7 cc
m & # '•'.' '•:•: & ••/• §1 $ & :<: ;.'; &: *••• j f i
*;.": 1 £■ :'{■: ':•: •."•* g :.-: %•: ■ • •
•.;.'; •;•• ••.
Top
Section number
tar f Bottom-
Empty; ' liner
Top
Section number
Core-catcher sample
Core-catcher sample
o t t om- f i * - J8a
Top
!L Core-catcher
sample
Figure 1. Diagram showing procedure used in cutting and labeling core sections.
during Leg 104. A sample from the core catcher of this core might be designated "104-642B-3H, CC (8-9 cm)".
The depth below the seafloor for a sample numbered 104-642B-3H-2, 98-100 cm is the sum of the depth to the top of the cored interval for Core 3 (14.3 m), plus the 1.5 m included in Section 1, plus the 98 cm below the top of Section 2. The sample in question is therefore located at 16.78 m sub-bottom which, in principle, is the sample sub-seafloor depth (sample requests should refer to a specific interval within a core section, rather than sub-bottom depths in meters).
ODP core and sample identifiers include core type. This qualifier designates the drilling and coring method used to obtain a given core. The following abbreviations are used to describe core type: R = rotary barrel; H = hydraulic piston core (HPC); P = pressure core barrel (PCB); X = extended core barrel (XCB); B = drill bit recovery; C = center bit recovery; I = in-situ water sample; S = side-wall sample; W = wash core recovery; N = Navidrill core barrel (NCB); and M = miscellaneous material. HPC, XCB, NCB, rotary, and wash coring were all used at some point during Leg 104 operations.
Core Handling As soon as a core is retrieved on deck, it is checked for poten
tial hydrocarbons and a sample is taken from the core catcher to the paleontological laboratory for an initial assessment of the age of the sample.
The core is then placed on a long horizontal rack and gas samples are taken by piercing the core liner and withdrawing gas into a vacuum-tube sampler (Vacutainer). Voids within the core are sought as sites for the gas sampling. Some of the gas samples are stored for shore-based study, while others are analyzed immediately as part of the safety and pollution-prevention program. Next, the core is marked into section lengths, each section is labeled, and the core is cut into sections. Interstitial water (IW), organic geochemistry (OG), physical properties (PP), and
28

EXPLANATORY NOTES
gas head-space analysis (GS) whole-round samples are taken at this time. These whole-round samples are capped with red end caps (no acetone) and taped. Each of the core sections is sealed top and bottom by gluing on a plastic cap, blue to identify the top of a section and clear for the bottom. A yellow cap is placed on a section end from which a whole-round core sample has been removed. The caps are attached to the liner by coating the end of the liner and the inside rim of the end cap with acetone.
The cores are then carried into the laboratory, where' the sections are again labeled and the core-section identifier is engraved on the liner. The length of core in each section and the core-catcher sample is measured to the nearest centimeter, and this information is logged on the shipboard core-log data base program.
The cores are then allowed to warm to room temperature before splitting (usually 2-4 hr). During this time, the whole-round sections are run through the GRAPE (gamma-ray-attenuation porosity evaluation) device for estimating bulk density and porosity (see below; Boyce, 1976). After the cores reach thermal equilibrium, thermal conductivity measurements are made immediately before splitting.
Cores are then split lengthwise into the working and archive halves. The softer cores are split with a wire or coping saw, depending on the degree of induration. In soft sediments, some smearing of material can occur, and to minimize contamination users of the cores should avoid using the very near-surface part of the split core. Semi-consolidated and hard-rock cores are split utilizing a high-speed, water-lubricated, diamond-blade saw.
The working half is then sampled for both shipboard and shore-based laboratory studies. Each extracted sample, and the name of the investigator receiving the sample, is logged by location in the sampling computer program. Records of all removed samples, including both those taken aboard ship and those taken after the cores are returned to the archiving facility, are kept by the Curator at ODP in College Station. The extracted samples are sealed in plastic vials or bags and labeled. Samples were routinely taken for shipboard analysis of sonic velocity by the Hamilton Frame method, water content by gravimetric analysis, percent calcium carbonate by carbonate bomb, bulk mineralogy by XRD, and for other purposes. Many of these data are reported in the site chapters.
The archive half is described visually, supplemented by either smear-slide samples from the archive half, or by thin sections from the working half, and studied under the petrographic microscope. The archive half is then routed to the pass-through cryogenic magnetometer (see below), and is then photographed in both black and white and color, a whole core at a time.
Both halves are then put into labeled plastic tubes (D-tubes), sealed, and transferred to cold-storage space aboard the drilling vessel. Leg 104 cores were transferred from the ship via refrigerated vans to cold storage at the East Coast Repository, at La-mont-Doherty Geological Observatory, Palisades, New York.
SEDIMENT CLASSIFICATION A N D DESCRIPTION The classification system used during Leg 104 was devised by
the former JOIDES Panel on Sedimentary Petrology and Physical Properties and adopted for use by the JOIDES Planning Committee in March 1974. The core descriptions, smear slide descriptions, and carbonate bomb (% CaC03) data, all obtained on board ship, serve as the bases for the graphic core descriptions presented at the end of each site chapter.
Sediment Disturbance The coring technique, which uses a 25-cm-diameter bit with
a 6-cm-diameter core opening, may result in extreme disturbance in the recovered core material.
The following disturbance categories are recognized for soft and firm sediments (Fig. 2):
(1) Slightly deformed: Bedding contacts are slightly bent. (2) Moderately deformed: Bedding contacts have undergone
extreme bowing. (3) Highly deformed: Bedding is completely disturbed, some
times showing symmetrical, diapir-like structure. (4) Soupy: Intervals are water-saturated and have lost all as
pects of original bedding. The following categories are used to describe the degree of
fracturing in hard sediments and igneous rocks (Fig. 2): (1) Slightly fractured: Core pieces in place, with very little
drilling slurry or breccia. (2) Moderately fragmented: Core pieces in place or partly
displaced, but original orientation is preserved or recognizable. Drilling slurry surrounds fragments. Commonly associated with "drilling biscuits" created by core barrel rotation.
(3) Highly fragmented: Pieces from the interval cored and probably in correct stratigraphic sequence (although they may not represent the entire section), but original orientation is totally lost.
(4) Drilling breccia: Core pieces have completely lost their original orientation and stratigraphic position. May be completely mixed with drilling slurry.
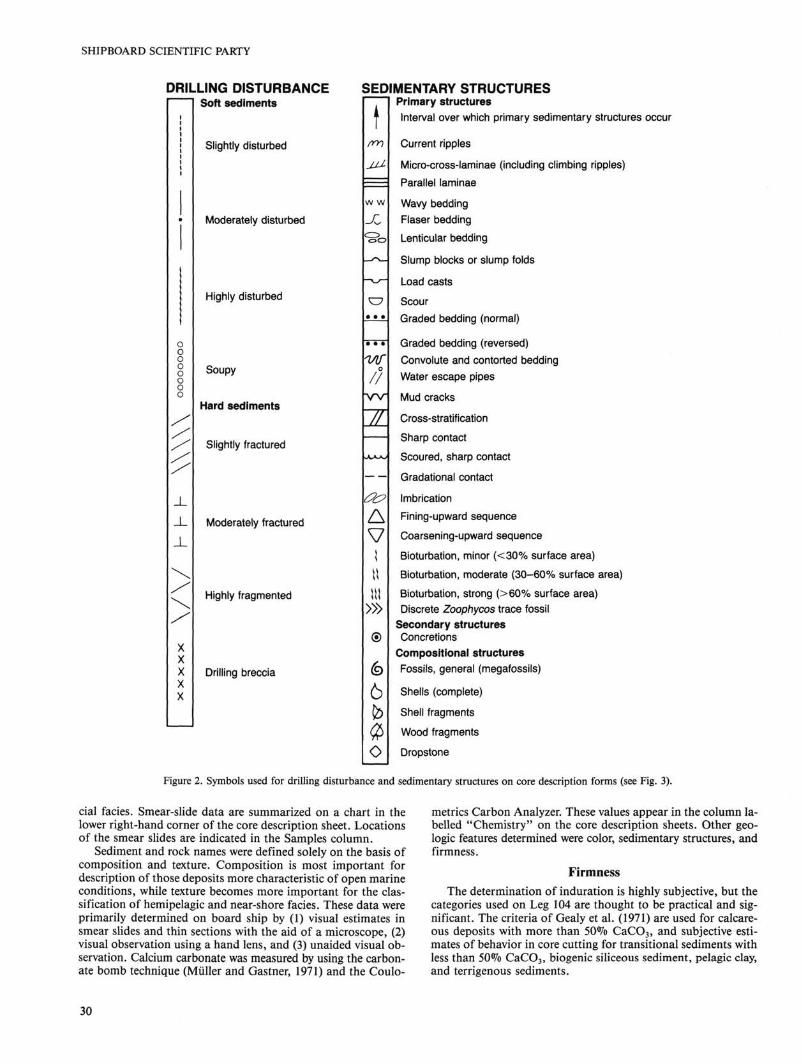
These categories are coded on the "Drilling Disturbance" column of the core description sheets (Fig. 3) at the end of each site chapter.
Sedimentary Structures The description of sedimentary structures on Leg 104 fol
lowed the suggested ODP format with only minor modifications. All structures observed are indicated on the "Sedimentary Structures" column of the core description sheets (Fig. 3) at the end of each site chapter. A key to the set of structural symbols used on Leg 104 is given in Figure 2.
Color Colors of the recovered material were determined with Mun-
sell soil color charts. Colors were determined immediately after the cores were split and while they were still wet. Information on core colors is given in the Lithologic Description text on the core description sheets (Fig. 3) at the end of each site chapter.
Graphic Lithology Column The lithological classification scheme presented here is repre
sented graphically on the core description sheets (Fig. 3) using the symbols illustrated in Figure 4. The only modification to the recommended usage of the JOIDES Panel on Sedimentary Petrology and Physical Properties by Leg 104 scientists was to illustrate the occurrences of volcanic ash and sands. These are often illustrated using an overprint of the volcanogenic component on a textural template (see symbols used in Fig. 4). Qualifier letters are used as overprints in the following cases:
(1) Zeolitic (Al) (2) Glauconitic (A3)
and a dark, solid marker symbol on the right margin of the "Graphic Lithology" column to characterize the thicknesses of the indicative dark layers within the glacial/interglacial sedimentary cycles.
SEDIMENT CLASSIFICATION SCHEME The text of the core description sheets includes the lithologic
name assignment, and other information such as color, structures, and textures. In addition, the frequent interbedded character of glacial and interglacial facies has been noted following the descriptive text by using [G] for glacial and [IG] for intergla-
29
SHIPBOARD SCIENTIFIC PARTY
DRILLING DISTURBANCE Soft sediments
Slightly disturbed
Moderately disturbed
_L
Highly disturbed
Soupy
Hard sediments
Slightly fractured
Moderately fractured
Highly fragmented
Drilling breccia
SEDIMENTARY STRUCTURES Primary structures Interval over which primary sedimentary structures occur
1AT o
/ / w i
Z
nrr)
w w X
e7 • • •
a? A l \\ ill
>»
®
6 lb
o
Current ripples
Micro-cross-laminae (including climbing ripples)
Parallel laminae
Wavy bedding Flaser bedding Lenticular bedding
Slump blocks or slump folds
Load casts
Scour Graded bedding (normal)
Graded bedding (reversed) Convolute and contorted bedding Water escape pipes
Mud cracks
Cross-stratification
Sharp contact
Scoured, sharp contact
Gradational contact
Imbrication
Fining-upward sequence
Coarsening-upward sequence
Bioturbation, minor (<30% surface area)
Bioturbation, moderate (30-60% surface area)
Bioturbation, strong (>60% surface area) Discrete Zoophycos trace fossil
Secondary structures Concretions
Compositional structures Fossils, general (megafossils)
Shells (complete)
Shell fragments
Wood fragments
Dropstone
Figure 2. Symbols used for drilling disturbance and sedimentary structures on core description forms (see Fig. 3).
cial facies. Smear-slide data are summarized on a chart in the lower right-hand corner of the core description sheet. Locations of the smear slides are indicated in the Samples column.
Sediment and rock names were defined solely on the basis of composition and texture. Composition is most important for description of those deposits more characteristic of open marine conditions, while texture becomes more important for the classification of hemipelagic and near-shore facies. These data were primarily determined on board ship by (1) visual estimates in smear slides and thin sections with the aid of a microscope, (2) visual observation using a hand lens, and (3) unaided visual observation. Calcium carbonate was measured by using the carbonate bomb technique (Miiller and Gastner, 1971) and the Coulo-
metrics Carbon Analyzer. These values appear in the column labelled "Chemistry" on the core description sheets. Other geologic features determined were color, sedimentary structures, and firmness.
Firmness The determination of induration is highly subjective, but the
categories used on Leg 104 are thought to be practical and significant. The criteria of Gealy et al. (1971) are used for calcareous deposits with more than 50% CaC03 , and subjective estimates of behavior in core cutting for transitional sediments with less than 50% CaC03 , biogenic siliceous sediment, pelagic clay, and terrigenous sediments.
30

EXPLANATORY NOTES
SITE HOLE CORE CORED INTERVAL
i i * y
ME
RC
BIOSTRAT. ZONE / FOSSIL CHARACTER co cc
^ z I < cc 0 u.
3R
CO
CO O
0 z z < z
ES
CO
z <
.DIO
LAI
1 CC
ER
UTO
MS
Q
VA Tl
</>
ETIC
z C3
LEO
MA
< a .
DN
co
RTI
O
PE
EC Ck
YSIC
AL
X a.
G = Good M = Moderate P = Poor
ABUNDANCE: A = Abundant C = Common F = Frequent R = Rare B = Barren
isitv
CO
T3 X) c re ^ >
rosi
i
a > o
Velo
>
EMIS
TFI
X
u
— c£ cu CD
bon
CO
o
CTI
ON
co
1
2
3
4
5
6
7
CC
TER
S
2
0 . 5 -
i i i | i i i i
q
-
^ ■3
-
_
-
GRAPHIC LITHOLOGY
i _
3 0 5
UL
ols
( ym
b
CO
> O ) O
tho
ic li
phi
CO
O ■t->
> CU
CU CU
CO
<o
Q
ILLI
NG
cc Q
co cc 3 t -o
D. S
TRL
CO
CM
lure
11
c
Is i
o £
sym
o ■f->
> cu .*
- Se
e
MPL
ES
< CO
PP
OG
IW
*
G
LITHOLOGIC DESCRIPTION
Lithologic description
^ Physical properties ful l round sample
^ Organic geochemistry sample
Smear-slide summary (%): Section, depth (cm) M = minor l i thology, D = dominant l ithology
Interstitial water sample
< Smear slide
^ Headspace gas sample
Figure 3. Core description form ("barrel sheet") used for sediments and sedimentary rocks.
31

SHIPBOARD SCIENTIFIC PARTY
Siliceous Biogenic Sediments
PELAGIC SILICEOUS BIOGENIC ■ SOFT
Diatom Ooze
1 - ^ - v ^j-
ladiolarian Ooze W J\-
Jiatom • Rad or Siliceous Ooze
SB1 SB2
PELAGIC SILICEOUS BIOGENIC - HARD
Porcellanite A A A A A
A A A A A A A A A A
A A A A A A A A A A
A A A A A SB4 SB5 SB6
TRANSIT IONAL BIOGENIC SILICEOUS SEDIMENTS
Siliceous Component < 50% Siliceous Component > 50%
Terrigenous Symbol
!Z Siliceous Modifier Symbol'
PELAGIC SEDIMENTS
▲ ▲ ▲ A A ▲ A A A ▲
A A A A A A A A A A
A A A A A
Non-Biogenic Sediments
Pelagic Clay
Calcareous Biogenic Sediments PELAGIC BIOGENIC CALCAREOUS - SOFT
Nannofossil Ooze Foraminiferal Ooze Nanno - Foram or Foram ■ Nanno Ooze Calcareous Ooze
a u a a a □ D 3 n
Q D D O D □ n a D
PELAGIC BIOGENIC CALCAREOUS • F IRM
Nannofossil Chalk Foraminiferal Chalk Nanno • Foram or Foram - Nanno Chalk Calcareous Chalk
CB5 PELAGIC BIOGENIC C A L C A R E O U S - H A R D Limestone
T R A N S I T I O N A L BIOGENIC CALCAREOUS SEDIMENTS
Calcareous Component < 50% Calcareous Component > 50%
Terrigenous Symbol
* Calcareous Modifier Symbol'
SPECIAL ROCK TYPES Breccia Basic Igneous
Metamorphics
Clay/Claystone
T1
Silt/Siltstone
Sandy Clay/ Ciayey Sand
TERRIGENOUS SEDIMENTS
Mud/Mudstone Shale (Fissile)
T2
Sand/Sandstone
Sandy Mud/ Sandy Mudstone
Silty Sand/ Sandy Silt M l ■ " ' ■ • ■
Silty Clay/ Clayey Silt
drawn circle with symbol ( others may be designated
VOLCANOGENIC SEDIMENTS
Volcanic Ash Volcanic Lapilli Volcanic Breech
„ * * NN \\ * 1 I.
\ ■ I „ i B
ADDITIONAL SYMBOLS
Zeolitic Glauconitic
Indicates dark glacial layers in Leg 104 cores.
3 Figure 4. Key to symbols used in "graphic lithology" column on the core description form shown in Figure 3.
32

EXPLANATORY NOTES
There are three classes of firmness for calcareous sediments: (1) Soft: Sediments which have little strength and are readily
deformed under the finger or broad blade of the spatula are termed ooze.
(2) Firm: Partly lithified ooze or friable limestone is called chalk. Chalks are readily deformed under the fingernail or the edge of a spatula blade.
(3) Hard: Limestone is restricted to nonfriable cemented rock.
Only two classes of firmness were regularly noted for non-calcareous sediments:
(1) Soft: Sediment core may be split with a wire cutter. Soft terrigenous sediment, pelagic clay, and transitional calcareous biogenic sediments are termed sand, silt, clay, or mud.
(2) Hard: The core is hard (i.e., consolidated or well indurated) if it must be cut with a saw. For these materials, the suffix -stone is added to the soft-sediment name (e.g., sandstone, silt-stone, claystone, mudstone).
Basic Sediment Types The following defines compositional class boundaries for the
use of qualifiers in the lithologic classification scheme:
Pelagic Clay
Pelagic clay is principally authigenic pelagic deposits that accumulate at very slow rates. Since all clay-rich sediments cored during Leg 104 show an evident terrigenous origin, this category was not used.
Siliceous Biogenic Sediments Siliceous biogenic sediments are distinguished from pelagic
clay because they contain common siliceous microfossils. Siliceous biogenic sediments are distinguished from the calcareous category by a calcium carbonate content of less than 30%.
There are two categories of siliceous biogenic sediments: (a) pelagic siliceous biogenic sediments that contain greater than 30% siliceous microfossils and less than 30% silt and clay; and (b) transitional siliceous biogenic sediments that contain between 10% and 70% siliceous microfossils and greater than 30% silt and clay.
For pelagic biogenic siliceous sediments the following terminology is used:
(1) Soft: Siliceous ooze (radiolarian ooze, diatom ooze, etc., depending on the dominant fossil component).
(2) Hard: Radiolarite, diatomite, chert, or porcellanite. Diatoms and radiolarians may be the principal components of these sediments; thus one or two qualifiers may be used, for example:
Indeterminate siliceous fossils: Siliceous ooze, chert, or porcellanite
Radiolarians predominate: Radiolarian ooze, or radiolarite Diatoms: Diatom ooze, or diatomite Diatoms < Radiolarians: Diatom radiolarian ooze, or dia
tom radiolarite Diatoms > Radiolarians: Radiolarian diatom ooze, or radi
olarian diatomite The most dominant component is listed last and the minor
component is listed first. For transitional biogenic siliceous sediments, the following
terminology is used: (1) Siliceous component < 50%: Diatomaceous mud (soft)
or diatomaceous mudstone (hard). (2) Siliceous component > 50%: Muddy diatom ooze (soft)
or muddy diatomite (hard). Other terms may be substituted for diatomaceous and diato
mite, for example, radiolarian or radiolarite, very siliceous, or chert if the fossil type is indeterminable. A calcareous content of between 10% and 30% in siliceous biogenic sediments carries a qualifier such as "calcareous," "nannofossil," etc.
Calcareous Biogenic Sediments
The Leg 104 shipboard party distinguished calcareous biogenic sediment by a biogenic CaC03 content in excess of 30%, following the standard DSDP and ODP classification scheme. There are two classes: (a) pelagic calcareous biogenic sediments that contain 65% to 100% biogenic CaC03 (less than 30% silt and clay), and (b) transitional calcareous biogenic sediments which contain 30%-65% CaC03 (greater than 30% silt and clay). Names given to these classes of sediment are consolidation-dependent, as shown in Figure 4. Sediments belonging to other classification categories but that contain 10% to 30% calcareous components are given the modifier "calcareous" (or "foraminif-eral" or "nannofossil," as appropriate). Less than 10% CaC0 3 was ignored.
Terrigenous Sediments Sediments falling in this portion of the classification scheme
are subdivided into textural groups on the basis of the relative proportions of three grain-size constituents, i.e., clay, silt, and sand. Coarser terrigenous sediments are classed as conglomerate or breccia, clast-supported or matrix-supported, or are treated as "Special Rock Types" (Fig. 4). The size limits for these constituents are those defined by Wentworth (1922). See Figure 5.
MILL IMETERS
4096
1024
16
3.36
2.83
2.38
1.68
1.41
1.19
0.84
0.71
0.59
0.42
0.35
0.30
0.210
0.177
0.149
0.105
0.088
0.074
1/16 0.0625 —
0.053
0.044 0.037
1 /64 0.01 56
1/128 0.0078
0.0020
0.00098
0.00049
0.00024
0.00012
0.00006
j j m
420
350
300
210
177
149
105
88
74
53
44
37
15.6
7.8
2.0
0.98
0.49
0.24
0.12
0.06
PHI ( 0 )
-20
-12
-10
-4
-1.75
-1.5
-1.25
-0.75
-0.5
-0.25
0.25
0.5
0.75
1.25
1.5
1.75
2.25
2.5
2.75
3.25
3.5
3.75
4.25
4.5
4.75
6.0
7.0
9.0
10.0
11.0
12.0
13.0
14.0
WENTWORTH SIZE CLASS
Boulder (-8 t o - 1 2 0 )
Cobble (-6 t o - 8 0 )
Pebble (-2 to -6 0 )
Granule
Very coarse sand
Coarse sand
Medium sand
Fine sand
Very fine sand
Coarse silt
Medium silt
Very f ine silt
Clay
VE
L
< CD
D 2
< CO
Q
5
Figure 5. Grain-size categories used for classification of terrigenous sediments (from Wentworth, 1922).
33

SHIPBOARD SCIENTIFIC PARTY
Five major textural groups are recognized on the accompanying triangular diagrams (Fig. 6). The groups are defined according to the abundance of clay (>90%, 90-10%, < 10%) and the ratio of sand to silt (> 1 or < 1). The terms clay, silt, and sand are used for unconsolidated sediments that are cut with a wire in the shipboard core splitting process. The hard or consolidated equivalents for the same textural groups are claystone, siltstone, and sandstone. Sedimentary rocks falling into the consolidated category include those which must generally be cut with the super-saw or diamond saw.
In this sediment category, numerous qualifiers are possible, usually based on minor constituents (for example, glauconitic, pyritic, feldspathic). The most commonly encountered minor constituents during Leg 104 were zeolite and glauconite, represented respectively by Al and A3 overprints. Terrigenous sediments and sedimentary rocks containing 10%-30% CaC03 are qualified by the modifier "calcareous."
Volcanogenic Sediments The Leg 104 shipboard party selected the Fisher and Schmin-
cke (1984) classification for pyroclastic rocks. This differs from the standard JOIDES, DSDP, and ODP recommended usage. The textural groups are: (a) volcanic breccia (greater than 32 mm in size); (b) volcanic lapilli (4-32 mm in size); and (3) volcanic ash, tuff if indurated (less than 4 mm in size). Composi-tionally, these pyroclastic rocks are described as vitric (glass), crystal, or lithic.
Clastic sediments of volcanic provenance are described in the same fashion as terrigenous sediments. Note is made of the dominant composition of the volcanic grains where possible.
SHIPBOARD X-RAY DIFFRACTION ANALYSIS To obtain further information about sediment composition,
splits of physical-properties samples were analyzed on the shipboard X-ray diffraction system for bulk and clay mineralogy. Splits of the physical properties samples were freeze-dried, then partitioned prior to carbonate bomb analysis, and used to prepare randomly oriented pressed powders. On each diffractogram, the peak areas of the quartz 3.36-A, calcite 3.06-A, feldspar 3.20-A, and clay mineral 4.50-A peaks were summed and set equal to 100%; relative mineral abundances were estimated from the rates of mineral peak area to total peak area. Other phases (e.g., pyrite, halite, etc.) were not included in this estimation. Oriented pastes were prepared for some samples and were analyzed qualitatively to identify the clay minerals present. Although
Figure 6. Classification scheme used for classification of terrigenous sediments and sedimentary rocks, Leg 104.
the estimates of mineral abundances obtained from the XRD data by this method are only relative and semi quantitative, they do provide a useful mechanism for comparing compositional changes downcore and between cores.
IGNEOUS ROCK DESCRIPTION The description of igneous rocks recovered during Leg 104
followed the recommended ODP format with minor modifications. The igneous core descriptions are graphically presented at the end of each site chapter. These visual core descriptions include graphic representation of the recovered rock, orientation, degree of alteration, and lithologic units. An example is shown in Figure 7.
Section identification information is entered at the top of each visual description form. Piece numbers, core diameters, and a graphic representation of the section are indicated on the left side of the form. A key to the graphic lithologies and textures used is shown in Figure 8. The graphic representation includes outlines and obvious features of the pieces (oxidation haloes, foliations, fractures, lineations, textures). Orientation of individual pieces is indicated with an arrow for pieces which are sufficiently large enough to not have overturned in the liner. Samples taken for shipboard studies are noted by their sample abbreviation at the corresponding interval: T for thin section, X for X-ray diffraction, P for physical properties, and M for pa-leomagnetic studies. The degree of alteration is graphically represented using the symbols shown in Figure 8.
Basalt Nomenclature Shipboard classification of basalts is based mainly on miner
alogy and texture. Texturally, basalts are described as aphanitic or phaneritic. Aphanitic basalts on a clean surface do not contain crystals visible to the eye, whereas phaneritic implies crystals are readily visible to the unaided eye. Generally, aphanitic, or fine-grained, basalts contain crystals <0.2 mm median size.
Phaneritic basalts are described in this volume as either medium- or coarse-grained. Medium-grained refers to a median crystal size from 0.2 to 1.0 mm. Coarse-grained, phaneritic basalts contain crystals visible to the unaided eye. They have a median diameter greater than 1.0 mm.
Basalts are also given modifiers to describe the abundance of phenocrysts, or megascopically visible crystals which stand out prominently from a finer-grained matrix (also possible micro-phenocrysts). Basalts are termed aphyric, sparsely phyric, moderately phyric, or highly phyric, depending on the proportion of phenocrysts.
Aphyric basalts contain less than 1% phenocrysts. For practical purposes, if one piece of basalt is found with a phenocryst or two in a section where all other pieces lack phenocrysts, and no other criteria such as grain size or texture distinguish this basalt from the others, then it is described as aphyric. A note of the rare phenocrysts is included in the general description. This approach enables us to restrict the number of lithologic units to those with clearly distinctive and persistent visible differences.
Sparsely phyric basalts are those with 1 % to 2% phenocrysts in almost every piece of a given core or section. Clearly contiguous pieces without phenocrysts are included in this category and the lack of phenocrysts is noted in the general description. Moderately phyric basalts contain 2 to 10% phenocrysts. Phyric basalts contain 10% to 20% phenocrysts. Highly phyric basalts are those with more than 20% phenocrysts.
The basalts are further classified by phenocryst type, and a modifying term precedes the terms phyric, sparsely phyric, etc. For example, a moderately plagioclase-olivine phyric basalt contains 2% to 10% phenocrysts, most of them olivine, but with some plagioclase; i.e., least-abundant phenocryst phase is listed first.
34

Figure 7. Core description form used for volcaniclastic sediments and sedimentary rocks, and igneous rocks.
SHIPBOARD SCIENTIFIC PARTY
SYMBOLS
ALTERATION
No discoloration (ol-fresh, plag-fresh, vesicles-unfilled)
Slightly altered (slightly discolored, vesicles filled or rimmed, ol-fresh, plag fresh)
Moderately altered (ol-altered, plag-fresh)
Strongly altered (complete discoloration, ol-gone, plag-gone)
Completely altered (begins to disaggregate)
DLOGY AND TEXTURES
Aphyric basalt to <2% phenocrysts
Vesicular basalt, > 10% vesicles
Olivine—plagioclase phyric basalt
Streaky basalt, flow fabric
Xenolith
M a
Chilled margin
Volcaniclastic rocks, tuff, and lapillistone
Breccia
Fractures
Weathered rind on rounded pieces
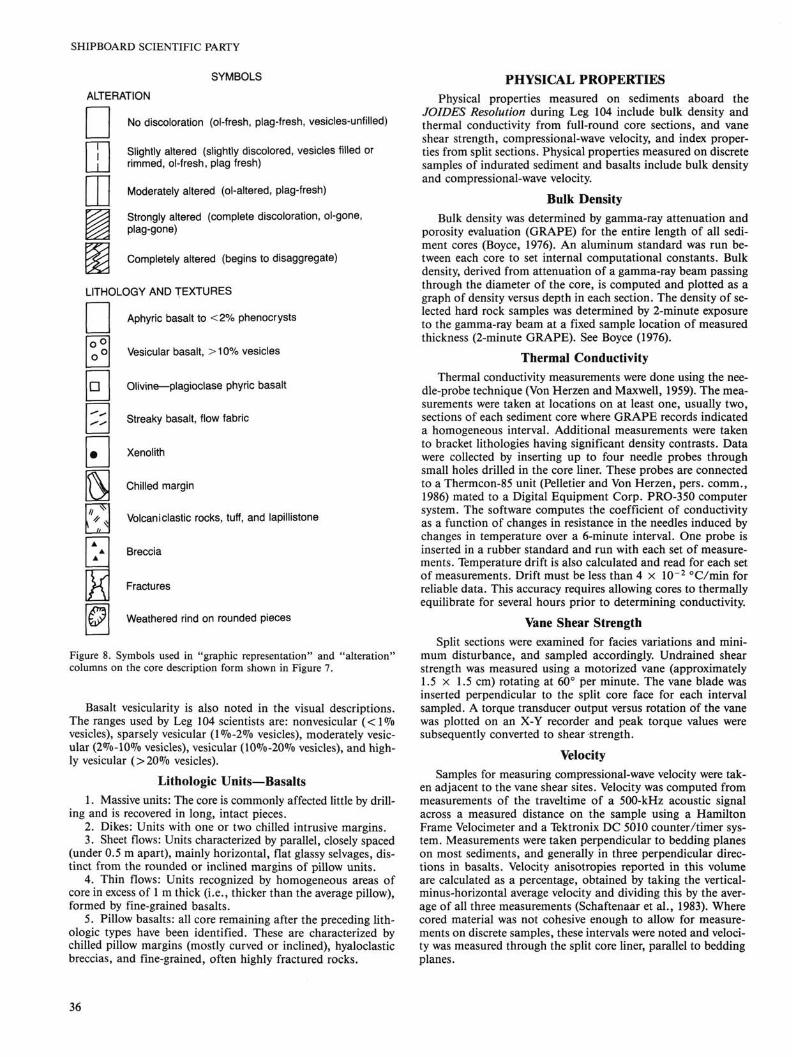
Figure 8. Symbols used in "graphic representation" and "alteration' columns on the core description form shown in Figure 7.
Basalt vesicularity is also noted in the visual descriptions. The ranges used by Leg 104 scientists are: nonvesicular ( < 1 % vesicles), sparsely vesicular (l°7o-2°7o vesicles), moderately vesicular (2^0-10% vesicles), vesicular (10%-20% vesicles), and highly vesicular (>20% vesicles).
Lithologic Units—Basalts 1. Massive units: The core is commonly affected little by drill
ing and is recovered in long, intact pieces. 2. Dikes: Units with one or two chilled intrusive margins. 3. Sheet flows: Units characterized by parallel, closely spaced
(under 0.5 m apart), mainly horizontal, flat glassy selvages, distinct from the rounded or inclined margins of pillow units.
4. Thin flows: Units recognized by homogeneous areas of core in excess of 1 m thick (i.e., thicker than the average pillow), formed by fine-grained basalts.
5. Pillow basalts: all core remaining after the preceding lithologic types have been identified. These are characterized by chilled pillow margins (mostly curved or inclined), hyaloclastic breccias, and fine-grained, often highly fractured rocks.
PHYSICAL PROPERTIES Physical properties measured on sediments aboard the
JOIDES Resolution during Leg 104 include bulk density and thermal conductivity from full-round core sections, and vane shear strength, compressional-wave velocity, and index properties from split sections. Physical properties measured on discrete samples of indurated sediment and basalts include bulk density and compressional-wave velocity.
Bulk Density Bulk density was determined by gamma-ray attenuation and
porosity evaluation (GRAPE) for the entire length of all sediment cores (Boyce, 1976). An aluminum standard was run between each core to set internal computational constants. Bulk density, derived from attenuation of a gamma-ray beam passing through the diameter of the core, is computed and plotted as a graph of density versus depth in each section. The density of selected hard rock samples was determined by 2-minute exposure to the gamma-ray beam at a fixed sample location of measured thickness (2-minute GRAPE). See Boyce (1976).
Thermal Conductivity Thermal conductivity measurements were done using the nee
dle-probe technique (Von Herzen and Maxwell, 1959). The measurements were taken at locations on at least one, usually two, sections of each sediment core where GRAPE records indicated a homogeneous interval. Additional measurements were taken to bracket lithologies having significant density contrasts. Data were collected by inserting up to four needle probes through small holes drilled in the core liner. These probes are connected to a Thermcon-85 unit (Pelletier and Von Herzen, pers. comm., 1986) mated to a Digital Equipment Corp. PRO-350 computer system. The software computes the coefficient of conductivity as a function of changes in resistance in the needles induced by changes in temperature over a 6-minute interval. One probe is inserted in a rubber standard and run with each set of measurements. Temperature drift is also calculated and read for each set of measurements. Drift must be less than 4 x 10~2 °C/min for reliable data. This accuracy requires allowing cores to thermally equilibrate for several hours prior to determining conductivity.
Vane Shear Strength Split sections were examined for facies variations and mini
mum disturbance, and sampled accordingly. Undrained shear strength was measured using a motorized vane (approximately 1.5 x 1.5 cm) rotating at 60° per minute. The vane blade was inserted perpendicular to the split core face for each interval sampled. A torque transducer output versus rotation of the vane was plotted on an X-Y recorder and peak torque values were subsequently converted to shear strength.
Velocity Samples for measuring compressional-wave velocity were tak
en adjacent to the vane shear sites. Velocity was computed from measurements of the traveltime of a 500-kHz acoustic signal across a measured distance on the sample using a Hamilton Frame Velocimeter and a Tektronix DC 5010 counter/timer system. Measurements were taken perpendicular to bedding planes on most sediments, and generally in three perpendicular directions in basalts. Velocity anisotropies reported in this volume are calculated as a percentage, obtained by taking the vertical-minus-horizontal average velocity and dividing this by the average of all three measurements (Schaftenaar et al., 1983). Where cored material was not cohesive enough to allow for measurements on discrete samples, these intervals were noted and velocity was measured through the split core liner, parallel to bedding planes.
36

EXPLANATORY NOTES
Index Properties Index properties (bulk and grain density, porosity, void ratio,
and water content) were measured gravimetrically on the same samples used for velocity analyses. Water contents are expressed as the percentage ratio of water to dry sample. Salt-corrected index properties were computed for all split core samples assuming a pore-water salinity of 35 %o. This salinity is in close agreement to values measured in the chemistry lab on interstitial water samples (see "Geochemistry" section, Chapter 4).. Sample weights were recorded from a triple-beam balance and sample volumes determined using a Penta-Pycnometer (Quantachrome Corp.) and helium as the purging gas. Dry weights and volumes were determined for all sediment samples after a minimum of 12 hours of freeze drying. The freeze-dried samples were stored in a dessicator and later crushed for determining percent carbonate by Carbonate Bomb method (Muller and Gastner, 1971). A split of the powdered sediment was also used for X-ray-diffraction analyses of bulk mineralogy.
BIOSTRATIGRAPHY
Introduction At the time that this volume goes to press, the biostratigra-
phy of Leg 104 sections is still in a preliminary form that only incorporates some post-cruise biostratigraphic data. Zonations of individual microfossil groups incorporate a variety of zonal schemes including: previously established Norwegian Sea zones published in the DSDP Leg 38 volume, North Pacific and Antarctic zones, and informal temporary zones. Zonal schemes for most microfossil groups (generally radiolarians, diatoms, silico-flagellates, pollen, and spores) will be revised for Volume B to establish new biostratigraphic zonations for the Norwegian Sea. These zonal schemes will be based on hole-to-hole comparisons of Leg 104 faunas and floras (not yet complete) and correlations with Leg 38 holes to provide maximum stratigraphic representation. More reliable interpretation of stratigraphy of Leg 104 sequences and inferences about the age and distribution of dis-conformities requires significant additional biostratigraphic studies to be incorporated in Volume B.
Abbreviations are used in the description of microfossil occurrences and datums as follows: LAD = last appearance datum, FAD = first appearance datum, and FC = first common occurrence.
Series/Subseries Boundaries The biostratigraphic events that have been chosen to define
Eocene-Pleistocene series and subseries boundaries are shown in Figure 9. Because of the high-latitude provincial microfossil assemblages encountered in Leg 104 recovery, these criteria do not conform to conventional standards. This composite scheme is consistent with the available paleomagnetic stratigraphy and represents our best approximation of the proper placement of these boundaries. Later revision may be required as our research on these diverse assemblages progresses.
Diatom Zonation The first diatom zonation for pre-Quaternary sediments of
the Norwegian Sea was established by Schrader and Fenner (1976). These authors found a diverse assemblage of diatoms in this region, but found difficulty in correlating Leg 38 Norwegian Sea sites with others outside the Norwegian Sea. This problem was caused to some extent by a domination of the assemblage by endemic species. A number of species that they encountered were previously noted elsewhere, particularly in the North Pacific. In spite of the presence of some North Pacific species, the assignment of absolute ages to Leg 38 sequences was not possible because the ranges of many of these species
Pliocene
Mio
cene
upper
middle
lower
Oligocene
Eoc
ene upper
middle
/ F .A . Neogloboquadrina pachyderma \ ( s i n . ) encrusted (planktonic foram.) / F .A . Thalassiosira oestrapii \ (d iatom)
.uncon fo rm i t y
/ F .A . Denticulopsis lauta \ (diatom)
/ L .0 . Discolithina enormis \(calcareous nannofossil) / L .0 . Areosphaendium multicornutum (dinocyst) \ L .0 . Cordosphaeridium funiculatum (dinocyst)
/ L . 0 . Rottnestia bornssica (dinocyst) \ L .0 . Eatonioysta ursulae (dinocyst)
Figure 9. Biostratigraphic events used to define Eocene-Pleistocene series and subseries boundaries, Leg 104.
were not yet correlated directly with the paleomagnetic record nor were they correlated indirectly through their relationship with standard lower latitude foraminifer and calcareous nannofossil zones. In addition, Schrader and Fenner (1976) had insufficient data regarding the potential diachroneity of "cosmopolitan" species with respect to their occurrences elsewhere.
Since the study by Schrader and Fenner (1976), a large number of Neogene sections have been studied for their diatom content (Barren, 1980, 1981, 1985a, and 1985b; Baldauf, 1984; Cie-sielski, 1983, 1985; Burckle, 1977, 1978; and many others). This wealth of relatively new data on the biostratigraphic ranges of diatoms from low to high latitudes has enabled Barron (1985b) to propose a standard Neogene diatom zonation for the mid- to high-latitude North Pacific. This zonation is based largely upon previous studies and zones by Koizumi (1973), Barron (1980, 1985b), and Schrader and Fenner (1976). These Neogene North Pacific diatom (NNPD) zones exhibit little diachroneity with latitude, are well constrained by paleomagnetic data, and are correlated with calcareous microfossil zonations.
The North Pacific diatom zonation is employed in these studies of Leg 104 sites. Where possible, correlations are also made with the Leg 81 (Rockall Plateau) zonal schemes of Baldauf (1984) and the Norwegian Sea zonation of Schrader and Fenner (1976). Correlations with Schrader and Fenner's zones should be considered only approximate. It is not possible to accurately define their zonal boundaries because of: (1) their use of multiple species datums (as many as eleven) to define zonal boundaries, (2) the rare and sporadic occurrence of some zonal indicators, and (3) the occasional use of the same species datum to define non-adjacent zonal boundaries.
Absolute ages referred to in the diatom stratigraphic sections are based upon direct correlations to magnetostratigraphy or are interpolated based upon the relative position of diatom datums to biostratigraphic datums of other microfossil groups. Diatom datum ages are from Koizumi (1977), Burckle and Trainer (1979), Burckle et al. (1982), Burckle (1972, 1978), Barron (1981, 1985b), and Ciesielski (1983, 1985). A summary of these datums and revisions of some ages based upon the new Chron 11-Anomaly 5 correlation are given in Barron et al. (1985).
The diatom biostratigraphy presented in this volume is largely based upon shipboard results. The short time available for post-cruise studies precludes the incorporation of subsequent studies into this volume. The stratigraphy presented for Holes 642B, 642C, and 642D of Site 642 is a composite stratigraphy of all three holes. Detailed studies of all three holes are far from
37

SHIPBOARD SCIENTIFIC PARTY
complete and prohibit presentation of an individual diatom stratigraphy for each hole. Post-cruise examinations of Holes 642B and 642C for diatoms and radiolarians reveal some differences in the stratigraphy of each hole, which are not discussed herein.
Silicoflagellate Zonation No single silicoflagellate zonation is employed for the Leg
104 Part A volume. The Neogene silicoflagellate zones used here are previously defined zones or revisions of zones (Ciesielski, 1975; Martini, 1971, 1972; and Busen and Wise, 1977) and are defined in the Site 642 Biostratigraphy section.
Post-cruise detailed examination of Hole 642C and 642D samples revealed a rich and highly diversified assemblage of silico-flagellates. The silicoflagellate biostratigraphy of these and other Leg 104 holes and the DSDP Leg 38 silicoflagellate biostratigraphy will be the basis of a much more detailed zonation that will be presented in Leg 104 Part B. Silicoflagellate biostrati-graphic procedures varied with each site and are discussed in each respective site chapter section.
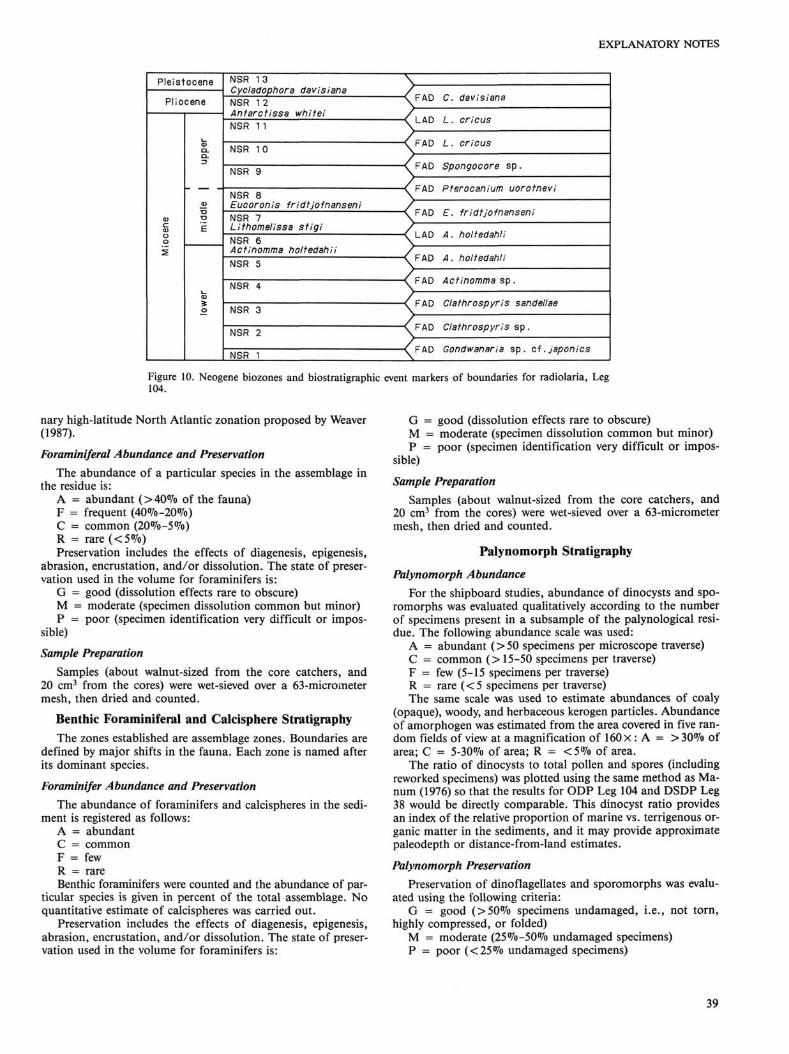
Radiolarian Biostratigraphy The scheme of biozones based on radiolarians that has been
applied to the Leg 104 recovery is provisional in nature at this time and differs markedly from the biozonation proposed by Bjrirklund (1976). Only three biozones (Lithomelissa stigi Bio-zone, Actinomma holtedahli Biozone, and Cycladophora davi-siana Biozone) of the original eight Neogene biozones have been retained without emendation. Additionally, the Antarctis-sa whitei Biozone as well as the Eucoronis fridtjofnanseni Biozone (Goll and Bjrirklund, 1980) have been employed with emended definitions. Eight new provisional biozones are proposed, but unnamed, and their definitions are presented informally. These new biozones and emendations are necessary because many of the biosiliceous sections recovered on Leg 104 were not previously cored on Leg 38, and it is now apparent that extensive biostratigraphic revision is required. Our investigations are only in a preliminary stage at the time of this writing, however, and our description of these new biozones is provisionally proposed here with the understanding that further revisions are necessary and formal description of new and emended biozones will be presented in the Leg 104 Part B volume.
In its present form, the Neogene radiolarian biozonation is composed of thirteen subdivisions, which are designated consecutively Norwegian Sea Radiolaria (NSR) 1-13. New biozones bear no other designation. The five biozones retained from Bjdrklund (1976) and Goll and Bjdrklund (1980) are designated both by their formal bioname and by a discrete number. All of the biozones and the biostratigraphic events that mark their boundaries are shown in Figure 10.
Abundance and Preservation Discussions of abundance of radiolarians in the Biostratigra
phy sections of the site chapters are based on slides of sieved, acid residues, and consequently they may differ markedly from the lithologic descriptions, which are based on smear slides. Our abundance estimates are completely qualitative, and are based on visual approximations of the total volume of processed residue and the relative frequency of radiolarians in each residue. Based on our long experience with these observations, we suggest that our abundance terms have the following range of absolute frequency:
A (abundant) = > 50,000 specimens/gram C (common) = 10,000-49,000 specimens/gram F (few) = 1000-9000 specimens/gram T (trace) = < 1000 specimens/gram The quality of radiolarians preservation in Leg 104 recovery
ranged from poor to good. Degraded preservation was largely a
result of dissolution effects. There is little evidence of corrosion pitting of metallic coating. Preservation is defined as:
G (good) = a majority of whole specimens with spines intact and normal index of refractions
M (moderate) = many broken specimens, or opal with high index of refraction
P (poor) = mostly broken fragments or specimens lacking all delicate lattice components. Sample Preparation
Radiolarians were studied from the coarse fraction components (>44 /mi). As a standard procedure the samples were boiled in H202, sieved, treated with HC1, and then with ultrasound for about 5 seconds (repeated several times if the sediment was tough to disintegrate), and sieved. An aliquot of the suspendable part of the residue was mounted on a slide in Canada balsam.
Calcareous Nannofossil Biostratigraphy
Nannofossil Zonation The standard nannofossil zonation of Martini (1971) was fol
lowed to some extent, but owing to the absence of many marker species, various zones had to be combined into longer ranging zones. Thus, the biostratigraphic resolution of the nannofossils in the Norwegian Sea is poor. The nannofossil assemblages presented here are similar to those compiled in DSDP Leg 38 (Miil-ler, 1976) with the exception of the interval with Cyclococcolith-us floridanus, which is presented here.
Nannofossil Abundance and Preservation Abundance of nannofossils was based on the method de
scribed by Hay (1970), using a magnification of 1000 x . The abundances reported follow the format:
A = abundant (1 to 10 species per field of view) C = common (1 specimen per 2 to 10 fields of view) F = few (1 specimen per 11 to 100 fields of view) R = rare (1 specimen per 101 to 1000 fields of view) The state of nannofossil preservation was designated as fol
lows: G = good (little or no evidence of overgrowth and/or etch
ing of specimen). M = moderate (some degree of overgrowth and/or etching,
but identification generally not impaired). P = poor (substantial overgrowth and/or etching, identifi
cation of specimens is difficult but still possible). Sample Preparation
Samples from sediment-bearing cores were prepared for smear slides and studied with the light-microscope. Selected upper Pleistocene samples were also prepared for scanning electron microscope (SEM) examination by ultrasonic treatment and suspension settling techniques.
Planktonic Foraminiferal Stratigraphy
Planktonic Foraminiferal Zonation A general absence of any marker species identified in the
standard low-latitude planktonic zonation schemes prohibits the application of standard zones (Blow, 1969; Kennett, 1973: Ken-nett and Srinivasan, 1983). A preliminary informal zonation mainly based on Neogloboquadrinids has been established to suit correlation purposes within this volume. Six zones have been defined: Norwegian Sea Planktonic Foraminiferal Zones (NSPF) 1 to 6 where NSPF 1-2 are from the Paleogene, while NPSF 3-6 are Neogene-Quaternary. Some datums defining zone boundaries within this informal scheme are also recognizable in the prelimi-
38
EXPLANATORY NOTES
Pleistocene
Pliocene
Mio
cene
i m
iddl
e |
uppe
r lo
wer
NSR 13 Cycladophora davisiana NSR 12 Antarctissa whitei NSR 1 1
NSR 10
NSR 9
NSR 8 Eucoronis fridtjofnanseni NSR 7 Lithomelissa stigi NSR 6 Actinomma holtedahii NSR 5
NSR 4
NSR 3
NSR 2
NSR 1
\ _ / C FAD
/ < FAD
/ \ F A D / /
■ C FAD / /
/ < FAD
C. davisiana
L . cricus
L . cricus
Spongocore sp .
Pterocanium uorotnevi
E. fridtjofnanseni
A. holtedahii
A. holtedahii
Actinomma sp .
Clathrospyris sandellae
Clathrospyris sp .
Gondwanaria sp . cf.japon cs
Figure 10. Neogene biozones and biostratigraphic event markers of boundaries for radiolaria, Leg 104.
nary high-latitude North Atlantic zonation proposed by Weaver (1987).
Foraminiferal Abundance and Preservation The abundance of a particular species in the assemblage in
the residue is: A = abundant (>40% of the fauna) F = frequent (40%-20%) C = common (20%-5%) R = rare (<5%) Preservation includes the effects of diagenesis, epigenesis,
abrasion, encrustation, and/or dissolution. The state of preservation used in the volume for foraminifers is:
G = good (dissolution effects rare to obscure) M = moderate (specimen dissolution common but minor) P = poor (specimen identification very difficult or impos
sible)
Sample Preparation Samples (about walnut-sized from the core catchers, and
20 cm3 from the cores) were wet-sieved over a 63-micrometer mesh, then dried and counted.
Benthic Foraminiferal and Calcisphere Stratigraphy The zones established are assemblage zones. Boundaries are
defined by major shifts in the fauna. Each zone is named after its dominant species.
Foraminifer Abundance and Preservation The abundance of foraminifers and calcispheres in the sedi
ment is registered as follows: A = abundant C = common F = few R = rare Benthic foraminifers were counted and the abundance of par
ticular species is given in percent of the total assemblage. No quantitative estimate of calcispheres was carried out.
Preservation includes the effects of diagenesis, epigenesis, abrasion, encrustation, and/or dissolution. The state of preservation used in the volume for foraminifers is:
G = good (dissolution effects rare to obscure) M = moderate (specimen dissolution common but minor) P = poor (specimen identification very difficult or impos
sible)
Sample Preparation Samples (about walnut-sized from the core catchers, and
20 cm3 from the cores) were wet-sieved over a 63-micrometer mesh, then dried and counted.
Palynomorph Stratigraphy
Palynomorph Abundance For the shipboard studies, abundance of dinocysts and spo-
romorphs was evaluated qualitatively according to the number of specimens present in a subsample of the palynological residue. The following abundance scale was used:
A = abundant (>50 specimens per microscope traverse) C = common (> 15-50 specimens per traverse) F = few (5-15 specimens per traverse) R = rare (< 5 specimens per traverse) The same scale was used to estimate abundances of coaly
(opaque), woody, and herbaceous kerogen particles. Abundance of amorphogen was estimated from the area covered in five random fields of view at a magnification of 160 x : A = > 30% of area; C = 5-30% of area; R = < 5 % of area.
The ratio of dinocysts to total pollen and spores (including reworked specimens) was plotted using the same method as Ma-num (1976) so that the results for ODP Leg 104 and DSDP Leg 38 would be directly comparable. This dinocyst ratio provides an index of the relative proportion of marine vs. terrigenous organic matter in the sediments, and it may provide approximate paleodepth or distance-from-land estimates.
Palynomorph Preservation Preservation of dinoflagellates and sporomorphs was evalu
ated using the following criteria: G = good (>50% specimens undamaged, i.e., not torn,
highly compressed, or folded) M = moderate (25%-50% undamaged specimens) P = poor (<25% undamaged specimens)
39

SHIPBOARD SCIENTIFIC PARTY
Palynomorph Zonation
Informal palynozones were delimited, based primarily on the stratigraphic ranges of well-known Neogene North Atlantic di-nocysts (Williams, 1977; Harland, 1979; Edwards, 1984; Mudie and Vilks, in press) and on the concurrent ranges of diagnostic Paleogene species (Manum, 1976; Drugg and Stover, 1977; Williams, 1977; Costa and Downie, 1979; Elde, 1985; Brown and Downie, 1984). These dinocyst ages are supported by pollen and spore ages documented by Koreneva et al. (1976) for Leg 38 and by correlation with data from Neogene stratotypes (Sue and Zag-wijn, 1983). Informal names are assigned to the palynomorph zones, based on either the most important range zone (RZ) or concurrent range zone (CRZ) taxa, or on species that have well-defined acme zones (AZ). It must be clearly recognized, however, that these zonations are provisional and of a tentative nature only—they are not proposed here as formal biostratigraph-ic units but are merely convenient labels for cross-correlating similar biofacies at the three sites drilled during Leg 104.
Sample Preparation Dinocysts (dinoflagellate cysts), pollen and spores were ex
amined microscopically in core-catcher samples and from selected sediment samples during Leg 104. All samples (10 cm3) were processed on the ship, using hot 1% Calgon solution for sediment disaggregation, sieving through 150- and 10-/xm meshes to remove coarse sediments and clays. Samples were also chemically treated with hot 50% HC1, cold 52% HF and cold 5% NaClO-50% HC1 mixture to remove carbonates, silicates, and lignins, respectively. Estimates of dinocyst and sporomorph (pollen and spores) concentrations (number per cm3 wet sediment) were obtained by adding Eucalyptus tablets containing a known number of pollen grains (27,510 ±420) to each sample.
PALEOMAGNETISM Paleomagnetic studies done during Leg 104 consist of mea
surements of natural remanent magnetization using the new pass-through cryogenic magnetometer for full-length, split-core sections, and the Molspin spinner magnetometer for 6-cm3 discrete samples.
The pass-through cryogenic magnetometer is equipped with a three-axis alternating demagnetization (AF) unit and a magnetic susceptibility meter mounted along the track. The entire operation including multiple-step AF demagnetization is under direct control of a PRO-350 minicomputer. However, AF-de-magnetization was not applied, as it was considered important to provide shore-based studies of sample material which was unaffected by potentially disturbing effects. The susceptibility meter could not be operated together with the cryogenic magnetometer owing to interference. Preliminary pass-throughs of whole-round sections showed that the intensities exceeded the sensor capabilities. Therefore, all results from the pass-through system refer to split-core sections.
Discrete samples were obtained from every section containing undisturbed sediments or basement rocks. In very soft material, oriented samples were taken by pressing plastic boxes (6-cm3 internal volume) into the sediment with one set of the sides maintained parallel to the axis of the core. In some semi-indurated sediments, an oriented cube was cut out of the sediment using an aluminum knife. Systematic AF-demagnetization of samples was performed onshore on the majority of samples taken, and results are presented in this volume.
Practically all basalt samples were measured on 7-cm3 cubes cut for density and velocity analyses. All cubes were inscribed with an arrow for vertical orientation and were returned to the working half following measurements. An average of one sample per section was measured, and a significant number of these were subsequently used for petrologic thin sections.
All basalt samples were tested at 0- and 50-Oe demagnetized states. Some sections were passed through the cryogenic magnetometer to check on the polarity. Also, whole pieces from the working core were occasionally measured for polarity where the material was too fragile (mostly tuffs and breccias) for cubes to be cut, or where the orientation of core pieces was in doubt. Polarity determinations were performed with the help of the Schon-stedt digital magnetometer placed within the shield of the Schon-stedt demagnetizer equipment. Ten apparently normal polarity samples could be related to misoriented core pieces. The proper orientation was verified by visual inspection and the orientation corrected accordingly.
Remanences were measured using the Molspin magnetometer and the Schonstedt demagnetizer. For calibration a standard (with the label 754 mA/m) was used. We accepted its magnetic moment as 970 x 10~5 emu. Remanence values were corrected for the actual volume.
Susceptibility values were determined with the Bartington MSI susceptibility meter using the high-frequency signal (the frequency is not given; however, test measurements showed only small differences between high- and low-frequency values). Unfortunately, the instrument manual has an inconsistency with respect to the digital output values in either SI or the emu units. We have, for the time being, accepted the output in emu (measured value x 10"6 G/Oe) and furthermore, accepted the calibration standard of 312 x 10~6 G/Oe. Subsequently, a volume correction for the effective sample volume was applied. Both susceptibility and remanence calibrations will be tested onshore.
A total of 89 samples were AF-cleaned in fields up to 1000 Oe to verify the primary polarity of samples, to arrive at stable inclination values and to test for multicomponent magnetizations in the samples.
In cases where during stepwise cleaning operation a steepening of reverse inclination angles was observed, followed by shallower angles at higher fields, the steepest angle has been reported. In those cases vector analyses performed after the cruise will help to define inclination values for the different magnetization components. N or R notations were used when no angle was obvious, and no character was noted when even the polarity was in doubt.
GEOCHEMISTRY The organic geochemistry program for ODP Leg 104 includ
ed (1) measurement of hydrocarbon gases, (2) determination of organic and inorganic carbon, (3) characterization of the organic matter by Rock-Eval pyrolysis, and (4) analysis of interstitial water for pH, alkalinity, salinity, sulfate, chlorinity, calcium, and magnesium. Samples for geochemical studies were generally recovered from every third core in the lower stratigraphic sections, and at more frequent intervals in the upper section.
Hydrocarbon Gases Gas was extracted from sediment samples by means of a head-
space technique modified after Bernard et al. (1978) and Kven-volden and Redden (1980). In this procedure, a sample of core (5-cm long, full round) was placed in a 1-pint can that had previously been prepared with septa-covered sampling ports. To the can was added sufficient degassed water so that a 100-cm3 head-space was established. The can was sealed, and the headspace was purged with helium. The sample container was agitated for 10 min on a paint can shaker to partition gases into the helium-filled headspace. A 5-mL sample of this headspace was withdrawn, and 0.25 mL of the gas mixture was analyzed on a Hewlett-Packard (H-P)-820 natural gas analyzer, a special option of one H-P 5890A gas chromatograph. This option employs three columns (DC-200, Poropak Q, and Molecular Sieve BX) and appropriate valve switching to separate the hydrocarbon gases from methane to hexane.
40
EXPLANATORY NOTES
Where gas packets formed within the core liner, the gas was sampled by means of vacutainers. Because of the high methane concentrations, the gas was analyzed on a second H-P 5890A gas chromatograph equipped with a 3.2-mm x 3.7-mm Poro-pak Q column and a thermal conductivity detector. A typical injection volume was 0.2 mL.
Elemental Analysis Shipboard organic carbon and total carbon analyses were
done using a Perkin-Elmer 240C Elemental Analyzer. For the direct determination of organic carbon, portions of acidified sediment from carbonate analyses were washed with deionized water and dried at 35°C. Samples containing about 15 mg of sediment were weighed on a Cahn Electrobalance for elemental analysis. Samples were combusted at 1000°C in the presence of oxygen, and the volumes of the evolved gases determined as measures of the C, H, and N contents of sediment organic matter. Concentrations were determined by the Perkin-Elmer 3600 Data Station and compared with those of known standards. Neither hydrogen or nitrogen results were reproducible nor realistic, and therefore are not reported. Organic carbon values are reported on a dry sediment weight basis. Total carbon was determined in a like manner except that the sediment samples were not acidified. Total carbon was used to calculate organic carbon by taking the difference between total carbon and carbonate carbon.
Carbonate Carbon Carbonate carbon was determined by the "Karbonat Bom-
be" technique (Muller and Gastner, 1971) and by means of the Coulometrics 5030 Carbonate Carbon apparatus. In the carbonate bomb method 1 g of dried powdered sediment was caused to react with HC1 in a closed container. The resulting C0 2 pressure is proportional to the carbonate content of the sample. The percentage error can be as low as 1 % for a sample high in carbonate content, and an overall accuracy is usually 2% to 5%. With the Carbonate Carbon apparatus, about 250 mg of dried, powdered sediment, was gently heated and reacted with HC1. The resulting C0 2 was transferred to a coulometer with ethanelamine as the indicator solution. The C0 2 was converted to a strong acid and the changing color of the solution was monitored. The results are reported in /xg C and %CaC03 . Carbonate carbon values from the carbonate bomb and the coulometer were similar except that the coulometer was more sensitive.
Rock-Eval Procedure The source character and maturity of organic matter in se
lected sediment samples were determined with the shipboard Del-si Nermag Rock-Eval II pyrolysis instrument. About 100 mg of nonacidified, coarsely ground dried sediment was heated from 250°C to 550°C at a rate of 25°C/min. Gases released during this heating were carried off in a helium stream, which was split into two parts. One part was directed through a flame ioniza-tion detector to monitor hydrocarbons; the other passed through a C0 2 trap from which the total amount of evolved C0 2 was released at the end of the heating program to be measured by a thermal conductivity detector.
This pyrolysis procedure yields four parameters that characterize the organic matter in a sample (Tissot and Welte, 1984):
1. Area of peak S1} which corresponds to the quantity of free hydrocarbons present in the sample.
2. Area of peak S2, which corresponds to the quantity of hydrocarbons released by pyrolysis of kerogen up to 550°C.
3. Temperature, Tmax, of the top of peak S2, which is related to the maturity of the organic matter.
4. Area of peak S3, which corresponds to the C 0 2 released from pyrolysis of kerogen and is a measure of the amount of oxygen in the kerogen matrix.
From S2, S3, and the organic carbon concentration, the hydrogen index (HI) and oxygen index (OI) can be calculated and used to determine kerogen source, character, and maturity.
Interstitial Waters Interstitial waters were routinely analyzed for pH, alkalinity,
salinity, sulfate, chlorinity, calcium, and magnesium. The method of obtaining interstitial waters from the sediment, using a stainless steel press, was described in detail by Manheim and Sayles (1974). In essence, 10-cm-long, full-round sediment core samples for interstitial water analyses were collected every third core of sediment. The sediment was extruded from the core liner, the outer layer of the sediment was removed by scraping with a spatula, and the sample was placed in a Carver Laboratory Hydraulic Press for removal of interstitial water. The press was operated to a pressure of about 30,000 psi. The sediment sample remained under pressure until water could no longer be squeezed from it. Interstitial water was collected in 50-mL syringes and filtered through a 0.45-/mi Millipore filter. If more than 50 mL of pore water was obtained, the samples were combined. If squeezing of the sample was not possible upon core retrieval, the sediment sample was capped, wrapped in plastic, and placed in a refrigerator until processing could be done. IAPSO standard seawater was the primary standard for the water analysis on board ship.
Individual inorganic parameters were analyzed according to procedures outlined by Gieskes and Peretsman (1985). Alkalinity and pH were determined by using a Brinkmann 650 pH meter coupled with a Brinkmann-655 Dosimat. The pH value of the sample was calibrated with 4.01, 6.86, and 7.41 buffer standards; readings were in millivolts and then converted to pH. The pH measurements were made immediately prior to the alkalinity measurements. The 5-10-mL interstitial water sample, after being tested for pH, was titrated with 0.1 nHCl as a potentiomet-ric titration (Gieskes, 1973).
Salinity was determined by means of a hand held AO refrac-tometer that measures the total dissolved solids. Sayles et al. (1970) found that this "salinity" agreed well with their measured ion sums.
Chlorinity was determined by titrating with silver nitrate 0.1 mL of sample diluted with 5 mL of deionized water. The Mohr titration used potassium chromate as an indicator.
Sulfate was quantified using a Dionex 2120 ion chromatograph. Calcium was determined by complexometric titration of a 0.5-mL sample with EGTA using GHA as an indicator. To enhance the determination of the endpoint, the calcium-GHA complex was extracted into a layer of butanol (Gieskes, 1973). No correction was made for strontium, which is also included in the result.
Magnesium was determined by EDTA titration for total alkaline earths (Gieskes, 1973). Subsequent subtraction of the calcium value (also including strontium) yielded the magnesium concentration in the interstitial water sample.
REFERENCES Baldauf, J. G., 1984. Cenozoic diatom biostratigraphy and paleocean-
ography of the Rockall Plateau Region, North Atlantic, Deep Sea Drilling Project Leg 81. In Roberts, D. G., Schnitker, D., et al., Init. Repts. DSDP, 81: Washington (U.S. Govt. Printing Office), 439-478.
Barron, J. A., 1980. Lower Miocene to Quaternary diatom biostratigraphy of Leg 57, off Northeastern Japan, Deep Sea Drilling Project. In Langseth, M., Okada, H., et al., Init. Repts. DSDP, 56, 57, Pt. 2: Washington (U.S. Govt. Printing Office), 641-685.
41

SHIPBOARD SCIENTIFIC PARTY
, 1981. Late Cenozoic diatom biostratigraphy and paleocean-ography of the middle-latitude eastern North Pacific, DSDP Leg 63. In Yeats, R. S., Haq, B. U , et al., Init. Repts. DSDP, 63: Washington (U.S. Govt. Printing Office), 507-538.
, 1985a. Miocene to Holocene planktonic diatoms. In Bolli, H. M., Saunders, J. B., and Perch-Nielsen, K., (Eds.), Plankton Stratigraphy: Cambridge (Cambridge Univ. Press), 763-810.
, 1985b. Late Eocene diatom biostratigraphy of the equatorial Pacific Ocean, DSDP Leg 85. In Mayer, L., Theyer, E , et al., Init. Repts. DSDP, 85: Washington (U.S. Govt. Printing Office), 413-456.
Barron, J. A., Keller, G., and Dunn, D. A., 1985. A multiple microfos-sil biochronology for the Miocene. Geol. Soc. Am. Mem, 163: 21-36.
Bernard, B. B., Brooks, J. M., and Sackett, W N., 1978. Light hydrocarbons in recent Texas continental shelf and slope sediments. J. Geo-phys. Res., 83:4053-4061.
Bjdrklund, K. R., 1976. Radiolaria from the Norwegian Sea, Leg 38 of the Deep Sea Drilling Project. In Talwani, M., Udintsev, G., et al., Init. Repts. DSDP, 38: Washington (U.S. Govt. Printing Office), 1101-1168.
Blow, W. H., 1969. Late middle Eocene to Recent Planktonic foraminif-eral biostratigraphy. In Bronnimann, P., and Renz, H. H. (Eds.), Proc, First Int. Conf. Planktonic Microfossils, Geneva, 1967, 1: 199-421.
Boyce, R. E., 1976. Definitions and laboratory techniques of compres-sional sound velocity parameters and wet-water content, wet-bulk density, and porosity parameters by gravimetric and gamma ray attenuation techniques. In Schlanger, S. O., Jackson, E. D., et al., Init. Repts. DSDP, 33: Washington (U.S. Govt. Printing Office), 931-958.
Brown, S., and Downie, C , 1984. Dinoflagellate cyst biostratigraphy of late Paleocene and early Eocene sediments from Holes 552, 553A, and 555, Deep Sea Drilling Project Leg 81, (Rockall Plateau). In Roberts, D. G , Schnitker, D., et al., Init. Repts. DSDP, 81: Washington (U.S. Govt. Printing Office), 565-580.
Burckle, L. H., 1972. Late Cenozoic planktonic diatom zones from the eastern equatorial Pacific. Nova Hedw., Beihft., 39:217-250.
, 1977. Pliocene and Pleistocene diatom datum levels from the equatorial Pacific. Quat. Res., 7: 330-340.
, 1978. Early Miocene to Pliocene diatom datum levels for the equatorial Pacific. In Proc, Second Working Group Meeting, Bio-stratigraphic Datum-Planes of the Pacific Neogene, IGCP Project 114: Republic of Indonesia Ministry of Mines and Energy, Directorate General of Mine, Geological Research and Development Center, Spec. Publ., 1:25-44.
Burckle, L. H., Keigwin, L. D., and Opdyke, N. D., 1982. Middle and late Miocene stable isotope stratigraphy: Correlation to the paleo-magnetic reversal record. Micropaleontology, 28(4):329-334.
Burckle, L. H., and Trainer, J., 1979. Middle and late Pliocene diatom datum levels from the central Pacific. Micropaleontology, 25(3): 281-293.
Busen, K. E., and Wise, S. W., Jr., 1977. Silicoflagellate stratigraphy, Deep Sea Drilling Project, Leg 36. In Barker, P. E, Dalziel, I. W D., et al., Init. Repts. DSDP, 36: Washington (U.S. Govt. Printing Office), 697-743.
Ciesielski, P. E, 1975. Biostratigraphy and paleoecology of Neogene and Oligocene silicoflagellates from cores recovered during Antarctic Leg 28, Deep Sea Drilling Project. In Hays, D. E., Frakes, L. A., et al., Init. Repts. DSDP, 28: Washington (U.S. Govt. Printing Office), 625-691.
, 1983. The Neogene and Quaternary diatom biostratigraphy of subantarctic sediments, Deep Sea Drilling Project Leg 71. In Lud-wig, W. J., Krasheninnikov, V. A., et al., Init. Repts. DSDP, 71, Pt. 2: Washington (U.S. Govt. Printing Office), 635-665.
, 1985. Middle Miocene to Quaternary diatom biostratigraphy of Deep Sea Drilling Project site 594, Chatham Rise, southwest Pacific. In Kennett, J. P., von der Borch, C. L., et al., Init Repts. DSDP, 90: Washington (U.S. Govt. Printing Office), 865-885.
Costa, L. I., and Downie, C , 1979. Cenozoic dinocyst stratigraphy of Sites 403 to 406 (Rockall Plateau), IOPD, Leg 48. In Montadert, L., Roberts, D. G., et al., Init. Repts. DSDP, 48: Washington (U.S. Govt. Printing Office), 513-529.
Drugg, W.S., and Stover, L. E., 1977. Stratigraphic range charts for selected Cenozoic dinoflagellates. Am. Assoc. Stratig. Palynol. Con-trib. Ser. no. 4, 73-91.
Edwards, L. E., 1984. Miocene dinocysts from Deep Sea Drilling Project Leg 81, Rockall Plateau, eastern North Atlantic Ocean. In Roberts, D. G., Schnitker, D., et al., Init. Repts. DSDP, 81: Washington (U.S. Govt. Printing Office), 581-594.
Elde, T , 1985. Dinoflagellatfloraen i ovre Eocen I DSDP 338, Vdring-plataet [Cand. scient. dissert.]. University of Oslo, Norway.
Fisher, R. V., and Schmincke, H. U , 1984. Pyroclastic Rocks: New York (Springer-Verlag).
Gealy, J. M., Winterer, E. L., and Moberly, R., 1971. Methods, conventions and general observations. In Winterer, E. L., Riedel, W. R., et al., Init. Repts. DSDP, 7, Pt. 1: Washington (U.S. Govt. Printing Office), 9-26.
Gieskes, J. M., 1973. Interstitial water studies, Leg 15. Alkalinity, pH, Mg, Ca, Si, P 0 4 , and NH4. In Heezen, B. C , MacGregor, I. D., et al., Init. Repts. DSDP, 20: Washington (U.S. Govt. Printing Office) 813-829.
Gieskes, J. M., and Peretsman, G., 1985. Water chemistry procedures on the SEDCO 471—some comments. Ocean Drilling Program Technical Note No. 5.
Goll, R. M., and Bjrfrklund, K. R., 1980. The evolution of Eucoronis fridtjofnanseni, n. sp. and its application to the Neogene biostratigraphy of the Norwegian-Greenland Sea. Micropaleontology, 26: 356-371.
Harland, R., 1979. Dinoflagellate biostratigraphy of Neogene and Quaternary sediments at Holes 400/400A in the Bay of Biscay (Deep Sea Drilling Project Leg 48). In Montadert, L., Roberts, D. G , et al., Init. Repts. DSDP, 48: Washington (U.S. Govt. Printing Office), 531-545.
Hay, W. W., 1970. Calcareous nannofossils from cores recovered on Leg 4. In Bader, R. G., Gerard, R. D., et al., Init. Repts. DSDP, 4: Washington (U.S. Govt. Printing Office), 455-502.
Kennett, J. P., 1973. Middle and late Cenozoic planktonic foraminiferal biostratigraphy of the southwest Pacific—DSDP Leg 21. In Burns, R. E., Andrews, J. E., et al., Init. Repts. DSDP, 21: Washington (U.S. Govt. Printing Office), 575-640.
Kennett, J. P., and Srinivasan, M. S., 1983. Neogene Planktonic Fora-minifera: a Phylogenetic Atlas: Stroudsburg, PA (Hutchinson Ross).
Koizumi, I., 1973. The late Cenozoic diatoms of Sites 183-193, Leg 19 Deep Sea Drilling Project. In Creager, J. S., Scholl, D. W., et al., Init. Repts. DSDP, 19: Washington (U.S. Govt. Printing Office), 805-855.
, 1977. Diatom biostratigraphy in the North Pacific region. In: Proc, First Int. Congress, Pacific Neogene Stratigraphy, Tokyo, 1976, Kaiyo Shuppan Co., Ltd., 1976, 235-253.
Koreneva, E. V., Zaklinskaya, E. D., Bratseva, G. M., and Kartashova, G. G , 1976. Palynology studies of Sites 336, 338, 346, and 348, DSDP Leg 38. In Talwani, M., Udintsev, G., et al., Init. Repts. DSDP, 38: Washington (U.S. Govt. Printing Office), 1169-1193.
Kvenvolden, K. A., and Redden, G. D., 1980. Hydrocarbon gas in sediment from the shelf, slope, and basin of the Bering Sea. Geochim. Cosmochim. Acta, 44:1145-1150.
Manheim, F. T , and Sayles, E L., 1974. Composition and origin of interstitial waters of marine sediments based on deep sea drill cores, In Goldberg, E. D., (Ed.), The Sea, Vol. 5: New York (Wiley-Intersci-ence), 527-568.
Manum, S. B., 1976. Dinocysts in Tertiary Norwegian-Greenland Sea sediments (DSDP Leg 38), with observations on palynomorphs and palynodebris in relation to environment. In Talwani, M., Udintsev, G., et al., Init. Repts. DSDP, 38: Washington (U.S. Govt. Printing Office), 897-919.
Martini, E., 1971. Standard Tertiary and Quaternary Calcareous Nanno-plankton Zonation. Proc. Second Plankt. Conf, Rome, 1970, vol. 2, 739-785.
, 1972. Silicoflagellate zones in the late Oligocene and early Miocene of Europe. Senckenbergiana Lethaea, 53:119-122.
Matthews, D. J., 1939. Tables of velocity of sound in pure water and in seawater: London (Admiralty, Hydrogr. Dept.).
Mudie, P. J. and Vilks, G., in press. The biostratigraphic correlation and biochronology. In: Keen, M. S. and Williams, G. L. (Eds.), Ge-
42

EXPLANATORY NOTES
ology of the continental margin off eastern Canada, Geol. Can., 2: 6-8.
Miiller, C , 1976. Tertiary and Quaternary calcareous nannoplankton in the Norwegian-Greenland Sea, DSDP Leg 38. In Talwani, M., Udint-sev, G., et al., Init. Repts. DSDP, 38: Washington (U. S. Govt. Printing Office), 823-841.
Miiller, G., and Gastner, M., 1971. The "Karbonat-Bombe," a simple device for determination of the carbonate content in sediments, soils and other materials. Neues. Jahrb. Mineral. Monatash., 10:466-469.
Sayles, F. L., Manheim, F. T , and Chan, K. M., 1970. Interstitial water studies on small core samples, Leg 4. In Bader, R. G., Gerard, R. D., et al., Init. Repts. DSDP, 4: Washington (U.S. Govt. Printing Office), 401-414.
Schaftenaar, C. H., Moore, R. P., and Carlson, R. L., 1983. Summary of shipboard physical properties of mudstones, carbonates, and clastic sediments, Deep Sea Drilling Project, Leg 72. In Barker, P. F , Carlson, R. L., Johnson, D. A., et al., Init. Repts. DSDP, 72: Washington (U.S. Govt. Printing Office), 551-564.
Schrader, H. J., and Fenner, J., 1976. Norwegian diatom biostratigraphy and taxonomy. In Talwani, M., Udintsev, G , et al., Init. Repts. DSDP, 38: Washington (U.S. Govt. Printing Office), 921-1099.
Sue, J-R, and Zagwijn, W. H., 1983. Plio-Pleistocene correlations between the northwestern Mediterranean region and northwestern Europe according to recent biostratigraphic and paleoclimatic data. Boreas 12:153-166.
Tissot, B. P., and Welte, D. H., 1984. Petroleum Formation and Occurrence: Berlin (Springer-Verlag).
Von Herzen, R. P., and Maxwell, A. E., 1959. The measurement of thermal conductivity of deep-sea sediments by a needle-probe method. /. Geophys. Res., 64:1557-1563.
Weaver, P. P. E., 1987. Late Miocene to Recent planktonic foraminifers from the North Atlantic: Deep Sea Drilling Project Leg 94. In Kidd R. B., Ruddiman, W. F , et al., Init. Repts. DSDP, 94, Pt. 2: Washington (U.S. Govt. Printing Office), 703-727.
Wentworth, C. K., 1922. A scale of grade and class terms of clastic sediment J. Geol., 30:377-390.
Williams, G. L., 1977. Dinocysts: their classification, biostratigraphy and paleoecology. In Ramsey, A. T. S. (Ed.), Oceanic Micropaleontolo-gy, 2:1231-1325.
43