2 Modern Techniques in Geography - Keralascert.kerala.gov.in/images/text_books/chapter 2.pdf · 2...
16
Modern Techniques in Geography 2 2 MODERN TECHNIQUES IN GEOGRAPHY Our ancestors used to collect information about the earth's surface of their nearby areas by climbing up trees and mountain tops. Such collection of information helped them in gathering food and protecting themselves from enemies. When the need arose to understand more about the earth they used to travel for collecting information about different regions and convert the information into maps. Maps were constructed in this manner during olden days and it used to take a long time for the collection of information and preparation of maps. It was not possible to collect information about isolated and inaccessible regions. Collection of information and the analysis of information are two major activities of the map making process. With the development of technology, these became faster. Moreover, it became possible to obtain information about places where we couldn't reach easily. As computers began to be used for the analysis of information collected through various means and to illustrate them in maps, geographical studies achieved more efficiency. Let us know more about these geographic techniques which help in the collection and analysis of information. Salient portions of the news report relating to the ‘Operation Nallamalai’
Transcript of 2 Modern Techniques in Geography - Keralascert.kerala.gov.in/images/text_books/chapter 2.pdf · 2...

Mod
ern
Tech
niqu
es in
Geo
grap
hy
23
2
2
MODERN TECHNIQUES IN GEOGRAPHY
Our ancestors used to collect informationabout the earth's surface of their nearbyareas by climbing up trees and mountaintops. Such collection of informationhelped them in gathering food andprotecting themselves from enemies.When the need arose to understand moreabout the earth they used to travel forcollecting information about differentregions and convert the information intomaps. Maps were constructed in thismanner during olden days and it used totake a long time for the collection ofinformation and preparation of maps. Itwas not possible to collect informationabout isolated and inaccessible regions.
Collection of information and the analysisof information are two major activities ofthe map making process. With thedevelopment of technology, these becamefaster. Moreover, it became possible toobtain information about places where wecouldn't reach easily. As computers beganto be used for the analysis of informationcollected through various means and toillustrate them in maps, geographicalstudies achieved more efficiency. Let usknow more about these geographictechniques which help in the collectionand analysis of information.
Salient portions of the news report relating to the ‘Operation Nallamalai’

Cla
ss X
- So
cial
Sci
ence
II
24
2The search operation carried out inconnection with the accident of thehelicopter in which the Andhra PradeshChief Minister Y.S. Rajasekhara Reddyand team travelled was named as the'Operation Nallamalai'. It was a difficultoperation to search the vast Nallamalaiforest region that spreads over six districts.
From the given press reports, you musthave understood the hurdles faced by theOperation Nallamalai. Realising that theuse of technology alone would help toovercome these difficulties, the authoritiesdecided to resort to on the three methods,viz satellite mapping, aerial mapping andground searches. It became possible tolocate the place quickly with the help ofaerial mapping. Following this, air forcecommandos reached Rudrakonda Hillsnear the Sreesailam region of Nallamalaiin a helicopter.
There are isolated as well as inaccessible
places on the earth where one cannot reacheasily. Today collection of informationabout these places is possible using theremote sensing technology.
Remote sensingThe method of collecting informationabout an object or a phenomenon with thehelp of distantly placed sensors withouttouching is known as remote sensing.Could you understand from the figure(Fig 2.1) the collection of informationabout the earth's surface from differentlevels?
The information is collected with the helpof either cameras or sensors. The surfacewhere the sensor or camera is placed forcollecting information by remote sensingis called the platform. Sensors can beplaced on aircrafts, satellites or balloons.Based on the type of platform used,
Figure - 2.1
(1) (2)
(3)
1. Terrestrial Photography
2. Aerial Remote Sensing
3. Satellite Remote Sensing

Mod
ern
Tech
niqu
es in
Geo
grap
hy
25
2remote sensing has been divided intothree.
1. Terrestrial Photography
2. Aerial Remote Sensing
3. Satellite Remote Sensing
Taking photographs of the earth's surfacefrom the terrain or from high elevations iscalled terrestrial photography. Don't wetake photographs of the scenery when wego on picnic? This is an examplefor terrestrial photography.
The process of takingphotographs of the earth's surfacecontinuously with the help ofcameras fixed on aircraft is calledaerial remote sensing. It is usuallyused for collecting informationabout small regions. Theadvantage is that we can collectinformation about any place in this way.
Overlap in aerial photographsOverlap is needed in aerial photographsin order to maintain continuity and alsoto ensure three dimensional view usingstereoscopes. For this purpose each aerialphotograph covers about 60 percent areaof the adjacent photographs also. This iscalled overlap of aerial photographs.
In the given figure (Fig. 2.2) it can be seenthat each photograph shows as much as60 percent area as repetition. Don't you seethat the majority of areas of the figure Aare present in figure B and those of figureB are repeated in Figure C?
Two such photographs of adjoining areasare called a stereo pair (Fig. 2.3). Stereo
vision is possible only in photos havingoverlap. The instrument used forobtaining three dimensional view fromthe stereo pairs is called stereoscope (Fig.2.4).
By placing stereoscopes over aerial photosand by viewing them after adjusting thedistance between the lenses, we get a threedimensional view of that region. This iscalled 'stereoscopic vision'.
Figure - 2.3
Since aerial photographs are highly usefulfor viewing a region as a whole and fordistinguishing the heights and
Figure - 2.2
Land Surface
Camera
A B C

Cla
ss X
- So
cial
Sci
ence
II
26
2
depressions of the earth's surface aerialphotographs were widely used duringand after the Second World War.
Aerial photography is ideal for the precisemaping of the earth's surface. Aerialphotographs are widely used for thepreparation of topographic maps.
First phase - Before 1925
• It is being said that during earliertimes photographs of Paris Citywere taken using cameras tied todomestic pigeons.
• Photographs taken in this manner didnot have a precise continuation orcontrol.
• Afterwards, balloons began to beused for this.
• In 1858 Gespard Felix took aphotograph of a place called Beaverin France using balloon.
• In 1860 James Wallace Blank took aphotograph of Boston city usingballoon.
• When the variations in the directionand speed of wind createddifficulties for photography usingballoons, aircraft began to be usedfor the phototography.
• It was in the American Civil War of1862 that aerial photographs beganto be used for purposes of war.
• Even in the First World War aerialphotographs were used forunderstanding about enemy camps,arms storage facilities and troopmovements.
Second phase - 1925 to 1945
• The use of aerial photographs forcollecting information about theearth's surface became morewidespread.
• Camera lenses were used effectively.
• Advanced aircraft began to be used.
• Aerial photographs were used greatlyin the Second World War.
Figure - 2.4
A glimpse into the historyof remote sensing
Remote sensing technology transformeditself into advanced technology throughseveral periods of experiments andobservations. Let us examine theprogress in remote sensing technologyover different periods.

Mod
ern
Tech
niqu
es in
Geo
grap
hy
27
2 Third phase - 1945 to 1960
• Aerial photographs began to be usedin different fields.
• Such photographs were used widelyfor theme based studies.
Fourth phase - 1960 to 1972
• Satellite remote sensing was started.
• Earth observation from the outerspace started.
Fifth phase - After 1972
• Apart from war related purposes,satellites were launched for thecollection of information about theearth.
• America successfully launched theLandsat series (1-7) of satellites.
• Several other countries acquired thesatellite remote sensing technology.
• Our country successfully launchedseveral satellites such as Cartosat,Resourcesat and Oceansat.
Aerial photography started in India afterthe attainment of Independence. Theresponsibility of aerial survey in India hasbeen given to three agencies, namely theIndian Air Force, the Kolkota based IndianAerospace Company and the NationalRemote Sensing Centre. Though there areseveral advantages for aerial surveys,certain limitations have also been noticed.These are:
• Open space is needed for the take offand landing of planes.
• The shaking of the aircraft affects thequality of photographs.
• It is costly to land the aircraftfrequently for refuelling
• It is not practical to take photographsof regions of the earth that are vast andextensive.
With the advent of artificial satellites mostof these limitations have been overcome.Earth observation became more effectivewhen satellites began to be used asplatforms. The process of collectinginformation using sensors fitted onartificial satellites is called satellite remotesensing. Artificial satellites are mainlydivided into two types:
• Geostationary Satellites
• Sun synchronous Satellites
Geostationary SatellitesThese satellites orbit the earth at a heightof about 36000 km with the same orbitalvelocity and direction as that of the earth.Since the orbits of these satellites are atgreat heights, they can bring one third ofthe globe under their observational limit.Since they move according to the orbitalmovement of the earth they always facethe same region of the earth. Because ofthis, constant data collection of any onepart of the earth is possible through them.These satellites are used forunderstanding the differences in weatherconditions and for telecommunications.The INSAT satellites of India are goodexamples for this.

Cla
ss X
- So
cial
Sci
ence
II
28
2
Sun Synchronous SatellitesIn comparison with the geostationarysatellites, sun synchronous satellites moveat very low heights. As shown in the figure(Fig.2.6) such satellites move by traversingthe north and the south poles. The positionof the sun synchronous satellites isapproximately between 800 km and 950km from the earth's surface. Since thesesatellites come over a particular region ata fixed interval of days, continuouscollection of information about that regionis possible. Satellites such as IRS andLandsat are examples for sun synchronoussatellites.
Apart from platforms another importantcomponent of remote sensing is thesensor.
SensorsThe instrument used for recordinginformation about the earth's surface iscalled sensor. In order to recordinformation, cameras on the earth's surfaceand in aircraft and scanners in satellitesserve as sensors (fig. 2.1).
Active remote sensing,Passive remote sensing
Insat - Figure - 2.5
Figure - 2.6
Sun synchronous satellite
North pole
South pole
An energy source is essential for remotesensing. This can be solar energycontaining electromagnetic radiations orartificial sources of light. Remote sensinghas been made possible by utilising thesunlight reflected from various objects.Based on the source of light or energy,remote sensing can be divided into two,namely active remote sensing and passiveremote sensing.

Mod
ern
Tech
niqu
es in
Geo
grap
hy
29
2Remote sensing based on an artificialsource of light or energy source is calledactive remote sensing. A fine example forthis is the taking of pictures using a cameraflash. Here camera is the sensor and theflash coming from the camera is theartificial energy source.
Remote sensing based on the energy fromthe sun is called passive remote sensing.This is made possible only through thehelp of a sensor fitted on a distant surface.
In general, we can say that the technologyutilizes the electromagnetic energyreflected and radiated by objects.
Spectral SignatureEvery object on the earth's surface reflectselectromagnetic radiation in differentmeasures. This difference in the amountof reflection is because of the variationsin the physical properties of objects. Themeasure of reflected energy by each objectis called the spectral signature of thatobject.
For example, the spectral signature ofplants is different from that of the waterbodies.
The sensors on artificial satellitesdistinguish objects on the earth's surfaceand transmit that information digitally toterrestrial stations. This is interpreted withthe help of computers and converted intopicture formats. These are called satelliteimageries.
Spatial ResolutionThe sensors fixed on satellites cannotdistinguish objects of all sizes on theearth's surface. Earlier sensors were ableto distinguish only large objects. But todaysensors that can distinguish even smallobjects are being used.
Spatial resolution of a sensor is the size ofthe smallest object on the earth's surfacethat it can distinguish. A one metre spatialresolution for a satellite imagery means,it can represent an area of the earth'ssurface of one square metre or 1 m x 1marea. Even houses and vehicles can beseen clearly in such satellite imageries.There are sensors today that can evenrepresent information of less than onemetre. Sensors having high spatialresolution can represent objects withgreater clarity. You have understood thescientific aspects of remote sensingtechnology. Let us now look at its uses.
Uses of remote sensing technology
• For collecting information about theextent of crops and pest attacks and forunderstanding about the periodicgrowth of crops and the spread of pestinfections
• For finding out forest fires ininaccessible areas and for takingcontrol measures by monitoring theirspread
• For finding out drought affected andflood affected areas

Cla
ss X
- So
cial
Sci
ence
II
30
2Land Use Board (KSLUB), GeologicalSurvey of India (GSI), Central GroundWater Board (CGWB), Central MarineFisheries Research Institute (CMFRI),Department of Mining and Geology, StateGround Water Department, MahatmaGandhi University and Kerala University,various private companies also useremote sensing data.
You have understood that a large amountof information about the earth is receivedthrough remote sensing technology.Computer based technology helps in thefinding of scientific answers to ourenquiries by the analysis of theinformation obtained through the methodof remote sensing and other means.
Geographic Information SystemReliable data increases the quality ofinferences arrived at through GeographicInformation System. Remote sensing data,maps, tables and the data obtainedthrough other types of surveys can beused as the basic data for analysis. Thedata obtained through these sources arestored in a computer based GeographicInformation System. These data can besubjected to various analyses usingGeographic Information Systemsoftwares.
Figure (2.7) depicts the GeographicInformation System. Entering basic datainto computers using data input devicessuch as CDs and scanners is the first step.The collected data can be transformed intovarious layers using GeographicInformation System softwares. They canalso be subjected to several analyticalstudies. The analysed data can beconverted, according to our needs, intoproducts in condensed tabular format, indigital form or as maps.
• For exploring the oceans
• For understanding about the land usein a region
• For locating mineral resources
• For finding out places having greaterground water availability
• For oil exploration.
Achievements ofremote sensing technology
• Concise maps of large areas can beobtained within a short time.
• Helps to understand the changes duringdifferent periods
• Gives authentic information aboutobjects or phenomena being observed
• From a single data source itselfanalytical studies about a number ofsubjects can be done.
• Images from satellites are receivedrepeatedly at regular intervals.
• Information can be collected within avery short time.
Remote Sensing in KeralaVarious central and state departments inKerala now make use of remote sensingdata for information about the earth andfor efficient map making. Apart from theKerala State Remote Sensing andEnvironment Centre (KSREC), Centre forEarth Science Studies (CESS), Centre forWater Resources Development andManagement (CWRDM), Kerala ForestResearch Institute (KFRI), Kerala State

Mod
ern
Tech
niqu
es in
Geo
grap
hy
31
2
Geographic Information System is acomputer based information managementsystem for the storage, retrieval andanalysis of spatial data and theirpeculiarities and also for displaying themin the form of maps, tables and graphs.
Layers
With the help of Geographic InformationSystem softwares, spatial data can bestored as different layers. Observe the partof a topographic map shown in the figure(2.8). Can we separate the items of thespatial data one by one from that to makeseparate maps. This is possible throughthe GIS softwares. For example, you cansee that in the figure (2.8) water courses,roads etc are separately shown. We can
call them layers. In this manner we cancreate layers out of every theme on theearth's surface. If the earth's surfacefeatures are represented as differentlayers, their spatial relationship can beeasily understood. Try to compare thelayers of roads and the water coursesshown in the figure. You can see that mostof the roads have been constructed byavoiding water courses. If we constructroads along places having water courses,bridges have to be constructed over them.We could easily understand the spatialrelation between roads and water coursesthrough this example. In this way we cananalyse the spatial data of different layersfor our different purposes.
Figure - 2.7

Cla
ss X
- So
cial
Sci
ence
II
32
2
Figure - 2.8
north latitudes 8°4' and 37°6' and eastlongitudes 68°7' and 97°25'. Each place onthe earth has a specific location.
The characteristics of spatial data can berecorded with the help of their attributes.For example when you find out thelocation of the well in your house, it forms
In the given figure (Fig. 2.8) parts of drainage network near a reservoir are shown. Canyou find out the different layers that have been used here?
Can you find out the other features that can be converted into layers from the giventopographic map?
Spatial Data and AttributesEach feature on the earth's surface has alocation of its own. Such features thatrelate to the earth's surface and have aspecific location are known as spatial data.For example, among the countries of theworld the location of India is between

Mod
ern
Tech
niqu
es in
Geo
grap
hy
33
2spatial data. We can also collectinformation about the characteristics of thewell such as the depth of the well andwhether there is a platform and retainingwall. These are attribute data. Suchattributes can be combined with theirspatial data using GIS softwares. In thisfashion you can collect information aboutthe location and attributes of all wells inyour locality and prepare a geographicinformation system of wells. Based on thiswe can answer various queries relating tothe wells in the locality. In this manner ifwe can collect and include data of thespatial characteristics and their attributes,the GIS can give precise and scientificanswers to the various queries about thatplace. The data stored in computers arenot as anologue, but are stored in a digitalformat with the help of GIS softwares. Thedata can be analysed in different ways forvarious purposes. As you might be awareit is not possible to do such types ofanalyses and generate need based modelsbased on ordinary maps.
The uses of Geographic InformationSystem
• For carrying out theme based studies
• For separating required data fromspatial databases
• For analysing data based on theirspatial relations
• To display the spatial characteristics
• For modifying and periodicallyupdating data in a fast and cheapmanner
• To model future phenomena andprocesses based on data stored inGeographic Information System
• For making maps, graphs and tablesfor specific needs
The analytical capabilities ofGeographic Information SystemThe surface features of the earth collectedas spatial data and attributes can besubjected to analyses for our variousneeds using Geographic InformationSystem. Overlay analysis, buffer analysisand network analysis are some of theimportant analytical capabilities.Geographic Information System softwaresare developed by combining a largenumber of such analytical capabilities. Letus now understand some of the analysesof Geographic Information System.
Overlay AnalysisOverlay analysis is used forunderstanding the mutual relationshipsbetween and the changes undergone bythe various features of the earth's surface.A study report by the Centre for EarthScience Studies (CESS) discusses the landuse changes in the Manickal Panchayathof Thiruvananthapuram district. Theperiodic changes that took place in the

Cla
ss X
- So
cial
Sci
ence
II
34
2
Figu
re -
2.9
Mod
ern
Tech
niqu
es in
Geo
grap
hy
35
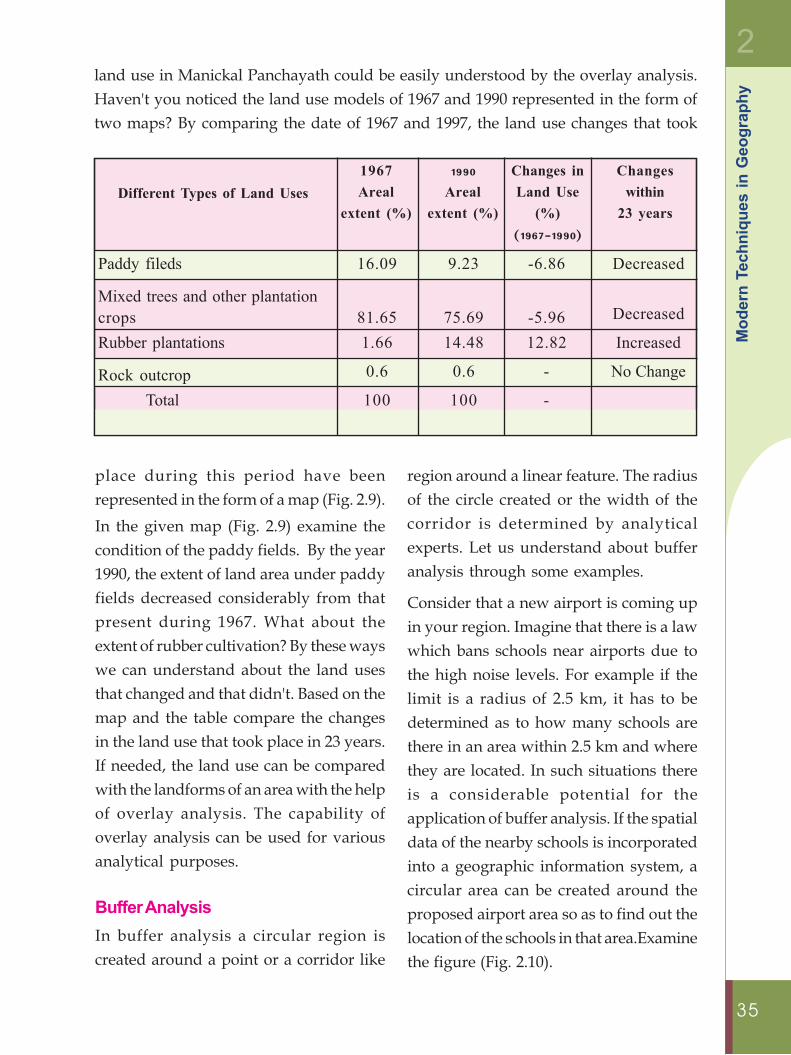
2land use in Manickal Panchayath could be easily understood by the overlay analysis.Haven't you noticed the land use models of 1967 and 1990 represented in the form oftwo maps? By comparing the date of 1967 and 1997, the land use changes that took
Different Types of Land Uses1967Areal
extent (%)
place during this period have beenrepresented in the form of a map (Fig. 2.9).In the given map (Fig. 2.9) examine thecondition of the paddy fields. By the year1990, the extent of land area under paddyfields decreased considerably from thatpresent during 1967. What about theextent of rubber cultivation? By these wayswe can understand about the land usesthat changed and that didn't. Based on themap and the table compare the changesin the land use that took place in 23 years.If needed, the land use can be comparedwith the landforms of an area with the helpof overlay analysis. The capability ofoverlay analysis can be used for variousanalytical purposes.
Buffer AnalysisIn buffer analysis a circular region iscreated around a point or a corridor like
region around a linear feature. The radiusof the circle created or the width of thecorridor is determined by analyticalexperts. Let us understand about bufferanalysis through some examples.
Consider that a new airport is coming upin your region. Imagine that there is a lawwhich bans schools near airports due tothe high noise levels. For example if thelimit is a radius of 2.5 km, it has to bedetermined as to how many schools arethere in an area within 2.5 km and wherethey are located. In such situations thereis a considerable potential for theapplication of buffer analysis. If the spatialdata of the nearby schools is incorporatedinto a geographic information system, acircular area can be created around theproposed airport area so as to find out thelocation of the schools in that area.Examinethe figure (Fig. 2.10).
Paddy fileds 16.09 9.23 -6.86 Decreased
Mixed trees and other plantationcrops 81.65 75.69 -5.96 Decreased
Rubber plantations 1.66 14.48 12.82 Increased
Rock outcrop 0.6 0.6 - No Change
Total 100 100 -
1990
Arealextent (%)
Changes inLand Use
(%)(1967˛1990)
Changeswithin
23 years

Cla
ss X
- So
cial
Sci
ence
II
36
2• Will more people become homeless, if
the road is widened only on the rightside?
From the given figure (Fig. 2.10) haven'tyou understood the application of bufferanalysis in the determination of a circularregion around a point? Consider anotherexample regarding the case of a linearfeature.
Let us consider that the width of a road inyour region is increased from 10m to 20mas per a government decision. In thissituation the detailed informationregarding the people living in that regionand their land assets has to be collected. Ifbuffer analysis is applied to thegeographic information system containingthe comprehensive data about that region,it can be easily determined as to howmuch land belonging to local people hasto be acquired and how many people willbecome homeless. Besides, this canprovide answers to many questions thegovernment authorities would be having(Fig. 2.11).
• For example, how many people wouldlose land if the width of the road isincreased by 5 m on either side?
• If the width of the road is increasedonly on the left hand side by 10m, howmuch land has to be acquired and howmany will become homeless?
Figure - 2.10
Network AnalysisIn contrast to the other two types ofanalyses, the network analysis deals onlywith linear features on a map. Linearfeatures such as roads, railway line andrivers are included here. For example, adairy entrepreneur wants to reach a milkprocurement centre by collecting milk in aregion within a radius of 5 km along theeasiest road in the shortest possible time.If the roads in the geographic information
Figure - 2.11

Mod
ern
Tech
niqu
es in
Geo
grap
hy
37
2system are subjected to network analysis,the easiest road that would take theshortest time can be found out. Similarly,when there is traffic congestion on a road,the easiest and less congested roads canbe determined as alternative paths usingnetwork analysis.
The possibilities of road network analysiscan be used in the planning of thefollowing:
• Helps to find out the nearest and lesscongested roads
• Travel time and costs are reduced.
• Roads having less accident rate can bedetermined.
• The hospital to which an accidentvictim has to be taken depending onthe situation
Figure - 2.12
• Planning maximum number ofattractive destinations for tourists inthe available time.
Practical applications of GeographicInformation System• Planning and decision making
becomes more efficient.
• Gives efficiency in data handling anddistribution.
• Data redundancy is reduced.
• The ability to integrate data fromdifferent sources
• Gives new information based oncomplex analyses of geographic data
Let us find out how theKerala State RemoteSensing and EnvironmentCentre has utilised theanalytical capability ofGeographic InformationSystem in the health sector.The spatial data of themalaria affected regions ofThiruvananthapuram districthas been shown with the helpof map. The spread of themalarial disease during 2004is shown in blue colour and
the red colour shows the spread of the disease during 2003. As these data have beenrepresented spatially the places of maximum spread of the disease can be easilydetermined from the map. Besides, when we click on each point by using mouse ongeographic information system, the detailed information regarding the persons affectedcan be obtained. If the spatial data about such communicable and noncommunicablediseases can be represented in a map, we can understand about their spread and thepossible areas into which they could spread more.

Cla
ss X
- So
cial
Sci
ence
II
38
2Global Positioning System (GPS)Global Positioning System (GPS) is aninstrument used for the determination ofthe positions of the objects on the earth'ssurface. A group of 24 satellites that orbitaround the earth in 6 different orbits atheights from 20000 to 20,200 km is whathelps in the determination of positions.GPS is an instrument that is used forcarrying out surveys in a simple manner.
It works using signals received from theartificial satellites. A GPS receiver shouldreceive signals from at least four satellitesin the network to be able to display thelatitude, longitude, height and time of theplace. GPS is of immense help in severalactivities including map making andtransportation. Try to collect informationabout the use of GPS.
Follow up activities
• Prepare an article on the theme 'The role of remote sensing in the developmentof India'.
• Which type of satellite is used for Doordarsan telecasts?
• Which satellites give us pictures of weather conditions?