2 investment attractive areas of large wind resource potential in thailand & the pdp's wind energy
33
Investment Attractive Areas of Large Wind Resource Potential in Thailand & the PDP’s Wind Energy Targets Renewable Energy Asia 2015, BITEC, Bangkok (Jun. 3, 2015) Kasemsan Manomaiphiboon E-mail: [email protected] The Joint Graduate School of Energy and Environment, King Mongkut’s University of Technology Thonburi, Thailand, and Center for Energy Technology and Environment, Ministry of Education, Thailand 1
-
Upload
theeranan-kanchanachongkon -
Category
Documents
-
view
215 -
download
0
description
2 investment attractive areas of large wind resource potential in thailand & the pdp's wind energy
Transcript of 2 investment attractive areas of large wind resource potential in thailand & the pdp's wind energy

Investment Attractive Areas of Large Wind Resource Potential
in Thailand & the PDP’s Wind Energy Targets
Renewable Energy Asia 2015, BITEC, Bangkok (Jun. 3, 2015)
Kasemsan ManomaiphiboonE-mail: [email protected]
The Joint Graduate School of Energy and Environment, King Mongkut’s University of Technology Thonburi, Thailand, and
Center for Energy Technology and Environment, Ministry of Education, Thailand
1

Alternative Energy for Electricity Generation
Wind energy development in Thailand: Rapid growth Encouraged by government Strong interest from private sector 2

3

PDP2015 Span 2015-2036 (or 2558-2579 B.E.) Still pending as of Mar., 2015:
Expected to come out soon Key:
Renewable energy shares ~22-25% of total capacity Wind energy ~3 GW (not 2 GW as previously)
4

5

A number of mesoscale mappings conducted Large-to-very large discrepancies in many areas among
past mapping studies Uncertainly when developing wind-energy projects
and making policy or plans related to wind energy
To derived technical potential of wind energy, need to account for key factors Land exclusion Wind speed distribution Air density Turbine technology
2 Issues
6

1. Given PDP targets of wind energy set, do we have adequate wind energy (land-based)?
2. Amid uncertainty in different maps, can we constrain it and then optimally identify areas worth investment?
2 Big Questions
7

1. DEDP (2001) (DP) Department of Energy Development and Promotion (currently,
DEDE)2. World Bank (2001) ( WB)3. Manomaiphiboon et al. (2010) (JG)4. DEDE (2010) ( DD)
Department of Alternative Energy Development and Efficiency
Four Mapping Studies Considered
8
1. Cover whole of Thailand 2. Moderate-to-fine resolution (1-3 km)3. Documentation available4. Performance evaluation made5. Often used or referred
Criteria

DP:
DEDP (2001)
Commissioned to Fellow Engineering Consultant (Thai company)
WindMap model Diaganostic State-of-science Commercial
Driving data: surface data, buoy data, satellite data, and wind towers
1-km resolution 10 m, 30 m, and 50 m Good performance
But by modeling nature
http://www2.dede.go.th/renew/Twm/main.htm
50 m. AGL
9

WB:
World Bank (2001)
Commissioned to TrueWind Solutions (US company) by World Bank
MesoMap modeling system: Prognostic State of science Proprietary
1-km resolution Randomly-generated conditions and
sampling 30 m & 65 m Fair performance
65 m. AGL
10

JG:
Manomaiphiboon et al. (2001)
Funded by Thailand Research Fund Combined meso/micro mapping
MM5: Prognostic Calmet: Diagnostic State of science Open-source
1-km resolution 2006 as representative year Multiple heights up to 100 m Acceptable performance
100 m. AGL
11

DD:
DEDE (2010)
Commissioned to Silpakorn University by DEDE
As effort to revise DEDP (2001) KAMM model
Prognostic State-of-science Proprietary
3-km resolution 15 years (1995-2009) simulated Multiple heights up 110 m Good performance
90 m. AGL
12

Map projections Different in some mappings For some, only partial info given 1-km (DP, WB, and JG) and 3-km (DD)
UTM47N on WGS84 used as reference Geo-referencing and resampling under GIS
Convert to Common Grid
2 Heights (50 m and 100 m) Results at 100 m discussed here
Numerical adjustment Cubic spline interpolation Power-law interpolation/extrapolation Tested and found acceptable for use
Adjust to common heights
13

100-m Wind Speed
m/s
DP WB
JG DD
14

100-m Median-Based (MD) Map
m/s
15

Deviation at 100 m
16

17
Terms of Technical Potential TPo: Technical potential before land exclusion
Total power generated by all turbines + Installed fully in all areas before land exclusion
TP: Technical potential after land exclusion Total power generated by all turbines + Installed fully
in remaining areas after land exclusion TPCF20:
Same as TP but only turbines with capacity factor ≥ 20% Economically feasible applications

CF (Capacity factor) = Pt / R
where Pt: Power generated by turbine, determined by
1. Power curve of turbine2. Wind speed distribution3. Air density
R: Rated power of turbine
18

Power curves at reference conditions
(dry, 1 atm, 15C)
Selected Large Turbine Models
ConventionalLow-windConventional
19

http://www.energy.ca.gov/pier/project_reports/CEC-500-2005-180.html20

Parameter TurbineL1 L2 L3
Rated power (kW) 2,000 2,000 2,000Hub height (m) 78-138 78-120 80-125
Rotor diameter (m) 82 97 90Cut-in speed (m s-1) 3 3 4
Cut-out speed (m s-1) 25 25 25No. of blades 3 3 3
No. of installed turbines before land exclusion* 1,198,718 856,610 995,082
No. of installed turbines after land exclusion* 619,828 442,803 514,605
* Rectangular-array installation with a turbine spacing of 8 times rotor diameter
21
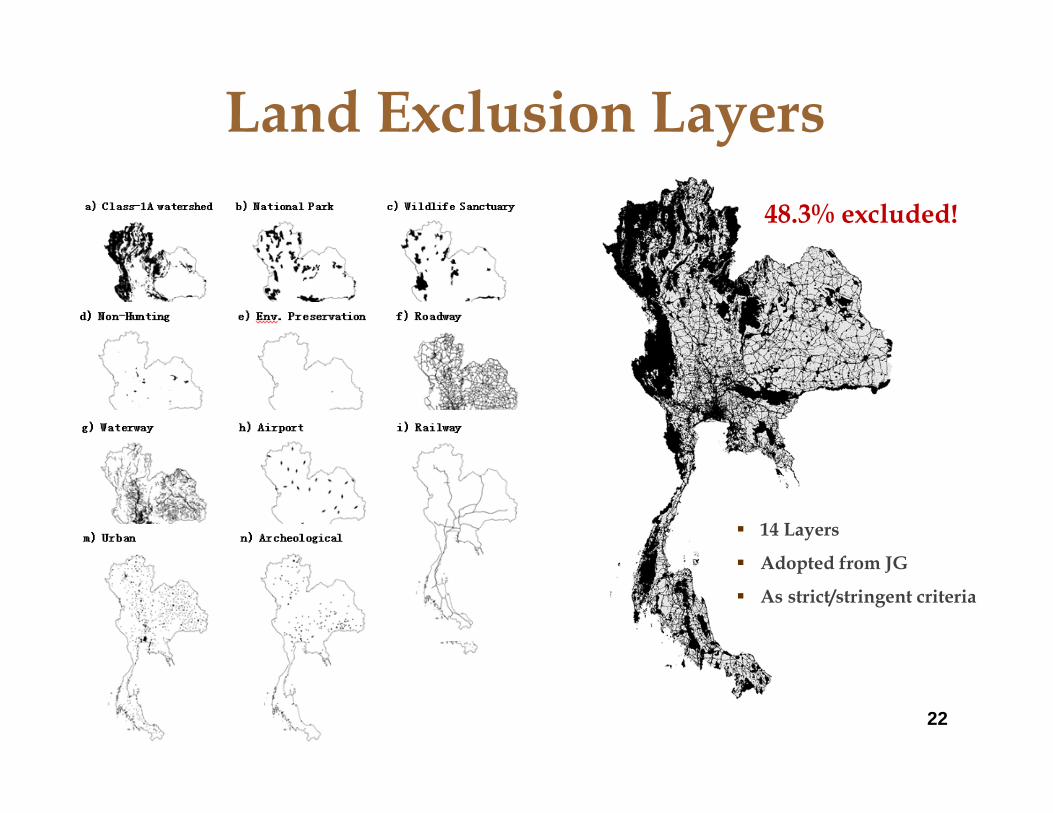
Land Exclusion Layers
14 Layers
Adopted from JG
As strict/stringent criteria
22
48.3% excluded!

Rectangular-Arrayed Turbines
D: Rotor diameter
23

TPo & TP at 100 m
24

Capacity Factor at 100 m
25

TPo, TP, TPCF20
GWNo. of Turbines
Land-based
Over Thailand
Based on 100-m MD map
26

27
Investment–Attractive Areas (CF ≥ 20%) by Turbine Technology
Conventional (L1) Low-Speed Design (L2) Conventional (L3)

28
L2 with CF ≥20% on 100-m MD
29
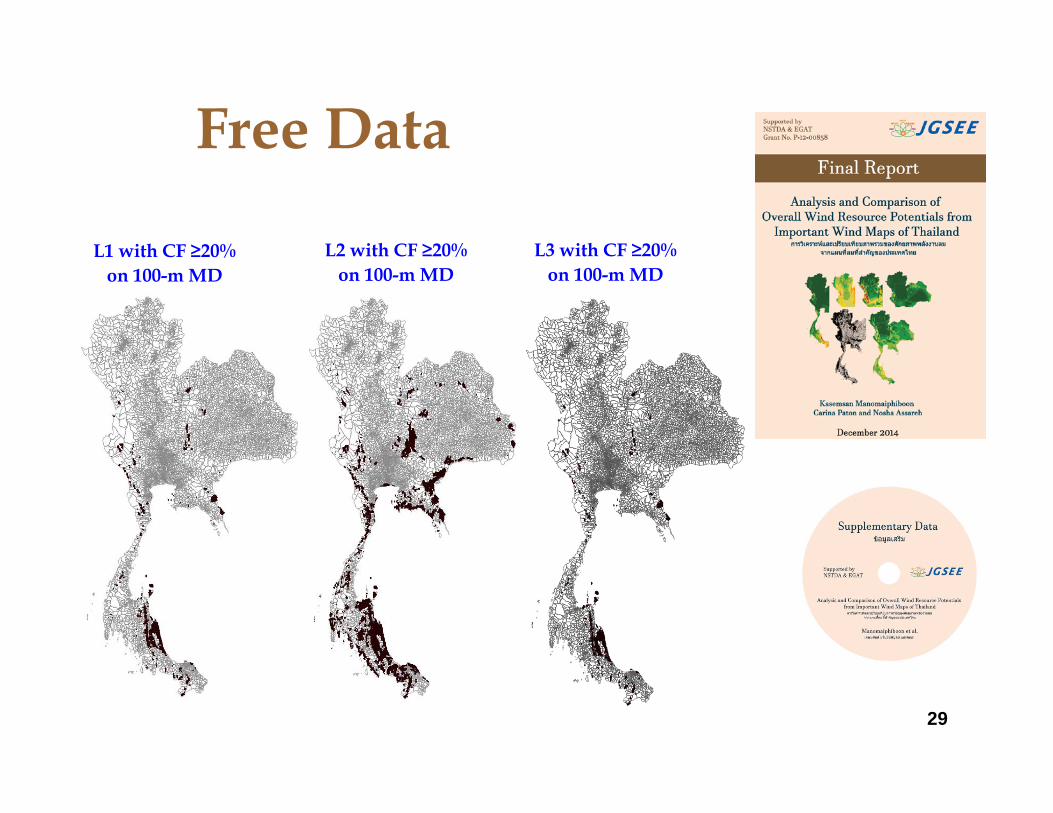
Free Data
L1 with CF ≥20% on 100-m MD
L2 with CF ≥20% on 100-m MD
L3 with CF ≥20% on 100-m MD

4 Maps (DP, WB, JG, DD) plus MD at 100 m
Incorporate Land after exclusion 3 turbine models Wind speed distribution Air density adjustment
TPCF20 = 17 GW (with low-speed-designed turbine)(3.5 times larger than)
= 5 GW (with conventional turbine)
Low-speed-designed large turbines: Promoted or Encouraged!
Adequate for both PDP2010v3’s 2030 target of 2 GW by wind energy PDP2015’s 2036 target of ~3 GW (not official yet) by wind energy
30

31
Acknowledgements

Thayukorn Prabamroong
Carina Paton
Nosha Assareh
Nuttee Rajpreeja
Contributors
32

Thank You
33