2. IMPLEMENTATION OF A PORTABLE AUTOMOBILE EXHAUST ...
15
DLSU Engineering e-Journal Vol. 1 No. 1, March 2007, pp.13-27 s t s t Implementation of a Portable Automobile Exhaust Emission Analyzer Fulton Baylon John Michael G. Dy Roveric D. Quidilla Ralph Andrew D.L. San Pascual Department of Electronics and Communication Engineering De La Salle University-Manila and Ann E. Dulay Department of Electronics and Communication Engineering De La Salle University-Manila Email: [email protected] The portable automobile exhaust emission analyzer is a device that can measure the gas emissions of both gasoline- and diesel- fueled cars. For gasoline-fueled cars, the device detects and displays the amount of the following air pollutants, namely, hydrocarbons (HC), carbon monoxide (CO), and nitrous oxides. For the die el- fueled cars, the device displays the opacity measurement. The portable emission analyzer consists of sensors, input devices, a microcontroller, and an LCD display. The sensors used are Iridium 50 gas sensor which detects CO and HC, and the NOXO 100 which detects the nitrous oxide. The tempera ure sensor together with the stroboscope provides the u er the temperature and rpm informa ion needed to start the operation of the emission analyzer. A light source, an LDR and a smoke chamber made of aluminum sheet comprised the opacimeter.
Transcript of 2. IMPLEMENTATION OF A PORTABLE AUTOMOBILE EXHAUST ...
DLSU Engineering e-Journal Vol. 1 No. 1, March 2007, pp.13-27
s
t st
Implementation of a Portable Automobile Exhaust Emission Analyzer
Fulton Baylon John Michael G. Dy Roveric D. Quidilla
Ralph Andrew D.L. San Pascual Department of Electronics and Communication Engineering
De La Salle University-Manila and
Ann E. Dulay Department of Electronics and Communication Engineering
De La Salle University-Manila Email: [email protected]
The portable automobile exhaust emission analyzer is a device that can measure the gas emissions of both gasoline- and diesel-fueled cars. For gasoline-fueled cars, the device detects and displays the amount of the following air pollutants, namely, hydrocarbons (HC), carbon monoxide (CO), and nitrous oxides. For the die el-fueled cars, the device displays the opacity measurement. The portable emission analyzer consists of sensors, input devices, a microcontroller, and an LCD display.
The sensors used are Iridium 50 gas sensor which detects CO and HC, and the NOXO 100 which detects the nitrous oxide. The tempera ure sensor together with the stroboscope provides the u er the temperature and rpm informa ion needed to start the operation of the emission analyzer. A light source, an LDR and a smoke chamber made of aluminum sheet comprised the opacimeter.

14 Baylon, Dy, Quidilla, San Pascual and Dulay
The accuracy of the emission analyzer is tested by comparing the tes results with LTO registered emission testing center. A 98.88% accuracy for the CO is derived. The precision of the device is also obtained by repeating the test for the same car for ten times. The following precision measurements are gathered: 98.42% for HC, 98.08% for NOX and a 94.49% for the opacimeter.
t -
1.0 INTRODUCTION
Exhaust Emission analyzers, also known as gas analyzers, are devices that measure the amount of air pollutants that a certain engine or industry emit into the air. Three major air pollutants that the gasoline-fueled vehicle generates are hydrocarbons (HC), carbon monoxide (CO), and Nitrous oxide (NOX). Hydrocarbon is a carcinogen and can cause lung cancer. Carbon monoxide is an odorless poisonous gas while the Nitrous oxide is a major contributor in forming the acid rain [1]. These gases are not only harmful to the environment, they also pose hazard to human beings. Diesel-fueled vehicles contribute particulates to the air that could destroy the respiratory system. In order to abate the deleterious effects of these gases, the government has set the limits for each of the pollutants. Every year, car owners are required to have their cars tested in emission test centers before they can renew their licenses. If their cars emit more of these gases than what is allowed by law, they cannot be issued a new license. In order to pass the test, most car owners would tune up their cars before the registration. This camouflages the real situation: that most of these cars emit gases above the allowable limits within the twelve-month period that they travel on the roads. To address this problem, the Land Transportation Office (LTO) has launched the roadside inspection. That is, they randomly select and stop vehicles plying along major roads in Metro Manila and conduct on-the-spot emission test using portable gas analyzers [2]. However, these portable analyzers are expensive and has a price range from $4,000 (roughly equivalent to P192,520.00) to $7,500 (P360,975.00) [3]. The portable emission analyzer developed in this study only cost P89,877.00 or $1,900.00 which is significantly cheaper compared to those mentioned above. Another advantage of this product is the incorporation of the opacimeter which is a separate device in most gas analyzers available in the market. 2.0 CONCEPTUAL FRAMEWORK
The Portable Automobile Exhaust Emission Analyzer is implemented using sensors, a keypad, a microcontroller, a thermal printer and an LCD display. It has two functions: a gas analyzer for the gasoline-fueled cars, and as an opacimeter for diesel-fueled cars. Figure 1 shows the main components of the emission analyzer.

Portable Automobile Exhaust Emission Analyzer 15
Keypad
Microcontroller
ReferenceCircuit
Opacimeter
Gas Sensors
LCD Display
ThermalPrinter
Fig. 1 Portable Automobile Exhaust Emission Analyzer Block D agram i
The operation of the emission analyzer is similar to the operation of the bulky emission test equipment. The details regarding the car to be tested are keyed in through the keypad. These details include the date of the test, the plate number, the type of engine, and the year model of the car. The oil temperature and the revolutions per minute (RPM) of the engine are then observed through the reference circuit. The oil temperature must be at least 70 degrees Celsius for both diesel and gasoline engines and the revolutions per minute (RPM) of the engine should reach 3500 for diesel and 2500 for gasoline-fueled vehicles before the measurement begins. If the vehicle is diesel-fueled, it is the opacimeter that will send data to the microcontroller. If it is gasoline, it would be the gas sensors that will feed data to the microcontroller. The microcontroller through its analog-to-digital converter reads the data and sends to the LCD display and thermal printer.
2.1 Keypad and LCD The keypad used in this study is Qterm N15. It has 12 keys and an LCD with 4
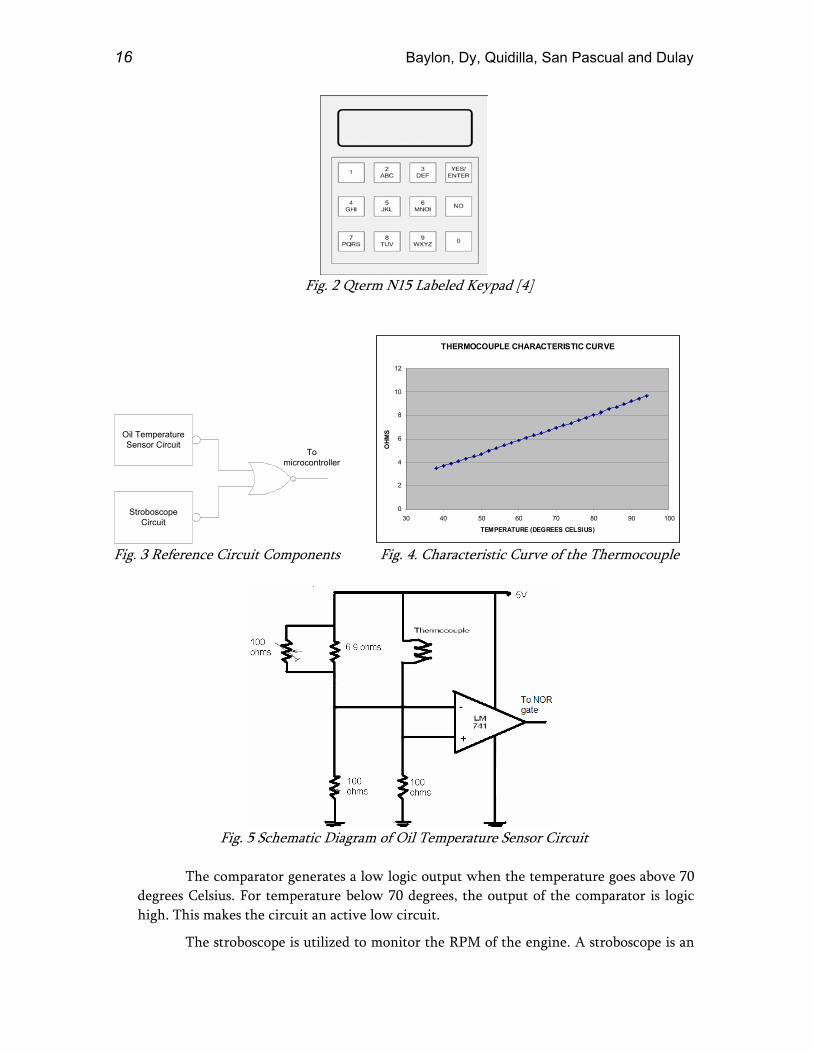
lines by 20 characters. The keypad is interfaced to the microcontroller through the RS232. For this study, the keys are programmed so as to function as letters or numbers as given in Figure 2. The number of presses followed by the Enter key gives the character that is sent to the LCD via the microcontroller.
2.2 Reference Circuit
The components of the reference circuit are shown in Figure 3. The oil temperature sensor is a type T-thermocouple and has the characteristic curve shown in Figure 4. The resistance at which the thermocouple detects 700 Celsius is 6.9 ohms and it increases as the temperature increases. Since the initialization of the circuit starts when the temperature goes above 700 Celsius, a comparator circuit is needed (Figure 5).
16 Baylon, Dy, Quidilla, San Pascual and Dulay
Fig. 2 Qterm N15 Labeled Keypad [4]
Oil TemperatureSensor Circuit
StroboscopeCircuit
Tomicrocontroller
THERMOCOUPLE CHARACTERISTIC CURVE
0
2
4
6
8
10
12
30 40 50 60 70 80 90 100
TEMPERATURE (DEGREES CELSIUS)
OHM
S
Fig. 3 Reference Circuit Components Fig. 4. Characteristic Curve of the The mocouple r
Fig. 5 Schematic Diagram of Oil Temperature Sensor Circuit
The comparator generates a low logic output when the temperature goes above 70
degrees Celsius. For temperature below 70 degrees, the output of the comparator is logic high. This makes the circuit an active low circuit.
The stroboscope is utilized to monitor the RPM of the engine. A stroboscope is an
Portable Automobile Exhaust Emission Analyzer 17
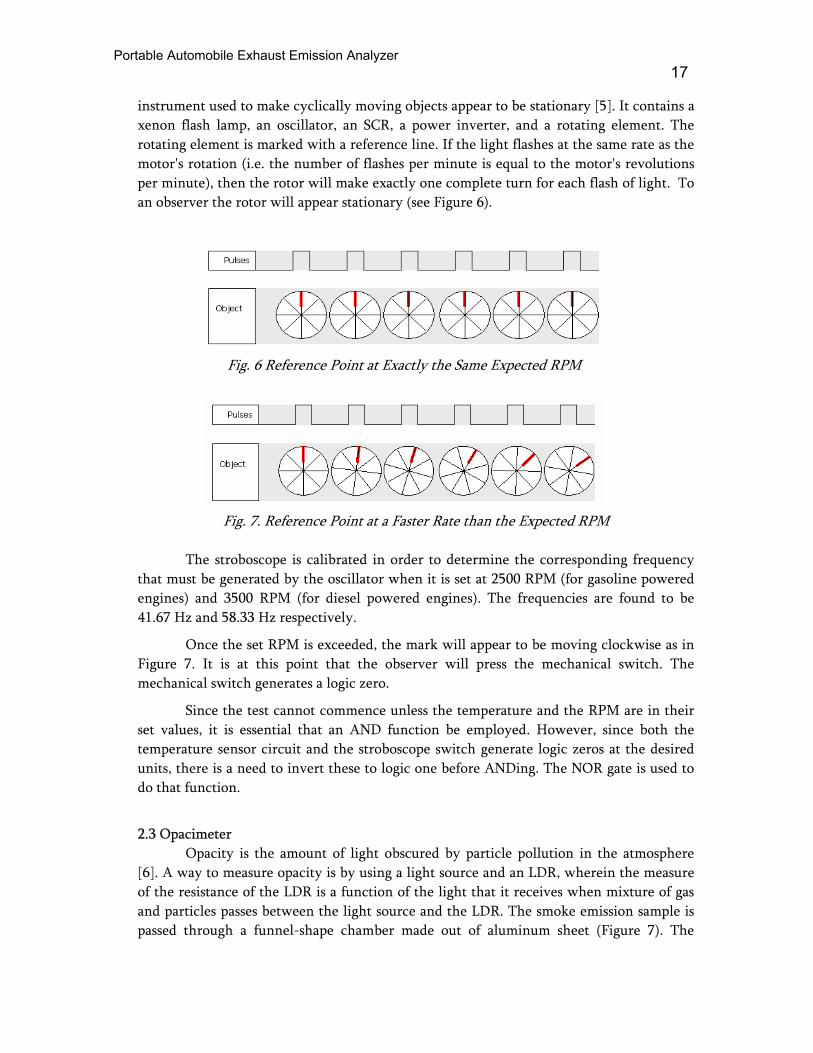
instrument used to make cyclically moving objects appear to be stationary [5]. It contains a xenon flash lamp, an oscillator, an SCR, a power inverter, and a rotating element. The rotating element is marked with a reference line. If the light flashes at the same rate as the motor's rotation (i.e. the number of flashes per minute is equal to the motor's revolutions per minute), then the rotor will make exactly one complete turn for each flash of light. To an observer the rotor will appear stationary (see Figure 6).
Fig. 6 Reference Point at Exactly the Same Expected RPM
Fig. 7. Reference Point at a Faster Rate than the Expected RPM
The stroboscope is calibrated in order to determine the corresponding frequency
that must be generated by the oscillator when it is set at 2500 RPM (for gasoline powered engines) and 3500 RPM (for diesel powered engines). The frequencies are found to be 41.67 Hz and 58.33 Hz respectively.
Once the set RPM is exceeded, the mark will appear to be moving clockwise as in Figure 7. It is at this point that the observer will press the mechanical switch. The mechanical switch generates a logic zero.
Since the test cannot commence unless the temperature and the RPM are in their set values, it is essential that an AND function be employed. However, since both the temperature sensor circuit and the stroboscope switch generate logic zeros at the desired units, there is a need to invert these to logic one before ANDing. The NOR gate is used to do that function.
2.3 Opacimeter
Opacity is the amount of light obscured by particle pollution in the atmosphere [6]. A way to measure opacity is by using a light source and an LDR, wherein the measure of the resistance of the LDR is a function of the light that it receives when mixture of gas and particles passes between the light source and the LDR. The smoke emission sample is passed through a funnel-shape chamber made out of aluminum sheet (Figure 7). The

18 Baylon, Dy, Quidilla, San Pascual and Dulay
amount of light that passes through determines the darkness or opacity of the smoke.
Fig. 7. Opacimeter Chamber with Dimensions in Inch [4]
The light source and a Light Dependent Resistor are strategically installed on the chamber so that smoke passes between them. The resistance of the LDR inversely varies with the amount of light being fed to it [7]. A circuit is developed to convert this change in resistance to a voltage that can be read by the ADC of the microcontroller (Figure 8).
Fig. 8. Opacimeter Circuit

Portable Automobile Exhaust Emission Analyzer 19
2.4 Gas Sensors Two gas sensors are used to measure the three gases commonly emitted by
gasoline-fueled vehicles. The Iridium 50 gas sensor detects the presence of CO and HC at a range of 0-15% for Carbon Monoxide and 0-10000 ppm for hydrocarbons [8]. The NOXO100 gas sensor detects the presence of Nitrous Oxide up to 5000 ppm [9]. The IRidium 50 gas sensor has an associated electronics that allows direct communications with the microcontroller via the RS232 serial interface (Figure 9).
Figure 9. Iridium 50 Gas Sensor
The NOXO 100 gas sensor is an electromechanical type of gas sensor that requires �12 Vdc supply. This sensor generates an analog voltage that is linear with the amount of concentration. Since the ADC of the microcontroller accepts up to 2.4V only, the output of the NOX sensor is passed through an attenuator circuit (Figure 10).
NOXO 100 sensor Attenuator Circuit Microcontroller
Fig.10. NOX Sensor Block Diagram
2.5 Microcontroller
The microcontroller utilized in this study is Z8! Encore F6423. This microcontroller has a 64K of flash memory, 4K RAM, two full-duplex UART, 10-bit ADC, and several I/O ports. Z8! Encore is programmed using C language. An algorithm is designed to instruct the microcontroller to collect data from the sensors connected to the UARTs and ADC when the initialization signal is received from the reference circuit. Figure 11 shows the flowchart of the Z8! algorithm.
The program prompts the user to input the date. Then, the user may choose to retrieve a previously stored testing information or select new test. If a new test is to be done, it asks for the plate number of the car to be tested. The user then encodes whether the vehicle is diesel-fueled or gasoline fueled. This allows the microcontroller to obtain data from the respective sensors. When the output of the NOR gate of the reference circuit is high, the microcontroller starts collecting data and sends this to the LCD output and the thermal printer together with the other car details inputted through the keypad.

20 Baylon, Dy, Quidilla, San Pascual and Dulay
START
GET PLATENUMBER
GET DATE
CHECKPREVIOUS
DATA?
CHOOSE FROM 3PREVIOUS DATA
DISPLAY TO LCDPREVIOUS DATA
PRINT ?
PRINT PREVIOUSSELECTEDRESULT
YES
NO
YES
NO
END
GAS ORDIESEL
GAS DIESEL
HIGH ORLOW?
HIGH ORLOW?LOW
HIGH
LOW
HIGH
SENDCOMMAND TO
IRIDIUM 50
GET OUTPUTFROM THE NOR
GATE
GET OUTPUTFROM THE NOR
GATE
ACQUIRE DATAFROM IRIDIUM 50
COMPARE THEMEASUREMENTS TO
STANDARDS
DISPLAYRESULTS TO
LCD
PRINT ?
PRINTRESULTS
YES
NO
ACQUIRE DATAFROM ADC
STORE DATA
LOOP = 6
ARITHMETIC MEANOF THE STORED
DATA
YES
NO
Fig. 11 Program F owchart for Zilog Microcontroller [4] l
2.6 Thermal Printer
The printer used in this study is Epson TM-T88 thermal printer. It is interfaced to the UART of the Zilog microcontroller. The printout contains the date of testing, the plate number, and the amount of the gases detected.

Portable Automobile Exhaust Emission Analyzer 21
3.0 DATA AND RESULTS
The prototype has been tested side by side with two emission testing center. Another test was done to determine the reliability of the product. The following subheadings show the results.
3.1 Acceptable Limits on Gas Emissions
The Land Transportation Office (LTO) has set the following standards for in-use motor vehicles [LTO].
Table 1: Acceptable Values for Gasoline and Diese Engines l
*K – constant for opacity
These values are stored in the microcontroller and are compared to the data
obtained by the sensor. The microcontroller then produces a Pass or Fail status and displays and prints this on the LCD and thermal printer respectively.
3.2 Comparative Tests for the Gas Analyzer
The portable gas analyzer is used to test eight cars in juxtaposition with the gas analyzer of Greenstar Emission Testing Center which is located in Tayuman, Manila. Refer to Table 2 for the comparison of data.
As can be seen, the portable exhaust emission gas analyzer produced the same status for all of the eight cars tested. However, in terms of actual values of the gases detected, the data gathered by the prototype did not exactly match that of Greenstar’s. This is due to the non-synchronized initialization of the system. Most of the time, when the Greenstar is already acquiring data, the prototype has just started initializing. The values though are credibly valid in toto.

22 Baylon, Dy, Quidilla, San Pascual and Dulay
Table 2: Greenstar’s Gas Analyzer vs Portable Gas Analyzer
3.3 Comparative Tests for the Opacimeter
For the opacimeter, ten diesel vehicles are tested. Again, the test is done side by side with the Greenstar’s Opacimeter. Table 3 shows the corresponding results for each opacimeter. The status of the test by the prototype is the same as that of the emission test center.
Table 3: Greenstar’s Opacimeter vs Portable Opacimeter
Greenstar Analyzer
Prototype
Greenstar Analyzer
Prototype
Mazda Pickup
Passed Passed
Terrano Passed Passed
Besta Passed Passed Pajero Failed Failed Delica Passed Passed PUJ Passed Passed L300 Passed Passed PUJ Failed Failed
Toyota FX Passed Passed Starex Passed Passed
3.4 Accuracy Test for the Portable Automobile Exhaust Emission Analyzer, Gas Analyzer
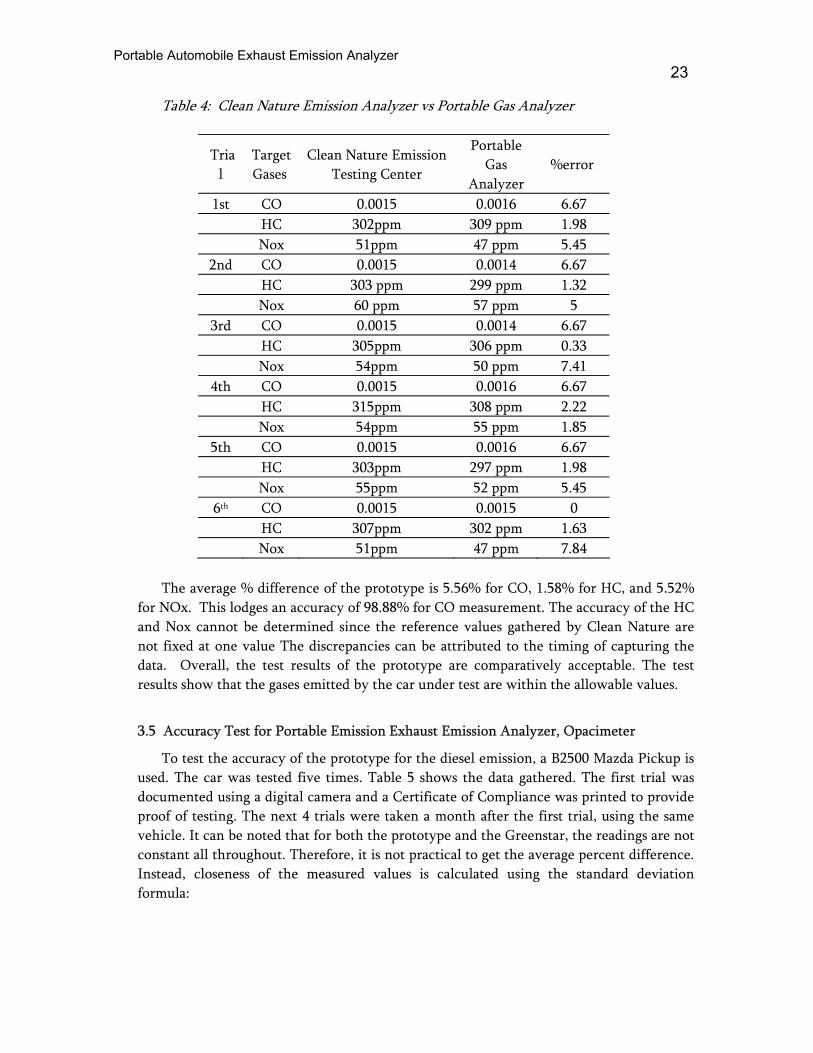
In order to test the accuracy of the gas analyzer, it is used to test one car for six times and compared with the test done by Clean Nature Emission Analyzer on the same car. The vehicle under test is a Mazda Familia, “January 1, 1997 and above” model. The test results are listed in Table 4.
Portable Automobile Exhaust Emission Analyzer 23
Table 4: Clean Nature Emission Analyzer vs Portable Gas Analyzer
Trial
Target Gases
Clean Nature Emission Testing Center
Portable Gas
Analyzer %error
1st CO 0.0015 0.0016 6.67 HC 302ppm 309 ppm 1.98 Nox 51ppm 47 ppm 5.45
2nd CO 0.0015 0.0014 6.67 HC 303 ppm 299 ppm 1.32 Nox 60 ppm 57 ppm 5
3rd CO 0.0015 0.0014 6.67 HC 305ppm 306 ppm 0.33 Nox 54ppm 50 ppm 7.41
4th CO 0.0015 0.0016 6.67 HC 315ppm 308 ppm 2.22 Nox 54ppm 55 ppm 1.85
5th CO 0.0015 0.0016 6.67 HC 303ppm 297 ppm 1.98 Nox 55ppm 52 ppm 5.45
6th CO 0.0015 0.0015 0 HC 307ppm 302 ppm 1.63 Nox 51ppm 47 ppm 7.84
The average % difference of the prototype is 5.56% for CO, 1.58% for HC, and 5.52%
for NOx. This lodges an accuracy of 98.88% for CO measurement. The accuracy of the HC and Nox cannot be determined since the reference values gathered by Clean Nature are not fixed at one value The discrepancies can be attributed to the timing of capturing the data. Overall, the test results of the prototype are comparatively acceptable. The test results show that the gases emitted by the car under test are within the allowable values.
3.5 Accuracy Test for Portable Emission Exhaust Emission Analyzer, Opacimeter
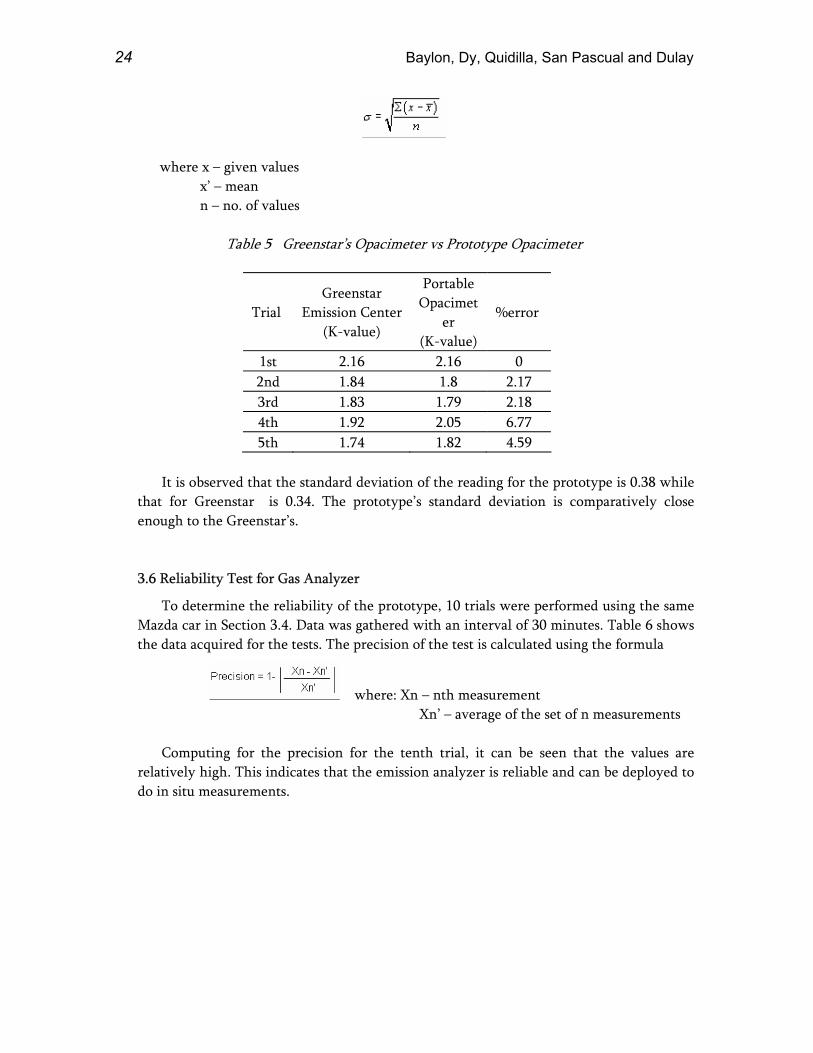
To test the accuracy of the prototype for the diesel emission, a B2500 Mazda Pickup is used. The car was tested five times. Table 5 shows the data gathered. The first trial was documented using a digital camera and a Certificate of Compliance was printed to provide proof of testing. The next 4 trials were taken a month after the first trial, using the same vehicle. It can be noted that for both the prototype and the Greenstar, the readings are not constant all throughout. Therefore, it is not practical to get the average percent difference. Instead, closeness of the measured values is calculated using the standard deviation formula:
24 Baylon, Dy, Quidilla, San Pascual and Dulay
where x – given values x’ – mean n – no. of values
Table 5 Greenstar’s Opacimeter vs Prototype Opacimeter
Trial Greenstar
Emission Center (K-value)
Portable Opacimet
er (K-value)
%error
1st 2.16 2.16 0 2nd 1.84 1.8 2.17 3rd 1.83 1.79 2.18 4th 1.92 2.05 6.77 5th 1.74 1.82 4.59
It is observed that the standard deviation of the reading for the prototype is 0.38 while
that for Greenstar is 0.34. The prototype’s standard deviation is comparatively close enough to the Greenstar’s. 3.6 Reliability Test for Gas Analyzer
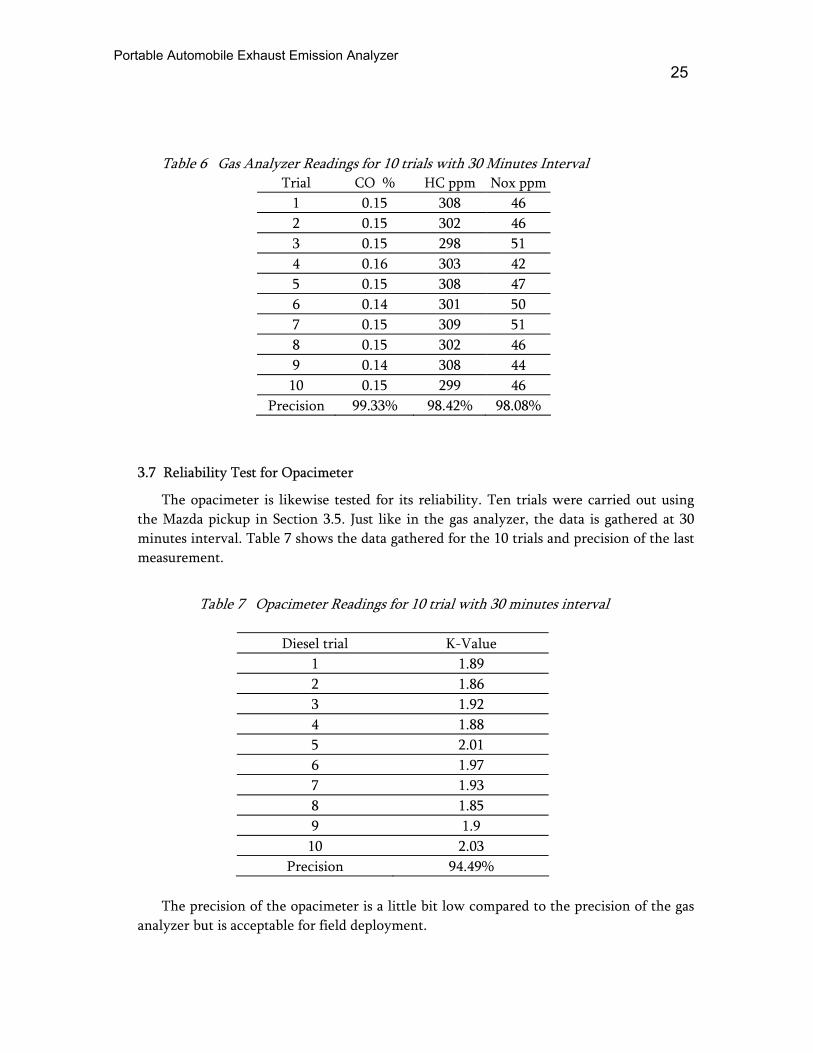
To determine the reliability of the prototype, 10 trials were performed using the same Mazda car in Section 3.4. Data was gathered with an interval of 30 minutes. Table 6 shows the data acquired for the tests. The precision of the test is calculated using the formula
where: Xn – nth measurement Xn’ – average of the set of n measurements
Computing for the precision for the tenth trial, it can be seen that the values are
relatively high. This indicates that the emission analyzer is reliable and can be deployed to do in situ measurements.
Portable Automobile Exhaust Emission Analyzer 25
Table 6 Gas Analyzer Readings for 10 trials with 30 Minutes Interval Trial CO % HC ppm Nox ppm
1 0.15 308 46 2 0.15 302 46 3 0.15 298 51 4 0.16 303 42 5 0.15 308 47 6 0.14 301 50 7 0.15 309 51 8 0.15 302 46 9 0.14 308 44
10 0.15 299 46 Precision 99.33% 98.42% 98.08%
3.7 Reliability Test for Opacimeter
The opacimeter is likewise tested for its reliability. Ten trials were carried out using the Mazda pickup in Section 3.5. Just like in the gas analyzer, the data is gathered at 30 minutes interval. Table 7 shows the data gathered for the 10 trials and precision of the last measurement.
Table 7 Opacimeter Readings for 10 trial with 30 minutes interval
Diesel trial K-Value
1 1.89 2 1.86 3 1.92 4 1.88 5 2.01 6 1.97 7 1.93 8 1.85 9 1.9
10 2.03 Precision 94.49%
The precision of the opacimeter is a little bit low compared to the precision of the gas
analyzer but is acceptable for field deployment.
26 Baylon, Dy, Quidilla, San Pascual and Dulay
4.0 CONCLUSION
In the development of the portable automobile exhaust emission analyzer, several factors were considered. First, was the size and weight of the whole prototype. The final product was able to achieve this by using a housing that is as big as an industrial flashlight and can be carried handily by the user. The second factor was the choice of sensors and interface. Since the analyzer does not only measure HC, CO, and NOX but covers also the measurement of opacity, one sensor did not suffice to do all of these functions. Three devices were utilized to measure these parameters and they are the Iridium 50 gas sensor, NOX100 sensor, and an LDR. A zilog microcontroller was used to process the data received from the sensors and to send the data to the output devices. Finally, the product must generate results which are at par with the existing emission testing center. Two emission testing centers were used as the benchmark. The test results gathered by the analyzer and that of the two emission testing centers show a very small standard deviation that indicates how close the readings are. A reliability test was also done to determine the repeatability in the measurement of the analyzer and in all the tests, more than 90% precision was achieved.
5.0 REFERENCES
[1] National Safety Council, Washington DC, “What you can do about car emissions,” [Online] http://www.nsc.org/ehc/mobile/mse_fs.htm#problem Retrieved, February 18, 2007
[2] Department of Transportation and Communications, Land Transportation Office: Plans and Programs. Retrieved February 18, 2007 from http://www.lto.gov.ph/programs.html
[3] Nextag Comparison Shopping. http://www.nextag.com/emission-analyzer/search-html [4] Baylon, F., Dy, M., Quidilla, R., San Pascual, R.A., Dulay, A., “Implementation of a
portable automobile exhaust emission analyzer,” Presented during the ECE Student Forum, DLSU, December 2006.
[5] Edgerton, H. Motion of Vision: The Stroboscopic Revolution in Photography. Cambridge:
MIT Press. 1979. [6] DENR Administrative Order No. 81 Series of 2000. Implementing Rules And Regulations
For RA8749 [7] Light Dependent Resistor. (n.d.)., http://www.technologystudent.com/elec1.htm
Retrieved April 16, 2006. [8] IRidium 50 Datasheet. City Technology, 2000. [9] NOXO 100 Datasheet. Envitec International Products, 2005.

Portable Automobile Exhaust Emission Analyzer 27
The Authors:
Fulton Baylon finished his B.S.ECE course from De La Salle University-Manila and graduated last October 2006. John Michael G. Dy finished his B.S.ECE course from De La Salle University-Manila and graduated last October 2006.
Roveric D. Quidilla finished his B.S.ECE course from De La Salle University-Manila and graduated last October 2006. He passed the Board Exam last November 2006. Ralph Andrew D.L. San Pascual has finished B.S.ECE course from De La Salle University and graduated last October 2006.
Ann E. Dulay is an Assistant Professor in the College of Engineering of De La Salle University. She is a member of the Microelectronics Group of the ECE Department. Her area of interest is in the fields of analog IC design, power line communication, switching power supplies, embedded systems, and robotics.