2 | AIA confidential and proprietary information. Not for distribution. 2 Fund Status of each plan...
46
-
Upload
gabriel-webb -
Category
Documents
-
view
213 -
download
1
Transcript of 2 | AIA confidential and proprietary information. Not for distribution. 2 Fund Status of each plan...


2|
AIA confidential and proprietary information. Not for distribution. 2
• Fund Status of each plan
• SUT Fund Performance as of September 30, 2009
• AIA Equity Fund Performance as of September 30, 2009
• Performance of each investment plan
• Investment Outlook and Strategy
• Other issue
2
Agenda

01
3
Fund Status of each plan

4|
AIA confidential and proprietary information. Not for distribution. 4
0
100
200
300
400
500
600
700
800
900
1000
Net Asset Value (NAV) Members
Plan 1 Plan 2 Plan 3Plan # Portion Fixed
Income Portion
Equity Portion
1 100% SUT Fund 90% 10%
90% SUT Fund
+ 10% AIA Equity Fund
85% SUT Fund
+ 15% AIA Equity Fund
2 81% 19%
3 77% 23%
(Million Baht)
(members)
Plan 1 Plan 2 Plan 3 TotalNet Asset Value
(Million Baht)360.09 55.5 52.93 468.52
No. of members 803 113 95 1,011
Fund Status As of September 30, 2009

02
5
SUT Fund Performance
As of September 30, 2009

6|
AIA confidential and proprietary information. Not for distribution. 6
Dec 31, 08 June 30, 09 Sep 30, 09
Net Asset value 399,769,590.09 437,987,923.79 455,020,473.67
No. of Units 26,406,281.00 27,884,762.00 28,342,909.00
No. of Members 987 1,009 1,011
Unit Price 15.1392 15.7071 16.0541
Net Return 0.64% 3.75%* 6.04%*
* YTD (Not Annualized)
Fund Status : SUT Fund
YTD Net Yield as of Oct 31, 09 = 5.57% ( from Jan 1, 09 to Oct 31, 09, not annualized)

7|
AIA confidential and proprietary information. Not for distribution. 7
Cost Market Price Protion
1)Bonds, Treasury Bills or BoT Bond 264,139,593 266,263,144 58.52%
2)Bank Deposits 57,711,660 58,850,667 12.92%
3)Debt Instruments - Commercial Banks 39,000,000 39,893,111 8.77%
4)Debt Instruments - Private companies 47,785,134 48,958,546 10.76%
5)Common Stock 34,647,429 41,432,916 9.11%
(Total Investment) 443,283,816 455,398,385 100.08%
6) Other Account Payable 0 -377,911 -0.08%
Net Asset Value 443,283,816 455,020,474 100.00%
SUT FUNDSecurities
Asset Allocation
Unit : Baht
As of September 30, 2009
8|
AIA confidential and proprietary information. Not for distribution. 8
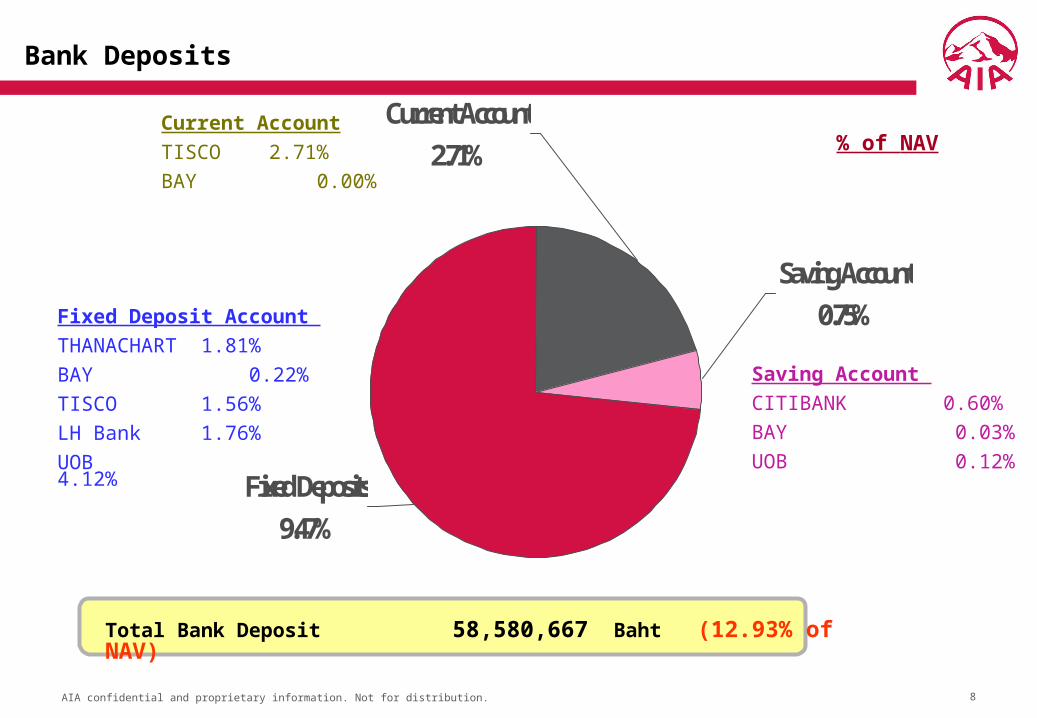
Fixed Deposit Account
THANACHART 1.81%
BAY 0.22%
TISCO 1.56%
LH Bank 1.76%
UOB 4.12%
Saving Account
CITIBANK 0.60%
BAY 0.03%
UOB 0.12%
Total Bank Deposit 58,580,667 Baht (12.93% of NAV)
% of NAVCurrent Account
TISCO 2.71%
BAY 0.00%
Bank Deposits
Fixed Deposits9.47%
Saving Account0.75%
Current Account2.71%

9|
AIA confidential and proprietary information. Not for distribution. 9
No. Issuer Credit Rating Issuer Code Maturity Cost (Baht) Market Value (Baht) Portion % NAV1 BANPU AA- BP165A 14/5/2012 8,997,960 9,139,913 2.01%
BP145A 14/5/2014 1,500,000 1,530,820 0.34%
BP125A 14/5/2012 1,000,000 1,014,986 0.22%
BP109A* 15/9/2010 888,000 896,272 0.20% 2.77%
2 SIAM CEMENT A SCC144A 1/4/2011 8,638,490 8,857,425 1.95% 1.95%
3 PTT PCL AAA PTTC153A 20/3/2015 6,286,338 6,465,193 1.42%
PTTC243A 6/3/2024 1,500,000 1,612,587 0.35%
PTTC16OA 12/10/2016 210,762 218,737 0.05% 1.82%
4 TOYOTA LEASING AAA TLT112A 28/2/2011 4,000,000 4,063,197 0.89%
TLT09DA 20/12/2009 700,195 715,128 0.16% 1.05%
5 THAI OIL PCL AA- TOP09OA 31/10/2009 4,000,428 4,100,558 0.90% 0.90%
6 HONDA LEASING AAA HLTC103A 25/3/2010 3,000,000 3,038,591 0.67%
HLTC10OA 18/10/2010 997,963 1,038,048 0.23% 0.90%
7 ADV INFO SVC AA AIS139A 7/9/2013 1,055,204 1,081,714 0.24%
AIS119A 7/9/2011 1,032,293 1,066,954 0.23%
AIS134A 30/4/2013 980,425 1,040,582 0.23% 0.70%
8 GLOW ENERGY A GLOW10DA* 11/12/2010 1,094,140 1,141,938 0.25%
GLOW09OA* 1/10/2009 502,160 513,741 0.11% 0.36%
9 DTAC A+ TAC09OA 30/10/2009 1,000,776 1,013,200 0.22% 0.22%
10 THAI AIRWAYS A THAI09OA* 20/10/2009 400,000 408,962 0.09% 0.09%
Total 47,785,134 48,958,546 10.76% 10.76%
Corporate Debenture Investment

10|
AIA confidential and proprietary information. Not for distribution. 10
3.19%3.84%
30.48%
62.49%
0.00%
10.00%
20.00%
30.00%
40.00%
50.00%
60.00%
70.00%
< 1 ปี� 1-3 ปี� 3-5 ปี� > 5 ปี�
Corporate,
10.76%Government,
58.52%
Financial
Inst., 21.70% (Modified Duration) = 1. 13 (Years)
Credit Rating by TRIS / FITCHAAA = 35%AA = 41%A = 24%
(Classify by duration)(Classify by issuer)
Summary of Fixed Income Investment
11|
AIA confidential and proprietary information. Not for distribution. 11
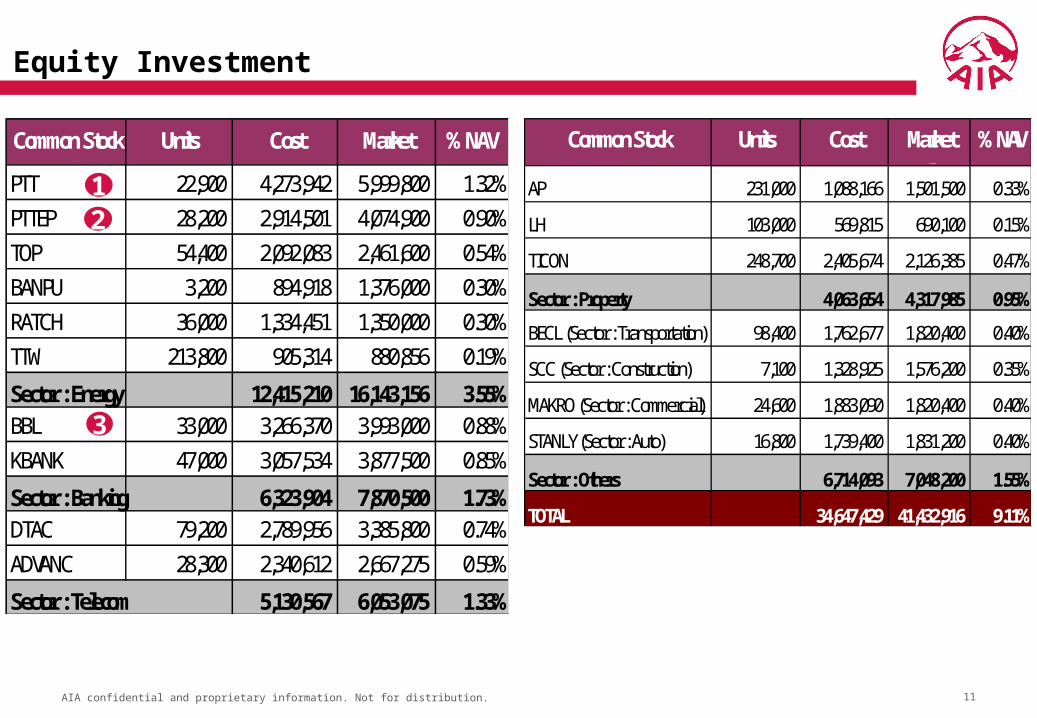
Common Stock Units Cost Market
Value
% NAV
PTT 22,900 4,273,942 5,999,800 1.32%
PTTEP 28,200 2,914,501 4,074,900 0.90%
TOP 54,400 2,092,083 2,461,600 0.54%
BANPU 3,200 894,918 1,376,000 0.30%
RATCH 36,000 1,334,451 1,350,000 0.30%
TTW 213,800 905,314 880,856 0.19%
Sector : Energy 12,415,210 16,143,156 3.55%BBL 33,000 3,266,370 3,993,000 0.88%
KBANK 47,000 3,057,534 3,877,500 0.85%
Sector : Banking 6,323,904 7,870,500 1.73%DTAC 79,200 2,789,956 3,385,800 0.74%
ADVANC 28,300 2,340,612 2,667,275 0.59%
Sector : Telecom 5,130,567 6,053,075 1.33%
12
3
Common Stock Units Cost Market
Value
% NAV
AP 231,000 1,088,166 1,501,500 0.33%
LH 103,000 569,815 690,100 0.15%
TICON 248,700 2,405,674 2,126,385 0.47%
Sector : Property 4,063,654 4,317,985 0.95%
BECL (Sector : Transportation) 98,400 1,762,677 1,820,400 0.40%
SCC (Sector : Construction) 7,100 1,328,925 1,576,200 0.35%
MAKRO (Sector : Commercial) 24,600 1,883,090 1,820,400 0.40%
STANLY (Sector : Auto) 16,800 1,739,400 1,831,200 0.40%
Sector : Others 6,714,093 7,048,200 1.55%
TOTAL 34,647,429 41,432,916 9.11%
Equity Investment

12|
AIA confidential and proprietary information. Not for distribution. 12
Income Baht
Interest on Bank Deposit 1,634,200.17
Interest on Bond and Treasury Bill 3,623,355.29
Interest on Promissory Note 701,990.38
Interest on Debenture 2,508,931.07
Dividend 1,625,352.00
Gain on Sales of Securities 3,457,530.59
Sub Total 13,551,359.50 Unrealized loss from mark-to market (Debt Instruments) (4,880,000.54)
Unrealized gain from mark-to-market (Equity Instruments) 17,402,858.31
Total Investment Income 26,074,217.27
January 1 – September 30, 09Earnings of fund
13|
AIA confidential and proprietary information. Not for distribution. 13
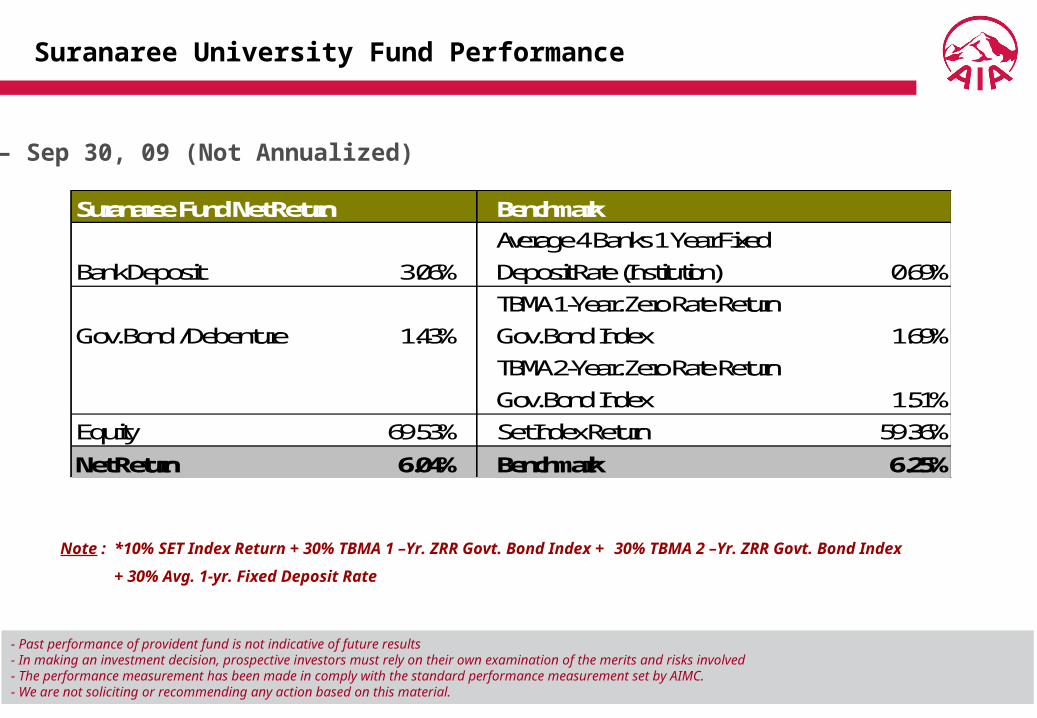
Suranaree Fund Net Return Benchmark
Bank Deposit 3.06%
Average 4 Banks 1 Year Fixed
Deposit Rate (Institution) 0.69%
Gov. Bond / Debenture 1.43%
TBMA 1-Year. Zero Rate Return
Gov. Bond Index 1.69%
TBMA 2-Year. Zero Rate Return
Gov. Bond Index 1.51%
Equity 69.53% Set Index Return 59.36%
Net Return 6.04% Benchmark 6.25%
Jan 1 30 09– Sep , (Not Annualized)
Suranaree University Fund Performance
Note : *10% SET Index Return + 30% TBMA 1 –Yr. ZRR Govt. Bond Index + 30% TBMA 2 –Yr. ZRR Govt. Bond Index
+ 30% Avg. 1-yr. Fixed Deposit Rate
- Past performance of provident fund is not indicative of future results - In making an investment decision, prospective investors must rely on their own examination of the merits and risks involved- The performance measurement has been made in comply with the standard performance measurement set by AIMC.- We are not soliciting or recommending any action based on this material.

14|
AIA confidential and proprietary information. Not for distribution. 14
Summary Equity Over Limit
Date Amount (Baht) % NAV
Oct 19 44,347,487.97 10.04%
Caused According to employee retirement effect to Net Asset Value of the fund decrease caused equity investment portion over investment policy limit.
Oct 20 43,620,700.96 9.89%
Suranaree Investment Policy :
Limit equity investment at : 10% of Net Asset Value
03
15
AIA Equity Fund Performance
As of September 30, 2009

16|
AIA confidential and proprietary information. Not for distribution. 16
31-ธ.ค.-08 30-ก.ย.-09 SUT
Net Asset value 63,970,898 108,728,952 13,497,689
No. of Units 20 20 1
No. of Members 921 943 208
Unit Price 8.0245 11.9257 11.9257
Net Return -38.67% 48.62%* 48.62%*
* YTD (Not Annualized)
Fund Status : AIA Equity
YTD Net Yield as of Oct 31, 09 = 39.60% ( from Jan 1, 09 to Oct 31, 09, not annualized)

17|
AIA confidential and proprietary information. Not for distribution. 17
Securities
Cost Market Price Portion
1)Bonds, Treasury Bills or BoT Bond 1,199,829 1,199,839 1.10%
2)Bank Deposits 1,925,472 1,933,204 1.78%
3) Common Stock 91,627,750 106,595,001 98.04%
(Total Investment) 94,753,051 109,728,044 100.92%
4) Suspense Contributions 0 -723,055 -0.67%
5) Other Account Payable 0 -276,037 -0.25%
Net Asset Value 94,753,051 108,728,952 100.00%
Equity FUND
Unit : Baht
Asset Allocation As of September 30, 2009

18|
AIA confidential and proprietary information. Not for distribution. 18
Common Stock Units Cost Market Value % NAV
PTT 60,600 14,686,582.64 15,877,200.00 14.60%PTTEP 49,900 5,867,833.60 7,210,550.00 6.63%BANPU 10,400 3,252,408.60 4,472,000.00 4.11%TOP 99,800 4,163,373.55 4,515,950.00 4.15%PTTAR 171,600 3,410,911.44 4,187,040.00 3.85%EGCO 31,400 2,751,409.92 2,409,950.00 2.22%RATCH 28,500 1,072,315.86 1,068,750.00 0.98%TTW 603,300 2,499,149.36 2,485,596.00 2.29%GROW 32,400 1,104,546.78 1,061,100.00 0.98%Sector : Energy 1,087,900 38,808,531.75 43,288,136.00 39.81%KBANK 111,400 7,021,563.69 9,190,500.00 8.45%BBL 63,200 6,337,830.82 7,647,200.00 7.03%SCB 55,300 3,764,175.38 4,700,500.00 4.32%KTB 127,100 1,070,495.94 1,150,255.00 1.06%Sector : Banking 357,000 18,194,065.83 22,688,455.00 20.86%ADVANC 79,000 6,588,500.48 7,445,750.00 6.85%DTAC 166,000 5,898,100.71 7,096,500.00 6.53%
Sector : Telecom 245,000 12,486,601.19 14,542,250.00 13.37%
1
4
2
3
5
Equity Investment

19|
AIA confidential and proprietary information. Not for distribution. 19
Common Stock Units Cost Market Value % NAV
LH 415,900 2,130,085.44 2,786,530.00 2.56%AP 324,700 1,446,425.15 2,110,550.00 1.94%STEC 197,300 1,058,378.61 1,302,180.00 1.20%Sector : Property 937,900 4,634,889.20 6,199,260.00 5.70%SCC 22,500 4,286,482.10 4,995,000.00 4.59%SCCC 4,700 910,875.30 1,104,500.00 1.02%
Sector : 27,200 5,197,357.40 6,099,500.00 5.61%BECL 233,300 4,346,086.16 4,316,050.00 3.97%
Sector : Transporation 233,300 4,346,086.16 4,316,050.00 3.97%DELTA 119,200 2,082,957.05 2,109,840.00 1.94%
MCOT 70,400 1,355,295.75 1,689,600.00 1.55%MAKRO 7,400 521,797.92 547,600.00 0.50%CPF 195,800 694,123.86 1,556,610.00 1.43%STANLY 23,500 2,024,852.54 2,561,500.00 2.36%PTTCH 13,600 1,281,191.59 996,200.00 0.92%Total 91,627,750.24 106,595,001.00 98.04%
Equity Investment (cont)
20|
AIA confidential and proprietary information. Not for distribution. 20
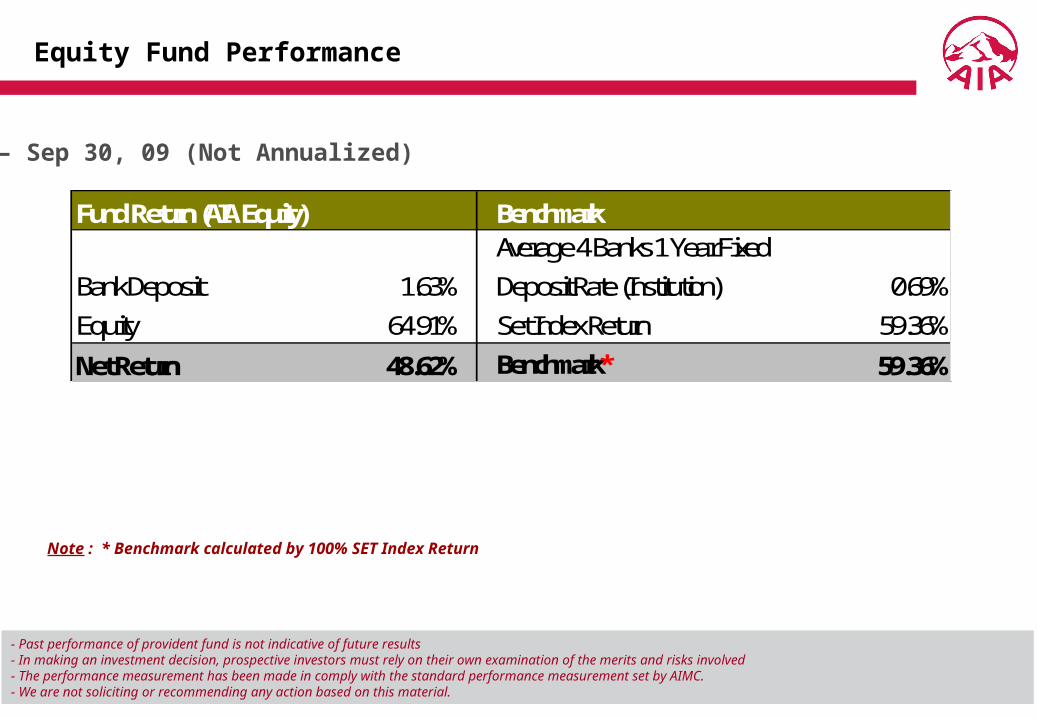
Fund Return (AIA Equity) Benchmark
Bank Deposit 1.63%
Average 4 Banks 1 Year Fixed
Deposit Rate (Institution) 0.69%
Equity 64.91% Set Index Return 59.36%
Net Return 48.62% Benchmark* 59.36%
Equity Fund Performance
Jan 1 30 09– Sep , (Not Annualized)
Note : * Benchmark calculated by 100% SET Index Return
- Past performance of provident fund is not indicative of future results - In making an investment decision, prospective investors must rely on their own examination of the merits and risks involved- The performance measurement has been made in comply with the standard performance measurement set by AIMC.- We are not soliciting or recommending any action based on this material.
21|
AIA confidential and proprietary information. Not for distribution. 21
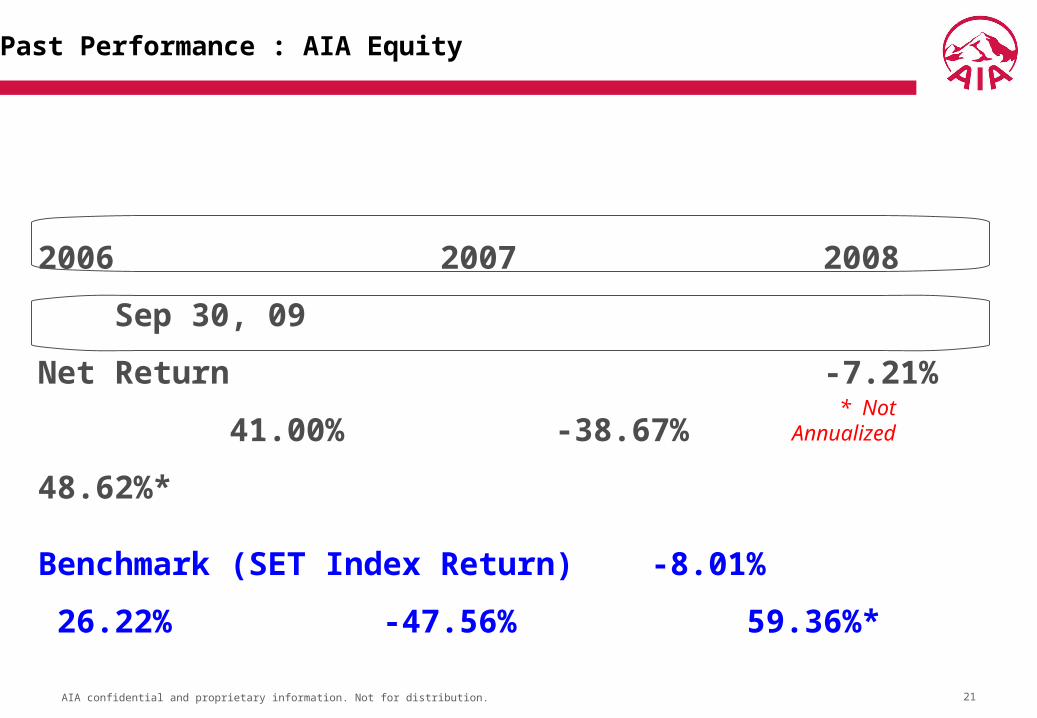
2006 2007
2008 30 09Sep ,
NNN NNNNNN -7.21% 41.00%
-38.67% 48.62%*
N( SET Index Return) -8.01% 26.22%
-47.56% 59.36%*
Past Performance : AIA Equity
* Not Annualized

04
22
Performance of each investment plan
23|
AIA confidential and proprietary information. Not for distribution. 23
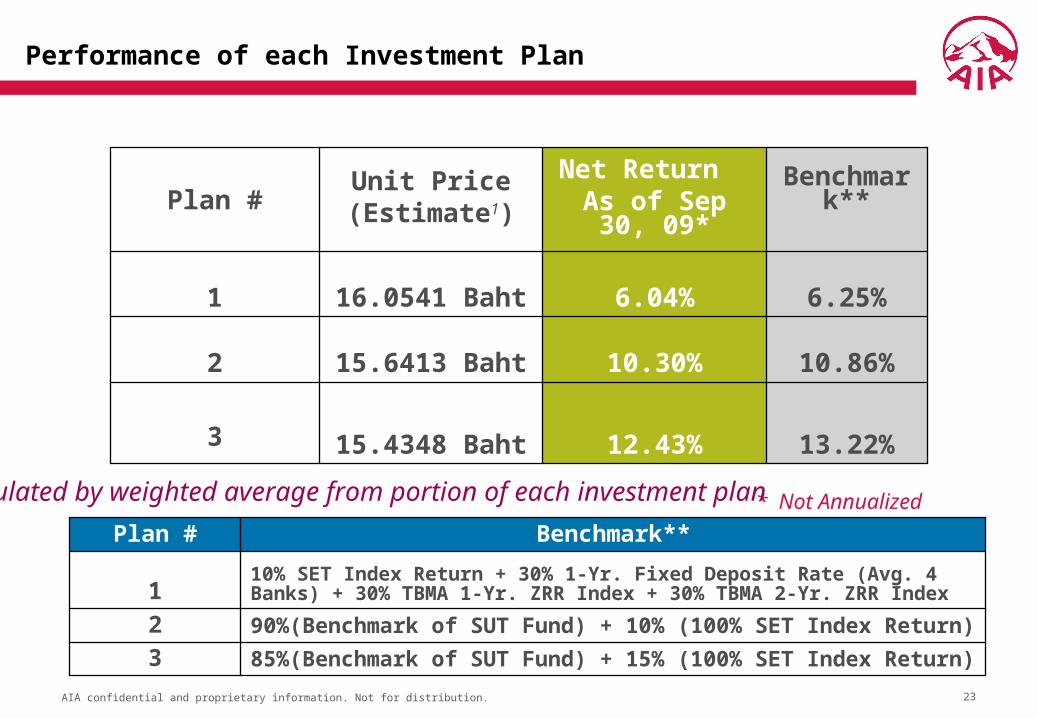
Performance of each Investment Plan
15434. 8 Baht
156413.Baht
160541.Baht
Unit Price(Estimate1)
10.86%10.30%2
13.22%12.43%3
6.25%6.04%1
Benchmark**
Net Return As of Sep 30,
09*Plan #
85%(Benchmark of SUT Fund) + 15% (100% SET Index Return)390%(Benchmark of SUT Fund) + 10% (100% SET Index Return)2
10% SET Index Return + 30% 1-Yr. Fixed Deposit Rate (Avg. 4 Banks) + 30% TBMA 1-Yr. ZRR Index + 30% TBMA 2-Yr. ZRR Index1
Benchmark**Plan # * Not
Annualized
1Calculated by weighted average from portion of each investment plan

24|
AIA confidential and proprietary information. Not for distribution. 24
Plan # Net Return 2008 Net Return (9 month)
Jan - Sep 09
Net Return (10 month )
Jan - Oct 09
1 0.64% 6.04% 5.57%
2 -2.59% 10.30% 8.97%
3 -4.17% 12.43% 10.67%
Compare Return of each Investment Plan
(2008 VS 9 month VS 10 month 2009)

05
25
Investment Outlook and Strategy

26|
AIA confidential and proprietary information. Not for distribution. 26
2007 2008 YTD 09Oct,
- 1 290year fixed . % 252. % 074 *. %
0.5
0.7
0.9
1.1
1.3
1.5
1.7
Dec 08 Feb 09 Apr 09 Jun 09 Aug 09 Oct 09
171. % p.a.
0625. % p.a.
1-Year Fixed Deposit Rate of BBL, KBANK, SCB, KTB
* YTD (Not Annualized)
27|
AIA confidential and proprietary information. Not for distribution. 27
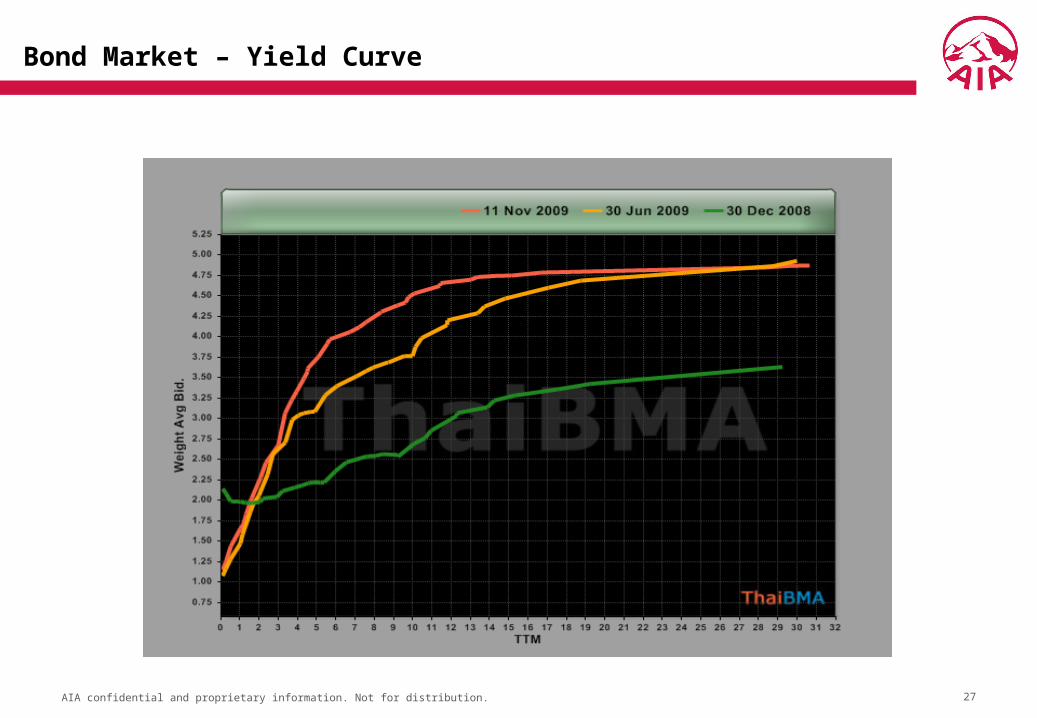
Bond Market – Yield Curve

28|
AIA confidential and proprietary information. Not for distribution. 28
125
127
129
131
133
135
Dec 08 Jan 09 Feb 09 Mar 09 Apr 09 May 09 Jun 09 July 09 Aug 09 Sep 09 Oct 09
ZRR Index - 2 years
ZRR Index - 1 year
130.12
131.71
2007 2008 YTD 09-1 Yr. ZRR Govt. Bond Index N/A N/A 1.82%*
2-Yr. ZRR Govt. Bond Index 6.17% 7.97% 1.23%*
Thai BMA 1-Year and 2-Year ZRR Government Bond Index
127.93
130.25
* YTD (Not Annualized)

29|
AIA confidential and proprietary information. Not for distribution. 29Source : www.aimc.or.th / Reuter
2007 2008 09SET Index Return 26.22% -47.56% 52.29%*
449.
96
624.00
SET Index Return
* YTD (Not Annualized)
30|
AIA confidential and proprietary information. Not for distribution. 30
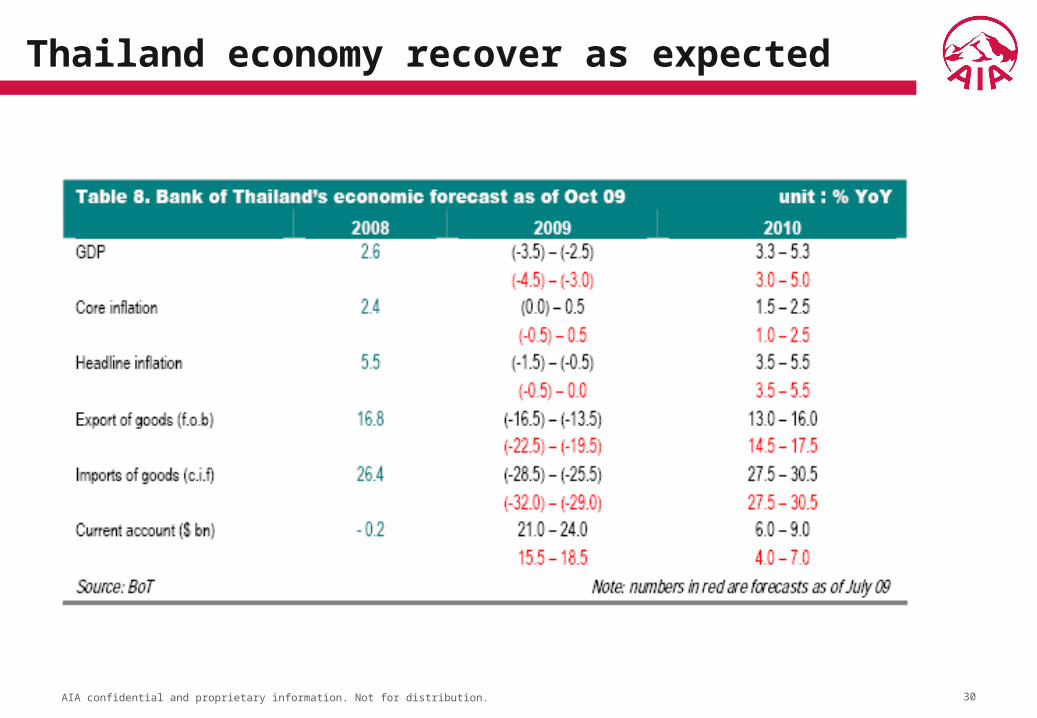
Thailand economy recover as expected

31|
AIA confidential and proprietary information. Not for distribution. 31
Global imbalance persist, The faith of USD

32|
AIA confidential and proprietary information. Not for distribution. 32
Liquidity pour into system with low gauge of inflationary

33|
AIA confidential and proprietary information. Not for distribution. 33
Risky asset supported by liquidity and USD carry trade
34|
AIA confidential and proprietary information. Not for distribution. 34
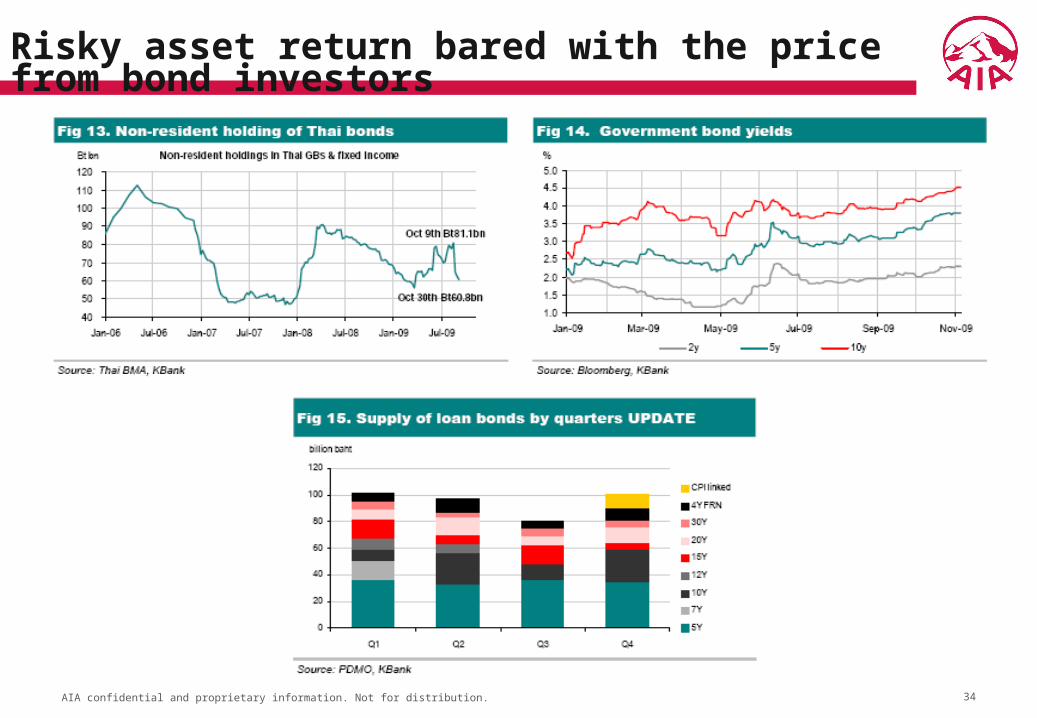
Risky asset return bared with the price from bond investors

35|
AIA confidential and proprietary information. Not for distribution. 35
• Straddle 1-2-3 Years Structure
• Duration range 1 - 1.5 Years • Take profit on short-dated credit / Long 5-year term corporate issue to
regain on maturity roll down
Fixed Income Strategy 2009

36|
AIA confidential and proprietary information. Not for distribution. 36
• 09 SET Index already passed its peak at 758.55
• Hold core position: PTT/BANPU/SCC/TOP/KBANK/BBL/SCB
• Trading Property/Petrochem: AP/LH/PTTCH• Reduce Value/Defensive play:
PTTEP/STANLY/TICON/TPC• Switch DTAC to ADVANC
• Risks Concern»Mapthaput overhang issue»Political uncertainty
• Down side risk supported by »Extending QE measures and extending low level
of global policy rate»LTF/RMF
The investment objective & Strategy : Equity

37|
AIA confidential and proprietary information. Not for distribution. 37
2009Forecast Return ( )
SUT
@ YTD @ Ex-ReturnEquity 9.8% 53.60% 9.5% 55.5%Fixed Income 83.5% 1.35% 85.5% 1.2%Cash 6.7% 2.86% 5.0% 3.0%
Total 100% 6.57% 100% 6.43%
AIAEQ
@ YTD @ Ex-ReturnEquity 92.1% 48.29% 98.0% 55.5%Fixed Income 1.9% 1.35% 0.0% 0%Cash 6.0% 2.86% 2.0% 3%
Total 100% 44.68% 100% 54.45%
Estimate Year End 09 Return@SUT @AIAEQ Aug-09 Dec-09
Plan I 100% 0% 6.6% 6.43%Plan II 90% 10% 10.4% 11.23%Plan III 85% 15% 12.3% 13.63%
Explaination to the performace
- Year-end SET Index target at 717 - Year-end lower fixed income return due to an expected yield shift up by 50 bps - Year-end target duration at 1.25 years - Year-end target equity portion 98%
Aug 09 Dec 09
Aug-09 Dec-09
* Forecast Return calculate according to expected assumption only, the real net return might be more or less than expectation.

06
38
Other Issue
39|
AIA confidential and proprietary information. Not for distribution. 39
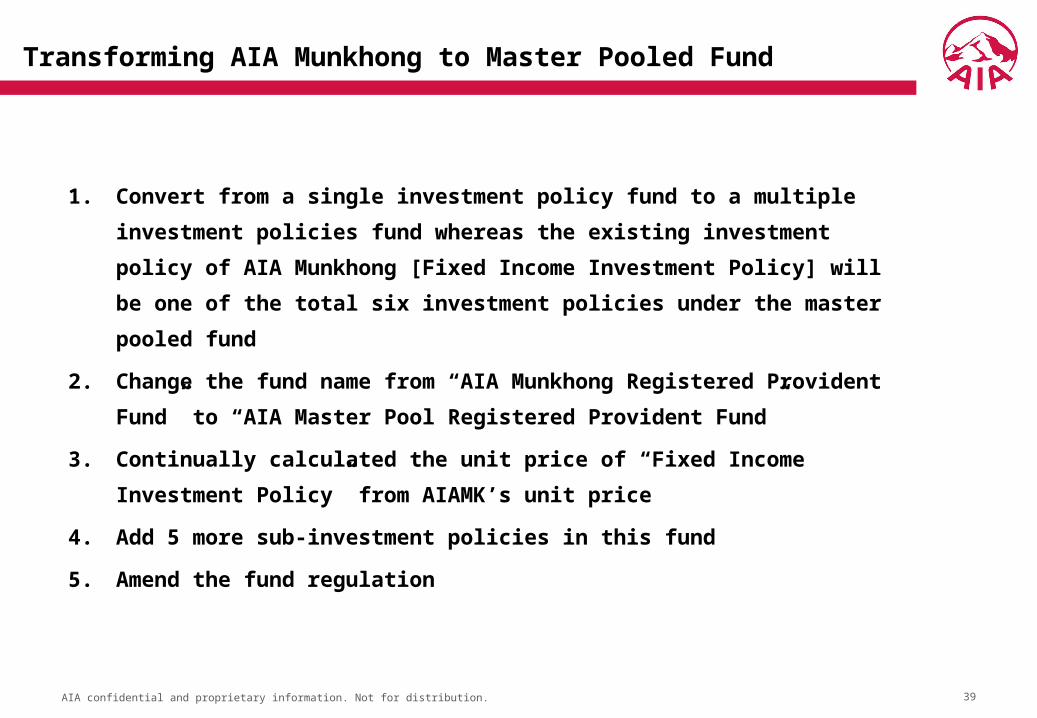
Transforming AIA Munkhong to Master Pooled Fund
1. Convert from a single investment policy fund to a multiple investment
policies fund whereas the existing investment policy of AIA Munkhong [Fixed
Income Investment Policy] will be one of the total six investment policies
under the master pooled fund
2. Change the fund name from “AIA Munkhong Registered Provident Fund” to
“AIA Master Pool Registered Provident Fund”
3. Continually calculated the unit price of “Fixed Income Investment Policy”
from AIAMK’s unit price
4. Add 5 more sub-investment policies in this fund
5. Amend the fund regulation

40|
AIA confidential and proprietary information. Not for distribution. 40
1. (Money Market)[AIA SATHIENSUP]
2. (Fixed Income)[AIA MUNKHONG]
3 (Mixed Fund with Equity < 5%)[ AIA PATTANA]
4. (Mixed Fund with Equity < 25%)[AIA PERMPOON]
5. (Equity Fund - Equity > 65%) [ AIA EQUITY]
6. (Feeder Fund) NN NNNNNNNN NN NNNNNNNN NNNN NNNNNNN NNNNNN NNNN NNNNNNN NNNNN(>80% .( )
(Investment in Asia Pacific stocks market except Japan stocks market)
Master Pooled Fund (Investment Policies)
Unit Price will be continually calculated from the old fund.

41|
AIA confidential and proprietary information. Not for distribution. 41
Member A.
AIA Munkho
ng (Fixed Income Policy)
Member C.
Member E.
AIA Pattana(Mixed Fund
Equity < 5%)
AIA Permpo
on(Mixed Fund
Equity < 25%)
Employee’s Choice (Before transform to Master Fund)
Low HighLevels of Risk
AIA Equity(Mixed Fund
Equity > 65%)
AIA Sathiens
up(Money market Policy)
Member B.
Member D.
42|
AIA confidential and proprietary information. Not for distribution. 42
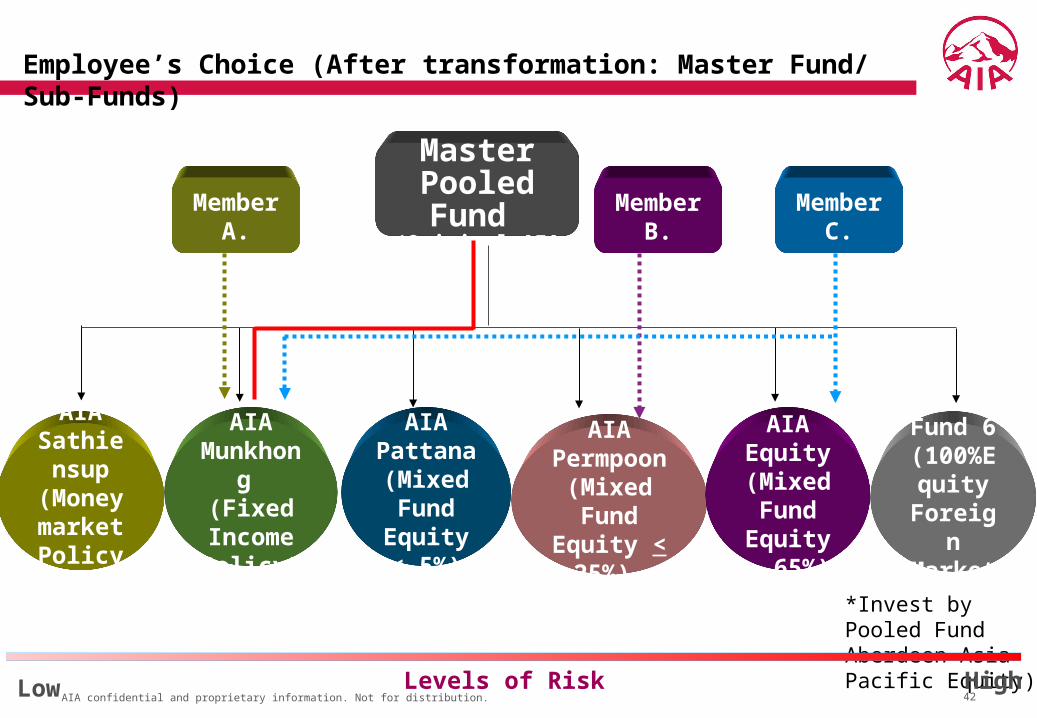
Employee’s Choice (After transformation: Master Fund/ Sub-Funds)
AIA Master Pooled Fund
(Original AIA Munkhong)
Sub-Fund 6(100%Equity Foreig
n Market*)
Member A.
Member B.
* Invest by Pooled Fund Aberdeen Asia Pacific Equity)
Member C.
AIA Munkh
ong (Fixed Income Policy)
AIA Pattan
a(Mixed Fund
Equity < 5%)
AIA Permpo
on(Mixed Fund
Equity < 25%)
AIA Equity(Mixed Fund
Equity > 65%)
AIA Sathiensup
(Money
market Policy)
Low HighLevels of Risk
43|
AIA confidential and proprietary information. Not for distribution. 43
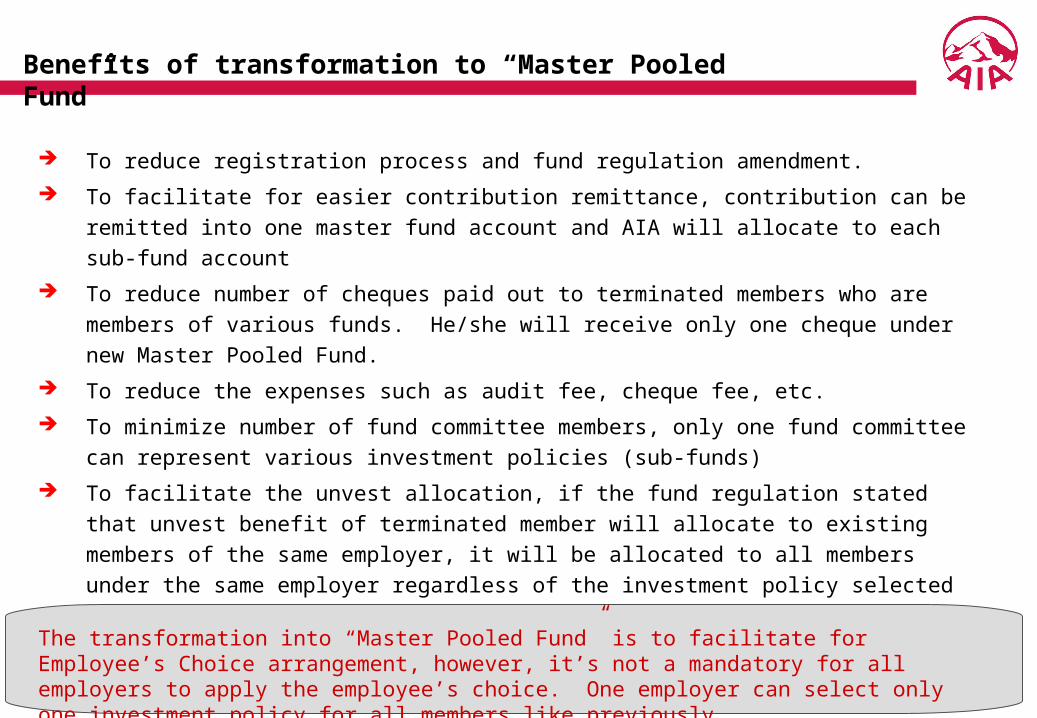
To reduce registration process and fund regulation amendment.
To facilitate for easier contribution remittance, contribution can be remitted into one master fund
account and AIA will allocate to each sub-fund account
To reduce number of cheques paid out to terminated members who are members of various
funds. He/she will receive only one cheque under new Master Pooled Fund.
To reduce the expenses such as audit fee, cheque fee, etc.
To minimize number of fund committee members, only one fund committee can represent
various investment policies (sub-funds)
To facilitate the unvest allocation, if the fund regulation stated that unvest benefit of terminated
member will allocate to existing members of the same employer, it will be allocated to all
members under the same employer regardless of the investment policy selected
The transformation into “Master Pooled Fund” is to facilitate for Employee’s Choice arrangement, however, it’s not a mandatory for all employers to apply the employee’s choice. One employer can select only one investment policy for all members like previously.
Benefits of transformation to “Master Pooled Fund”

44|
AIA confidential and proprietary information. Not for distribution. 44
The Fund needs to get approval in writing from all employers (Fund committee
needs to sign the consent letter to transfer the existing fund (AIA Sathiensup,
Pattana, Permpoon, Equity) to be Sub-Funds under Master Pooled Fund.)
At the beginning of the change, it might cause any inconvenience in making contri
bution remittance because of changing the name of the fund.
Disadvantage
The transformation into “Master Pooled Fund” is to facilitate for Employee’s Choice arrangement, however, it’s not a mandatory for all employers to apply the employee’s choice. One employer can select only one investment policy for all members like previously.
45|
AIA confidential and proprietary information. Not for distribution. 45
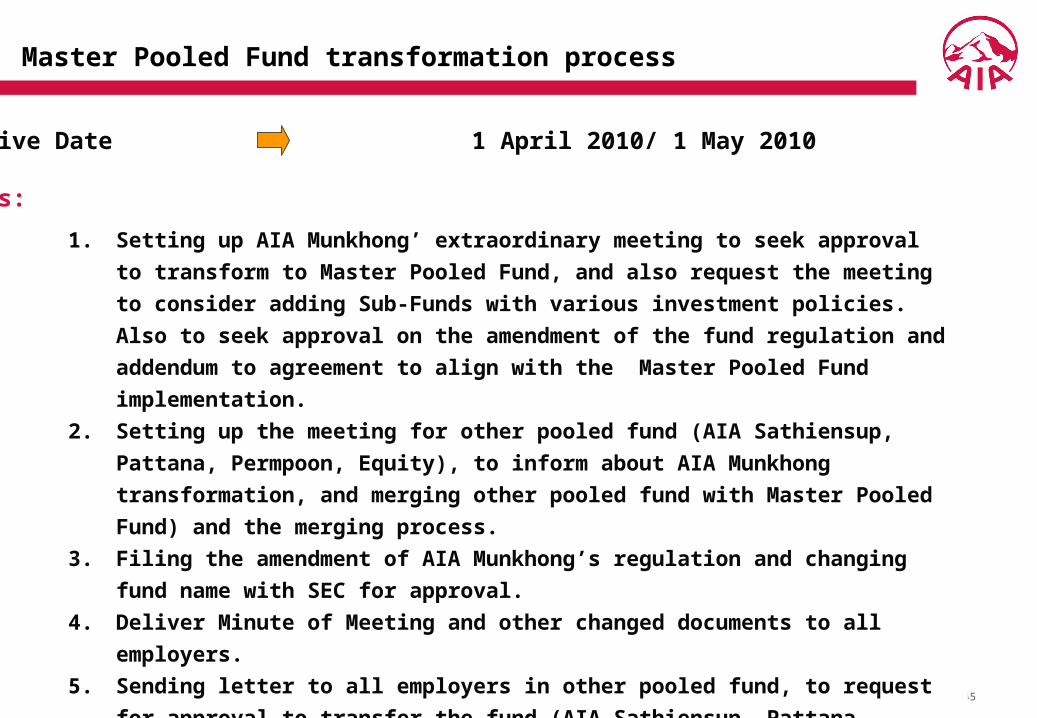
Master Pooled Fund transformation process
Tentative Date 1 April 2010/ 1 May 2010
Process:
1. Setting up AIA Munkhong’ extraordinary meeting to seek approval to transform to
Master Pooled Fund, and also request the meeting to consider adding Sub-Funds
with various investment policies. Also to seek approval on the amendment of the
fund regulation and addendum to agreement to align with the Master Pooled Fund
implementation.
2. Setting up the meeting for other pooled fund (AIA Sathiensup, Pattana, Permpoon,
Equity), to inform about AIA Munkhong transformation, and merging other pooled
fund with Master Pooled Fund) and the merging process.
3. Filing the amendment of AIA Munkhong’s regulation and changing fund name with
SEC for approval.
4. Deliver Minute of Meeting and other changed documents to all employers.
5. Sending letter to all employers in other pooled fund, to request for approval to
transfer the fund (AIA Sathiensup, Pattana, Permpoon, Equity) to be Sub-Funds
under Master Pooled Fund.
6. Transferring asset and members of other funds to join under Master Pooled Fund.
Thank you.
46
Investment involves risk. Investors should study investment details before making investment.
Past performance of provident fund is not a guarantee of future result.
Disclaimer: