Strategic Decision Making - uliege.be decision... · Strategic Decision Making - uliege.be

1
2
A systematic decision-making approach for the assessment of hybrid renewable 3
energy applications with techno-economic optimization: Application to 4
the Rajamangala University of Technology Srivijaya (Trang campus), 5
Southern Thailand 6
Weerasak Chaichan1*, Jompob Waewsak2, and Yves Gagnon3 7
1Faculty of Engineering, Thaksin University (Phatthalung Campus), 8
Phatthalung, 93210, Thailand 9
2Research Center in Energy and Environment, Faculty of Science, 10
Thaksin University (Phatthalung Campus), Phatthalung, 93210, Thailand 11
3Université de Moncton, Edmundston, New Brunswick, Canada 12
* Corresponding author, Email address: [email protected] 13
14
Abstract 15
This paper proposes a systematic decision-making approach for the assessment of 16
hybrid renewable energy applications with techno-economic optimization, with 17
application to the Rajamangala University of Technology Srivijaya (Trang Campus) in 18
southern Thailand. Using the Hybrid Optimization Model for Electric Renewable 19
(HOMER) Pro simulation tool, the techno-economic aspects of a grid-connected 20
combined solar photovoltaics (PV), wind turbine generator (WTG) and energy storage 21
(Li-Ion battery), are optimized in order to minimize the net present cost (NPC) and the 22
levelized cost of energy (LCOE). The model inputs are NASA-Surface Meteorology and 23
Solar Energy (SSE) and Modern-Era Retrospective analysis for Research and 24
Manuscript
1 2 3 4 5 6 7 8 9 10 11 12 13 14 15 16 17 18 19 20 21 22 23 24 25 26 27 28 29 30 31 32 33 34 35 36 37 38 39 40 41 42 43 44 45 46 47 48 49 50 51 52 53 54 55 56 57 58 59 60 61 62 63 64 65

Applications (MERRA) databases, and monthly power loads of the campus analyzed. The 25
results are compared and optimized amongst four combinations. It is found that the 26
optimal hybrid renewable energy power system offers the lowest NPC and the lowest 27
LCOE to satisfy the full load of the campus. 28
29
Keywords: Hybrid renewable energy, Optimization, Net present cost, Levelized cost of 30
energy, Energy storage 31
32
1. Introduction 33
In the last few years, as the use of fossil fueled is being questioned as a viable 34
long term source of energy, renewable energy has come to play an important role in 35
electricity portfolios (Hernandez, Alonso, Alvarez, & Carrillo, 2014; Singh, Singh, & 36
Kaushik, 2016). In particular, solar and wind resources are generating electricity for large 37
scale facilities and in rural remote areas (Zhou, Lou, Li, Lu, & Yang, 2010). Besides the 38
large scale applications, solar power generation and energy storage systems have proven 39
to be attractive energy sources not only for remote areas (Agarwal, Kumar, & Varun, 40
2013), but also for commercial buildings (Shaahid & Elhadidy, 2004; Kazem, Khatib, & 41
Sopian, 2013). However, the disadvantage of solar and wind energy is their stochastic 42
nature, thus affecting their reliability as an energy source for electricity generation. 43
Hybridization of both wind and solar energy was used to solve the problems 44
mentioned above, followed by increases in the complexity of systems (Yang, Zhou, Lu, 45
& Fang, 2008). In many countries, many rural areas are far away from transmission lines 46
(Borhanazad, Mekhilef, Ganapathy, Modiri-Delshad, & Mirtaheri, 2014; Mbaka, Mucho, 47
& Godpromesse, 2010). However, these areas can have important renewable energy 48
1 2 3 4 5 6 7 8 9 10 11 12 13 14 15 16 17 18 19 20 21 22 23 24 25 26 27 28 29 30 31 32 33 34 35 36 37 38 39 40 41 42 43 44 45 46 47 48 49 50 51 52 53 54 55 56 57 58 59 60 61 62 63 64 65

potentials, such as solar and wind energy, and hybrid technology development can be the 49
most appropriate approach. In the literature, hybrid solar/wind energy is often used in 50
remote areas (Borhanazad et al., 2014; Yong-jian, Da-wei, Hong-xun, & Ya-feng, 2009). 51
It was found that a hybrid power generation system between solar and wind energy can 52
reduce greenhouse gas (GHG) emissions and diesel consumption by up to 50% 53
(Blechinger et al., 2016). 54
The economic and environmental aspects of a stand alone renewable power 55
generation system were evaluated in Yemen (Ajlan, Tan, & Abdilahi, 2017). The 56
optimization results based on the levelized cost of energy (LCOE) and using HOMER 57
found that a hybrid solar/wind energy successfully reduced GHG emission by 30%. For 58
its part, a study on the economic feasibility of LCOE by using HOMER to simulate an 59
off-grid area in China showed that hybrid renewable energy systems can reduce GHG 60
emissions by 40 to 70%, in comparison to conventional electricity generation (Ye et al., 61
2017). 62
Hybrid energy systems analysis is quite complex. Therefore, it is necessary to 63
design software tools. Previously, the nineteen software tools were compared (Sinha, & 64
Chandel, 2014). HOMER was found to be the most widely used tools due to it has the 65
maximum combination of renewable energy systems. In addition, HOMER performs the 66
optimization and sensitivity analysis. Thus, the evaluation of many possible system 67
configurations can easier and faster. 68
In 2019, Thailand’s electricity generation portfolio was comprised of natural gas 69
(59.5%), coal and lignite (16.5%), fuel oil and diesel (0.1%), and renewable energy 70
(23.9%) (Department of Alternative Energy Development and Efficiency, 2020). From 71
the national policy, the Thai government is encouraging large investments in clean energy 72
1 2 3 4 5 6 7 8 9 10 11 12 13 14 15 16 17 18 19 20 21 22 23 24 25 26 27 28 29 30 31 32 33 34 35 36 37 38 39 40 41 42 43 44 45 46 47 48 49 50 51 52 53 54 55 56 57 58 59 60 61 62 63 64 65

through the PDP 2018 policy, where investments in renewable energy are planned, 73
focusing on solar and wind power (Ministry of Energy (Thailand), 2018). 74
Aligned with the Thai government’s objective of reducing the usage of fossil fuel 75
for electricity generation, this paper proposes a systematic decision-making approach for 76
the assessment of hybrid renewable energy applications with a techno-economic 77
optimization using the HOMER Pro computer simulation toolkit, with application to the 78
Rajamangala University of Technology Srivijaya (Trang Campus) in southern Thailand. 79
Hybrid renewable energy-based power applications, consisting of combined solar 80
photovoltaics (PV), wind turbine generator (WTG), and energy storage (Li-Ion battery), 81
are analyzed for better system reliability than without energy storage (Agarwal et al., 82
2013), as well as a grid connection for power backup. The results can provide a systematic 83
decision-making approach for renewable energy investments for the campus. 84
85
2. Methodology 86
In order to assess the most suitable hybrid power generation technology for the 87
location analyzed, this paper applied the HOMER Pro computer simulation toolkit as a 88
research tool for the analysis, planning and design optimization, as shown in Figure 1. 89
The input parameters of potential optimal system configurations with an objective 90
function are related to technical aspects and cost characteristics (e.g., solar PV, wind 91
turbine, power converter, battery, grid connection, and economics). The optimization 92
constraints are load demand, resources, technical aspects, reliability, and GHG emissions. 93
The output results of the optimal hybrid renewable energy configurations are optimized 94
for equipment sizes, costs data, energy generation and consumption, and total GHG 95
emissions. 96
1 2 3 4 5 6 7 8 9 10 11 12 13 14 15 16 17 18 19 20 21 22 23 24 25 26 27 28 29 30 31 32 33 34 35 36 37 38 39 40 41 42 43 44 45 46 47 48 49 50 51 52 53 54 55 56 57 58 59 60 61 62 63 64 65

2.1. Mathematical modelling and cost specifications of hybrid renewable energy systems 97
2.1.1. Mathematical modeling of the photovoltaics 98
photovoltaics (PV) converts solar irradiance into electricity. In this simulation, the 99
CanadianSolar MaxPower CS6X-325P PV panel model is used with a rated capacity of 100
325 W and an efficiency of 16.94%. The lifetime is assumed as the same as the project 101
lifetime (25 years). The operating temperature is 45°C, the derating factor is set as 102
12%/year, the capital and replacement costs are 700 $/kW and the O&M costs per year 103
are 14 $/kW (Duman & Güler, 2018). The power of the PV output in time ( ( )PVP t ) is 104
calculated using Eq. (1) (Bagheri, Shirzadi, Bazdar, & Kennedy, 2018; Mills & Al-Hallaj, 105
2004), 106
( ) = 1 25T
PV PV ,r PV P cell
T
G tP t P . f . . C T t
G STC (1) 107
where PV ,rP is the capacity of the PV array under standard test conditions in kW, PVf is 108
the derating factor, TG and TG STC are the actual conditions and standard conditions of 109
solar radiation, respectively, on the PV panel in kW/m2, and PC is the temperature 110
coefficient power (%/°C). 111
For its part, the real-time temperatures of the PV panels ( ( )cellT t ) were expressed 112
by Eq. (2) (Akhtari & Baneshi, 2019), 113
( ) = 1T c
cell cell ,NOTC ,NOTC
T ,NOTC
G tT t T t T T . .
G . (2) 114
where T is the ambient air temperature in °C, cell ,NOTCT and ,NOTCT are the nominal 115
operating temperature of the PV and the temperature of the ambient air, respectively, in 116
°C, c is the PV array efficiency (%) of the electrical conversion, while and are the 117
1 2 3 4 5 6 7 8 9 10 11 12 13 14 15 16 17 18 19 20 21 22 23 24 25 26 27 28 29 30 31 32 33 34 35 36 37 38 39 40 41 42 43 44 45 46 47 48 49 50 51 52 53 54 55 56 57 58 59 60 61 62 63 64 65

PV solar absorbance (%) and solar transmittance, respectively, of the shield above the 118
surface of the PV array (%). 119
2.1.2. Mathematical modeling of the WTG 120
For the simulation, the 3-blade 10 kW Eocycle E010 WTG model is used and 121
connected to the hybrid renewable power system at the AC bus. The lifetime of the WTG 122
is 20 years, the hub height is 16 m, the cut-in and cut-out wind speed is 2.75 m/s and 123
20 m/s respectively, the capital and replacement costs are 20,000 $ (Abo-elyousr & 124
Elnozahy, 2018), and the costs of O&M is 150 $/year (Dawoud et al., 2015). The wind 125
speeds at the hub height ( wv ) are obtained using Eq. (3), 126
0
0
ln
( ) =
ln
hub
w anem
anem
H
Hv t v t .
H
H
(3) 127
where anemv is the speeds at the height of the anemometer in m/s, hubH and anemH are 128
the heights of the hub and the anemometer, respectively, in m, and 0H is the surface 129
roughness length in m. 130
The output power from the WTG under standard conditions of temperature and 131
pressure at each wind speed is calculated by determining the wind speed at the hub high 132
using Eq. (4) (Dahiru & Tan, 2020), 133
3 3
3 3
0
( ) =
0
w i
w iw,r i w r
r iw,STP
w,r r w o
w o
v t v
v t vP . v v t v
v vP t
P v v t v
v t v
(4) 134
1 2 3 4 5 6 7 8 9 10 11 12 13 14 15 16 17 18 19 20 21 22 23 24 25 26 27 28 29 30 31 32 33 34 35 36 37 38 39 40 41 42 43 44 45 46 47 48 49 50 51 52 53 54 55 56 57 58 59 60 61 62 63 64 65

where w,rP is the wind turbine generator power output at rated wind speed, rv is the rated 135
wind speed, iv and ov are the cut-in and cut-out wind speeds, respectively, of the WTG. 136
The output value to actual conditions is calculated by the actual air density value 137
using Eq. (5) (Bagheri, Delbari, Pakzadmanesh, & Kennedy, 2019; HOMER, 2016), 138
( ) = w w,STP
o
tP t P t . (5) 139
where and o are the real air density in kg/m3 and the air density at standard pressure 140
and temperature (1.225 kg/m3), respectively. 141
2.1.3. Mathematical modeling of the power converter 142
DC/AC and AC/DC power converters are required for the hybrid system, which 143
is integrating DC power sources, such as PV, while the demand is an AC load. In this 144
study, a power converter model System Converter is used. The lifetime of the power 145
converter is 15 years, the capital and replacement costs of the power converter are 146
750 $/kW, while the costs of O&M are 15 $/kW/year (Duman & Güler, 2018), with 147
an efficiency of 95%. 148
2.1.4. Mathematical modeling of the Li-Ion battery 149
The battery is the energy storage in the hybrid renewable energy power system 150
that provides a more reliable power source, while being able to cover sudden increases in 151
the load demand. Therefore, it contributes in improving the system stability and 152
reliability. The Trojan SSIG 06 255 model is used in this study. The lifetime cycle of the 153
battery is 914.3 kWh, the capital and replacement costs of the battery are 167 $/unit, the 154
O&M costs are 8 $/unit/year, a nominal capacity of 1.52 kWh, a nominal voltage of 6 V, 155
a roundtrip efficiency of 80%, and maximum charge and discharge currents of 45 A and 156
300 A, respectively. The minimum state of charge (SOC) is set to 30 % (Duman & Güler, 157
1 2 3 4 5 6 7 8 9 10 11 12 13 14 15 16 17 18 19 20 21 22 23 24 25 26 27 28 29 30 31 32 33 34 35 36 37 38 39 40 41 42 43 44 45 46 47 48 49 50 51 52 53 54 55 56 57 58 59 60 61 62 63 64 65

2018). The storage capacity of the considered batteries is given by Eq. (6) (Baek et al., 158
2016), 159
= wh L Conv BATC E .AD. . .DOD (6) 160
where LE is the total load in kWh/day, AD is the daily autonomy, DOD is the depth of 161
discharge of the battery, while Conv and BAT are the converter and battery efficiencies, 162
respectively. 163
2.1.5. Economic model 164
As mentioned above, in this study, the total net present cost (NPC) and the 165
levelized cost of energy (LCOE) are used as the main indicators to compare the economic 166
feasibility of the various scenarios studied. The objective function is to minimize the total 167
NPC of the hybrid renewable energy system, which can be calculated using Eq. (7) 168
(HOMER, 2016; Acuña et al., 2018), 169
= proj
TACObjective function min NPC min
DF i,n (7) 170
where TAC is the total annualized cost ($/year), projDF i,n is the discount factor based 171
on the interest rate. 172
The LCOE is calculated to compare the different hybridization scenarios. The 173
LCOE is the cost per unit of useful electrical energy produced by the hybrid renewable 174
energy system, and it is expressed as in Eq. (8) (HOMER, 2016), 175
load
TACLCOE
E (8) 176
where loadE is the total electrical load (kWh/year) of the hybrid renewable energy system. 177
1 2 3 4 5 6 7 8 9 10 11 12 13 14 15 16 17 18 19 20 21 22 23 24 25 26 27 28 29 30 31 32 33 34 35 36 37 38 39 40 41 42 43 44 45 46 47 48 49 50 51 52 53 54 55 56 57 58 59 60 61 62 63 64 65

The renewable fraction (RF) is the fraction of the energy delivered to the total load 178
from renewable power sources, which is calculated by determining the wind speed at the 179
hub height using Eq. (9) (HOMER, 2016), 180
= 1- g ,non ren loadRF E / E (9) 181
where, g ,non renE is the nonrenewable electrical production (kWh/year). 182
2.2 Mathematical modelling of the air pollution 183
Power generation from fossil fuels affects air pollution by releasing carbon 184
dioxide (CO2) to the atmosphere. Therefore, in this study, the total CO2 emissions are 185
calculated from the hybrid renewable energy system. It is related to the rate of fuel 186
consumption (Halabi & Mekhilef, 2018) as given in Eq. (10): 187
3 667comp f fuel f cTCE . .m .LHV .CEF .X (10) 188
where, compTCE is the total amount of CO2 emissions by component, fm is the amount 189
of diesel fuel (liters), fuelLHV is the lower fuel heating value (MJ/L), fCEF and cX are 190
the carbon emission factor (ton carbon/TJ) and the oxidized fraction of carbon, 191
respectively, where each 3.667 gm of CO2 include a quantity of 1 gm of carbon. 192
193
3. Case Study 194
In the proposed study, a systematic decision-making approach for the assessment 195
of hybrid renewable energy applications with techno-economic optimization, with 196
application to the Rajamangala University of Technology Srivijaya (Trang campus), is 197
proposed. The area is located at 7 34 4. ' N latitude and 99 21' E longitude, and it has 198
an annual average temperature of 26.54 ๐C. The HOMER Pro computer simulation 199
1 2 3 4 5 6 7 8 9 10 11 12 13 14 15 16 17 18 19 20 21 22 23 24 25 26 27 28 29 30 31 32 33 34 35 36 37 38 39 40 41 42 43 44 45 46 47 48 49 50 51 52 53 54 55 56 57 58 59 60 61 62 63 64 65

software is used to analyse and evaluate the techno-economic performance parameters of 200
NPC, LCOE, RF, and GHG emissions. Figure 2 shows the schematic diagram of the 201
hybrid renewable energy system, consisting of combined solar PV, WTG, and energy 202
storage (Li-Ion battery), as well as a grid connection for power backup. The average 203
annual consumption of electrical energy for the winter and summer seasons are each given 204
as 6791.43 kWh/day. Further, the monthly electrical load profiles are illustrated in Figure 3. 205
It can be seen that the electrical load demand has low values outside of academic 206
semesters (March-June, November) while the load demand increases when the academic 207
semesters are on-going. 208
The power potential of renewable energy resources for the Rajamangala 209
University of Technology Srivijaya (Trang campus) are presented in Figure 4. The model 210
inputs are renewable energy resource databases, i.e., NASA-SSE for solar energy (NASA 211
Surface meteorology and Solar Energy service, 2020), MERRA for wind energy (NASA 212
Global Modeling and Assimilation Office, 2020), where the mean monthly average solar 213
radiation (ASR) and the mean monthly average wind speed (AWS) are 5.17 kWh/m2/day 214
and 3.64 m/s, respectively. According to this figure, the monthly ASR was highest in 215
February (6.24 kWh/m2/day) and lowest in November (4.49 kWh/m2/day) due to the rainy 216
season, as seen in Figure 4a. For its part, the monthly AWS profile is illustrated in Figure 217
4b, with the highest and lowest monthly average wind speeds in December (4.98 m/s) and 218
April (2.5 m/s), respectively. 219
220
4. Results and Discussion 221
In the scenarios studied, the project lifetime is 20 years, the maximum annual 222
capacity shortage is 5%, the nominal discount rate is 6%, and the expected inflation rate 223
1 2 3 4 5 6 7 8 9 10 11 12 13 14 15 16 17 18 19 20 21 22 23 24 25 26 27 28 29 30 31 32 33 34 35 36 37 38 39 40 41 42 43 44 45 46 47 48 49 50 51 52 53 54 55 56 57 58 59 60 61 62 63 64 65

is 2%. The details of the optimization results for four combinations are shown in Tables 224
1 and 2. 225
According to the results in Table 1, it is found that a hybrid renewable energy 226
system, incorporating PV, WTG, battery, converter, and grid connection (Scenario 1), is 227
the optimal application as it offers the lowest NPC (3,696,697 $/project lifetime) and the 228
lowest LCOE (0.1090 $) to satisfy the full load. On the GHG emissions point of view, 229
the optimal hybrid renewable energy system emits 715,281 kg/year of GHG. The fraction 230
of the energy delivered to the total load from renewable power sources of 54.3 %. 231
Based on the results presented in Table 2 for load demand of 6791.43 kWh/day, the 232
best hybrid renewable energy system (Scenario 1) composed of a hybridized solar PV 233
with a capacity of 1,020 kW, 9 sets of WTG with a total of 90 kW capacity, 72 Li-Ion 234
batteries of 1.52 kWh each, and a power converter of 490 kW. 235
The power balance and the battery SOC for one week of May are shown, as an 236
example, in Figure 5 in order to understand the power exchange between the components 237
(PV and WTG) of the hybrid renewable energy system. The battery SOC can be charged 238
continuously during the operation of the system. In summary, the hybrid power 239
generation system is stability and could provide a low cost of energy. 240
Currently, Rajamangala University of Technology Srivijaya has considered 241
investment in renewable energy power project on other campuses. The Trang campus is 242
in the process of the appropriate energy potential analysis. Therefore, an appropriate 243
system of economic feasibility analysis and system component sizing from Tables 1 and 244
2, respectively, can be used as a reference in the proposed budgeting system for further 245
renewable energy investment. 246
247
1 2 3 4 5 6 7 8 9 10 11 12 13 14 15 16 17 18 19 20 21 22 23 24 25 26 27 28 29 30 31 32 33 34 35 36 37 38 39 40 41 42 43 44 45 46 47 48 49 50 51 52 53 54 55 56 57 58 59 60 61 62 63 64 65

5. Conclusions 248
A systematic decision-making approach for the assessment of hybrid renewable 249
energy applications with techno-economic optimization, with application to the 250
Rajamangala University of Technology Srivijaya (Trang Campus) in southern Thailand, 251
is proposed. Using the HOMER Pro computer simulation tool-kit, the techno-economic 252
aspects of hybrid renewable energy-based power applications, with grid connection for 253
power backup, are optimized in order to minimize the net present cost (NPC) and the 254
levelized cost of energy (LCOE). Four combinations are compared, namely 1) PV-WTG-255
battery-converter-grid, 2) WTG-battery-converter-grid, 3) PV-battery-converter-grid and 256
4) grid connection only (base case). It is found that the hybrid renewable energy system 257
incorporating PV-WTG-battery-converter-grid (Scenario 1) is the optimal application as 258
it offers the lowest NPC (3,696,697 $/project lifetime) and the lowest LCOE (0.1090 $). 259
The optimal hybrid renewable energy system emits 715,281 kg/year of GHG on an annual 260
basis, while the battery SOC can be charged continuously during the operation of the 261
system. 262
From the results, the cost of energy is lower compared to the present (0.0210 $). 263
if another renewable energy is used, such as community waste or agricultural waste, it is 264
expected to significantly increase the fraction of electricity generated from renewable 265
energy, thus reducing the LCOE and the GHG emissions. 266
267
References 268
Abo-Elyousr, F. K., & Elnozahy, A. (2018). Bi-objective economic feasibility of hybrid 269
micro-grid systems with multiple fuel options for islanded areas in Egypt. 270
Renewable Energy, 128, 37–56. doi:10.1016/j.renene.2018.05.066 271
1 2 3 4 5 6 7 8 9 10 11 12 13 14 15 16 17 18 19 20 21 22 23 24 25 26 27 28 29 30 31 32 33 34 35 36 37 38 39 40 41 42 43 44 45 46 47 48 49 50 51 52 53 54 55 56 57 58 59 60 61 62 63 64 65

Acuña, L. G., Lake, M., Padilla, R. V., Lim, Y. Y., Ponzón, E. G., & Soo Too, Y. C. 272
(2018). Modelling autonomous hybrid photovoltaic-wind energy systems under 273
a new reliability approach. Energy Conversion and Management, 172, 357–369. 274
doi:10.1016/j.enconman.2018.07.025 275
Agarwal, N., Kumar, A., & Varun. (2013). Optimization of grid independent hybrid 276
PV–diesel–battery system for power generation in remote villages of Uttar 277
Pradesh, India. Energy for Sustainable Development, 17(3), 210–219. 278
doi:10.1016/j.esd.2013.02.002 279
Ajlan, A., Tan, C. W., & Abdilahi, A. M. (2017). Assessment of environmental and 280
economic perspectives for renewable-based hybrid power system in Yemen. 281
Renewable and Sustainable Energy Reviews, 75, 559–570. 282
doi:10.1016/j.rser.2016.11.024 283
Akhtari, M. R., & Baneshi, M. (2019). Techno-economic assessment and optimization 284
of a hybrid renewable co-supply of electricity, heat and hydrogen system to 285
enhance performance by recovering excess electricity for a large energy 286
consumer. Energy Conversion and Management, 188, 131-141. 287
doi:10.1016/j.enconman.2019.03.067 288
Baek, S., Park, E., Kim, M.-G., Kwon, S. J., Kim, K. J., Ohm, J. Y., & del Pobil, A. P. 289
(2016). Optimal renewable power generation systems for Busan metropolitan 290
city in South Korea. Renewable Energy, 88, 517–525. 291
doi:10.1016/j.renene.2015.11.058 292
Bagheri, M., Delbari, S. H., Pakzadmanesh, M., & Kennedy, C. A. (2019). City-293
integrated renewable energy design for low-carbon and climate-resilient 294
communities. Applied Energy, 239, 1212–1225. 295
1 2 3 4 5 6 7 8 9 10 11 12 13 14 15 16 17 18 19 20 21 22 23 24 25 26 27 28 29 30 31 32 33 34 35 36 37 38 39 40 41 42 43 44 45 46 47 48 49 50 51 52 53 54 55 56 57 58 59 60 61 62 63 64 65

doi:10.1016/j.apenergy.2019.02.031 296
Bagheri, M., Shirzadi, N., Bazdar, E., & Kennedy, C. A. (2018). Optimal planning of 297
hybrid renewable energy infrastructure for urban sustainability: Green 298
Vancouver. Renewable and Sustainable Energy Reviews, 95, 254–264. 299
doi:10.1016/j.rser.2018.07.037 300
Blechinger, P., Cader, C., Bertheau, P., Huyskens, H., Seguin, R., & Breyer, C. (2016). 301
Global analysis of the techno-economic potential of renewable energy hybrid 302
systems on small islands. Energy Policy, 98, 674–687. 303
doi:10.1016/j.enpol.2016.03.043 304
Borhanazad, H., Mekhilef, S., Gounder Ganapathy, V., Modiri-Delshad, M., & 305
Mirtaheri, A. (2014). Optimization of micro-grid system using MOPSO. 306
Renewable Energy, 71, 295–306. doi:10.1016/j.renene.2014.05.006 307
Dahiru, A. T., & Tan, C. W. (2019). Optimal Sizing and Techno-economic Analysis of 308
Grid-connected Nanogrid for Tropical Climates of the Savannah. Sustainable 309
Cities and Society, 101824. doi:10.1016/j.scs.2019.101824 310
Dawoud, S. M., Lin, X. N., Sun, J. W., Okba, M. I., Khalid, M. S., & Waqar, A. (2015). 311
Feasibility Study of Isolated PV-Wind Hybrid System in Egypt. Advanced 312
Materials Research, 1092-1093, 145–151. 313
doi:10.4028/www.scientific.net/amr.1092-1903 314
Department of Alternative Energy Development and Efficiency. (2020, November 5). 315
Energy Situation January - December 2019. Retrieved from 316
https://www.dede.go.th/ewt_news.php?nid=52877 317
Duman, A. C., & Güler, Ö. (2018). Techno-economic analysis of off-grid PV/wind/fuel 318
cell hybrid system combinations with a comparison of regularly and seasonally 319
1 2 3 4 5 6 7 8 9 10 11 12 13 14 15 16 17 18 19 20 21 22 23 24 25 26 27 28 29 30 31 32 33 34 35 36 37 38 39 40 41 42 43 44 45 46 47 48 49 50 51 52 53 54 55 56 57 58 59 60 61 62 63 64 65

occupied households. Sustainable Cities and Society, 42, 107–126. 320
doi:10.1016/j.scs.2018.06.029 321
Halabi, L. M., & Mekhilef, S. (2018). Flexible hybrid renewable energy system design 322
for a typical remote village located in tropical climate. Journal of Cleaner 323
Production, 177, 908–924. doi:10.1016/j.jclepro.2017.12.248 324
HOMER. (2020, November 2). HOMER ® pro version 3.7 user manual © all rights 325
reserved. Retrieved from https://www.homerenergy.com 326
Kazem, H. A., Khatib, T., & Sopian, K. (2013). Sizing of a standalone 327
photovoltaic/battery system at minimum cost for remote housing electrification 328
in Sohar, Oman. Energy and Buildings, 61, 108–115. 329
doi:10.1016/j.enbuild.2013.02.011 330
Mbaka, N. E., Mucho, N. J., & Godpromesse, K. (2010). Economic evaluation of small-331
scale photovoltaic hybrid systems for mini-grid applications in far north 332
Cameroon. Renewable Energy, 35(10), 2391–2398. 333
doi:10.1016/j.renene.2010.03.005 334
Mills, A., & Al-Hallaj, S. (2004). Simulation of hydrogen-based hybrid systems using 335
Hybrid2. International Journal of Hydrogen Energy, 29(10), 991–999. 336
doi:10.1016/j.ijhydene.2004.01.004 337
Ministry of Energy (Thailand). (2020, November 5). Thailand Power Development Plan 338
2018. Retrieved from http://www.eppo.go.th/index.php/th/plan-policy/tieb/pdp 339
Mundo-Hernández, J., de Celis Alonso, B., Hernández-Álvarez, J., & de Celis-Carrillo, 340
B. (2014). An overview of solar photovoltaic energy in Mexico and Germany. 341
Renewable and Sustainable Energy Reviews, 31, 639–649. 342
doi:10.1016/j.rser.2013.12.029 343
1 2 3 4 5 6 7 8 9 10 11 12 13 14 15 16 17 18 19 20 21 22 23 24 25 26 27 28 29 30 31 32 33 34 35 36 37 38 39 40 41 42 43 44 45 46 47 48 49 50 51 52 53 54 55 56 57 58 59 60 61 62 63 64 65

NASA Global Modeling and Assimilation Office. (2020, November 7). Modern-Era 344
Retrospective analysis for Research and Applications (MERRA). Retrieved from 345
https://gmao.gsfc.nasa.gov/reanalysis/MERRA/ 346
NASA Surface meteorology and Solar Energy service. (2020, November 7). Solar 347
radiation data. Retrieved from http://www.soda-pro.com/web-348
services/radiation/nasa-sse 349
Shaahid, S. M., & Elhadidy, M. A., (2004). Prospects of autonomous/stand-alone hybrid 350
(photo-voltaic plus diesel plus battery) power systems in commercial 351
applications in hot regions. Renewable Energy, 29(2), 165-177. doi: 352
10.1016/S0960-1481(03)00194-0 353
Sinha, S., & Chandel, S. S. (2014). Review of software tools for hybrid renewable 354
energy systems. Renewable and Sustainable Energy Reviews, 32, 192–205. 355
doi:10.1016/j.rser.2014.01.035 356
Singh, S., Singh, M., & Kaushik, S. C. (2016). Feasibility study of an islanded 357
microgrid in rural area consisting of PV, wind, biomass and battery energy 358
storage system. Energy Conversion and Management, 128, 178–190. 359
doi:10.1016/j.enconman.2016.09.046 360
Yang, H., Zhou, W., Lu, L., & Fang, Z. (2008). Optimal sizing method for stand-alone 361
hybrid solar–wind system with LPSP technology by using genetic algorithm. 362
Solar Energy, 82(4), 354–367. doi:10.1016/j.solener.2007.08.005 363
Ye, B., Yang, P., Jiang, J., Miao, L., Shen, B., & Li, J. (2017). Feasibility and economic 364
analysis of a renewable energy powered special town in China. Resources, 365
Conservation and Recycling, 121, 40–50. doi:10.1016/j.resconrec.2016.03.003 366
367
1 2 3 4 5 6 7 8 9 10 11 12 13 14 15 16 17 18 19 20 21 22 23 24 25 26 27 28 29 30 31 32 33 34 35 36 37 38 39 40 41 42 43 44 45 46 47 48 49 50 51 52 53 54 55 56 57 58 59 60 61 62 63 64 65

Yong-jian, L., Da-wei, Y., Hong-xun, L. & Ya-feng, L. (2009). Wind-solar 368
complementary power inverter based on intelligent control. Proceedings of 4th 369
IEEE Conf. on Industrial Electronics and Applications, 3635-3638. doi: 370
10.1109/ICIEA.2009.5138884 371
Zhou, W., Lou, C., Li, Z., Lu, L., & Yang, H. (2010). Current status of research on 372
optimum sizing of stand-alone hybrid solar–wind power generation systems. 373
Applied Energy, 87(2), 380–389. doi:10.1016/j.apenergy.2009.08.01 374
1 2 3 4 5 6 7 8 9 10 11 12 13 14 15 16 17 18 19 20 21 22 23 24 25 26 27 28 29 30 31 32 33 34 35 36 37 38 39 40 41 42 43 44 45 46 47 48 49 50 51 52 53 54 55 56 57 58 59 60 61 62 63 64 65

Solar PV
- Lifetime
- Capital, replacement, O&M
- Derating factor
- Temperature coefficient
- Operating temperature
- Efficiency
Wind turbine
- Lifetime
- Capital, replacement, O&M
- Hub height
- Cut-in speed, cut-off speed
Power Converter
- Lifetime
- Capital, replacement, O&M
- Efficiency
Battery
- Lifetime
- Capital, replacement,
O&M
- Initial state of charge
- Minimum state of charge
Grid
- Grid power price
- Grid sellback price
Economics
- Project lifetime
- Interest and inflation rate
Load demand
- Energy demand requested by
the electrical load
Resources
- Availability of solar radiation
- Availability of wind
Technical
- Hourly operating reserve of
the load
- Hourly operating reserve of
RESs
Reliability
- Allowable capacity shortage
Emissions
- Penalties over GHG emissions
Search optimal system configuration with objective function: Min (NPC)
Optimal configuration plan
- Optimized equipment sizes - Energy generation and consumption
- Cost data - Total GHG emissions
Input parameters Optimization constranints
Figure 1 Methodology for the hybrid renewable energy planning and design
optimization.
The input parameters of potential optimal system configurations with an objective
function are related to technical aspects and cost characteristics (e.g., solar PV, wind
turbine, power converter, battery, grid connection, and economics). The optimization
constraints are load demand, resources, technical aspects, reliability, and GHG emissions.
The output results of the optimal hybrid renewable energy configurations are optimized
for equipment sizes, costs data, energy generation and consumption, and total GHG
emissions.
Manuscript

Figure 2 Modeling of a grid connected hybrid renewable energy system.
Figure shows the schematic diagram of the hybrid renewable energy system,
consisting of combined solar PV, WTG, and energy storage (Li-Ion battery), as well as a
grid connection for power backup. The average annual consumption of electrical energy
for the winter and summer seasons are each given as 6791.43 kWh/day.

Figure 3 Seasonal profiles of the electrical load.
It can be seen that the electrical load demand has low values outside of academic
semesters (March-June, November) while the load demand increases when the academic
semesters are on-going.
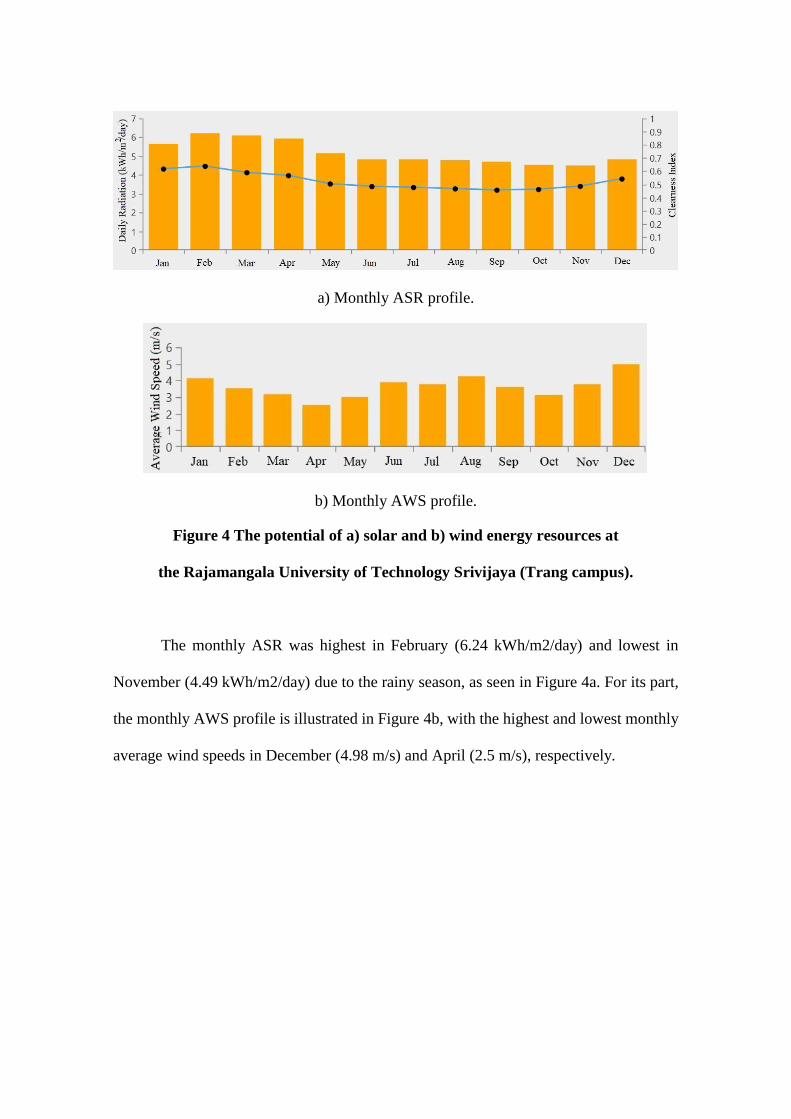
a) Monthly ASR profile.
b) Monthly AWS profile.
Figure 4 The potential of a) solar and b) wind energy resources at
the Rajamangala University of Technology Srivijaya (Trang campus).
The monthly ASR was highest in February (6.24 kWh/m2/day) and lowest in
November (4.49 kWh/m2/day) due to the rainy season, as seen in Figure 4a. For its part,
the monthly AWS profile is illustrated in Figure 4b, with the highest and lowest monthly
average wind speeds in December (4.98 m/s) and April (2.5 m/s), respectively.
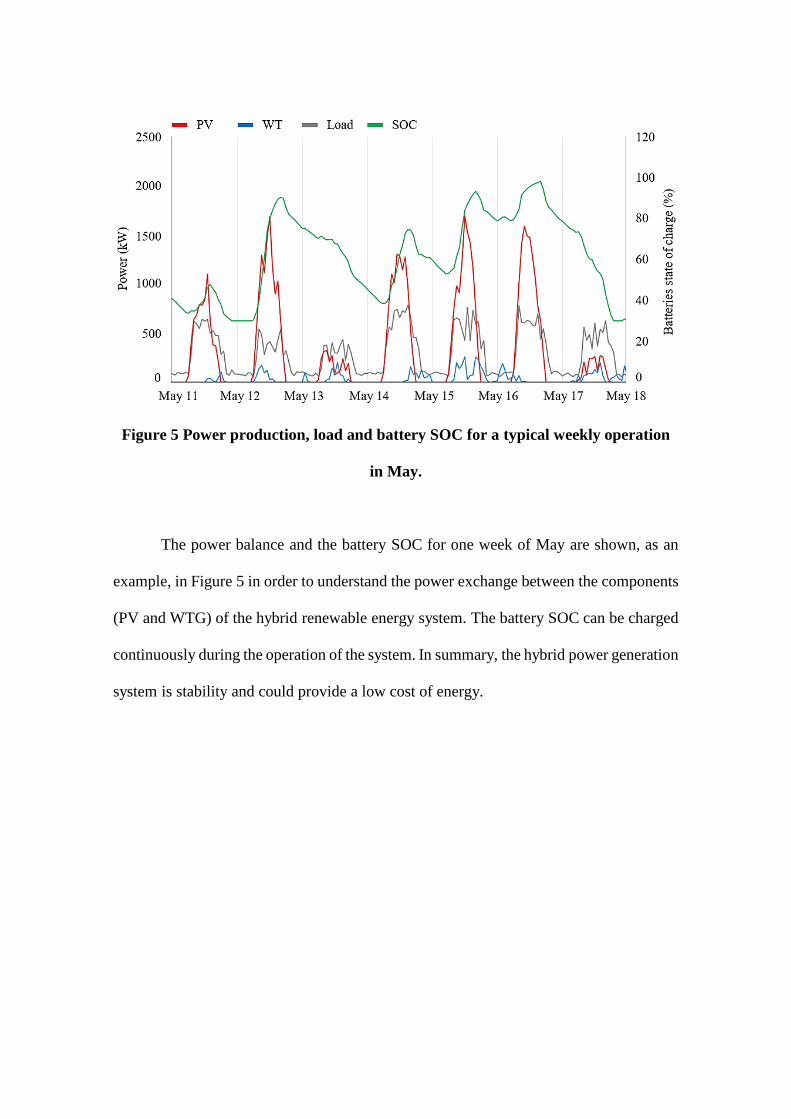
Figure 5 Power production, load and battery SOC for a typical weekly operation
in May.
The power balance and the battery SOC for one week of May are shown, as an
example, in Figure 5 in order to understand the power exchange between the components
(PV and WTG) of the hybrid renewable energy system. The battery SOC can be charged
continuously during the operation of the system. In summary, the hybrid power generation
system is stability and could provide a low cost of energy.

Table 1, it is found that a hybrid renewable energy system, incorporating PV,
WTG, battery, converter, and grid connection (Scenario 1), is the optimal application as
it offers the lowest NPC (3,696,697 $/project lifetime) and the lowest LCOE (0.1090 $)
to satisfy the full load. On the GHG emissions point of view, the optimal hybrid renewable
energy system emits 715,281 kg/year of GHG. The fraction of the energy delivered to the
total load from renewable power sources of 54.3 %.
Rank Sr. hybrid renewable energy
configuration
NPC
($)
LCOE
($/kWh)
R.F.
(%)
GHG
(kg/yr.)
1 1 PV/WTG/battery/converter/grid 3,696,697 0.1090 54.3 715,281
2 3 PV/battery/converter/grid 3,720,762 0.1097 51.2 764,647
3 2 WTG/battery/converter/grid 4,281,447 0.1262 21.7 1,226,914
4 4 Grid (base case) 4,410,102 0.1300 0 1,566,647
Table 1 Model optimization results of the hybrid renewable energy power generation
ranked by LCOE.
Manuscript

Based on the results presented in Table 2 for load demand of 6791.43 kWh/day,
the best hybrid renewable energy system (Scenario 1) composed of a hybridized solar PV
with a capacity of 1,020 kW, 9 sets of WTG with a total of 90 kW capacity, 72 Li-Ion
batteries of 1.52 kWh each, and a power converter of 490 kW.
Sr.
Equipment Size Cost
PV
(kW)
WT
(Qty.)
Battery
(Qty.)
Converter
(kW) Grid
O&M
Costs ($/yr)
Capital
Costs ($)
1 1,020 9 72 490 Yes 170,686 1,273,513
2 - 37 8 8.85 Yes 258,118 747,974
3 1,081 - 72 516 Yes 180,727 1,155,331
4 - - - - Yes 322,253 0
Table 2 Optimized system component sizing and associated cost with each hybrid
renewable energy configuration.