2 920 7+610 10+500 - HQDOCS Reportpublications.iwmi.org/pdf/H_9191iii.pdf · weir notch, so C, will...
20
. , Weir Weir Weir Weir 2-t.550 2 -t 920 7+610 10+500 Free Flow Free Flow Free Flow Broken The channel headworks is without a gate. Instead, the headregulator is il weir overflow structure having modular flow. At the head, karries (wooden planks1 are used to control the water supply. As the regulation is clone by putting karrics in the weir notch, so C, will vary according lo the changing of karries, both because tiicy are of different sizes and thc degree of warpness. This channel has sufficient working head while offtaking from the parent channel. This sub - minor runs more than its dcsign discharge. Thc design dischorgc? is 17.0 cfs, but the measured discharge was 20.2 cfs, which is 19 percent more than llic dcsiyn discharye (see Annex K.2). This sub- minor has experienced scour at the head rcach. The bed of this sub minor has scour ranging from 1.00 to 1.75 feet. This sub - minor has sediment deposition at RD 7 + 800 ranging from 0.40 - 0.60 foot. The actual width of the sub. minor is less than the design width at ED 2 + 850 and RD 3 -I- 100 ranging from 2 - 2.5 feet. For details, see Figures K.l to K.4. In these figures, the cross - section at different RDs are shown. The tail portion is lined from RD 15 + 400 to 17 I 590. 3.5.4 Ukni Minor Kokrii Minor also offtnkcs froin tlic Gujjiani Distributsry at AD 77 t 260/ II. rlic basic statistics are given in Table 27. 34
Transcript of 2 920 7+610 10+500 - HQDOCS Reportpublications.iwmi.org/pdf/H_9191iii.pdf · weir notch, so C, will...

.
,
Weir Weir Weir Weir
2-t .550 2 -t 920 7+610 10+500
Free Flow Free Flow Free Flow
Broken
The channel headworks is without a gate. Instead, the headregulator is il weir overflow structure having modular flow. A t the head, karries (wooden planks1 are used to control the water supply. As the regulation is clone by putting karrics in the weir notch, so C, will vary according l o the changing of karries, both because tiicy are of different sizes and thc degree of warpness. This channel has sufficient working head while offtaking from the parent channel.
This sub-minor runs more than its dcsign discharge. Thc design dischorgc? is 17.0 cfs, but the measured discharge was 20.2 cfs, which is 19 percent more than l l ic dcsiyn discharye (see Annex K.2).
This sub-minor has experienced scour a t the head rcach. The bed of this s u b minor has scour ranging from 1.00 to 1.75 feet. This sub-minor has sediment deposition at RD 7 + 800 ranging from 0.40 - 0.60 foot. The actual width of the sub. minor is less than the design width at ED 2 + 8 5 0 and RD 3 - I - 100 ranging from 2 - 2.5 feet. For details, see Figures K.l to K.4 . In these figures, the cross-section a t different RDs are shown.
The tail portion is lined from RD 15 + 400 to 17 I 590.
3.5.4 U k n i Minor
Kokrii Minor also offtnkcs froin tlic Gujjiani Distributsry at AD 77 t 260/ I I . r l i c basic statistics are given in Table 27.
34

Table 27. Basic statistics of Kokni Minor.
Length of sub Minor (feel)
Off-taking RD (Gujjiani Distributaiy)
Design discharge
Intensity
Full supply factor at outlet head
Design Kharif/Rabi Ratio
Type head structure
Number of outlets ._
,
12,750 -
77 f 250
13.0 CIS
80 Yo
3.6 cfs l1000 acres
32 : 48
Weir
7 --
-. Dominant outlet type
GCA (acres)
CCA (acres)
Total design discharge of outlets
OFRB, OF
3.767
3,431
12.3 cfs
The channel headworks is without a gate. Instead, the headregulator is a weir overflow structure having modular flow. A t the head, karries (wooden planks) are used to control the water supply. As the regulation is done by putting karries in the weir notch, so C,, will vary according to the changing of karries. both because they are of different sizes and the degree of warpness. This channel has sufficient working head while offtaking from tl ic parent channel.
This Minor runs more than i ts design discharge. The design discharge is 13 .0 cfs, but the measured discharge was 24.12 cfs, which is 85 percent more than the design discharge (see Annex L.2). Due to this reason, the iniddle and tail reaches are suffering with waterlogging. The iriiddle and tail of this channel are partly in fill and cut. The head reach is in cut.
There are 7 outlets along IKokni Minor. The details of GCA, CCA, "B", "Y", "H", authorized discharge, location and type of outlets are given in Annex L . l . The measured values of "B" & "Y" lor Ihc outlets are given in Annex L . l . The difference between the measured and the dasign dimensions of the outlets are quite small (see Annex L. 1)
35

Type of structure
This channel has an excellent command area. The overflow structures of this minor need necessary repair. All of the structures have been calibrated. The calibration data are given in Annex L.2. The design data of these structures is given in Annex L.3.
The Minor has experienced scour in the head reach. The bed o f this minor lias scour ranging from 0.50 to 1.00 foot. This minor has sediment deposition at RD 7+000 ranging from 0.50 - 0.90 foot. For details, see Figures L. l to L.5. In these figures, the cross-section a t different RDs are shown.
Reduced Distance Flow condition
,
3.5.5 Chatala Minor
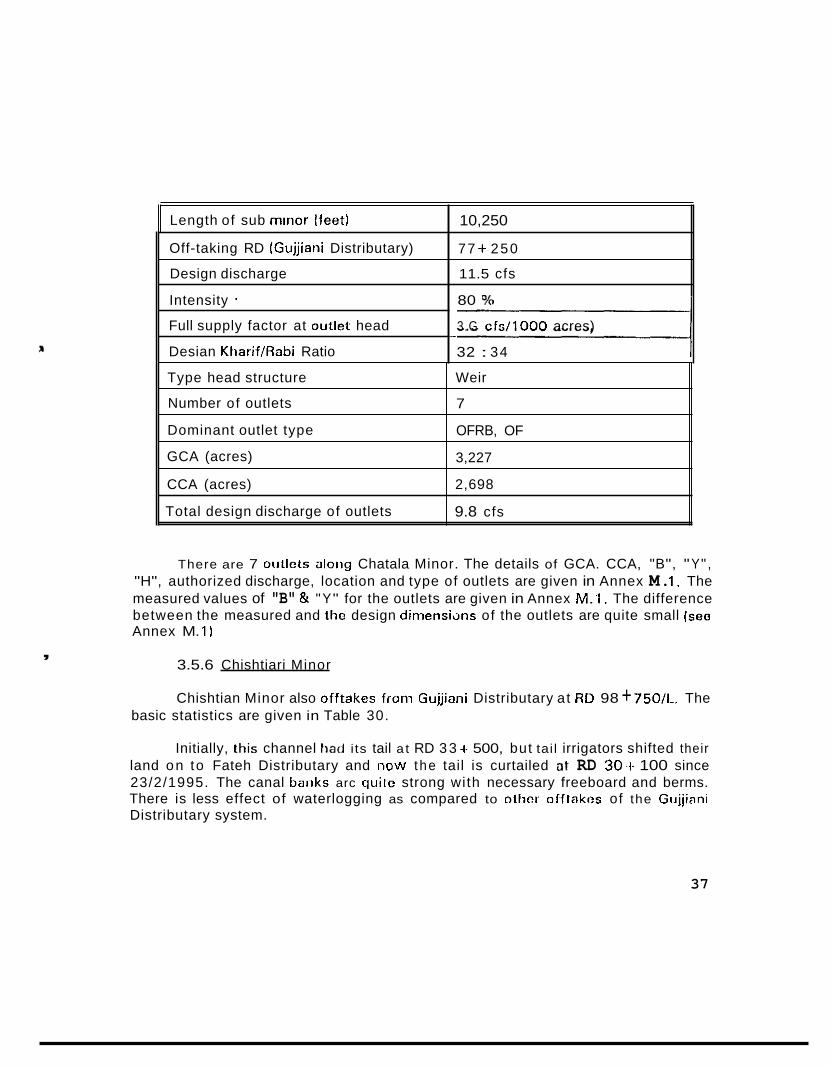
Chatala Minor also offtakes from the Gujjiani Distributary at RD 77250/L. The basic statistics are given in Table 29.
1-here is no regulation gate provided at the head of this channel. Instead, the headregulator is a weir overflow structure having modular f low. A t the head, karries (wooden planks) are used to control tlie water supply. As the regulation is done by putting karries in the weir notch, so C, will vary according to the changing o f karries, both because they are of different sizes and the degree of warpness. This channel has sufficient working head while offtaking from the parent channel.
This minor runs more than its design clischargo. The design discharge is 11.50 cfs, but the measured discharge was 17.98 cfs, which is 56 percent more than the design discharge (see Annex M.2). Due to this reason, the middle and tail reaches are sufferinq w i l h waterlogging. Heavy growths of junglelsarkanda can be observed along the tight side of this niinor. The channel reach from HD 0 - 5 is partly cutl l i l l and from RD 5 to tail is in fill.
36
,
Length of sub mirior (ieet)
Off-taking RD (Gujjiani Distributary)
Design discharge
Intensity '
Full supply factor at outlet head
Desian Kharif/Rabi Ratio
10,250
77 + 250
11.5 cfs
80 Oh
3.G cfs/1000 acres)
32 : 34 -
Type head structure
Number of outlets
Dominant outlet type
GCA (acres)
CCA (acres)
Total design discharge of outlets
There are 7 oullets along Chatala Minor. The details of GCA. CCA, "B", "Y" , "H", authorized discharge, location and type of outlets are given in Annex M. 1. The measured values of "B" & "Y" for the outlets are given in Annex M:I. The difference between the measured and the design dimensions of the outlets are quite small (see Annex M. 1)
3.5.6 Chishtiari Minor
Chishtian Minor also offtakes from Gujjiani Distributary at RD 98 + 750/L. The basic statistics are given in Table 30.
Initially, [his channel had its tail a t RD 3 3 + 500, but tai l irrigators shifted their land on to Fateh Distributary and ncw t he tail is curtailed at RD 30.1. 100 since 23/2/1995. The canal baiiks arc quite strong with necessary freeboard and berms. There is less effect of waterlogging as compared to 01hcI olftakos of the Gujjinni Distributary system.
Weir
7
OFRB, OF
3,227
2,698
9.8 cfs
37
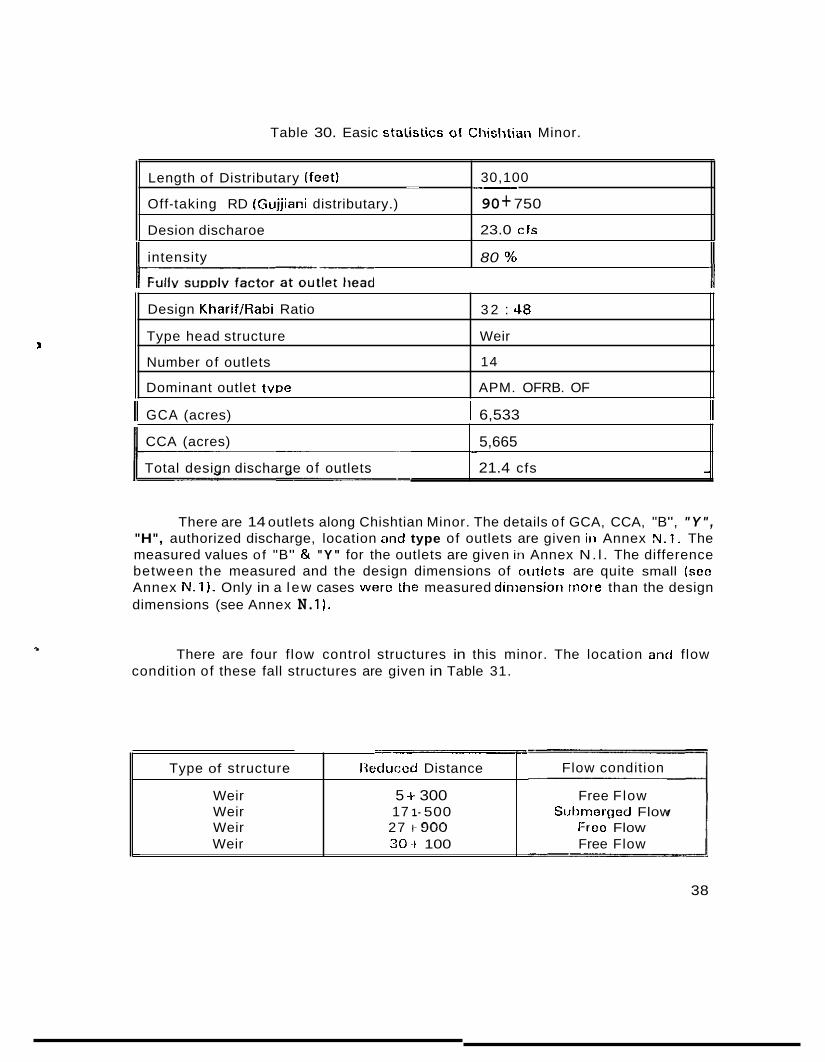
Table 30. Easic stalistics of Cliislitian Minor.
- Length of Distributary (feet1
Off-taking RD (Gujjiani distributary.)
Desion discharoe
30,100
90 + 750
23.0 cfs
--
intensity
L
80 O/o
Design Kharif/Rabi Ratio
Type head structure
Number of outlets
Dominant outlet tvDe
II GCA (acres) I 6,533 II
3 2 : 38
Weir
14
APM. OFRB. OF
CCA (acres)
Total design discharge of outlets
There are 14 outlets along Chishtian Minor. The details of GCA, CCA, "B", " Y " , "H", authorized discharge, location and type of outlets are given iii Annex N.1. The measured values of "B" & " Y " for the outlets are given it1 Annex N. l . The difference between the measured and the design dimensions of outlcls are quite small (see Annex N.1). Only in a l ew cases were the measured dimensiori more than the design dimensions (see Annex N. 1).
5,665 - 21.4 cfs -
There are four f low control structures in this minor. The location and flow condition of these fall structures are given in Table 31.
Flow condition
Free Flow Sihmerged Flow
Free Flow Free Flow -
-- Type of structure l luduccd Distance
Weir 5 + 300 Weir 17 1- 500 Weir 27 1+000 Weir 30~1 100
38

All structures have been calibrated. The calibration data is given in Annex N.2. The design data for all structures are given in Annex N.3.
This minor has sediment deposition at RD OO+OOO ranging f rom 0.75 - 1.00 foot, at RD 5 + 600 ranging from 1.50 to 1.75 feet, a t RD 17 + 800 ranging from 1.75 to 2.00 feet, at RD 27 t- 700 and 28 + 100 ranging froin 0.30 to 0.40 foot and a t RD 30+300 rangingfrom 1 .OO to 1.50 feet. For details, see Figures N . l to N.7. In these figures, the cross-section at diffetent RDs are shown.
3.6 BENCHMARKS
Temporary benchmarks werc also established on a!l of the structures, t i , , and H, elevations are mentioned from time-lo-time in tlie Annexures chapters. But foi their X-axis, Y-axis and Z-axis (X,,, X,, YkL, Y,,, Z, and Z,I locations are shown in Annex 0.1
The definitions of the.se axes are sl iown in the last Figures of this report (Figures 0 .1 and 0.2 in Annex 0). The crest elevation of the open channel construction in the reference fot the Z-axis with tho crest devot ion being Zero. For the horizonal plane, the reference point is at the upstream face of the inost constricted section for the X-axis, while the reference for the Y-axis is an imaginary line passing through tho center o f the constriction and the Y measurenienl are measured transversely from this imaginary line.
39

CHAPTER 4
FREE FLOW DISCHARGE RATING OF STRUCTURES
4.1 FREE FLOW
There are t w o most significant f low in the open channel structures.
1) Free f low and
2) Submerged f low.
Other terms for free f low are critical depth flow and modular flow, while other tetms for submerged f low are drowned f low and nonmodular flow. The general form of tlie freeflow equation for an overflow (weir) structure is:
Where
Q, = free f low discharge;
C,, = freeflow discharge coefficient;
W, = crest width of tho overflow section; and
nl = freeflow exponent.
The upstream f low depth, h,, n u s t be measured at some location upstream from the overflow crest (the exact localion will affect the value of C,,, and must have the zero reference elevation correspond with the crest elevation). A sketch dcpicting free open channel f low is shown in Figure 7.
40
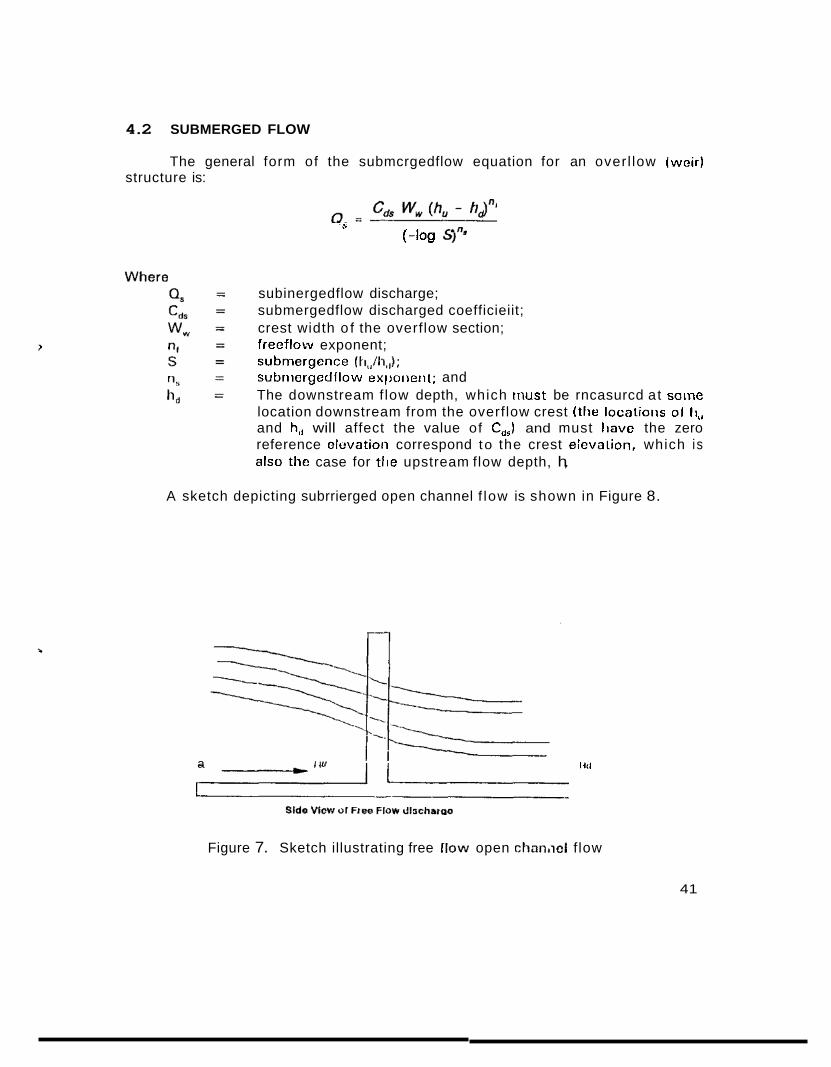
4.2 SUBMERGED FLOW
The general form of the submcrgedflow equation for an overl low (weir) structure is:
-s (-log 4"'
subinergedflow discharge; submergedflow discharged coefficieiit; crest width o f the overflow section; freeflow exponent; submergence (ti,,/li,,); subriiercjedllow exlloiieiit; and The downstream f low depth, which must be rncasurcd at soine location downstream from the overflow crest Ithe locatioiis 0 1 li,, and h, will affect the value of CdJ and must l iavc the zero reference elevation correspond to the crest elcvation, which is also the case for t l ie upstream flow depth, h,.
A sketch depicting subrrierged open channel f low is shown in Figure 8.
a I I" 1111
Figure 7. Sketch illustrating free [low open chaiiliel f low
41

d ! Slde VleW 01 Submerged Flow dlscharge
Figure 8. Sketch illustrating submerged open channel f low.
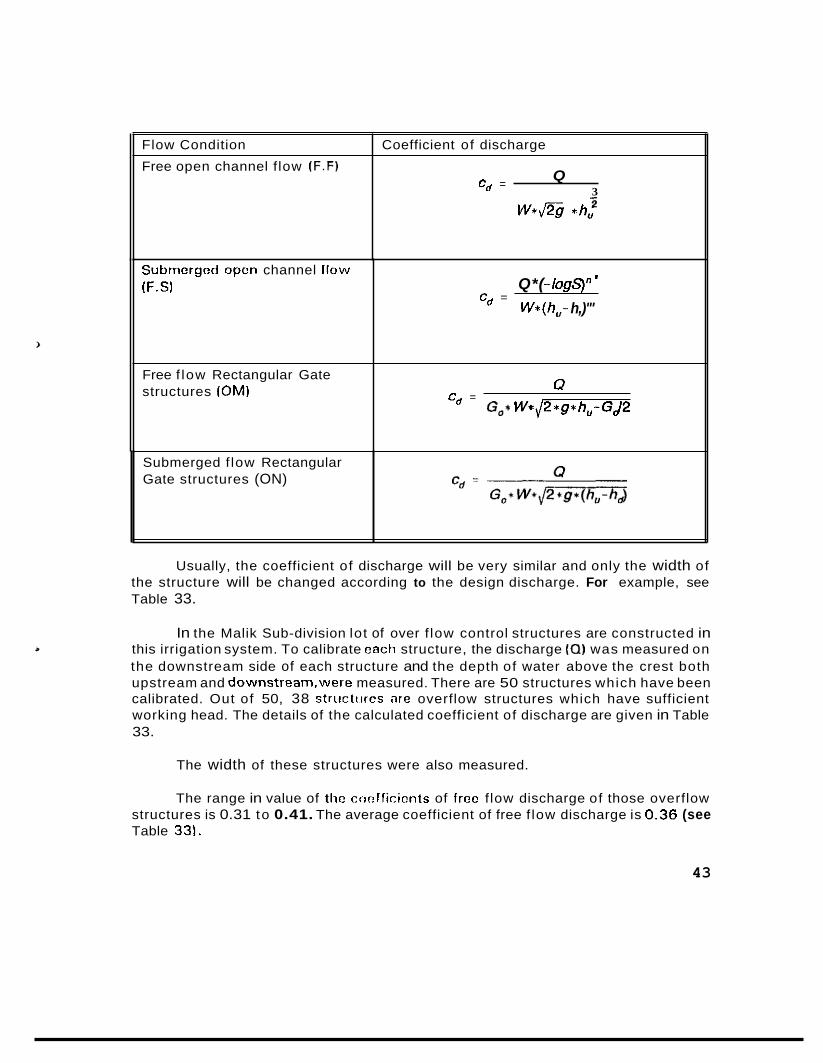
4.3 COEFFICIENT OF DISCHARGE
Commonly following flow conditions were observed and their formulas are given in Table 32. The various f low conditions are denoted by:
, Free open channel f low (F.F);
Submerged open channel flow (F.SI;
Free f low Rectangular Gate structures (OM); and
Submerged f low Rectangular Gate structures (ON).
42
Flow Condition
Free open channel f low IF.F)
Coefficient of discharge
Q
5 W * F g *h, 3
Cd =
Submerged f low Rectangular Gate structures (ON)
Subnicrgod open channel llow ( F . 3
Free f low Rectangular Gate structures (OM)
Usually, the coefficient of discharge will be very similar and only the width of the structure will be changed according to the design discharge. For example, see Table 33.
In the Malik Sub-division lot of over f low control structures are constructed in this irrigation system. To calibrate each structure, the discharge (a) was measured on the downstream side of each structure and the depth of water above the crest both upstream and downstream,were measured. There are 50 structures which have been calibrated. Out of 50, 38 structiircs are overflow structures which have sufficient working head. The details of the calculated coefficient of discharge are given in Table 33.
The width of these structures were also measured.
The range in value of thc cnr?lficicnts of frco f low discharge of those overflow structures is 0.31 to 0.41. The average coefficient of free f low discharge is 0.36 (see Table 33).
Q*( -logs)" ' W*(h,- h,)"'
c, =
Q Go* W*J2 *g* h,-GJ2
c, =
43
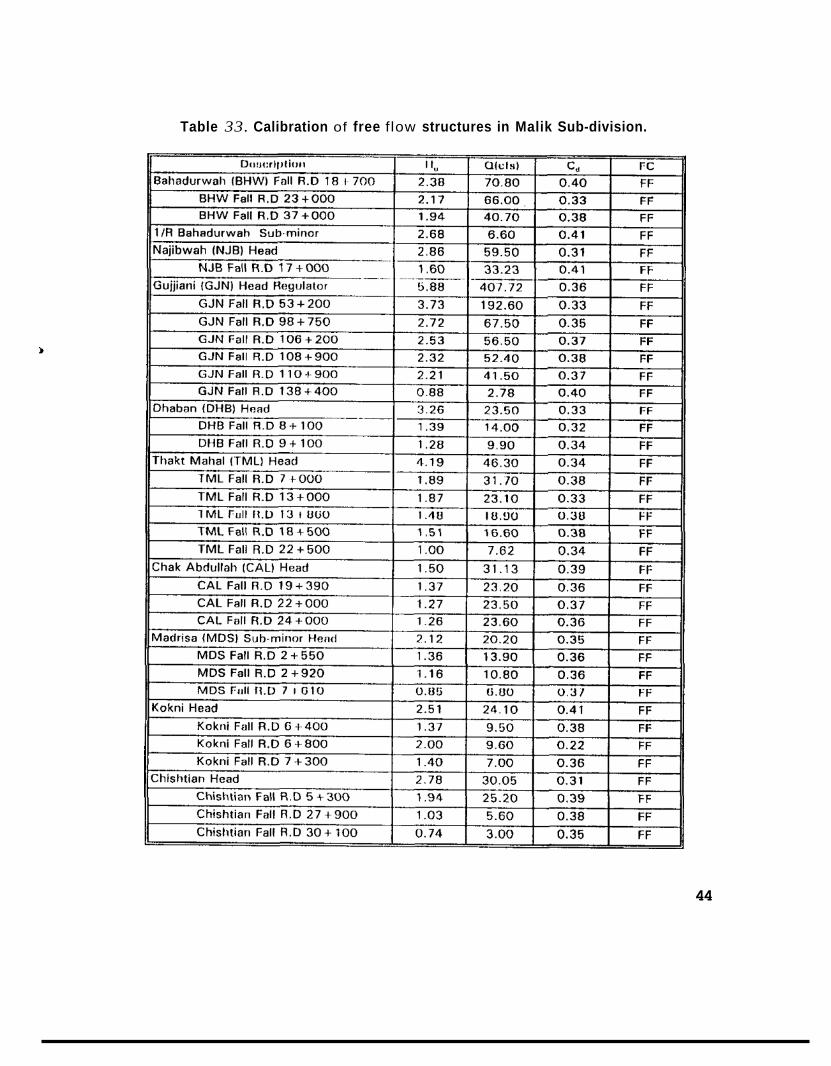
Table 33. Calibration of free f low structures in Malik Sub-division.
44

CHAPTER 5
REVENUE AND MAINTENANCE
,
The portion o f Malik Branch Canal located in the Kot Sher Muhammad Section has the greater expenses, since the maintenance expenses o f Malik Branch Canal are always more than for the distributaries. The maintenance costs b y section , along with the establishment expenses for Malik Sub-division are given in Table 34 for the ten-year period of 1985-95.
Table 34. Maintenance expenses for channels and establishment costs for Malik Sub-division (amounts in rupees).
The abeyana3, which is collected by the Irrigation Department, is Rs 6,01,60,227 for ten years (Kharif 1985 to Kharif 1995). The abeyana which is collected from the Gujjiani Section is more than for the other t w o sections. The abeyana which is collected f rom the Gujjiani Section is Rs 2,24,67,846, f rom Kot Sher Muhammad Section Rs 1.90.79.248 and from Sirajwah Section is Rs 1,86,13,133. The details of abeyana collection are given in Table 35.
Water charges collected f rom farmers for using canal water
4 5

Table 35. Details of abeyana col lcckd from farmers in the Malik Sub-division.
section NO1 Shor Muhnmmncl S,,"lWll, O<*,i TnId MnHh SobMvldon
Ih.dl 8 1
A"hM *,.*B
Khsrll 98
81.1,. l r . ,
21.993 10.15.250 29.781 10.60.105 17.310 1l.51.813 90.084 31.32.948
25.859 5.7, .5RS ,q,,c,, 6.47.466 30.846 7.07.61 I 86.771 19.17.6R2
29.333 10.12.640 31,"RS 10.48.942 33.536 11.51.408 93.955 32.12.990
1.12.411
11.71.678
7.09.598
-_
nahbi BA-89 28.802 5.93.666 23.186 8.37.081 31.740 7.21.698 87.788 19.62.146
Aahbl 89-90 18.311 5.79.lO9 29.029 8.31.381 30.7o.l 6.94.294 88.044 19.06.390
Khmll 91 32,293 10.91.012 32.112
h h b l 90~9 , 26.315 5.77.855 P % " l l
Rihhl 91-92 26.956 5.02.441 73 40,
K h s l 92 32.989 11.03.065 33.445
R&bl 92-93 25.560 5.50.701 29.462
10.73.010 3>.127 12.00.070 1.01.812 34.32.722
ri.21.784 30.734 0.81.6.ll 88.08s 18.91.180
6 3 I . R R A 11.89, 7.18.301 ~ 8 . 2 6 6 19.d1.6.13
11.02.544 39.300 12.96.788 1.05.734 36.04.311
5.31.096 31.432 7.08.5a3 ne.444 19.00.340 I I I -_
Iharll 93 32.342 14.13.900 32.315
Total abeyana is more than the maintenance and establishment expenses. The yearly expenses are Sirajwah Section Rs 3.09.940: Kot Sher Muhammad Section As 12,78,805; Gujjiani Section Rs 3.26.871 and establishment costs Rs 25,32,423.
I I I 1 13.43.180 38.077 16.23.703 1.02.734 43.80.583
Total yearly expenses are Rs 44.48.039. but yearly abeyana collections are Rs 60.16.023. which is 35.25 % more than the expenses. However, this does not take into account the expenses a t higher levels in the Irrigation Department, such as Division, Circle, etc.
Aboynria Ratcs l o r 198 1 , 1993. 1994 and 1995 or0 liskod in Toblo 36.
Rabbl 93-94 24.527
4 6
6.80.888 27.873 7.37.401 30.205 8.49.410 82.605 I 22.47.703
1h.111 94
Rabbl 94~95
Khmil 95
10t.l
33.701 ,c.."3.7,, 14.,1',,, 1!#.20.7311 1 A . 8 7 0 lO.Oh.3.%1 1.06.809 *9,09.301
25.470 7.59.014 26.293 1.l8.735 31.015 9.64.531 82.798 25.02.286
33,425 11.01.t53 31.CA4 15.95.351 39.018 19.65.544 1.05.087 62.68.048
5.98.745 1.90.79.248 G.39.126 1.86.13.133 7.06.827 2.24.67.848 19.44.498 8.01.80.227

.
Garden 50.40 63.00 69.30 76.23
1 Vegetable 34.60 43.25 47.30 52.03
Garden i f un approved 34.40 43.00 47.30 52.03
Table 36. Abeyana rates far different craps (amount in Rupees per acre).
, Rice - Water chestnut 1 32.00 140.00 144.00 148.40
1 Melon - Chili- Water Melon - poppy. 28.00 35.00 38.50 42.35
1 Oil seeds 23.20 29.00 31.90 35.09
, ' Wheat - Barley
Maize
Pulses
- I Mil'eL Gram
Cotton - Tobacco etc. I 33.60 142.00 146.20 I 50.82
Name
Fish farm
1981 1993 1994 1995
219.00 262.50 288.75 31 7.63
27.00
21 .oo
20.00
17.00
Forest - Meadow I 22.40 I 28.00 130.80 133.88
29.70 32.69
23.10 25.41
27.00 71.20
18.70 20.57 -. .-
21.60
16.80
lfi.00
13.60
47

CHAPTER 6
OPERATION
All of the distributaries received more discharge than their design. In Table 6 , the average discharges are given as reported by the Irrigation Department, but the actual discharges are more than these (see calibration tables in the annexuresl. Although all of the distributaries and minors received more water, still a shortage of water occurs. Due to the shortage of water, a warabandi program was made. The Sub-divisional Officer Jalwala has prepared a warabaandi program and the Executive Engineer Sadiqia Division has approved it. A t the tail of Eastern Sadiqia Canal, there is a major offtake (i.e Hakra Branch Canal that falls in Hakra Division). There is no warabandi between Hakra Division and Sadiqia Division and the water is distributed as the ratio of 53:47 (e.g i f there is 100 CIS in Eastern Sadiqia Canal, 53 CIS will go to the Hakra Division and 47 cfs to the Sadiqia Division.
The groups A and B in the warabandi (Table 37) program have almost an equal discharge. Thcso groupings Iiavc oxistcd like Ili is for D long titno end are no t likely to change in the near future. The warabandi schedule for kharif 1996 is given in Table 38. The warabandi program for the rabi 1996-97 grouping distributaries will be the same. Only the dates of the warabandi program will change. Turn-by-turn all distributaries came at first preference, then 2nd and 3rd. First of all, the distributaries that are in the first preference group will run at full supply, after this the remaining water will be given to the 1 s t distributary of the 2nd group, then the 2nd distributary, and then the 3rd distributary of the 2nd group.
Table 37. Warabandi program for kharif 1996, Sadiqia Division, Bahawalnagar.
Group A: A1 : Faleli Distributary A2: Mahmooda Distributary, Bhukan Distributary and Gujjiani
Distributary. A3: Sadiq Ford Feeder.
Group B: 61: Murad Distributary. 82: Ya rwah D is t r ibu tary , Gardar iwala D is t r i bu ta ry and
Sirajwah Distributary.
Note: 1. A t the tail of Eastern Sadiqia Canal (head of Jalwala) the water will be
distributed between Eastcrn Sadiqia Division and Hakra Division with the ratio of 43:57. Each group will be a t first turn for 8 days. In case of excess (or less) water, the warabandi program can be changed.
2. 3.
48

4.
5 .
The Sub-divisional Officer Jalwala will be incharge of the warabandi program under the supervision of the Executive Engineer Sadiqia. In case of excess lor less) water, the warabandi program will be changed and the Sub-divisional Officers of Jalwala, Malik and Daharanwala Sub- divisions will be responsible for their sub-divisional warabandi program.
! 6. The Executive Engiriccr Sadiqia will be authorized to change the warabandi program in case of an emergency.
Table 38. Warabandi schedule for Sadiqia Division during kharif 1996.
49
CHAPTER 7
CONCLUSIONS
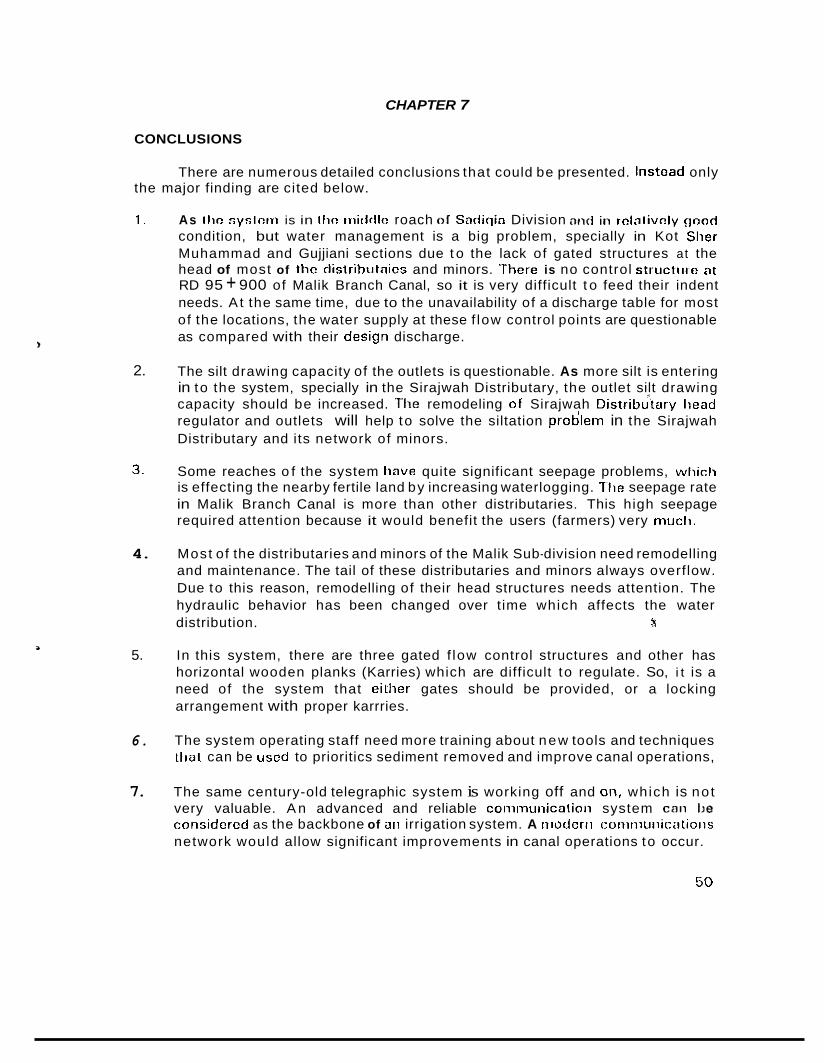
There are numerous detailed conclusions that could be presented. Instead only the major finding are cited below.
1 . As I l io n y s l n n i is in Iho ir i ir lr l lo roach of Sadiqia Division and i n rclil l ivnly good condition, but water management is a big problem, specially in Kot Slier Muhammad and Gujjiani sections due t o the lack of gated structures at the head of most of tlic dislributaics and minors. There is no control striictii it? at RD 95 + 900 of Malik Branch Canal, so it is very difficult t o feed their indent needs. A t the same time, due to the unavailability of a discharge table for most of the locations, the water supply at these f low control points are questionable as compared with their design discharge.
The silt drawing capacity of the outlets is questionable. As more silt is entering in to the system, specially in the Sirajwah Distributary, the outlet silt drawing capacity should be increased. .The remodeling of. Sirajwah Distribulai~y liead regulator and outlets will help to solve the siltation problem in the Sirajwah Distributary and its network of minors.
Some reaches o f the system have quite significant seepage problems, wl i ic l i is effecting the nearby fertile land by increasing waterlogging. T~lle seepage rate in Malik Branch Canal is more than other distributaries. This high seepage required attention because it would benefit the users (farmers) very niucli.
Most of the distributaries and minors of the Malik Sub-division need remodelling and maintenance. The tail of these distributaries and minors always overflow. Due to this reason, remodelling of their head structures needs attention. The hydraulic behavior has been changed over t ime which affects the water distribution. 2,
In this system, there are three gated f low control structures and other has horizontal wooden planks (Karries) which are difficult to regulate. So, i t is a need of the system that eilher gates should be provided, or a locking arrangement with proper karrries.
The system operating staff need more training about new tools and techniques tliat can be used to prioritics sediment removed and improve canal operations,
The same century-old telegraphic system is working off and on, which is no t very valuable. A n advanced and reliable coniini i i i ici l l ioi i system can be considered as the backbone of an irrigation system. A niodern coiiiti iuiiiciil ioiis network would allow significant improvements in canal operations to occur.
2.
3.
4.
5.
6.
7.
50

References
Abbasi, R . U . R . et.al. 1996. Training Course On Field Calibration Of Irrigation Outlets. International Irrigation Management Institute, Lahore, Pakistan. June, 163 pages.
Haider, Muhammad Shabbir and Mushtaq Ahmed Khan 1996. Research Opportunities in Canal Irrigation Management In Malik Sub-division, Sadiqia Canal Division, Bahawalnagar. International Irrigation Management Institute. March, 58 pages.
L i s t o f records available f rom the Irrigation Department.
1 - Outlet register.
2-
3-
4-
5-
6- H register of outlets.
L-Section o f all distributaries and minors.
Structure drawings of all distributaries and minors
Daily Gauges Record of all offtakes and all tails.
Bench Mark register of Malik Sub-division.
51

ANNEXURES
Annex A: Malik Branch Canal
Annex A . l . Details of outlets from Malik Branch Canal.
Nulc. WII working 1,eiitl
,
52

Annex A.3. Measured data for structures in Malik Branch Canal.
Description
Head
Fall RD 22+900
St.RD 38 + 900
Fall RT) R5+900 ~~~~ .~~ .. ~. . ...
. 82 H Working Crest Discharge Remarks If t) Iftl Head Reduced Icfs)
I f t l Level lftl
3'15 6.65 4.00 535.59 1538.00
3.15 5.45 1.59 530.56 ---
2'15 6.50 1.59 526.60 11 54.00
7*15 5.64 2.09 518.53 1047.00 ~ ~ ~ - . _ _ _ _ _ ~ _ ~ ~ ~ ~ ~ ~
Note. The benchmark elevation above the crest of the flow control structure is denoted by WM, which is a painted white mark placed on the structure wall.
53
vperera
Next >>