2 3 - irena.org Presentation.pdf · Pelita Agung Agrindustri 229.885 kl PT. Cemerlang Energi...
27
BANGKOK, DEC 2016 "%&$, # "$, " "$ %#)$% 23 I I
-
Upload
trinhquynh -
Category
Documents
-
view
217 -
download
1
Transcript of 2 3 - irena.org Presentation.pdf · Pelita Agung Agrindustri 229.885 kl PT. Cemerlang Energi...
BANGKOK, DEC 2016
OUTLINE
• • • •
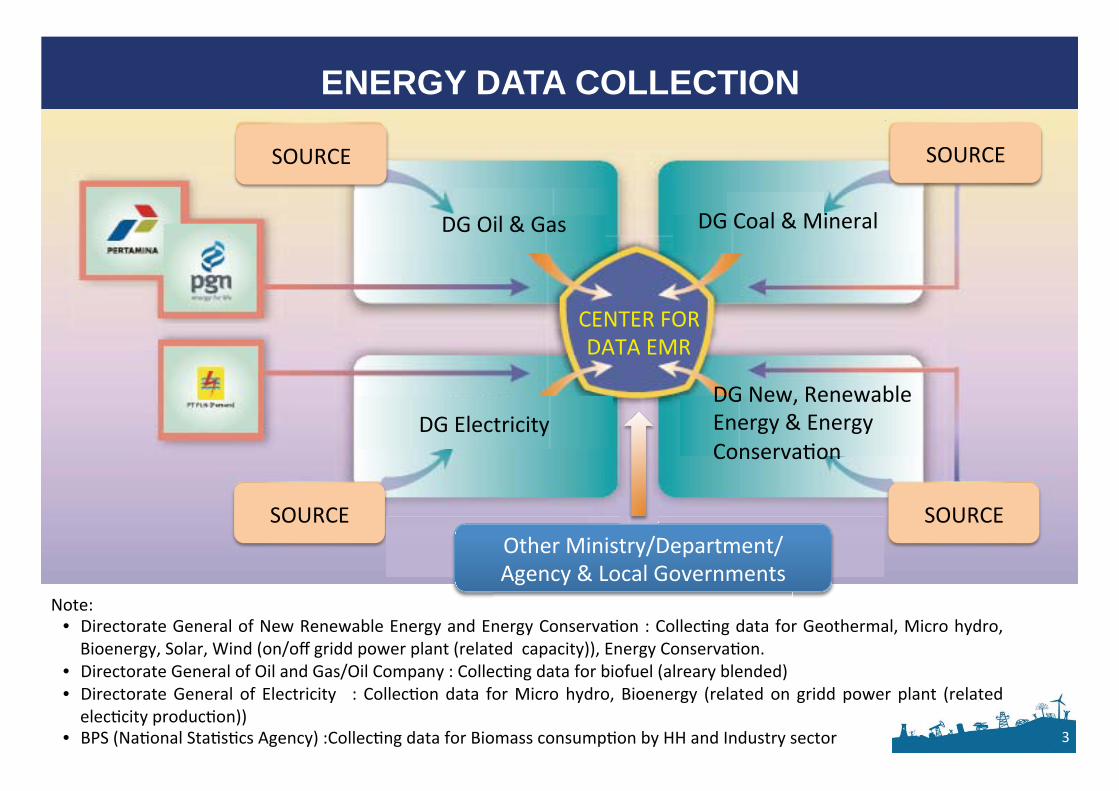
ENERGY DATA COLLECTION
•
• •
•
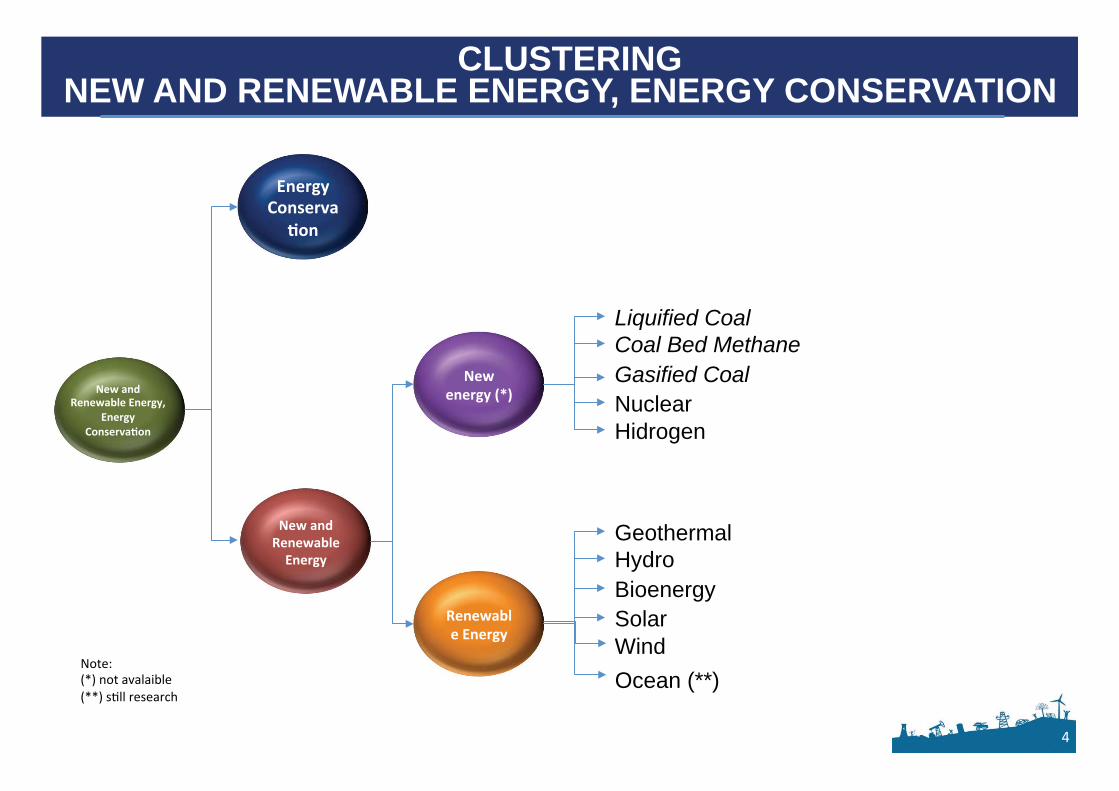
Liquified Coal Coal Bed Methane Gasified Coal Nuclear Hidrogen
Geothermal Hydro Bioenergy Solar Wind
CLUSTERING NEW AND RENEWABLE ENERGY, ENERGY CONSERVATION
Ocean (**)
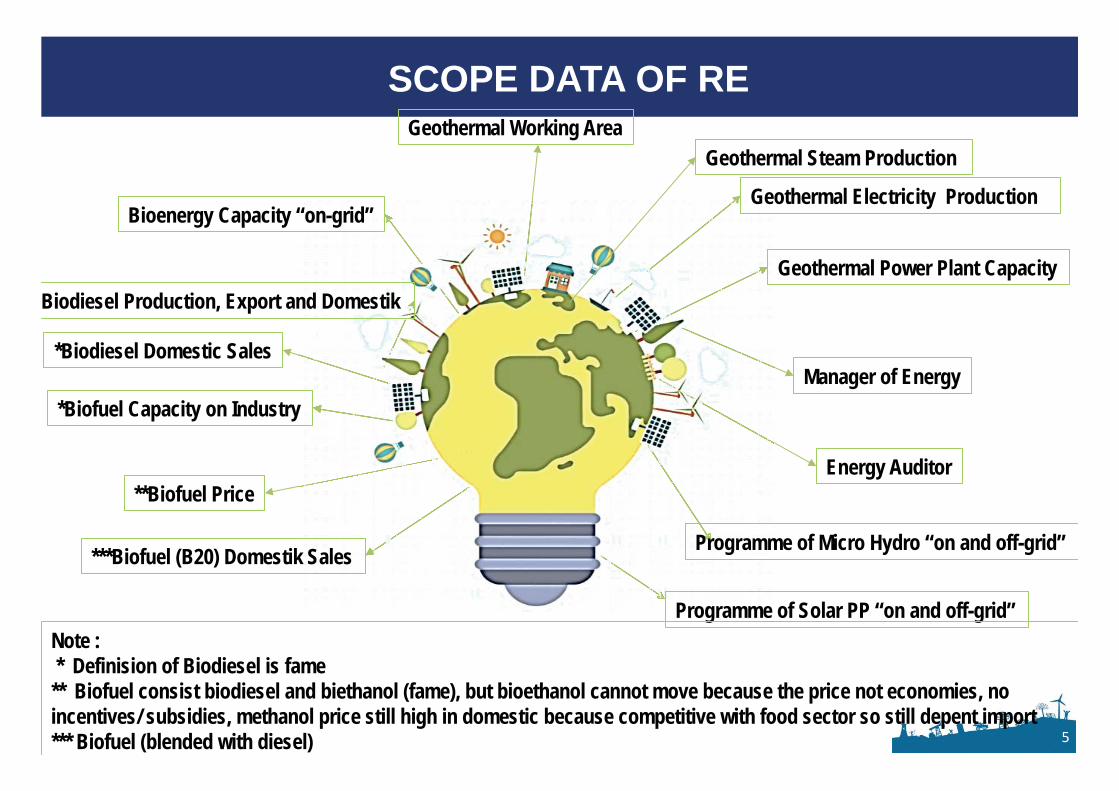
SCOPE DATA OF RE Geothermal Working Area
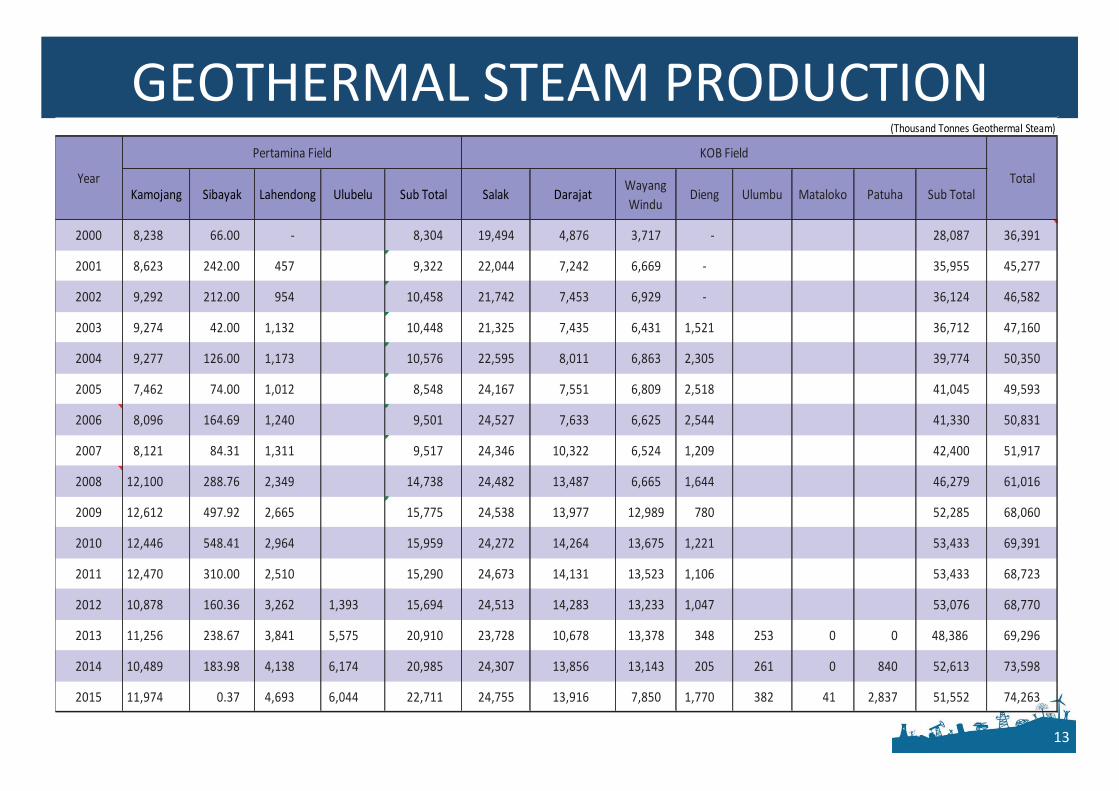
Geothermal Electricity Production
Energy Auditor
Geothermal Power Plant Capacity
Bioenergy Capacity “on-grid”
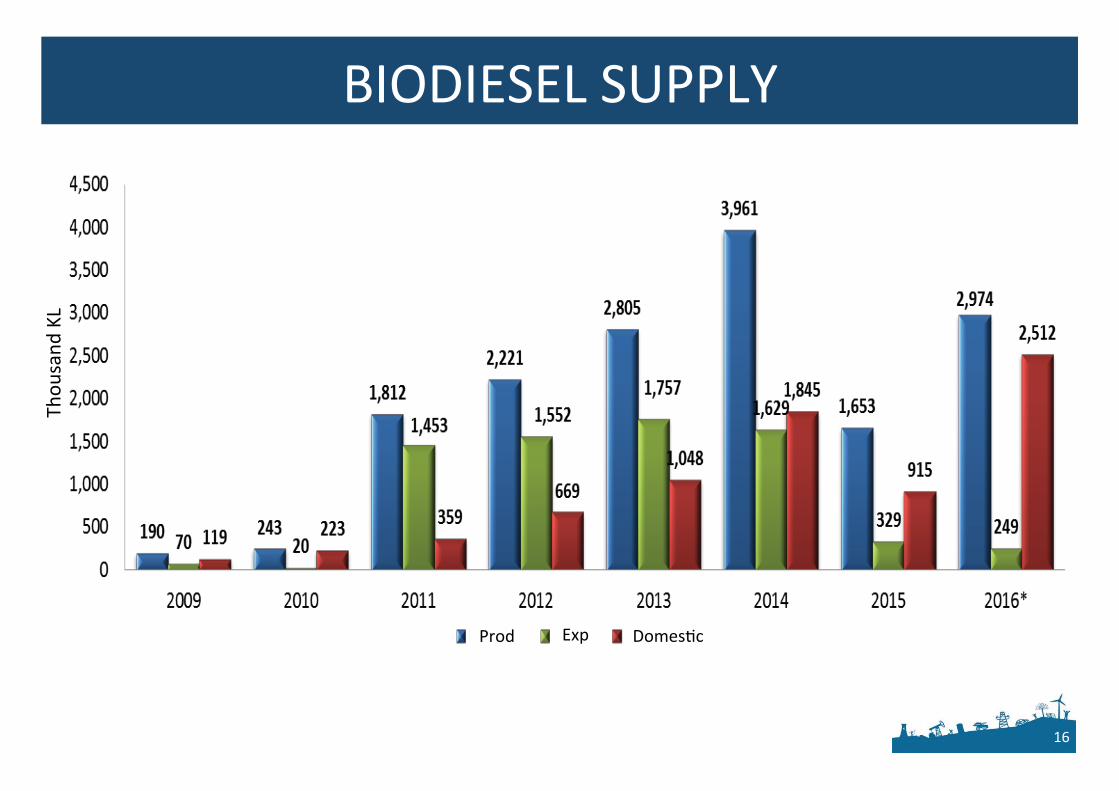
*Biodiesel Domestic Sales
*Biofuel Capacity on Industry
**Biofuel Price
***Biofuel (B20) Domestik Sales
Programme of Solar PP “on and off-grid”
Biodiesel Production, Export and Domestik
Manager of Energy
Programme of Micro Hydro “on and off-grid”
Geothermal Steam Production
Note : * Definision of Biodiesel is fame ** Biofuel consist biodiesel and biethanol (fame), but bioethanol cannot move because the price not economies, no incentives/ subsidies, methanol price still high in domestic because competitive with food sector so still depent import *** Biofuel (blended with diesel)
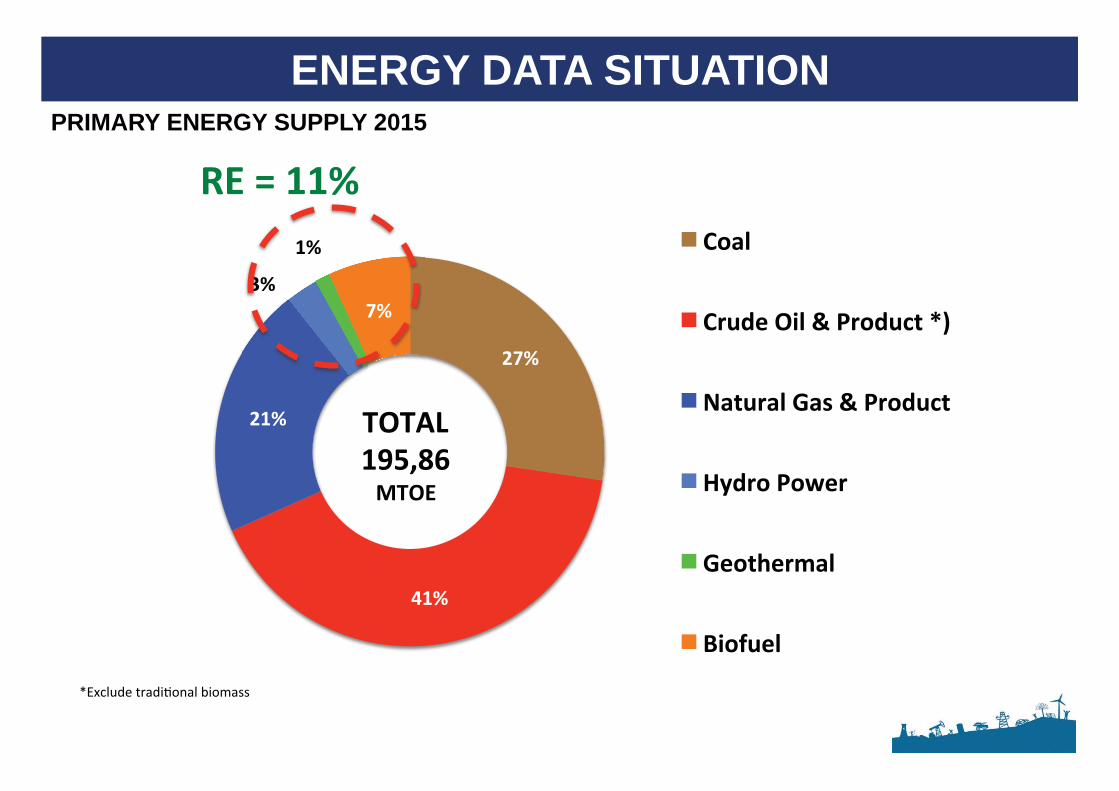
ENERGY DATA SITUATION PRIMARY ENERGY SUPPLY 2015
28%
13%
4%
40%
2% 13%
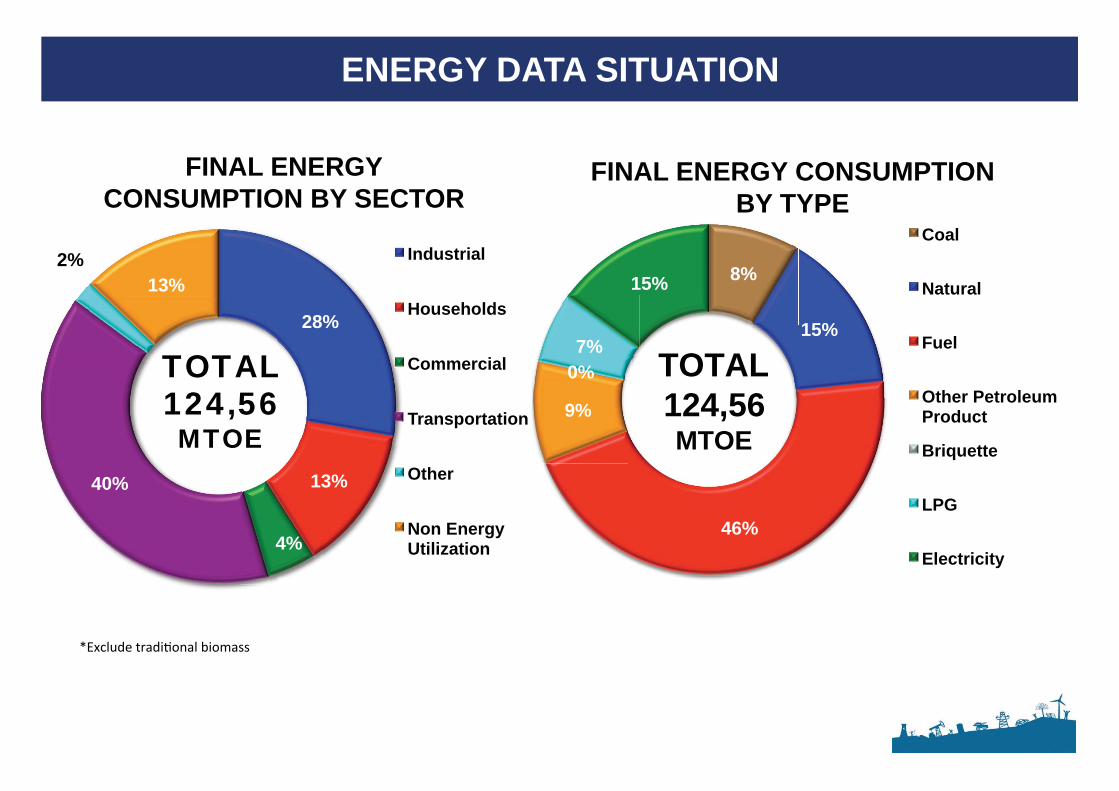
FINAL ENERGY CONSUMPTION BY SECTOR
Industrial
Households
Commercial
Transportation
Other
Non Energy Utilization
TOTAL 124,56 MTOE
8%
15%
46%
9%
0% 7%
15%
FINAL ENERGY CONSUMPTION BY TYPE
Coal
Natural
Fuel
Other Petroleum Product
Briquette
LPG
Electricity
TOTAL 124,56 MTOE
ENERGY DATA SITUATION
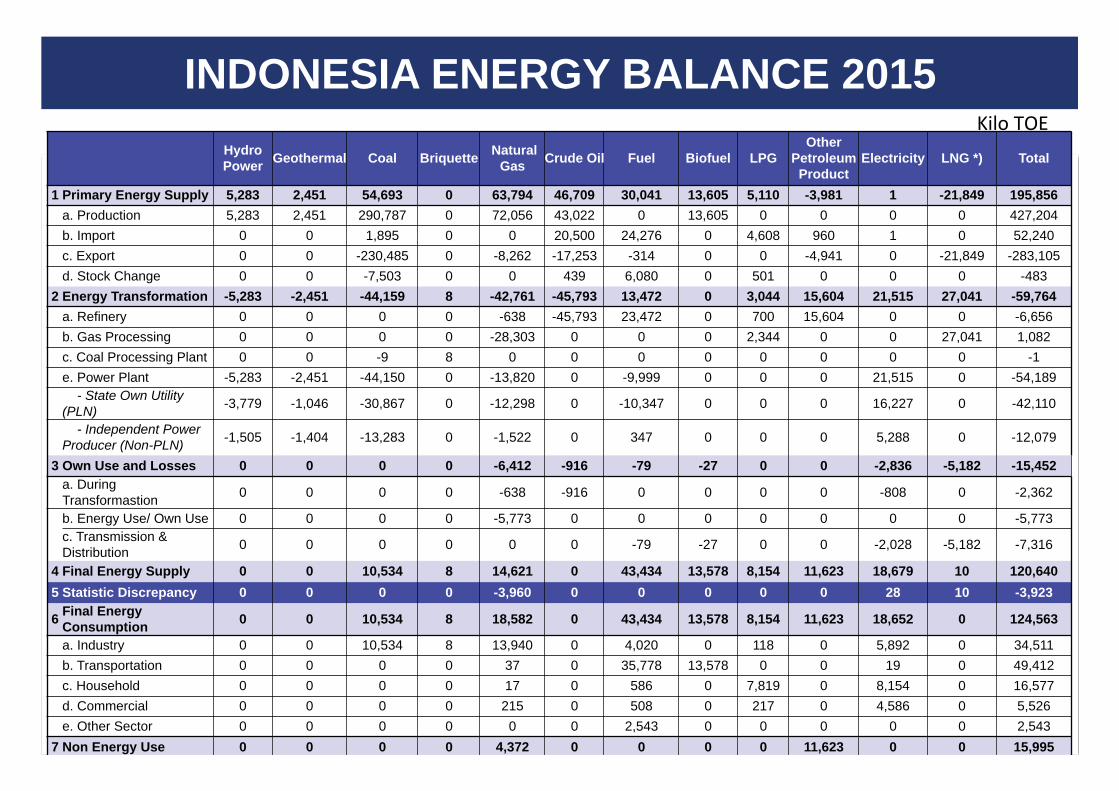
INDONESIA ENERGY BALANCE 2015 Hydro
Power Geothermal Coal Briquette Natural Gas Crude Oil Fuel Biofuel LPG
Other Petroleum
Product Electricity LNG *) Total
1 Primary Energy Supply 5,283 2,451 54,693 0 63,794 46,709 30,041 13,605 5,110 -3,981 1 -21,849 195,856 a. Production 5,283 2,451 290,787 0 72,056 43,022 0 13,605 0 0 0 0 427,204 b. Import 0 0 1,895 0 0 20,500 24,276 0 4,608 960 1 0 52,240 c. Export 0 0 -230,485 0 -8,262 -17,253 -314 0 0 -4,941 0 -21,849 -283,105 d. Stock Change 0 0 -7,503 0 0 439 6,080 0 501 0 0 0 -483 2 Energy Transformation -5,283 -2,451 -44,159 8 -42,761 -45,793 13,472 0 3,044 15,604 21,515 27,041 -59,764 a. Refinery 0 0 0 0 -638 -45,793 23,472 0 700 15,604 0 0 -6,656 b. Gas Processing 0 0 0 0 -28,303 0 0 0 2,344 0 0 27,041 1,082 c. Coal Processing Plant 0 0 -9 8 0 0 0 0 0 0 0 0 -1 e. Power Plant -5,283 -2,451 -44,150 0 -13,820 0 -9,999 0 0 0 21,515 0 -54,189
- State Own Utility (PLN) -3,779 -1,046 -30,867 0 -12,298 0 -10,347 0 0 0 16,227 0 -42,110
- Independent Power Producer (Non-PLN) -1,505 -1,404 -13,283 0 -1,522 0 347 0 0 0 5,288 0 -12,079
3 Own Use and Losses 0 0 0 0 -6,412 -916 -79 -27 0 0 -2,836 -5,182 -15,452
a. During Transformastion 0 0 0 0 -638 -916 0 0 0 0 -808 0 -2,362
b. Energy Use/ Own Use 0 0 0 0 -5,773 0 0 0 0 0 0 0 -5,773
c. Transmission & Distribution 0 0 0 0 0 0 -79 -27 0 0 -2,028 -5,182 -7,316
4 Final Energy Supply 0 0 10,534 8 14,621 0 43,434 13,578 8,154 11,623 18,679 10 120,640 5 Statistic Discrepancy 0 0 0 0 -3,960 0 0 0 0 0 28 10 -3,923
6 Final Energy Consumption 0 0 10,534 8 18,582 0 43,434 13,578 8,154 11,623 18,652 0 124,563
a. Industry 0 0 10,534 8 13,940 0 4,020 0 118 0 5,892 0 34,511 b. Transportation 0 0 0 0 37 0 35,778 13,578 0 0 19 0 49,412 c. Household 0 0 0 0 17 0 586 0 7,819 0 8,154 0 16,577 d. Commercial 0 0 0 0 215 0 508 0 217 0 4,586 0 5,526 e. Other Sector 0 0 0 0 0 0 2,543 0 0 0 0 0 2,543 7 Non Energy Use 0 0 0 0 4,372 0 0 0 0 11,623 0 0 15,995
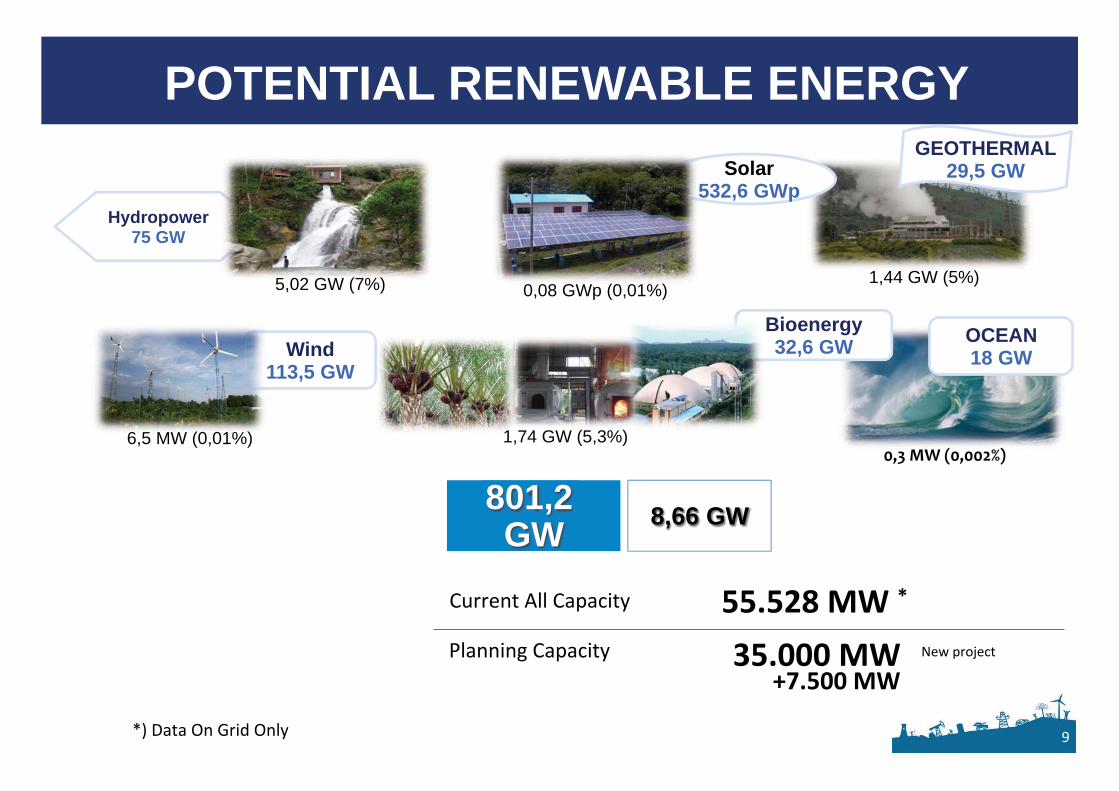
GEOTHERMAL 29,5 GW
Hydropower 75 GW
Solar 532,6 GWp
OCEAN 18 GW Wind
113,5 GW
5,02 GW (7%) 0,08 GWp (0,01%) 1,44 GW (5%)
6,5 MW (0,01%) 1,74 GW (5,3%)
801,2 GW
Bioenergy 32,6 GW
8,66 GW
POTENTIAL RENEWABLE ENERGY
DITJEN GATRIK - KESDM 10
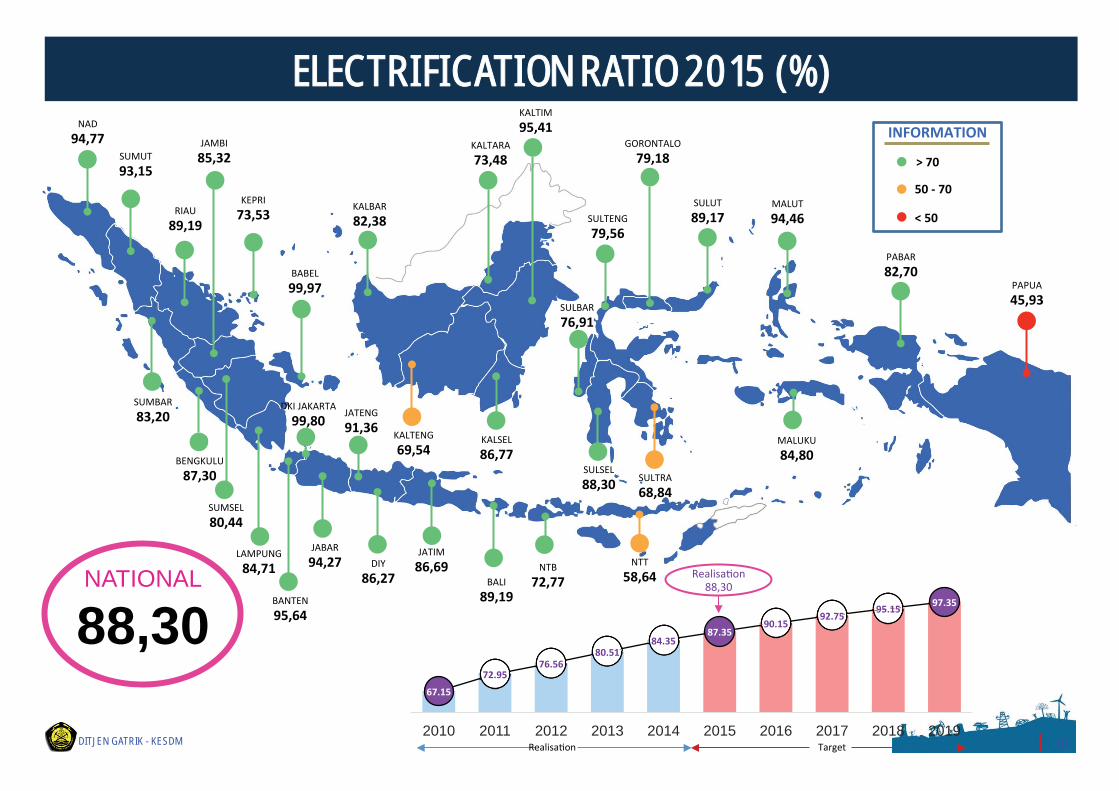
ELECTRIFICATION RATIO 2015 (%)
NATIONAL
88,30 2010 2011 2012 2013 2014 2015 2016 2017 2018 2019
(MW)
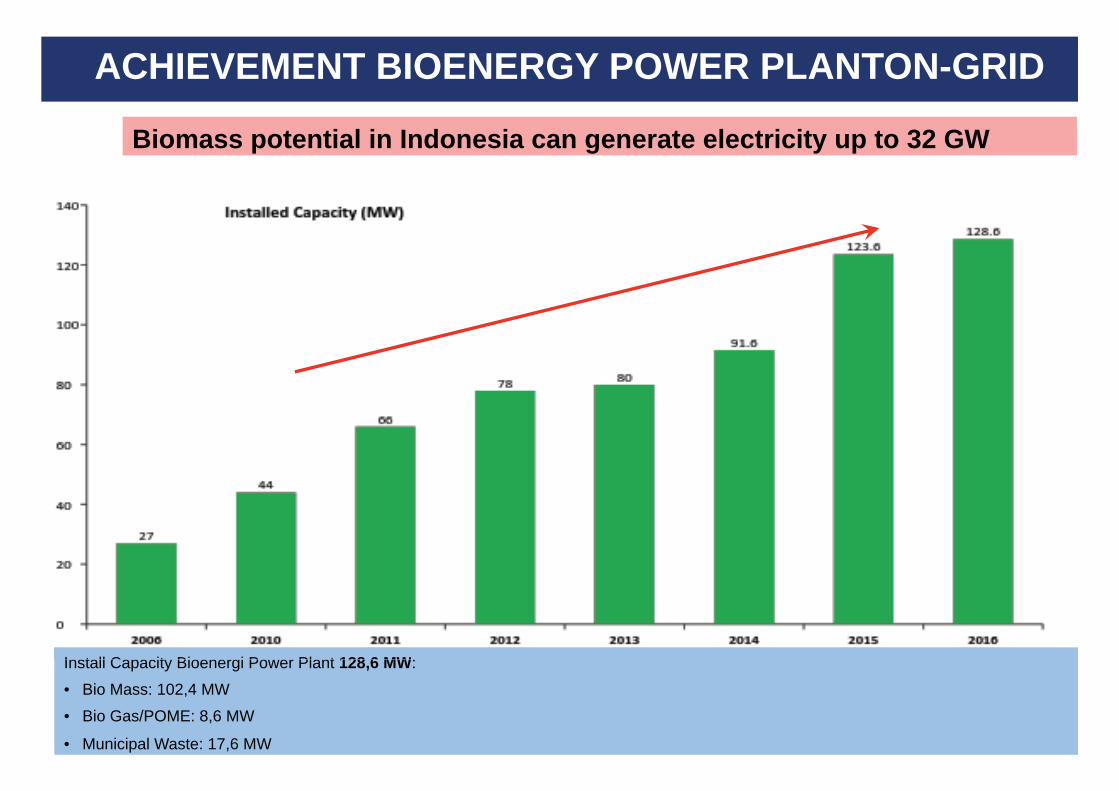
Install Capacity Bioenergi Power Plant 128,6 MW:
• Bio Mass: 102,4 MW
• Bio Gas/POME: 8,6 MW
• Municipal Waste: 17,6 MW
Biomass potential in Indonesia can generate electricity up to 32 GW
ACHIEVEMENT BIOENERGY POWER PLANTON-GRID
I t ll C it Bi i P Pl t 128 6 MW
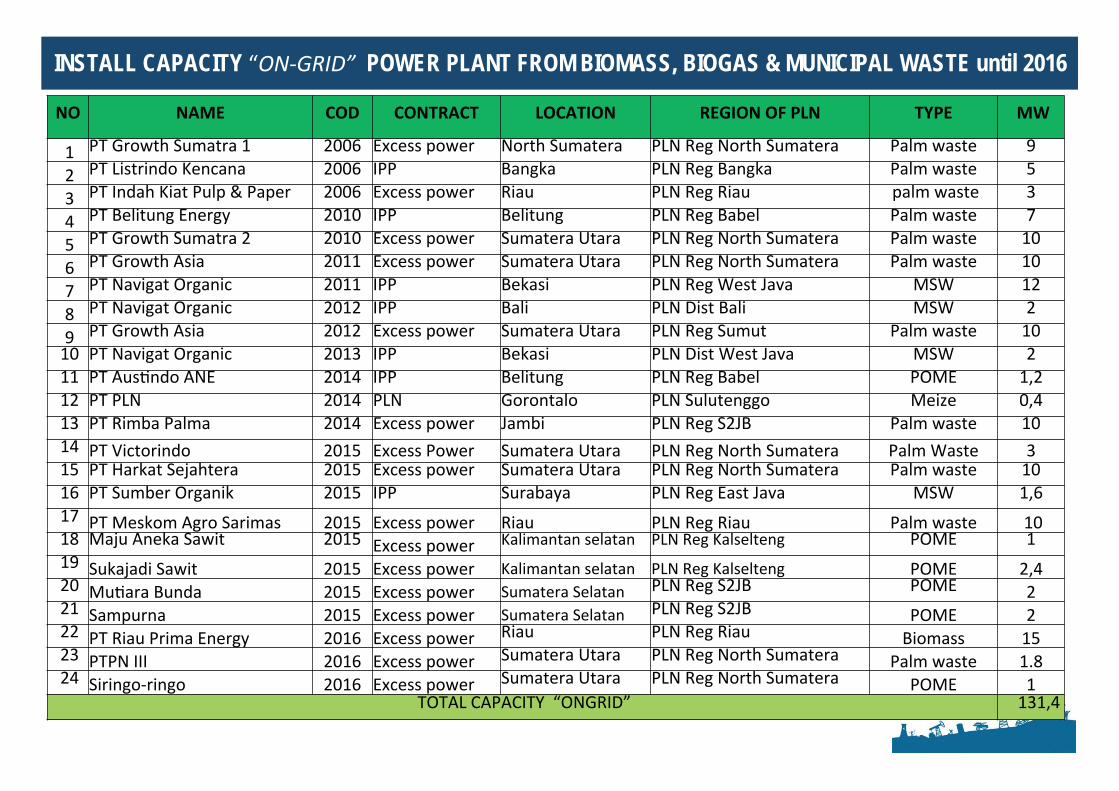
INSTALL CAPACITY POWER PLANT FROM BIOMASS, BIOGAS & MUNICIPAL WASTE until 2016
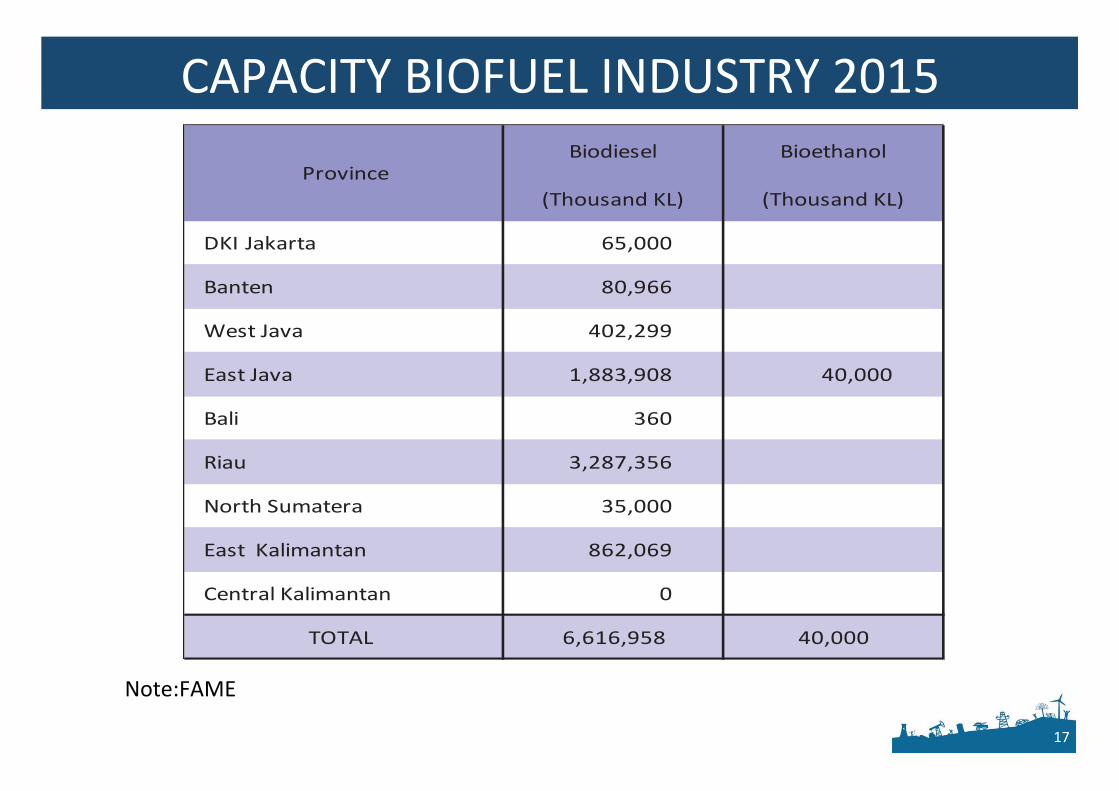
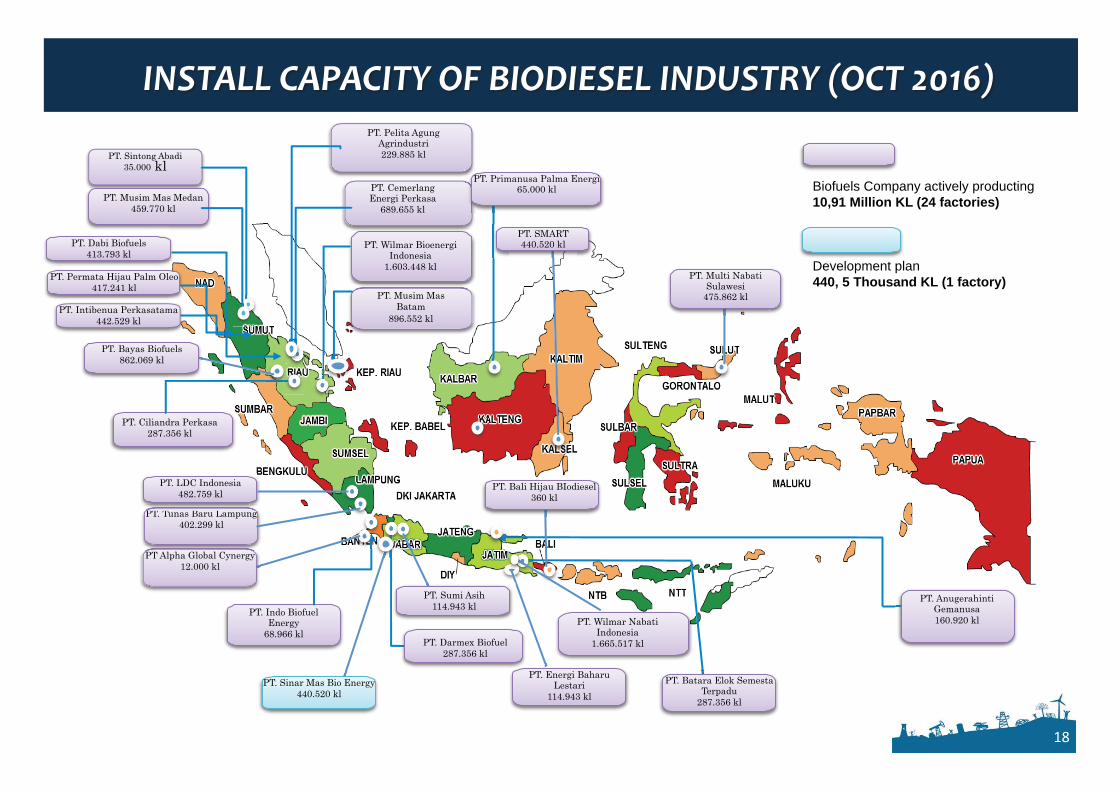
PT. Sintong Abadi 35.000 kl
PT. Musim Mas Batam
896.552 kl
PT. Pelita Agung Agrindustri 229.885 kl
PT. Cemerlang Energi Perkasa
689.655 kl
PT. Wilmar Bioenergi Indonesia
1.603.448 kl
PT. Ciliandra Perkasa 287.356 kl
PT. Musim Mas Medan 459.770 kl
PT. Indo Biofuel Energy
68.966 kl PT. Darmex Biofuel
287.356 kl
PT. Wilmar Nabati Indonesia
1.665.517 kl
PT. Anugerahinti Gemanusa 160.920 kl
PT. Primanusa Palma Energi 65.000 kl
PT. Energi Baharu Lestari
114.943 kl
PT Alpha Global Cynergy 12.000 kl
PT. Sumi Asih 114.943 kl
PT. Bali Hijau BIodiesel 360 kl
PT. SMART 440.520 kl
PT. Sinar Mas Bio Energy 440.520 kl
PT Al h Gl b lP C
PT. Tunas Baru Lampung 402.299 kl
PT T B LPT T B L
PT. LDC Indonesia 482.759 kl
Biofuels Company actively producting 10,91 Million KL (24 factories) Development plan 440, 5 Thousand KL (1 factory)
PT. Bayas Biofuels 862.069 kl
PT. Multi Nabati Sulawesi
475.862 kl PT. Intibenua Perkasatama
442.529 kl
PT. Dabi Biofuels 413.793 kl
PT. Permata Hijau Palm Oleo 417.241 kl
PT. Batara Elok Semesta Terpadu
287.356 kl
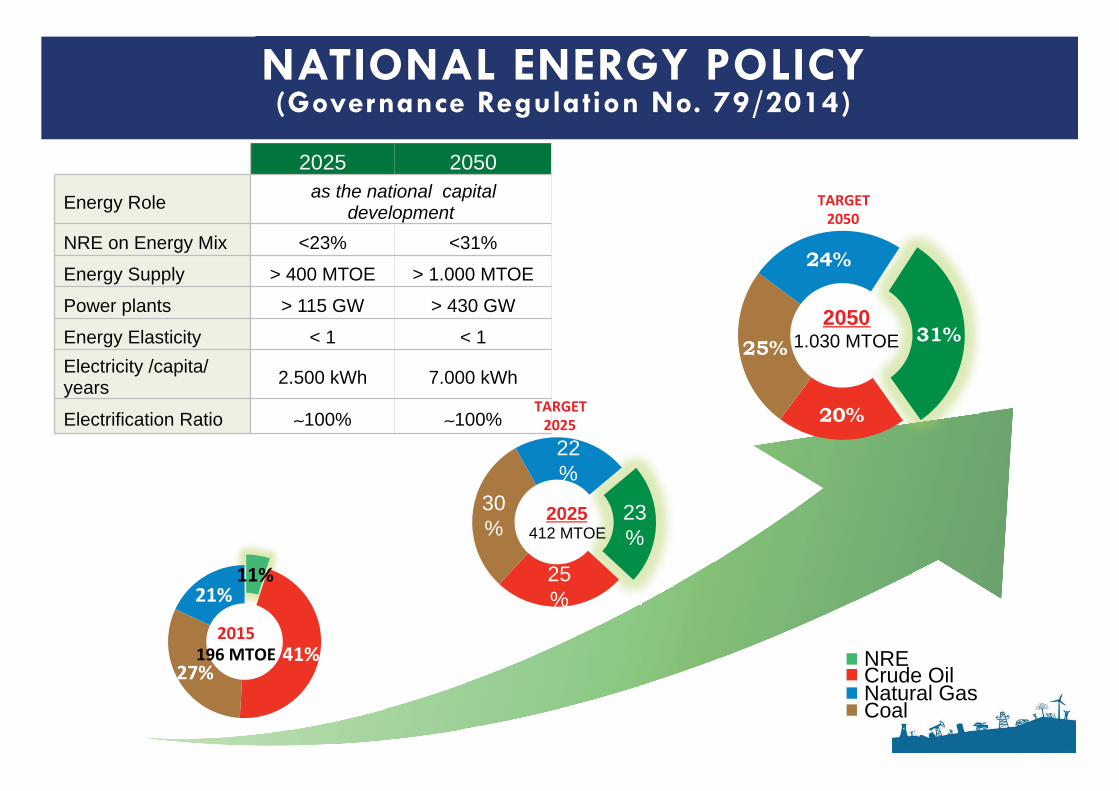
NATIONAL ENERGY POLICY (Governance Regulation No. 79/2014)
2025 2050
Energy Role as the national capital development
NRE on Energy Mix <23% <31%
Energy Supply > 400 MTOE > 1.000 MTOE
Power plants > 115 GW > 430 GW
Energy Elasticity < 1 < 1 Electricity /capita/years 2.500 kWh 7.000 kWh
Electrification Ratio ∼100% ∼100%
23%
25%
30%
22%
2025 412 MTOE
31%
20%
25%
24%
2050 1.030 MTOE
NRE Crude Oil Natural Gas Coal
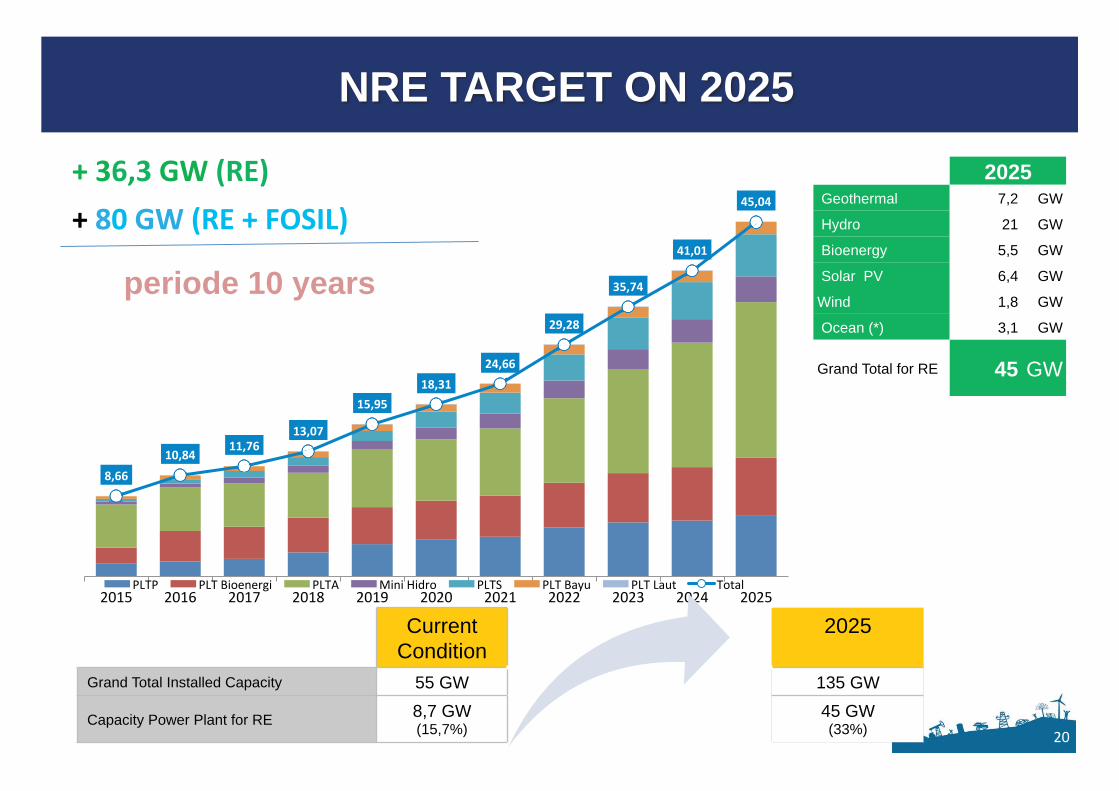
Current Condition
2025
Grand Total Installed Capacity 55 GW 135 GW
Capacity Power Plant for RE 8,7 GW (15,7%)
45 GW (33%)
periode 10 years
2025 Geothermal 7,2 GW
Hydro 21 GW
Bioenergy 5,5 GW
Solar PV 6,4 GW
Wind 1,8 GW
Ocean (*) 3,1 GW
Grand Total for RE 45 GW
NRE TARGET ON 2025
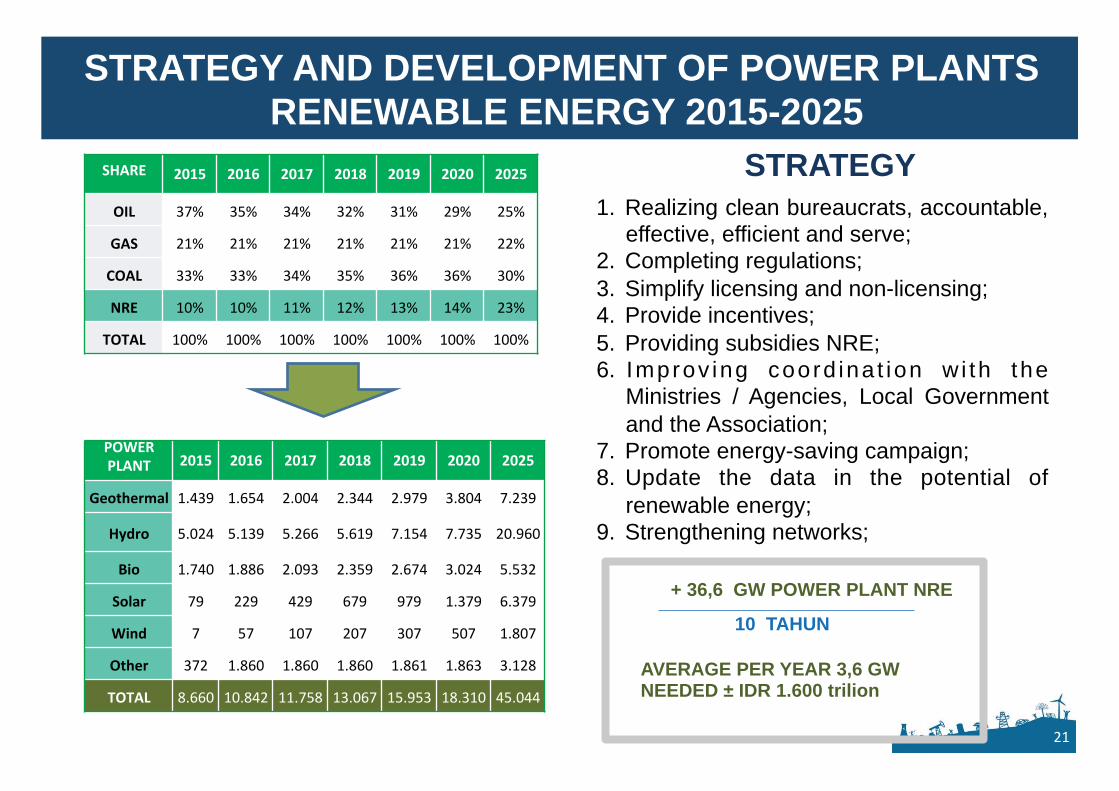
STRATEGY AND DEVELOPMENT OF POWER PLANTS RENEWABLE ENERGY 2015-2025
1. Realizing clean bureaucrats, accountable, effective, efficient and serve;
2. Completing regulations; 3. Simplify licensing and non-licensing; 4. Provide incentives; 5. Providing subsidies NRE; 6. Improv ing coord ina t ion w i th the
Ministries / Agencies, Local Government and the Association;
7. Promote energy-saving campaign; 8. Update the data in the potential of
renewable energy; 9. Strengthening networks;
STRATEGY
+ 36,6 GW POWER PLANT NRE
10 TAHUN
AVERAGE PER YEAR 3,6 GW NEEDED ± IDR 1.600 trilion
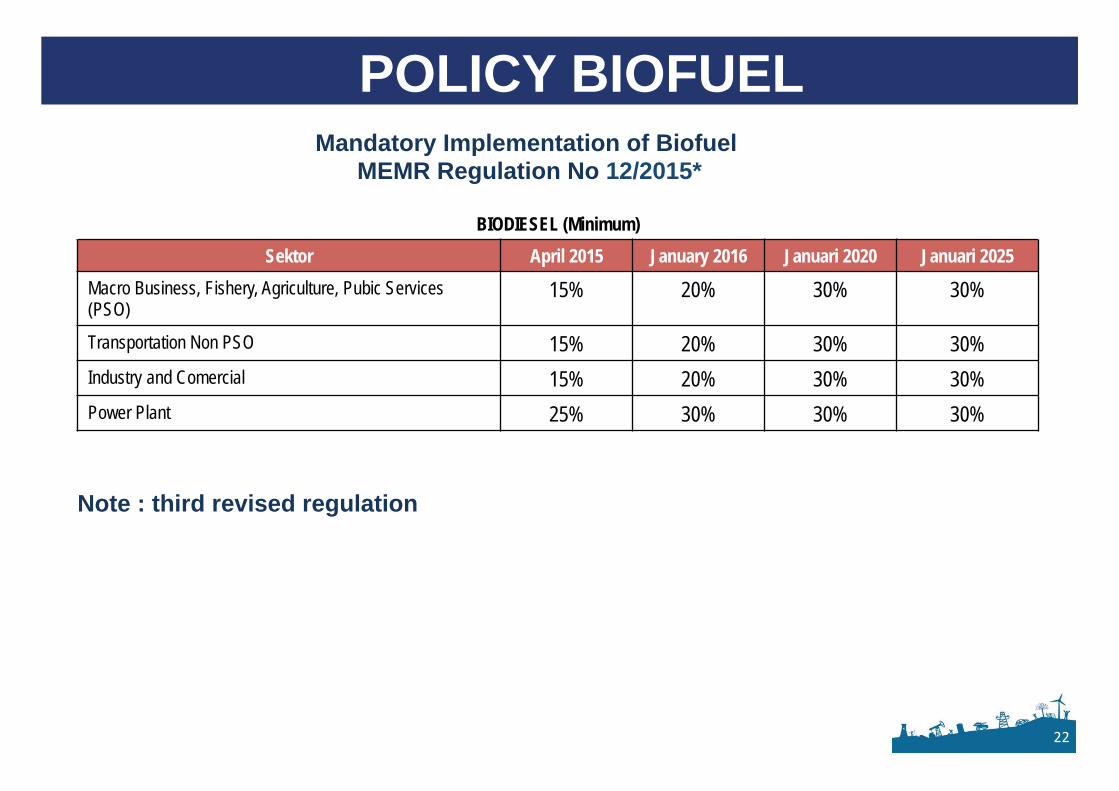
Mandatory Implementation of Biofuel MEMR Regulation No 12/2015*
POLICY BIOFUEL
BIODIESEL (Minimum) Sektor April 2015 January 2016 Januari 2020 Januari 2025
Macro Business, Fishery, Agriculture, Pubic Services (PSO)
15% 20% 30% 30%
Transportation Non PSO 15% 20% 30% 30% Industry and Comercial 15% 20% 30% 30% Power Plant 25% 30% 30% 30%
Note : third revised regulation
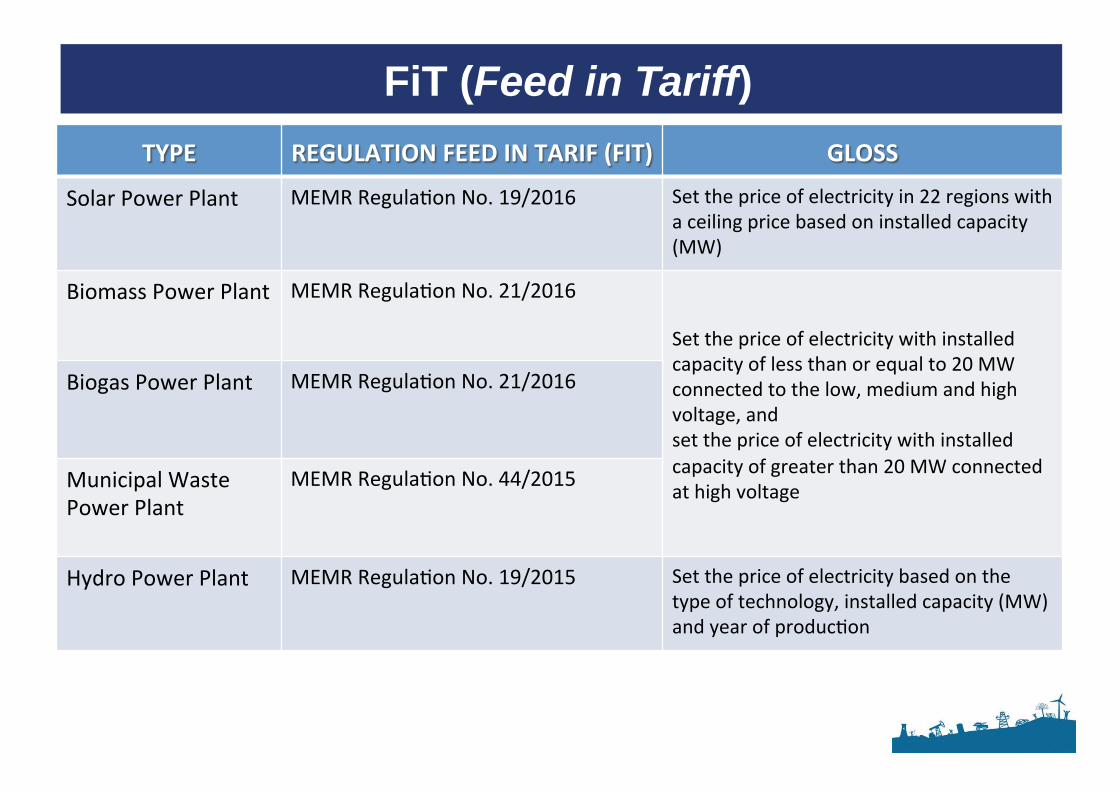
FiT (Feed in Tariff)
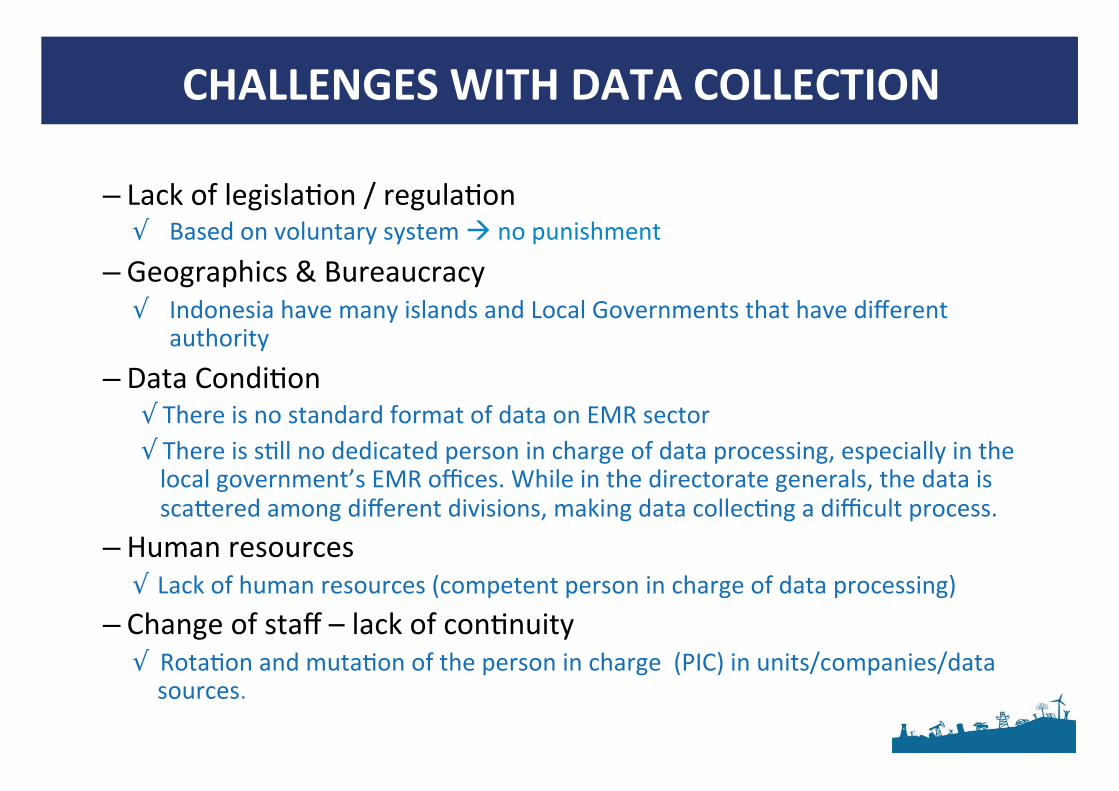
– √
– √
– √√
– √
– √
– √
– √
– √
– √
√