2 3 4 5 BEFORE THE PUBLIC UTILITIES COMMISSION 6 OF THE...
53
1 2 3 4 5 6 7 8 9 10 11 12 13 14 15 16 17 18 19 20 21 22 23 24 25 26 27 28 COOPER, WHITE & COOPER LLP ATTORNEYS AT LAW 201 CALIFORNIA STREET SAN FRANCISCO, CA 94111-5002 BEFORE THE PUBLIC UTILITIES COMMISSION OF THE STATE OF CALIFORNIA In the Matter of Application of Foresthill Telephone Co. (U 1009 C) to Review Intrastate Rates and Charges, Establish a New Intrastate Revenue Requirement and Rate Design, and Modify Selected Rates. A. 17-10-004 REBUTTAL TESTIMONY OF DALE LEHMAN ON BEHALF OF FORESTHILL TELEPHONE CO. July 18, 2018
Transcript of 2 3 4 5 BEFORE THE PUBLIC UTILITIES COMMISSION 6 OF THE...

1
2
3
4
5
6
7
8
9
10
11
12
13
14
15
16
17
18
19
20
21
22
23
24
25
26
27
28COOPER, WHITE & COOPER LLP ATTORNEYS AT LAW
201 CALIFORNIA STREET SAN FRANCISCO, CA 94111-5002
BEFORE THE PUBLIC UTILITIES COMMISSION
OF THE STATE OF CALIFORNIA
In the Matter of Application of Foresthill Telephone Co. (U 1009 C) to Review Intrastate Rates and Charges, Establish a New Intrastate Revenue Requirement and Rate Design, and Modify Selected Rates.
A. 17-10-004
REBUTTAL TESTIMONY OF DALE LEHMAN
ON BEHALF OF FORESTHILL TELEPHONE CO.
July 18, 2018

1
2
3
4
5
6
7
8
9
10
11
12
13
14
15
16
17
18
19
20
21
22
23
24
25
26
27
28
1223615.1 1
INTRODUCTION
Q.1. Are you the same Dale Lehman who submitted opening testimony in this
proceeding?
A.1. Yes.
Q.2. What is the purpose of your rebuttal testimony?
A.2. My testimony will address several issues raised in Ms. Roman’s recommendations
and calculations of Foresthill Telephone Co.’s (“Foresthill”) corporate expenses. First, I explain
why the recommendation of ORA witness Laura Roman to include rate case expense under the
corporate operations expense cap is inappropriate and results in a 100% disallowance of
Foresthill's rate case expense. Second, I explain other errors in her application of the cap to
Foresthill, including her proposal to allocate Foresthill's rate case expense caused by its regulated
operations to Foresthill's unregulated affiliates who do not cause this expense. Third, I
demonstrate errors in her proposed inflation rates and labor and non-labor escalation factors, and
present more appropriate factors to use in this proceeding.
In addition, I demonstrate several deficiencies in ORA witness's James Ahlstedt’s
testimony regarding proposed rates for Foresthill’s services. His comparisons with telephone
companies and populations in urban areas in California are misleading, and his recommendations
ignore price elasticity and basic economic principles.
Q.3. Please summarize your rebuttal testimony.
A.3. ORA claims that rate case expense is included under the FCC corporate operations
cap, but it confuses the accounts in which rate case expense is reported with the model through
which the FCC derives the cap. The regression models that produce the cap depend on the
relationships between corporate operations expense per loop and the number of loops. Rate case
expense can only be reflected in this relationship to the extent that a significant number of rural
study areas in 2009 had substantial rate case expense in their reported corporate operations
expenses for that year. There is no evidence that this is the case, and I provide a simulation that
shows it is virtually impossible for the cap to include any meaningful portion of Foresthill’s rate
case expense. Instead, rate case expense is a transactional expense that must be recovered

1
2
3
4
5
6
7
8
9
10
11
12
13
14
15
16
17
18
19
20
21
22
23
24
25
26
27
28
1223615.1 2
separately from the cap.
Ms. Roman’s application of the cap is also flawed because she ignores several relevant
factors to Foresthill’s corporate operations that I present in my Opening Testimony: prevailing
wage rates for the types of labor involved in corporate operations activities relative to other rural
areas of the country; the relatively intense regulatory environment in California, which directly
impacts corporate operations; and the nature of Foresthill’s service territory relative to that of
other rural study areas of the country. Adjustments are necessary to account for these unique
factors because the FCC cap is based on data comparing different rural study areas nationwide,
and these study areas have widely varying conditions that impact corporate operations expense.
I demonstrate that Ms. Roman’s application of the cap is further flawed, in that her
inflation factor omits two years of expected inflation—2018 and 2019. Her analysis fails to
recognize the two year lag between when costs are reported to NECA for high cost loop support
and the inflation factor that NECA provides for calculation of the cap. When using the cap for a
rate case, it is necessary to forecast inflation for future years, while NECA only reports past
inflation. I also explain that the same error applies to Ms. Roman’s recommended non-labor
escalation factors.
In addition, Ms. Roman’s recommended labor cost escalation factors are inappropriately
based on factors used in water cases, and ORA has failed to cite to authority to support their use in
telecommunications cases. ORA's labor cost escalation factors are lower than a number of more
relevant and justifiable cost escalation forecasts for a small telephone company like Foresthill.
Mr. Ahlstedt provides a number of misleading comparisons of telephone service rates and
income levels in Foresthill’s territory with urban areas in California. He unduly focuses on the
rates of the only carrier that has basic rates higher than what Foresthill is proposing—AT&T—and
there is no evidence that a sizable number of AT&T’s customers actually pay those tariffed rates.
Further, ORA has itself claimed in other proceedings that AT&T’s rates are not just and
reasonable. Yet, ORA recommends a rate for Foresthill driven by AT&T’s rate. And, ORA has
refused to admit or deny in response to Foresthill's data request whether it contends AT&T's rates
are "just and reasonable." See ORA's Response to Data Request Set 5, Question 7, Attachment

1
2
3
4
5
6
7
8
9
10
11
12
13
14
15
16
17
18
19
20
21
22
23
24
25
26
27
28
1223615.1 3
DL-1. I show that Foresthill’s proposed rates are among the highest in rural areas of the country,
despite any evidence that Foresthill’s territory has income higher than the rest of California.
ORA’s rate recommendations also implicitly assume that the price elasticity for all of
Foresthill’s services is zero, which is at odds with economic logic and recent studies.
Q.4. How is your rebuttal testimony organized?
A.4. My rebuttal testimony contains four sections: rate case expense issues, the
application of the corporate operations expense cap, inflation and escalation factors, and rate
issues.
RATE CASE EXPENSE
Q.5. Ms. Roman claims that Foresthill’s amortized rate case expense should be
disallowed, alleging that it is included in the FCC cap on Corporate Operations Expense?
Do you agree?
A.5. No, Ms. Roman erroneously confuses the account in which rate case expense is
reported with the way the FCC cap is derived. As I explained in my Opening Testimony, rate case
expense is reported under Corporate Operations Expense Account 6720, but that does not mean
that the FCC cap includes rate case expense. The FCC cap is derived by comparing corporate
operations expenses per loop for a large set of rural telephone study areas based on historical
expense levels. The vast majority of the companies subject to this comparison did not have rate
case expense in 2009, the year upon which the FCC cap was based. Accordingly, the cap does not
include rate case expense. ORA offers no evidence to discount this fact.
Q.6. Assuming rate case expense was included in the corporate expense figures for
2009, would the corporate cap be a reasonable way to provide for recovery of that expense?
A.6. No. While it is highly unlikely that significant rate case expense was included in
the 2009 base year that informed the cap, even if it were, this would not be a reasonable way to
recover rate case expense because of the statistical model upon which the cap is based. As I have
explained, rate case expense is analytically separate from historical corporate expense figures that
are used to project corporate expenses for a test year. Rate case expense does not occur regularly,
and is only incurred as part of a required, ongoing regulatory process, such as this rate case. The

1
2
3
4
5
6
7
8
9
10
11
12
13
14
15
16
17
18
19
20
21
22
23
24
25
26
27
28
1223615.1 4
regression model that drives the cap does not account for this kind of a “transactional” expense, so
any reliance on the cap to account for and recover this expense is misplaced.
To illustrate this point, I conducted an experiment to see what the impact of a hypothetical
significant (and unrealistic) number of rate cases would be for the FCC cap calculation. I took the
2009 NECA data and, using an assumption that 20% of the rural study areas involved a rate case
during that year, I applied a hypothetical rate case expense of $166,666 (equivalent to Foresthill’s
proposed annual amortization of their rate case expense) to 20% of the rural study areas. I then
derived the kinked linear relationship between the corporate operations expense per loop and the
number of loops for both the original NECA data and the simulated data where 20% of the study
areas experienced rate case expense (i.e., I removed $166,666 from the corporate operations
expenses of these random 20% of study areas). Figure 1 shows the original relationship used in
creating the cap, along with my simulated relationship:
Figure 1: Expense-Loop Relationship Used to Derive the Cap and Simulated Rate Case Expense
The red line on top is the original FCC model and the green line on bottom shows the fitted
relationship between corporate operations expenses per loop and the number of loops for the

1
2
3
4
5
6
7
8
9
10
11
12
13
14
15
16
17
18
19
20
21
22
23
24
25
26
27
28
1223615.1 5
simulated hypothetical removal of rate case expense from 20% of the rural study areas.1 As
Figure 1 shows, if rate case expense were included for an unrealistically large number of rural
study areas in account 6720 data in 2009, the resulting FCC cap does not change much compared
with what the cap would be if rate case expense were removed from account 6720. The reason is
simple – the linear relationship is an average relationship, and the average changes little due to
fairly large changes in a subsample of the data. So, without specifically adjusting for them, as
Foresthill has done, the FCC cap relationship recovers little rate case expense, even with my
unrealistically large (20%) simulated model of these expenses for 2009. This relationship shows
why the cap cannot be relied upon to account for rate case expense as such expenses are
analytically independent of the cap. As a result, rate case expense must be separately recovered.
To the extent that ORA believes the intent or results of the cap are designed to recover rate case
expense, ORA is wrong.
Q.7. Is there other evidence regarding the infrequent and spiky nature of rate case
expense?
A.7. Yes, Ms. Roman provides a good example in her Figure 5 which purports to show a
sizeable increase in Foresthill’s intrastate corporate operations expense in 2019 over prior years.
She claims “Foresthill’s TY 2019 Corporate Operations Expense proposal represents a 69%
increase from its actual 2016 Corporate Operations Expense, see Figure 5.” But the $173,353 “in
excess of its Corporate Cap” is primarily due to Ms. Roman’s inclusion of the $166,667 of rate
case expense within the Corporate Operations Expense. That is the nature of rate case expense – it
occurs sporadically with large temporary effects on reported account 6720 expense levels. As my
simulation shows, it is unlikely that the FCC cap reflects any substantial rate case expense of any
rural telephone company.
Q.8. Ms. Roman recommends that Foresthill not be allowed to recover rate case
expense outside the Corporate Operations Expense Cap, citing the Commission’s intent to
“reduce rate case litigation cost.” Do you agree with that recommendation?
A.8. No, Ms. Roman has gone beyond the Commission’s rationale for adopting the cap
1 The scales in Figure 1 have been truncated so that the lines and actual data can be seen more clearly.

1
2
3
4
5
6
7
8
9
10
11
12
13
14
15
16
17
18
19
20
21
22
23
24
25
26
27
28
1223615.1 6
and ascribed views to the Commission that it did not express. Use of the cap as a rebuttable
presumption was expected to limit litigation cost by setting a benchmark and requiring a company
to justify expenditures above the cap. If the cap becomes the presumed level of corporate expense,
fewer debates were expected to occur about specific historical corporate expense components.
However, rate case expense is not a historical expense embedded in corporate expense figures that
are reviewed in a rate case. Rate case expense is a transactional expense that is incurred in
connection with a specific, required regulatory proceeding that Foresthill cannot avoid – this rate
case. While the Commission’s discussion of the cap in D.14-12-084 suggests that litigation costs
might be reduced by simplifying the corporate expense methodology, the Commission did not
state that rate case expense is included in that cap. Affecting litigation about the cap and
determining the components of the cap are not the same thing.
Q.9. Ms. Roman also states that a portion of Foresthill’s rate case expense should
be allocated to its unregulated subsidiaries. Do you agree?
A.9. No, rate case expense is caused by the regulated services offered by the regulated
utility, not by the unregulated services of Foresthill's affiliates. Allocating rate case expense to
affiliates who do not cause this expense would distort the profitability of both the regulated and
non-regulated businesses.2 When costs are allocated to the nonregulated affiliate but not caused
by that business activity, the profitability of that business is artificially reduced (or eliminated).
This approach jeopardizes the incentive to engage in that business. It could also distort the market
by applying costs to one entity, while not applying those costs to other market participants. In
effect, this creates a "tax" on just one provider in the market, which undermines the functioning of
the market as a whole, and which can lead to irrational behavior by competing firms and pricing
irregularities that harm consumers. The proposal that affiliates that use those services should be
allocated a portion of the regulated utility’s costs of complying with regulation makes no more
sense than asking a hypothetical competitor that uses Foresthill’s network services to bear a
portion of those costs of regulation.
2 ORA admits in response to Foresthill's data requests that it does not contend that, under 47 C.F.R., Part 64, costs can be allocated to an entity that did not cause the costs to be incurred. ORA's Response to Data Request Set 6, Question 6, Attachment DL-2.
1
2
3
4
5
6
7
8
9
10
11
12
13
14
15
16
17
18
19
20
21
22
23
24
25
26
27
28
1223615.1 7
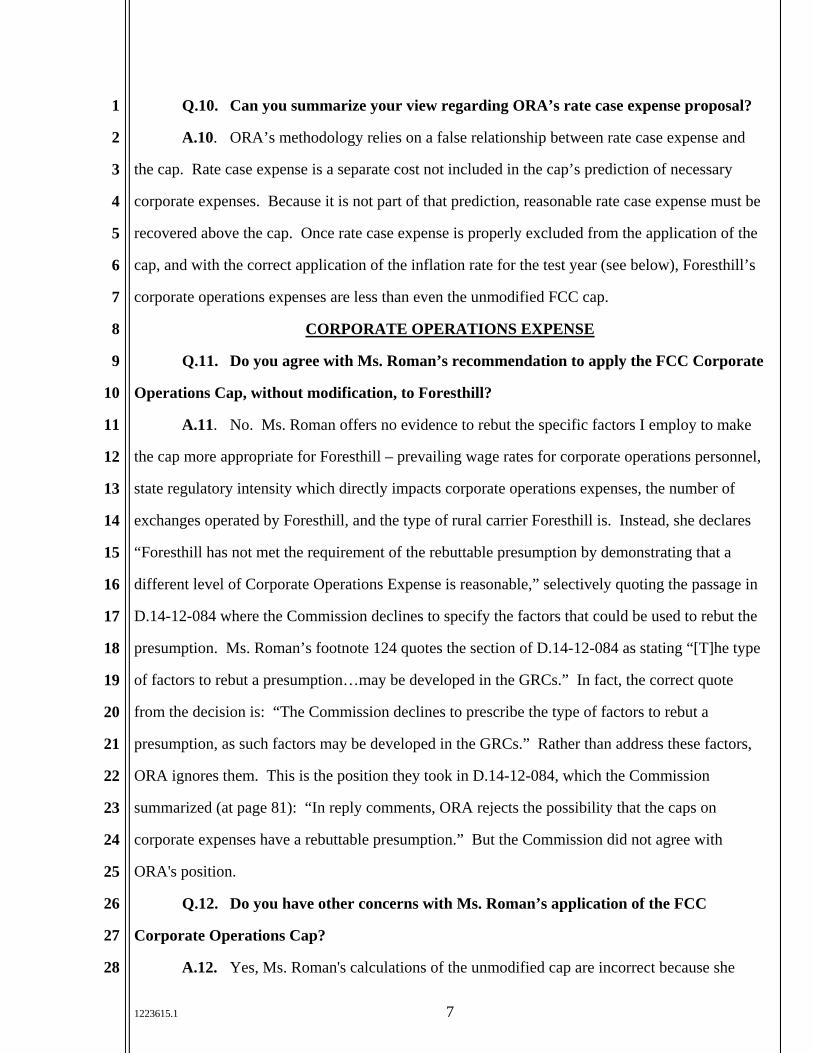
Q.10. Can you summarize your view regarding ORA’s rate case expense proposal?
A.10. ORA’s methodology relies on a false relationship between rate case expense and
the cap. Rate case expense is a separate cost not included in the cap’s prediction of necessary
corporate expenses. Because it is not part of that prediction, reasonable rate case expense must be
recovered above the cap. Once rate case expense is properly excluded from the application of the
cap, and with the correct application of the inflation rate for the test year (see below), Foresthill’s
corporate operations expenses are less than even the unmodified FCC cap.
CORPORATE OPERATIONS EXPENSE
Q.11. Do you agree with Ms. Roman’s recommendation to apply the FCC Corporate
Operations Cap, without modification, to Foresthill?
A.11. No. Ms. Roman offers no evidence to rebut the specific factors I employ to make
the cap more appropriate for Foresthill – prevailing wage rates for corporate operations personnel,
state regulatory intensity which directly impacts corporate operations expenses, the number of
exchanges operated by Foresthill, and the type of rural carrier Foresthill is. Instead, she declares
“Foresthill has not met the requirement of the rebuttable presumption by demonstrating that a
different level of Corporate Operations Expense is reasonable,” selectively quoting the passage in
D.14-12-084 where the Commission declines to specify the factors that could be used to rebut the
presumption. Ms. Roman’s footnote 124 quotes the section of D.14-12-084 as stating “[T]he type
of factors to rebut a presumption…may be developed in the GRCs.” In fact, the correct quote
from the decision is: “The Commission declines to prescribe the type of factors to rebut a
presumption, as such factors may be developed in the GRCs.” Rather than address these factors,
ORA ignores them. This is the position they took in D.14-12-084, which the Commission
summarized (at page 81): “In reply comments, ORA rejects the possibility that the caps on
corporate expenses have a rebuttable presumption.” But the Commission did not agree with
ORA's position.
Q.12. Do you have other concerns with Ms. Roman’s application of the FCC
Corporate Operations Cap?
A.12. Yes, Ms. Roman's calculations of the unmodified cap are incorrect because she

1
2
3
4
5
6
7
8
9
10
11
12
13
14
15
16
17
18
19
20
21
22
23
24
25
26
27
28
1223615.1 8
applies an incorrect inflation factor in the derivation of the cap. I will address the required
adjustment to this factor in the next section, but I explain her error here. She is using an inflation
factor (1.113096) for the test year 2019, which only includes inflation through 2017. Her number
comes from the NECA documentation for application of the cap, updated to include expected
inflation (incorrectly, as I explain in the next section) for 2018 and 2019. However, NECA reports
an inflation figure for the Gross Domestic Product-Chained Price Index (“GDP-CPI”) that is used
for recovering costs in that year – these costs are reported in the prior year, and apply to costs
incurred two years prior. Accordingly, there is a two-year lag between the time when expenses are
incurred and when they may be recovered from federal universal service funds.
The timing is clear in the NECA instructions for submission of federal high-cost support
data.3 The 2018 GDP-CPI figure from NECA (1.097290) says “January 1, 2018 through
December 31, 2018 (Applies to 2017 -1, -2, -3, -4).” This means that the data are used to recover
federal high-cost support in 2018, but the data are filed in the quarterly reports in 2017, based
upon data from 2016. Appendix A of the instructions states that for the “2017 Data Collection
Form,” the company is to “enter the amounts for the 12-month period ending December 31,
2016.” In other words, costs are incurred in 2016, reported in 2017, and available to be recovered
from federal high-cost support in 2018. There is a two-year lag between incurring costs and
potentially recovering those costs from federal high-cost support, and for the correct cap figure to
be computed for a future period, the appropriate inflationary figures must be applied.
It is important to note that the function of the NECA guidance for applying the GDP-CPI
factor to the FCC cap is for cost recovery from federal high-cost support mechanisms. The two-
year lag that results is due to the difference in times between incurring costs, reporting them to
NECA, and recovering those costs from federal high-cost support. So, the NECA GDP-CPI
number does not include any expected inflation – only inflation that has already occurred.
Here, it is necessary to project sufficient inflation to reach estimated FCC cap figures for
the 2019 test year. This Commission’s use of the FCC cap in general rate cases is forward-
3 See https://www.neca.org/Current_Results.aspx, accessed on May 20, 2018. In particular, Appendices A and B make clear the year for which data are reported, the time period the collected data refers to, and the time period the data will be used in. Appendix B is attached hereto as Attachment DL-3.

1
2
3
4
5
6
7
8
9
10
11
12
13
14
15
16
17
18
19
20
21
22
23
24
25
26
27
28
1223615.1 9
looking and focused on a future test year, so it is necessary to include expected inflation. I have
done that, but ORA has not.
Q.13. How can you tell that Ms. Roman has misunderstood the timing of the NECA
GDP-CPI measure?
A.13. "Exhibit B-3_Attachment 1.3 (BEA_GDPCPI_2009-2019)" to her testimony makes
this clear. For example, the tab labeled " Table 6 08-30-2017" (the Bureau of Economic
Analysis's ("BEA") GDP-CPI estimates for 2017) shows:
Table 6. Price Indexes for Gross Domestic Product
[Index numbers, 2009=100] 2014 2015 2016 Seasonally adjusted
2016 2017 Q2 Q3 Q4 Q1 Q2r
1 Gross domestic product
108.839 110.012 111.419 111.257 111.641 112.190 112.752 113.024
Then, the GDP-CPI tab of Ms. Roman’s exhibit shows the following calculation of the inflation
rate for these three years, and how it results in the NECA algorithm for the FCC cap:
(emphasis in the original). First, the NECA methodology shows a GDP-CPI for 2012 of 1.0000,
while the BEA measure for the GDP-CPI was 100 in 2009. The FCC re-based the corporate cap

1
2
3
4
5
6
7
8
9
10
11
12
13
14
15
16
17
18
19
20
21
22
23
24
25
26
27
28
1223615.1 10
calculations to a base year of 2010, while the GDP-CPI data from BEA uses a base year of 2009.
So, after moving the base year to 2010, NECA shows no inflation for the year 2012 – two years
after the re-based GDP-CPI was equal to 100. This is the result of the two year lag between
incurring costs and receiving high cost loop support; i.e., the 2012 NECA instructions are for costs
incurred in 2010.
This same result can also be seen in the shaded cells. Ms. Roman is recommending the use
of 1.113096 as the inflation factor, but this number is derived by multiplying the 2017 inflation
figure (cell K8) by the 2018 NECA inflation factor (cell L10). That product is exactly what Ms.
Roman is recommending for inflation for 2019. It is actually the inflation measured in 2017 as a
result of the same two year lag. So, ORA’s recommendation includes no inflation for the years
2018 and 2019.
The GDP-CPI inflation for 2018 and 2019 cannot be calculated from the BEA data. There
are few forecasts of GDP-CPI (the calculations are generally backward-looking, based on GDP
data after it is reported). In the next section, I provide one publicly available forecast for GDP-
CPI inflation, but ORA's material error is that Ms. Roman has not included any inflation for two
years.
INFLATION AND ESCALATION FACTORS
Q.14. Are there any public forecasts for the GDP-CPI price index (also known as the
GDP deflator)?
A.14. Rarely is the GDP-CPI forecast, since it requires forecasts of the nominal and real
GDP, which themselves require some forecast for the rate of inflation. The Energy Information
Administration ("EIA") publishes the only such forecasts of which I am aware.4 As I have
explained, Ms. Roman only measures inflation through 2017. According to the EIA estimates, the
GDP implicit price deflator is expected to rise by 2.0394% in 2018 and 2.4871% in 2019. When
these inflation estimates are added to Ms. Roman’s 2017 inflation estimate of 11.3096% (inflation
from the 2010 base year for the FCC cap), the inflation rate for the 2019 test year should be
16.404%. I used 16.08% in my opening testimony.
4 See https://www.eia.gov/opendata/qb.php?category=1039997&sdid=STEO.GDPDIUS.A.

1
2
3
4
5
6
7
8
9
10
11
12
13
14
15
16
17
18
19
20
21
22
23
24
25
26
27
28
1223615.1 11
Q.15. Do you agree with Ms. Roman's recommendation to reduce the operating
expense non-labor growth factors from Foresthill's proposal?
A.15. No. For non-labor growth, ORA appears to rely on the GDP-CPI. As discussed
above, she misunderstands the timing of the release of this data. Although GDP-CPI may be used
for non-labor cost growth, it is essential that the forecast inflation for 2018 and 2019 be included.
Thus, the correct rates would be 1.8% for 2017, 2.0% for 2018, and 2.5% for 2019 for the non-
labor escalation factors.
Q.16. Do you agree with Ms. Roman’s recommended labor growth factors?
A.16. No. Her testimony cites the CPUC, but her precise reference is to the CPUC
Escalation Memorandum, Attachment L to her testimony. This document is produced by the
Energy Cost of Service & Natural Gas Branch of ORA and sent to the Water Division.5 Nowhere
does it say that these rates should be applied to telephone utilities, nor does it state that the CPUC
has approved these factors. Ms. Roman claims use of these escalation factors is “longstanding
Commission practice” but the only Resolution she cites in support of this claim does not adopt
those factors.6 In fact, when ORA proposed use of those factors for labor in a telephone company
rate case, the Commission instead chose a significantly higher labor cost inflation rate of 3%.7
Q.17. What would a reasonable cost escalation rate be for labor expenses?
A.17. There are many analyses that could be conducted to examine local labor market
conditions and the evolving markets for different types of labor. A more expedient approach is to
use a targeted cost inflation measure that is readily available. The Federal Reserve publishes an
5 It appears that this memo was intended to be applied to water companies, rather than telephone companies. See Water Rate Case Plan, D.04-06-018, at pp. 10-12. 6 Footnote 64 on page 10 of Roman’s testimony refers to Resolution T-16720, page 6, but that reference only shows that the Telecommunications Division (now Communications Division) used ORA’s escalation factors. However, the actual decision in the resolution did not adopt those factors, instead using the escalation factors proposed by the telephone company in that case. In response to Foresthill's data request seeking all supporting authorities that support Ms. Roman's contention, ORA failed to identify any other authority. ORA's Response to Foresthill's Data Request Set 6, Question 34, Attachment DL-4. 7 Resolution T-16720, Finding 4 (“We find Evans’ comments requesting a 3% expense inflation factor to be reasonable…”). In contrast, ORA's proposed labor escalation rates referenced in footnote 4 of Resolution T-16720 are slightly over 1%.

1
2
3
4
5
6
7
8
9
10
11
12
13
14
15
16
17
18
19
20
21
22
23
24
25
26
27
28
1223615.1 12
Employment Cost Index for “Total Compensation for Private Industry Workers in Utilities.”8
Figure 2 shows the annual rates of increase for this series from January 1, 2002 through January 1,
2018.
Based on this figure, a 3% annual increase is a reasonable approximation based on the experience
over the past decade. Figure 3 shows the trends for all Private Industry Workers in the Pacific
Census Division:9
8 Downloaded from https://fred.stlouisfed.org/series/CIU2014400000000I. 9 https://fred.stlouisfed.org/series/CIU2010000000249I.
‐6.0%
‐4.0%
‐2.0%
0.0%
2.0%
4.0%
6.0%
8.0%
10.0%
12.0%
2002
2003
2004
2005
2006
2007
2008
2009
2010
2011
2012
2013
2014
2015
2016
2017
2018
Figure 2: Annual Compensation Inflation: Utilities
0.0%
0.5%
1.0%
1.5%
2.0%
2.5%
3.0%
3.5%
4.0%
2007 2008 2009 2010 2011 2012 2013 2014 2015 2016 2017 2018
Figure 3: Labor Compensation Costs in the Pacific Region

1
2
3
4
5
6
7
8
9
10
11
12
13
14
15
16
17
18
19
20
21
22
23
24
25
26
27
28
1223615.1 13
Figure 4 shows Labor Compensation Cost trends for all Private Industry Workers:10
While the details vary for the different time series trends, 3% is a minimum annual rate to
expect for labor expenses. It is also consistent with the labor inflation factors published by
the Congressional Business Office as described in response to Question 77 of Mr. Clark's
Opening Testimony. The relatively higher escalation rates in recent years is due to a
combination of tight labor markets, increasing health care costs, and increasing pension
costs, and there is no reason to believe these factors will abate in the next two years.
RATES
Q.18. Mr. Ahlstedt proposes a residential basic monthly rate of $25.00, comparing it
with the weighted average of urban rates for the five California URF carriers: AT&T,
Frontier California, Frontier/Citizens, Frontier Southwest, and Consolidated (weighted
average of $25.45). Is this a reasonable comparison?
A.18. No, for several reasons. First, using the weighted average masks the fact that only
AT&T has a rate higher than the rate proposed by Foresthill. Since AT&T has almost 70% of the
lines served by these five companies, it is AT&T’s rate that is driving the comparison. However,
the number of working lines is not reported in conjunction with any particular pricing package
10 https://fred.stlouisfed.org/series/CIU2010000000000I.
0.0%
0.5%
1.0%
1.5%
2.0%
2.5%
3.0%
3.5%
4.0%
Figure 4: Compensation Costs all Private Industry Workers

1
2
3
4
5
6
7
8
9
10
11
12
13
14
15
16
17
18
19
20
21
22
23
24
25
26
27
28
1223615.1 14
among the many that AT&T offers.11 As I discussed in my Opening Testimony, there are a
number of reasons that AT&T’s rates are not appropriate for benchmarking Foresthill’s rates.
Among these reasons (discussed at length in my Opening Testimony, to which ORA has
provided no response) are the fact that AT&T’s rates are not regulated by the CPUC, there is no
evidence how many customers actually pay these rates to AT&T (given the prevalence of bundled
services that AT&T sells),12 and ORA itself has previously asserted that AT&T’s rates are not just
and reasonable.
If these URF rates are to be used at all, the unweighted average is more meaningful, given
these concerns. That unweighted average is $22.80 – below what Foresthill is proposing.
I provided a more meaningful comparison with basic service rates charged in other rural
service areas in the country: Foresthill’s proposed $24.00 rate would place it in the top 3.5% of
basic service rates nationwide.13 ORA has provided no evidence supporting why Foresthill’s
customers should be charged rates any higher than this simple average.
Q.19. Mr. Ahlstedt claims that income levels in Foresthill’s service area are more
accurately measured at the Census Block Group (CBG) level than at the zip code level
(which is provided in your Opening Testimony). Do you agree?
A.19. No, Mr. Ahlstedt is correct that CBGs are more granular than zip codes so are
potentially more accurate. However, he overlooks a major difference between the zip code data I
use and the CBG income data he uses. My data comes from the IRS and is population data – that
is, it is the actual reported income data for all people in each zip code. Mr. Ahlstedt is using data
from the American Community Survey ("ACS"), which is derived from household surveys. That
CBG level data is granular, but subject to large margins of error. Table 1 shows the income levels
for each of the 5 CBGs that Mr. Ahlstedt reports, with the margins of error provided by ACS:
11 The total AT&T line count in the Service Quality Report that Mr. Ahlstedt's relies upon includes voice, bundles, residential and business lines. In response to Foresthill's data requests, ORA claimed that it has no information about the number of customers who subscribe to AT&T's bundles that include a voice component. ORA's Response to Foresthill's Data Request Set 5, Question 11. Attachment DL-5. 12 In response to Foresthill's data requests, ORA has claimed that it has no information about the number or percentage of AT&T's customers who subscribe to AT&T's standalone, regulated, basic residential service. ORA's Response to Foresthill's Data Request Set 5, Question 6. Attachment DL-6. 13 Response to Question 9 in my Opening Testimony.

1
2
3
4
5
6
7
8
9
10
11
12
13
14
15
16
17
18
19
20
21
22
23
24
25
26
27
28
1223615.1 15
Table 1: Median Household Incomes and Margins of Error14
CBG Median HH income margin of error
60610202001 $83,059 +/- $18,181
60610202002 $60,521 +/- $17,529
60610202003 $10,313 +/- $40,731
60610202004 $33,452 +/- $19,072
60610220132 $74,167 +/- $14,660
The principal advantage of the ACS data – its granularity – is also its greatest weakness.
Sample sizes become quite small at the CBG level, so the margins of error are huge. The IRS tax
data I rely on does not have any margin of error since it is not derived from a sample.
Despite these major differences in data sources, the results are not that different. Mr.
Ahlstedt claims the weighted median household income in Foresthill’s territory is $68,201 and the
estimate in my Opening Testimony was $64,582. The statewide median household income varies
quite a bit between the two sources: Mr. Ahlstedt cites the statewide median household income as
$68,653 (presumably from 2010-2014), while the IRS data (from 2015) shows the average
statewide income per tax return as $84,058. Mr. Ahlstedt’s data shows Foresthill to be just
slightly below the statewide level, while my data shows a more substantial difference. Tax returns
and households are not quite the same thing, so I do not claim that my measures are accurate
measures of household income – but my data is consistent between the Foresthill zip codes and the
rest of the state and have no margin of error.
Regardless of which data is used, it is clear that Foresthill’s service area does not have
higher income than the state, on average. Foresthill proposes a residential rate higher than the
urban carriers, with the exception of AT&T, and much higher than the vast majority of rural study
areas nationwide. ORA provides no evidence to support setting an even higher residential rate.
14 ACS defines the margin of error as a 90% confidence interval. Data was obtained from https://factfinder.census.gov/faces/nav/jsf/pages/guided_search.xhtml, searching for household income for all CBGs in Placer County.

1
2
3
4
5
6
7
8
9
10
11
12
13
14
15
16
17
18
19
20
21
22
23
24
25
26
27
28
1223615.1 16
Q.20. Mr. Ahlstedt offers comparisons of the number of CBGs in San Francisco and
Los Angeles with lower median household income levels than the CBGs served by Foresthill.
Are those useful comparisons?
A.20. No, they are virtually meaningless. Population levels in the major urban areas are
much larger and both cities have significant low income areas. Mr. Ahlstedt’s Table 5 compares
CBGs and their population levels in San Francisco and Los Angeles with those in Foresthill’s
service area. I recomputed his data as percentages so that the non-comparable sizes of these areas
don’t cloud the comparisons. Table 2 presents these comparisons:
Table 2: Comparison of CBGs’ Populations in Foresthill, San Francisco, and Los Angeles by Percentages
Area % of CBGs with MHI<$10,313
% of Population in CBGs with MHI<$10,313
% of CBGs with MHI< $68,201
% of Population in CBGs with MHI<$68,201
Foresthill 20% 5.2% 60% 49.5%SF 0% 0% 34% 36.9%LA 0.1% 0.1% 63% 66%
Mr. Ahlstedt’s comparisons ignore the several orders of magnitude difference in sizes
between these areas, and provide no useful information. Even comparing percentages of
CBGs and population is not meaningful because the source of this data is from ACS and is
subject to large margins of error. Also, by definition, half of the households living in these
CBGs have income levels greater than the median, and we have no data on how many of
these households subscribe to any particular service offered by AT&T in those cities.
It should also be noted that income is not the only measure of economic hardship. The
Neighborhood Atlas (https://www.neighborhoodatlas.medicine.wisc.edu/) publishes an Area
Deprivation Index ("ADI") based on a measure created by the Health Resources & Services
Administration over twenty years ago. It has been adapted to rank neighborhoods at the CBG
level. I downloaded the CBG rankings at the state level for San Francisco, Los Angeles, and
Foresthill’s service area. Table 3 shows the mean and median ADI rankings (higher numbers
indicate more disadvantaged areas; rankings are for the decile within California). 15
15 For example, a ranking of 3 means a CBG is in the 30-40th percentile of California CBGs, ranking from the least to the most disadvantaged.

1
2
3
4
5
6
7
8
9
10
11
12
13
14
15
16
17
18
19
20
21
22
23
24
25
26
27
28
1223615.1 17
Table 3: Area Deprivation Index for SF, LA, and Foresthill
Area (County) Median ADI State Rank Mean ADI State Rank
SF 2 2.65
LA 5 5.16
Foresthill (Placer County) 6 6.8
Using a more robust measure of economic need than solely income suggests that
Foresthill’s territory may be more disadvantaged than either of the two urban areas Mr. Ahlstedt
has chosen for comparison.
More importantly, there is no evidence regarding how many of the people living in those
urban areas are purchasing basic residential service at the tariffed rates. Many are buying bundles
and many have “cut the cord” and rely on mobile services. In fact, it has been a policy of AT&T
to channel customers towards both bundles and mobile services. I provide substantial discussion
of these points in my Opening Testimony. ORA has offered no evidence regarding the behavior
of low income households in these urban areas, yet Mr. Ahlstedt concludes that “many of the
urban customers wishing to purchase basic residential land-line service must do so at AT&T’s
tariffed rate of $27.00…”16
Q.21. Mr. Ahlstedt recommends equal percentage increases for other Foresthill
services as for basic residential service – custom calling features and business rates. Is this
reasonable?
A.21. No, it is superficially simple, and ignores the differing economic conditions facing
these services. Optional services have more elastic demands, as they are both inessential and have
more substitutes available. For example, many products are available, which offer the array of
custom calling features as well as basic residential (or business) service over a broadband
connection.17 Raising these service prices is likely to entail greater customer attrition than raising
16 Ahlstedt Testimony, at page 12, lines 3-4. 17 For an example, see https://www.ooma.com/?utm_expid=.xOMc3IEyRzKFwkLiStLPZg.0&utm_referrer=https%3A%2F%2Fwww.google.com%2F.

1
2
3
4
5
6
7
8
9
10
11
12
13
14
15
16
17
18
19
20
21
22
23
24
25
26
27
28
1223615.1 18
basic residential service prices (and even the latter is becoming more elastic over time).
In fact, ORA has failed to consider any possible losses in subscribers due to its proposed
significant rate increases.18 In fact, ORA has implicitly assumed that the elasticity of demand for
wireline telephone service is zero. This is evident in the equal percentage increases in their
proposed rates as their estimated increases in basic local service revenues. Evidently, ORA
believes no customers will drop service as a result of these continued price increases.
However, this is not a tenable assumption. Raising rates by the magnitude proposed in
ORA’s testimony will clearly result in customer losses. Based on my review of the
literature on elasticity of demand, I anticipate customer losses from current access line
counts, if ORA’s proposal is implemented. The true elasticity is hard to measure with
exact certainty, but whatever the elasticity effect would be, there is no reasonable scenario
under which it will be 0%, which is ORA’s assumption.
Q.22. In fact, Mr. Ahlstedt recommends that the Commission not accept Foresthill’s
use of a price elasticity of demand from experience in Kerman Telephone Company’s service
area. Do you agree?
A.22. I have done no study to estimate the elasticity of demand for Foresthill’s services.
But Mr. Ahlstedt’s position – to use a zero elasticity of demand – is certainly not correct.
Q.23. What studies are available regarding elasticity of demand for
telecommunications services?
A.23. Most price elasticity studies for basic wireline telephone service were conducted 30
or more years ago. At that time, price elasticity estimates were very small – perhaps zero
according to some studies. But that predated the development of wireless services.19 Since that
time, academic interest in this subject has waned, but there are a few recent studies to draw upon.
For example, a recent study by K.W. Caves estimated demand impacts, and found that wireline
18 ORA acknowledges that it did not conduct any elasticity study. ORA's Responses to Foresthill's Data Request Set 4, Response to Question 20(a). Attachment DL-7. 19 Famously, AT&T asked McKinsey to estimate worldwide cellular phone use in the year 2000 and they concluded a total worldwide market demand of 900,000 – an underestimate by three and a half orders of magnitude! (see “Cutting the Cord,” The Economist, October 7, 1999), available at http://www.economist.com/node/246152.

1
2
3
4
5
6
7
8
9
10
11
12
13
14
15
16
17
18
19
20
21
22
23
24
25
26
27
28
1223615.1 19
telecommunications elasticities are in the range of -.544 to -.575.20 This means that a 10%
increase in price would be associated with approximately a 5.44% to 5.75% decrease in demand.
The same study found that:
the cross-price elasticity estimates here substantially exceed prior estimates from the existing literature, which has found only weak evidence of substitutability, particularly when substitution is defined in terms of access (as it is here). As noted above, the existing empirical literature has relied almost exclusively on older datasets compiled at the turn of the millennium, and has found evidence of complementarity, rather than substitutability.
While there is a paucity of recent economic research, the direction things have been
changing is clear:
The introduction of these alternative services has likely changed the elasticity of demand for traditional telephone service (while the demand for communication may still be inelastic, the demand faced by any one provider is likely more elastic and the elasticity of different forms of communications, e.g., voice calls, email, text, is likely higher than the overall elasticity).21
ORA’s assumption of zero price elasticity is simply not legitimate in today’s environment.
If the Commission were to consider ORA’s significant price increases beyond Foresthill’s
proposal, it should incorporate an elasticity factor into the revenue figures to be derived from the
resulting rate.
Q.24. Does your concern about ORA’s elasticity assumption also apply to ORA’s
proposed business rates?
A.24. Yes, the assumed zero elasticity of demand is not plausible for business demand
either. The relevant elasticity for ORA’s proposed increases in basic business rates would be the
elasticity of demand for fixed line business access provided by Foresthill. 22 There is no reason to
20 K.W. Caves, 2011, “Quantifying price-driven wireless substitution in telephony,” Telecommunications Policy, 35, 984-998, available at http://documents.tips/download/link/quantifying-price-driven-wireless-substitution-in-telephony. Another study (Hauge, et al. 2009, “Whose call is it? Targeting universal service programs to low-income households’ telecommunications preferences,” in Telecommunications Policy, Vol. 33, issue 3-4, pages 129-145) cites elasticities of demand for landline service as 2.5 for low income households and 1.63 for non-low income households, available at http://www.dwt.com/files/Uploads/Documents/Lifeline/0805_Hauge_Whose_Call_is.pdf. 21 G. L. Rosston, 2011, “The Relationship between Technological and Regulatory Change in the Communications Industry,” Stanford Institute for Economic Policy Research, Discussion Paper No. 11-020, available at http://siepr.stanford.edu/sites/default/files/publications/11-020_0.pdf. 22 Relatively few studies are available for fixed line business demand conducted within the past 20 years.

1
2
3
4
5
6
7
8
9
10
11
12
13
14
15
16
17
18
19
20
21
22
23
24
25
26
27
28
1223615.1 20
believe that the price elasticity of demand for business lines is zero, and the evidence from
Kerman suggests it is not.
Q.25. Mr. Ahlstedt rejects the price elasticity of demand estimates provided by
Foresthill, based on Kerman data, claiming that “the 14 months of data offered is too
narrow to make any determination at all.” Do you agree?
A.25. No, there is always a tradeoff between using more data (e.g., a longer time period)
and using data that, due to its age, is subject to additional factors other than a price change.
Foresthill based its elasticity of demand estimates on data from the price increases experienced
starting on August 1, 2016 by Kerman’s customers. The price elasticity of demand was estimated
comparing the trend in lines for the seven months prior to the price increase in its last rate case
with the demand for lines in the seven months after the price increase. The difference in the
decrease in lines from the pre-price increase period to the post-price increase period was the basis
for estimating a price elasticity of demand.
While these seven month periods are fairly short and longer periods would provide more
data, longer periods also introduce the possibility for other factors to be influencing demand (e.g.,
population growth or decline, economic conditions, etc.). In any event, ORA's assumption of a
zero price elasticity of demand is not tenable.
Q.26. What fees have you incurred in relation to your testimony in this proceeding?
A.26. I have spent 7.5 hours in connection with my opening testimony and 10 hours in
connection with my rebuttal testimony as of June 30, 2018. The invoice for my opening testimony
is included as Attachment DL-8 to this testimony, and Foresthill has paid this invoice. I have not
yet issued an invoice for my services in connection with the rebuttal testimony.
Q.27. Does this conclude your Rebuttal Testimony?
A.27. Yes.
There are major difficulties obtaining good price data for business demand modeling, as well as the fact that business and residential demands cannot easily be identified as mobile services become more prevalent than fixed line services. One study from Austria, finds “that business customers have a higher elasticity of demand than private customers,” based on mobile services. “Demand Elasticities for Mobile Telecommunications Services in Austria,” Ruhr Economic Paper No. 17, by Dewenter and Haucap, 2007.

Attachment DL-1

1
BEFORE THE PUBLIC UTILITIES COMMISSION
OF THE STATE OF CALIFORNIA
In the Matter of Application of Foresthill
Telephone Co. (U1009C) to Review
Intrastate Rates and Charges, Establish a
New Intrastate Revenue Requirement and
Rate Design, and Modify Selected Rates.
Application 17-10-004
OFFICE OF RATEPAYER ADVOCATES’ RESPONSES TO THE
JUNE 15, 2018 DATA REQUEST NO. 5 OF
FORESTHILL TELEPHONE COMPANY, INC. (U 1009 C)
KERRIANN SHEPPARD
Attorney for the
Office of Ratepayer Advocates
California Public Utilities Commission
505 Van Ness Avenue
San Francisco, CA 94102
Phone: (916) 327-6771
Fax: (415) 703-4432
WILLIAM MAGUIRE
Attorney for the
Office of Ratepayer Advocates
California Public Utilities Commission
505 Van Ness Avenue
San Francisco, CA 94102
Phone: (415) 703-2642
Fax: (415) 703-4432
July 3, 2018

5
DATA REQUEST NO. 7
Does ORA contend that AT&T's residential basic rates are "just and reasonable?" If the answer to
this question is anything other than an unequivocal "no," please identify all facts and provide all
documents and authorities that support this contention.
ORA OBJECTION: ORA objects to this question on the grounds that it is outside the scope of this
proceeding.

6
ORA RESPONSE:
Subject to and without waiving this objection, ORA responds as follows: ORA’s testimony utilizes
Commission-approved rates to determine the weighted average of basic residential rates that URF
companies are charging to assess the comparability of Foresthill’s proposed basic residential rates
comply with urban rates, in accordance with California Public Utilities Code 275.6(c)(3).

Attachment DL-2

1
BEFORE THE PUBLIC UTILITIES COMMISSION
OF THE STATE OF CALIFORNIA
In the Matter of Application of Foresthill
Telephone Co. (U1009C) to Review
Intrastate Rates and Charges, Establish a
New Intrastate Revenue Requirement and
Rate Design, and Modify Selected Rates.
Application 17-10-004
OFFICE OF RATEPAYER ADVOCATES’ RESPONSES TO THE
JUNE 15, 2018 DATA REQUEST NO. 6 OF
FORESTHILL TELEPHONE COMPANY, INC. (U 1009 C)
KERRIANN SHEPPARD
Attorney for the
Office of Ratepayer Advocates
California Public Utilities Commission
505 Van Ness Avenue
San Francisco, CA 94102
Phone: (916) 327-6771
Fax: (415) 703-4432
WILLIAM MAGUIRE
Attorney for the
Office of Ratepayer Advocates
California Public Utilities Commission
505 Van Ness Avenue
San Francisco, CA 94102
Phone: (415) 703-2642
Fax: (415) 703-4432
July 3, 2018

4
DATA REQUEST NO. 6
Do you contend that, under 47 C.F.R., Part 64, costs can be allocated to an entity that did not cause
the costs to be incurred? If the answer to this question is anything other than an unequivocal “no,”
please provide any authority, facts, or documents supporting your contention that costs may be
allocated to an entity that did not cause the costs to be incurred.

5
ORA OBJECTION: ORA objects to this question as calling for a legal conclusion, vague and
ambiguous as to the word “costs.”
ORA RESPONSE: Subject to and without waiving the above objections, ORA responds as follows:
ORA does not contend this.

Attachment DL-3

Page 1 September 2017
Universal Service Fund Loop Cost and Expense Adjustment Algorithms
Cost Company Loop Cost Algorithm for 1997 and Subsequent Years Line Formula Description 1. (DL255 * (DL710/DL700)) + DL820 Cable & Wire Facilities plus C&WF
portion of Capital Leases assigned to Category 1
2. DL250 + DL810 Central Office Equipment plus COE
portion of Capital leases assigned to Category 4.13
3. AL1/(DL255 + DL815) "A" Factor Cable & Wire Facilities.
C&WF Category 1 divided by Total C&WF
4. AL2/(DL230 + DL235 + DL240 + DL805) "B" Factor Central Office Equipment. COE
Category 4.13 divided by Total COE 5. AL1/DL160 "C" Factor Cable & Wire Facilities (Gross
Allocator) C&WF Category 1 divided by Total Plant in Service
6. AL2/DL160 "D" Factor Central Office Equipment
(Gross Allocator) COE Category 4.13 divided by Total Plant In Service
7. AL5 * DL170 Materials & Supplies assigned to Cable &
Wire Facilities Category 1 8. AL6 * DL170 Material & Supplies assigned to Central
Office Equipment Category 4.13 9. AL3 * ((DL280 + DL330) +
(DL815/DL800) * DL195) Accumulated Depreciation plus
Accumulated Amortization plus Net Noncurrent Deferred Operating Income Taxes assigned to C&WF Category 1
10. AL4 * ((DL260 + DL265 + DL270 + DL310 + DL315
+ DL320) + (DL805/DL800) * DL195) Accumulated Depreciation plus
Accumulated Amortization plus Net Noncurrent Deferred Operating Income Taxes assigned COE Category 4.13
11. [Reserved] 12. [Reserved] 13. AL3 * (DL430 - DL435 - DL440) Cable & Wire Facilities Maintenance
Expense assigned to Category 1

Page 2 September 2017
Universal Service Fund Loop Cost and Expense Adjustment Algorithms
Cost Company Loop Cost Algorithm for 1997 and Subsequent Years Line Formula Description 14. AL4 * (DL365 + DL380 + DL395 - DL370 - DL375 -
DL385 - DL390 - DL400 - DL405) Central Office Equipment Maintenance
Expense assigned to Category 4.13 15. (AL5 + AL6) * (DL335 + DL350 - DL340 - DL345 -
DL355 - DL360) Network Support Expenses plus General
Support Expenses assigned to C&WF Category 1 and COE Category 4.13
16 (AL5 + AL6) * (L450 - L455) Network Operations Expenses assigned to
C&WF Category 1 and COE Category 4.13 17. AL3 * (DL530 + ((DL815/DL800) * DL830)) Depreciation and Amortization Expense
assigned to C&WF Category 1 18. AL4 * ((DL510 + DL515 + DL520) +
((DL805/DL800) * DL830)) Depreciation and Amortization Expense
assigned to COE Category 4.13 19. (AL5 + AL6) * (DL535 + DL550)
(Adjusted for Corporate Operations Expense Limitation)
Corporate Operations Expense assigned to C&WF Category 1 and COE Category 4.13, limited in accordance with §54.1308(a)(4)
20. (AL5 + AL6) * DL650 Operating Taxes assigned to C&WF
Category 1 and COE Category 4.13 21. (AL5 + AL6) * (DL600 - DL540 - DL555) Benefits other that Corporate Operations
Expense assigned to C&WF Category 1 and COE Category 4.13
22. (AL5 + AL6) * DL610 Rents assigned to C&WF Category 1 and
COE Category 4.13 23. (AL1 + AL7 - AL9) * ROR Return Component for C&WF Category 1 24. (AL2 + AL8 - AL10) * ROR Return Component for COE Category 4.13 25a. AL17 + AL18 + AL23 + AL24
(Adjusted for Capex Benchmark Limits Jul 2012 – Mar 2013)
Total Capex Costs
25b. AL13 + AL14 + AL15 + AL16 + AL19 + AL20 + AL21 + AL22 (Adjusted for Opex Benchmark Limits Jul 2012 – Mar 2013, adjusted for Opex Limits effective Jan 2017)
Total Opex Costs

Page 3 September 2017
Universal Service Fund Loop Cost and Expense Adjustment Algorithms
Cost Company Loop Cost Algorithm for 1997 and Subsequent Years 25c. 26.
AL25a + AL25b (Adjusted for Capex Opex Benchmark Limits Apr 2013 – Jul 2014) AL25c/DL060
Total Unseparated Costs Study Area Cost per Loop (SACPL)

Universal Service Fund Loop Cost and Expense Adjustment Algorithms
Page 4 September 2017
Cost Company Loop Cost Algorithm for 1997 and Subsequent Years Rate of Return (algorithm lines 23 and 24): The FCC ordered that the rate of return (ROR) transition downward from .1125 to .0975. The transition is applied to HCL support as follows:
HCL Payment Year ROR (January – June) ROR (July – December) 2016 .1125 .1100
For HCL payment years 2017 through 2021 a blended ROR will be used for the entire payment year.
HCL Payment Year ROR (January –
December) Notes 2017 .10875 6 months of .1100, 6 months of .1075 2018 .10625 6 months of .1075, 6 months of .1050 2019 .10375 6 months of .1050, 6 months of .1025 2020 .10125 6 months of .1025, 6 months of .1000 2021 .09875 6 months of .1000, 6 months of .0975

Universal Service Fund Loop Cost and Expense Adjustment Algorithms
Page 5 September 2017
Cost Company Loop Cost Algorithm for 1997 and Subsequent Years
Corporate Operations Expense Limitation The Cost Company Loop Cost Algorithm at Line 19 limits Corporate Operation Expenses in accordance with §54.1308(a)(4). Step 1: Total Reported Corporate Operations Expense per loop per month is calculated by summing DL535
(Account 6710) and DL550 (Account 6720). This resulting amount is then divided by DL060 (Total Loops) and 12 (months) to yield a per line per month number.
Step 2: Total Allowed Corporate Operations Expense per loop per month is determined for specific working
line groupings as defined in the FCC Part 54.1308(a)(4) rules:
Effective for the period January 1, 2002 through December 31, 2011
Total Allowed Corporate Operations Expense per loop per month is adjusted annually to reflect the percentage change in Gross Domestic Product-Chained Price Index (GDPCPI).
For study areas with 6,000 or fewer USF Loops (DL070):
[$33.30853 – ($0.00246 x DL070)] x GDPCPI or [50,000 / DL070] x GDPCPI, whichever is or greater
For study areas with more than 6,000 but fewer than 18,006 USF Loops (DL070): [$3.83195 + (88,429.20 / DL070)] x GDPCPI
For study areas with 18,006 or more USF Loops (DL070):
$8.74472 x GDPCPI
Effective January 1, 2012
The GDPCPI factor for 2012 was re-indexed to 1 to reflect the use of a modified formula. Beginning January 1, 2013 the monthly per loop limit shall be adjusted annually to reflect the percentage change in GDPCPI.
For study areas with 6,000 or fewer Total Loops (DL060):
[$42.337 – ($0.00328 x DL060)] x GDPCPI or [63,000 / DL060] x GDPCPI, whichever is or greater
For study areas with more than 6,000 but fewer than 17,887 Total Loops (DL060): [$3.007 + (117,990 / DL060)] x GDPCPI
For study areas with 17,887 or more Total Loops (DL060):
$9.562 x GDPCPI Note: §54.1308(a)(4) uses the terms Working Loops and Total Working Loops, with Working Loops = USF
Loops (DL070) and with Total Working Loops = Total Loops (DL060).

Universal Service Fund Loop Cost and Expense Adjustment Algorithms
Page 6 September 2017
Cost Company Loop Cost Algorithm for 1997 and Subsequent Years The GDPCPI values currently in effect are as follows:
January 1, 2013 through December 31, 2013 (Applies to 2012-1, -2, -3, -4)
1.021324
January 1, 2014 through December 31, 2014 (Applies to 2013-1, -2, -3, -4)
1.039187
January 1, 2015 through December 31, 2015 (Applies to 2014-1, -2, -3, -4)
1.054650
January 1, 2016 through December 31, 2016 (Applies to 2015-1, -2, -3, -4)
1.071998
January 1, 2017 through December 31, 2017 (Applies to 2016-1, -2, -3, -4)
1.083433
January 1, 2018 through December 31, 2018 (Applies to 2017-1, -2, -3, -4)
1.097290
Step 3: Limitation Test – compare the Total Reported Corporate Operations Expense per loop per month to the Total Allowed Corporate Operations Expense per loop per month.
If the limitation is not exceeded, the Total Reported Corporate Operations Expense as reported for the study area is used in the cost per loop algorithm.
If the limitation is exceeded, the Total Allowed Corporate Operations Expense is calculated by
multiplying the Total Allowed Corporate Operations Expense per loop per month by DL060 (Total Loops) and 12 (months).
Limits on Capital and Operating Expenses For the period July 2012 – July 2014 there is a limitation on allowable Capital Expenses (Capex) and Operating Expenses (Opex). Algorithm Line 25 has been split into separate Capex and Opex amounts which are compared to benchmark limit values published by the FCC and the lesser of the calculated value and limit value is used in the calculation. The impact of the limits is phased in. For the period July – December 2012, support is reduced by 25% of the difference between support calculated using the study area’s reported data and the support as calculated using the Capex Opex limits (unless that reduction would exceed 10% of support). For the period January – March 2013 support is reduced by 50% of the difference between support calculated using the study area’s reported data and the support as calculated using the Capex Opex limits. For the period April 2013 – July 2014 the Capex and Opex limits is summed and compared to the sum of the reported capex and opex amounts, support is reduced by 50% of the difference between support calculated using the study area’s reported data and the support as calculated using the Capex Opex limit (unless that reduction would exceed 15% of the difference between support calculated using the study area’s reported data and the support as calculated using the Capex Opex limit). The FCC eliminated the use of benchmark limits on Capex and Opex effective August 2014. The FCC adopted new limits on Opex in the ROR order that are effective January 2017. For study areas subject to the

Universal Service Fund Loop Cost and Expense Adjustment Algorithms
Page 7 September 2017
Opex limit, a study area specific factor will be applied to reduce reported eligible operating expenses. HCL eligible operating expenses include all of the Opex amounts included in Algorithm Line 25B except for Algorithm Line 20 (operating taxes). Operating taxes are not currently subject to the Opex limit. The impact of the Opex limit is being phased in. During 2017 study areas subject to the Opex limit will have eligible operating expenses reduced by 50% of the difference between operating expenses reported and operating expenses as calculated using the Opex limits. Beginning in 2018 the full reduction in operating expenses will take place.
National Average Cost Per Loop Algorithm Cost Study Area USF Unseparated Costs =
Cost Study Area Total Unseparated Costs * (Study Area USF Loops/Study Area Total Loops) Nationwide USF Unseparated Costs =
Sum of Cost Study Area USF Unseparated Costs + Sum of Average Schedule Study Area USF Unseparated Costs
Nationwide Average Cost Per Loop (NACPL) = (Nationwide USF Unseparated Costs) / (Nationwide USF Loops)

Universal Service Fund Loop Cost and Expense Adjustment Algorithms
Expense Adjustment Algorithm
Page 8 September 2017
Study Areas Reporting 200,000 or Fewer Loops
SACPL less than or equal to 115% NACPL: 0
SACPL in excess of 115% NACPL, but not greater than 150% NACPL: o ( .65 * (SACPL – 115% of NACPL)) * USF Loops
SACPL in excess of 150% NACPL:
o ((.65 * (150% of NACPL – 115% of NACPL)) + (.75 * (SACPL – 150% of NACPL))) * USF Loops
Note: Beginning with the 2015-1 data collection, a frozen NACPL of $647.87 is used in the formula above and then the result is multiplied by a pro rata adjustment factor in order to ensure that the total fund does not exceed the authorized fund size for that year.

Attachment DL-4

1
BEFORE THE PUBLIC UTILITIES COMMISSION
OF THE STATE OF CALIFORNIA
In the Matter of Application of Foresthill
Telephone Co. (U1009C) to Review
Intrastate Rates and Charges, Establish a
New Intrastate Revenue Requirement and
Rate Design, and Modify Selected Rates.
Application 17-10-004
OFFICE OF RATEPAYER ADVOCATES’ RESPONSES TO THE
JUNE 15, 2018 DATA REQUEST NO. 6 OF
FORESTHILL TELEPHONE COMPANY, INC. (U 1009 C)
KERRIANN SHEPPARD
Attorney for the
Office of Ratepayer Advocates
California Public Utilities Commission
505 Van Ness Avenue
San Francisco, CA 94102
Phone: (916) 327-6771
Fax: (415) 703-4432
WILLIAM MAGUIRE
Attorney for the
Office of Ratepayer Advocates
California Public Utilities Commission
505 Van Ness Avenue
San Francisco, CA 94102
Phone: (415) 703-2642
Fax: (415) 703-4432
July 3, 2018

15
DATA REQUEST NO. 34
Please provide all supporting authorities that you believe support your contention on page 10 of Ms.
Roman's testimony that "[i]t is longstanding Commission practice to escalate labor expenses for
CHCF-A purposes using ORA's estimates of Labor and Non-Labor Inflation Factors from IHS
Global Insight U.S. Economic Outlook."
ORA OBJECTION: ORA objects to the extent this question calls for a legal conclusion, is overly
broad and unduly burdensome, and seeks publicly available information.
ORA RESPONSE:
Subject to and without waiving the above objections, ORA responds as follows: Please see
Resolution T-16720, page 6, footnote 4.

Attachment DL-5

1
BEFORE THE PUBLIC UTILITIES COMMISSION
OF THE STATE OF CALIFORNIA
In the Matter of Application of Foresthill
Telephone Co. (U1009C) to Review
Intrastate Rates and Charges, Establish a
New Intrastate Revenue Requirement and
Rate Design, and Modify Selected Rates.
Application 17-10-004
OFFICE OF RATEPAYER ADVOCATES’ RESPONSES TO THE
JUNE 15, 2018 DATA REQUEST NO. 5 OF
FORESTHILL TELEPHONE COMPANY, INC. (U 1009 C)
KERRIANN SHEPPARD
Attorney for the
Office of Ratepayer Advocates
California Public Utilities Commission
505 Van Ness Avenue
San Francisco, CA 94102
Phone: (916) 327-6771
Fax: (415) 703-4432
WILLIAM MAGUIRE
Attorney for the
Office of Ratepayer Advocates
California Public Utilities Commission
505 Van Ness Avenue
San Francisco, CA 94102
Phone: (415) 703-2642
Fax: (415) 703-4432
July 3, 2018

7
DATA REQUEST NO. 11
Provide the number of customers in California that subscribe to AT&T's bundled services that
include a voice component.
ORA RESPONSE:
To the best of its knowledge, ORA does not possess this information.

Attachment DL-6

1
BEFORE THE PUBLIC UTILITIES COMMISSION
OF THE STATE OF CALIFORNIA
In the Matter of Application of Foresthill
Telephone Co. (U1009C) to Review
Intrastate Rates and Charges, Establish a
New Intrastate Revenue Requirement and
Rate Design, and Modify Selected Rates.
Application 17-10-004
OFFICE OF RATEPAYER ADVOCATES’ RESPONSES TO THE
JUNE 15, 2018 DATA REQUEST NO. 5 OF
FORESTHILL TELEPHONE COMPANY, INC. (U 1009 C)
KERRIANN SHEPPARD
Attorney for the
Office of Ratepayer Advocates
California Public Utilities Commission
505 Van Ness Avenue
San Francisco, CA 94102
Phone: (916) 327-6771
Fax: (415) 703-4432
WILLIAM MAGUIRE
Attorney for the
Office of Ratepayer Advocates
California Public Utilities Commission
505 Van Ness Avenue
San Francisco, CA 94102
Phone: (415) 703-2642
Fax: (415) 703-4432
July 3, 2018

5
DATA REQUEST NO. 6
Please provide all information in ORA's possession that reflects either the number or percentage of
AT&T customers who subscribe to standalone, regulated, basic residential service.
ORA RESPONSE:
To the best of its knowledge, ORA does not have this information.

Attachment DL-7

1
BEFORE THE PUBLIC UTILITIES COMMISSION
OF THE STATE OF CALIFORNIA
In the Matter of Application of Foresthill
Telephone Co. (U1009C) to Review
Intrastate Rates and Charges, Establish a
New Intrastate Revenue Requirement and
Rate Design, and Modify Selected Rates.
Application 17-10-004
OFFICE OF RATEPAYER ADVOCATES’ RESPONSES TO THE
June 13, 2018 DATA REQUEST NO. 4 OF
FORESTHILL TELEPHONE COMPANY, INC. (U 1009 C)
KERRIANN SHEPPARD
Attorney for the
Office of Ratepayer Advocates
California Public Utilities Commission
505 Van Ness Avenue
San Francisco, CA 94102
Phone: (916) 327-6771
Fax: (415) 703-4432
WILLIAM MAGUIRE
Attorney for the
Office of Ratepayer Advocates
California Public Utilities Commission
505 Van Ness Avenue
San Francisco, CA 94102
Phone: (415) 703-2642
Fax: (415) 703-4432
June 27, 2018

10
DATA REQUEST NO. 20
On page 23 of Mr. Ahlstedt’s testimony, he recommends that the Commission reject Foresthill's
elasticity study in connection with its proposed rates. With reference to this statement, please
address the following:
a. Did ORA prepare a price elasticity study in connection with its proposed rates?
b. Does ORA contend that basic telephone service and vertical services have the same
elasticity?
c. Please admit that as prices increase for vertical services, demand for those services
will decrease.
d. If you do not admit the statement Data Request 20(c), please provide an explanation.
e. Please admit that demand for the vertical services listed in Table 9 of Mr. Ahlstedt’ s
testimony is more elastic than basic telephone service.
f. If you do not admit the statement Data Request 20(e), please provide an explanation.

11
ORA RESPONSE:
a. ORA did not prepare its own elasticity study in connection with its proposed rates. ORA did
analyze Foresthill’s proposed elasticity study, which was based on data from Foresthill’s
affiliate, Kerman Telephone Company.
b. ORA makes no such contention. See the response to Data Request question 20(a), above.
c. ORA is unsure whether Data Request question 20(c) is in reference to Foresthill’s vertical
services, Kerman’s vertical services, or both. With regards to Foresthill, ORA was unable to
determine the validity of this statement for the reasons stated on Pages 23-27 of the Testimony of
James Ahlstedt.
d. See ORA’s response to Data Request question 20(c), above.
e. ORA was unable to determine the validity of this statement for the reasons stated on Pages 23-27
of the Testimony of James Ahlstedt. Please see ORA’s responses to Data Request questions
20(a)-(d), above.
f. See ORA’s response to Data Request question 20(e), above.

Attachment DL-8