2 12 14 22 - PwC · But for a planner, engineer or ... works best through an examination ... HSR...
32
gridlines Inside Sorting through the HSR decision factors Under the Alps by fast rail Golden anniversary doesn’t slow Japan’s silver bullet Tracking HSR in the US and Russia 2 12 14 22 Why high-speed rail?
Transcript of 2 12 14 22 - PwC · But for a planner, engineer or ... works best through an examination ... HSR...

gridlinesInside Sorting through the
HSR decision factors Under the Alps by fast rail
Golden anniversary doesn’t slow Japan’s silver bullet
Tracking HSR in the US and Russia
2 12 14 22
Why high-speed rail?

Cover photo—An ICE train arrives in Cologne, Germany Photo above—The first .italo train, scheduled to begin HSR service in 2012 for the Italian operator NTV, leaves the La Rochelle plant in France where it was produced.
www.pwc.com
© 2011 PwC. All rights reserved. PwC refers to the PwC network and/or one or more of its member firms, each of which is a separate legal entity. Please see www.pwc.com/structure for further details. This content is for general information purposes only, and should not be used as a substitute for consultation with professional advisors.
Gridlines is PwC’s magazine devoted to infrastructure. Stories focus on four areas: emerging trends and technologies driving infrastructure transformation, ways to manage risks and seize opportunities, tactics that can help with day-to-day challenges, and inter-views with experts at the heart of thought and action. Gridlines combines PwC’s analysis and insight with reporting on critical developments and directions.

Seizing the opportunities in high-speed rail demands rigorous thinking on a range of issues
High-speed rail can mean many things, depending on context. For a traveler, HSR typically delivers com-fort, speed, punctuality, safety and reliability just to begin—especially when journeying between central city business districts at a time of increasing airline delays. For those who remember pictures of the first Shinkansen whizzing past Mount Fuji in 1964 or the TGV streaming from Paris to Lyon in the early 1980s, these images revolutionized the popular view of rail travel.
Today, HSR remains a powerful symbol of a nation’s commitment to infrastructure. But for a planner, engineer or government official charged with considering it, HSR presents a complex decision-making process, especially at a time when fiscal constraints demand prudent prioritization.
HSR can play an important role in a nation’s transportation network, depending on a range of demo-graphic, geographic, social and economic factors. Determining when it is the right solution is as much an art as a science, requiring a view that balances local prefer-ences with big-picture economic and engineering practicalities. Mak-ing that judgment goes to the heart of properly deploying HSR today.
This issue of Gridlines investigates why and when high-speed rail
works best through an examination of the overarching considerations. We also look at several examples of HSR around the world.
‘Why high-speed rail’ provides an overview of the social and eco-nomic realities of where and when HSR works, why it does and when it may not. A range of complex, inter-related issues is involved in sorting out when it is the right choice for a region or nation. The decision requires careful balancing of all the factors ranging from the distance covered to the preferences of the population and the tangible and intangible costs and benefits that are expected.
‘Under the Alps by fast rail’ takes a look at one railway line that is being planned to address a num-ber of strategic objectives: To take pressure off the heavy truck traffic between France and Italy which transfer 85% of their freight by truck; to complete a strategic piece of the European HSR network; and to reduce accidents and traffic densities on Alpine passes. When the link is completed, its 53-kilome-ter tunnel under the Alps also will represent a significant piece of engi-neering even for the 21st century.
‘Shinkansen speeds ahead’ updates the history of Japan’s groundbreaking high-speed rail line on the eve of its 50th anniversary. The Shinkansen still is making
dramatic technical advances today in areas like magnetic levitation and safety, carrying more passengers than the world’s biggest airline, making a healthy profit on its busiest lines, and posting safety and punctuality records even in a nation prone to earthquakes. The Japanese system remains a textbook example of a nation using HSR in the right way and in the right places. Histori-cally, the Shinkansen also offers a lesson in the personal vision and commitment required to bring transformative infrastructure ideas from the drawing board to reality.
‘Continental divides’ compares the challenges and plans of the United States and Russia in dealing with HSR. For large nations like these two (and China) with cities very far apart, a HSR network may be a regional or inter-regional link unlike the transcontinental railway lines these countries built in the 19th century.
I hope you enjoy this edition of Gridlines focusing on high-speed rail. Please contact me to discuss any of the issues raised here.
Yours truly,
outlook | winter 2011
Richard Abadie
Global capital projects and infrastructure leader.

2 | Gridlines | PwC
It has been almost 50 years since the first high-speed rail (HSR) train captured the global imagination as it zipped past Mount Fuji 10 days before the opening of the 1964 Tokyo Olympics. Today, HSR’s speed, punctuality, and, above all, safety have not only achieved celebrated status among travelers throughout the world, but have fundamentally transformed passenger transport in several countries.
At the same time, the social and economic benefits and costs of HSR continue to be debated worldwide: When and where does HSR work best; how does it fit in among a nation’s infrastructure priorities; what are the envi-ronmental, political, and cost considerations? These questions are being resolved against the backdrop of advancing technology, changing demographics in a rapidly urbanizing world, and funding challenges at all levels. Ultimately, the answers are as complex as the questions. And they depend on finding the balance that fits local conditions and the distinct factors at work in each case.
Definition helps to set the stage. According to the 1996 European Union (EU) directive that has now become the global template,1 HSR is composed of: a) specifically built (or dedicated) lines capable of speeds equal to or greater than 250 kilometers per hour (kph); b) upgraded lines capable of speeds of about 200 kph; and c) upgraded lines with HSR features because of topographical, relief, or zoning constraints, on which speed is adapted to each case.
Given this definition, every country that builds HSR initially faces an obvious, and prudential, dilemma: whether to build new and dedicated infrastructure or make significant improve-ments, at less expense, of existing lines that will nevertheless provide enhanced passenger ser-vice. The latter option does not preclude HSR, however. In most cases, the choice is deter-mined by the particular characteristics of each country’s rail infrastructure, and the immediate needs and travel habits of passengers.
France, for example, constructed completely dedicated TGV (Train à Grande Vitesse) lines, connected to the existing network, while
1 Annex I, Council Directive 96/48/EC of 23 July 1996 on the interop-erability of the trans-European high-speed rail system, at http://eur-lex.europa.eu/LexUriServ/LexUriServ.do?uri=CELEX:31996L0048:EN:HTML. Europe is now so identified with high-speed rail that the very definition of it in most of the world, from the US Congress to the International Union of Railways, has been adapted from this directive. See David Randall Peterman, John Frittelli, and William J. Mallett, High Speed Rail (HSR) in the United States, Congressional Research Service (CRS), December 8, 2009, p. 1, and, more relevantly, UIC (International Union of Railways), “General definitions of highspeed,” at http://www.uic.org/spip.php?article971.
2 In addition to different needs, it was also hampered by legal chal-lenges for about 20 years. See Peterman et al., HSR in the United States, p. 11.
3 “20 years of high speed in Germany,” UIC, http://www.uic.org/com/article/20-years-of-high-speed-in-germany?page=thickbox_enews .
4 Interoperability was enshrined in Directive 96/48/EC. Several subsequent EU directives, including 2004/50/EC of 29 April 2004 and 2008/57/EC of 17 June 2008, have amended or elaborated upon Directive 96/48/EC.
High-speed rail: why, when and how the signals line up
Infrastructure In transforMatIon
By Julian Smith
Germany followed a strategy of upgrading existing lines to create its ICE (Intercity-Express) network.2 As of last year, ICE carried 60% of German rail passengers, or 78 million people.3 While its multi-hub system differs substantially from France’s network, which con-nects distant city-pairs with few stops and has Paris as its central hub, both systems—in fact, Europe’s HSR network in general—rely on what has become a key EU-wide principle of high-speed rail: interoperability.4

cultu
ral n
orm
s
dedica
ted tr
ack
conv
enien
ce
fund
ing
soun
d bar
riers
spee
d
infra
struc
ture
tilting
train
wider
eco
nom
ic ben
efits
punct
uality
urban
rege
nera
tion
cost
com
fort
co-m
odali
ty
mult
imod
al
relia
bility
safe
ty
demog
raphic
s
priorit
ies ec
onom
ics
CO 2 e
miss
ions
inter
-regio
nal
inter
oper
abilit
y
tech
nolog
y
sust
ainab
ility
urban
izatio
n
ballas
t mat
sTE
N-T
cent
ral b
usine
ss d
istric
t/CBD
com
petitiv
enes
s
privat
e se
ctor
regio
nal
AV/AC
envir
onm
enta
l impac
t
secu
rity
agglo
mer
ation
popula
tion
densit
y
stan
dard g
auge
distan
ce
vision
elect
rifica
tion
politic
al will
inter
mod
ality
balanc
e
ener
gy e
fficie
ncy
mag
lev
A complex network of issues

4 | Gridlines | PwC
Interoperability simply means that techni-cal specifications for HSR are harmonized on an EU-wide basis so that HSR can cross national boundaries. Since both France and Germany have made their HSR systems integrated and interoperable with their previously existing rail networks,5 this has resulted in the effective integration of German and French railway net-works at the heart of a growing, Europe-wide HSR network. Most of France’s network consists of newly built, dedicated HSR lines with HSR trains also running on conventional lines to serve smaller destinations (e.g., on the French Riviera), whereas German HSR service includes
a high proportion of upgraded conventional lines also used by other traffic. This illustrates the point that HSR is not a discrete concept from rail in general; indeed, “high speed” trains are sometimes scheduled to run slowly where infrastructure so dictates, while maintaining their high standard of passenger comfort and service.
“Two hours & 59 civilized minutes” remains a classic of American advertising in the 1980s. The advertisement pictured a businessperson whizzing along between New York and Washington, DC, in total comfort
5 By contrast, Spanish HSR is separate from the main conventional network, mainly because it was built to the European gauge, rather than the wider Spanish gauge. In Italy, voltage (now 25 kv 50 Hz a.c.) was adopted on the new HSR in order to harmonize it with the French HSR network, and because it was considered more appropri-ate for HSR operations. This, however, does not mean that Italian HSR trains circulate only on HSR lines, since dual-voltage rolling stock has been purchased to ensure national interoperability. See also Javier Campos, Ginés de Rus, and Ignacio Barrón, “A Review of HSR Experiences Around the World,” in Economic Analysis of High Speed Rail in Europe, edited by Ginés de Rus, BBVA Foundation, May 2009.
(see http://www.amtrak40th.com/amtraks-history/1980s). But the obvious connection was to planes: a leather seat and a glass of wine showed that trains could now be as “civilized” as planes and could get their passengers to their destinations just as fast—if not faster.
The Eurostar in Brussels Midi/Zuid station

PwC | Gridlines | 5
uncivilized—to many people when compared with a CBD-CBD high-speed train.
Consequently, air travel between Paris and Lyon now makes up only 7% of the travel market, as opposed to the TGV, which takes 72% (with cars and buses making up the other 21%).7 The Eurostar between Paris and London took three-quarters of air-rail passengers in 2009.8 By the second year of its operation, the AVE (Alta Velocidad Española) between Madrid and Barcelona had captured 89% of the air- rail market.9 Even in Japan, where airlines competed vigorously against the original HSR between Tokyo and Osaka (adding flights and slashing fares), the Shinkansen carried 85% of the corridor’s air-rail traffic in 2007.10
There is clearly a “sweet spot” for HSR of 400 to 800 kilometers between city pairs that
There is clearly a “sweet spot” for HSR somewhere between 400 to 800 kilometers that makes it overwhelmingly the preferred mode of travel over both air and road.
In fact, those two hours and 59 minutes reflect a market reality. According to an Australian government report, three hours is “the turning point for high-speed competitiveness.”6
Thirty years after Amtrak’s advertisement, HSR throughout the world offers more than “civilized” travel. It promises an atmosphere of unmatched civility. Since September 11, 2001, air trans-port has necessarily become less relaxed and comfortable, at least regarding the essential aspects of access. Long security lines add to what has always been air travel’s disadvantage: airports are at the margins of cities while train stations are in central business districts (CBDs). A drive to an airport, followed by hours in line before boarding a short-haul flight, and then another drive into the CBD after reaching one’s destination, seems positively irrational—even
makes it overwhelmingly the preferred mode of travel over both air and road. Of course, as HSR has become faster over the years, the outward limits of that range increase.11 Still, most specialists believe that a journey above 900 kilometers makes air travel the more viable option.12
It is not simply speed that makes HSR so attractive to travelers, however. It is also punc-tuality—and not only a steadfast reliability of schedule, but on-time arrival that verges on perfection.
Between 1964, when it began operations, and 2007, Japan’s Shinkansen carried more than six billion passengers: its on-time record for all trains during those years was a truly staggering 99%.13 In Spain, the AVE offers a money-back guarantee should a train arrive more than
6 The report goes on to clarify: “That is, as train journey time between two cities falls below 3 hours, rail mode share rapidly increases. Conversely, as train journey time exceeds 3 hours, the rail competitiveness quickly declines.” See A profile of high-speed rail-ways, Internal Brief, Department of Infrastructure, Transport, Regional Development and Local Government, Bureau of Infrastructure, Transport and Regional Economics, p. 9, at http://www.bitre.gov.au/publications/77/Files/A_profile_of_high-speed_railways.pdf.
7 The figures of Javier Campos and Philippe Gagnepain, “Measuring the Intermodal Effects of High Speed Rail,” Economic Analysis, May 2009, p. 75, vary slightly: 6%, 70%, and 21%, respectively (with another 3% for conventional rail). The percentages above come from Interactions between High-Speed Rail and Air Passenger Transport, the COST 318 final report to the European Commission’s Directorate-General for transport, prepared by the intergovernmental framework for European Cooperation in Science and Technology in 1998. The oft-cited Table 9 is on p. 78.
8 See Andrew Cave, “Eurostar feeding on hunger for travel,” The Telegraph, April 12, 2009.
9 Victoria Burnett, “Spain’s High-Speed Rail Offers Guideposts for U.S.,” The New York Times, May 29, 2009.
10 The market share comes from Peterman et al., HSR in the United States, pp. 6-7, citing Prospects for High Speed Rail in the U.S., presentation prepared by Mercer Management Consulting before the House Committee on Transportation and Infrastructure, March 20, 2007. See Reinhard Clever and Mark Hansen, “Interaction of Air and High-Speed Rail in Japan,” Transportation Research Record: Journal of the Transportation Research Board, No. 2043, Transportation Research Board of the National Academies, 2008, p. 5, regarding the competition from airlines. Shinkansen, by the way, does not mean “bullet train,” but, more prosaically, “new trunk line.”
11 But there are diminishing returns. For a variety of reasons— including aerodynamic (track curves), environmental (limited speeds through urban areas), and physical (decreasing energy efficiency at higher velocities)—the fact is that 300-350 kph is, for all intents and purposes, the maximum speed for HSR. See Ryo Takagi, “High-speed Railways: The Last 10 Years” (“40 Years of High-speed
Railways”), Japan Railway & Transport Review, 40 (March 2005), p. 5: “…[P]roportionally smaller speed increases no longer cut journey times by more than a minute or two so the impact on attractiveness to passengers…[is] too small to justify the additional costs.”
12 See High-speed Europe: A sustainable link between citizens, Directorate-General for Mobility and Transport, European Com-mission, 2010, p. 9. The assessment of HSR’s optimal efficiency in regard to air travel is an inexact science. See, for example, Peterman et al., HSR in the United States, p. 23; Ginés de Rus, “The Economic Effects of High Speed Rail Investment,” Discussion Paper 2008-16 revised October 2008, Joint Transport Research Centre, OECD, pp. 7, 12, and 17; Campos and Gagnepain, “Measuring Intermodal Effects,” p. 74; and Yong Sang Lee, “A Study of the Development and Issues Concerning High Speed Rail (HSR),” Working Paper No. 1020, Transport Studies Unit, Oxford University Centre for the Environment, January 2007, p. 7.
13 Yong Sang Lee, “A Study of the Development and Issues Concerning High Speed Rail (HSR),” Introduction.

6 | Gridlines | PwC
five minutes late—to date, 0.3% of passengers have received refunds. Its schedule, too, is 99% on time—and on the Madrid-Seville line, 99.5%.14 Even the Eurostar between Paris and London, a HSR line that got off to a bad start (because of antiquated track on the British side of the Channel),15 quickly came up to speed, improving its performance from 79% to 90% long before the British part of the high-speed corridor was opened.16 Of course, Eurostar gives itself an unusually generous margin for HSR scheduling: the airlines’ definition of “on time,” or 15 minutes within scheduled arrival. But even within this generous characterization of punctuality, Eurostar’s competitors can only claim on-time arrival for 70% of flights.17
HSR’s competition with airlines has benefited the consumer. To quote researchers Reinhard Clever and Mark Hansen, “If air and rail com-pete vigorously in a particular market and rail has an excellent reliability, air service will have to match approximately that performance or its shorter line-haul time advantage will become completely meaningless.”18
Furthermore, to paraphrase the US Postal Service, neither snow nor sleet nor gloom of volcano ash can stay a HSR line from the swift
completion of its appointed journey. While a host of weather events can severely disrupt both air and road transport, HSR often contin-ues operating. The whole world witnessed last year’s eruption of the Eyjafjallajökull volcano that paralyzed much of European air travel. While a large area of the continent’s airspace was shut down, rail transport throughout Europe was mobilized into extraordinary action to mitigate the enormous disruption. Eurostar alone carried 50,000 extra passengers on its two routes between London, Paris, and Brussels—serving people from as far away as Greece.19
Safety is, finally, the most profound aspect of any transport mode’s “reliability”—and here HSR’s record is even more astonishing than its punctuality. Until July’s accident in China, the only accident-related fatalities ever recorded on a high-speed train were on a German derail-ment that occurred between Hannover and Hamburg in 1998. Neither Japan nor France has ever incurred fatalities in their long histories with HSR.
But the most contentious issue concern-ing HSR is economic. In the words of Spanish economist Ginés de Rus, a very trenchant
14 For refunded fares, see Tony Dutzik and Jordan Schneider, Phineas Baxandall, and Erin Steva, A Track Record of Success: High-Speed Rail Around the World and Its Promise for America, U.S. PIRG Education Fund, fall 2010, p. 25; for overall punctuality, see “AVE Madrid,” The Economist, February 5, 2009; for the Madrid-Seville line, see Air and Rail Competition and Complementarity, final report prepared for the European Commission by Steer Davies Gleave, August 2006, p. 24.
15 A profile of high-speed railways, p. 9.
16 Dutzik et al., Track Record of Success, p. 25; Air and Rail Compe-tition, p. 23, gives Eurostar 89% on-time performance. According to Eurostar itself, its on-time success rate was 93.8% in 2009; see the press release, “Rail travel you can rely on,” at http://www.eurostar.com/UK/uk/leisure/business/punctuality.jsp.
Safety is the most profound aspect of any transport mode’s reliability—and here HSR’s record is even more astonishing than its punctuality.
analyst of HSR, “Deciding to reject (or delay)…a high-speed rail line is not necessarily a position against progress.”20 The net economic costs of HSR’s social benefits, he argues, have to be weighed against the net costs and benefits of other investment:
“High speed rail infrastructure is not good or bad in global terms. There are socially profitable projects, and others which are not. Economists can help to identify those projects that are socially worthy and whose benefits justify the sacrifice of leaving other social needs unattended.”21
Of course, the reality is that HSR is as viable as any other transport option, given all the costs—social, economic, and environmental—but that is not always clear to a public that must ulti-mately pay for a high-speed line’s construction. In addition, while we know relatively precisely what the total costs are for HSR, that is often not the case for competing modes of transport.22 One example illustrates the problem.
Travel by car is much more expensive in France than in the US, both absolutely and relatively. Gas, for example, is $2.19/liter in France, but only $1.04 in the US.23 France also has high tolls.24 Thus, a journey today from, say, Paris to
17 Dutzik et al., Track Record of Success, p. 25.
18 Clever and Hansen, “Interaction of Air,” p. 9.
19 The April 14 event was actually the second eruption. The first, much less powerful, eruption was on March 20. For a representative report on the interruption of European air service, see Jad Mouawad and Nicola Clark, “Airlines Press Europe to Ease Ban on Flights,” The New York Times, April 18, 2010. For Eurostar, see the box “High-Speed Rail as a Backup for Air Travel,” in Dutzik et al., Track Record of Success, p. 10.
20 Economic analysis, “Introduction,” p. 17. The introduction is unsigned but since de Rus is the volume’s editor, it is assumed he wrote it.
21 Economic analysis, “Conclusions,” p. 17. Again, the conclusions are unsigned but it is assumed de Rus wrote them.
22 As the CRS rightly points out, “The user fees/taxes that support those other [non-HSR transport] modes may not cover their so-called externality costs (that is, costs that those modes impose on other people, such as environmental pollution and deaths and injuries due to crashes).” Peterman et al., HSR in the United States, p. 14.
23 Gas prices are taken from the table, “Average end-use prices” (US dollars), in End-use petroleum product prices and average crude oil import costs, May 2011, International Energy Agency, p. 3, at http://www.iea.org/stats/surveys/mps.pdf.
24 Tolls are so ubiquitous on French motorways that a ratebook (in both French and English) is available on the Website (http://www.autoroutes.fr/index.htm) of ASFA (Association des Sociétés Fran-çaises d’Autoroutes et d’Ouvrages à Péage), the official highways trade group.

Bordeaux, a distance of 589 kilometers, costs just about $75.50, while one from New York to Chicago costs $31.50 for 1,274 kilometers—less than half the cost for more than twice the distance.25 Clearly, France and the US price the cost of driving, and roads, in radically different ways.26
The Federal Highway Act of 1956 specifically banned tolls from the new interstate high-way system (a massive public works project), for example. Only preexisting toll roads incorporated into the proposal (such as the Pennsylvania and Massachusetts turnpikes or the New York Thruway) were allowed to continue collecting fees. But those roads made
On profitability, certain facts are irrefutable: the two pioneering HSR lines, Japan’s Tōkaidō Shinkansen and France’s TGV Sud-Est, recouped their costs decades ago and have been continually, and extremely, profitable ever since.
25 Michelin provides a cost calculator at its Website, http://www.viamichelin.com, that includes tolls for France but not for the US. US tolls were calculated by adding $15.00 for the Ohio Turnpike, $9.00 for the Indiana Toll Road, and $3.50 for the Chicago Skyway. From Chicago to New York, there would be an additional $12.00 toll at the George Washington Bridge. The value of the euro was calculated on the basis of the exchange rate of $1.45 on July 1, 2011.
26 The other long-standing issue, which recently made news (again), is of US emissions and fuel efficiency. The New York Times calls them “the world’s most lenient.” New US policy to increase mile-age standards to “roughly double the current level” would simply “put domestic vehicle fuel efficiency on a par with that in Europe, China and Japan. …” See John M. Broder, “Obama Seeking a Steep Increase in Auto Mileage,” The New York Times, July 4, 2011. France has a “bonus-malus” tax incentive program that encourages purchases of smaller and more fuel-efficient cars. See the Website of the French embassy in the UK, at http://www.ambafrance-uk.org/Bonus-Malus-France-encourages.html.
27 For the history of the interstate highway system, see the Federal Highway Administration’s Website. The total length of the system is at http://www.fhwa.dot.gov/interstate/faq.htm#question3; the information on toll roads is at http://www.fhwa.dot.gov/infrastructure/tollroad.cfm. It may not be coincidental that the German autobahn that informed President Eisenhower’s vision of the interstate highway is also toll free for passenger cars.
28 The urban population of the US is probably larger, as the figures for total population (311,677,000) come from the US Census Bureau population clock as of July 2, 2011 (at http://www.census.gov), while the figure of 165,073,706 living in cities of at least one million residents in 2009 comes from Demographia US Metropolitan Area Population & Migration: 2000-2009, March 2010 (at http://www.demographia.com/db-metmic2004.pdf).
29 Edward Glaeser, Triumph of the Cities, New York, The Penguin Press, 2011, p. 176.
up a total of just 2,102 miles—or about 4.5%—of a system that stretches 46,786 miles across the US today.27
“Hidden” costs, therefore, actually apply as much, if not more, to other transport modes as they do to HSR. For suburban and exurban Americans, the interstate highway system is the gift that keeps on giving, but for the 53% of Americans in the country’s largest cities, questions arose long ago about the system’s efficacy.28 As Harvard economist and urban theorist Edward Glaeser recently pointed out, while interstate highway spending was not designed as anti-urban, it “certainly hurt cities.”29
At the Guillemins TGV Station in Liège, Belgium.

8 | Gridlines | PwC
Meanwhile, the full economic rationale for short-haul flights—that is, costing out the price of environmental damage and time lost to congestion, both on the ground and in the air—is rarely made. In the US, for example, the country’s single densest air corridor of less than 500 miles, between Los Angeles and San Francisco, still lacks HSR even with annual air traffic of more than 6.3 million passengers in 2009. Current technology would allow 11 trains per day to travel the 400 miles between the two cities in 110-120-minutes, CBD to CBD, in lieu of flying several hundred planes weekly as is now done. In a case like this, it makes sense to at least question whether this complete dependence on flying (and driving) is the wisest, most economically efficient30 allocation of infrastructure (and other) resources.
As for profitability, certain facts are irrefutable: the two pioneering HSR lines, Japan’s Tōkaidō Shinkansen and France’s TGV Sud-Est, recouped
their costs decades ago and have been continu-ally profitable ever since.31 According to their respective companies, Japanese, French, and Spanish HSR networks are all profitable as a whole, with more profitable lines making up for less profitable ones.32
The best case for HSR is made by its many successes. After almost half a century of expan-sion on two continents, examples abound of HSR lines that have drastically changed the economic and demographic landscape of the areas they serve. A remarkable example of high-speed rail leading to an entirely unan-ticipated labor (and cultural) migration is the phenomenon described by The Economist as “Paris-on-Thames,” the creation, within just 20 years, of a vibrant French community in London, “Gallicizing” everything from the City to Arsenal, the British capital’s oldest and most popular football club, led for the last 15 years by Frenchman Arsène Wenger, the longest-serving
30 Peterman et al., HSR in the United States, “Table 5: Densest Air Travel City Pairs Within About 500 Miles Distance,” p. 24. The CRS report uses 2007 figures, with daily passenger traffic of 13,838. The 6.3 million figure comes from the March 2009 (annualized) data in Adie Tomer and Robert Puentes, Expect Delays: An Analysis of Air Travel Trends in the United States, Metropolitan Infrastructure Initiative Series, Metropolitan Policy Program, Brookings Institution, October 2009, Appendix 3: Top 100 corridors, p. 28.
31 Again, while it is difficult to get specific numbers and general agreement by every analyst, there seems to be a consensus that the Tōkaidō line amortized all its costs within a decade and the TGV within 12 years. Terry Gourvish, The High Speed Rail Revolution:
Workers building a high-speed train at a Siemens plant in Krefeld, Germany.
manager in “Gunners” history and the one who’s brought the club its greatest successes.33
Across the Channel, the decision to make Lille the hub of the TGV network that goes on to Brussels, Amsterdam, and London has changed the economic life of the city. In just over a decade, Euralille, the massive develop-ment planned by Rem Koolhaas, is now the third largest business district in France. It is also a good example of a high-speed rail project regenerating a former industrial powerhouse (once known as the Manchester of France) that had subsequently been affected by the decline familiar to so many other post-industrial cities in the developed world.
Separately, Euralille also illustrates the impor-tance of political will in HSR projects—and likely all infrastructure initiatives with similarly ambitious social and economic goals. In this case, the fact that the man behind the
History and Prospects, HS2 Ltd, March 11, 2010, p. 25, and Dutzik et al., Track Record of Success, p. 33, agree on the TGV, while Gourvish writes that the Tōkaidō line was “an instant financial success,” and that, after three years of operation, its “revenue stream was greater than its costs, including interest on debt and depreciation.” Regard-ing the Tōkaidō line, Peterman et al., HSR in the United States, p. 2, states that, “From its inception, it earned enough revenue to cover its operating costs and reportedly earned enough money within its first few years to pay back its construction costs.”
32 For Spain and France, see Dutzik et al., Track Record of Success, p. 34. As Japan’s HSR lines are all run by private companies, it is fair to say that profitability is a basic concern and goal.
33 See “Paris-on-Thames,” The Economist, February 24, 2011. The exact numbers are in dispute. According to The Economist, the French consulate “estimates that up to 400,000 of London’s 7.6m people” are French. A more recent article in The Telegraph of London (Alex Spillius, “Why the French have sought refuge in London,” Octo-ber 18, 2011) states that the “French embassy estimates that there are 200,000 to 300,000” French living in the UK as a whole, but “with the majority in the South-East.” The New York Times cites 190,000 (“French making themselves at home in London,” February 5, 2008). What is beyond discussion is that tens of thousands of French men and women have moved to London.

PwC | Gridlines | 9
Rail travel grows throughout Europe despite modern alternatives
(in millions of passengers)
French data to 2000 are based on Table 20 in Yong Sang Lee, “A Study of the Development and Issues Concerning High Speed Rail (HSR),” Working Paper No. 1020, Transport Studies Unit, Oxford University Centre for the Environment, January 2007; 2010 figures come from the International Union of Railways (UIC), table titled 2010—full year, at http://www.uic.org/spip.php?article1348. German data to 2000 (West Germany from 1950 onward) come from the Oxford study as well, while 2010 figures for all of Germany are from Deutsche Bahn, Mobility Logistics, Facts & Figures 2010, p. 5. Percentages of HSR travel for France and Germany come from EU energy and transport in figures: Statistical pocketbook 2010, European Commission, p. 124. Italian data come from three sources: for 1885-1900, Andrea Curami and Paolo Ferrari, I trasporti del regno: iniziativa privata e intervento statale in Italia, 1861-1946, Fondazione Negri, 2007; for 1910-1980, Valter Guadagno, Cento anni di storia ferroviaria: i dirigenti, l’Azienda, il Paese (1905-2005), Assidifer Federmanager, 2005; and for 1990-2009, National Transport Accounts, Ministry of Transport, Italy. For Spain, the data come from Albert Carreras de Odriozola and Xavier Tafunell Sambola, Estadísticas históricas de España: Siglos XIX-XX, Fundación BBVA, 2005, and the statistical yearbooks of the Spanish Ministry of Public Works. Between 1930 and 1942, there are only data for 1935. In addition, from 1871-1959, the figures are only for broad-gauge rail (vía ancha); beginning in 1960, they include narrow-gauge rail (vía estrecha). The numbers added to the totals from narrow-gauge rail vary from 137 million in 1960 to 189 million in 2007. Finally, all numbers for all countries are rounded off.
Ultimately, determining when HSR is the right transportation solution depends on finding the balance that fits local conditions and the distinct factors at work in each case.
After peaking in the first 30 years of the last century—when railroads offered the only practical choice for most people and war and upheaval uprooted millions—rail travel in Germany and France has climbed back to or beyond 1930 levels. In Italy, despite a light dip during the sixties, rail travel last year was about double that at the end of the Second World War. In Spain, it increased over five-fold during that time.
Many reasons may explain why this has occurred. Although most Europeans today own cars and can also take advantage of inexpensive air travel, the European Union’s development of an effective network intermodality has made rail travel easy. In 2008, among total passengers, HSR represented almost 62% of France’s rail traffic and over 28% in Germany, according to the EU.
2010200019901980197019601950194019301920191019001890188018701840
Germany
In 1991 Germany’s HSR starts
France
In 1981 France’s HSR starts
Italy
In 2006 Italy’s HSR starts
340
856
1,541
2,979
1,9002,049
1,472 1,399
1,024 1,107 1,043 1,088
1,716
60
430 492 500
790
347545 570 607
686 834 861
51 59 95 113 126 223349 381 343 381
586
41
1,950
11 1526 32 49 98 117
478
108 107 246 314 279
423573
577
Spain
In 1992 Spain’s HSR starts
Excludes East Germany
10 | Gridlines | PwC
Europe’s high-speed network as of December 2010
v >_ 250 km/h
v >_ 250 km/h planned
180 < 250 km/h
Possible (not part of the TEN-T)
Other lines
enterprise was Pierre Mauroy, Lille’s mayor—but also, much more important, French prime minister under François Mitterand—was critical. Margaret Thatcher’s decision to join Mitterand in building the Channel Tunnel was also decisive for the long-term viability of the Euralille project.34
Although rail growth was surprisingly strong in many European countries even before it, HSR has helped to accelerate long-term growth in rail travel despite the increase in car ownership. The table on the previous page registers rail passenger volumes in four countries over the last two centuries.
What is truly impressive is that in 1990—within a decade of the TGV’s introduction—there were more people riding trains (of all kinds) in France than there had been in 1930, when the country was much poorer and had no other mass transport to speak of. And while the popu-lation was smaller in 1930 than it is today, of course, the French also have many more travel options today than they had eight decades ago. Even more remarkably, Germany—with untolled autobahnen and automobile manufac-turers of global renown—has only 10% fewer rail passengers in 2000 than it did in 1930. In Italy, rail travel has about doubled since the end of the Second World War, while it has quintupled in Spain during the same time.
In the end, choosing HSR requires careful study, balancing needs, expectations, and, above all, competing claims on public expenditures. Travelers around the world have embraced it. While it is obviously not a panacea for all transport problems, HSR is efficient, fast, singularly safe, and can be the least environmentally harmful form of long-distance transport.35 It can also be a significant driver to regional economic development.
Finally, after almost 50 years, it is clear that HSR networks are not simply valuable elements of national transport systems. The European Union has proved that they can increasingly be developed as integral links of ever more extensive transnational systems.
About the author
Julian Smith, PwC’s rail and transport infrastructure leader, is based in Moscow. ([email protected]; +7 495 967 6462)
The best case for HSR is made by its many successes. After almost half a century of expansion on two continents, examples abound of HSR lines that have drastically changed the economic and demographic landscape of the areas they serve.
Source: High speed around the world: Maps, High Speed Depart-ment, International Union of Railways, December 15, 2010, p. 9, at http://www.uic.org/IMG/pdf/20101219_d_high_speed_lines_in_the_world_maps.pdf and, for the Russian Federation, Russian Railways, at http://www.eng.hsrail.ru/abouthsr/HSRNetworkinRF.
34 See High-speed Europe, p. 10, and Martin K. Meade, “Euralille: the instant city,” The Architectural Review, December 1994. For Mauroy, see Jan Jacob Trip, What makes a city? Planning for “quality of place”: The case of high-speed train station area development, Sustainable Urban Areas 12, Delft Centre for Sustainable Urban Areas, Delft University Press, 2007, Chapter 6, “Euralille,” pp. 87-99. For Thatcher, see her Speech at ratification of Channel Tunnel Treaty, July 29, 1987, Margaret Thatcher Foundation, at http://www.marga-retthatcher.org/document/106564.
35 The issue of environmental benefit is complex. Suffice it to say that fully dedicated HSR is run on an electrical grid, so a large part of its contribution to environmental sustainability is dependent on the source of a nation’s electricity. Having said that, when it comes to emissions (both CO2 and particulate matter), HSR has the same astounding record as in punctuality and safety: it’s simply on another level entirely from its competitors. See Dutzik et al., Track Record of Success, Figures 6 and 7 (pp. 21 and 22).

PwC | Gridlines | 11
Dublin
Bristol
GlasgowEdinburgh
London
Paris
Luxembourg
Lyon
Barcelona
MadridPorto
CoruñaVitoria
ValladolidVigo
Lisbon
Malaga
Seville
Valencia
Alicante
Marseilles
Nice
Rome
Naples
Budapest
Nuremberg
Zurich Munich
Poznan
KatowicePrague
Krakow
WarsawBerlin
Hannover
Frankfurt
BelgradeBucharest
Kiev
MoscowVladimir Kazan
EkaterinburgNizhny Novgorod
Copenhagen
Hamburg
Oslo
Stockholm
Tampere
TurkuSt. PetersburgHelsinki
Istanbul
AnkaraSivas
KayseriKonya
Izmir
Bursa
Athens
Bologna
Milan
Torino
Nantes
Toulouse
Bordeaux
Amsterdam
Brussels
Zaragoza
Cologne
Göteberg
Europe’s evolving high-speed network

12 | Gridlines | PwC
Under the Alps by fast rail
While France’s TGV has rightly been heralded as a pioneer in HSR, Italy’s long history in HSR technology is less known. (The initial leg of the ferrovia direttissima between Rome and Florence that opened in 1977, for example, was the first dedicated HSR line in Europe.1) Partnering to link 21st-century Lyon and Turin, and thereby to increase overall capacity between France and Italy (not only in passengers but in freight), is, therefore, a natural project for the two countries, for which PwC carried out the evaluation of the socioeconomic impact and assessment of access charges.
From an engineering standpoint, the most complex part of the project involves digging a new 53-kilometer tunnel well below the historic 14-kilometer Fréjus Rail Tunnel that is currently used to cross the Mont Cenis Pass on the Franco-
Italian border. Just as the original Fréjus tunnel, opened 140 years ago, inaugurated the era of the great trans-Alpine rail tunnels, it is hoped that this “new line,” as it is called, will be part of a twenty-first-century HSR era2 that will not only improve transport for individuals and com-merce, but significantly improve conditions in the increasingly vulnerable Alpine environment.
In addition to environmental amelioration and protection, the project’s other major goal is enhancing the safety of future users, both commercial and private, of all Alpine crossings. From 1999 to 2005, several deadly accidents, all involving trucks, killed 64 people and injured many more in the Alpine road tunnels. While much more robust safety measures have been put in place in the intervening years, it is inevitable that, as traffic continues to increase
Existing line: Mountain profile Maximum grade: 33%
New line: Flat profile Maximum grade: 12.5%
Lyon
Mont Cenis
on these routes, future accidents will occur. And while no mode of travel is accident-free, HSR in Europe has proved to be profoundly less danger-ous to life and limb than automobile travel.
The project is now scheduled for completion in 2030 at a cost of €19 billion. Because of the ongoing financial crisis, details of each country’s contributions have not been finalized, but there will be substantial financing from the European Union, as the line is part of the TEN-T program’s priority project 6, stretch-ing west to east from Lisbon to Ukraine. The line will also connect with the preexisting north-south axis from London to Naples.
Today, 85% of all freight traffic between France and Italy is hauled by truck. The intention is to bring that down to a 51-49 truck/rail split
By Paolo Guglielminetti

PwC | Gridlines | 13
Turin
51%
Distribution of freight rail/road
Development on the corridor Mont Blanc
2030 without the Lyon-Turin link 2030 with the Lyon-Turin link
80%20%
49%
by 2030, which would ultimately mean taking 700,000 trucks, and 40 million tons of freight, off the road and onto rails. That would immedi-ately decrease toxic emissions by 700,000 tons annually and, eventually, 2.5 million tons a year. This shift to “rolling highways” on rail will also increase safety for everyone on the Alpine roads, including the truckers.
But this impressive public project is not the only major investment in Italian HSR. The most intriguing development might very well be in the private sector, where a recently formed company, Nuovo Trasporto Viaggiatori, is ready to launch its “.italo” HSR service between Turin and Salerno (with stops in Naples, Rome, Florence, Bologna, and Milan), and between Venice and Rome (with stops in Florence, Bologna, and Padua). The trains’ brilliant color is not fire engine red: it is Ferrari red, as the venture’s chairman is Ferrari’s Luca Cordero di Montezemolo, with major backing from another prominent Italian business leader, Diego Della Valle, CEO of Tod’s.
1 See High-speed Europe: A sustainable link between citizens, Directorate-General for Mobility and Transport, European Commis-sion, 2010. The line was finally completed in 1992 (Utah Foundation, “High-Speed Rail Around the World: A Survey and Comparison of Existing Systems,” Report Number 694, August 2010, p. 9). Italy’s preeminence in HSR goes back almost nine decades. Mussolini not only “made the trains run on time,” as the notorious phrase has it, but made them run much faster as well. He inaugurated the first direttissimi between Rome and Naples (1927) and Bologna and Florence (1934). Moreover, a test run of the Italian ETR (Elettro Treno Rapido) 200 broke the world speed record in 1939 at 203 kph (Hugo Tobar Vega, The World Seaborne Trade and Transport: Facts and Challenges, ESPOL Polytechnic University, Department of Maritime Engineering and Sciences, August 2010, at http://www.dspace.espol.edu.ec/bitstream/123456789/11617/2/1.%20THE%20WORLD%20SEABORNE%20TRADE%20TRANSPORTa.ppt).
2 All the information and data in this article are taken from the Web-site of LTF (Lyon Turin Ferroviaire), the company created to build the line, at http://www.ltf-sas.com. See, especially, “The Alpine tunnels: Today and tomorrow”; “Important stakes: Economy”; and “Lyon-Turin: unavoidable: Freight: from road to rail.”
The question that immediately occurs regard-ing this enterprise is obvious: If so many critics of HSR argue that it is unprofitable, why would such experienced businessmen enter the market?
About the author
Paolo Guglielminetti is rail transport director in PwC’s Rome office. ([email protected], +39 06 570832008)
Tunnel source: Lyon Turin Ferroviaire, at http://www.ltf-sas.com/pages/articles.php?art_id=239.
Trucks and trains source: Lyon Turin Ferroviaire, at http://www.ltf-sas.com/pages/articles.php?art_id=258.
14 | Gridlines | PwC

PwC | Gridlines | 15
It was not an accident of history that a station in Japan saw the scheduled departure of the first high-speed passenger train on October 1, 1964. For a variety of reasons—historical, geographic, and demographic—it was a foreseeable event. It was also the result of the visionary commitment of a few individuals.
As Japan’s Shinkansen (or “new trunk line”) approaches its 50th anniversary in 2014, its achievements continue and they speak for themselves. The Tōkaidō line alone—which was declared a Historic Mechanical Engineering Landmark in 2000 by the American Society of Mechanical Engineers—carries 386,000 passen-gers on 336 trains daily, for an annual total of 138 million passengers. According to Bloom-berg, that puts it 38 million ahead of the world’s largest airline, United Continental Holdings, in passenger load.1
Meanwhile, JR East, which owns the Tōhoku and Jōetsu lines, is the largest passenger rail company in the world. Its high-speed and conventional trains carry about 17 million passengers daily, which translates into 6.2 billion passengers annually. That is almost six times France’s passenger rail traffic and well over 200 times that of the US.
Economically, cities with Shinkansen stations have experienced greater increases in business attraction, population, municipal revenues, and labor savings than those without. Trains now travel at top speeds of 300 kph and over 500 kph is on the drawing board for maglev (magnetic levitation) trains that will connect Tokyo and Nagoya.
But the most impressive recent demon-stration of the Shinkansen’s technology came in what Japan’s then-prime minister, Naoto Kan, called “the toughest and the most difficult crisis” Japan has faced since the end of the Second World War, the March 11 Tōhoku earthquake.2 JR East had 27 HSR trains—including one capable of 275 kph—speeding down its tracks when the 9.0 temblor struck. There were no derailments (except for a stationary train at Sendai) and, most incredibly, no injuries. The Urgent Earthquake Detection and Alarm System, introduced on the Shinkansen in 1992, worked
1 For the Tokaido line’s landmark status, see ASME’s Website, at http://www.asme.org/about-asme/history/landmarks: It is #211. For its daily passenger totals, see JR Central’s 2011 annual report, p. 16; for its total passenger numbers, see Chris Cooper, “Rail’s Cash-Flow King Stakes $62 Billion on Tokyo Maglev Train,” Bloomberg News, February 8, 2011.
2 “Anxiety in Japan grows as death toll steadily climbs,” March 14, 2011, CNN, at http://edition.cnn.com/2011/WORLD/asiapcf/03/13/japan.quake/index.html?iref=NS1.
By Yumiko Noda and Satoshi Takesada
On the bullet train in Tokyo.
Shinkansen speeds ahead … nearly 50 years after the silver bullet transformed transportation infrastructure

16 | Gridlines | PwC
flawlessly to pick up seismic P-waves released before the main shock, and signaled them to the trains, which activated the emergency brake within three seconds after detecting the waves. In one case, a train running near the quake’s epicenter, between Sendai and Furukawa, braked 70 seconds before the main shock.3
The birth of Shinkansen is a story of the vision and commitment needed to make a transforma-tive infrastructure project work. Along with others throughout the world, Japan first tried to develop a “bullet train” (dangan ressha) in the 1930s.4 By the 1950s, however, the passenger needs of Japan’s main railway, the Tōkaidō5 line between Tokyo and Osaka, could not be ignored: postwar economic growth demanded rail expan-sion, especially as trains were the predominant form of transport for most people. Rail modern-ization also required electrification, but only 8% of Japanese National Railways (JNR) was elec-trified in 1950.6 The ensuing electrification of the major lines set the stage for transformation.
Japan’s main rail artery, the Tōkaidō line—with only 3% of total track but 24% of passengers and 23% of freight—was the first to be electrified, in 1956. As projections,
however, showed passenger traffic doubling within 20 years (or sooner), engineers who had once worked on “super-express” train projects considered them again. Moreover, with 38% of the country’s population residing in the two metropolitan areas of Tokyo and Osaka (42% today), the expansion—or, in this case, the absolute reinvention—of the Tōkaidō line was urgent. And the pressure was greater because it was clear even as this massive project was being planned that Japan had already embarked upon that extraordinary growth that was to constitute its famous postwar “economic miracle.”
Ironically, however, the country was concerned at the time (as were other countries) with “railway downfall theory”—the notion that rail-roads were generally a transport mode that was doomed to irrelevance and limited utility in the new world of automobiles and airplanes.7 This seemed to be especially true as the economy began to boom in Japan, people earned more, and Japanese automobile manufacture was gradually, but effectively, ramping up.8 In the words of the Shinkansen’s designer, Hideo Shima: “At that time, air and car traffic were showing remarkable growth. I thought that building a line that would soon fall behind the
3 For JR East’s trains on the day of the earthquake, see Daisuke Yamamoto, “Shinkansen quake survivability key selling point,” The Japan Times, June 16, 2011. For the Urgent Earthquake Detection and Alarm System, see the report in the quarterly Web magazine Nipponia, 33: June 15, 2005, at http://web-japan.org/nipponia/nip-ponia33/en/feature/feature10.html.
4 See Christopher P. Hood, “The Shinkansen’s Local Impact,” Social Science Japan Journal, 13:2, Winter 2010, and Roderick A. Smith, “The Japanese Shinkansen: Catalyst for the renaissance of rail,” Journal of Transport History, 24/2 (September 2003). “Bullet” was a popular metaphor throughout the world for the fastest trains at the time. In the US, the Brill “Bullets,” the aluminum interurban railcars introduced in 1931—and the first railcars tested in wind tunnels—were still running in 1990. See Debra D. Brill, History of the J.G. Brill Company, Railroads Past and Present series, Indiana University Press, 2001.
5 The railroad line was named after the East Sea Road (Tokaido), the most important of the Five Routes (major roads) during the Edo period (the Tokugawa shogunate of 1603-1868); see Jilly Traganou, “The Tokaido—Scenes from Edo to Meiji eras” (“Impact of Railways on Japanese Society & Culture”), Japan Railway & Transport Review, 13 (September 1997).
6 See Yasuo Wakuda, “Railway Modernization and Shinkansen” (“Japan Railway History 10”), Japan Railway & Transport Review, 11 (April 1997), p. 60. JNR was organized in 1949; in addition to Smith, “Japanese Shinkansen,” p. 225, see Ryohei Kakumoto, “Sensible Policies and Transport Theories?—Japan’s National Railways in the 20th Century” (“Railway Lessons and Challenges”), Japan Railway & Transport Review, 22 (December 1999).
7 The term “railway downfall theory” is most associated with Roderick Smith, who in addition to being professor of railway engineering at Imperial College London and chairman of its Future Rail Research Centre, is deputy president of the UK’s Institution of Mechanical Engineers.
8 The actual production numbers were miniscule, at least compared with the US and even Europe. Nonetheless, in the decade from 1950 to 1960, production multiplied fifteenfold (from 32,000 to 482,000 cars) and was to multiply almost eleven times again in the decade to 1970, this time to an impressive figure of 5.289 million units—and this only six years after the first Shinkansen began operations. See John W. Wright, general editor, The New York Times Almanac 2002, Penguin Books, 2001, p. 410. Toyota actually shipped its first car to the US in 1957, followed a year later by Nissan; see the Websites of the two companies.
The Shinkansen N700 with top speeds of 300 kph goes into service at Shinagawa station, Tokyo.

PwC | Gridlines | 17
The most impressive recent demonstration of the Shinkansen’s technology came in the Tōhoku earthquake. JR East had 27 HSR trains speeding down its tracks when the 9.0 temblor struck. There were no derailments and no injuries.
advancing transport world would be regrettable for the future of JNR and in meeting social expectations.”9
What happened next proves the importance of having key individuals dedicated to making grand infrastructure projects succeed—in this case, Shima and JNR President Shinji Sogo. Beyond legendary “master builders” such as Baron Haussmann in 19th-century France or Robert Moses in 20th-century America, what is often needed is a master facilitator willing to expend personal and often political capital to ensure a project’s realization. Margaret Thatcher, former Prime Minister in the UK, played that role with the Channel Tunnel that led to the Eurostar, as did Spanish prime minister Felipe González with his country’s Alta Velocidad Española. In the case of the Shinkansen, that task fell to the man described as “Old Man Thunder.”10
Sogo had gone directly to work for the govern-ment railway agency upon graduating from university in 1909 and was appointed head of JNR in 1955. Having spent his entire career in railroads, he understood the limitations of the Japanese system and what was needed to over-come them. Specifically, the fact that Japanese railways remained narrow gauge limited both their haulage capacity and speed. The decision to abandon narrow gauge, however, entailed greater expenditures, as one would not be upgrading preexisting track but starting anew;
9 See Hideo Shima, “Birth of the Shinkansen—A Memoir” (“30 Years of High Speed Railways”), Japan Railway & Transport Review, 3 (October 1994), p. 46.
10 See Bill Hosokawa, Old Man Thunder: Father Of The Bullet Train, Sogo Way, 1997.
11 Shima, “Birth of the Shinkansen,” p. 46.
12 Ibid.
13 Ibid., p. 45.
even worse, should something go wrong, or should work simply be delayed, a partially completed line was as worthless as none at all. For those reasons, “narrow gauge opinion was dominant.”11
This critical argument anticipated a cen-tral question that continues to revolve around HSR; namely, is it better to upgrade incremen-tally or construct a state-of-the-art system that allows for maximal technical efficiencies and passenger capacity from the moment of opera-tion? Sogo was unyielding. He not only believed that standard gauge was critical to the success of the new line but that it was the only way Japan would not fall further behind Western rail technologies.12 Shima has written that he “was moved” by Sogo’s “zeal”13 in deciding to rejoin JNR as chief engineer at Sogo’s invitation, hav-ing left the company earlier.
Two details stand out in the story of Sogo, Shima, and the birth of the Shinkansen. The first goes to the heart of the debate about HSR: its cost. The budget for building the new, dedicated, high-speed line was calculated at ¥200 billion, or about $556 million at the exchange rate at

18 | Gridlines | PwC
First line
Second line
Sections under construction
Future lines likely to be built
‘Mini-Shinkansen’ lines (where speeds are lower due to the line not meeting full Shinkansen standards)
The Shinkansen network
The Shinkansen today
Line Length (kilometers)
Tokaido 553
Sanyo 622
Tohoku 714
Joetsu 340
Hokuriku 222
Kyushu 257
Source: Adapted from Christopher P. Hood, “Bullets and Trains: Exporting Japan’s Shinkansen to China and Taiwan,” at http://www.japanfocus.net/-Christopher_P_-Hood/2367.
Hokkaido Shinkansen(only part of the route approved)
Akita Shinkansen
Tohoku Shinkansen
Tokaido Shinkansen
Chuo Shinkansen
Sanyo Shinkansen
Kyushu Shinkansen
Nagasaki Shinkansen(only part of the route approved)
Yamagata Shinkansen
Joetsu Shinkansen
Hokuriku (Nagano) Shinkansen
Hokuriku Shinkansen Extension
Final Hokuriku Shinkansen Extension(no route or construction timetable set)

PwC | Gridlines | 19
the time—an enormous amount of money for a country that had only recently moved beyond postwar reconstruction.14 The project proceeded because, in addition to a government loan and bonds, JNR applied to the World Bank for a loan. The company secured $80 million only because engineer Shima, who’d been dispatched to Washington to negotiate the transaction, convinced bank authorities that no “experi-mental” technologies—which were explicitly precluded from bank funding—were involved. Rather, Shima maintained, the project simply “integrated” JNR’s “proven advanced technolo-gies…under the slogan ‘Safety First’ ”—which was truer than anybody could possibly have imagined at the time.15
When the Tōkaidō Shinkansen was launched 10 days before the opening of the Tokyo Olympics, however, the cost had almost doubled to ¥380 billion. As both Sogo and Shima had already resigned, taking responsibility for the overruns, neither one attended the formal opening.
This is obviously a cautionary tale—but one that also illustrates the risk-taking, passion, and will that is often needed for success in transformative infrastructure projects. And it tells us that proponents of infrastructural transformation often had to overcome skepticism, in every country.
A map of Japan quickly explains the country’s pioneering efforts in HSR. Railroads are “developed to match the nature and cultural climate of a nation,” Hiroshi Okada, former head of Japan Railway Technical Service, wrote 30 years after the Shinkansen’s creation.16 Japan has a population of 126.5 million people in a comparatively small area of 378,000 square kilometers17 dominated by steep mountains. Most large cities and industrial areas are on the coastal plain. With a ratio of habitable land to total area of only 20%, population density on that habitable land is high, with populations for Tokyo, Osaka, and Nagoya of 36.7 million, 17 million, and 10 million, respectively.18
14 Until 1971, when the postwar Bretton Woods currency peg collapsed, the official exchange rate was ¥360 to the dollar. In today’s exchange rate of about ¥80 to the dollar, the equivalent amount would have been $2.5 billion. The Japanese government approved the plan in December 1958; see Smith, “Japanese Shinkansen,” p. 227.
15 The World Bank loan was repaid in 1982; see Smith, Ibid.
16 Hiroshi Okada, “Features and Economic and Social Effects of the Shinkansen” (“30 Years of High-Speed Railways”), Japan Railway & Transport Review, 3 (October 1994), p. 9.
17 CIA, The World Factbook, at https://www.cia.gov/library/publications/the-world-factbook/geos/ja.html.
18 Okada, “Economic and Social Effects,” p. 9, and, for city popula-tions, Demographia World Urban Areas (World Agglomerations), seventh edition, April 2011, Table 1, at http://www.demographia.com/db-worldua.pdf.
19 See Reinhard Clever and Mark M. Hansen, “Interaction of Air and High-Speed Rail in Japan,” Transportation Research Record: Journal of the Transportation Research Board, No. 2043, Transportation Research Board of the National Academies, 2008, p. 11. Also, Okada presents a table that shows Japan with over nine times the popula-tion density of France per square habitable kilometer, almost six times that of England, over four times that of Germany, and 30 times that of the US. See “Economic and Social Effects,” Table 1, p. 9.
20 Okada, “Economic and Social Effects,” p. 12.
21 Ibid., p. 9, for the rainfall comparisons and pp. 12-13 for the consequences on banking.
22 Mamoru Taniguchi, “High Speed Rail in Japan: A Review and Evaluation of the Shinkansen Train,” Working Paper UCTC (The University of California Transportation Center) No. 103, April 1992, p. 17, wrote almost 20 years ago that “the Japanese land price is the highest in the world.”
23 Okada, “Economic and Social Effects,” p. 13.
24 Ibid., p. 11.
Shinkansen has transported tens of billions of passengers over the last 47 years, without a single fatality in one of the most geologically vulnerable nations in the world, and with delays over a 10-year period that average only 41 seconds.
In fact, two-thirds of the country’s residents, roughly 100 million people, reside in an extremely dense band of urban settlement that begins in Tokyo and proceeds southwest along the coast of Honshu (the main island) to Fukuoka, on Kyushu.19
Geography answers another question often posed about Japanese HSR: Why is it so costly? The answer can be distilled to two words, geology and demography.
Because of its mountainous terrain, Japan’s HSR requires an inordinate amount of tunneling: tunnels constituted an incredible 30.8% of the total length of the first four Shinkansen built.20
Moreover, and tragically, as the entire world saw last March, Japan’s seismic activity precludes standard, much cheaper, banking methods for track, as does the country’s high annual rainfall. (Tokyo has almost double London’s rainfall and more than double that of Paris or Berlin.) Conse-quently, Japan’s HSR lines are built on elevated track, which costs about four times the price of banking.21 And the well-known cost of site acquisition in a country with about 42% of the US population in a landmass the size of Califor-nia only adds to the outlays.22
Precisely because so many people are concen-trated in an extensive urban agglomeration that takes up a good part of the country as a whole, the Shinkansen is forced to speed past one urban area after another, thus requiring exceptional noise-abatement measures, from sound barriers to ballast mats.23 As Okada characteristically comments, “When you ride a Shinkansen for the first time, you are surprised by the rows of houses continuing without a break except at tunnel sections.”24 It is these “rows of houses” and the nation’s population density that lead to a final factor that distinguishes the Shinkansen from HSR in the rest of the world: short station-
20 | Gridlines | PwC
to-station distances so that as many people can be accommodated on the lines as possible. More stations mean more costs for a transit system.25
The Tōkaidō line was the first step in what is now truly the most complete HSR network in the world in terms of national coverage. An impres-sive grid of six Shinkansen covers the entire island of Honshu from north to south, crosses over into Kyushu in the south, and will connect with Sapporo on Hokkaido island in the north.26 (Shikoku, the smallest and least populated of the four major Japanese islands, is the only one without Shinkansen service.) There are also two “mini-Shinkansen” that do not run at HSR speeds but extend the Tōhoku line to communi-ties not served by it.27
The government privatized the system in 1987 after the debt that had built up after three decades of continuous HSR construction reached ¥37.1 trillion, or some 10% of GNP. About 30% of the debt was assumed by the newly privatized companies, while the other 70% was transferred to a government agency, which recouped more than a third by selling surplus JNR land. Ultimately, however, JNR’s outstanding debts passed into the government’s balance sheet.
JNR itself was broken up into six independent passenger lines, according to geography, and a freight line that together composed the new JR (Japan Railways) Group. The group’s most important components are JR Central, which owns the Tōkaidō Shinkansen, the world’s most profitable high-speed passenger service, and JR East, which, in addition to its two major lines, owns the two mini-Shinkansen.28 The other major entity is JR West, which runs the Sanyō line. All three companies are now fully private, while the three smallest companies, which operate on the three islands around Honshu, remain government-owned.29
Privatization allowed HSR to return to passen-ger growth and technical innovation. In the first year after privatization, ridership was up 3.2%, the first increase since the mid-1970s.30 More significantly, cities with new Shinkansen stations registered some noteworthy changes.
Cities with Shinkansen stations saw an average increase of population of about 32% between 1975 and 1995 compared with a national average of about 12% and a 7% increase in cities near the Tōhoku line with no Shinkansen station. In addition, between 1975 and 1991, cities with
a Shinkansen station saw an increase of about 46% in the number of companies locating in them, compared with a national rise of about 21% and about 17% for cities near the Tōhoku line without Shinkansen service. Most signifi-cantly, cities with a Shinkansen station saw an increase of about 155% in their receipts between 1980 and 1993, compared with a national aver-age of about 110% and 75% for cities near the Tōhoku line without the service.31
These are compelling numbers, confirming how critical a Shinkansen station in a city is to a municipality’s development and prosperity.
25 Ibid., p. 13.
26 A map on p. 3 of a presentation by the Thai-French Technical Association shows that the vast majority of the country’s residents are within an hour of HSR service. See http://www.tfta.or.th/PDF/High%20Speed%20Rail%20in%20Japan_%20Kobayashi.pdf.
27 They are the Yamagata and Akita lines; see Terry Gourvish, The High Speed Rail Revolution: History and Prospects, HS2 Ltd, March 11, 2010, p. 9.
28 For a relatively recent report on JR Central’s profitability as a whole, see Cooper, “Rail’s Cash-Flow King.” For JR East, see its 2011 Annual Report, Creative Reconstruction.
29 These three are JRs Kyushu, Hokkaido, and Shikoku; Smith, “Japanese Shinkansen,” p. 229.
30 See the “Railroads and Subways” section (Chapter 4) of the Library of Congress’s Japan country study at http://memory.loc.gov/frd/cs/jptoc.html.
31 See Christopher P. Hood, “Shinkansen’s Local Impact,” p. 215.
Cities with a Shinkansen station saw an increase of about 155% in their municipal receipts between 1980 and 1993, compared with a national average of about 110% and 75%, respectively, for cities near the Tōhoku line without the service.
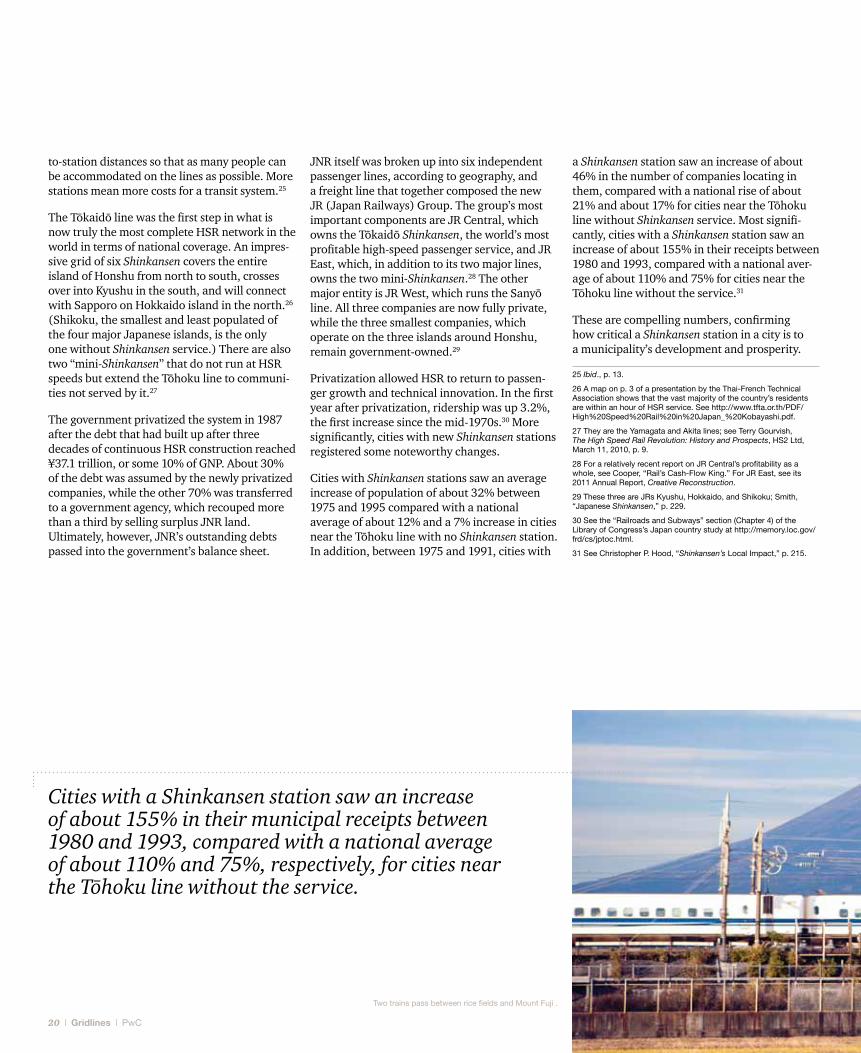
Two trains pass between rice fields and Mount Fuji .

PwC | Gridlines | 21
32 See Smith, “Japanese Shinkansen,” p. 231: “If 85 per cent of the total passengers on the present Shinkansen lines are assumed to have shifted from conventional lines, the annual time saving…is approximately 400 million hours.” The ¥500 billion per annum is based on the value of hours from GDP per capita data.
33 For the E6, see Creative Reconstruction, p. 32, as well as http://www.jreast.co.jp/press/2009/20100203.pdf. For JR Central’s maglev, see Cooper, “Rail’s Cash-Flow King” and the White House announcement, “Vice President Biden Announces Six Year Plan to Build National High-Speed Rail Network,” February 8, 2011, at http://www.whitehouse.gov/the-press-office/2011/02/08/vice-presi-dent-biden-announces-six-year-plan-build-national-high-speed-r.
34 The chart, “Punctuality, just on time,” on p. 9 of the Thai-French Technical Association presentation actually covers a 16-year period (1991-2006) for the Tokaido line; see http://www.tfta.or.th/PDF/High%20Speed%20Rail%20in%20Japan_%20Kobayashi.pdf. Forty-one seconds was the average for the period 1997-2006. If the prior six years are added, the average delay increases to 53 seconds.
Even more compelling is the calculation made in 2003 of a massive journey-time savings of 400 million hours annually—which translate into the sum of ¥500 billion per year—because of the Shinkansen.32
The maximum speed on the Shinkansen today is 300 kph. Within two years, JR East’s E6 train, to be introduced in 2014, will have a maximum speed of 320 kph. But JR Central is taking an even bolder technological leap. It plans to introduce maglev (magnetic levitation) trains between Tokyo and Nagoya (Japan’s fourth largest city), at a speed of over 500 kph. The company is funding the project completely on its own at a cost of $62 billion. As a standard of comparison, that is six times the amount dedi-cated to all HSR projects this year in the US and $9 billion more than the total allocated by the US government for the next six years.33
In the continuing debate about HSR’s pros and cons, it is critical to maintain perspective. Anyone who examines Japan’s Shinkansen, however, is struck by the massive success of a technology that has transported tens of billions
of passengers over the last 47 years, without a single fatality in one of the most geologically vulnerable nations in the world, and with delays over a 10-year period that average only 41 seconds per train service.34 About the authors
Yumiko Noda, leader of Japan’s capital markets and infrastructure practice, and Satoshi Takesada, transport director, are based in PwC’s Tokyo office ([email protected], +81 3 3546 8512; [email protected], +81-80 1031 1517).

22 | Gridlines | PwC
Continental Divides: tracking HSr in the
US and russia

PwC | Gridlines | 23
A simple look at a map tells much of the story on high-speed rail; why some countries choose it sooner and others later and why some cities are first to connect. The US and Russia together offer an instructive example of HSR’s trajectory in two nations that are similar as well as different.
Parallels can be seen in both nations’ geography and in their untapped potential for HSR. At the same time, population densities and cultural preferences differ markedly: Each country will follow different tracks. Ultimately, however, viable HSR systems are based on pragmatic expectations that recognize local social and economic needs.
HSR works best at current top speeds accord-ing to a straightforward calculation: a distance of 400-800 kilometers from terminal to termi-nal, as far as cities are concerned. Accordingly, smaller, more compact countries such as Japan or France immediately see the comparative advantage in traveling on high-speed rail as opposed to flying or driving.
The distance from Niigata on the Sea of Japan, to Yokohama, on the Pacific, is 277 kilometers, while Calais, on the French Atlantic coast near the Belgian border, to Perpignan, on the Mediterranean coast near the Spanish border, is approximately 921 kilometers. The distance from Portland, Maine, to Los Angeles, on the other hand, is 4,240 kilometers, while that from Saint Petersburg to Vladivostok is 6,542 kilometers.
With modern, high-speed trains traveling 320 kph, the Japanese distance can be traversed in just over 40 minutes and the French journey in under three hours. But the American trip, coast to coast, would take more than 13 hours. The journey northwest to southeast across the great Russian landmass would take over 20 hours—just an hour less than the flight time from New York to Sydney. Even HSR’s staunchest advocates would never have considered it for trips of such length until China recently entered the picture.
China’s unprecedented, and truly massive, entry into HSR has challenged predominant assumptions even as the nation pauses to review its plans and quality controls after the fatal
By Peter Raymond and Julian Smith
The American and Russian experience demonstrates that HSR is not a one-size-fits-all transport strategy. Different nations—of different sizes, different population levels, different cultural habits, and, above all, different preexisting transport infrastructures—have different needs.
Russian (left) and American crossing signs.

24 | Gridlines | PwC
Wenzhou accident in July. But China’s funda-mental decision to embark upon the largest construction program in the history of HSR (having already built, in just a few years, the world’s longest network)1 is easy to understand given its demographic and economic situation.
The four largest countries in the world in total area are, in descending order, Russia, Canada, the United States, and China.2 With the excep-tion of China, none of them have a HSR program of any significance, let alone of China’s breath-taking scale. Only India among the next four largest nations (including Brazil, Australia, and Argentina)3 has announced plans for a HSR network.4
Countries of a certain size and (especially) development need to adapt HSR in ways that are most efficient for them, on the basis of others’ experience, rather than just copying the approach of countries with very different infrastructural needs. China might very well be pioneering HSR for territorially large nations, just as Japan did for smaller, compact ones, with populations concentrated in large, urban agglomerations in relatively close proximity to each other.
For example, the size of the Chinese, Russian, and American populations differs markedly: China’s 1.336 billion dwarf Russia’s 138.7 million by almost a factor of 10 and the US’s 313.2 million by a factor of four.5 Since HSR is primarily a matter of passenger trans-port, population size is important.
Standard of living is another relevant factor. China’s per capita GDP in 2009 of $6,828 was just under a third of Russia’s $18,932 and almost a seventh of the $45,989 in the US.6 Citizens of more affluent nations undoubtedly perceive their transport options differently from those in less affluent ones—and that is especially the case when these options involve car ownership.
What makes sense for one country, and what doesn’t, therefore, is more than just a straightforward calculus of miles and propulsion efficiencies—and it is often more intuitive than rational.
For example, the major national postwar infrastructural project in the United States was the interstate highway system, the largest controlled-access highway system in the world.7 In 1995, 40 years after its creation, there were roughly 205 million passenger vehicles
1 The intention is to build 16,000 kilometers of track for 35 HSR lines, as well as 120,000 kilometers of conventional rail. Already, China has built 7,531 kilometers of HSR, triple the size of Japan’s network, which was the largest national system until now. See Keith Bradsher, “High-Speed Rail Poised to Transform China,” The New York Times, June 22, 2011, as well as “Backgrounder: The development of China’s high-speed rail network,” Xinhua News Agency, December 7, 2010, and Xin Dingding, “High-speed railways to be rolled out in 2012,” China Daily, June 24, 2009. The numbers for the total do vary, even among the Chinese press, but 16,000 seems to be the latest consensus, although the Financial Times gave a total of 30,000 last year (see Jamil Anderlini, “China on track to be world’s biggest network,” April 5, 2010).
2 CIA, The World Factbook, at https://www.cia.gov/library/publica-tions/the-world-factbook/rankorder/2147rank.html.
3 Ibid.
4 India’s plan (Indian Railways’ Vision 2020) foresees six high-speed corridors operating within a decade (see Roana Maria Costa, “Vision 2020 sees train to Mumbai in 2 hours,” The Times of India, October 28, 2010). Brazil’s São Paulo-Rio de Janeiro HSR project recently failed to attract any bids (see “Brazil bullet train project fails to attract bidders,” BBC News, July 12, 2011, at http://www.bbc.co.uk/news/world-latin-america-14118028). Argentina, however, is building a HSR line that will link Buenos Aires to Rosario and then on to Cór-doba (see Jude Webber, “Argentina, Alstom in high-speed train deal,” Financial Times, April 30, 2008). Finally, Australia has rejected HSR as “relatively unsuitable” because of the country’s “low, and dispersed, population” (see A profile of high-speed railways, Internal Brief, Department of Infrastructure, Transport, Regional Development and Local Government, Bureau of Infrastructure, Transport and Regional Economics, p. 9, at http://www.bitre.gov.au/publications/77/Files/A_profile_of_high-speed_railways.pdf.
5 CIA, The World Factbook, at https://www.cia.gov/library/publica-tions/the-world-factbook/rankorder/2119rank.html.
6 2009 figures are from the World Bank at http://data.worldbank.org/indicator/NY.GDP.PCAP.PP.CD.
7 Here, too, however, China will soon surpass the world’s leader, in this case, the US. See Cathy Yan, “Road-Building Rage To Leave U.S. In Dust,” January 18, 2011, at The Wall Street Journal’s China Real Time Report blog at http://blogs.wsj.com/chinarealtime/2011/01/18/road-building-rage-to-leave-us-in-dust.
Boarding the Sapsan high-speed train from Moscow to St. Petersburg, on its maiden journey in 2009.
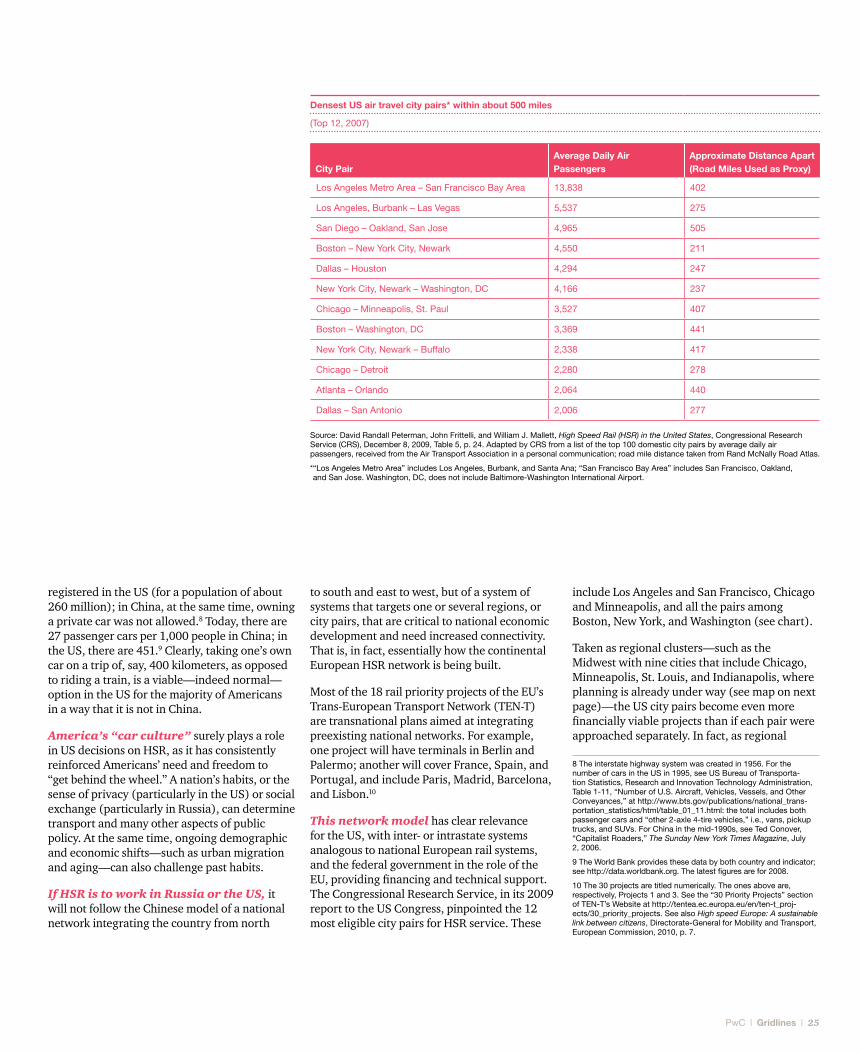
PwC | Gridlines | 25
registered in the US (for a population of about 260 million); in China, at the same time, owning a private car was not allowed.8 Today, there are 27 passenger cars per 1,000 people in China; in the US, there are 451.9 Clearly, taking one’s own car on a trip of, say, 400 kilometers, as opposed to riding a train, is a viable—indeed normal—option in the US for the majority of Americans in a way that it is not in China.
America’s “car culture” surely plays a role in US decisions on HSR, as it has consistently reinforced Americans’ need and freedom to “get behind the wheel.” A nation’s habits, or the sense of privacy (particularly in the US) or social exchange (particularly in Russia), can determine transport and many other aspects of public policy. At the same time, ongoing demographic and economic shifts—such as urban migration and aging—can also challenge past habits.
If HSR is to work in Russia or the US, it will not follow the Chinese model of a national network integrating the country from north
to south and east to west, but of a system of systems that targets one or several regions, or city pairs, that are critical to national economic development and need increased connectivity. That is, in fact, essentially how the continental European HSR network is being built.
Most of the 18 rail priority projects of the EU’s Trans-European Transport Network (TEN-T) are transnational plans aimed at integrating preexisting national networks. For example, one project will have terminals in Berlin and Palermo; another will cover France, Spain, and Portugal, and include Paris, Madrid, Barcelona, and Lisbon.10
This network model has clear relevance for the US, with inter- or intrastate systems analogous to national European rail systems, and the federal government in the role of the EU, providing financing and technical support. The Congressional Research Service, in its 2009 report to the US Congress, pinpointed the 12 most eligible city pairs for HSR service. These
include Los Angeles and San Francisco, Chicago and Minneapolis, and all the pairs among Boston, New York, and Washington (see chart).
Taken as regional clusters—such as the Midwest with nine cities that include Chicago, Minneapolis, St. Louis, and Indianapolis, where planning is already under way (see map on next page)—the US city pairs become even more financially viable projects than if each pair were approached separately. In fact, as regional
Densest US air travel city pairs* within about 500 miles
(Top 12, 2007)
City PairAverage Daily Air Passengers
Approximate Distance Apart (Road Miles Used as Proxy)
Los Angeles Metro Area – San Francisco Bay Area 13,838 402
Los Angeles, Burbank – Las Vegas 5,537 275
San Diego – Oakland, San Jose 4,965 505
Boston – New York City, Newark 4,550 211
Dallas – Houston 4,294 247
New York City, Newark – Washington, DC 4,166 237
Chicago – Minneapolis, St. Paul 3,527 407
Boston – Washington, DC 3,369 441
New York City, Newark – Buffalo 2,338 417
Chicago – Detroit 2,280 278
Atlanta – Orlando 2,064 440
Dallas – San Antonio 2,006 277
Source: David Randall Peterman, John Frittelli, and William J. Mallett, High Speed Rail (HSR) in the United States, Congressional Research Service (CRS), December 8, 2009, Table 5, p. 24. Adapted by CRS from a list of the top 100 domestic city pairs by average daily air passengers, received from the Air Transport Association in a personal communication; road mile distance taken from Rand McNally Road Atlas.
* “Los Angeles Metro Area” includes Los Angeles, Burbank, and Santa Ana; “San Francisco Bay Area” includes San Francisco, Oakland, and San Jose. Washington, DC, does not include Baltimore-Washington International Airport.
8 The interstate highway system was created in 1956. For the number of cars in the US in 1995, see US Bureau of Transporta-tion Statistics, Research and Innovation Technology Administration, Table 1-11, “Number of U.S. Aircraft, Vehicles, Vessels, and Other Conveyances,” at http://www.bts.gov/publications/national_trans-portation_statistics/html/table_01_11.html: the total includes both passenger cars and “other 2-axle 4-tire vehicles,” i.e., vans, pickup trucks, and SUVs. For China in the mid-1990s, see Ted Conover, “Capitalist Roaders,” The Sunday New York Times Magazine, July 2, 2006.
9 The World Bank provides these data by both country and indicator; see http://data.worldbank.org. The latest figures are for 2008.
10 The 30 projects are titled numerically. The ones above are, respectively, Projects 1 and 3. See the “30 Priority Projects” section of TEN-T’s Website at http://tentea.ec.europa.eu/en/ten-t_proj-ects/30_priority_projects. See also High speed Europe: A sustainable link between citizens, Directorate-General for Mobility and Transport, European Commission, 2010, p. 7.

26 | Gridlines | PwC
clusters, they have the potential to act as anchors for further HSR expansion, exactly as the initial HSR lines in Europe did in the early ’80s and ’90s.11
Looking at the US city pairs, the longest distance among them is 505 miles between San Diego and Oakland, which could be covered by today’s HSR in about two and a half hours. The shortest distance, between Boston and New York, should not take more than 65 minutes, just over a third of the time it now takes on the fastest Acela express—which, according to the New York Times, had an average speed a few years ago of 71 mph, or a mere 114 kph, which, of course, does not even begin to approach HSR speed.
State authorities throughout the US are rethink-ing HSR in terms of regional connectivity. The plan put forward by the Midwest High Speed
Rail Association (see map) foresees a Midwest HSR corridor (and extensions) that goes beyond the cluster described above and connects the major cities of eight states.12
Meanwhile, the federal government has autho-rized 11 high-speed corridors (and extensions), although, until recently, the funding for them has been minimal.13
The US Department of Transportation’s plans are not “national” in the sense of China’s transcontinental connectivity, nor are they designed for complete continental integration, as the EU’s projects are (see map on page 11). They are thoroughly focused on robust regional networks—in the Northeast, Midwest, and, especially, the Los Angeles-San Francisco corridor—that might spur further extensions
11 The five clusters are a) San Diego-Los Angeles/Burbank-San Jose-San Francisco/Oakland, with an extension to Las Vegas from Los Angeles; b) Dallas/Fort Worth-San Antonio-Houston, with a direct Dallas-Houston line; c) Atlanta-Orlando, which could easily be extended southward to Miami and northward to Washington, DC (the distance from Atlanta to Washington would, on state-of-the-art HSR, take just under the time of the current Acela express between Washington and New York); d) the Northeast Corridor (Boston-New York/Newark-Washington), with an extension to Buffalo from New York; and e) a Midwest corridor (Minneapolis/Saint Paul-Chicago-Detroit). It should be pointed out, however, that daily traffic of 2,000 passengers is probably not viable for a train line, although 13,000 certainly is, and even 3,500 might be with an eight-car trainset of roughly 570 passengers (as in an E-set 700 Series Shinkansen) that would allow about six trains a day.
and HSR integration in the future. And, even if they don’t, substantive and dynamic HSR will have been built throughout the country.
The Russian Federation’s approach to HSR bears out the importance of national context. Although Russia’s railways are among the most freight-dominant in the world,14 they also carry about 46 times more passengers than the US rail system does.15
Nonetheless, in a country almost twice as big as China in area with less than half of America’s population, Russian railways carry freight and passengers over long distances and nearly empty spaces. Indeed, Russia has one of the smallest population densities in the world, ranking in the bottom 20 of almost 200 nations, with eight people per square kilometer, one-quarter of the US figure (32/kilometer2) and almost 18 times
12 See also the Association’s 2011 report, The Economic Impacts of High Speed Rail: Transforming the Midwest.
13 See US Department of Transportation, Federal Railroad Adminis-tration (FRA), Vision for High-Speed Rail in America, High-Speed Rail Strategic Plan, The American Recovery and Reinvestment Plan Act, April 2009, p. 6. Also, see the FRA’s “Chronology of High-Speed Rail Corridors: Designations and Extensions,” at http://www.fra.dot.gov/rpd/passenger/618.shtml.
14 According to Russell Pittman, Russia is third behind the US and China in volume of freight hauled and fourth behind Canada, the US, and Estonia in ratio of freight ton-kilometers to passenger-kilometers. See his “Blame the Switchman? Russian Railways Restructuring After Ten Years,” Discussion Paper, Economic Analysis Group, Anti-trust Division, US Department of Justice, February 2011, pp. 1-2.
15 Direct comparisons are often difficult because comparable data are not always available. According to Russia’s Federal State Statistics Service, passenger traffic for Russian rail was 1.296 bil-lion in 2008; see Table 18.4, “Passenger Traffic by Public Transport Mode (Mln. Persons),” at http://www.gks.ru/bgd/regl/b10_12/IssWWW.exe/stg/d02/18-04.htm. For the US, the data used are for Amtrak. According to the US Government Accountability Office, Amtrak “currently carries about 28 million passengers per year”; see the report to Congress, High Speed Rail: Learning From Service Start-ups, Prospects for Increased Industry Investment, and Federal Oversight Plans, June 2010, p. 4. Finally, see the Statistical Yearbook for Asia and the Pacific 2009 (2010 edition) of the United Nation’s (UN) Economic and Social Commission for Asia and the Pacific, p. 135, for passenger-rail data on Russia and China, which states that, “Chinese Railways carried 1.46 billion passengers…and Russian Railways 1.3 billion” in 2008, which agrees with the Russian Federation’s figures.
2:45
1:05 0:40
1:55
1:10
2:15
1:55
1:55
Cleveland
Cincinnati
Minneapolis-St. Paul
Madison
Milwaukee
Chicago
Detroit
Indianapolis
St. Louis
Source: Midwest High Speed Rail Association, The Economic Impacts of High Speed Rail: Transforming the Midwest, 2011.
Route studied
Alternate route
Estimated travel times from Chicago
Plan for future Midwest HSR network

PwC | Gridlines | 27
less than China (140/kilometer2).16 It is not sur-prising, therefore, that the Russian Federation’s entry into HSR has been marked by prudence and careful, stage-by-stage, calibration.
But it has not been timid. In March of last year, President Dmitry Medvedev signed a decree facilitating the necessary “measures to develop high-speed railway transport in Russia.” That decree was followed in December by Prime Min-ister Vladimir Putin’s pledge of HSR services for the cities hosting the 2018 World Cup. In fact, he made his statement after taking the inaugural trip of the new Helsinki-Saint Petersburg HSR line with Finnish President Tarja Halonen.17
Russia’s interest in HSR goes back several decades to the Soviet era, when the Ministry of Railways first proposed a feasibility study in 1975. But it was only in 1988, after Mikhail
Gorbachev’s accession to power, that plans moved forward, including a proposal for a HSR line from Moscow to Saint Petersburg capable of speeds of 300-350 kph. Within three years, the order establishing the Moscow-Saint Peters-burg HSR line was signed and, within another decade, the prototype Sokol (Hawk) trainset was produced and tested, achieving speeds of 236 kph. However, Russia’s 1998 financial crisis eventually sidetracked the project.18
The Hawk was succeeded by the Peregrine Falcon, or Sapsan, Russia’s first truly HSR trainset, in December 2009. It began operating between Moscow and Saint Petersburg at speeds of up to 250 kph. The ser-vice was extended east to Nizhny Novgorod in July of last year.19 Like the Tōkaidō line between Tokyo and Osaka and the TGV between Paris and Lyon, the Moscow-Saint Petersburg Sapsan
16 It is instructive that those countries best known for HSR—Japan, France, Germany, Spain, and Italy—have densities, respectively, of 335, 114, 231, 91, and 201 people per square kilometer. Of course, Japan has the highest density, which, again, helps to explain its pioneering role in HSR. See the Website of the UN’s Department of Economic and Social Affairs, Population Division, Population Estimates and Projections Section, “World Population Prospects, the 2010 Revision,” Table 1, “Selected Demographic Indicators: Population, 2010,” at http://esa.un.org/unpd/wpp/Sorting-Tables/tab-sorting_population.htm. Also, the density as a whole of the EU 15 countries (pre-Eastern European enlargement) is 121/kilometer2—almost four times that of the US and 15 times that of Russia—which, too, explains their commitment to HSR. See European Commission, Population Statistics, 2006 edition, Table I-1, “Main demographic indicators by region, 2003,” p. 146.
17 For the presidential decree, see the Russian Railways/JSC Speed Lines Website, at http://www.eng.hsrail.ru/info/documents/19.html; for the World Cup statement, see “Putin promises high speed travel during 2018 World Cup,” RIA Novosti, December 12, 2010, http://en.rian.ru/russia/20101212/161744616.html; for the Putin-Halonen HSR story, see Irina Titova, AP, “Finnish, Russian Leaders Ride New Fast Train,” ABC News, http://abcnews.go.com/International/wireStory?id=12376611.
18 All of the information in this paragraph is taken from Andrey Guryev, “HSR in Russia,” on the Russian Railways/JSC Speed Lines Website, at http://www.eng.hsrail.ru/abouthsr/history-in-russia.
19 “High-speed Sapsan train to make first commercial run,” RIA Novosti, December 12, 2009, http://en.rian.ru/russia/ 20091217/157266771.html, and “Sapsan reaches Nizhny Novgorod,”
Railway Gazette International, August 2, 2010, http://www.railwayga-zette.com/news/single-view/view/sapsan-reaches-nizhny-novgorod.html.
20 “Sapsan train races ahead in profitability for Russian Railways,” RIA Novosti, October 26, 2010, http://en.rian.ru/busi-ness/20101026/161088304.html; for the euro-ruble exchange rate on October 26, 2010, see http://www.exchange-rates.org/Rate/EUR/RUB/10-26-2010.
21 Russell Pittman writes that, “The years from Strategy enactment in 2008 through 2015 are to focus on modernization”; see “Blame the Switchman?,” p. 20.
service has proved to be immensely profitable from the first day. According to Russian Rail-ways President Vladimir Yakunin, annual losses last year from commuter trains were 34 billion rubles and 36 billion rubles for long-distance trains, but the Sapsan was projected to make a first-year profit of €61 million (2.578 billion rubles).20
A year and a half before the first Sapsan began running, the Russian government released its “Strategy for Railway Development in the Russian Federation to 2030,” a document that foresees a primary focus on modernization during the next few years.21 Part of that focus will be the Moscow-Saint Petersburg corridor (see map on p. 11), this time with an entirely new and dedicated HSR line that will traverse the 660 kilometers between the two cities in two and a half hours.
Vast nations like the US, Russia, and China will, in the end, confirm that making HSR work depends on adapting to specific tangible and intangible requirements that vary from country to country and region to region.

28 | Gridlines | PwC
The eastern corridor from Moscow to Ekater-inburg is a different concept, as its market will comprise a chain of cities in Russia’s heartland rather than the usual pair of cities. This illus-trates one of the economic advantages of HSR over air: the ability to serve many different origin-destination pairs with a single train, as passengers can get on or off at a variety of stops on a route.
The American and Russian experience demonstrates that HSR is not a one-size-fits-all transport strategy. Different nations—of differ-ent sizes, different population levels, different cultural habits, and, above all, different preexisting transport infrastructures—have different needs.
While the US, for example, has, by far, the most extensive rail system in the world, it is mostly privately owned and used to haul freight. It is much more difficult to secure rights-of-way for new HSR lines (or any railroad upgrades) in this context than in one in which rail infrastructure is publicly owned.22 By contrast, Japan priva-tized its railways after it had built its four major Shinkansen (see related story in this issue, p. 15), while, in Germany, public ownership of the rails is constitutionally mandated.23
The US is also a wealthier country than, say, China, and using one’s car to travel even 1,000 kilometers (625 miles, just a bit longer than the
distance from New York to Detroit) can be second nature to most Americans. Getting on a train, however—no matter how state of the art—seems almost quaint or even novel.
Russia, on the other hand, still has the tradi-tion, and reality, of the “night train” to Saint Petersburg.24 Clearly, in that cultural difference (shared by many European nations) lays an affinity for train travel in Russia that increases the possibility of success of any HSR line.
But that cultural difference does not stack the odds forbiddingly against HSR in the US. High-speed rail has proved its attraction in city after city. As it is, Amtrak’s Northeast Corridor car-ried almost 10.4 million passengers in fiscal year 2010, more than a third of the company’s total carriage.25 A full upgrade to a dedicated HSR line would likely increase that passenger load significantly.26 And that holds true even for future routes that have never known HSR, such as the planned line between Los Angeles and San Francisco.
There are grounds for hope that vast nations like the US, Russia, and China might, in the end, confirm not that HSR works—which is already proven—but, more important, that it works in a variety of circumstances because it can be adapted to specific tangible and intangible requirements that vary from country to country and region to region.
22 The total route length of the American rail network is 224,792 kilometers; the next longest is Russia’s at 87,157 (CIA, The World Factbook, at https://www.cia.gov/library/publications/the-world-factbook/rankorder/2121rank.html?countryName=United%20States&countryCode=us®ionCode=noa&rank=1#us).
23 Article 87e, ¶ (1), of the Basic Law of the Federal Republic of Germany states: “Rail transport with respect to federal railways shall be administered by federal authorities. Responsibilities for rail trans-port administration may be delegated by a federal law to the Länder acting in their own right.” See the German Bundestag’s Website at https://www.btg-bestellservice.de/pdf/80201000.pdf.
24 See Ed Bentley, “Night train no more,” The Moscow News, August 3, 2009.
25 Amtrak, National Fact Sheet FY 2010, at http://www.amtrak.com/servlet/ContentServer?c=Page&pagename=am%2FLayout&cid=1246041980246.
26 In FY 2010, the Northeast Corridor took 69% of the Washington-New York and 53% of the New York-Boston air/rail travel markets, respectively. See Amtrak’s Annual Report FY 2010, p. 28.
And this is one of the strengths of HSR: that it can be modeled to accommodate the particular economic, geographic, and passenger needs it is constructed to serve.
About the authors
Peter Raymond leads PwC’s US capital projects and infrastructure practice. He is based in McLean VA. ([email protected], +1 703 918 1580).
Julian Smith, PwC’s rail and transport infrastructure leader, is based in Moscow. ([email protected]; +7 495 967 6462)
A “car culture” does not stack the odds of success forbiddingly against HSR in the US. High-speed rail has proven its attraction in city after city.

Global capital projects & infrastructure leader Richard Abadie Tel +44(0) 20 7213 3225 [email protected]
Argentina Maximiliano Galli Tel +54 11 4850 6887 [email protected]
Australia Joseph Carrozzi Tel +61 2 8266 1144 [email protected]
Brazil Carlos Biedermann Tel +55 51 3378 1708 [email protected]
Canada Michel Grillot Tel +1 403 509 7565 [email protected]
Central and eastern europe Julian Smith Tel +7 495 967 6462 [email protected]
China/Hong Kong Hongbin Cong Tel +86 10 6533 2667 [email protected]
France Peter Vickers Tel +33 1 56 57 73 05 [email protected]
Germany Hansjörg Arnold Tel +49 69 9585 5611 [email protected]
india Sotiris Pagdadis Tel +91 022 6669 1888 [email protected]
italy Guido Sirolli Tel +390 6 57083 2125 [email protected]
Japan Yumiko Noda Tel +81 3 3546 8512 [email protected]
Malaysia/Vietnam/thailand/Cambodia/Laos Andrew Chan Yik Hong Tel +60 3 2173 1219 [email protected]
Mexico Francisco Ibañez Tel +52 55 52 63 60685 [email protected]
Middle east Neil Broadhead Tel +971 4 304 3199 [email protected]
Charles Lloyd Tel +971 56 682 0617 [email protected]
netherlands Martin Blokland Tel +31 8879 27586 [email protected]
russia Tim Nicolle Tel +7 (495) 232 5589 [email protected]
Singapore Mark Rathbone Tel +65 6236 4190 [email protected]
South Africa Mark Ally Tel +27 11 797 5049 [email protected]
Spain Guillermo Masso Tel +34 915 684 353 [email protected]
Sweden Lars Tvede-Jensen Tel +46 8 555 33 403 [email protected]
UK Tony Poulter Tel +44 20 780 45814 [email protected]
Uruguay Jorge Seré Tel +598 29160463 Int 1383 [email protected]
US Peter Raymond Tel +1 703 918 1580 [email protected]
HSR contacts
Julian Smith Tel +7 495 967 6462 [email protected]
Klaus-Dieter Ruske Tel +41 211 981 2877 [email protected]
Paolo Guglielminetti Tel +39 06 570832008 [email protected]
Satoshi Takesada Tel +81-80 1031 1517 [email protected]
Contributors
Strategic direction Richard Abadie Tony Poulter Peter Raymond
Marketing + outreach Lee Ann Ritzman Becky Weaver
Editor William Sand
Design Odgis + Company Janet Odgis Rhian Swierat
Writing Peter Pappas
To discuss the issues
Special thanks to the many members of PwC’s global rail network who assisted:
Kensuke Hosomi, Klaus Jäcker, Dmitry Kadykov, Peter Kauschke, Nao Nomura, Sotiris Pagdadis, Alexander Semenikhin, Wenceslao Serrano, Phillipe Vincent

3 trees were preserved for the future
4 lbs of waterborne waste were not created
657 gallons of wastewater flow were saved
73 lbs of solid waste were not generated
143 lbs net of greenhouse gases were prevented
1,094,000 BTUs of energy were not consumed
2,024 lbs of GHG emissions were not generated
2 barrels of fuel oil were not used
1,641 cubic feet of natural gas were not used
equivalent of not driving 2,003 miles
equivalent of planting 138 trees
The papers and printer used in the production of this study are certified to Forest Stewardship Council (FSC) standards, which promote environmentally appropriate, socially beneficial, and economically viable management of the world’s forests. The cover for this publication was printed on paper containing 10% postconsumer waste material, and the text was printed on paper containing 10% postconsumer waste material.
By printing at a facility utilizing 100% wind energy and using postconsumer recycled fiber in lieu of virgin fiber:
www.pwc.com