2 0 1 9 Sample Pages - University of Belgrade
33
2082 Business Center Drive, Suite 240 | Irvine, CA 92612 Telephone (949) 831-8700 | www.computereconomics.com 2 0 1 9 Sample Pages
Transcript of 2 0 1 9 Sample Pages - University of Belgrade

2082 Business Center Dr ive , Suite 240 | I rv ine, CA 92612Telephone (949) 831-8700 | www.computereconomics .com
2 0 1 9
Sample Pages

TECHNOLOGY TRENDS 2019
TECHNOLOGY TRENDS 2019 © 2019 COMPUTER ECONOMICS, INC. UNAUTHORIZED DISTRIBUTION OR REPRODUCTION IS PROHIBITED.
PAGE 1
Technology Trends 2019
Computer Economics provides research and advisory services on the strategic and financial management of information technology. Our clients include IT end-user organizations and major consulting firms in North America. Our IT Spending and Staffing Benchmarks study, published annually since 1990, is the definitive source of IT benchmarking data.
Other annual studies include Technology Trends, an assessment of technology adoption, spending, and economic experience; IT Outsourcing Statistics, which provides data on the use of and experience with IT outsourcing; IT Management Best Practices, which measure adoption trends of strategic IT practices; and IT Staffing Ratios, a series of benchmarking studies with metrics for 16 IT job functions.
In addition to these major studies, we publish IT management advisories on various issues of concern to IT managers. These reports are made available through our website. For further information on our custom benchmarking services, website subscriptions, advisory reports, and other services, please contact our office or visit our website at Uwww.computereconomics.comU.
ISBN: 1-56909-021-X
Contact Information: Address: 2082 Business Center Drive, Suite 240, Irvine, CA 92612, USA Telephone: +1 (949) 831-8700 www.computereconomics.com
© 2019, Computer Economics, Inc., All Rights Reserved
Unauthorized reproduction or distribution in whole or in part in any form, including photocopying, faxing, image scanning, e-mailing, or making available for electronic downloading is prohibited without written permission from Computer Economics. Prior to photocopying items for internal or personal use, please contact Computer Economics, Inc. All trade names, trademarks, or registered trademarks are trade names, trademarks, or registered trademarks of their respective owners. Information contained in this publication has been compiled from sources believed to be reliable, but the accuracy of this information is not guaranteed.
Computer Economics disclaims all warranties and conditions with regard to the content, express or implied, including warranties of merchantability and fitness for a particular purpose, nor assumes any legal liability for the accuracy, completeness, or usefulness of any information contained herein. Any reference to a commercial product, process, or service does not imply or constitute an endorsement of the same by Computer Economics. This publication is designed to provide accurate and authoritative information in regard to the subject matter covered. It is sold or distributed with the understanding that Computer Economics is not engaged in rendering legal, accounting, or other professional service. If legal advice or other expert assistance is required, the services of a competent professional person should be sought.
TECHNOLOGY TRENDS 2019
TECHNOLOGY TRENDS 2019 © 2019 COMPUTER ECONOMICS, INC. UNAUTHORIZED DISTRIBUTION OR REPRODUCTION IS PROHIBITED.
PAGE 2
Table of Contents
TECHNOLOGY TRENDS OVERVIEW 4 Introduction 4 Analysis of Relative Maturity, Economic Experience, and Customer Satisfaction 5
ENTERPRISE SYSTEMS 11 Enterprise Resource Planning 13 Customer Relationship Management 21 E-Commerce 29 Supply Chain Management 37 Human Capital Management 45 Business and Data Analytics 53 Enterprise Asset Management 61 Artificial Intelligence 69
INFRASTRUCTURE TECHNOLOGY 76 Software as a Service 78 Infrastructure as a Service 86 Mobile and Wearable Devices 95 Mobile Applications 103 Internet of Things 110 Robotic Process Automation 117 IT Security Technology 124
EARLY ADOPTER AND FUTURE TECHNOLOGIES 133 Blockchain 134 Digital Currencies 135 Digital Assistants 135 Drones 136 Autonomous Vehicles 136 Virtual Reality 137 Augmented Reality 137 Quantum Computing 137 Biometric Authentication 138 No Code/Low Code 138 Electronic Tattoos 139 Microchip Implants 139 Smart Dust 140 3D Printing 140 4D Printing 141

TECHNOLOGY TRENDS 2019
TECHNOLOGY TRENDS 2019 © 2019 COMPUTER ECONOMICS, INC. UNAUTHORIZED DISTRIBUTION OR REPRODUCTION IS PROHIBITED.
PAGE 3
Self-Healing Systems 141 Volumetric Displays/Holograms 141 Digital Twins 142
METHODOLOGY AND PARTICIPANTS 144

TECHNOLOGY TRENDS 2019
TECHNOLOGY TRENDS 2019 © 2019 COMPUTER ECONOMICS, INC. UNAUTHORIZED DISTRIBUTION OR REPRODUCTION IS PROHIBITED.
PAGE 4
Technology Trends Overview Introduction
New technologies can come in and out of fashion with astonishing rapidity as vendors push the next big service, solution, or strategy. Only with time can business leaders know for certain which emerging technologies will have staying power and which will fall short of the initial hype.
This study is designed to give business leaders insight into the staying power of 15 technologies that are currently top of mind for many companies. It provides a glimpse into how quickly an emerging technology is being adopted, how deeply more-established technologies are penetrating the market, and how positive the customer experience is with each of them. The study also delves into the specific types of solutions under consideration. By understanding the adoption trends, investment activity, and customer experience, decision- makers are in a better position to assess the potential risks and rewards of investing in each of these technologies. They also can gain insight into just how aggressively competitors and peers are investing in them.
The study examines adoption trends, investment activity, and customer experience of 15 selected technologies, including eight that fall broadly into the category of enterprise systems and seven that we categorize as infrastructure technologies. In addition to the 15 major technologies in the study, we also briefly surveyed our respondents on their knowledge and potential use of 18 early adopter and future use technologies. Descriptions of these technologies can be found in the last section of this study.
This study is based on a survey of 249 IT organizations worldwide conducted from September through December 2018. The IT organizations were asked about their technology adoption plans for the 18-month period stretching into the first half of 2020, as well as their return on investment and total cost of ownership experience over the previous two-year period. A further description of the methodology and sample is at the end of this study.

TECHNOLOGY TRENDS 2019
TECHNOLOGY TRENDS 2019 © 2019 COMPUTER ECONOMICS, INC. UNAUTHORIZED DISTRIBUTION OR REPRODUCTION IS PROHIBITED.
PAGE 5
Analysis of Relative Maturity, Economic Experience, and Customer Satisfaction
Before profiling each technology, we compare the technologies as a group to gain perspective on their relative maturity and relative risk associated with investing in each. The comparative analysis provides a context within which to assess each technology.
Analysis of Relative Maturity Our IT maturity analysis, illustrated in Figure 1, compares the technologies along two parameters: the current investment rate and current adoption rate. This provides an assessment of how widely each technology is deployed, along with an assessment of how many organizations are currently investing in the technology. Taken together, these factors provide insight into how mature a technology is relative to other technologies in our study.

TECHNOLOGY TRENDS 2019
TECHNOLOGY TRENDS 2019 © 2019 COMPUTER ECONOMICS, INC. UNAUTHORIZED DISTRIBUTION OR REPRODUCTION IS PROHIBITED.
PAGE 6
The horizontal axis labeled “Percentage with Technology in Place” represents the current adoption rate. The higher the adoption rate, the farther the technology moves to the right in the chart. The vertical axis is labeled “Percentage Currently Investing,” representing the current investment rate. The greater the percentage of organizations currently investing in a technology, the higher it rises on the chart. Note that the scale on each axis is defined by the lowest and highest values in the study. As such, in this analysis, the words “low” and “high” are relative to the technologies in this study.
In fact, investment in most of the technologies in the study has increased this year, most likely due to several years in a row of a fairly strong global economy and the way cloud technologies have made it easier to deploy many of the technologies that we cover, especially those software technologies that can now be deployed as part of a software-as-a-service (SaaS) model.
The chart is divided into nine sectors, representing low, moderate, and high current investment rates, and low, moderate, and high current adoption rates. Each of the initiatives falls into one of the nine sectors as follows:
High Investment/High Adoption: Three technologies fall into the high-investment, high-adoption sector this year. Security technology (1) is in our study for the first time. It is not surprising that security technology is a high priority in terms of adoption and investment given the threats impacting the enterprise today. SaaS (2) as a whole is now the default manner in which many companies are deploying new software. Companies are attracted to its flexibility and security as well as the lower up-front costs. Business and data analytics (3) also is a mature concept benefiting from new technologies including artificial intelligence (AI), machine learning, faster networks, and cloud.
Moderate Investment/High Adoption: Four technologies fall into this category. ERP (4) has long been one of the most adopted and mature technologies in this survey. However, investment is still relatively high, because of new capabilities in the ERP space including AI, machine learning, and automation. New cloud-based offerings also are encouraging IT organizations to shift away from legacy systems. Customer relationship management (CRM) software (5) is following a similar investment pattern to ERP. While mature, new capabilities and SaaS are encouraging continued investment. Human capital management (HCM) (6), like CRM and ERP, is benefiting from the replacement of legacy systems with cloud offerings. Mobile devices/wearables (8) is showing increased investment, perhaps as a wider array of applications makes mobile devices valuable to more of the workforce.
Moderate Investment/Moderate Adoption: Three technologies fall into this group. Mobile applications (7) are now a part of most new software deployments, as the workforce becomes increasingly remote. As such, adoption and investment rates can be slightly deceiving. Infrastructure as a service (IaaS) (9) was a success for early adopters and is now moving into the mainstream. E-commerce systems (10) are ubiquitous in some sectors, but not necessary in others. As such, adoption and investment rates can be slightly deceiving.

TECHNOLOGY TRENDS 2019
TECHNOLOGY TRENDS 2019 © 2019 COMPUTER ECONOMICS, INC. UNAUTHORIZED DISTRIBUTION OR REPRODUCTION IS PROHIBITED.
PAGE 7
Moderate Adoption/Low Investment: Two technologies fall into this group. Supply chain management systems (SCM) (11) should be benefiting from the same enhancements as other systems in this survey, but unlike ERP and CRM they are lagging in new investment. Clearly, other applications are a higher priority for cloud deployments. But it should also be pointed out that even with our rather broad definition, some organizations do not need to make use of supply chain management, and some organizations use ERP to serve up much of its functionality. Enterprise asset management (12) is a must for larger organizations that are heavily invested in facilities and equipment but not as much for services businesses, such as professional services.
Low Investment/Low Adoption: All three technologies in this sector are relatively new. As such, we would expect low adoption and investment numbers at first. However, we also expect that these should be heavy growth areas. The Internet of Things (IoT) (13) is especially promising as a way to reduce costs through elimination of waste by using smart devices and sensors. New consumer goods using IoT also will open businesses to new kinds of customer data and intimacy. AI (14) stands in for a series of technologies including machine learning, rules-based automation, natural language learning, facial and voice recognition, and even chatbots. AI also is being “baked in” to existing business applications, and we expect its role to grow. Robotic process automation (15) can take over for humans in doing simple, repetitive tasks and free them up for higher-order analysis and decision-making. Cost savings should propel growth in this area.
Enterprises are investing in their bread-and-butter core systems at a strong rate, with many applications getting major investments. SaaS options are helping to drive investment. Security is obviously a top priority. And organizations are thirsty for data that they can use to make better decisions in a rapidly changing economy. The dream next step for business and data analytics is the inclusion of AI, machine learning, better networks, and cloud allowing for increased agility. Automation based on these analytics would allow for business decisions to be made by AI at a rate even faster than human managers can make them. Even without the AI component, companies are increasingly reliant on data, and we would not expect business and data analytics to fall as a priority any time soon.
In the next section, we assess the economic experience adopters are having with each of these initiatives, regardless of their maturity. This analysis will provide greater insight into the prospects for the emerging technologies.

TECHNOLOGY TRENDS 2019
TECHNOLOGY TRENDS 2019 © 2019 COMPUTER ECONOMICS, INC. UNAUTHORIZED DISTRIBUTION OR REPRODUCTION IS PROHIBITED.
PAGE 8
Analysis of Economic Experience Although some IT spending may be viewed simply as the cost of doing business, organizations ultimately expect a financial return on their investments. Like all investments, those in IT carry risks, and balancing risks against potential rewards is an important step in sound decision-making. The scatter chart in Figure 2 illustrates the relationship between risk and reward by plotting the cost-success rate (risk) against the ROI-success rate (reward) for each initiative.
This analysis defines reward in terms of the percentage of adopters that break even or obtain positive ROI on their investment, which we call the ROI success rate. We define risk in terms of the percentage of adopters that came in at or at less than budget for total cost of ownership (TCO), which we call the cost- success rate. Figure 2 ranks each technology by economic experience, which is the combination of the two. Technologies with higher combined success rates are positioned closer to the upper-right-hand corner.

TECHNOLOGY TRENDS 2019
TECHNOLOGY TRENDS 2019 © 2019 COMPUTER ECONOMICS, INC. UNAUTHORIZED DISTRIBUTION OR REPRODUCTION IS PROHIBITED.
PAGE 9
Each initiative falls into one of nine sectors, representing low, moderate, or high reward, and low, moderate, or high risk. The findings are as follows:
Low Risk/High Reward: Technologies with the most successful economic experience profiles are in the low-risk, high-reward sector. Seven technologies are in this category. For the most part, organizations are achieving success with these technologies. Mobile devices/wearables (1), mobile applications (2), robotic process automation (3), enterprise asset management (4), Internet of Things (5), e-commerce (6), and IaaS (7) are technologies that all IT executives should be tracking closely because of their positive risk-reward characteristics.
Low Risk/Moderate Reward: Business and data analytics (8) is the only technology that falls into this sector. With technologies in this sector, cost is predictable, but return on investment is sometimes difficult to measure or is unclear.
Moderate Risk/High Reward: The technologies in this sector have uncertain costs associated with them, but they usually exhibit a return on investment in the end. SaaS (9) is the only technology in this sector. It is noteworthy, as cost certainty is supposed to be one of the strengths of SaaS.
Moderate Risk/Moderate Reward: There are four technologies in this sector. It should be pointed out that most technologies in this sector have ROI that is often difficult to determine. AI (10) is increasingly being embedded in business systems to the point that users often do not realize they are working with it. Supply chain management (11) is technology that has an ROI that is often easy to quantify. HCM (12), like most large software deployments, lacks some cost certainty, and it is difficult to judge its impact on employees or productivity. Security technology (14) does not really have an ROI in a traditional sense. However, security is much like a field goal kicker: You only notice him when he misses.
High Risk/Moderate Reward: The only technology in this sector is CRM (13). CRM systems, like many complex software systems, can be difficult to implement. Costs can often get out of hand. However, generally speaking, once these systems are in place a reward can be measured, and if done right it can be substantial.
High Risk/Low Reward: The sole technology in this sector, ERP (15), has a poor track record in these areas, and consistently so. ERP success requires user adoption and willingness to change, which increases the risk of failure. Because these systems are an essential part of the application portfolio of most organizations, the high-risk/low-reward nature does not mean organizations should not invest in ERP. Rather, it means that they should focus on mitigating the risks as well as managing the people side of change.

TECHNOLOGY TRENDS 2019
TECHNOLOGY TRENDS 2019 © 2019 COMPUTER ECONOMICS, INC. UNAUTHORIZED DISTRIBUTION OR REPRODUCTION IS PROHIBITED.
PAGE 10
Customer Satisfaction Ratings In our final comparative analysis, Figure 3 shows the scaled satisfaction ratings for the 15 technologies in our study. The ratings are based on the percentage of companies saying they are satisfied or very satisfied with their experience with each technology. As with the other charts, the satisfaction ratings are based on a relative scale determined by the highest and lowest values for all technologies in the study.
The top technology in the study by a good margin is mobile devices/wearables. It has been more than a decade since Apple introduced the iPhone and even longer since BlackBerries and other smartphones entered the enterprise. Organizations know what they are getting with these devices, and they are happy to deploy them to their highly mobile workers. These devices are literally changing the way we work, and most people seem to be happy about that. Next come the two cloud technologies, IaaS and SaaS. The cloud transformation is well under way, and most companies are embracing it. On the other end, four complex business systems have the lowest satisfaction. ERP, human capital management, CRM, and supply chain management form the backbone of many modern enterprises. The fact that they give the most trouble to our respondents is troubling but not surprising. A great deal of organizational change management, buy-in from users, and rethinking of business processes go into the successful deployment of any of these systems. And as the organization changes, changes to these systems are a constant battle.
We present an expanded description of each of these technologies with their individual adoption trend and ROI/TCO and satisfaction profiles in the next two sections.

TECHNOLOGY TRENDS 2019
TECHNOLOGY TRENDS 2019 © 2019 COMPUTER ECONOMICS, INC. UNAUTHORIZED DISTRIBUTION OR REPRODUCTION IS PROHIBITED.
PAGE 11
Enterprise Systems The study includes eight technologies that we place in the category of enterprise systems. They include ERP, CRM, e-commerce, supply chain management, human capital management, business and data analytics, enterprise asset management, and artificial intelligence.
In this section, we profile each technology initiative in seven figures as follows:
Adoption and Customer Experience Profile: This figure establishes the context for understanding the metrics. The profile chart shows how each technology compares with other initiatives in the study on adoption rate, investment rate, ROI success rate, and TCO success rate, and overall customer satisfaction.
Stages of Adoption: This figure shows the percentage of organizations at each of five adoption stages. Stage 1 is “no activity.” Organizations studying or piloting technologies fall into the “considering” stage, or Stage 2. The implementation stage, Stage 3, includes companies that plan to implement an initiative for the first time within the next 18 months. Those at Stage 4 have technology in place but show “no further activity” beyond routine maintenance and addition of new users. Organizations at Stage 5 have the technology in place and are “increasing” their investment by implementing new features and capabilities.
Adoption and Investment by Organization Size: This chart shows adoption and investment rates by organization size. The adoption rate is the percentage of organizations at Stages 4 and 5, with initiatives in place. Investors are organizations at Stages 3 and 5, including first-time implementers and those making follow-on investments. We define small organizations as those with from $20 million to less than $350 million in annual revenue, midsize organizations as those with from $350 million to less than $1 billion in revenue, and large organizations as those with at least $1 billion in annual revenue.
Customer Experience with ROI: This figure shows the percentage of adopters that have a return on investment that is positive, break even, or negative over a two-year period. The ROI success rate is the percentage having positive or break-even ROI.
Customer Experience with TCO: The customer experience with total cost of ownership is measured by the percentage of adopters that find TCO is greater than budgeted, the same as budgeted, or less than budgeted. The cost-success rate is the percentage that experience TCO of less than or the same as the budgeted amount for implementation and ongoing support.

TECHNOLOGY TRENDS 2019
TECHNOLOGY TRENDS 2019 © 2019 COMPUTER ECONOMICS, INC. UNAUTHORIZED DISTRIBUTION OR REPRODUCTION IS PROHIBITED.
PAGE 12
Satisfaction with Customer Experience: We measure overall customer satisfaction by asking adopters to rate their satisfaction with each technology on a five-point scale, from very dissatisfied to very satisfied.
Types of Solutions: This figure shows the percentage of investors that are making an investment or considering investment in each type of solution within the category. We include organizations making follow-on investments and first-time implementations, as well as those only considering an investment. Respondents can select from among multiple choices.

TECHNOLOGY TRENDS 2019
TECHNOLOGY TRENDS 2019 © 2019 COMPUTER ECONOMICS, INC. UNAUTHORIZED DISTRIBUTION OR REPRODUCTION IS PROHIBITED.
PAGE 13
Supply Chain Management
Supply chain management systems manage the planning, movement, and storage of materials from the earliest stages of procurement through intermediate stages of production to final distribution to the end customer. Whereas ERP systems primarily focus on the internal operations of the business, supply chain management looks outward to encompass the activities of suppliers, customers, and partners, as well as internally to the movement and storage of materials within the organization’s operations. Supply chain management systems encompass two main subcategories:
Supply chain planning systems support planning of supply and demand, both within the production facility and across the supply chain. These systems often incorporate concepts and techniques such as demand forecasting, predictive analytics, rapid simulation, theory of constraints, demand-driven material requirements planning, in-memory computing, and linear programming.
Supply chain execution systems carry out those plans on a day-to-day or hour-by-hour basis and react to events or disruptions. These systems can incorporate a number of technologies, such as bar-coding, radio-frequency identification (RFID), conveyor systems, warehouse automation, automated material handling systems, robotics, global positioning systems, and machine-to-machine communications.
The fundamentals of supply chain management have been known and practiced for decades. Early in the development of material requirements systems, practitioners saw the need to extend the concept into distribution. This led to the development of distribution requirement planning systems in the 1970s. Through the 1980s and 1990s, supply chain management systems continued to evolve with development of systems for sales forecasting and demand planning, advanced warehouse management, and sales and operations planning. The term “supply chain management” first gained a foothold in the mid-1990s to encompass all these disciplines.
Today, the rise of global supply chains and energy-driven transportation costs are providing renewed impetus for adoption. Manufacturers and distributors cannot compete without the visibility into their increasingly complex supply chains, driven in part by the increasing use of contract manufacturers in overseas locations. The cost savings in offshore manufacturing can quickly be lost if transportation and inventory costs skyrocket because of an inability to plan material and resource requirements over long lead times. Supply chain management systems, therefore, are a necessity in today’s global economy.
Organizations that have successfully implemented supply chain management systems enjoy a number of benefits, including:
Lower inventory levels and improved order fill rates
Ability to respond more quickly to supply disruption or changes in customer demand
Shorter customer order lead times due to better replenishment planning, allowing the organization to compete on delivery times

TECHNOLOGY TRENDS 2019
TECHNOLOGY TRENDS 2019 © 2019 COMPUTER ECONOMICS, INC. UNAUTHORIZED DISTRIBUTION OR REPRODUCTION IS PROHIBITED.
PAGE 14
Better utilization of assets such as warehouse space and transportation fleet equipment, which leads to a reduction in working capital
On the other hand, supply chain management systems are complex applications, and organizations seeking to implement them often face challenges. In a complex supply chain, it is unusual to have all the information needed for supply chain management in a single system, necessitating the complex integration of information from disparate systems internally and externally with customers and suppliers. In addition, supply chain professionals—those who know how to manage complex supply-and-demand plans and the software that supports them—are in short supply. Finally, supply chain management systems can be complex undertakings, and the total cost of implementation and ongoing support can exceed budget.
Because of the wide variety of solutions and capabilities under the supply chain management umbrella, the market is highly fragmented. Nevertheless, we put technology providers in four broad categories. The first category is large application suite providers that have integrated supply chain management offerings. The big guns in enterprise software offer integrated suites that include a wide variety of business applications. Their offerings, therefore, are extensive. SAP and Oracle top the list. The third is Infor, which has recently been making new investments in supply chain visualization and collaboration capabilities.
The second category consists of best-of-breed supply chain management specialists. This category includes larger providers of integrated suites, such as Descartes Systems Group, Fleetmatics (owned by Verizon), JDA Software Group and Manhattan Associates. In addition, there are many smaller specialists focused on specific categories, including E2open, Kinaxis, and Steelwedge Software (acquired by E2open). IBM, through its acquisition of Sterling Commerce, also is in this category. The list of supply chain mangagement specialists is long, especially when providers to niche industries are included. The third category is midtier application suite providers that combine some supply chain management capabilities with their ERP offerings. These are similar to the first category, but they have less size and scale than SAP, Oracle, and Infor. They include Aptean, Epicor, IBS Software, IFS AB, Microsoft, and QAD. The last category is companies that let customers outsource their supply chain processes. This approach is attractive to organizations that do not see SCM as a core competency but still seek its benefits. This list includes well-known players such as Accenture, Capgemini, IBM, Infosys, and many others. Third-party logistics providers include DB Schenker, DHL, FedEx, Kuehne + Nagel, UPS, and others.

TECHNOLOGY TRENDS 2019
TECHNOLOGY TRENDS 2019 © 2019 COMPUTER ECONOMICS, INC. UNAUTHORIZED DISTRIBUTION OR REPRODUCTION IS PROHIBITED.
PAGE 15
Technology Adoption Profile Figure 25 shows how supply chain management systems compare with other technology initiatives in the study on five metrics: adoption rate, investment rate, ROI success, TCO success, and satisfaction.
Adoption Rate: The adoption rate is moderate compared with other technologies in the study. The percentage of organizations that have supply chain management systems in place is within the middle one-third of the range, defined by the technologies with the highest and lowest adoption rates in the study.
Investment Rate: The percentage of organizations currently investing in this technology is low. Investors include organizations that plan new implementations or enhancements to existing systems within the next 18 months.
ROI Success Rate: Among those organizations that have adopted supply chain management systems, the percentage that is at least breaking even on investments within a two-year period is moderate when compared with other technologies in the study.
TCO Success Rate: The TCO success rate for supply chain management systems is moderate compared with other technologies in this study. The TCO success rate is defined as the percentage of adopters coming in at or at less than budget for implementation and ongoing support costs.
Satisfaction Rate: The satisfaction rate for supply chain management systems is low when compared with other technologies in the study.

TECHNOLOGY TRENDS 2019
TECHNOLOGY TRENDS 2019 © 2019 COMPUTER ECONOMICS, INC. UNAUTHORIZED DISTRIBUTION OR REPRODUCTION IS PROHIBITED.
PAGE 16
Stages of Adoption Figure 26 shows the percentage of organizations at each of the five adoption stages.
The stages are as follows:
No Activity: About 38% of IT organizations report no activity in regard to adoption of supply chain management systems. These organizations have not deployed the technology and are not researching or piloting an initiative.
Considering: The consideration stage includes the 12% of organizations that are investigating the potential benefits and risks of an implementation. This includes organizations that may be piloting the technology but have not yet decided to move to the next stage.
Implementing: The 6% of organizations at the implementation stage have plans to deploy the technology for the first time within an 18-month period.
In Place, No Further Activity: The 17% of organizations at this stage have supply chain management systems in place but have no plans to augment their systems with new functionality.
In Place, Increasing: About 27% of organizations have supply chain management systems in place and have budgeted additional money to expand the functionality of their systems.

TECHNOLOGY TRENDS 2019
TECHNOLOGY TRENDS 2019 © 2019 COMPUTER ECONOMICS, INC. UNAUTHORIZED DISTRIBUTION OR REPRODUCTION IS PROHIBITED.
PAGE 17
Adoption and Investment by Organization Size The adoption rate rises with organization size. Figure 27 shows that 28% of small, 55% of midsize, and 78% of large organizations have supply chain management systems in place. Those that are implementing or enhancing systems—the investors—include 25% of small, 41% of midsize, and 46% of large organizations.
We define small organizations as those with from $20 million to less than $350 million in annual revenue, midsize organizations as those with from $350 million to less than $1 billion in revenue, and large organizations as those with at least $1 billion in annual revenue.

TECHNOLOGY TRENDS 2019
TECHNOLOGY TRENDS 2019 © 2019 COMPUTER ECONOMICS, INC. UNAUTHORIZED DISTRIBUTION OR REPRODUCTION IS PROHIBITED.
PAGE 18
Customer Experience with ROI Figure 28 shows that 39% of organizations recorded positive ROI with their investment in supply chain management systems, compared with just 17% that failed to recoup their investment over a two-year period. Another 44% reached the break-even point.
Customer Experience with TCO About 19% of organizations exceeded budget while 7% came in at less than budget, Figure 29 shows. Another 74% successfully met their budgets with this technology. Managing TCO can be an issue with supply chain management systems, as with many enterprise systems.

TECHNOLOGY TRENDS 2019
TECHNOLOGY TRENDS 2019 © 2019 COMPUTER ECONOMICS, INC. UNAUTHORIZED DISTRIBUTION OR REPRODUCTION IS PROHIBITED.
PAGE 19
Satisfaction with Customer Experience Figure 30 shows that 40% of supply chain management adopters are satisfied or very satisfied with their systems. However, these systems receive a low satisfaction rating because of the higher levels of satisfaction with some other technologies in the study. About 12% of adopters are dissatisfied or very dissatisfied, and 48% are neutral.
.
TECHNOLOGY TRENDS 2019
TECHNOLOGY TRENDS 2019 © 2019 COMPUTER ECONOMICS, INC. UNAUTHORIZED DISTRIBUTION OR REPRODUCTION IS PROHIBITED.
PAGE 20
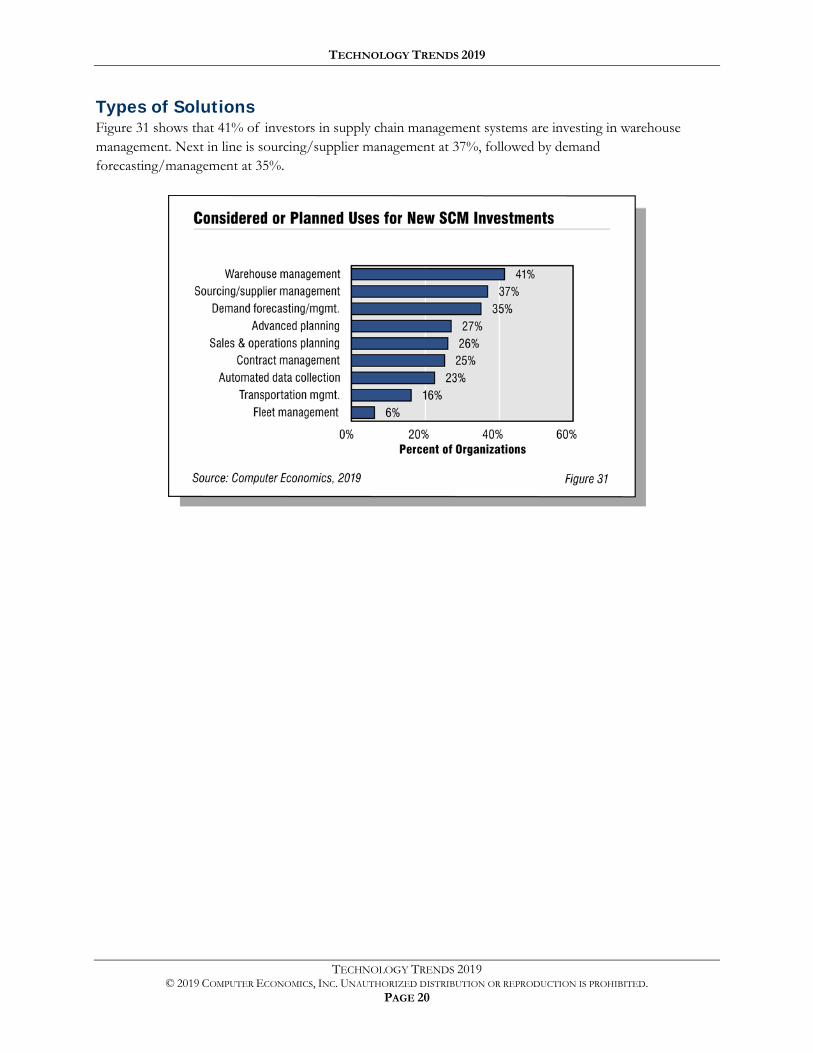
Types of Solutions Figure 31 shows that 41% of investors in supply chain management systems are investing in warehouse management. Next in line is sourcing/supplier management at 37%, followed by demand forecasting/management at 35%.

TECHNOLOGY TRENDS 2019
TECHNOLOGY TRENDS 2019 © 2019 COMPUTER ECONOMICS, INC. UNAUTHORIZED DISTRIBUTION OR REPRODUCTION IS PROHIBITED.
PAGE 21
Early Adopter and Future Technologies
This year, for only the second time, we decided to look not just at technologies in major use today but also ask our respondents about technologies that are a little more on the horizon or in the early adopter stage. We wanted to find out which of these newer technologies are really catching the eye of decision-makers and which are either too far out in terms of practical application or are simply in the news because of vendor or media hype. We listed 18 technologies that have gotten at least some attention in the media as potential future technologies for the enterprise. We deliberately did not provide a definition or explanation for each technology so that we could test whether our survey respondents had even a basic understanding of the terminology.
We gave our respondents five choices:
Not familiar with the technology
See no use for the technology
Possible use in the future
Currently implementing
Already in place
Of the 18 early adoption and future technologies, it appears that digital currencies may have the highest hype factor, with three-quarters of respondents saying they see no need for them in their organizations even though most are familiar with the concept.
On the other end of the spectrum, no-code/low-code and biometric authentication seem to be the real deal. Neither have widespread adoption today, but less than one-quarter of respondents do not see a possible use for them. Full results can be found in Figure 113.

TECHNOLOGY TRENDS 2019
TECHNOLOGY TRENDS 2019 © 2019 COMPUTER ECONOMICS, INC. UNAUTHORIZED DISTRIBUTION OR REPRODUCTION IS PROHIBITED.
PAGE 22
Early Adopter and Future Technologies
Technology Not Familiar
Don’t See Need
Possible Use Implementing In
Place
3-D Printing 1% 52% 30% 4% 13%
Drones 2% 65% 19% 4% 9%
Virtual Reality 2% 44% 43% 6% 5%
Autonomous Vehicles 3% 68% 25% 2% 2%
Biometric Authentication 3% 20% 48% 11% 18%
Digital Currencies 3% 75% 22% 0% 0%
Augmented Reality 5% 36% 48% 8% 3%
Digital Assistants 5% 30% 52% 10% 3%
Blockchain 6% 43% 47% 4% 0%
Quantum Computing 16% 59% 23% 2% 0%
Microchip Implants 20% 71% 9% 0% 0%
Volumetric Displays/Holograms 21% 46% 30% 2% 1%
No-Code/Low-Code 28% 24% 33% 11% 4%
Self-Healing Systems 31% 34% 30% 3% 2%
4-D Printing 39% 45% 14% 1% 1%
Electronic Tattoos 49% 45% 6% 0% 0%
Digital Twins 50% 25% 19% 4% 2%
Smart Dust 60% 36% 4% 0% 0%
Source: Computer Economics, 2019 Figure 113
In the remainder of this section, we define each of these early adopter and future technologies and provide the current view of IT organizations concerning them.
3-D Printing
3-D printing is certainly the most well-known of our early adopter and future technologies with only 1% of respondents saying that they were unfamiliar with the technology. 3-D printing makes a physical object usually from a digital model by layering materials until the object is formed. Despite the fact that it is the most well-known of our technologies, we do not necessarily expect 3-D printing to grow to as great an extent as some other technologies in the survey. At its heart, 3-D printing is a manufacturing technology. It is used to make things, and not all companies make things. Of course, 3-D printing does not have to be used to produce products for sale. In fact, it is usually best used by end users, so some companies could implement 3-D printing to produce spare parts, marketing displays, or anything else one can build with a digital model. It also can be used for one-off units, such as custom designs. It is unlikely to ever be used for mass production, where traditional manufacturing methods are far more cost-effective and

TECHNOLOGY TRENDS 2019
TECHNOLOGY TRENDS 2019 © 2019 COMPUTER ECONOMICS, INC. UNAUTHORIZED DISTRIBUTION OR REPRODUCTION IS PROHIBITED.
PAGE 23
faster. About 13% of organizations already use some form of 3-D printing. About 30% of the organizations we surveyed see a use for it in their organization, so it certainly has room to grow. As models get more sophisticated and more types of materials are available for 3-D printing, we expect it to grow. But its ceiling is still somewhat limited.
Drones
Drones encompass a large variety of unmanned aerial vehicles. They may be controlled remotely by an operator or fly autonomously to a designated destination. In the consumer world, this often means a small multirotor vehicle with a camera attached. Although drones were first developed for military applications, they are increasingly being used in business in a variety of applications, such as security, surveillance, aerial photography, surveying, and agricultural scouting. They are especially useful in environmental conditions that are unsafe, harsh, or too extensive for humans to cover. Eventually, drones may become vehicles for package delivery. For example, there has been experimentation with drones for pizza delivery. Although drones are not strictly an information technology, they rely on on-board computers and telecommunication systems and may interact with the organization’s IT systems. In this way, drones could be considered an edge device, like a connected machine tool.
A respectable 13% of organizations have drones in place or are implementing them. Another 19% see a future possible use for drones in their organizations.
Although deployment of drones in some applications is restricted by the Federal Aviation Administration (FAA) in the U.S., we expect this obstacle eventually to be overcome. Like many other early adopter technologies, drones augment and extend the capabilities of humans. We therefore believe drones will reach widespread business use within the next five years, especially in industries with a wide physical and geographic footprint, such as government, energy, utilities, agriculture, mining, and transportation.
Virtual Reality
Virtual reality (VR) is a computer-generated simulation usually using a headset designed to immerse the user into the simulation. Manufacturers of VR headsets include Oculus Rift (acquired by Facebook), Sony’s PlayStation VR, and others. Although the primary application of virtual reality today is in video gaming, VR also shows promise for business applications. For example, a surgeon could practice a medical procedure without touching a real patient. Or, a maintenance worker could be trained on a repair operation without having to touch production equipment. VR is also increasingly being used to provide a 3-D experience, for example, in touring a factory. A manufacturing engineer can even reconfigure the plant layout using 3-D copies (called digital twins) in a VR environment. VR is becoming a useful tool, and the use cases are growing.
About 11% of organizations in our survey have VR applications in place or are implementing them. Another 43% see a possible use for VR in the future, while only 2% are unfamiliar with the concept of VR.

TECHNOLOGY TRENDS 2019
TECHNOLOGY TRENDS 2019 © 2019 COMPUTER ECONOMICS, INC. UNAUTHORIZED DISTRIBUTION OR REPRODUCTION IS PROHIBITED.
PAGE 24
The growth in the use of VR in business is likely to be slower than most of the other technologies we surveyed. The use will probably be strongest in industry sectors such as manufacturing, healthcare, energy, utilities, transportation, and others where there is heavy use of capital equipment or there are issues where VR offers a safe way for experimentation, research and development, and training.
Autonomous Vehicles
Autonomous vehicles are similar to drones, except that they operate on land. Self-driving cars are one common example in popular culture. Robotic vacuum cleaners are another example on a smaller scale. In business, autonomous vehicles already can be found in warehouse management (autonomous forklifts), manufacturing (material movement), mining (mapping tunnels), and agriculture (harvesting, pruning). Anywhere a vehicle exists now, it needs a driver. As with drones, eliminating the driver frees up workers for higher-value roles, and most experts agree that once perfected, they will be safer than human-driven vehicles.
Only 4% of our respondents are implementing autonomous vehicles or already have them in place. But surprisingly, 68% do not see a use for them.
As with drones, autonomous vehicles extend the reach and productivity of humans. In the case of agriculture, the shortage of field workers is already accelerating the automation of farm work with autonomous vehicles. As mentioned, other industries such as mining, warehouse management, and manufacturing also represent opportunities to increase productivity and improve worker safety through the use of autonomous vehicles. We believe these benefits will increase the use of autonomous vehicles for the foreseeable future.
Biometric Authentication
Biometric authentication is the use of unique personal characteristics as credentials for authentication and access to computer systems or physical assets. Common factors include fingerprints, retinal or iris scans, and facial or voice recognition. Biometric authentication has a significant advantage over passwords as it does not rely on what the user knows, but something that the user is. Passwords can be weak, guessed, or stolen. They can also be forgotten. Other types of authentication tokens can be lost or stolen.
Given the increased security and convenience, it is no surprise that biometric authentication leads the way in our survey with 29% of organizations implementing it or already having it in place. A full one-fifth, on the other hand, do not see the need for biometric authentication.
One reason that many do not see the need for biometric authentication may be that it has one weakness. Unlike a password, biometrics cannot be changed. If a biometric is compromised (say, a file containing a fingerprint is stolen, or worse yet, criminals begin acting out the Hollywood scenario of using a severed finger to gain access), users cannot change their bodies and organizations cannot easily change the biometric authentication protocols. Biometrics also require specialized hardware. This hardware is getting less expensive, enough so that it can be found on most smartphones. But it is still a fairly expensive capability and requires constant upkeep and updating. In addition, despite some of its flaws, the security and convenience of biometric authentication likely will contribute to its continued growth over the next three to five years. In
TECHNOLOGY TRENDS 2019
TECHNOLOGY TRENDS 2019 © 2019 COMPUTER ECONOMICS, INC. UNAUTHORIZED DISTRIBUTION OR REPRODUCTION IS PROHIBITED.
PAGE 25
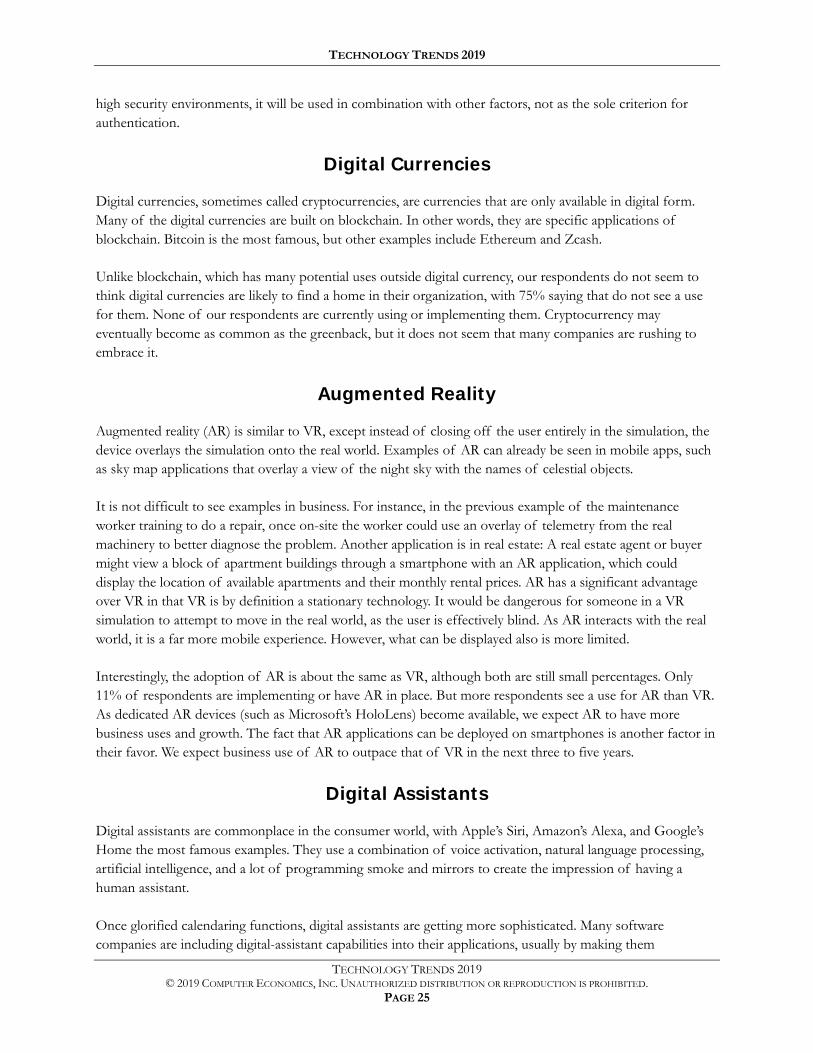
high security environments, it will be used in combination with other factors, not as the sole criterion for authentication.
Digital Currencies
Digital currencies, sometimes called cryptocurrencies, are currencies that are only available in digital form. Many of the digital currencies are built on blockchain. In other words, they are specific applications of blockchain. Bitcoin is the most famous, but other examples include Ethereum and Zcash.
Unlike blockchain, which has many potential uses outside digital currency, our respondents do not seem to think digital currencies are likely to find a home in their organization, with 75% saying that do not see a use for them. None of our respondents are currently using or implementing them. Cryptocurrency may eventually become as common as the greenback, but it does not seem that many companies are rushing to embrace it.
Augmented Reality
Augmented reality (AR) is similar to VR, except instead of closing off the user entirely in the simulation, the device overlays the simulation onto the real world. Examples of AR can already be seen in mobile apps, such as sky map applications that overlay a view of the night sky with the names of celestial objects.
It is not difficult to see examples in business. For instance, in the previous example of the maintenance worker training to do a repair, once on-site the worker could use an overlay of telemetry from the real machinery to better diagnose the problem. Another application is in real estate: A real estate agent or buyer might view a block of apartment buildings through a smartphone with an AR application, which could display the location of available apartments and their monthly rental prices. AR has a significant advantage over VR in that VR is by definition a stationary technology. It would be dangerous for someone in a VR simulation to attempt to move in the real world, as the user is effectively blind. As AR interacts with the real world, it is a far more mobile experience. However, what can be displayed also is more limited.
Interestingly, the adoption of AR is about the same as VR, although both are still small percentages. Only 11% of respondents are implementing or have AR in place. But more respondents see a use for AR than VR. As dedicated AR devices (such as Microsoft’s HoloLens) become available, we expect AR to have more business uses and growth. The fact that AR applications can be deployed on smartphones is another factor in their favor. We expect business use of AR to outpace that of VR in the next three to five years.
Digital Assistants
Digital assistants are commonplace in the consumer world, with Apple’s Siri, Amazon’s Alexa, and Google’s Home the most famous examples. They use a combination of voice activation, natural language processing, artificial intelligence, and a lot of programming smoke and mirrors to create the impression of having a human assistant. Once glorified calendaring functions, digital assistants are getting more sophisticated. Many software companies are including digital-assistant capabilities into their applications, usually by making them

TECHNOLOGY TRENDS 2019
TECHNOLOGY TRENDS 2019 © 2019 COMPUTER ECONOMICS, INC. UNAUTHORIZED DISTRIBUTION OR REPRODUCTION IS PROHIBITED.
PAGE 26
compatible with existing digital assistants. Digital assistants could help managers interact with daily metrics, assist salespeople in managing their leads and opportunities, or mimic virtually any spoken task expected of a mobile workforce. There are, however, security and privacy concerns. If you ask Alexa to give you your latest sales projections, for example, the record of that conversation would go to Amazon’s cloud for storage. Proprietary information should be handled with care. Of our respondents, 13% have digital assistants in place or are implementing them. Almost one-third (30%), do not see a use for digital assistants in the enterprise, possibly because of the security issues. Despite those issues, it appears digital assistants are here to stay. They are too convenient to ignore entirely. The breadth and depth of their use likely depends on working out the security and privacy issues, which could take some time
Blockchain
A blockchain is a secure distributed ledger or list of electronic records (blocks) that are linked using cryptography. As such, a blockchain can be used to record business transactions with a high degree of security and integrity. Although blockchain is the technology underlying digital currencies such as Bitcoin, blockchain itself has many applications, such as in financial transactions, smart contracts, supply chain management, food safety, and copyright ownership. It may soon be used to prevent certain types of cyberattacks, collect and store digital signatures, maintain the accuracy and privacy of electronic health records, and even protect against voter fraud.
Given the amount of hype around blockchain, it is surprising that none of the respondents report having some application of blockchain in place. In fact, despite all the media hype around blockchain, 49% percent of respondents say they have not even heard of it or do not see a use for it.
Despite the skepticism, we believe blockchain eventually will be used in many IT organizations where sensitive data exists or trust in the integrity of records is a must. It will probably not become the panacea that some analysts are predicting, but we do believe that it will ultimately play an important role in certain applications, such as pharmaceutical distribution and food safety, where an immutable record of the chain of custody is needed.
Quantum Computing
Quantum computing should not be viewed as an early adopter technology, as it does not yet have commercial applications. However, it has the power to be the most transformative. Traditional computers must work on one operation or calculation at a time. Quantum computers can theoretically perform thousands (possibly millions) of operations at the same time. They essentially are a massive set of parallel processors or a super computer. If perfected (and it should be said that some analysts find the idea impossible), a single quantum computer could put a super computer’s worth of power on a desk and significantly shrink the size and cost of data centers. Again, it should be stressed that no quantum computer is currently in commercial distribution. However, IBM and others have created working prototypes.

TECHNOLOGY TRENDS 2019
TECHNOLOGY TRENDS 2019 © 2019 COMPUTER ECONOMICS, INC. UNAUTHORIZED DISTRIBUTION OR REPRODUCTION IS PROHIBITED.
PAGE 27
Quantum computing is the least familiar of our technologies. Around 16% of respondents admit that they do not know what it is. Nearly 60% cannot imagine a use for it in their organizations, although we suspect this number to drop if working prototypes become feasible. Strangely, 2% of respondents say they are implementing quantum computing. We think these respondents are in error or have a time machine, as most experts think a viable quantum computer for use in an enterprise setting is at least a decade or two away.
It is not known exactly how long it will take for quantum computing to make its way into commercial distribution. Moreover, if and when quantum computing does become a viable technology, it is likely to only take hold in a small percentage of organizations, probably those involved in scientific research.
Microchip Implants
Similar to electronic tattoos (see below), microchip implants are likely to be deployed first in healthcare. Microchip implants, simply put, are small devices placed under the skin. They usually function in a similar way to NFC chips in phones, although other sensors can be added. For most people, their experience with these implants starts with the family pet. Implants can be used to track lost pets. As such, they can also be used with people to monitor life signs or even blood sugar for diabetics. But to get out of the healthcare niche, implants could also be used as biometric authentication or security tokens. Implants could also be used to pay for goods and services exactly the way people pay with their phones now. In Sweden, thousands of people have already received microchips in their hands to pay for goods. They also can be used as a government ID and rail card. Not surprisingly, this technology is not in use or being implemented by any company taking our survey. There is much to overcome, including the general feeling of discomfort with the idea. But interestingly, more respondents, 9%, saw a use for implants than for the much-less-invasive electronic tattoo.
Volumetric Displays/Holograms
Volumetric displays are simply what we think of as the holograms common in the movies, at least since Princess Leia famously said, “Help me, Obi-Wan Kenobi, you’re my only hope.” They are simply devices that can create a 3-D image. Rather primitive volumetric displays already exist in the home product market as desk lamps and novelties. One obvious first business use might be 3-D presentations. But the uses should go beyond that. Holograms of equipment in the field could be used to aid maintenance personnel. Holograms could be used as part of medical diagnostics and training. In fact, volumetric displays may simply be looked on as the natural extension of virtual and augmented reality. They free the user from the associated head gear. As such, any use for VR and AR could be applied to volumetric displays. Surprisingly, 3% of companies surveyed say that they are already using or implementing volumetric displays. Nearly one-third more (30%) see a use case in their business. Because this technology is not as advanced as virtual and augmented reality, we expect its growth to be slow. Many of the use cases overlap, and companies that invest in VR or AR are less likely to jump right over to

TECHNOLOGY TRENDS 2019
TECHNOLOGY TRENDS 2019 © 2019 COMPUTER ECONOMICS, INC. UNAUTHORIZED DISTRIBUTION OR REPRODUCTION IS PROHIBITED.
PAGE 28
volumetric displays. However, in the long run, we expect this technology to have a longer lifespan if only as a marketing tool to unsuspecting shoppers inundated with dozens of holograms as they walk through the mall.
No-Code/Low-Code
No-code and low-code environments use graphical interfaces to create user applications, with fewer experienced coders involved or even none at all. No-code/low-code options allow for end users to create and automate work processes and even to develop customer-facing applications with minimal assistance from IT. They usually rely on set user experiences and drag-and-drop capability. While low-code and no-code are similar, they usually have different use cases. Low-code usually requires at least one experienced developer to customize or write crucial bits of the code. Low-code environments are usually deployed to make efficient use of application developer time as their expertise is not common among users. The drag-and-drop interface allows the developer to reuse or rearrange existing code when possible to streamline the process. No-code usually bypasses the developer entirely and is typically reserved for simple tasks where the end user understands the needs of the application and can easily create it using the existing interface. As an example, no-code can be deployed in a data-intensive organization for creating reports or dashboards. Healthcare organizations can use no-code to set up medical trials. While not yet in common use, no-code/low-code environments are in place or being implemented in 15% of organizations that responded to our survey. We expect the number to grow because the flexibility, agility, and reduced costs are definitely attractive. However, it should be pointed out that some believe no-code/low-code leaves companies open to vulnerabilities, either through the reuse of bad code or through errors from undertrained workers who accidentally expose data. Others see no-code specifically as another form of shadow IT and something that should be tightly controlled. Despite all of these concerns, the benefits are likely to outweigh the negatives.
Self-Healing Systems
Self-healing systems refer to any IT system that recognizes anomalies or poor function and can correct them in an autonomous manner. The most common example is the self-healing database, which can detect intrusions or inappropriate changes and correct itself, always keeping itself “tuned” for optimal access. Self-healing systems will likely grow far beyond databases in time, however, and will find their way into many IT systems. Roughly 40% of the IT budget today is allocated to personnel, and a large percentage of those personnel are dedicated to supporting and managing systems. If those systems can manage and support themselves, it represents a great cost savings. It also results in more accurate data, more uptime, more efficient scaling up and down of resources and, perhaps most importantly, more secure systems. Systems that can be programmed to respond to anomalies can be programmed to defend themselves in case of attack. Self-healing or self-managing systems are being offered, or soon will be offered, by most of the top software providers including Oracle, Microsoft, IBM, and SAP. More offerings are likely to come in the near future.

TECHNOLOGY TRENDS 2019
TECHNOLOGY TRENDS 2019 © 2019 COMPUTER ECONOMICS, INC. UNAUTHORIZED DISTRIBUTION OR REPRODUCTION IS PROHIBITED.
PAGE 29
About 5% of companies we surveyed already have or are currently implementing some form of self-healing system. Another 30% see the use of such a system. Still, 31% have not heard of the term. We expect that to change shortly and for self-healing technology to enter into more mainstream use in the coming years.
4-D Printing
4-D printing uses the same techniques and technology as 3-D printing. However, the result is a product that can react and move under certain stimuli such as heat or electrical current. 4-D printing could be used in consumer products to adapt to temperature or humidity, perhaps sealing a leak or creating clothing that adapts to the environment around it. Healthcare could use 4-D printing to create biomonitors that react to signals from the body. Just as 3-D printing might have a ceiling for use inside the enterprise, 4-D printing might have a similar limit. Only 14% of our respondents see a potential use for 4-D printing, and 2% have it in place or are currently implementing the technology.
Electronic Tattoos
Electronic tattoos are simply flexible electronics applied to the skin. Usually no thicker than a sheet of paper, these temporary tattoos, like those you can get at an amusement park, can contain a wide array of sensors, Wi-Fi connection, and even the ability to display information. The obvious first application for electronic tattoos would be in healthcare. They could be used to monitor heart rate, temperature, or other vital signs in patients without the use of invasive or uncomfortable equipment. However, this is really only the first step. Electronic tattoos could be used as tokens for security just like sending a PIN to your phone, but with biometric sensors that ensure that recipients are who they say they are. Flexible electronics could be used to make a smartphone out of your arm or forehead. Adventurous marketers could rent space on people. Basically, take any existing function of a smartphone, and imagine it sticking to a human. None of our respondents have deployed electronic tattoos in their organizations, but electronic tattoos exist. They are just not readily made for commercial use. Only 6% of our respondents see a use for them at their companies. So perhaps this is more the stuff of science fiction than an enterprise-worthy technology.
Digital Twins
Digital twins create a digital simulation of some entity, such as a piece of capital equipment, a data center, a production line, or other physical environment, using real-time sensors and other data to get as clear a picture of the physical object as possible. The digital twin allows for a maintenance staff member, a plant manager, or an IT manager to get an understanding of an object without being present. The classic example of the use of digital twins would be for a piece of machinery on a production line. Using telemetry from the real machinery, the digital twin monitors the health of the system. A change in noise or

TECHNOLOGY TRENDS 2019
TECHNOLOGY TRENDS 2019 © 2019 COMPUTER ECONOMICS, INC. UNAUTHORIZED DISTRIBUTION OR REPRODUCTION IS PROHIBITED.
PAGE 30
temperature might trigger an alarm that there is a potential problem. The maintenance worker could examine the digital twin before being dispatched to make a repair. The digital twin would also have all maintenance records, logs, manuals, and other data needed to diagnose the problem. This would increase the chance that the maintenance personnel dispatched to the problem could diagnose it right the first time, have the appropriate parts and tools to fix the device, and limit unplanned downtime. Paired with AI, IoT sensors, and machine learning, digitals twins can often save significant downtime and expense in repairs. However, digital twins do not have to be limited to a single piece of machinery. Plant managers can use digital twins to route production around problem equipment or manage personnel on the shop floor. Digital twins can be used for fleet management or agricultural production as well. About 6% of those we surveyed are implementing or already have digital twins in place. We expect that, as IoT and AI grow within organizations, digital twins will be one of the first projects in companies with the appropriate equipment to be “twinned.”
Smart Dust
Smart dust, or more accurately, microelectromechanical systems, are perhaps the most frightening technology on our list. Basically they are tiny computers the size of sand grains with their own power supply, sensors, and connectivity that can collect, store, and transmit data. They can float through the air and stay in a space like dust particles. And they can be printed by a 3-D printer. Before you get too worried about the idea of being spied on by a computer that just looks like dust on your desk, there are amazing possibilities for this technology. Smart dust can be used to measure anything in an environment from temperature to vibrations to light or noise. They could be used to test corrosion in metal before it fails, preventing a plane crash or a factory shutdown. They could float around a warehouse taking inventory or be used for security by monitoring people. The uses are endless, and therefore also frightening.
Only 40% of our respondents have even heard of smart dust, and only 4% saw an enterprise use for the product. But we expect that to change somewhat as the concept matures. As with any new product, smart dust is expensive to make at scale, and the privacy issues are not small. Not to mention that this needs to be a product that is perceived as disposable, further driving the need for cost reduction in its manufacture. There is a long way to go to make it practical.
Predicting the future is never easy. Our list of early adopter and future technologies undoubtedly misses technologies we will be talking about in earnest next year. Some are destined for obscurity. But we believe the bulk of this list will need to be on the radar of IT leaders in the near future. The technologies, or at least some aspect of their implementation, will be their responsibility. Each year we intend to track these technologies as well as other technologies that may emerge. Some will no doubt become a full part of our Technology Trends survey as they gain favor. Even for the ones that do not, we believe this data will help cut through the hype and see what is on the horizon for business adoption.

TECHNOLOGY TRENDS 2019
TECHNOLOGY TRENDS 2019 © 2019 COMPUTER ECONOMICS, INC. UNAUTHORIZED DISTRIBUTION OR REPRODUCTION IS PROHIBITED.
PAGE 31

TECHNOLOGY TRENDS 2019
TECHNOLOGY TRENDS 2019 © 2019 COMPUTER ECONOMICS, INC. UNAUTHORIZED DISTRIBUTION OR REPRODUCTION IS PROHIBITED.
PAGE 32
Methodology and Participants The survey behind this study was conducted by Computer Economics between September and December 2018. We solicited organizations worldwide to participate in an online survey through a variety of means, with the majority responding to email solicitation. We evaluated each respondent to ensure they were qualified, and we validated responses for internal consistency. In some cases, correspondence with respondents was conducted to clarify or correct responses. Nonqualified responses were eliminated from the sample.
The final sample includes 249 organizations, with 45% from North America, 39% from Europe, the Middle East, and Africa (EMEA), 9% from the Asia-Pacific region, and 6% from Latin America.
By sector, manufacturing made up 23.3% of the sample; professional and technical services, 21.1%; financial services, 14.4%, government/nonprofit, 11.1%; utilities, 7.9%; retail and wholesale distribution, 7.2%; healthcare, 5.6%; construction and trade services, 5.0%; and other sectors, 4.4%.
Small organizations with from $20 million to $350 million in annual sales made up 60% of the sample, midsize organizations with from $350 million to $1 billion in sales accounted for 23% of the sample, and large companies with more than $1 billion in annual sales made up 17% of the sample.