1Strategic Social Plan Social and Economic Indicators February, 2004.
38
1 Strategic Social Plan Social and Economic Indicators February, 2004
-
Upload
annika-aliff -
Category
Documents
-
view
221 -
download
2
Transcript of 1Strategic Social Plan Social and Economic Indicators February, 2004.
1 Strategic Social Plan
Social and Economic Indicators
February, 2004
2 Strategic Social Plan
Overview
SSP Vision and Goals
How do we measure progress Indicators – what, why, who
Key indicators for social and economic development

3 Strategic Social Plan
SSP Vision
Healthy, educated, distinctive, self-reliant and prosperous people living in vibrant, supportive communities within sustainable regions.

4 Strategic Social Plan
SSP Goals
Vibrant communities and regions in which people actively participate in their collective well-being.
Sustainable regions based on strategic investment in individuals, families and communities.
Self-reliant, healthy, educated individuals and families living in safe, nurturing communities.
Integrated and evidence-based policy development and monitoring as the foundation for the design, delivery and evaluation of programs and services.
5 Strategic Social Plan
Indicators
What are they?
Why have them?
Who picked them?
Where does the information come from?
6 Strategic Social Plan
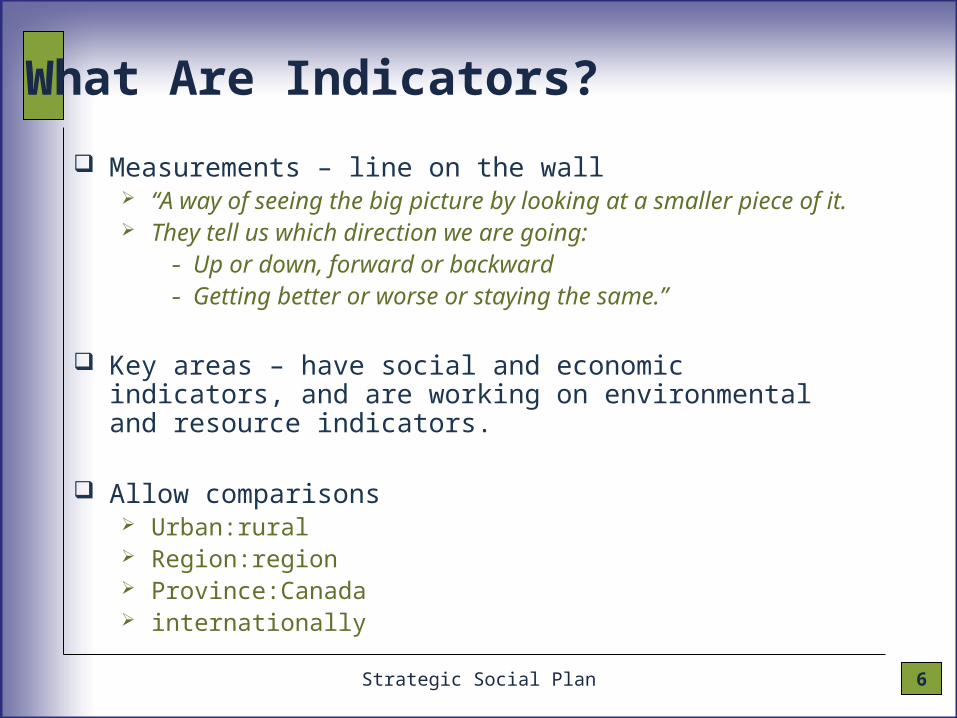
What Are Indicators?
Measurements – line on the wall “A way of seeing the big picture by looking at a smaller
piece of it. They tell us which direction we are going:
- Up or down, forward or backward- Getting better or worse or staying the same.”
Key areas – have social and economic indicators, and are working on environmental and resource indicators.
Allow comparisons Urban:rural Region:region Province:Canada internationally

7 Strategic Social Plan
Why Have Indicators?
Measure our progress – change over time Are we doing the right things? Are we doing them the right way? Are we making any difference?
Helps us focus on the real problems not just symptoms see the bigger picture recognize common goals
- develop collaborative solutions

8 Strategic Social Plan
Who Picked The Indicators?
Key social and economic indicators In use nationally and internationally.
Selected by Dr. Doug May, Memorial University.
Advice from Premiers Council, Regional Steering Committees, university academics and government departments.

9 Strategic Social Plan
Where did the Information Come From?
Memorial University Government of NL
Education Finance Health and Community Services Human Resources and Employment Industry, Trade and Rural Development Justice Tourism, Culture and Recreation Youth Services and Post-Secondary Education Women’s Policy Office
Statistics Canada Human Resources Development Canada Canada Customs and Revenue Agency
10 Strategic Social Plan
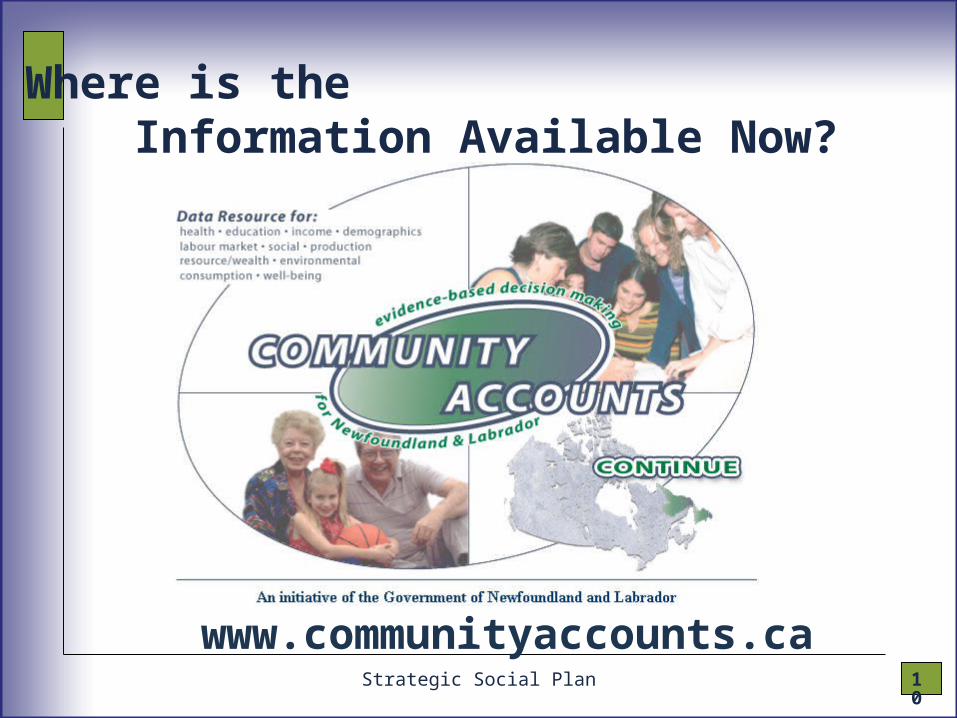
Where is the Information Available Now?
www.communityaccounts.ca
11 Strategic Social Plan
Who can access the data?
The Community Accounts are publicly accessible
Government and community organizations are encouraged to access the information to help them make informed decisions
Community Accounts have a wealth of social and economic information (environment and natural resources in progress) and can be accessed at neighbourhood, community, regional and provincial levels.

12 Strategic Social Plan
Quality of Life
Half of people surveyed in the province in 2002 said their lives were better than they were five years ago
63% rated their quality of life as Very Good to Excellent ranges from 67% in NE Avalon to 57% in
Cormack-Grenfell SSP Region
13 Strategic Social Plan
Healthy People
Disease Mortality rates for heart attacks and
strokes, etc down by about half since 1979 but… compared to Canada heart attacks for both men and women are
about 20% higher strokes, etc. are about 31% higher for men
and 18% higher for women

14 Strategic Social Plan
Healthy People
Length of Life Living longer than we used to but…
Compared to Canada we don’t live as long- NL men 75.2 years, NL women 80.2 years- Cdn men 76.3 years, Cdn women 81.7 years
NL women live disability free longer than Canadians but NL men do not

15 Strategic Social Plan
Healthy People
LifestyleCompared to Canada… Less physically active; women less active
than men Smoking rate declining but still higher
Daily smokers (population age 12+)- 24% in St. John’s - 33% for Health Labrador- NL – 25%- Canada – 21%
Heavy drinking rates are higher 40% of men and 16% of women drinkers
16 Strategic Social Plan
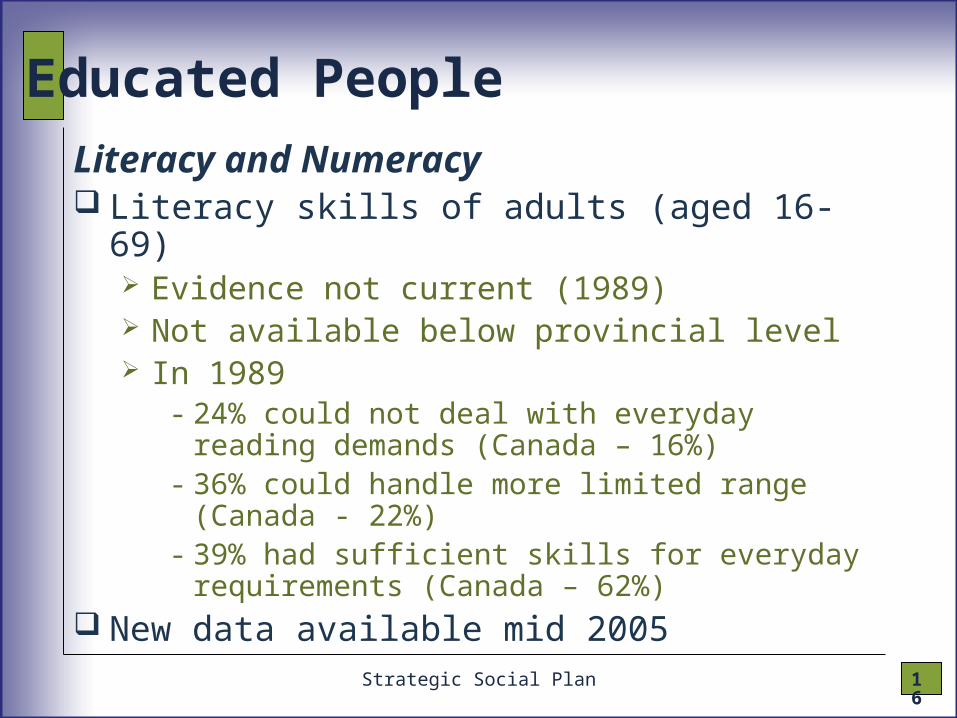
Educated PeopleLiteracy and Numeracy Literacy skills of adults (aged 16-69)
Evidence not current (1989) Not available below provincial level In 1989
- 24% could not deal with everyday reading demands (Canada – 16%)
- 36% could handle more limited range (Canada - 22%)
- 39% had sufficient skills for everyday requirements (Canada – 62%)
New data available mid 2005
17 Strategic Social Plan
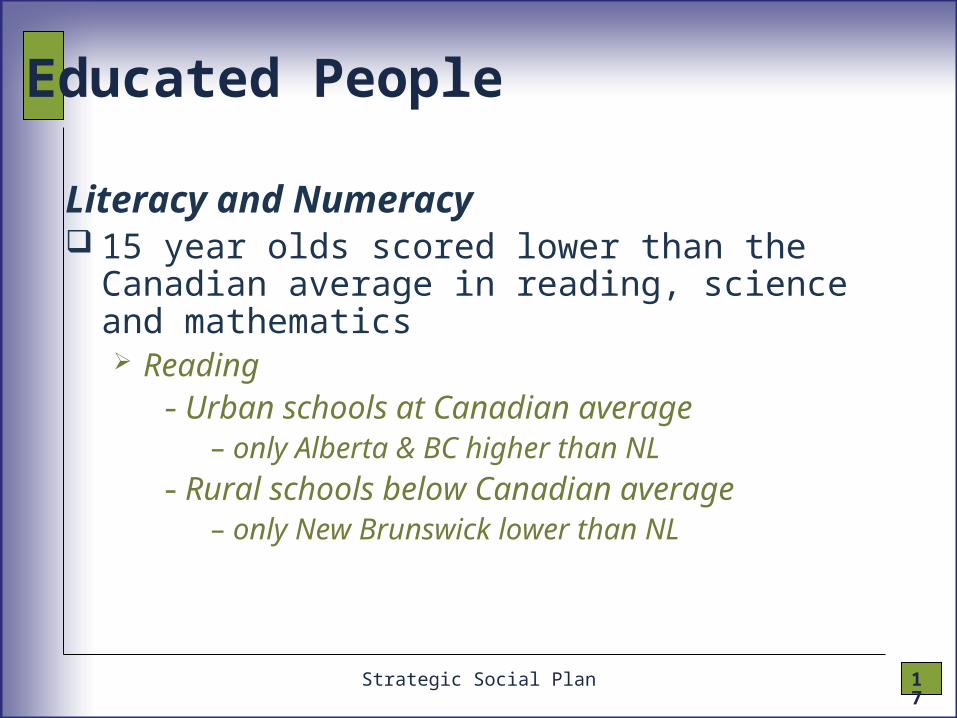
Educated People
Literacy and Numeracy 15 year olds scored lower than the
Canadian average in reading, science and mathematics Reading
- Urban schools at Canadian average– only Alberta & BC higher than NL
- Rural schools below Canadian average– only New Brunswick lower than NL

18 Strategic Social Plan
Educated People
Education levels of population In 2001 compared to 1979
Higher proportion has completed high school
Higher proportion with university degrees
Three-quarters of high school graduates now enroll directly in college or university

19 Strategic Social Plan
Educated People
Regional Variations - Ages 25-29 Regional Variations - Ages 25-29 No HS Univ Grad
NE Avalon 11% 28%Labrador 17% 8%Central 28% 11%Cormack-Grenfell 28% 12%Eastern 28% 9%Avalon 30% 8%
Province 21% 18%Canada 15% 26%

20 Strategic Social Plan
Income and equity Personal income per capita is increasing but…
- 25% lower than Canada over past decade - 1999 : NL - $15,500, Can - $21,300
– NE Avalon - $18,400– Labrador - $18,100– Cormack-Grenfell – $14,000– Eastern –$13,900– Central – $13,900– Avalon – $13,200
Prosperous and Self-reliant People

21 Strategic Social Plan
Prosperous and Self-reliant People
Assets Compared to Canada in 2001…
More people own their own homes- 78% in NL vs. 66% for Canada
– Range: 70% in NE Avalon to 89% in Avalon
Housing was about 47% cheaper- Average value of $76,283 in NL vs. $162,709
in Canada– Range: Eastern $52,519 to NE Avalon at
$111,249

22 Strategic Social Plan
Prosperous and Self-reliant People
Poverty Based on after-tax income in 2000
18% of children were living in poverty up from 15% in 1991 higher than Canada at 13%
Based on Market Basket Measure – 2000 31.6% of children (Canada 16.9%) 61.3% of lone-parent families (Canada 35.6%) 20.9% of two-parent families with children (Canada
10.8%) 43.0% of elderly unattached individuals (Canada
11.7%)

23 Strategic Social Plan
Prosperous and Self-reliant People
Employment In 2001
52% in labour market worked all year- Range: Eastern 37% to NE Avalon at 64%
43% worked for an average of 25 weeks- Range: Eastern 61% to NE Avalon at 32%
5% could not find work at any time in 2001- Range: Eastern 2% to Avalon at 7%

24 Strategic Social Plan
Prosperous and Self-reliant People
Self-reliance Newfoundlanders and Labradorians depend
more on government transfers.
Most people who get social assistance only receive it for a short time.
Less than 20% of people who get social assistance receive it continuously for six or more years.

25 Strategic Social Plan
Safe Communities
Feeling Safe Most women and most men feel safe
walking alone in their neighbourhoods at night Considerably higher than Canada Fewer women than men
Crime Crime rate is lower than Canada Rate of sexual assault higher than for
Canada; almost all victims were women

26 Strategic Social Plan
Safe Communities
Children needing protection In July 2002 there were 5407 children in
need of protection- St. John’s Health Region –1824- Eastern – 782- Central – 650- Western – 1048- Grenfell – 55- Labrador - 1048

27 Strategic Social Plan
Vibrant, Distinctive and Supportive Communities
Business Environment 46% of all jobs in the Province were clustered
within four industry sectors in 2002: Public Administration 13% Health Care and Social Assistance 13% Retail Trade 10% Education 10%
Fish harvesting and fish processing in top four in Eastern Region; fish harvesting in Avalon.
Health Care and Social Assistance - at least 11% of jobs in all Regions except Labrador.

28 Strategic Social Plan
Top four industry sectors
NE Avalon – 51% Public Administration – 17% Educational Services – 12% Health Care & Social Assistance – 11% Prof., Scientific & Technical Service – 11%
Avalon – 44% Fish Processing – 13% Health Care & Social Assistance – 11% Construction – 11% Fish Harvesting – 9%
29 Strategic Social Plan
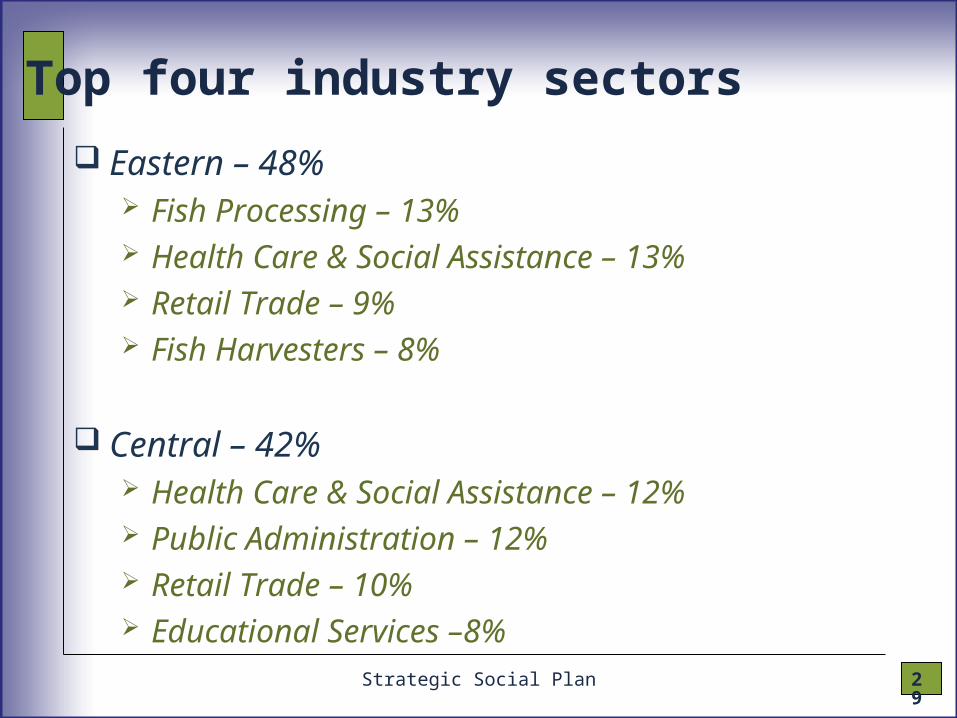
Top four industry sectors
Eastern – 48% Fish Processing – 13% Health Care & Social Assistance – 13% Retail Trade – 9% Fish Harvesters – 8%
Central – 42% Health Care & Social Assistance – 12% Public Administration – 12% Retail Trade – 10% Educational Services –8%

30 Strategic Social Plan
Top four industry sectors
Cormack-Grenfell – 45% Health Care & Social Assistance – 18% Retail Trade – 10% Educational Services – 9% Public Administration – 8%
Labrador – 51% Public Administration – 20% Retail Trade – 14% Mining and Oil and Gas Extraction – 10% Educational Services – 7%
31 Strategic Social Plan
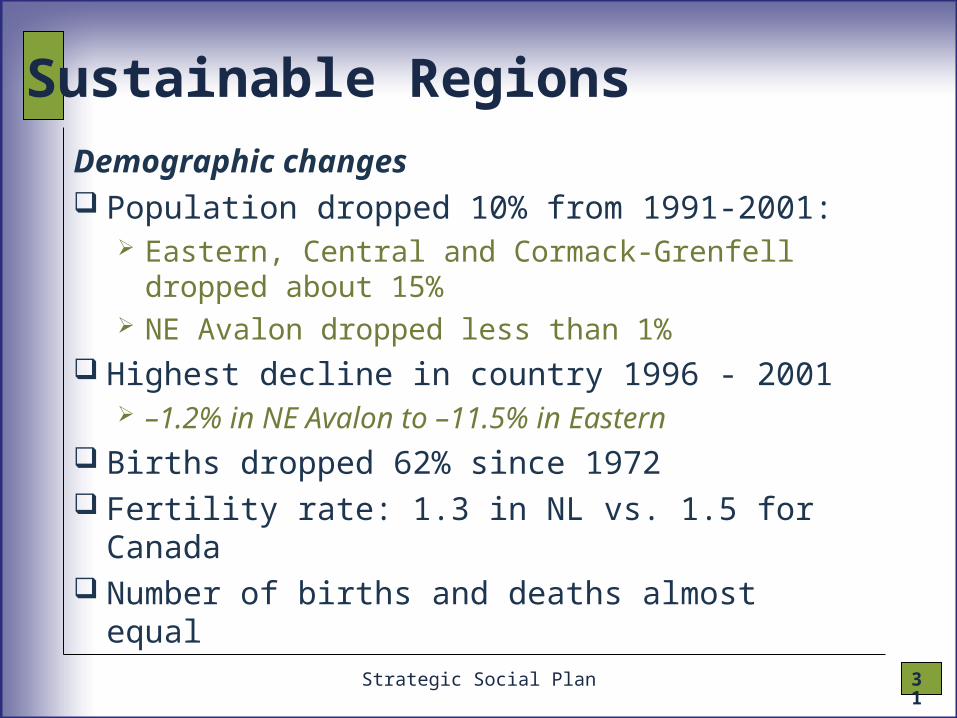
Sustainable Regions
Demographic changes Population dropped 10% from 1991-2001:
Eastern, Central and Cormack-Grenfell dropped about 15%
NE Avalon dropped less than 1% Highest decline in country 1996 - 2001
–1.2% in NE Avalon to –11.5% in Eastern Births dropped 62% since 1972 Fertility rate: 1.3 in NL vs. 1.5 for Canada Number of births and deaths almost equal
32 Strategic Social Plan
Sustainable Regions
Migration More people left the province than entered
between 1977 and 2002 Half of those who left the province in 1991
to 1996 had completed post-secondary About three-quarters of postsecondary
graduates remain in the province for at least one year after graduation
Half who left in 2001-02 were aged 15 to 29 but only 39% of those who entered
33 Strategic Social Plan
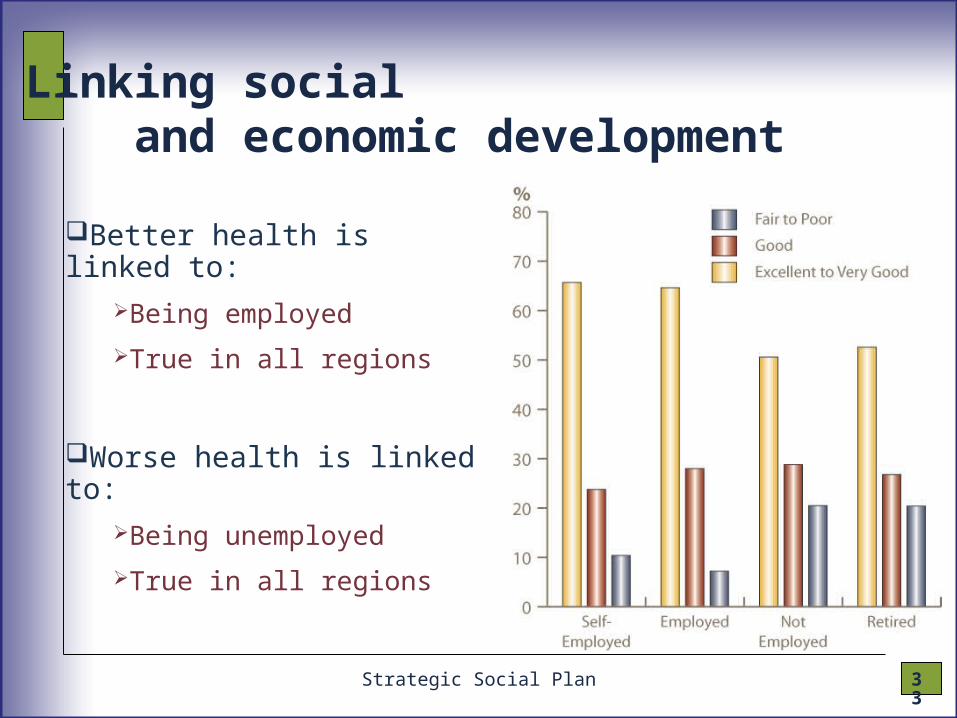
Better health is linked to:Being employed
True in all regions
Worse health is linked to:Being unemployed
True in all regions
Linking social and economic development

34 Strategic Social Plan
Better health is linked to:Higher income
True in all regions
Worse health is linked to:Lower income
True in all regions
Linking social and economic development
35 Strategic Social Plan
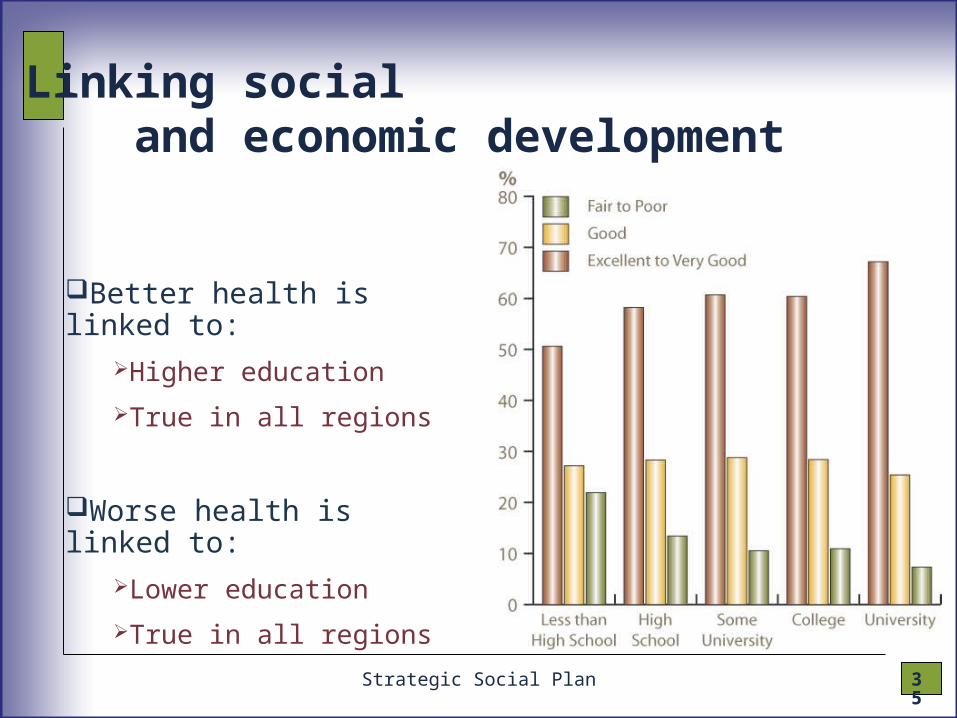
Better health is linked to:Higher education
True in all regions
Worse health is linked to:Lower education
True in all regions
Linking social and economic development

36 Strategic Social Plan
Education levels make a difference to income
In a 2001 survey, more than three-quarters of those with high school or lower earned less than $25,000 — about 60% of them earned less than $15,000.
Only about 20% of university graduates reported earning less than $25,000 in 2001.

37 Strategic Social Plan
Workshop Results
To the question “In 5 years time, which Indicators would need
to change positively to know we are impacting social and economic development in the province?”
Participants consistently replied “Lifestyle” Education levels and literacy Poverty levels Employment Diversification of business Number of children needing protection Population decline and net migration
38 Strategic Social Plan
Conclusions Using evidence for planning and decision making
requires a shift in thinking from using anecdotes to critical analysis of solid and reliable information
Need to reflect on evidence and ask question Does the evidence support the directions and
priorities my organization is taking?
This will allow us to: Understand the root causes Know our communities better Develop sound approaches to what works Target our programming and services better Focus on outcomes Be proactive in being accountable