1st Quarter FY2017 · PDF filefeedback through WeChat Virtual currency for corporate HR staff...
29
1 st Quarter FY2017 IR Presentation Zhaopin Limited November 2016
Transcript of 1st Quarter FY2017 · PDF filefeedback through WeChat Virtual currency for corporate HR staff...

1st Quarter FY2017
IR Presentation Zhaopin Limited
November 2016

This presentation contains forward-looking statements made under the “safe harbor” provisions of
Section 21E of the Securities Exchange Act of 1934, as amended, and the U.S. Private Securities Litigation
Reform Act of 1995. These forward-looking statements can be identified by terminology such as “will,”
“expects,” “anticipates,” “future,” “intends,” “plans,” “believes,” “estimates,” “confident” and similar
statements. Zhaopin may also make written or oral forward-looking statements in its reports filed with or
furnished to the U.S. Securities and Exchange Commission, in its annual report to shareholders, in
presentations and other written materials and in oral statements made by its officers, directors or
employees to third parties. Any statements that are not historical facts, including statements about
Zhaopin’s beliefs and expectations, are forward-looking statements that involve factors, risks and
uncertainties that could cause actual results to differ materially from those in the forward-looking
statements. Such factors and risks include, but not limited to the following: Zhaopin’s goals and strategies;
its future business development, financial condition and results of operations; its ability to retain and grow
its user and customer base for its online career platform; the growth of, and trends in, the markets for its
services in China; the demand for and market acceptance of its brand and services; competition in its
industry in China; its ability to maintain the network infrastructure necessary to operate its website and
mobile applications; relevant government policies and regulations relating to the corporate structure,
business and industry; and its ability to protect its users' information and adequately address privacy
concerns.
Further information regarding these and other risks, uncertainties or factors is included in the Company's
filings with the U.S. Securities and Exchange Commission. All information provided in this presentation is
current as of the date of the presentation, and Zhaopin does not undertake any obligation to update such
information, except as required under applicable law.
Safe Harbor Statement and Disclaimer
1

Who We Are
Zhaopin is a Leading Career Development Platform in China

Who We Are
A leading career development platform in China focused on the needs of job seekers
throughout their entire career lifecycle
Graduation Skills and
Personality Assessment
Job Changes Education & HR Training
Career Advancement
Campus Recruitment Assessment services White-collar recruitment
Vocational training High-end recruitment
platform
3 Market
Leadership Strategic
Expansion Product
Innovation Mobile
Dominance Inorganic Growth
Growth Pillars

4
Notes:
All the rankings are measured among major players that exclusively focus on recruitment and career related services during white-collar job seekers’ career lifecycle based on
publicly available information from third party and competitors.
(1) Source: a third-party survey report in 2014;
(2) Source: company data, registered users as of September 30, 2016;
(3) Source: company data, unique customers for the quarter ended September 30, 2016; a “unique customer” refers to a customer that purchases our online recruitment services
during a specified period. We make adjustments for multiple purchases by the same customer to avoid double counting. Each customer is assigned a unique identification
number in our information management system. Affiliates and branches of a given customer may, under certain circumstances, be counted as separate unique customers;
(4) Source: company data, average daily unique visitors for the quarter ended September 30, 2016;
(5) Source: iResearch, average monthly visits per user for the quarter ended September 30, 2016.
Our Strong Market Leadership Position and Track Record of Growth
12.4
Average monthly visits per user(5)
25%
Job placement rate(1)
125.2mn
Registered users(2)
391,782
Unique customers(3)
3.1mn
Average daily unique visitors(4)
Highest growth in revenue and no. of unique customers
#1
#1
#1
#1
#1 #1

What Our Market Opportunities Are

44
144
177
Zhaopin's active registered users
Zhaopin's registered users
Number of online job seekers in China
Under-penetrated and Growing User(1) Base
Multiplier effect of the number of placements as a result of increase in job changes per user
(3)
2016e 2018e (2)
125
Penetration
rate: 31%
(1)
Q1 FY2017
Highly Underpenetrated Job Seeker Market
Frequency of Changing Jobs(4)
Post-1970s: every 4-5 years
Post-1980s: every 2-3 years
Post-1990s: every 1.5 years
Online Job Seekers in China(1)
115.3 128.9
143.6 159.7
177.1
2014 2015 2016e 2017e 2018e
6
Zhaopin registered users vs. China online job seekers
(in millions)
(in millions)
Notes:
(1) Source: iResearch reports;
(2) Number of active registered users refer to the number of Zhaopin's registered users who logged on to the website during the past 12 months ended September 30, 2016;
(3) Zhaopin’s number of registered users as of September 30, 2016;
(4) Source: Zhaopin survey.

Large and Growing Employer Market
0.51
4.1
5.5
Zhaopin's number of unique customers
Number of online employers in China
Under-penetrated and Growing Employer(1) Base
Penetration
rate: 12%
(2)
2016e 2018e FY2016
Zhaopin unique customers vs. China online employers
(in millions)
Number of SMEs in China(1)
62.8 68.9 75.1 81.3 87.8
2014 2015 2016e 2017e 2018e
Number of Online Employers in China(1)
2.5 3.3
4.1 4.8
5.5
2014 2015 2016e 2017e 2018e
(in millions)
(in millions)
7 Notes:
(1) Source: iResearch reports; online employers refer to companies in China that use Internet to conduct business;
(2) Zhaopin’s number of unique customers for fiscal year 2016.
(1)

8
Deepen Our Penetration in Recruitment Value Chain
Zhaopin’s value-added services
• Priority listing
• Olive Branch
• Easy Hire
• Quick Feedback
Customers’ willingness
to pay
Actual cost 5%-10% 90%-95%
Untapped budget
What Employers Need
What We Can Offer
Source: Zhaopin survey conducted in 2014, which showed the average HR budget for filling a job vacancy is about one month salary.
• Increase recruitment efficiency for HR staff • Significant monetization potential for Zhaopin
Purchase services from other vendors
Spent on Zhaopin’s services
Basic recruitment
products:
~¥30/ job posting
~¥20-40/ resume
download
Low take rate
at the stage
Campus recruitment
service
Assessment service
Education & training service
Recruitment process
outsourcing
Highpin.cn

How We Are Capturing These Opportunities

Zhaopin’s market leadership(1) is leading to faster growth of jobseekers and employers
Competitive Advantages vs. Other Players
No. of Unique Customers(2) (in ‘000)
322 329 352 384 392 296 287 302 322 334
109% 115% 117% 119% 117%
Q1 FY16 Q2 FY16 Q3 FY16 Q4 FY16 Q1 FY17
Zhaopin Player 2
Zhaopin/ Player 2
105 110 115 120 125
94 96 100 104 106
112% 115% 115% 115% 118%
Q1 FY16 Q2 FY16 Q3 FY16 Q4 FY16 Q1 FY17
Zhaopin Player 2
Zhaopin/ Player 2
No. of Registered Users(2) (in millions)
10
High-end niche recruitment websites
General websites which offer recruitment
as part of their services
TMT vertical recruitment websites
Professional networking websites
Full-scale recruiting business model
Zhaopin offers full suite of services vs. vertical and niche players
Vertical players
Zhaopin/ Player 2 in Monthly Visits per User and Daily
Unique Visitors(3)
YoY Growth in No. of Quarterly Unique Customers(2)
21% 21% 21% 22% 22%
4% 3% 5%
7% 13%
Q1 FY16 Q2 FY16 Q3 FY16 Q4 FY16 Q1 FY17
Zhaopin Player 2
Notes:
Traffic of Player 2 (51job) does not include the traffic of the subsidiary that it acquired in 2015.
(1) Zhaopin's website is the most popular career platform in China as measured by average daily unique visitors in each of the 12 months ended September 30, 2016, the number of
registered users as of September 30, 2016 and the number of unique customers for the three months ended September 30, 2016. All the rankings are measured among players that
exclusively focus on recruitment and career related services during white-collar job seekers’ lifecycle; (2) Source: company data; (3) Source: iResearch.
207% 186%
153% 157% 172%
122% 125% 120% 117% 119%
Q1 FY16 Q2 FY16 Q3 FY16 Q4 FY16 Q1 FY17
Monthly visits per user
Daily unique visitors

Highly productive nation-wide sales network
Strong Sales and Marketing Capabilities to Support Growth
Sales Force of ~3,450
2 Call
Centers
5 Key
Industries
33
Regional Offices
Covering >250 Cities
Actively promote Zhaopin’s self-service platform and use of “Zhaopin Currency”.
11
= =
=
+ TMT
+ Finance
+ Real Estate
+ Consumer/ Retail
+ Education/ Training
Main Industry Sectors(1)
ꔷ Top 5 industries with highest recruiting demand in China
ꔷ Diversified customer portfolio to de-risk our business
Note: (1) According to company data of the quarter ended September 30, 2016.

Product vision: Good to Use + Simple to Use + Fun to Use
Focus on Delivering Value to Users (1/2)
Recent Product Innovation (1/2)
12
Priority Listing Quick Feedback Easy Hire Zhaopin Virtual
Currency
Premium charged for
higher search results,
generating better
recruiting results for
employers.
A PC and mobile-based
product that allows
employers to provide
instant feedback to job
applicants once the
application has been
submitted.
A mobile-based product
that provides employers
with a user-friendly
platform to track
applications to their job
postings and offer quick
feedback through WeChat
anytime anywhere.
Virtual currency for
corporate HR staff to
purchase various products
and services on Zhaopin’s
self-service platform.

Olive Branch (Invite job seekers to apply)
Direct Interview Scheduling (Request interviews with employers)
Employers send “Olive Branches” to selected
candidates allowing job seekers to instantly access
the job application once accepted, and employers to
access the job seeker’s contact information.
Direct Interview Scheduling is a mobile-based app that
allows job seekers to skip the application process and
directly request an interview. By removing a step in the
interview scheduling process, interview conversation rates have doubled.
Product vision: Good to Use + Simple to Use + Fun to Use
Focus on Delivering Value to Users (2/2)
Recent Product Innovation (2/2)
13

Past Now
Job applications Confirmed interviews
Uncertainty Certainty
Advertisement-based Transaction-based
Product roadmap: Matching → Stickiness → Monetization → Eco-system
Re-defining Recruiting Success for the Industry
Great Monetization Opportunities
Source: company data.
14

15
New Products & Services are Deepening Our Relationships and Value Proposition to Employers and Job Seekers
RPO provides one-stop recruiting professional
service.
Recruitment Process Outsourcing
NET offers a new means of
identifying talent irrespective of a
graduate's academic credentials, not taking
into account the prestige of his or her
university.
National Employability Test
Note:
Source: company data.
(1) Online car share service that recently acquired Uber China.
Focus on high-end job seekers with
RMB100K+ annual salary (~RMB200K for tier-
1 cities)
Highpin.cn
In Didi’s(1) app, Highpin has become its exclusive partner in its high-end recruiting column.
A training program for fresh-graduate
employees.
Training program
A new student loan program launched with
insurance agencies.
Student Loan

16
Highpin’s Revolutionary Dispatch Business Model
1.Corporate HRs post job vacancies
to Highpin Dispatch platform
2. Job vacancies automatically
dispatched to suitable individual
headhunters using Highpin’s
proprietary matching algorithm
3. Headhunters recommend CVs to
Corporate HRs
4. Corporate HRs download
interested CVs and pay a fee

Capture Rapidly Growing Mobile Audience
17
• A large number of quick
feedbacks are confirmed
through mobile channel
• Mobile serves a crucial role
for our strategy to redefine
recruiting success for the
industry
• Mobile plays an important
role in building Zhaopin’s
closed-loop transaction
platform
Source: company data.
Mobile Growth(1)
Daily unique visitors +106%
Daily page views +83%
Mobile as % of Total Internet Traffic
Daily unique visitors 61%
Daily page views 81%

Identify and match job
seeker needs at various
stages in their career
lifecycle through
personalized services.
Leveraging Big Data to Accelerate Expansion
Database 125mn
registered users(1)
& 44mn active
users(1)
Evolve our service offerings to deliver more value, opening up large opportunities across the human capital management industry 18
Leverage Zhaopin’s big
data pool to establish
virtual assets for users.
Eg. creditability, reputation.
Leverage data to create new marketing solutions for employers.
Eg. precision marketing.
Help HR staff make better
decisions with our market
and competition
intelligence based on our
proprietary data analysis.
Our career-related data can be leveraged to re-shape the
transaction value chain for other business categories.
Note: (1) Source: company data as of September 30, 2016.
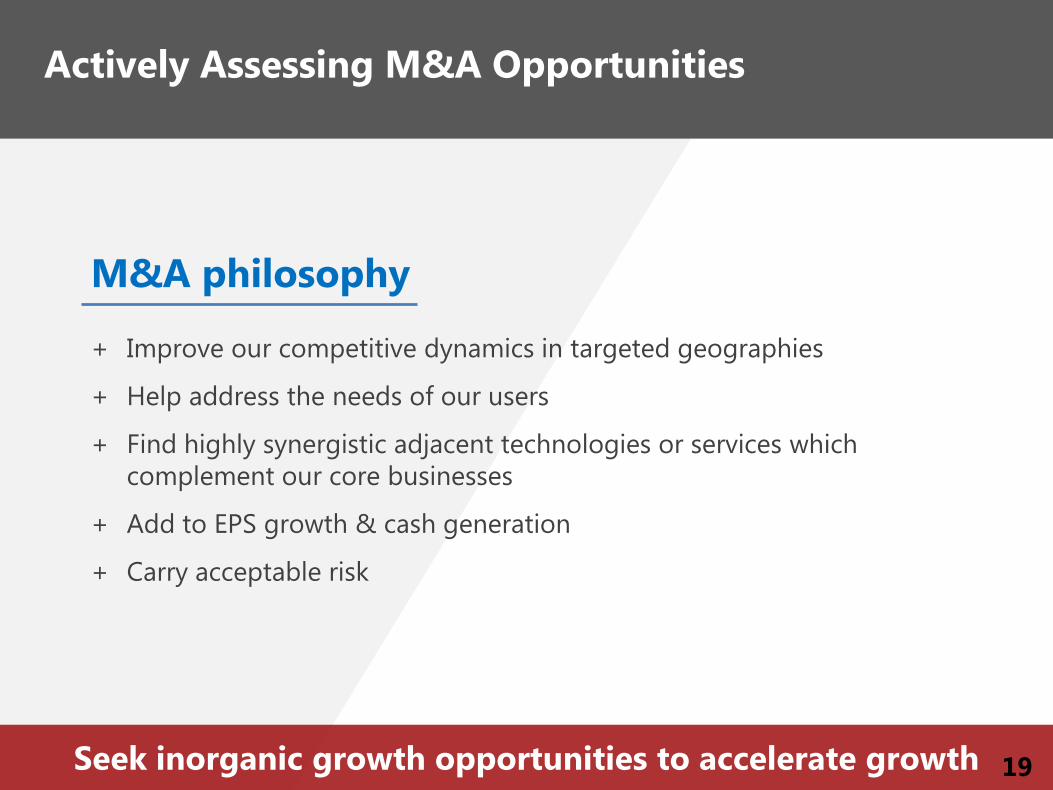
Seek inorganic growth opportunities to accelerate growth
Actively Assessing M&A Opportunities
19
M&A philosophy
+ Improve our competitive dynamics in targeted geographies
+ Help address the needs of our users
+ Find highly synergistic adjacent technologies or services which
complement our core businesses
+ Add to EPS growth & cash generation
+ Carry acceptable risk

Key Financial and Operational Metrics
* All quarterly financial numbers are unaudited.

10.8%
89.2%
Online recruitment services revenue
Other Services Revenue
• Campus recruitment
services, assessment
services and other
human resource related
services delivered
strong growth despite
intensified competition.
Key Financial Highlights for Q1 FY17
21
Notes:
(1) Total revenue and margins refer to the quarter ended September 30, 2016.
(2) Cash position as of September 30, 2016.
(3) All margins are calculated as a % of net revenue.
Total Revenue
+
RMB426.2mn +21.9% YoY
Online Revenue
+
RMB380.3mn +21.6% YoY
Cash Position
RMB2.3bn +2.6%
vs. 30-June-2016
Deferred Revenue
RMB717.1mn +0.6%
vs. 30-June-2016 Gross
Margin
91%
Operating Margin
20% Net Cash per ADS
US$5.87, +2.3% vs. 30-June-2016
Q1 FY17 Revenue Breakdown

Continuation of Strong Revenue Growth Underpinned by Growth in Unique Customers
222 257
335 418
510
322 392
FY2012 FY2013 FY2014 FY2015 FY2016 Q1 FY16 Q1 FY17
3,114 2,991 2,633 2,556 2,565
972 971
FY2012 FY2013 FY2014 FY2015 FY2016 Q1 FY16 Q1 FY17
821.5 908.9 1,079.8
1,289.9 1,542.9
349.5 426.2
FY2012 FY2013 FY2014 FY2015 FY2016 Q1 FY16 Q1 FY17
Total Revenue
(RMB millions) (‘000)
692.8 769.1 882.5
1,069.4
1,307.6
312.7 380.3
FY2012 FY2013 FY2014 FY2015 FY2016 Q1 FY16 Q1 FY17
Online Recruitment Services Revenue
(RMB millions)
Average Revenue per Customer (ARPU)
(RMB)
No. of Unique Customers
22

High Cash Generation and Strong Visibility on Forward Revenue
Strong cash balance and opportunities to re-invest
and grow the business
Technology and product –
personnel and development
costs for new products or
service offerings
Marketing – offline or online
advertising
Strengthen sales force
Explore M&A opportunities
23 Note: (1) Including restricted cash and cash equivalent, time deposits and restricted time deposits.
330.0 390.7
488.7
603.2
712.7 717.1
FY2012 FY2013 FY2014 FY2015 FY2016 Q1 FY17
Deferred Revenue (As of fiscal year-end or quarter-end)
(RMB millions)
617.8
944.9
1,536.7
1,910.1
2,289.2 2,348.7
FY2012 FY2013 FY2014 FY2015 FY2016 Q1 FY17
(As of fiscal year-end or quarter-end)
(RMB millions)
Cash Balance(1)
1
2
3
4

Strong Cash Flow Due to the Scalability of Online-focused Business Model
54
103
75 92
75
164
79
133
45
151
101
131
62
Q1 FY14 Q2 FY14 Q3 FY14 Q4 FY14 Q1 FY15 Q2 FY15 Q3 FY15 Q4 FY15 Q1 FY16 Q2 FY16 Q3 FY16 Q4 FY16 Q1 FY17
Operating cash flow (RMB millions)
Operating Cash Flow (Unaudited)
50
98
62
84
61
156
71
130
39
143
96
124
54
Q1 FY14 Q2 FY14 Q3 FY14 Q4 FY14 Q1 FY15 Q2 FY15 Q3 FY15 Q4 FY15 Q1 FY16 Q2 FY16 Q3 FY16 Q4 FY16 Q1 FY17
Free cash flow (RMB millions)
Free Cash Flow (Unaudited)
24

109 138 128 131 133 165 156 160 171 201 210 195 207
47% 49% 49%
47% 46% 49% 50%
48% 50% 50%
56%
49% 49%
Q1
FY14
Q2
FY14
Q3
FY14
Q4
FY14
Q1
FY15
Q2
FY15
Q3
FY15
Q4
FY15
Q1
FY16
Q2
FY16
Q3
FY16
Q4
FY16
Q1
FY17
as % of net revenues
25
Sales and Marketing Expenses and Margin (Unaudited)
(RMB millions)
165 194 185 192 200 228 216 225 246 287 274 271 300
71%
69%
70%
69% 69%
68%
69%
68%
71% 71%
73%
68%
71%
Q1
FY14
Q2
FY14
Q3
FY14
Q4
FY14
Q1
FY15
Q2
FY15
Q3
FY15
Q4
FY15
Q1
FY16
Q2
FY16
Q3
FY16
Q4
FY16
Q1
FY17
as % of net revenues
Operating Expenses and Margin (Unaudited)
(RMB millions)
56 56 56 61 67 63 60 65 74 86 64 76 94
24%
20% 21% 22% 23%
19% 19% 19% 22% 21%
17% 19%
22%
Q1
FY14
Q2
FY14
Q3
FY14
Q4
FY14
Q1
FY15
Q2
FY15
Q3
FY15
Q4
FY15
Q1
FY16
Q2
FY16
Q3
FY16
Q4
FY16
Q1
FY17
as % of net revenues
General and Administrative Expenses and Margin (Unaudited)
(RMB millions)
217 250 238 258 268 300 279 308 322 356 340 368 385
93%
88%
90%
93% 93%
89% 89%
93% 94%
88% 91% 92% 91%
Q1
FY14
Q2
FY14
Q3
FY14
Q4
FY14
Q1
FY15
Q2
FY15
Q3
FY15
Q4
FY15
Q1
FY16
Q2
FY16
Q3
FY16
Q4
FY16
Q1
FY17
as % of net revenues (RMB millions)
Gross Profit and Margin (Unaudited)
Notes:
All quarters refer to fiscal quarters. Zhaopin’s fiscal year refers to the 12 months ended June 30. All quarter numbers refer to unaudited financial results.
All quarterly margins and expenses percentage are calculated as a % of quarterly net revenue.
Sustained Levels of Profitability Despite Re-investment to Sustain Future Growth

26
62 59 63 74 77 78 69 86 82 73 59 98 87
26%
21% 24%
26% 27%
23% 22%
26% 24%
18% 16%
24%
21%
Q1
FY14
Q2
FY14
Q3
FY14
Q4
FY14
Q1
FY15
Q2
FY15
Q3
FY15
Q4
FY15
Q1
FY16
Q2
FY16
Q3
FY16
Q4
FY16
Q1
FY17
as % of net revenues
Non-GAAP Operating Income and Margin (Unaudited)
(RMB millions)
57 44 53 63 68 68 64 76 76 66 55 92 83
25%
16%
20% 23% 24%
20% 20% 23% 22%
16% 15%
23% 20%
Q1
FY14
Q2
FY14
Q3
FY14
Q4
FY14
Q1
FY15
Q2
FY15
Q3
FY15
Q4
FY15
Q1
FY16
Q2
FY16
Q3
FY16
Q4
FY16
Q1
FY17
as % of net revenues
Non-GAAP Net Profit and Margin (Unaudited)
(RMB millions)
Notes:
All quarters refer to fiscal quarters. Zhaopin’s fiscal year refers to the 12 months ended June 30. All quarter numbers refer to unaudited financial results.
All quarterly margins and expenses percentage are calculated as a % of quarterly net revenue.
(1) Excluding the one-time tax expense of RMB5 million arising from the ownership change of a consolidated affiliated entity, our net profit and net margin for Q1 FY15 would have
been RMB65 million and 22%, respectively.
Sustained Levels of Profitability Despite Re-investment to Sustain Future Growth(Cont.)
52 56 53 67 68 72 63 83 77 69 66 96 84
22% 20% 20%
24% 24% 21%
20%
25%
22%
17% 18%
24%
20%
Q1
FY14
Q2
FY14
Q3
FY14
Q4
FY14
Q1
FY15
Q2
FY15
Q3
FY15
Q4
FY15
Q1
FY16
Q2
FY16
Q3
FY16
Q4
FY16
Q1
FY17
as % of net revenues
Operating Profit and Margin (Unaudited)
(RMB millions)
47 41 43 56 60 62 58 73 71 62 62 90 81
20%
14% 17%
20% 21%
18% 19%
22% 21%
15% 17%
22%
19%
Q1
FY14
Q2
FY14
Q3
FY14
Q4
FY14
Q1
FY15
Q2
FY15
Q3
FY15
Q4
FY15
Q1
FY16
Q2
FY16
Q3
FY16
Q4
FY16
Q1
FY17
as % of net revenues
Net Profit and Margin (Unaudited)
(RMB millions)
(1)

Strong Growth in Key Operational Metrics
27
1.4
1.8 2.2 2.3
2.7 2.4
3.1
FY2012 FY2013 FY2014 FY2015 FY2016 Q1 FY16 Q1 FY17
No. of Completed Resumes
41.3
57.1 66.5
73.9 83.6
75.2
86.3
FY2012 FY2013 FY2014 FY2015 FY2016 Q1 FY16 Q1 FY17
56.6
76.9 89.5
100.8
120.0
104.8
125.2
FY2012 FY2013 FY2014 FY2015 FY2016 Q1 FY16 Q1 FY17
No. of Registered Users (As of fiscal year-end)
(in millions)
7.6 11.0
18.1
25.6
36.9
8.4 11.5
FY2012 FY2013 FY2014 FY2015 FY2016 Q1 FY16 Q1 FY17
No. of New Job Postings (in millions)
Average Daily Unique Visitors
(in millions)
(As of fiscal year-end)
(in millions)
Source: company data.

Check Out What’s New About Zhaopin
1. Twitter account: https://twitter.com/Zhaopin_com 2. Scan for ZPIN IR official account on WeChat!
28