Observers for the 1st Phase of Panchayat General Election ...
Upload
rohit-sahaiCategory
view
254download
0
PROJECT REPORT
on
ANALYSIS AND DESIGN OF UNDERGROUND DRAINAGE SYSTEM IN SRM UNIVERSITY KATTANKULATHUR CAMPUS (HOSTELS)
Submitted in partial fulfillment for the award of the degree
of
BACHELOR OF TECHNOLOGY
in
CIVIL ENGINEERING
by
ROHIT SAHAI 1011010177
Under the guidance of
Mr. J. Rajprasad
(Assistant Professor)
DEPARTMENT OF CIVIL ENGINEERING
FACULTY OF ENGINEERING AND TECHNOLOGY
SRM UNIVERSITY
(Under section 3 of UGC Act 1956)
SRM Nagar, Kattankulathur- 603203
Kancheepuram District
APRIL 201
1

TABLE OF CONTENT
CHAPTER TITLE PAGE
ABSTRACT iv
ACKNOWLEDGEMENT v
LIST OF TABLES viii
LIST OF FIGURES ix
ABBRIVATIONS x
1 OVERVIEW 1
1.1 OBJECTIVE 1
1.2 NECESSITY 1
1.3 SCOPE 1
1.4 METHODOLOGY 2
1.5 MAJOR DESIGN EXPERIENCE 2
1.6 REALISTIC DESIGN CONSTARINTS 2
1.7 REFERNCE TO CODES AND STANDARDS 3
1.8 APPLICATION OF EARLIER COURSE WORKS 3
1.9 MULTIDISCIPLINARY AND TEAM WORK 4
1.10 SOFTWARE USED 4
2 INTRODUCTION 5
2.1 GENERAL 5
2.2 LITERATURE RIVIEW 5
2
2.2.1 Soil profile 6
2.2.2 Effects of drainage 6
2.2.3 Hydrology 6
2.2.4 Annual drain flow 6
2.3 SUMMARY 6
3 OBJECTIVES AND SCOPE 8
3.1 OBJECTIVE AND SCOPE 8
3.2 CATCHMENT AREA 9
3.3 STORM DRAINAGE AND STANDARD POLICIES 9
3.4 SITE SELECTION 10
3.5 PREVIOUS YEAR STUDIES 11
3.6 DATA COLLECTED 11
3.7 POPULATION FORECAST AND AVERAGE DRY
WEATHER FLOW
14
3.8 PERCAPITA CONSUMPTION OF WATER 15
3.9 WASTE WATER CHARACTERSTICS 15
3.10 STORM WATER DRAINAGE 17
3.11 RUNOFF DEPTH 17
3.12 RUNOFF RATE 18
3.13 PIPE MATERIAL 24
3.13.1 Vitrified clay pipes 25
3.13.2 Properties of vitrified clay pipes 26
3.13.3 Economic considerations 28
3

3.14 JOINTS 29
3.14.1 Assemblies 29
3.15 SAFETY ISSUES 30
4 RESULTS AND DISCUSSIONS 31
4.1 BASIC INFORMATION 31
4.1.1 Preliminary Investigation for Design of Sewer System 31
4.1.2 Detailed Survey 32
4.1.3 Profile of Sewer System 32
4.2 SEWER CONSTRUCTION 38
4.3 LAYING OF PIPE SEWERS 40
4.3.1 Depth of flow 40
4.4 TRENCH DESIGN 44
4.4.1 Trench condition 44
4.4.2 Load producing forces 45
4.4.3 Load calculations 45
4.4.4 Type of bedding 46
4.5 PIPE DIMENSIONS 49
4.5.1 Spigot 50
4.5.2 Bends 51
4.5.3 Tees 52
4.6 MANHOLES 53
4.6.1 Junction manholes 53
4

4.6.2 Spacing of manholes 54
4.6.3 Size of manholes 54
4.6.4 Construction 54
4.6.5 Safety measures 56
4.7 COST ESTIMATION AS PER QUANTITY 58
4.8 ABSTRACT ESTIMATE 60
5 CONCLUSION 61
5.1 CONCLUSION
61
5.2 FUTURE SCOPE OF THE PROJECT 61
REFERENCES 62
5

LIST OF TABLES
TABLE TITLE PAGE
1.1 Reference to codes and standard 3
1.2 The application of earlier course work 3
3.1 The rainfall data for last five years in Kanchipuram district 12
3.2 The water consumption data in hostel blocks 14
3.3 The designed sewage flow 16
3.4 The annual rainfall depth 18
3.5 The drainage area with soil type 19
3.6 The runoff curve number (CN) 19
3.7 The slope adjustment factor 24
3.8 The different types of pipe material 25
3.9 The mechanical properties 27
3.10 The angular deflection (after 5mm draw) 29
4.1 Tabulation of the calculated pipe diameter 39
4.2 Peak flow to facilitate the hydraulic properties 41
4.3 Slope and length of the open channel 43
4.4 Weight of 650 mm diameter pipe 46
4.5 Spigot dimensions as per manual 50
4.6 Bends dimensions as per manual 51
4.7 Tees dimensions as per manual 53
4.8 Cost estimation of underground drainage system 58
4.9 Abstract estimation of underground drainage system 60
6
LIST OF FIGURES
FIGURE TITLE PAGE
3.1 Methodology followed for the project 8
3.2 The campus plan of SRM university 13
3.3 The catchment area of SRM hostels 17
3.4 The hydraulic length and drainage area relationship. 21
3.5 The discharge Vs equivalent drainage area for average
watershed slope 5 %
22
3.6 The peak discharge adjustment factor for impervious area 23
3.7 The vitrified clay pipes 26
3.8 The biological induced H2S corrosion 27
3.9 The economic viability and service life 38
3.10 The jointing system C and F 39
4.1 Flow of water at a lower level. 32
4.2 Most economical open channel 41
4.3 Dimensions of open channel 43
4.4 Free body diagram of sewer 45
4.5 Bedding dimensions 47
4.6 Class B bedding 47
4.7 Bedding dimensions for 650mm diameter pipe 48
4.8 Bedding dimensions for 150mm diameter pipe 48
4.9 Bedding dimensions for 230mm diameter pipe 49
4.10 Spigot 50
4.11 90° Bend 51
4.12 Tees 52
4.13 Typical illustration of circular manhole 55
4.14 Pipes, Bends and tees nomenclature 57
7

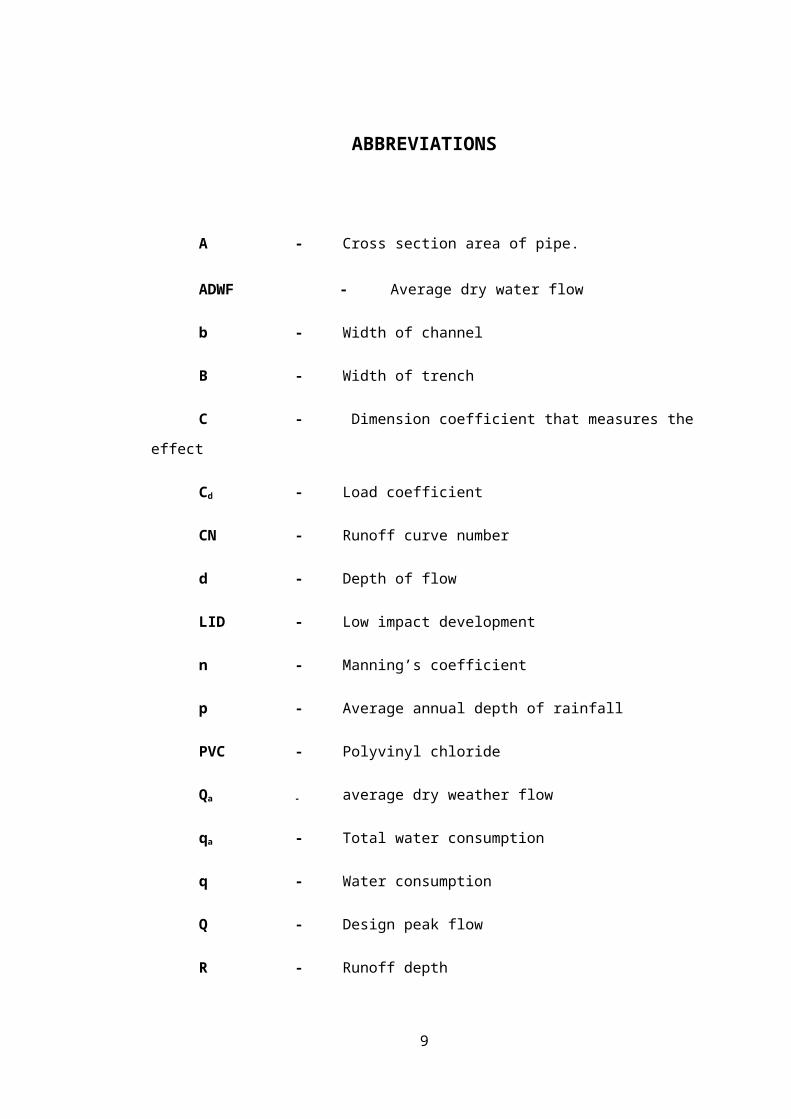
ABBREVIATIONS
A - Cross section area of pipe.
ADWF - Average dry water flow
b - Width of channel
B - Width of trench
C - Dimension coefficient that measures the effect
Cd - Load coefficient
CN - Runoff curve number
d - Depth of flow
LID - Low impact development
n - Manning’s coefficient
p - Average annual depth of rainfall
PVC - Polyvinyl chloride
Qa - average dry weather flow
qa - Total water consumption
q - Water consumption
Q - Design peak flow
R - Runoff depth
W - Load on pile
w - Weight of soil
8
WL - Load on pi
BONAFIDE CERTIFICATE
Certified that this project report titled ANALYSIS AND DESIGN
OF UNDERGROUND DRAINAGE SYSTEM IN SRM
UNIVERSITY KATTANKULATHUR CAMPUS is the bonafide
work of ROHIT SAHAI (1011010177), who carried out the project
under my supervision. Certified further, that to the best of my knowledge
the work reported herein does not form part of any other project report or
dissertation on the basis of which a degree or award was conferred on an
earlier occasion or any other candidate.
Signature of the Guide
Mr.J.RAJ PRASADAsst.Professor O.G.Department of Civil EngineeringSRM UniversityKattankulathur- 603203
Signature of the HOD
Dr. R. ANNADURAIProfessor & HeadDepartment of Civil EngineeringSRM UniversityKattankulathur- 603203
INTERNAL EXAMINER EXTERNAL EXAMINER
DATE:
9
ABSTRACT
This project was done primarily to present an alternate solution for
the problem caused due to open channel drainage system in SRM
University, Kattankulathur campus. This project explores the possibility
of construction of systematic sewerage system which is directly treated
by the treatment plant and the excess storm water which is drained by
providing open channel, making its way to the rainwater collecting
trench. The geographical location of the catchment area is such that it
paves the way for the entire waste water extracted from the hostels.
In this project analysis of waste water is carried out by collecting
the per capita consumption of water and the annual rainfall for last five
years. Pipe networking was done according to Indian Standard code
recommendations using software AutoCAD. The design of pipe
including dimensions, network, and dimensions of trench, slope and
manhole was done manually as per Indian Standard codes. The cost of
the project was estimated as per the latest pricing by PWD and the
abstract cost of the project was calculated. The environmental constraints
were eradicated by undergoing the construction in winters to increase
efficiency and optimum anti-corrosive measures are undertaken. Use
high performance concrete is adopted in order to resolve the
sustainability constraint. Most economical design methods are done
using economically efficient products in order to avoid economical
drawbacks. The project presented the analysis and design of
underground drainage system at SRM University.
10
ACKNOWLEDGEMENT
We would like to place on record, our grateful thanks to Dr.T.P.GANESAN, Pro
Vice Chancellor (P&D), for providing all facilities and help in carrying out this project. We
thank Dr.C.MUTHAMIZHCHELVAN, Director (E&T) for the stimulus provided.
We are extremely grateful to Dr.R.ANNADURAI, Professor and Head, Department
of Civil Engineering for the encouragement and support provided during the project work.
We express our sincere thanks to the coordinator Dr.K.GUNASEKARAN,
Professor, for his valuable suggestions for improvement during project reviews.
Our deepest thanks to MR.J.RAJPRASAD (Asst. Prof, O.G.) for guiding us by
elaborating the analysis process with attention, patience and care. He has taken pain to help
us through the project and make necessary corrections and when needed.
We also thank the staff of SRM DTP section for their efforts in composing the
project report. We record our sincere thanks to our parents for the support and motivation.
Last, but by no means the least, we thank all our friends, who freely helped us in
many ways towards the successful completion of this project work.
ROHIT SAHAI
11
CHAPTER 1
OVERVIEW
1.1 OBJECTIVE
The objective of the project is to construct the underground drainage system
in SRM University (Hostel).
To estimate the total cost of construction.
1.2 NECESSITY
The basic necessities of an underground drainage system are given below.
Drainage of storm water from the surface to avoid settling of water on the
paths.
To induce sanitation foul water with surface rain water to abate the foul
smell.
To facilitate the overall flow in the drainage pipes.
Flooding of surface and subsurface may cause heavy loss of property
(buildings and roads) and health (people and vegetation) of the people residing in the
campus during extremely heavy rains. Hence in order to exterminate such problem
underground drainage system is necessary.
The provision of such a scheme shall ensure a constant, reliable drainage and
reduce environmental pollution.
1.3 SCOPE
The scope of the project is given below.
To gain an understanding of basic excavation techniques.
To test the applicability of perforated pipes.
12

To assess the adequacy of the existing drainage system.
1.4 METHODOLOGY
Literature survey: Books and codes required for the project are collected.
Surveying: Selection of site, study of old drainage system, soil exploration,
type of soil, preparing layout.
Analysis and Design: Analysis of types of pipe material, flow rate, discharge
and estimation total runoff. Design of surface inlet and outlet, manholes, cover,
trenches and pipe network.
1.5 MAJOR DESIGN EXPERIENCE
The project is an “Underground Design Project”. Design experience in the
following areas has been gained during the course of the project.
Design of pipeline network.
Design of manholes.
Design and cost estimation of trenches and pipe laying operations.
1.6 REALISTIC DESIGN CONSTRAINTS
Environmental constraints: Consideration of actual environmental factors
(extreme working temperature, corrosive fluid, abrasive air, etc.) in design.
To overcome the environmental constraints the construction is scheduled in
winters to increase efficiency and optimum anti-corrosive measures are undertaken.
Sustainability constraints: Consideration of sustainability factors in
application of dead and live loads on the underground pipelines.
To overcome these constraints the high performance concrete is used for the
construction.
Economical constraints: Availability of funds for successful completion of
project.
In order to overcome economical constraints, most economical design
methods are adopted using economically efficient products.
1.7 REFERENCE TO CODES AND STANDARDS
13

As far as the codes and standards are concerned, for the design of some
components such as pipe network, trenches and manholes, the Indian Standard (IS)
codes have been used. The various IS codes and standards used for the project are
listed below in the Table 1.1.
Table 1.1 Reference to codes and standard
CODES CONTEXT
IS 2527:1984 Code Of Practice For Fixing Rainwater Gutters And
Downpipes For Roof Drainage (First Revision)
IS 1172:1993 Code Of Basic Requirements For Water Supply, Drainage
And Sanitation (Fourth Revision)
IS 1742:1983 Code Of Practice For Building Drainage (Second Revision))
IS 4111
(Part 1):1986
Code Of Practice For Ancillary Structures In Sewerage
System: Part I Manholes (First Revision)
IRC:SP:42-1994 Guidelines On Road Drainage
1.8 APPLICATION OF EARLIER COURSE WORK
The knowledge gained from some of the earlier courses are used in this
project and are listed in Table 1.2.
Table 1.2 Application of earlier course work
14
COURSE
CODE
COURSE NAME CONTEXT
CE0104 Computer Aided Building
Drawing
Pipe layout and alignment
CE0205 Fluid Mechanics Evaluation of discharge ,inlet
outlet diameter
CE0206 Applied Hydraulic
Engineering
Evaluation of catchment area,
hydrological parameter
CE0306 Foundation Engineering Determination of water Table
and depth of excavation.
Table 1.2 (continued)
CE0307 Environmental
engineering I
Design of pits, manholes, pipe
material, joints
CE0411 Estimation, Costing And
Professional Practice
Estimation and costing
1.9 MULTIDISCIPLINARY COMPONENT AND TEAM WORK
This project involves students in multidisciplinary team work like interacting
with the common people while procuring the dimensions of the streets, evaluation of
ground water Table, chemical and physical properties of the soil with the
maintenance department for the allocation of labor force.
1.10 SOFTWARE USED
The various software used in the project are given below.
AutoCAD
Microsoft Office
SAP
CHAPTER 2
INTRODUCTION
15

2.1 GENERAL
Drainage is the process of interception and removal of water from over, and
under the vicinity of the road surface. Drainage can be surface (where water is
conveyed on the road surface and drainage channels) or subsurface (water flows
underneath the pavement structure).
Surface and subsurface drainage of roads critically affects their structural
integrity, life and safety to users, and is thus important during highway design and
construction. Road designs therefore have to provide efficient means for removal of
this water; hence the need for road drainage designs.
Drainage facilities are required to protect the road against damage from
surface and sub surface water. Traffic safety is also important as poor drainage can
result in dangerous conditions like hydroplaning. Poor drainage can also compromise
the structural integrity and life of a pavement. Drainage systems combine various
natural and a manmade facility e.g. ditches, pipes, culverts, curbs to convey this
water safely (Ref. 1).
2.2 LITERATURE REVIEW
This project demands through the study of terminology and the methods of
construction of an underground drainage system. The required details are collected
from the literature and also from earlier course study that is environmental
engineering are summarized here.
2.2.1 Soil profile
Soil which does not drain quickly and naturally can be improved by the
installation of a subsurface tile drainage system. Tile drainage provides storage
capacity in the soil profile. This storage acts as a reservoir which fills and reduces
surface runoff for low intensity storms (Ref. 1).
2.2.2 Effects of drainage
16
Soil water regimes and water balances are presented for a series of drained
and undrained experimental grassland plots, intended to examine the agronomic
consequences of drainage. The major effect of drainage is to alter the route of water
loss from the site (Ref. 1).
2.2.3 Hydrology
Research conducted for the last 35 years has shown that subsurface drainage
has a significant impact on hydrology and contaminant transport. As a first step
towards incorporating drainage systems into large-scale hydrological models, an
equivalent representation of drains buried in a soil profile by using a homogeneous
anisotropic porous medium without drains (Ref. 1).
2.2.4 Annual drain flow
Drainage water management showed potential for reducing annual average
(1915–2006) drain flow from all drain spacing (10–35 m) regardless of the growing
season operational strategy, with reductions varying between 52% and 55% for the
drain spacing considered. Approximately, 81% to 99% of the annual drain flow
reduction occurred during the non- growing season, depending on the operational
strategy (Ref. 1).
2.3 SUMMARY
The effects of climate variability, drain spacing, and growing season
operational strategy on annual drain flow were studied for a hypothetical drainage
water management system.
Drainage has lowered the water tables, reduced the duration of water logging
in the drained plots and its effects in terms either of the total water quantities leaving
the site or of peak flows is quite small. In order to facilitate easy cleaning in sewer
lines whenever blockage occurs in sewer line, adequate number of manholes is
provided at regular intervals. Manholes with cast iron frames and covers are provided
in heavy traffic roads, on small lanes and cross roads with less traffic with RCC
frames and covers for the manholes.
17

CHAPTER 3
OBJECTIVES AND SCOPE
18

3.1 OBJECTIVE AND SCOPE
Drainage and sewerage system have always been part of essential
infrastructure in modern cities and town. In SRM university separate systems are
provided for collection and disposal of sewage and storm water. These systems are
unsanitary for the environment hence the project intends to provide a sanitary source
of drainage which is underground system which collects the sewage and leads it to
the sewage treatment plant.
Over the past ten years, population in SRM University has increase
significantly. This has led to an increase in water consumption and a consequential
increase in quantity of waste water to be handled. Today our community generates
about 50 million liters per day of waste water daily which required proper collection
and disposal. The methodology followed in the project is shown in Figure 3.1.
Fig. 3.1 Methodology followed in the project
3.2 CATCHMENT AREA
The catchment area of any point is defined by the limits from where surface
runoff will make its way, either by natural or manmade paths, to this point. The
catchment boundary is determined by using the most accurate information available
subject to such information being acceptable to council as appropriate. This is
presented to Council in a contour map along with the source of information.
Catchment area land use is based on current available zoning information or
19

proposed future zonings, where applicable and is produced to reflect both the minor
and major event catchments.
In SRM University the most vulnerable catchment area is the Hostels that
include both boys as well as girls. The quantity of water used per day in this varied
area is peculiarly gigantic (Ref. 2).
3.3 STORM DRAINAGE & GRADING STANDARDS AND POLICIES
All storm water which falls within a development, including the respective
one-half of all abutting streets, shall retain a minimum of the 100 year 2 hour storm
water runoff within the boundaries of said development. Predevelopment runoff
versus post development runoff retention is not acceptable, except for a “first flush”
facility or an approved designated drainage outfall, and shall be approved by the
Public Works Department.
Drainage retention/detention and conveyance systems shall be designed to
eliminate and reduce storm water runoff impact of adjacent or downstream
properties. No storm water drainage system shall be approved if the effect may cause
an increase in peak discharge, volume, or velocity of runoff or change the point of
entry of drainage onto another property during the runoff event.
The institution Civil Department shall require for review and approval a
grading and drainage plan and report be submitted wherever development and/or
grading is proposed within the University limits.
Construction documents for grading and drainage submitted to the University
for approval must be sealed by a registered Professional Civil Engineer. This
registered Professional Civil Engineer shall be held solely responsible for the
correctness and adequacy of all data, drawings, calculations, and reports submitted to
the University for review and approval. Approval by the University does not
necessarily imply that the design is appropriate, or that the development is in strict
compliance with all applicable regulations and standards.
Changes or additions to sites which require a site plan approval shall be
required to address drainage alterations and/or additions on the entire site with
approval of the University and meet storm drainage requirements as set forth in this
project (Ref. 2).
20
3.4 SITE SELECTION
The underground drainage system is located in SRM University, Chennai,
India (shown below in Figure 3.1). The site is at an altitude of 33 m above mean sea
level at latitude 12° 42’ N and longitude of 80°02’ E. The climate is characterized by
a short rain period from mid July to the end of September, a long rain period from
October to mid January, and a long dry period from mid January to mid July. The
climate is tropical, with a temperature variation of 19° - 42° C and average annual
rainfall of 1330 mm (India Meteorological Department, Chennai) (Ref. 2).
Site Planning Low impact development (LID) techniques are incorporated
into redevelopment drainage in SRM University. Exceptions may be made for
incidences where a demonstrated public purpose (such as preserving a historic
resource or a significant natural feature) is found to be served by the permitting
board or agency which would necessitate the use of underground recharge systems.
The site planning process shall be documented and include the following steps:
Perform Site Analysis – The important natural features such as streams and
drainage ways, floodplains, wetlands, recharge groundwater protection areas, high-
permeability soils, steep slopes and erosion-prone soils were identified.
Layout Preferred Development Scenario – Preferred site development layout
that minimizes total impervious area, reflects the existing topography, and uses
existing hydrologic features was prepared.
Create a Decentralized Storm water System management of runoff at the
source to the extent practical through the use of small decentralized structures, such
as infiltration structures, filter strips, rain barrels, cisterns, dry wells, and vegetated
areas was done. The time of concentration (average time for rainfall to reach a point)
by using open, vegetated drainage systems and maximizing overland or sheet flow
was increased as studied in CE0307, Environmental engineering I (Ref. 2).
3.5 PREVIOUS YEAR STUDIES
In SRM hostels around 1mold of sewage is generated daily for carrying the
sewage surface drainage systems are provided around the hostels. Surface drainage
21
system consists of different diameter and length pipes which are made up of different
materials such as cast iron pipe and vitrified clay pipes.
Storm water drainage system is also provided at certain places such as along
the road and in parking lot.
3.6 DATA COLLECTED
The urban heat island effect leads to increased rainfall, both in amounts and
intensity, downwind of cities. Global warming is also causing changes in the
precipitation pattern globally, including wetter conditions across eastern South India
and drier conditions in the tropics. Rainfall is measured using rain gauges. Rainfall
amounts can be estimated by weather radar.
The major cause of rain production is moisture moving along three-
dimensional zones of temperature and moisture contrasts known as weather fronts. If
enough moisture and upward motion is present, precipitation falls from convective
clouds (those with strong upward vertical motion) such as cumulonimbus (thunder
clouds) which can organize into narrow rain bands. In mountainous areas, heavy
precipitation is possible where upslope flow is maximized within windward sides of
the terrain at elevation which forces moist air to condense and fall out as rainfall
along the sides of mountains. On the leeward side of mountains, desert climates can
exist due to the dry air caused by down slope flow which causes heating and drying
of the air mass. The movement of the monsoon trough, or inter tropical convergence
zone, brings rainy seasons to savannah climes.
In planning a drainage system, the following data should be collected to
ensure compatibility with the overall strategic plan and master plans,
Water consumption in each hostel for calculation of sewage discharge
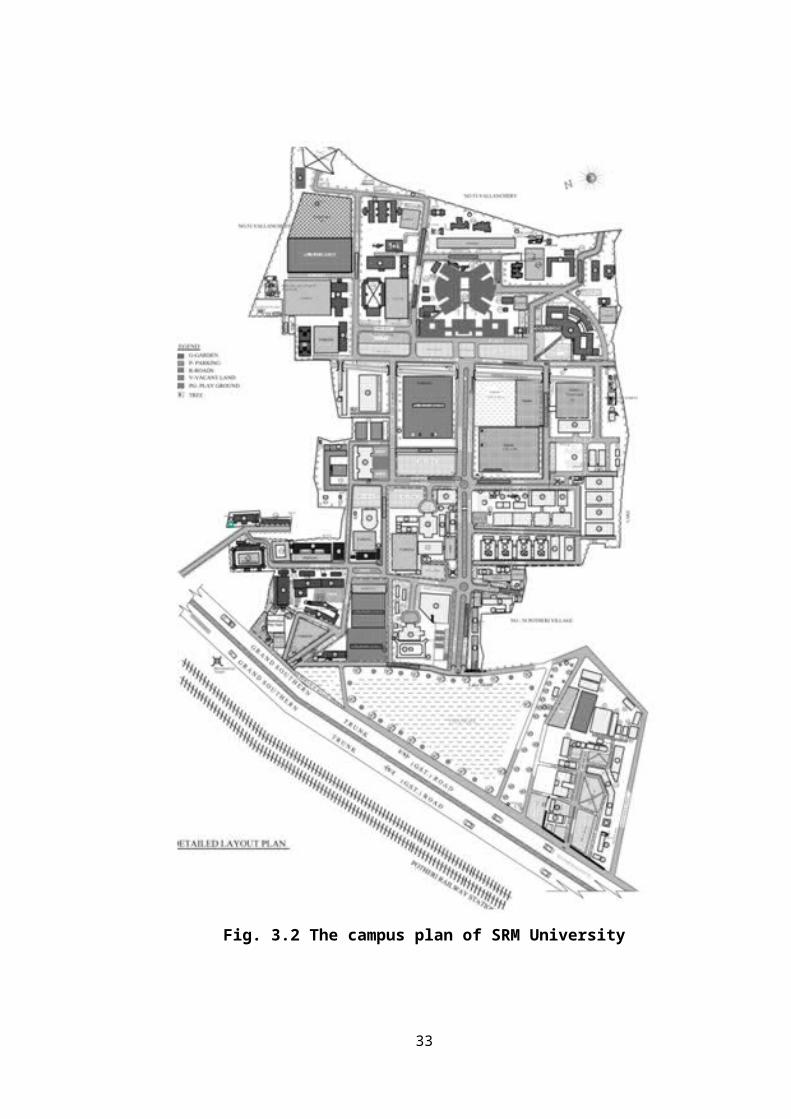
Campus layout plan for calculation of catchment area (shown below in
Figure 3.2).
Rainfall data for runoff calculation (shown below in Table 3.1)
Number of student in hostels
Rainfall data for last five years (Ref. 4).
22

Table 3.1 The rainfall data for last five years in Kanchipuram district
YearJan Feb Mar Apr May Jun
R/f R/f R/f R/f R/f R/f
2008 28.8 18.8 150.9 13.5 18.6 52.2
2009 16 0 6.6 0 43.8 22.3
2010 1 0 0 4.4 91.3 107.9
2011 5.6 36.1 0 55.9 29.8 36.6
2012 7.9 0 0 0.1 5.9 31.6
YearJul Aug Sep Oct Nov Dec
R/f R/f R/f R/f R/f R/f
2008 42 99.7 117.8 312.4 505.7 36.3
2009 48.7 119.7 132 57.9 505.2 174
2010 93.3 209.3 116.1 192 291.9 260.9
2011 121.3 189.9 180 249.1 390.3 181.7
2012 75.1 `141.9 93.8 318.4 95.3 132.6
23

Fig. 3.2 The campus plan of SRM University
24

3.7 POPULATION FORECAST AND AVERAGE DRY WEATHER FLOW
The no. of students residing in hostel is calculated based on the no. of room in
each hostel multiply by no. of student in each room, there are total 13 blocks. (shown
below in Table 3.2) as studied in CE0307, Environmental engineering I.
Average dry weather flow.
The quantity of average dry weather flow is about 80% of the total water
consume in each hostel and mess (Shown below in Table 3.2).
Qa = 80 % of “q” = 0.80 × “q”
Where,
q = water consumption
Qa = average dry weather flow
Table 3.2 The water consumption data in hostel blocks
S.no Name of hostel No. of student/hostel
Water consumption
lpd
Quantity of average dry
weather flow lpd
1 Paari 1000 118602 94881.6
2 Kaari 1000 120303 96242.4
3 Oori 1000 122004 97603.2
4 Adhiyaman 1000 122428 97942.4
5 Nelson mandela 800 58722 46977.6
6 Agasthiyar 600 38398 30718.4
7 Sannasi 450 36394 29115.2
8 Sannasi mess - 26667 21333.6
Girls hostel
9 A block 1000 121603 97282.4
10 B block 1000 115300 92240.0
11 C block 1000 123667 98933.6
12 D block 1000 118749 94999.2
13 Mess - 26890 21572.0
Total X=9850 qa=1149727 Qa=822238.3
25

Total water consumption is given by as recommended by IS 1172:1993 (Ref.
10),
qa = 118602+120303+122004+122428+58722
+38398+36394+26667+121603+115300+
123667+118749+26890
qa = 1149727 lpd
Where,
qa = total water consumption
3.8 PERCAPITA CONSUMPTION OF WATER
The percapita consumption of water is computed by taking the ratio between
the total number of students in the hostel and the total water consumption (Ref. 5).
Total no of students,
X = 1000+1000+1000+1000+800+600+450+
1000+1000+1000+1000
= 9850
Where,
X = total no. of students in hostel
As known,
qa = 1149727 lpd
Therefore, percapita consumption of water,
= q aX
= 1149727
9850
= 117 lpd
3.9 WASTE WATER CHARACTERISTICS
Sewage systems are designed to accommodate peak flows which are
determined from the product of the average dry weather flow (ADWF) and a peak
factor (Pf) (the designed sewage flow shown below in Table 3.3) as studied in
CE0307, Environmental engineering I.
26

Q = Qa × pf
Where,
Q = designed peak flow
Qa = average dry weather flow
Now, Peak factor,
pf = Q a maxQ a avg
From Table 3.2,
Qamax = 98933.6 lpd
Where,
Qaavg = total of avg. dry weather flow / no of blocks
=
94881.6+96242.4+97603.2+97942.4+46977.6+¿30718.4+29115.2+21333.6+97282.4+92240.0+¿98933.6+94999.2+21572.013
= 63249.10 lpd
Peak factor (pf) = 98933.6
63249.10 = 1.5
Designed peak flow = Qa ×1.5
Table 3.3 The designed sewage flow
S.no. Name of hostels Quantity of average dry weather flow
(qa)lpd
Designed peak flow(q)=qa×1.5
Lpd
1 Paari 94881.6 142322.4
2 Kaari 96242.4 144363.6
3 Oori 97603.2 146404.8
4 Adhiyaman 97942.4 146913.6
5 Nelson mandela 46977.6 70466.4
6 Agasthiyar 30718.4 46077.6
7 Sannasi 29115.2 43672.8
8 Sannasi mess 21333.6 32000.4
Girls hostel
9 A block 97282.4 145923.6
10 B block 92240.0 138360.0
11 C block 98933.6 148400.4
Table 3.3 (continued)
27

12 D block 94999.2 142492.8
13 Mess 21572.0 32358.0
Total 822238.3 1233357.45
As shown in the Table 3.3,
Total designed peak flow = 1233357.45 lpd
Q = 1233.36 cu meter/day
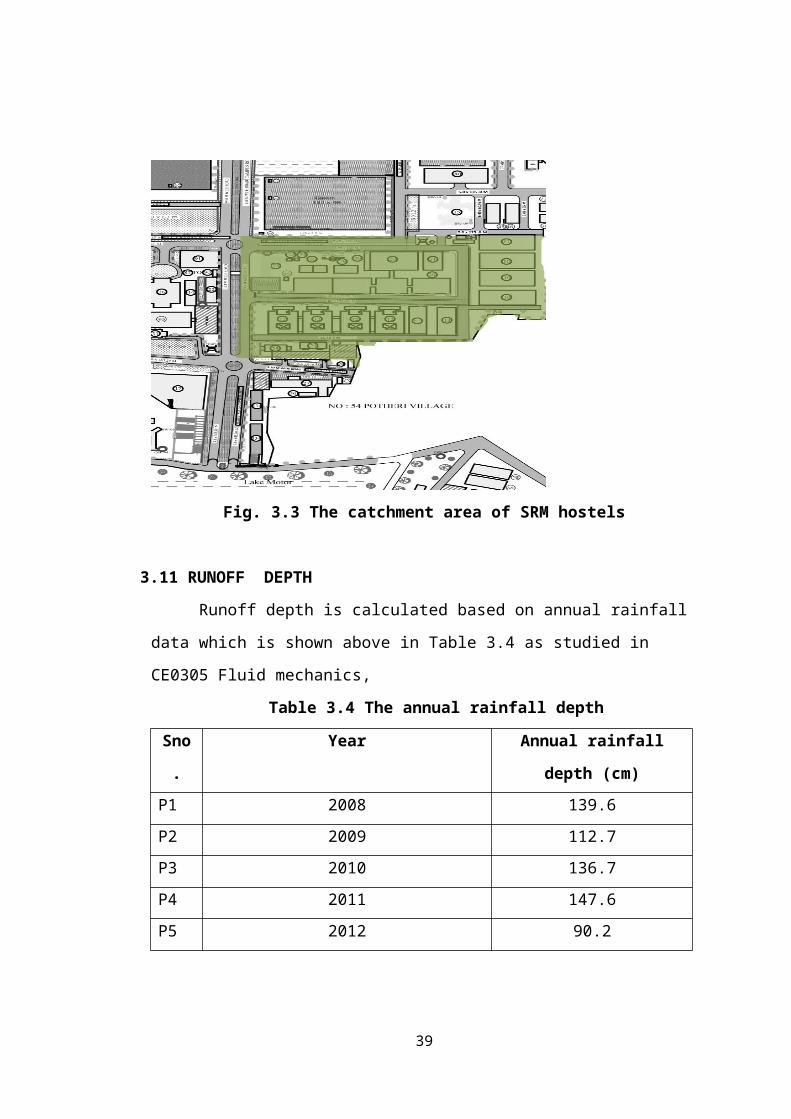
3.10 STORM WATER DRAINAGE
Total catchment area of the site is 17.60 acres in that built-up area is 10.32
acres, open space is 5.19 acres, paved area is 2.05 acres and slope is 5% which is
claculated from the campus layout plan (Catchment area is shown below in Figure
3.3) (Ref. 5).
Fig. 3.3 The catchment area of SRM hostels
3.11 RUNOFF DEPTH
Runoff depth is calculated based on annual rainfall data which is shown
above in Table 3.4 as studied in CE0305 Fluid mechanics,
Table 3.4 The annual rainfall depth
28

Sno. Year Annual rainfall depth (cm)
P1 2008 139.6
P2 2009 112.7
P3 2010 136.7
P4 2011 147.6
P5 2012 90.2
P = (P 1+P 2+P 3+P 4+P 5)
5
Therefore,
P = (139.6+112.7+136.7+147.6+90.2)
5
= 125.3 cm.
From the Inglis formula,
R = 0.85P – 30.5 mm
= 0.85 × 125.3 – 30.5
= 76 mm
= 3 inch
Where,
P = Average annual depth of rainfall
R = runoff depth
3.12 RUNOFF RATE
Runoff that occurs on surfaces before reaching a channel is also called a
nonpoint source. If a nonpoint source contains man-made contaminants, the runoff is
called nonpoint source pollution. A land area which produces runoff that drains to a
common point is called a drainage basin.
Using SCS peak discharge method calculation of peak runoff rate is
calculated as recommended by IS 2526:1984 (Ref. 11).
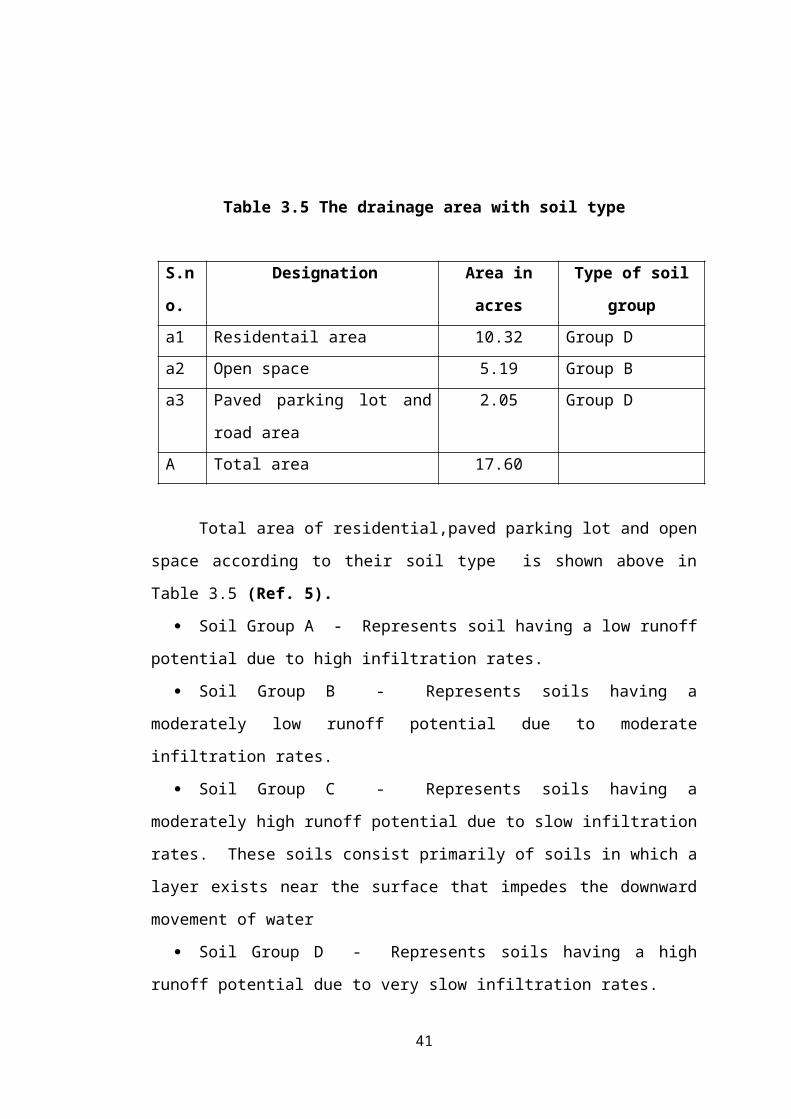
Table 3.5 The drainage area with soil type
29
S.no. Designation Area in acres Type of soil group
a1 Residentail area 10.32 Group D
a2 Open space 5.19 Group B
a3 Paved parking lot and road area 2.05 Group D
A Total area 17.60
Total area of residential,paved parking lot and open space according to their
soil type is shown above in Table 3.5 (Ref. 5).
Soil Group A - Represents soil having a low runoff potential due to high
infiltration rates.
Soil Group B - Represents soils having a moderately low runoff potential
due to moderate infiltration rates.
Soil Group C - Represents soils having a moderately high runoff potential
due to slow infiltration rates. These soils consist primarily of soils in which a layer
exists near the surface that impedes the downward movement of water
Soil Group D - Represents soils having a high runoff potential due to very
slow infiltration rates.
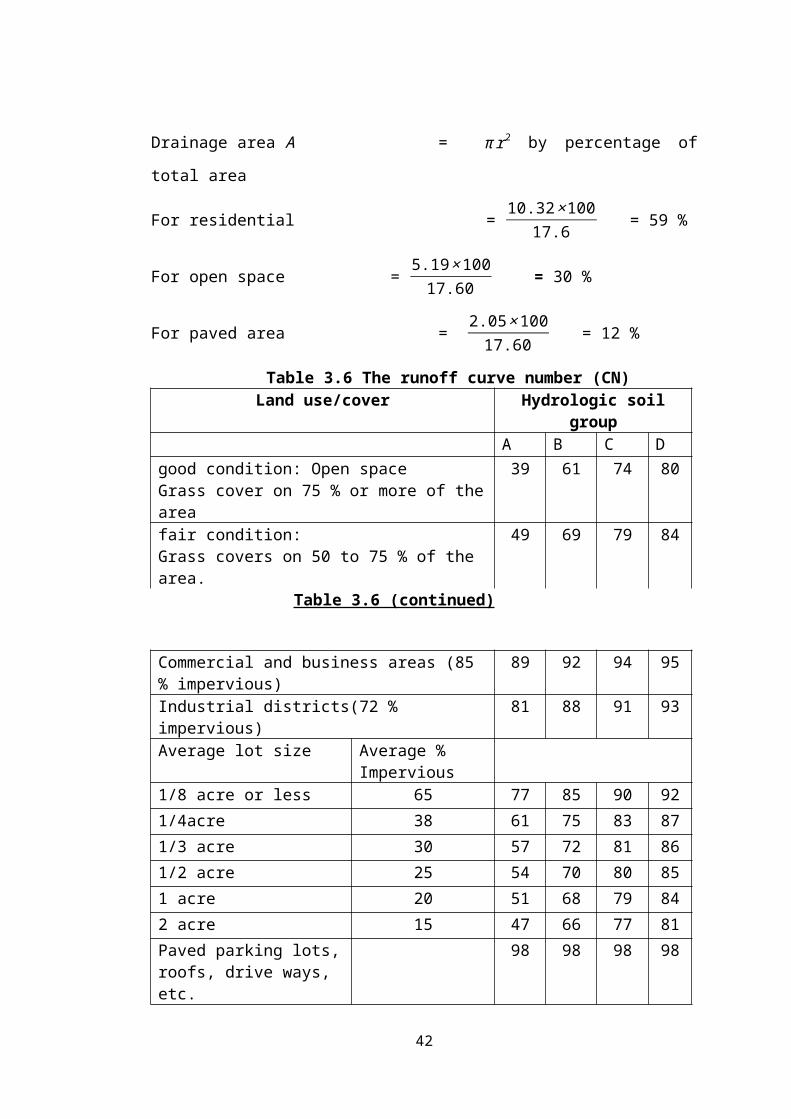
Drainage area A = π r2 by percentage of total area
For residential = 10.32× 100
17.6 = 59 %
For open space = 5.19× 100
17.60 = 30 %
For paved area = 2.05× 100
17.60 = 12 %
Table 3.6 The runoff curve number (CN)Land use/cover Hydrologic soil group
A B C D
good condition: Open spaceGrass cover on 75 % or more of the area
39 61 74 80
fair condition:Grass covers on 50 to 75 % of the area.
49 69 79 84
Table 3.6 (continued)
30

Commercial and business areas (85 % impervious) 89 92 94 95
Industrial districts(72 % impervious) 81 88 91 93
Average lot size Average % Impervious
1/8 acre or less 65 77 85 90 92
1/4acre 38 61 75 83 87
1/3 acre 30 57 72 81 86
1/2 acre 25 54 70 80 85
1 acre 20 51 68 79 84
2 acre 15 47 66 77 81
Paved parking lots, roofs, drive ways, etc.
98 98 98 98
Runoff Curve Number (CN): It is the empirical formula used in hydrology to
calculate direct runoff or infiltration which is shown in Table 3.6 above (Ref. 5).
Using Table 3.6,
For residential, because size of each block is less than 0.125 acres and soil group is
D,
CN1 = 92
For open space, fair condition: grass cover on 50 to 75 % of the area and soil group is
B,
CN2 = 69
For paved area, soil group D,
CN3 = 98
Average curve number (CN) = percentage of drainage area × CN
Residential = 0.59 × 92
= 54.28
Open space = 0.30 × 69
= 20.7
Paved area = 0.12 × 98
= 11.76
Total average CN number = 54.28+20.7+11.76
= 86.7~87
31

Hydraulic length, Figure 3.4 below shows the hydraulic length and drainage
area relationship.
L = 209 × (A) 0.6
Where,
L = hydraulic length, in feet
A = drainage area, in acres
L = 209 × (17.60) 0.6
L = 1170 ft
= 356.61 m
Fig. 3.4 The hydraulic length and drainage area relationship.
Equivalent area,
Using Figure 3.4 as recommended by IS 1742:1983 (Ref. 9),
Using interpolation = 1170 x15
1000
= 17.55 acres
= 71022.33 m2
32
Discharge for equivalent area: for average watershed slopes 3-7% and CN 87
which is shown below in Figure 3.5.
Fig. 3.5 The discharge Vs equivalent drainage area for average slope 5%
Using Figure 3.5 for equivalent drainage area 17.55 acres as recommended by
IS 1742:1983 (Ref. 9).
Q1 = 20 cfs
Peak rate of runoff is Q1 × R
Where,
Q1 = rate discharge for equivalent area per inch
R = runoff depth, inch
Peak rate of runoff = 20 × 3
= 60 cfs
Corrected peak rate of runoff = Q1 × (drainage area/equivalent area)
= 60 × 17.6017.55
Q2 = 60.2 cfs
Where,
Q2 = Corrected peak rate of runoff
33

Q3 = Q2 × impervious factor
Q3 = Adjust peak discharge rate
Impervious factor and peak discharge relationship is shown below in Figure 3.6
Fig. 3.6 The peak Discharge Adjustment Factor for Impervious Area
Using Figure 3.6 as recommended by IS 1742:1983 (Ref. 9),
For impervious area 59 % and CN 87,
Impervious factor is 1.2,
Q3 = 60.2 × 1.2
= 72.24 cfs
Adjust peak discharge for averagage watershed slope,
Q4 = Q3 × slope factor
Q4 = Adjust peak discharge for avg. watershed
Slope factor and drainage area relationship is shown below in Table 3.7 as
recommended by IS 1172:1993 (Ref. 10).
Table 3.7 The slope adjustment factor
Type Slope (present) 10 acres 20 acres 50 acres
34

Flat 0.1 0.49 0.47 0.44
0.2 0.61 0.59 0.56
0.3 0.69 0.67 0.65
0.4 0.76 0.74 0.72
0.5 0.82 0.80 0.78
0.7 0.90 0.89 0.88
1.0 1.0 1.0 1.0
1.5 1.13 1.14 1.14
Moderate 3 0.93 0.92 0.91
4 1.0 1.0 1.0
5 1.04 1.05 1.07
6 1.07 1.10 1.12
7 1.09 1.13 1.18
Using Table 3.7 for 5% slope and area 17.60 acres,
Using interpolation,
Slope factor = 17.60× 1.04
10
= 1.8
Q4 = 72.24 × 1.8
= 130.03 cfs
So designed runoff rate,
Q = 130.03 cfs
Q = 3.7 cu meter/sec
3.13 PIPE MATERIAL
Different type of pipe materials with their properties are shown below in
Table 3.8 (Ref. 6).
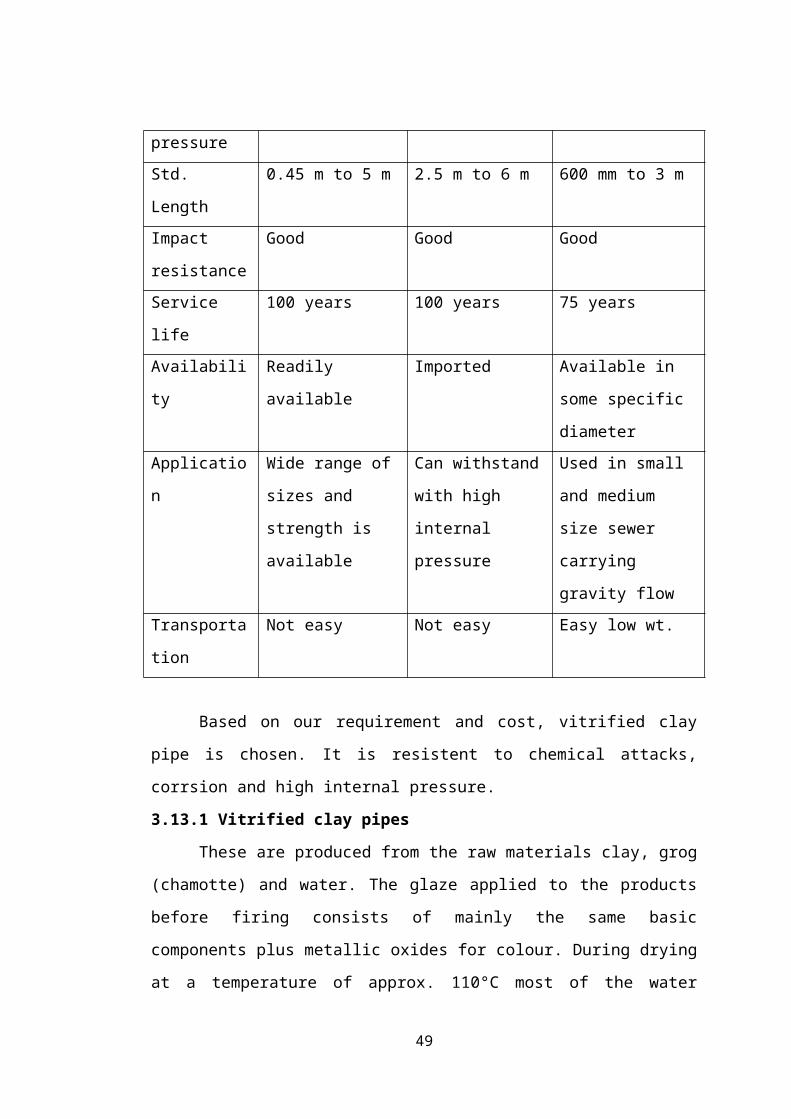
Table 3.8 The different types of pipe material
35

Material Concrete plain
reinforcement
Prestressed
concrete
Vitrified clay
Size range DN 150 to DN 300 DN 450 to DN 3000 DN 150 to DN 1200
Normal
working
pressure
Atmospheric
pressure
4 to 12 bar Atmospheric
pressure
Std. Length 0.45 m to 5 m 2.5 m to 6 m 600 mm to 3 m
Impact
resistance
Good Good Good
Service life 100 years 100 years 75 years
Availability Readily available Imported Available in some
specific diameter
Application Wide range of sizes
and strength is
available
Can withstand with
high internal
pressure
Used in small and
medium size sewer
carrying gravity flow
Transportation Not easy Not easy Easy low wt.
Based on our requirement and cost, vitrified clay pipe is chosen. It is resistent
to chemical attacks, corrsion and high internal pressure.
3.13.1 Vitrified clay pipes
These are produced from the raw materials clay, grog (chamotte) and water.
The glaze applied to the products before firing consists of mainly the same basic
components plus metallic oxides for colour. During drying at a temperature of
approx. 110°C most of the water necessary for shaping is extracted. The subsequent
firing at temperatures rising up to 1200°C creates a completely new material by
sintering. This vitrified clay has exceptional properties in respect to chemical
resistance, mechanical strength, impermeability and hardness. Highly developed
manufacturing and preparation techniques have made it possible to upgrade an
already proven product, the consistency is guaranteed by quality control. Vitrified
clay pipes are designed for sewers operating on gravity in municipal and industrial
applications, Figure 3.7 below shows the vitrified clay pipe (Ref. 6).
36

Fig. 3.7 The Figure shows the vitrified clay pipes
3.13.2 Properties of vitrified clay pipes
Chemical resistance
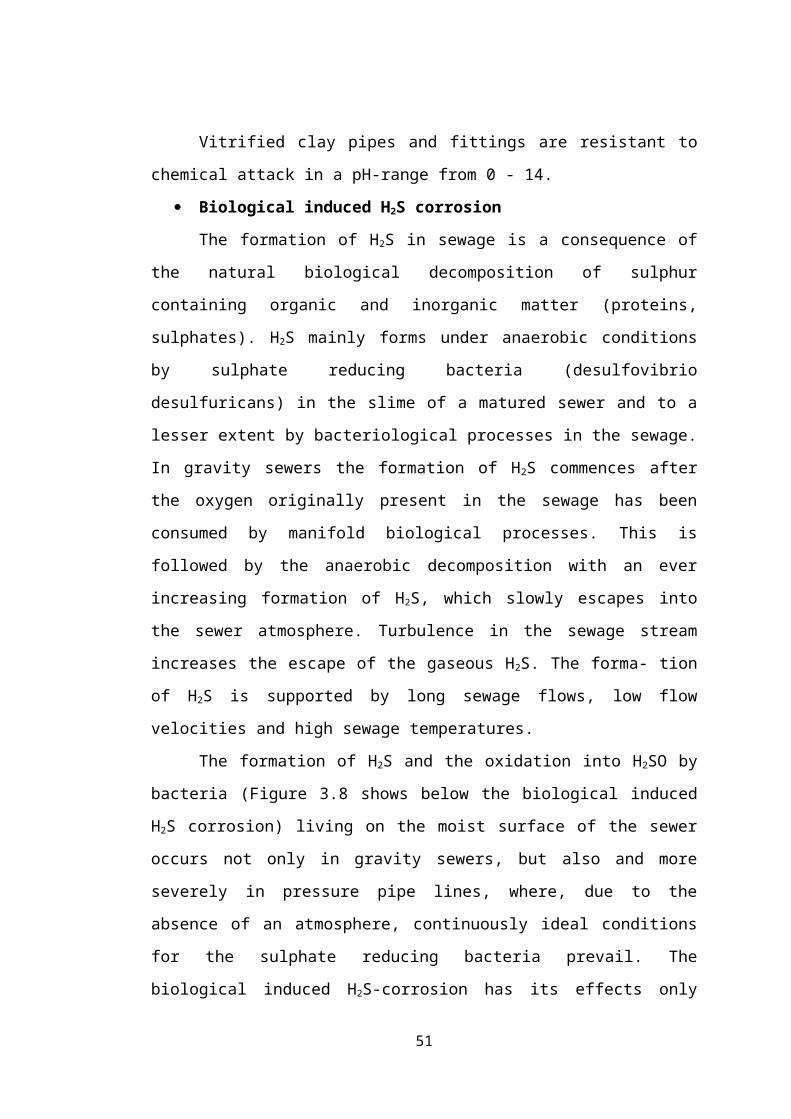
Vitrified clay pipes and fittings are resistant to chemical attack in a pH-range
from 0 - 14.
Biological induced H2S corrosion
The formation of H2S in sewage is a consequence of the natural biological
decomposition of sulphur containing organic and inorganic matter (proteins,
sulphates). H2S mainly forms under anaerobic conditions by sulphate reducing
bacteria (desulfovibrio desulfuricans) in the slime of a matured sewer and to a lesser
extent by bacteriological processes in the sewage. In gravity sewers the formation of
H2S commences after the oxygen originally present in the sewage has been
consumed by manifold biological processes. This is followed by the anaerobic
decomposition with an ever increasing formation of H2S, which slowly escapes into
the sewer atmosphere. Turbulence in the sewage stream increases the escape of the
gaseous H2S. The forma- tion of H2S is supported by long sewage flows, low flow
velocities and high sewage temperatures.
37
The formation of H2S and the oxidation into H2SO by bacteria (Figure 3.8
shows below the biological induced H2S corrosion) living on the moist surface of the
sewer occurs not only in gravity sewers, but also and more severely in pressure pipe
lines, where, due to the absence of an atmosphere, continuously ideal conditions for
the sulphate reducing bacteria prevail. The biological induced H2S-corrosion has its
effects only above the surface level of the sewage stream, where the sulphuric acid
reacts with the lime content of cement-bound pipe materials (Ref. 6).
Fig. 3.8 The Figure shows the biological induced H2S-corrosion
Mechanical resistance
The mechanical resistance of vitrified clay has developed enormously during
the last decades. Nowadays, a vitrified clay pipe up till DN 600 has the same
mechanical strength as reinforced concrete pipes from the series 135, mechanical
properties are shown below in Table 3.9 (Ref. 6).
Table 3.9 The mechanical properties
S.No
. Mechanical Properties Value
1. Specific weight 22 kN/m3
2. Bending tensile strength 15-40 N/mm2
3. Mohs hardness 8
4. Modulus of elasticity 50,000 N/mm2
5. Coefficient of thermal expansion 5x10⁻⁶ 1/K
6. Thermal conductivity 1-2 W/m.K
Hydraulic capacity
38
Vitrified clay pipes have and hold a smooth inner surface (wall roughness
between 0.02 mm and 0.05 mm). Especially in the case of limited slopes, this offers
quite some advantages. Because of the high erosion resistance, vitrified clay can
even be used for slopes up to 10 m/sec., without any danger of material deterioration
for concrete example, the maximum slope is only 3 m/sec (Ref. 6).
High abrasion resistance
Vitrified clay has high abrasion resistance, which is equally true for the glaze
and the rest of the wall. Abrasion values encountered in the tests are approximately
0.08 mm, which is much lower than the typical abrasion values of 0.2 mm to 0.5 mm
after 100 000 load cycles measured using the Darmstadt test (Ref. 6).
Corrosion resistance
Vitrified clay material is resistant to all types of chemicals over the entire
wall thickness. The resistance of the vitrified clay material and seals is tested using
chemicals, including sulphuric acid at pH 0 and NaOH at pH 14.
3.13.3 Economic consideration
The cost for construction of a sewer line is determined largely by the location
and thetype of construction. Figure 3.9 below shows the economic viability and
service life.The operating and maintenance cost are the basis of the charges levied
for use of the sewer. These costs represent a constant expense (Ref. 6).
Fig. 3.9 The Figure shows the economic viability and service life
3.14 JOINTS
39

It is imperative that tight flexible joints are formed when individual pipes and
fittings are assembled to form sewers. The pipe and joint are part of a unique system
that together ensures easy assembly, reliability and long service life. For this reason
sealing elements are factory installed.jointing systems are shown below in Figure
3.10 (Ref. 6).
Joint “L” to jointing system “F”
Joint “K” to jointing system “C”
Joint “S” to jointing system “C”
Fig. 3.10 The Figure shows the jointing system C and F
3.14.1 Assemblies
These shall remain watertight when tested at internal or external pressures of
5 kPa (0.05 bar) and 50 kPa (0.5 bar). The joint under such internal or external
pressure must not show any visible leakage when further be subjected to Table 3.10
below shows the angular deflection (Ref. 6).
Table 3.10 Angular deflection (after 5 mm draw)
S.No
.
Nominal size
(mm)
Deflection per meter of deflected pipe
length
1 100-200 80 mm
2 250-500 30 mm
3 600-800 20 mm
4 >800 10 mm
Pipes and fittings of the same jointing system, of the same nominal size and
the same pipe class are directly interchangeable. Uniformity of pipe class during
installation is a prerequisite. For all applications it must be observed, that joint
40
assemblies are guaranteed to withstand cyclic temperature changes of -10°C to
+70°C and chemical attacks from normal sewage and other harmful effluents in
concentrations from pH 0 (sulphuric acid) to pH 14 (caustic soda).
3.15 SAFETY ISSUES
Every project has its own particular and distinctive features (e.g. general
arrangement/layout of the works, site location and constraints, accessibility of the
works by the public, etc). It is necessary for the designer to identify all potential
risks arisen from the proposed works and to design the works in such a way as to
remove, reduce and/or control the identified hazards present during the course of
construction, operation, maintenance, and finally decommissioning and demolition.
In general, consideration should be given to the following aspects when carrying out
risk assessment at the design stage,
The anticipated method of construction – site constraints encountered,
technique involved may prove hazardous, plant and materials to be used
carefully.
The operation of works – warning signs, fencing, life buoys, grilles, and
means of emergency communication were established.
The decommissioning and demolition of the works – pre-stressed members
and contaminated grounds were keenly observed.
41
CHAPTER 4
RESULTS AND DISCUSSION
4.1 BASIC INFORMATION
Before the sewer network can be designed, accurate information regarding
the site conditions is essential. This information may vary with the individual scheme
but shall, in general, be covered by the following (Ref. 7).
Site plan - A plan of the site to scale with topographical levels, road
formation levels, level of the outfall, location of wells, underground sumps
and other drinking water sources.
The requirements of local bye-laws.
Subsoil conditions - Subsoil conditions govern the choice of design of the
sewer and the method of excavation.
Location of other services (such as position, depth and size of all other pipes,
mains, cables, or other services, in the vicinity of the proposed work).
Topography.
4.1.1 Preliminary Investigation for Design of Sewer System
The anticipation of future growth in any community in terms of population or
commercial and industrial expansion forms the basis for preparation of plan for
providing the amenities including installation of sewers in the area to be served.
The recommended planning period is 30 years, however, this may vary depending
upon the local conditions. The prospective disposal sites are selected and their
suitability is evaluated with regard to physical practicability for collection of sewage,
effects of its disposal on surrounding environment and cost involved (Ref. 7).
4.1.2 Detailed Survey
The presence of rock or underground obstacles such as existing sewers,
42

water lines, electrical or telephone wires, tunnels, foundations, etc., have significant
effect upon the cost of construction. Therefore, before selecting the final lines and
grades for sewers necessary information regarding such constructions is collected
from various central and state engineering departments (Ref. 7).
4.1.3 Profile of Sewer System
The vertical profile is drawn from the survey notes for each sewer line. The
vertical scale of the longitudinal sections are usually magnified ten times the
horizontal scale. The profile shows ground surface, tentative manhole locations,
grade, size and material of pipe, ground and invert levels and extent of concrete
protection, etc. (Ref. 7).
Design velocity for hostel,
Assuming the velocity of flow at each floor will be same as 'V'.
The diameter of main drainage pipe = 0.40 m.
Now considering difference in head for one floor as shown in the Figure 4.1
as studied in CE0305 Fluid mechanics,
Fig.4.1 Flow of water at a lower level.
Applying Bernoulli's equation at the top of the water surface and at the outlet
of the pipe as recommended by IS: 1172:1993 (Ref. 10).
P1
ρg+
V 12
2 g + Z1 =
P2
ρg+
V 22
2 g +Z2+all losses
P1
ρg,
P2
ρg = Pressure heads
V 12
2 g,V 2
2
2g = Velocity heads
Z1 and Z2 = datum head
43

All losses = major losses + minor losses
Considering datum line passing through the centre of pipe,
0+0+3 = 0+ V 2
2 g+0+ hi+h f
hi = 0.5V 2
2 g
hf = 4 × F × L × v2
d × 2 g
F = 0.009 for vitrified clay pipe
3 = V2
2 g + 0.5V 2
2 g +4 × F × L × v2
d × 2g
3 = V 2
2 g×[1+0.5+ 4 × F × L
d ]3 =
V 2
2 g×[1.5+ 4 ×0.009 × 4
0.1 ]3 = V
2
2 g×2.94
V = 4.40 m/sec
Now using continuity equation,
A1×V 1 ¿ A2×V 2 = A3× V 3......
AV × g = A1×V 1
A = cross section area of pipe
π d2
4 × 4.4 × g = π d2
4 × V 1
d2 ×4.4 × g = d2 V 1
(0.1 )2× 4.4 × g
(0.4 )2 = V 1
V 1 = 2.475 m/sec
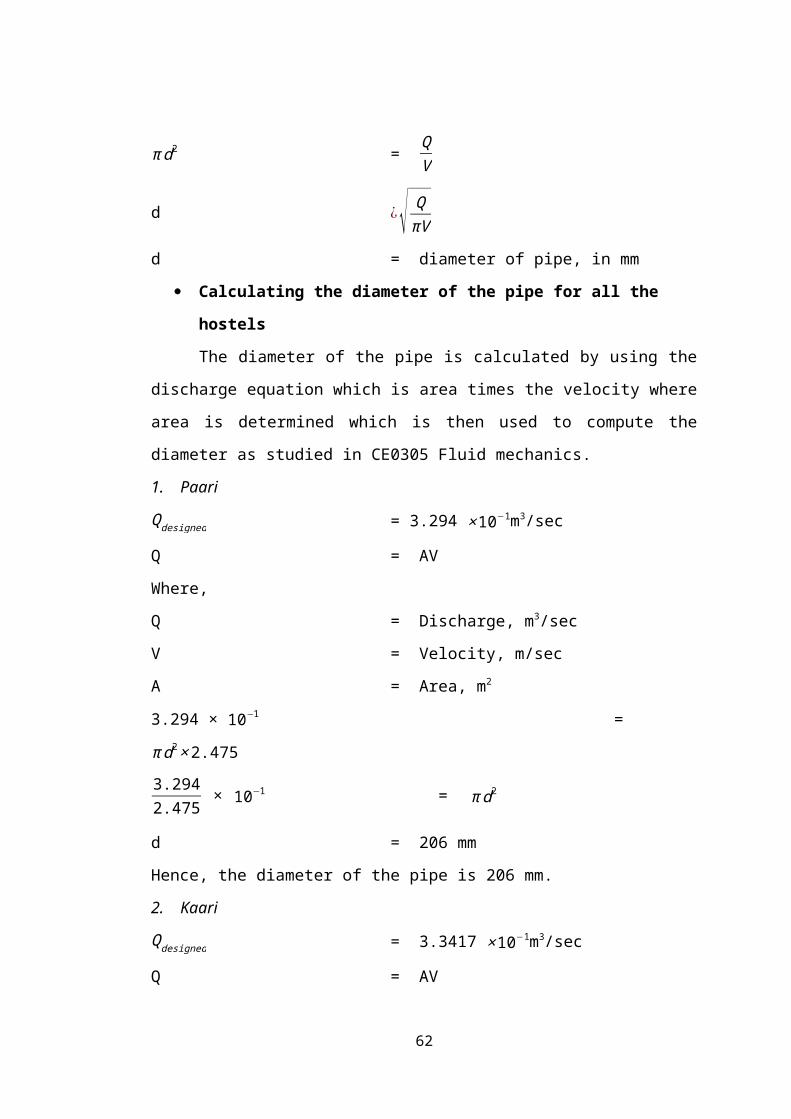
Now consider the velocity of flow through each hostel,
Q = AV
A = QV
44

π d2 = QV
d ¿√ QπV
d = diameter of pipe, in mm
Calculating the diameter of the pipe for all the hostels
The diameter of the pipe is calculated by using the discharge equation which
is area times the velocity where area is determined which is then used to compute the
diameter as studied in CE0305 Fluid mechanics.
1. Paari
Qdesigned = 3.294 ×10⁻¹m3/sec
Q = AV
Where,
Q = Discharge, m3/sec
V = Velocity, m/sec
A = Area, m2
3.294 × 10−1 = π d2× 2.475
3.2942.475
× 10−1 = π d2
d = 206 mm
Hence, the diameter of the pipe is 206 mm.
2. Kaari
Qdesigned = 3.3417 ×10⁻¹m3/sec
Q = AV
3.341 × 10−1 = π d2× 2.475
3.34172.475
× 10−1 = π d2
d = 207 mm
Hence, the diameter of the pipe is 207 mm.
3. Oori
Qdesigned = 3.3890 ×10⁻¹m3/sec
Q = AV
45

3.3890 × 10−1 = π d2× 2.475
3.38902.475
× 10−1 = π d2
d = 208 mm
Hence, the diameter of the pipe is 208 mm.
4. Adyaman
Qdesigned = 3.4×10⁻¹m3/sec
3.4 × 10−1 = π d2× 2.475
3.42.475
× 10−1 = π d2
d = 209 mm
Hence, the diameter of the pipe is 209 mm.
5. NRI
Qdesigned = 1.6311×10⁻¹m3/sec
Q = AV
1.6311 × 10−1 = π d2× 2.475
1,63112.475
× 10−1 = π d2
d = 145 mm
Hence, the diameter of the pipe is 145 mm.
6. Agasthiyar
Qdesigned = 1.0666 ×10⁻¹m3/sec
Q = AV
1.066 × 10−1 = π d2× 2.475
1.0662.475
× 10−1 = π d2
d = 117 mm
Hence, the diameter of the pipe is 117 mm.
7. Sannasi
Qdesigned = 1.6311 ×10⁻¹ m3/sec
8. Blocks in Sannasi
I - Q Idesigned = 0.252 ×10⁻¹ m3/sec
46

d = √ 0.2527.773
d = 60 mm
II - Q IIdesigned = 0.252 ×10⁻¹ m3/sec
d = √ 0.2527.773
d = 60 mm
III - Q IIIdesigned = 0.252×10⁻¹ m3/sec
d =√ 0.2527.773
d = 60 mm
IV - Q IVdesigned = 0.252 ×10⁻¹ m3/sec
d = √ 0.2527.773
d = 60 mm
Hence, the diameter of the pipes connecting sannasi blocks are 60 mm.
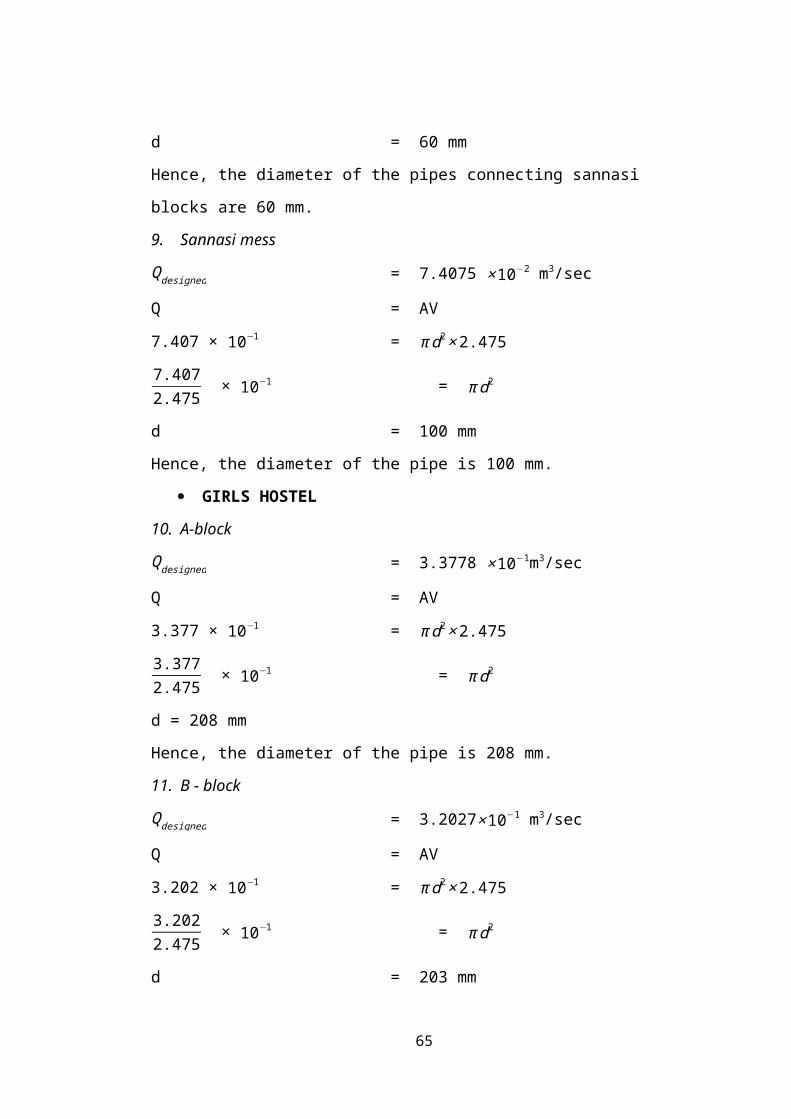
9. Sannasi mess
Qdesigned = 7.4075 ×10⁻² m3/sec
Q = AV
7.407 × 10−1 = π d2× 2.475
7.4072.475
× 10−1 = π d2
d = 100 mm
Hence, the diameter of the pipe is 100 mm.
GIRLS HOSTEL
10. A-block
Qdesigned = 3.3778 ×10⁻¹m3/sec
Q = AV
3.377 × 10−1 = π d2× 2.475
3.3772.475
× 10−1 = π d2
d = 208 mm
47

Hence, the diameter of the pipe is 208 mm.
11. B - block
Qdesigned = 3.2027×10⁻¹ m3/sec
Q = AV
3.202 × 10−1 = π d2× 2.475
3.2022.475
× 10−1 = π d2
d = 203 mm
Hence, the diameter of the pipe is 203 mm.
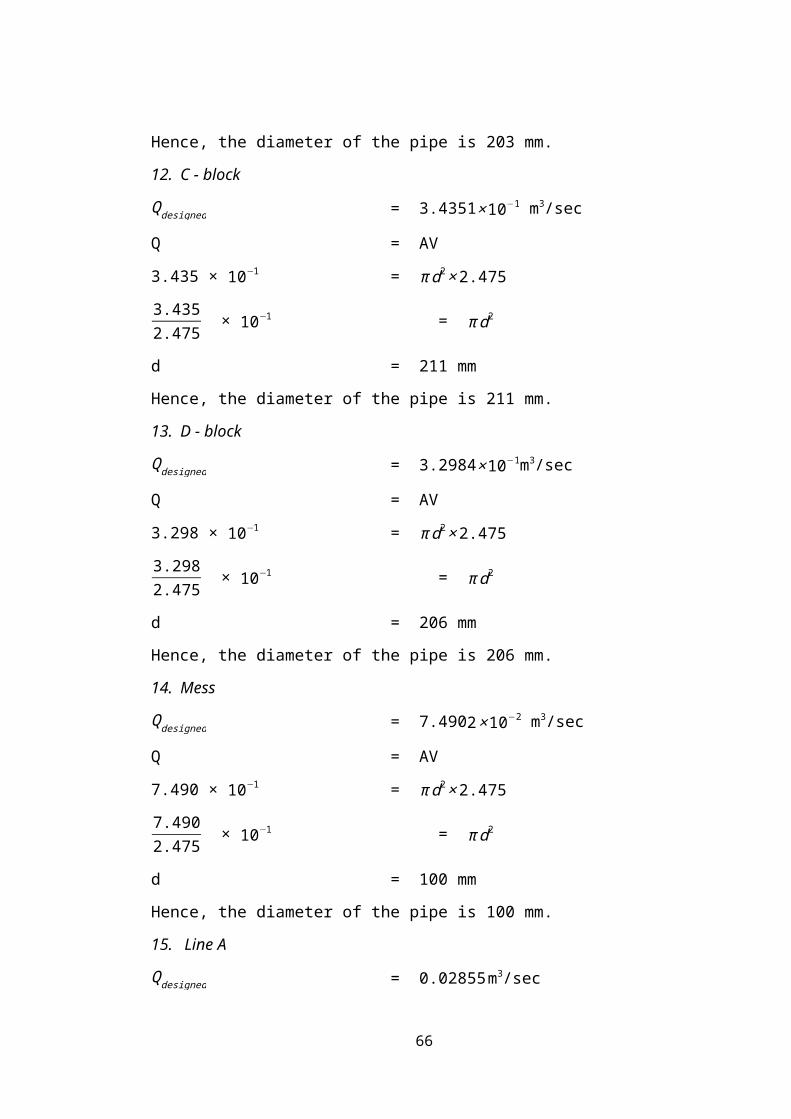
12. C - block
Qdesigned = 3.4351×10⁻¹ m3/sec
Q = AV
3.435 × 10−1 = π d2× 2.475
3.4352.475
× 10−1 = π d2
d = 211 mm
Hence, the diameter of the pipe is 211 mm.
13. D - block
Qdesigned = 3.2984×10⁻¹m3/sec
Q = AV
3.298 × 10−1 = π d2× 2.475
3.2982.475
× 10−1 = π d2
d = 206 mm
Hence, the diameter of the pipe is 206 mm.
14. Mess
Qdesigned = 7.4902 ×10⁻² m3/sec
Q = AV
7.490 × 10−1 = π d2× 2.475
7.4902.475
× 10−1 = π d2
d = 100 mm
48
Hence, the diameter of the pipe is 100 mm.
15. Line A
Qdesigned = 0.02855m3/sec
Q = AV
0.0285 × 10−1 = π d2× 2.475
0.02852.475
× 10−1 = π d2
d = 606 mm
Hence, the diameter of the pipe is 606 mm.
16. Line B
Qdesigned = 1.751×10⁻³ m3/sec
Q = AV
1.751 × 10−1 = π d2× 2.475
1.7512.475
× 10−1 = π d2
d = 150 mm
Hence, the diameter of the pipe is 150 mm.
4.2 SEWER CONSTRUCTION
In sewer construction work, two operations are of special importance,
namely, excavation of trenches, and laying of sewer pipes in trenches and tunnels.
Most of the trench work involves open cut excavation; and in urban areas it includes.
Removing pavement
Removal of the material from the ground, and its separation, its classification
where necessary, and its final disposal.
Sheeting and bracing the sides of the trench
Removal of water (if any) from the trench
Protection of other structures, both underground and on the surface,
whose foundations may be affected
Backfilling
Replacement of the pavement.
49

The most common type of sewer construction practice involves the use of
open trenches and prefabricated pipes. However, larger sewer systems, and unusual
situations may require tunnelling, jacking of pipes through the soil, or cast-in-situ
concrete sewers.
On all excavation work, safety precautions for the protection of life and
property are essential; and measures to avoid too great inconveniences to the public
are desirable. Such measures and precautions include the erection and maintenance
of signs (to forewarn public), barricades, bridges and detours; placing and
maintenance of lights both for illumination and also as danger signals; provision of
watchmen to exclude unauthorized persons, particularly children from trespassing on
the work; and such other precautions as local conditions may dictate. Table 4.1
shows the designed slope and the pipe diameter determined for various hostels (Ref.
7).
Table 4.1 Tabulation of the calculated pipe diameterHostel Q
(m3/sec)Pipe diameter
(mm)Slope 1
inStandard pipe(mm)
Length(m)
Paari 0.329 206 175 230 7.85
Kaari 0.334 207 175 230 6.61
Oori 0.338 208 175 230 5.24
Adhiyaman 0.34 209 175 230 4
NRI 0.163 145 170 150 2.99
Agastiyar 0.106 117 170 150 4
Sannasi I 0.025 60 57 100 4.22
II 0.025 60 57 100 4.71
III 0.025 60 57 100 4.98
IV 0.025 60 57 100 5.65
Sannasi
mess 0.74 100 57 100 9.59
A 0.337 208 175 230 5.74
B 0.32 203 175 230 6.56
C 0.34 211 175 230 9.19
D 0.32 206 175 230 11.88
Main sewer 2.855 606 1000 650 522.69
50
Sub main
sewer 0.175 150 170 150 229.35
4.3 LAYING OF PIPE SEWERS
In laying sewers, the centre of each manhole shall be marked by a peg. Two
wooden posts 100 mm 100 mm 1800 mm high shall be fixed on either side at nearly
equal distance from the peg or sufficiently clear of all intended excavation. The sight
rail when fixed on these posts shall cross the centre of manhole. The sight rails made
from 250 mm wide 40 mm thick wooden planks and screwed with the top edge
against the level marks shall be fixed at distances more than 30 m apart along the
sewer alignment. The centre line of the sewer shall be marked on the sight rail. These
vertical posts and the sight rails shall be perfectly square and planed smooth on all
sides and edges. The sight rails shall be painted half white and half black alternately
on both the sides and the tee heads and cross pieces of the boning rods shall be
painted black. When the sewers converging to a manhole come in at various levels
there shall be a rail fixed for every different level.
The boning rods with cross section 75 mm 50 mm of various lengths shall be
prepared from wood. Each length shall be a certain number of meters and shall have
a fixed tee head and fixed intermediate cross pieces, each about 300 mm long. The
top edge of the cross pieces shall be fixed at a distance below the top edge equal to,
the outside diameter of the pipe, the thickness of the concrete bedding or the bottom
of excavation, as the case may be. The boning staff shall be marked on both sides to
indicate its full length, The posts and the sight rails shall in no case be removed until
the trench are excavated, the pipes are laid, jointed and the filling is started.
When large sewer lines are to be laid or where sloped trench walls result in top-
of-trench widths too great for practical use of sight rails or where soils are unstable,
stakes set in the trench bottom itself on the sewer line, as rough grade for the sewer is
completed, would serve the purpose as recommended by IRC: SP: 42-1994 (Ref. 12).
4.3.1 Depth of flow
51

The sewer shall not run full as otherwise the pressure will rise or fall below
atmospheric pressure also from consideration of ventilation sewer should not be
design to run full in case of circular sewer the manning’s formula reveals that,
The velocity at 0.8 depth of flow is 1.14 times the discharge at full depth of
flow.
The discharge at 0.8 depth of flow is 0.98 times the discharge at full depth of
flow.
According to maximum depth of flow in design shall limited to 0.8 of the
diameter at ultimate peak flow in order to facilitate the calculation easily the
hydraulic properties at various depth of flow are compiled in the Table 4.2,
Table 4.2 Peak flow to facilitate the hydraulic properties
d/D v/V q/Q
1 1 1
0.9 1.24 1.066
0.8 1.14 0.968
0.7 1.12 0.838
0.6 1.072 0.671
0.5 1 0.5
0.4 0.902 0.337
0.3 0.776 0.106
0.2 0.615 0.008
0.1 0.401 0.021
Storm water drainage design,
Q = 3.7 m3/sec
There is natural slope towards (west to east) and the most economical design
parameters are taken into account to avoid the economical constraints.
Open channel is provided for storm water drainage whose dimensions are
given below in the Figure 4.2 as recommended by IS: 2527: 1984 (Ref. 11).
52
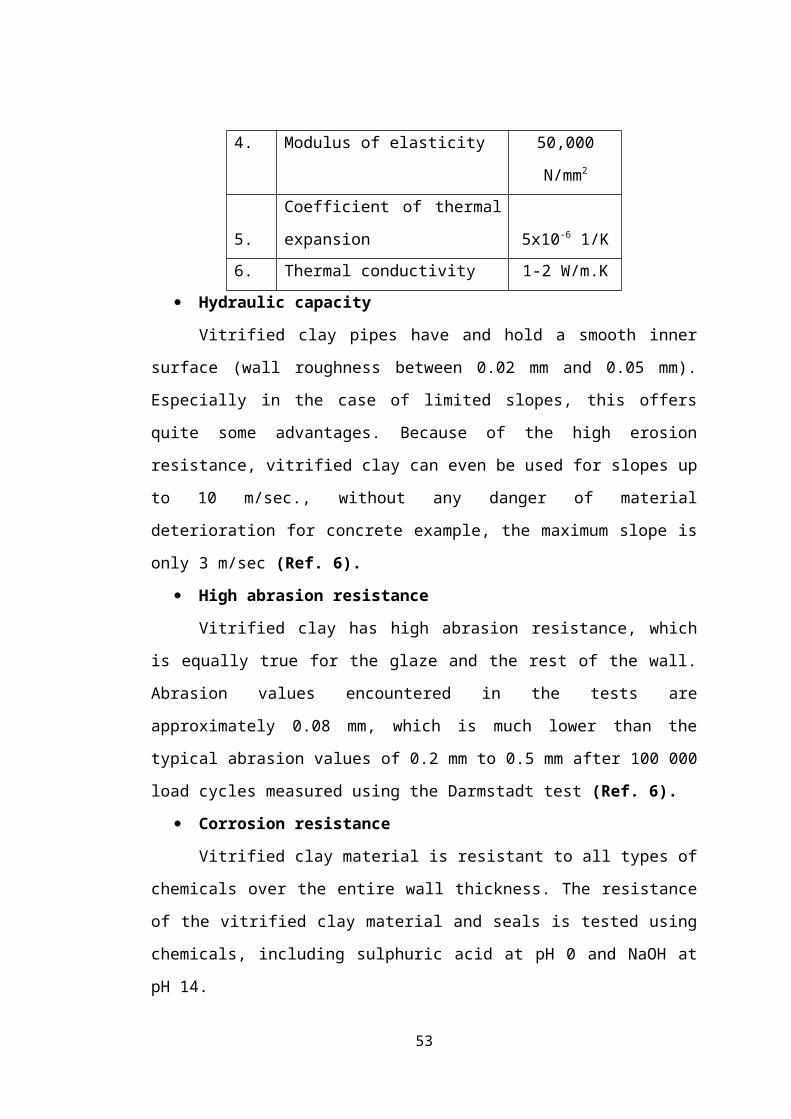
Fig. 4.2 Most economical open channel
Where,
b = width of channel
d = depth of flow
A = b×d (4.1)
Wetted perimeter (p),
p = b+d+d
= b+2d (4.2)
From equation (4.1)
b = Ad
Substituting value of b in equation (4.2)
p = b+2d
p = Ad
+2d
Differentiate equation with respect to d,
dpd (d )
= 0
-A
d2+2 = 0
A = 2d2
A = b×d
b×d = 2d2
b = 2d
Now hydraulic mean depth (m),
53

m = Ad
= b × db+2d
= 2 d × d2 d+2 d
m = d2
Q = 3.7 m3/sec
Bed slope (i) is 1 in 1000,
i = 1
1000
C = 1n
× (m)1/6
Where,
n = manning’s coefficient
C = chezy’s constant
m = hydraulic mean depth
n = 0.015
C = 1n
×( d2)
1 /6
Q = AC√mi (as studied in CE0206 Hydraulics)
3.7 = 2d2× 10.015
( d2)
1/6√ 11000
×√ d2
1.390 = d2.66
d = 1.131 m
then,
b = 2d
b = 2.262
54

Fig. 4.3 Dimensions of open channel
Hence the dimensions of the rectangular open channel are shown in Figure
4.3. To deliver the water into Rainwater collecting trench, the length and slope of the
trench is shown in the Table 4.3 as recommended by IS: 2527: 1984 (Ref. 11).
Table 4.3 Slope and length of the open channel
Channel Slope Length
(m)
Level (m)
AB 1/1000 228.63 A = -1.131
BC 1/1000 99.35 B = -1.364
Table 4.3 (continued)
CD 1/1000 223.64 C = -1.466
DE 1/1000 14.58 D = -1.597
EF 1/1000 144.35 E = -1.611
FG 1/1000 216.33 F = -1.846
G = -2.107
4.4 TRENCH DESIGN
In a buried sewer stresses are induced by external loads and also by internal
pressure in case of pressure main as recommended by IS: 1742: 1983 (Ref. 9).
Load due to back fill,
W = cwB2
where,
W = Load on pipe
w = Weight of soil
55
B = Width of trench
c = Dimensions coefficient that measure the effect of
A) Ratio of height of fill to width of trench.
B) Shearing force between interior and adjacent earth portion
C) Direction and amount of relative settlement
There are three classification of construction condition
Embankment condition
Trench condition
Tunnel condition
4.4.1 Trench condition
Generally sewers are laid in ditches or trenches by excavation in natural or
undisturbed soil and then covered by refilling the trench to the original ground level
as studied in CE0306 Foundation Engineering.
4.4.2 Load Producing Forces
The vertical dead load to which a conduit is subjected under trench conditions
is the resultant of two major forces. The first component is the weight of the prism of
soil within the trench and above the top of the pipe and the second is due to the
friction or shearing forces generated between the prism of soil in the trench and the
sides of the trench produced by settlement of backfill. The resultant load on the
horizontal plane at the top of the pipe within the trench is equal to the weight of the
backfill minus these upward shearing forces as shown in Figure 4.4 as recommended
by IS: 1742: 1983 (Ref. 9).
4.4.3 Load calculation
Load of pipe shown in Figure 4.4,
W c = CdWBd2
where,
Wc = Load on the pipe in kg per linear meter
w = Unit weight of backfill soil in kg/m3
56
Bd = Width of trench at the top of the pipe in m
Cd = Load coefficient
Fig 4.4 Free body diagram of the sewer
In order to calculate the loads applied by the pipe, the dead load of the
material in excavation above the concrete bedding is determined which is shown in
the Table 4.4.
Table 4.4 Weight for 650mm diameter pipe
Materials Weight
(kg/m2)
Dry Sand 1600
Ordinary (Damp Sand) 1,840
Wet Sand 1920
Wet Sand 1920
Saturated Clay 2080
Saturated Top Soil 1840
Sand and Damp Soil 1600
Saturated top soil (w) = 1840 kg/m2
Maximum of (Cd ) = 0.461 for ordinary sand and
57
HBd
= 0.5 m
4.4.4 Type of bedding
Bedding factor = desined load × factor of safetyT h ree edgebearing strengt h
= 11.98
64 × 1.5
= 0.3
The bedding dimension criterion for the excavation trench after laying the
pipe lines of various diameter is shown in the Figure 4.5 as recommended by IS:
1742: 1983 (Ref. 9),
Fig 4.5 The bedding dimensions
Class B bedding having a shaped bottom of compacted granular bedding with
carefully backfill as shown in the Figure 4.6 as recommended by IS: 1742: 1983
(Ref. 9),
Fig 4.6 The class B bedding
For safe condition it is necessary to keep width of trench less than the
diameter of pipe,
58

For 650 mm diameter pipe as shown in Figure 4.7,
Bd < 2 Bc
Bd < 2 ×0.650
Bd < 1.3
So assume it as Bd = 1.2
Now,
Load on pipe = 0.469 ×1840 ×1.22
= 11.98 kN/m
W c = 1.98 kN /m≤ 64 kN /m
Hence, safe.
Fig 4.7 The bedding dimensions for 650 mm diameter pipe
For pipe diameter 150 mm as shown in Figure 4.8,
Load on pipe = 0.469 ×1840 × Bd2
Bd < 2 Bc
Bd < 2 ×0.150
Bd < 0.2
W c = 0.461 ×1840 ×0.22
W c = 0.3 kN /m
Hence the load will be very much less and (W c<64 kN /m)
So provide the least trench dimensions for Bedding grade ‘B’
59

Fig 4.8 The bedding dimensions for 150 mm diameter pipe
For 230 mm diameter pipe as shown in Figure 4.9,
Q = 230 mm
= 0.230 m
Load on pipe = Cd ×W × Bd2
W c = 0.469 ×1840 × Bd2
Bd < 2 Bc
Bd < 2 ×0.23
Bd < 0.45
H = 0.225 m
W c = 0.461 ×1840 ×0.452
W c = 1.68 kN /m
Hence here load is very less and depth ¿1 m
So provide the least possible trench dimension for bedding grade ‘B’ as
recommended by IS: 1742: 1983 (Ref. 9).
60

Fig 4.9 The bedding dimensions for 230 mm diameter pipe
4.5 PIPE DIMENSIONS
Gladding, McBean is a specialty manufacturer of Vitrified Clay Pipe products
which are used by contractors and agencies throughout the world. Our state-of-the-
art manufacturing processes and technology produces a ceramic product which has
great strength, high density and water tight jointing. Vitrified Clay Pipe is the most
inert of all sanitary sewer pipe materials. It does not have gradual reduction in
strength over time as with resin type products. Chemical resistance likewise does not
deteriorate. Vitrified Clay Pipe is the only pipe which offers both a design and
service life exceeding 100 years.
Hence according to the brochure provided by the manufacturer, the
dimensions of the standard pipe (spigot), bends (mitered pipe) and tees are given
below respectively (Ref. 8).
4.5.1 Spigot
A spigot is a tubular section or hollow cylinder, usually but not necessarily of
circular cross-section, used mainly to convey substances which can flow liquids and
gases (fluids), slurries, powders, masses of small solids. It can also be used for
structural applications; hollow pipe is far stiffer per unit weight than solid members.
The dimensions of the spigot are given in feet and inches since the manual
used as a reference followed the same unit convention (as shown in Table 4.5). The
computations made in the project were based on SI units of meter and centimeters in
order to avoid proximity of calculations. The calculations based on the parameters
are shown in the Figure 4.10 (Ref. 8).
Fig 4.10 Spigot
Table 4.5 Spigot dimensions as per manual
61
Pipes L D1 D2 D3 D4 D5 T1 T2
a 1', 2', 6' 8" 10.02" 11.49" 13.09" 2.31" .98" 0.78"
b 1', 2', 6' 8" 10.02" 11.49" 13.09" 2.31" .98" 0.78"
c 1', 2', 6' 8" 10.02" 11.49" 13.09" 2.31" .98" 0.78"
d 1', 2', 6' 8" 10.02" 11.49" 13.09" 2.31" .98" 0.78"
e 1', 2', 6' 6" 7.87" 9.05" 10.43" 2.33" .87" 0.67"
f 1', 2', 6' 6" 7.87" 9.05" 10.43" 2.33" .87" 0.67"
g 1', 2', 4' 4" 5.3125" 6.5" 7.625" 1.5" .68" .5"
h 1', 2', 4' 4" 5.3125" 6.5" 7.625" 1.5" .68" .5"
i 1', 2', 4' 4" 5.3125" 6.5" 7.625" 1.5" .68" .5"
j 1', 2', 4' 4" 5.3125" 6.5" 7.625" 1.5" .68" .5"
k 1', 2', 4' 4" 5.3125" 6.5" 7.625" 1.5" .68" .5"
l 1', 2', 6' 6" 7.87" 9.05" 10.43" 2.33" .87" 0.67"
Table 4.5 (continued)
m 1', 2', 6' 6" 7.87" 9.05" 10.43" 2.33" .87" 0.67"
n 1', 2', 6' 6" 7.87" 9.05" 10.43" 2.33" .87" 0.67"
o 1', 2', 6' 6" 7.87" 9.05" 10.43" 2.33" .87" 0.67"
Line A 1', 2', 6' 24" 28.85" 30.78" 34.06" 3.67" 2.99" 1.71"
Line B 1', 2', 6' 6" 7.87" 9.05" 10.43" 2.33" .87" 0.67"
4.5.2 Bends
Pipe bending is the umbrella term for metal forming processes used to
permanently form pipes or tubing. One has to differentiate between form bound and
freeform-bending procedures, as well as between heat supported and cold forming
procedures.
The dimensions of the bend are given in feet and inches since the manual
used as a reference followed the same unit convention (as shown in Table 4.6). The
computations made in the project were based on SI units of meter and centimeters in
order to avoid proximity of calculations. The calculations based on the parameters
are shown in the Figure 4.11 (Ref. 8).
62

Mitered 1/4 or 90° Bend
Fig 4.11 90° Bend
Table 4.6 Bends dimensions as per manual
Bends A D E G I J K H
b1 6-1/4" 6" 4" 7-1/2" 8" 8" 12" 9-1/4"
b2 6-1/4" 6" 4" 7-1/2" 8" 8" 12" 9-1/4
b3 18" 24" 6" 30" 18" 24-3/4" 39-1/4" 24-1/2"
b4 18" 24" 6" 30" 18" 24-3/4" 39-1/4" 24-1/2"
4.5.3 Tees
A tee is used in pipe plumbing systems to connect straight pipe or tubing
sections, to adapt to different sizes or shapes, and for other purposes, such as
regulating or measuring fluid flow.
The dimensions of the tee are given in feet and inches since the manual used
as a reference followed the same unit convention (as shown in Table 4.7). The
computations made in the project were based on SI units of meter and centimeters in
order to avoid proximity of calculations. The calculations based on the parameters
are shown in the Figure 4.12 (Ref. 8).
63

Fig 4.12 Tees
Table 4.7 Tee dimensions as per manual
T-Joint D&D2 D3 A B
t1 24" 15" 14-1/8" 18-5/8"
t2 24" 15" 14-1/8" 18-5/8"
t3 24" 15" 14-1/8" 18-5/8"
t4 24" 15" 14-1/8" 18-5/8"
t5 6" 4" 6-1/16" 6-5/16"
t6 6" 4" 6-1/16" 6-5/16"
t7 6" 4" 6-1/16" 6-5/16"
t8 6" 4" 6-1/16" 6-5/16"
t9 24" 15" 14-1/8" 18-5/8"
t10 24" 15" 14-1/8" 18-5/8"
t11 24" 15" 14-1/8" 18-5/8"
t12 24" 15" 14-1/8" 18-5/8"
t13 24" 15" 14-1/8" 18-5/8"
c1 24" 15" 14-1/8" 18-5/8"
64
The nomenclature used in the previous tables for various pipes, bends and
tees are shown in Figure 14.4.
4.6 MANHOLES
4.6.1 Junction Manholes
A manhole should be built at every junction of two or more sewers, and the
curved portions of the inverts of tributary sewers should be formed within the
manhole. The soffit of the smaller sewer at a junction should be not lower than that
of the larger, in order to avoid the surcharging of the former when the latter is
running full, and the hydraulic design usually assumes such a condition.
The gradient of the smaller sewer may be steepened from the previous
manhole sufficiently to reduce the difference of invert level at the point of junction to
a convenient amount as recommended by IS 4111 (Part-1): 1986 (Ref. 13).
4.6.2 Spacing of Manholes
Manholes should be built at every change of alignment, gradient or diameter,
at the head of all sewers and branches, at every junction of two or more sewers. On
sewers which are to be cleaned manually which cannot be entered for cleaning or
inspection the maximum distance between manholes should be 30 m as
recommended by IS 4111 (Part-1): 1986 (Ref. 13).
4.6.3 Sizes of Manholes
The circular manholes may be constructed as alternative to rectangular and
arch type manholes. Circular manholes are much stronger than rectangular and arch
type manholes and thus these are preferred over rectangular (ordinary) as well as
arch type of manholes. The circular manholes can be provided for all depths starting
from 0.9 m. Circular manholes are straight down in lower portion and slanting in top
portion so as to narrow down the top opening equal to internal diameter of manhole
cover. Depending upon the depth of manhole, the diameter of manhole changes. The
internal diameter of circular manholes may be kept as following for varying depths.
For depths above 0.90 m and up to 1.65 m, 900 mm diameter
For depths above 1.65 m and up to 2.30 m, 1200 mm diameter
65
For depths above 2.30 m and up to 9.0 m, 1500 mm diameter
For depths above 9.0 m and up to 14.0 m, 1800 mm diameter
4.6.4 Construction
Excavation - The manhole shall be excavated true to dimensions and levels as
shown on the plan. The excavation of deep manholes shall be accompanied with
safety measures like timbering, staging, etc. In areas where necessary, appropriate
measures for dewatering should be made.
Bed Concrete - The manhole shall be built on a bed of concrete 1: 4 : 8 ( 1
cement: 4 coarse sand: 8 graded stone aggregate 40 mm nominal size ) unless it is
otherwise required by the local bodies, etc. Generally the thickness of bed concrete
shall be 225 mm for manholes of depth less than 2.30 m and 300 mm for depths of
2.30m and above, unless otherwise specified on account of specific considerations.
This may, however, be designed to carry safely the weight of walls, cover, the wheel
loads, impact of traffic which are transmitted through cover and shaft walls and also
for water pressure, if any. In case of weak soil, special foundation as suitable shall be
provided. The thickness of wall shall in no case be less than one brick length.
Generally the wall shall be built of one brick length thickness for depth less than 2.25
m. The thickness of wall for depths from 2.25 m to 3.0 m is kept one and half brick
length, for depth from 3.0 to 5.0 m, two brick length; for depths 5.0 to 9.0 m, two and
half brick length and beyond 9.0 m depth it may be 3 brick length as recommended
by IS 4111 (Part-1): 1986 (Ref. 13).
66

Fig 4.13 Typical illustration of circular manhole
Plastering - The walls of manholes shall be plastered both inside and outside
with cement mortar 1:3 (1 cement: 3 coarse sand) and finished smooth with a coat of
neat cement. Typical illustration of the circular manhole used in shown in the Figure
4.13.
4.6.5 Safety measures
In deep manholes enlarged rest chambers should be made at about 6 m
intervals, each provided with a landing platform in the form of a grating
incorporating a hinged trap-door immediately under the ladder.
All manholes on sewers of 1 m diameter and over should be provided with
provision for fixing safety chains (galvanized wrought-iron close link, 6 or 10 mm)
for placing across the mouth of the sewer on the down- stream side when men are at
work, and galvanized pipe hand-rail, (nominal 38 mm bore) should be provided on
67

the edges of all benching, platforms, etc, to prevent possibility of a man falling into
the sewer.
If ground conditions are such as to give rise to excessive risk of settlement
and consequential damage to the manhole or sewer a concrete slab shall be provided
at the top of the shaft to receive the cover frame. This should be independent of the
shaft in order to avoid transmitting traffic shocks to the manhole. Any subsidence of
the backfilling on which the slab rests, shall be brought to the required road level
without disturbing or damaging the pipe or the shaft.
No manhole shall be permitted inside a building or in any passage, therein.
In cascades and ramps, hand-rails and chains should be provided for the
safety of workmen as recommended by IS 4111 (Part-1): 1986 (Ref. 13).
4.6.6 Hazards caused by stray voltage in manholes
In urban areas, stray voltage issues have become a significant concern for
utilities. At some places it was electrocuted after stepping on a metal manhole cover.
One solution is the Electrified Cover Safeguard invention, which is an on-site, real-
time stray voltage warning system and other utilities and municipalities in European
countries.
68

Fig 4.14 Pipes, Bends and tees nomenclature
69

4.7 COST ESTIMATION AS PER QUANTITY
The cost estimation as studied in CE0411 Estimation cost and professional
practice, is carried out for individual quantity as per latest pricing records proposed
by PWD where each cost includes transportation of materials, labor charges, various
taxes and construction execution as shown in the Table 4.8 (Ref. 8).
Table 4.8 Cost estimation of underground drainage system
S.No.
Description Nos. Measurement Quantity (m3)
Rates per
meter (rs)
Amount in (Rs)L(m) B(m) D(m)
1. ExcavationI. For 650 mm pipe
diameterII. For 150 mm pipe
diameterIII. For 230 mm pipe
diameterIV. For 100 mm pipe
diameterV. Manhole digging
VI. Stormwater open channel
1
1
1
1
161
573.25
229.38
65.07
23.49
-875
1.2
0.3
0.45
0.2
-2.262
1.1
0.5
0.6
0.425
-1.931
756.69
34.07
17.56
1.99
-3822
39.5
39.5
39.5
39.5
2039.5
29889.25
1359
693.9
78.86
320150969
2. Concrete BeddingI. For 650 mm pipe
diameterII. For 150 mm pipe
diameterIII. For 230 mm pipe
diameterIV. For 100 mm pipe
diameterV. Concrete lining
for open channel
1
1
1
1
1
573.25
229.38
65.07
23.49
875
1.2
0.3
0.45
0.2
2.262
0.48
0.115
0.17
0.075
0.2
333.63
7.91
5.12
0.35
395
1170
1170
1170
1170
1170
390350
9258.92
6000
412.25
462150
3. Removing earth and refilling
I. For 650 mm pipe diameter
II. For 150 mm pipe diameter
III. For 230 mm pipe diameter
1
1
1
-
-
-
-
-
-
-
-
-
423.06
26.49
12.44
33
33
33
13960.98
874.4
410.52
70
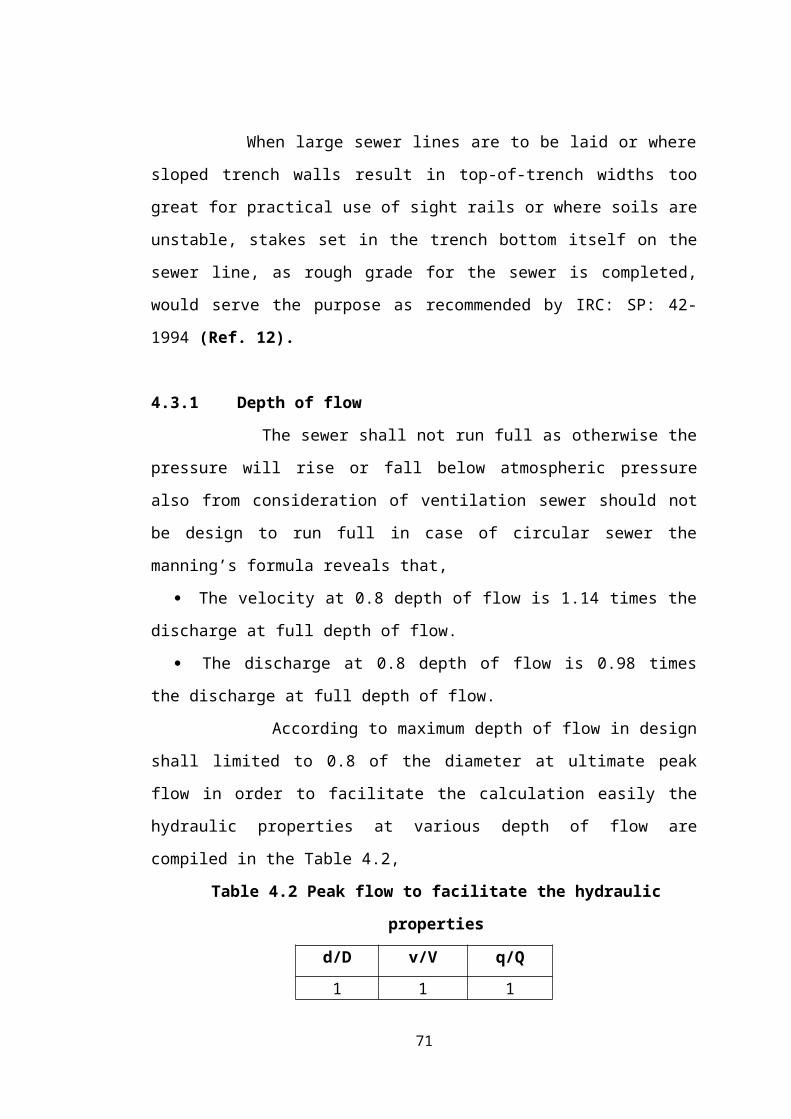
IV. For 100 mm pipe diameter
1 - - - 0.97 33 32.01
4. Breaking of pavement - - - 405.39 26 10540.24
5. Pipeline I. For 650 mm pipe
diameterII. For 150 mm pipe
diameterIII. For 230 mm pipe
diameterIV. For 100 mm pipe
diameter
314
126
36
5
573.25
229.38
65.07
23.49
-
-
-
-
-
-
-
-
-
-
-
-
390 Rs
130 Rs
280 Rs
85 Rs
122460
16380
10080
425
6. ManholeI. Cement concrete
with plinth in cement mortar (1:4:8)
II. Cement concrete (1:2:4) with brick work
III. Cement plaster (1:3)
IV. Reinforced cement concrete (1:2:4)
V. Mild steel reinforcements for slab
VI. Rectangular cover 455x610 mm with frame
VII. Carriage of C.I. cover & frame
VIII. Painting of C.I. cover & frame with coal tar
16
16
16
16
16
16
16
16
-
-
-
-
-
-
-
-
-
-
-
-
-
-
-
-
-
-
-
-
-
-
-
-
0.43
0.34
0.16
0.25
10.57 kg
1 unit
6.76
6.76
3593.3
3508.25
4514.05
173.10
56.7 Rs/kg
1415
1.49
1.49
24721.92
19084.88
11555.96
692.4
9589.10
22640
161.16
161.16
71

IV.8 ABSTRACT ESTIMATION
The abstract estimate as studied in CE0411 Estimation cost and professional
practice, is the total cost of all the items used with combined quantity and rates. This
gives the total cost of an item to be purchased as shown in the Table 4.9 (Ref. 8).
Table 4.9 The abstract estimation of the underground drainage system
S.no. Quantity (m3) Description Rate
(Rs)
Per Amount
(Rs)
1 810.31 Excavation 39.5 m3 32022
2 3470.01 Concrete bedding 1170 m3 406020
3 462.96 Removing earth
and refilling
33 m3 1577.91
4 16 Digging manhole
holes
20 hole 320
5 405.394 Breaking of
pavement
26 m2 10540.24
6 481 Pipeline Depends
on
diameter
No. 149345
7 16 Manhole Varying unit 88606.58
Total
=
688431.73
Add 1% of electrical work = Rs. 6,884.31
Add 1% of Sanitary settings = Rs. 6,884.31
Add 5% of lump sum and miscellaneous = Rs. 34,421.5
TOTAL COST = Rs. 7,36,621.93
72

CHAPTER 5
CONCLUSION
5.1 CONCLUSION
Drainage and sewerage system have always been part of essential
infrastructure in modern cities and town. In SRM university separate systems are
provided for collection and disposal of sewage and storm water.
Over the past ten years, population in SRM University has increase significantly.
This has led to an increase in water consumption and a consequential increase in
quantity of waste water to be handled.
The project study concluded that rapid developments in the study area have
resulted in higher runoff and some existing drainage systems are inadequate in
respect to flood protection capacities. Consequently, severe flooding and overflowing
occurs in these low-lying areas during heavy rainfall. The environmental constraints
were eradicated by undergoing the construction in winters to increase efficiency and
optimum anti-corrosive measures are undertaken. Use high performance concrete is
adopted in order to resolve the sustainability constraint. Most economical design
methods are done using economically efficient products in order to avoid economical
constraints. The proposed drainage improvements to be carried out under the project
involve the construction of the underground drainage system and an open channel at
SRM university hostel.
V.2 FUTURE SCOPE OF THE PROJECT
The future scope of the project includes the design of underground drainage
system in the main campus and fuses it with the latter drainage system to enhance the
arsenal of the project.
73
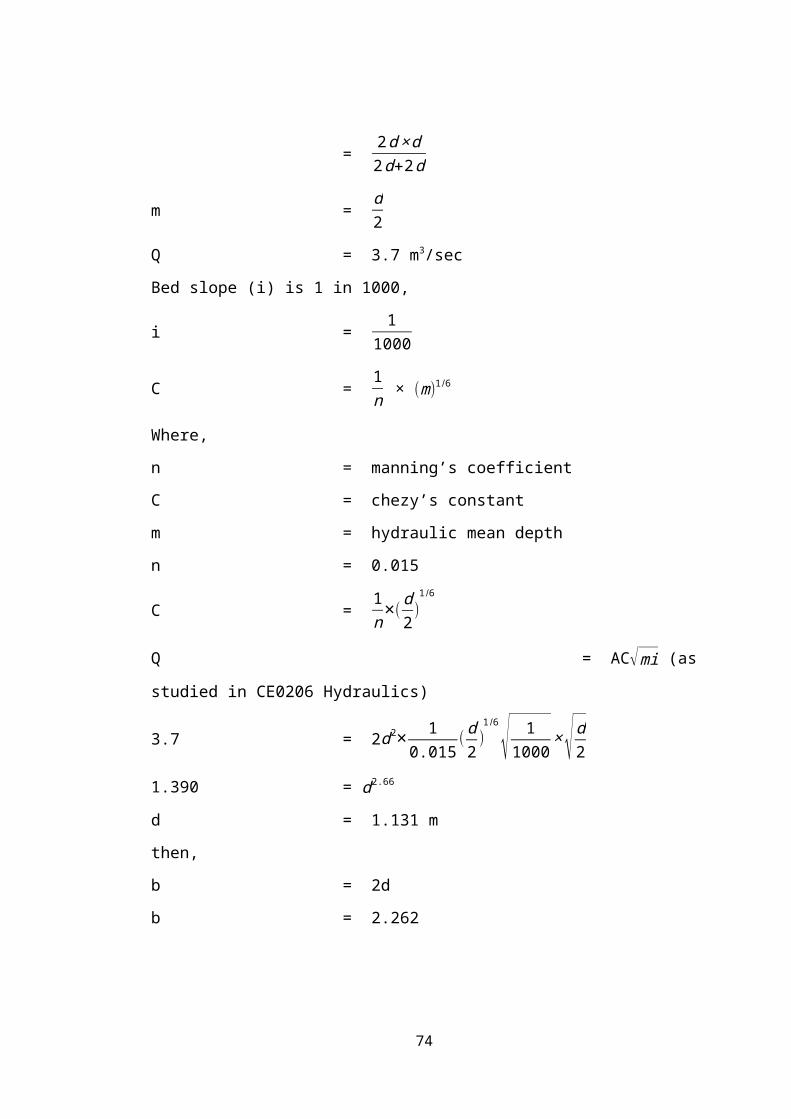
REFERENCE
1. http://en.wikipedia.org/wiki/Drainage_system, retrieved on September 12, 2013 at 9.45am.
2. http://www.imd.gov.in/section/hydro/distrainfall/webrain/tamilnadu/kanchipuram.txt, retrieved on September 15, 2013 at 7.15pm.
3. G.s. bajwa, 2010, public health engineering, storm water drainage, pg356
4. Jack Q. Zhao, 1998, P.Eng., Durability and Performance of Gravity Pipes
5. Linsley r.k., m.a. Kohler and j.h.l. Paulhus, 1975, hydrology for engineers, 2nd edition, pg112
6. S.k. garg, 2008, environmental engineering, vol 2, sewage treatment, pg 102, 104
7. http://www.gladdingmcbean.com/docs/PipeBrochure.pdf, retrieved on January 11, 2014 at 3.25pm.
8. S.k. garg, 2006, environmental engineering, vol 1, water suppy engineering
9. IS 1742 – 1983, Code Of Practice For Building Drainage (Second Revision)
10. IS 1172 – 1993, Code Of Basic Requirements For Water Supply, Drainage And Sanitation (Fourth Revision)
11. IS 2527 – 1984, Code Of Practice For Fixing Rainwater Gutters And Downpipes For Roof Drainage (First Revision)
12. IRC:SP:42 - 1994, Guidelines On Road Drainage13. IS 4111 – 1986, Code Of Practice For Ancillary Structures In Sewerage
System: Part I Manholes (First Revision)
74