1.SMU MB 050 RM (MBA 3 Sem )
47
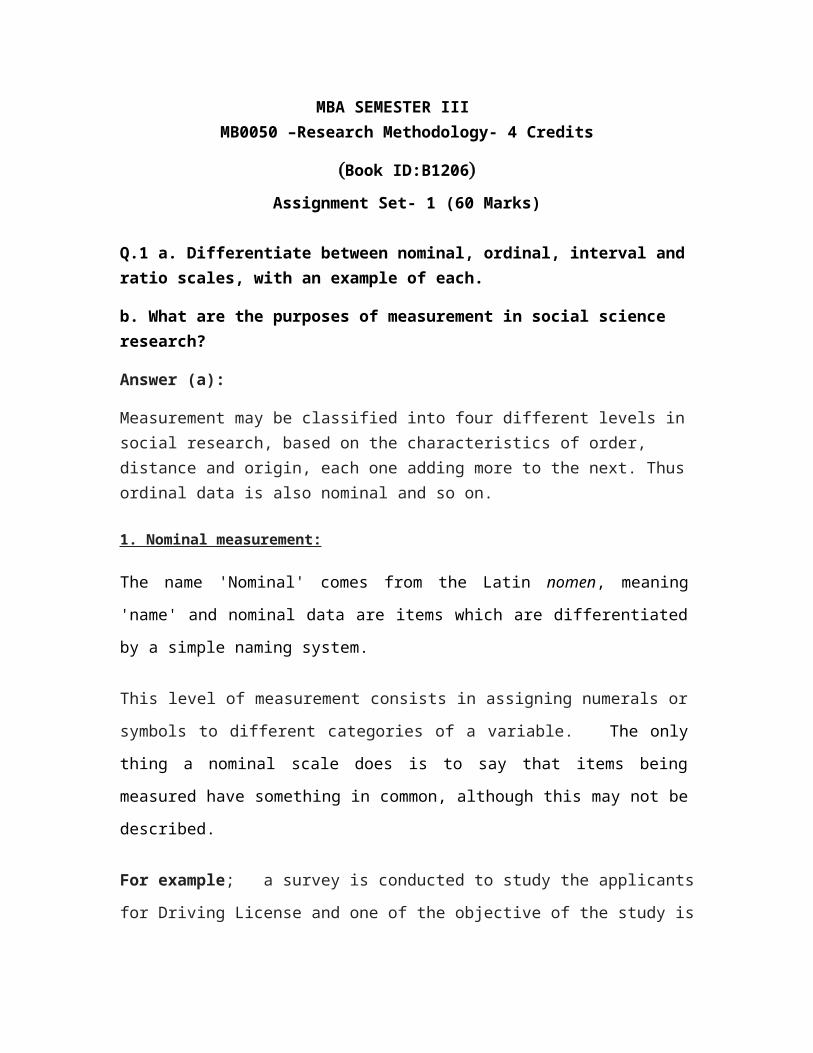
MBA SEMESTER III MB0050 –Research Methodology- 4 Credits ( Book ID:B1206 ) Assignment Set- 1 (60 Marks) Q.1 a. Differentiate between nominal, ordinal, interval and ratio scales, with an example of each. b. What are the purposes of measurement in social science research? Answer (a): Measurement may be classified into four different levels in social research, based on the characteristics of order, distance and origin, each one adding more to the next. Thus ordinal data is also nominal and so on. 1. Nominal measurement: The name 'Nominal' comes from the Latin nomen, meaning 'name' and nominal data are items which are differentiated by a simple naming system. This level of measurement consists in assigning numerals or symbols to different categories of a variable. The only thing a nominal scale does is to say that items being measured have something in common, although this may not be described. For example; a survey is conducted to study the applicants for Driving License and one of the objective of the study is
Transcript of 1.SMU MB 050 RM (MBA 3 Sem )
MBA SEMESTER IIIMB0050 –Research Methodology- 4 Credits
(Book ID:B1206)Assignment Set- 1 )60 Marks(
Q.1 a. Differentiate between nominal, ordinal, interval and ratio scales, with an example of each.
b. What are the purposes of measurement in social science research?
Answer )a(:
Measurement may be classified into four different levels in social research, based on the characteristics of order, distance and origin, each one adding more to the next. Thus ordinal data is also nominal and so on.
1. Nominal measurement:
The name 'Nominal' comes from the Latin nomen, meaning 'name' and nominal data are
items which are differentiated by a simple naming system.
This level of measurement consists in assigning numerals or symbols to different
categories of a variable. The only thing a nominal scale does is to say that items being
measured have something in common, although this may not be described.
For example; a survey is conducted to study the applicants for Driving License and one
of the objective of the study is to fine out the sex-wise break-up of applicants. In this
case, we may assign the number “0” to male applicant and number “1” to female
applicants. Thus number may be used to label individuals, events or things.
The numerals or symbols are just labels and have no quantitative value. The numbers of
cases under each category are counted. Nominal measurement is therefore the simplest
level of measurement. It does not have characteristics such as order, distance or
arithmetic origin.
A categorical variable, also called a nominal variable, is for mutual exclusive, but not ordered, categories. For example, a study might compare five different genotypes. We can code the five genotypes with numbers if we want, but the order is arbitrary and any calculations (for example, computing an average) would be meaningless.
2. Ordinal measurement:
In this level of measurement, persons or objects are assigned numerals which indicate
ranks with respect to one or more properties, either in ascending or descending order.
Example: Individuals may be ranked according to their “socio-economic class”, which
is measured by a combination of income, education, occupation and wealth. The
individual with the highest score might be assigned rank 1, the next highest rank 2, and so
on, or vice versa.
The numbers in this level of measurement indicate only rank order and not equal distance
or absolute quantities. This means that the distance between ranks 1 and 2 is not
necessarily equal to the distance between ranks 2 and 3.
Ordinal scales may be constructed using rank order, rating and paired comparisons.
Variables that lend themselves to ordinal measurement include preferences, ratings of
organizations and economic status. Statistical techniques that are commonly used to
analyze ordinal scale data are the median and rank order correlation coefficients.
It is one where the order matters but not the difference between values.
For example, you might ask patients to express the amount of pain they are feeling on a
scale of 1 to 10. A score of 7 means more pain that a score of 5, and that is more than a
score of 3. But the difference between the 7 and the 5 may not be the same as that
between 5 and 3. The values simply express an order. Another example would be movie
ratings, from --- to ----.
3. Interval measurement:
This level of measurement is more powerful than the nominal and ordinal levels of
measurement, since it has one additional characteristic – equality of distance. However, it
does not have an origin or a true zero. This implies that it is not possible to multiply or
divide the numbers on an interval scale.
A interval variable is a measurement where the difference between two values is
meaningful. The difference between a temperature of 100 degrees and 90 degrees is the
same difference as between 90 degrees and 80 degrees.
Example: The Centigrade or Fahrenheit temperature gauge is an example of the interval
level of measurement. A temperature of 50 degrees is exactly 10 degrees hotter than 40
degrees and 10 degrees cooler than 60 degrees.
Since interval scales are more powerful than nominal or ordinal scales, they also lend
themselves to more powerful statistical techniques, such as standard deviation, product
moment correlation and “t” tests and “F” tests of significance.
4. Ratio measurement:
This is the highest level of measurement and is appropriate when measuring
characteristics which have an absolute zero point. This level of measurement has all the
three characteristics – order, distance and origin.
Examples : Height, weight, distance and area.
Since there is a natural zero, it is possible to multiply and divide the numbers on a ratio
scale. Apart from being able to use all the statistical techniques that are used with the
nominal, ordinal and interval scales, techniques like the geometric mean and coefficient
of variation may also be used.
The main limitation of ratio measurement is that it cannot be used for characteristics such
as leadership quality, happiness, satisfaction and other properties which do not have
natural zero points.
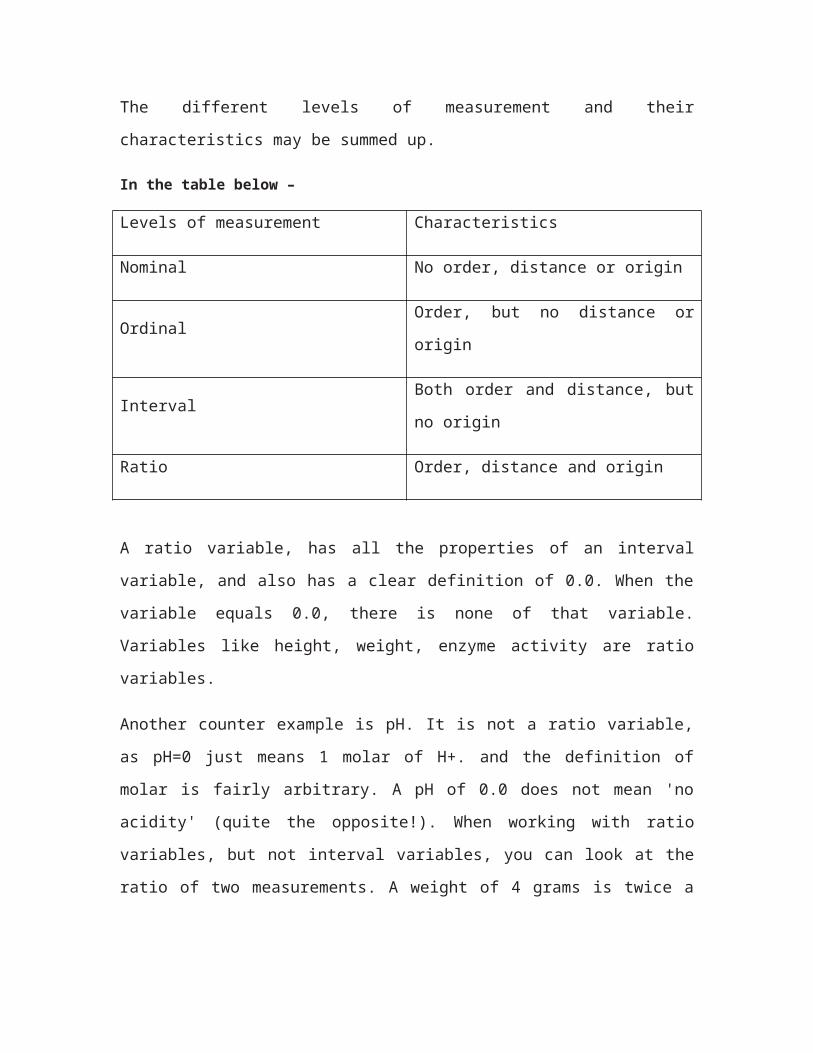
The different levels of measurement and their characteristics may be summed up.
In the table below –
Levels of measurement Characteristics
Nominal No order, distance or origin
Ordinal Order, but no distance or origin
Interval Both order and distance, but no origin
Ratio Order, distance and origin
A ratio variable, has all the properties of an interval variable, and also has a clear
definition of 0.0. When the variable equals 0.0, there is none of that variable. Variables
like height, weight, enzyme activity are ratio variables.
Another counter example is pH. It is not a ratio variable, as pH=0 just means 1 molar of
H+. and the definition of molar is fairly arbitrary. A pH of 0.0 does not mean 'no acidity'
(quite the opposite!). When working with ratio variables, but not interval variables, you
can look at the ratio of two measurements. A weight of 4 grams is twice a weight of 2
grams, because weight is a ratio variable. A temperature of 100 degrees C is not twice as
hot as 50 degrees C, because temperature C is not a ratio variable. A pH of 3 is not twice
as acidic as a pH of 6, because pH is not a ratio variable.
Different definitions of measurement have been offered by different authors–
1. According to Stevens, measurement is “the assignment of numerals to objects or
events according to rules.”
A simple example of assignment of numerals according to a rule is described below:
Suppose a survey is conducted to study the applicants of an MBA program and one of the
objectives of the study is to find out the sex-wise break-up of applicants. In this case, we
may assign the number “0” to male applicants and the number “1” to female applicants.
Thus numbers may be used to label individuals, events or things.
2. Campbell defines measurement as “the assignment of numbers to represent
properties.”
3. In the words of Torgerson, measurement is “the assignment of numbers to objects to
represent amounts or degrees of a property possessed by all of the objects.
In research, it is necessary to distinguish between “objects” and “properties’ or
characteristics of these objects. For example, a person is an object and his/her physical
characteristics include height, weight, color, etc. while his or her psychological
characteristics include intelligence and attitudes. The important point to remember is that
the researcher is concerned with measuring properties and not the objects themselves.
While physical properties may be directly observed, psychological properties such as
intelligence are inferred. For example, a child’s score in an IQ test indicates his or her
level of intelligence.
b. Purposes of measurement in social science research:
Measurement also has several purposes :
One of the primary purposes of classifying variables according to their level or scale of
measurement is to facilitate the choice of a statistical test used to analyze the data. There
are certain statistical analyses which are only meaningful for data which are measured at
certain measurement scales. For example, it is generally inappropriate to compute the
mean for Nominal variables. Suppose you had 20 subjects, 12 of which were male, and 8
of which were female. If you assigned males a value of '1' and females a value of '2',
could you compute the mean sex of subjects in your sample? It is possible to compute a
mean value, but how meaningful would that be? How would you interpret a mean sex of
1.4? When you are examining a Nominal variable such as sex, it is more appropriate to
compute a statistic such as a percentage (60% of the sample was male).
When a research wishes to examine the relationship or association between two variables,
there are also guidelines concerning which statistical tests are appropriate.
For example, let's say a University administrator was interested in the relationship
between student gender (a Nominal variable) and major field of study (another Nominal
variable). In this case, the most appropriate measure of association between gender and
major would be a Chi-Square test. Let's say our University administrator was interested
in the relationship between undergraduate major and starting salary of students' first job
after graduation. In this case, salary is not a Nominal variable; it is a ratio level variable.
The appropriate test of association between undergraduate major and salary would be a
one-way Analysis of Variance (ANOVA), to see if the mean starting salary is related to
undergraduate major.
Finally, suppose we were interested in the relationship between undergraduate grade
point average and starting salary. In this case, both grade point average and starting salary
are ratio level variables. Now, neither Chi-square nor ANOVA would be appropriate;
instead, we would look at the relationship between these two variables using the Pearson
correlation coefficient
Further;
the researcher constructs theories to explain social and psychological phenomena
(e.g. labor unrest, employee satisfaction), which in turn are used to derive
hypotheses or assumptions. These hypotheses can be verified statistically only by
measuring the variables in the hypotheses.
Measurement makes the empirical description of social and psychological
phenomena easier.
Example: When conducting a study of a tribal community, measuring devices
help the researcher in classifying cultural patterns and behaviors.
Measurement also makes it possible to quantify variables and use statistical
techniques to analyze the data gathered.
Measurement enables the researcher to classify individuals or objects and to
compare them in terms of specific properties or characteristics by measuring the
concerned variables.
Examples : Comparison of male and female students’ performance in college exams or
of length of stay on the job of older and younger employees.
------------------------------------------------------------------------------------------------------------
Q.2. a. What are the sources from which one may be able to identify research problems?
b. Why literature survey is important in research?
Answer )a(:
R. L. Ackoffs analysis affords considerable guidance in identifying problem for research.
He visualizes five components of a problem.
1) Research-consumer: There must be an individual or a group which experiences some
difficulty.
2) Research-consumer’s Objectives: The research-consumer must have available,
alternative means for achieving the objectives he desires.
3) Alternative Means to Meet the Objectives: The research-consumer must have
available, alternative means for achieving the objectives he desires.
4) Doubt in Regard to Selection of Alternatives: The existence of alternative courses of
action in not enough; in order to experience a problem, the research consumer must have
some doubt as to which alternative to select.
5) There must be One or More Environments to which the Difficulty or Problem Pertains:
A change in environment may produce or remove a problem. A research-consumer may
have doubts as to which will be the most efficient means in one environment but would
have no such doubt in another.
Identifying research Problem :
This involves the identification of a general topic and formulating it into a specific
research problem. It requires thorough understanding of the problem and rephrasing it in
meaningful terms from an analytical point of view.
The sources from which one may be able to identify research problems or develop problems awareness are:
• Review of literature
• Academic experience
• Daily experience
• Exposure to field situations
• Consultations
• Brain storming
• Research
• Intuition
Review of Literature:
Review of literature is a systematic process that requires careful and perceptive reading and attention to detail. In the review of the literature, the researcher attempts to determine what others have learned about similar research problems. It is important in the following ways:
specifically limiting and identifying the research problem and possible hypothesis or research questions i.e. sharpening the focus of the research.
informing the researcher of what has already been done in the area. This helps to avoid exact duplication.
“If one had the literature and exercised enough patience and industry in reviewing
available literature, it may well be that his problem has already been solved by someone
somewhere some time ago and he will save himself the trouble.” Nwana (1982).
Providing insights into possible research designs and methods of conducting the research and interpreting the results.
Providing suggestions for possible modifications in the research to avoid unanticipated difficulties.
The library can be an ideal physical location for the research literature. The availability
and access to books, periodicals, technical reports and academic theses facilitate the
researcher. Other sources are the Education Index and the Educational Resources
information centre (ERIC). Computer-assisted searchers of literature have become very
common today with advantage of comprehensiveness and speed. They are cost-effective
in terms of time and effort and sometimes access to some of the databases requires
payment. Irrespective of the sources of the literature, ethics of research require that the
source is acknowledged through a clear system of referencing.
Generally, an exploratory study is concerned with an area of subject matter in which
explicit hypothesis have not yet been formulated. The researcher’s task is to review the
available material checking the possibilities of developing hypothesis from it. In some
areas of the subject matter, hypothesis may have already been stated by previous research
workers. In such cases, the researcher has to take stock of these various hypotheses with a
view to evaluating their usefulness for further research and to consider whether they
suggest any new hypothesis. Sociological journals, economic reviews, the bulletin of
abstracts of current social sciences research, directory of doctoral dissertation accepted by
universities etc afford a rich store of valuable clues. In addition to these general sources,
some governmental agencies and voluntary organizations publish listings of summaries
of research in their special fields of service. Professional organizations, research groups
and voluntary organizations are a constant source of information about unpublished
works in their special fields.
Further, there are four main possible sources of research opportunities: private
laboratories, universities, hospitals, and government research agencies.
When looking for research opportunities, look at the
international research community. The best way to get involved is to participate
in research reviews. Many journals and publications actively solicit submission
reviewers. As part of this role, you can gain a unique perspective on the research being
completed and the key team members.
Some more ways to find research opportunities are:
to become a graduate student. Every doctoral student is required to publish a
thesis. This is a unique research project. In order to prepare for this task, master's
and doctoral students are required to complete a series of research projects.
To identify opportunities is to subscribe to the journals in your area of expertise.
Read on the different research projects underway and make contact with the lead
researcher to identify research opportunities.
The selection of one appropriate researchable problem out of the identified problems
requires evaluation of those alternatives against certain criteria, which may be grouped
into:
A. Internal Source :
Internal Criteria consists of:
1( Researcher’s interest: The problem should be of researcher’s interest and be a
challenge to him. And curiosity may develop sustained perseverance and small
difficulties may not become an excuse for discontinuing the study. Interest in a problem
depends upon the researcher’s educational background, experience, outlook and
sensitivity.
2( Researcher’s competence: The researcher must be competent, must have ability and
possess adequate knowledge of subject-matter to deal with the problem and should be
aware of relevant methodology and statistical procedures.
3( Researcher’s own resource: To carry out research and complete on his own, a
researcher should consider his financial resources and limits. If it is beyond his means, he
needs some external financial support. Time is equally or more important than finance
and should be properly planned and utilized.
B. External Source:
1( Research-ability of the problem: The problem should be researchable, i.e.,
amendable for finding answers to the questions involved in it through scientific method.
For this, a question must be one for which observation or other data collection in the real
world can provide the answer.
2( Importance and urgency: Selection of the Problem for research should be on priority
basis of importance and urgency as Problems requiring investigation are unlimited, but
available research efforts are very much limited.
3( Novelty of the problem: The problem must have novelty. Necessity for selection of
problem already studied must be considered carefully checking its utility.
4( Feasibility: A problem may be a new one and also important, but if research on it is
not feasible, it cannot be selected. Hence feasibility is a very important consideration
5( Facilities: Research requires certain facilities such as well-equipped library facility,
suitable and competent guidance, data analysis facility, etc. Hence the availability of the
facilities relevant to the problem must be considered.
6( Usefulness and social relevance: Above all, the study of the problem should make
significant contribution to the concerned body of knowledge or to the solution of some
significant practical problem. It should be socially relevant. This consideration is
particularly important in the case of higher level academic research and sponsored
research.
7( Research personnel: Research undertaken by professors and by research
organizations require the services of investigators and research officers. But in India and
other developing countries, research has not yet become a prospective profession. Hence
talent persons are not attracted to research projects.
Each identified problem must be evaluated in terms of the above internal and external
criteria and the most appropriate one may be selected by a research scholar.
b. Why literature survey is important in research? [ 5 marks]
The review of concerning literature is the most simple and fruitful method of formulating
the research problem or developing hypothesis. Hypothesis mentioned by earlier workers
may be reviewed and its usefulness is evaluated as a basis for further research or it may
suggest new hypothesis. In this way the researcher review and build upon the work
already done by others. And if it is new, his task is to review the valuable material for
deriving the relevant hypothesis from it. Besides, he make the bibliographical review of
studies, already made in one’s area of interest. He should also attempt to apply concepts
and theories developed in different research contents to the area in which he is himself
working.
Sometimes the works of creative writers also provide good opportunities for hypothesis formulation.
Sociological journals, economic reviews, the bulletin of abstracts of current social
sciences research, directory of doctoral dissertation accepted by universities etc afford a
rich store of valuable clues. In addition to these general sources, some governmental
agencies and voluntary organizations publish listings of summaries of research in their
special fields of service. Professional organizations, research groups and voluntary
organizations are a constant source of information about unpublished works in their
special fields.
Literature Survey is a study involving a collection of literatures in the selected area of research in which the researcher has limited experience, and critical examination and comparison of them to have better understanding. It also helps the researchers to update with the past data, data sources and results, which will be useful for related researches in future.
Some examples of such researches are review of wholesale price index, demographic analysis, periodic stock exchange index reports, cross comparison of census details of different countries, etc.
Some key questions to ask are:
- whether researcher surveyed and described relevant studies related to the problem?
- Whether Researcher surveyed existing experts opinion of the problem?
- Has the Researcher summarized the existing state of opinion and research on the problem?
- Until literature is reviewed, there is no way of knowing whether the research question has already been adequately answered, of identifying the conceptual and practical obstacles that others have already encountered in the line of research, of learning how those obstacles have been overcome, and of deciding what lines of research can best build on the work that has already been done in a particular problem area.
- It is a prime source of selecting a research question to begin with.
===============================================================
Q.3. a. What are the characteristics of a good research design?
b. What are the components of a research design?
Ans a:
The preparation of a research design is an important step in the research design. A research design is a written plan for a study.
According to W. Boyd and Westfall, Research design is a specified pattern of frame work for controlling the collection of data accurately and economically.”
Thomas Kinner defines research design as “ the basic plan which guides the data collection and analyses the phases of the project. It is the frame work which specifies the type of information to be collected, the sources of data and the data collection procedure.”
Thus, Research design is a logical and systematic plan prepared for conducting a research study. It is comparable to blue print which the architect prepare before construction of the building commences.
“A research design is the arrangement of conditions for collection and analysis of data in a manner that aims to combine relevance to the research purpose with economy in procedure” Is the conceptual structure within which research is conducted; it constitutes the blueprint for the collection, measurement and analysis of data more explicitly:
i.What is the study about?
ii.Why is the study being conducted?
iii.Where will the study be carried out?
iv.What type of data is required?
v.Where can the required data be found?
Characteristics of a Good Research Design are as follows:-
1. It is a series of guide posts to keep one going in the right direction.
2. It reduces wastage of time and cost.
3. It encourages co-ordination and effective organization.
4. It is a tentative plan which undergoes modifications, as circumstances demand, when
the study progresses, new aspects, new conditions and new relationships come to
light and insight into the study deepens.
5. It has to be geared to the availability of data and the cooperation of the informants.
6. It has also to be kept within the manageable limits
Components of Research Design are :
It is important to be familiar with the important concepts relating to research design.
They are:
1 . Dependent and Independent variables:
A magnitude that varies is known as a variable. The concept may assume different
quantitative values, like height, weight, income, etc. Qualitative variables are not
quantifiable in the strictest sense of objectivity. However, the qualitative phenomena may
also be quantified in terms of the presence or absence of the attribute considered.
Phenomena that assume different values quantitatively even in decimal points are known
as ‘continuous variables’. But, all variables need not be continuous. Values that can be
expressed only in integer values are called ‘non-continuous variables’. In statistical term,
they are also known as ‘discrete variable’. For example, age is a continuous variable;
whereas the number of children is a non-continuous variable. When changes in one
variable depends upon the changes in one or more other variables, it is known as a
dependent or endogenous variable, and the variables that cause the changes in the
dependent variable are known as the independent or explanatory or exogenous variables.
For example, if demand depends upon price, then demand is a dependent variable, while
price is the independent variable. And if, more variables determine demand, like income
and prices of substitute commodity, then demand also depends upon them in addition to
the own price. Then, demand is a dependent variable which is determined by the
independent variables like own price, income and price of substitute.
2. Extraneous variable:
The independent variables which are not directly related to the purpose of the study but
affect the dependent variable are known as extraneous variables. For instance, assume
that a researcher wants to test the hypothesis that there is relationship between children’s
school performance and their self-concepts, in which case the latter is an independent
variable and the former, the dependent variable. In this context, intelligence may also
influence the school performance. However, since it is not directly related to the purpose
of the study undertaken by the researcher, it would be known as an extraneous variable.
The influence caused by the extraneous variable on the dependent variable is technically
called as an ‘experimental error’. Therefore, a research study should always be framed in
such a manner that the dependent variable completely influences the change in the
independent variable and any other extraneous variable or variables.
3. Control:
One of the most important features of a good research design is to minimize the effect of
extraneous variable. Technically, the term control is used when a researcher designs the
study in such a manner that it minimizes the effects of extraneous independent variables.
The term control is used in experimental research to reflect the restrain in experimental
conditions.
4. Confounded relationship:
The relationship between dependent and independent variables is said to be confounded
by an extraneous variable, when the dependent variable is not free from its effects.
Research hypothesis: When a prediction or a hypothesized relationship is tested
by adopting scientific methods, it is known as research hypothesis. The research
hypothesis is a predictive statement which relates a dependent variable and an
independent variable. Generally, a research hypothesis must consist of at least one
dependent variable and one independent variable. Whereas, the relationships that
are assumed but not be tested are predictive statements that are not to be
objectively verified are not classified as research hypothesis.
Experimental and control groups: When a group is exposed to usual conditions
in an experimental hypothesis-testing research, it is known as ‘control group’. On
the other hand, when the group is exposed to certain new or special condition, it is
known as an ‘experimental group’. In the afore-mentioned example, the Group A
can be called a control group and the Group B an experimental one. If both the
groups A and B are exposed to some special feature, then both the groups may be
called as ‘experimental groups’. A research design may include only the
experimental group or the both experimental and control groups together.
Treatments: Treatments are referred to the different conditions to which the
experimental and control groups are subject to. In the example considered, the
two treatments are the parents with regular earnings and those with no regular
earnings. Likewise, if a research study attempts to examine through an experiment
regarding the comparative impacts of three different types of fertilizers on the
yield of rice crop, then the three types of fertilizers would be treated as the three
treatments.
Experiment: An experiment refers to the process of verifying the truth of a
statistical hypothesis relating to a given research problem. For instance,
experiment may be conducted to examine the yield of a certain new variety of rice
crop developed. Further, Experiments may be categorized into two types namely,
absolute experiment and comparative experiment. If a researcher wishes to
determine the impact of a chemical fertilizer on the yield of a particular variety of
rice crop, then it is known as absolute experiment. Meanwhile, if the researcher
wishes to determine the impact of chemical fertilizer as compared to the impact of
bio-fertilizer, then the experiment is known as a comparative experiment.
Experiment unit: Experimental units refer to the predetermined plots,
characteristics or the blocks, to which the different treatments are applied. It is
worth mentioning here that such experimental units must be selected with great
caution.
===============================================================
Q4. a. Distinguish between Doubles sampling and multiphase sampling.b. What is replicated or interpenetrating sampling?
Answer: Double Sampling and Multiphase Sampling :
Double sampling is resorted to when further information is needed from a subset of the
group from which some information has already been collected for the same study. A
sampling design where initially a sample is used in a study to collected some preliminary
information of interest, and later a subsample of this primary sample is used to examine
the matter in more detail, is called double sampling.
For example, a structured interview might indicate that a subgroup of the respondents
has more insight into the problems of the organization. These respondents might be called
again and asked additional questions. This research adopts a double sampling method.
A double sampling approach or a sample within a sample approach can be used to get the
population of well informed people, whose opinions are of greater importance to the
researcher than the opinions of comparatively less well informed.
In other words, Double sampling or two-phase sampling refers to the subsection of the
final sample form a pre-selected larger sample that provided information for improving
the final selection. When the procedure is extended to more than two phases of selection,
it is then, called multi-phase sampling. This is also known as sequential sampling, as
sub-sampling is done from a main sample in phases. Double sampling or multiphase
sampling is a compromise solution for a dilemma posed by undesirable extremes. “The
statistics based on the sample of ‘n’ can be improved by using ancillary information from
a wide base: but this is too costly to obtain from the entire population of N elements.
Instead, information is obtained from a larger preliminary sample nL which includes the
final sample n. extraneous Double sampling refers to the subsection of the final sample
form a pre-selected larger sample that provided information for improving the final
selection. When the procedure is extended to more than two phases of selection, it is then,
called multi-phase sampling. This is also known as sequential sampling, as sub-sampling
is done from a main sample in phases. Double sampling or multiphase sampling is a
compromise solution for a dilemma posed by undesirable extremes. “The statistics based
on the sample of ‘n’ can be improved by using ancillary information from a wide base:
but this is too costly to obtain from the entire population of N elements. Instead,
information is obtained from a larger preliminary sample nL which includes the final
sample n.
In multi-phase sampling the purpose change at each phase. For example, at phase one the
selection of sample might be based on the criterion of geography (region), phase two
might be based on an economic criterion (standard of living), phase three might be based
on a political criterion ( influence of a political system of party) and so on.
b. Replicated or interpenetrating sampling:
It involves selection of a certain number of sub-samples rather than one full sample from
a population. All the sub-samples should be drawn using the same sampling technique
and each is a self-contained and adequate sample of the population. Replicated sampling
can be used with any basic sampling technique: simple or stratified, single or multi-stage
or single or multiphase sampling. It provides a simple means of calculating the sampling
error. It is practical. The replicated samples can throw light on variable non-sampling
errors. But disadvantage is that it limits the amount of stratification that can be employed.
Interpenetrating replicate subsamples, are useful in measuring the degree of agreement of
the results of successive samples. They are also useful in obtaining crash estimates. One
subsample can be used for this purpose prior to calculation of a final estimate from the
entire sample. A further use is to check one enumerator against another by giving each a
separate subsample to work on. For example, there are 1,000 one-kilogram bags of an
item numbered 1 to 1,000 consecutively. We might select 10 different samples of 10
bags each at random and select 10 items from each bag at random. If we put the 100
items from the first subsample of 10 bags into the 1st of 10 baskets, put the 100 items
from the second subsample of 10 bags into the 2nd of 10 baskets, etc., the 10 baskets of
100 items each would represent 10 interpenetrating replicate sub-samples.

Q. 5. a. How is secondary data useful to researcher?
b. What are the criteria used for evaluation of secondary data?
Answer )a(: Usefulness of secondary data to researcher:
Secondary data are data which have been collected and analyzed by some other agency
for some other purpose. The sources containing data consists readily compendia and
already compiled statistical statements and reports whose data may be used by the
researchers for their studies e.g., census reports, annual reports, financial reports, reports
of Government departments, publication of international organizations such as UNO,
IMF, ILO, WHO, world bank, other statistical statements and so on. Secondary sources
are divers and consists both published and non-published records.
Secondary sources can also be interpretations of primary data. Examples of secondary
data are encyclopedias, textbooks, handbooks, magazine articles, newspaper articles etc.
Secondary data is useful to researcher in the sense that the data is readymade and quickly
available, time saving, cost-effective, tabulated, compiled, covers even a larger area and
fields and consists of all sorts of material.
Mainly the secondary data may be used in three ways by the researcher:
1. Some specific information from secondary sources may be filtered and used for
reference.
For example, the general statistical information in the number of co-operative credit
societies in the country, their coverage of villages, their capital structure, volume of
business etc., may be taken from published reports and quoted as background information
in a study on the evaluation of performance of cooperative credit societies in a selected
district/state.
2. Secondary data may be used as bench marks. The findings of research may be
compared and tested against the pre-set benchmark.
For Example, the findings of a local or regional survey may be compared with the
national averages; the performance indicators of a particular bank may be tested
against the corresponding indicators of the banking industry as a whole; and so on.
3. Secondary data may be used as the sole source of information for a research project.
Such studies as securities Market Behaviour, Financial Analysis and performance of
companies, Trade in credit allocation in commercial banks, sociological studies on
crimes, historical studies and so on, depend primarily on secondary data. Year books,
statistical reports of government departments, report of public organizations of Bureau
of Public Enterprises, Censes Reports etc, serve as major data sources for such
research studies.
Some more uses/advantages of the secondary data are as follows:
4. Secondary data saves time as it can be secured quickly.
5. It covers wider geographical area and longer reference period in a cost-effective
manner. Thus, extends the researcher’s space and time.
6. The use of secondary data broadens the data base from which scientific generalizations
can be made.
7. The use of secondary data broadens the data base from which scientific generalization
can be made.
8. The use of secondary data enables a researcher to verify the findings bases on primary
data. It readily meets the need for additional empirical support. The researcher need
not wait the time.
B. Evaluation of Secondary Data is as follows:-
When a researcher wants to use secondary data for his research, the secondary data are to
be scrutinized before they are compiled from the source and before deciding to use them.
The scrutiny should be made to assess the data pertinence, quality (accuracy, reliability)
and completeness of the data.
1. Data Pertinence : The first consideration in evaluation of secondary data is to
examine the pertinence and suitability of the available secondary data to the research
problem under study. In particular, the conformity of the definitions, units of
measurement and time frame should be checked. For example, one US gallon is different
from one British gallon or one US dollar has a different value than Canadian dollar value.
The following questions should be considered:
• What are the definitions and classifications employed? Are they consistent?
• What are the measurements of variables used? What is the degree to which they
conform to the requirements of our research?
• What is the coverage of the secondary data in terms of topic and time? Does this
coverage fit the needs of our research?
On the basis of above consideration, the pertinence of the secondary data to the research
on hand should be determined, as a researcher who is imaginative and flexible may be
able to redefine his research problem so as to make use of otherwise unusable available
data.
2. Data Quality : The next step is to examine the quality of the data. The quality of data
refers to their accuracy, reliability and completeness. The assurance and reliability of the
available secondary data depends on the organization which collected them, mode of
collection, time period of collection and the purpose for which they were collected.
For example, secondary data collected by a voluntary agency with unskilled investigators
are unlikely to be reliable.
So there is a need to check the authority and prestige of the organization. Is it well
recognized? Is it noted for reliability? It is capable of collecting reliable data? Does it use
trained and well qualified investigators? The answers to these questions determine the
degree of confidence we can have in the data and their accuracy. It is important to go to
the original source of the secondary data rather than to use an immediate source which
has quoted from the original. Then only, the researcher can review the cautionary and
other comments that were made in the original source.
3. Data Completeness and adequacy: The completeness refers to the actual coverage of
the published data. This depends on the methodology and sampling design adopted by the
original organization. Is the methodology sound? Is the sample size small or large? Is the
sampling method appropriate? Answers to these questions may indicate the
appropriateness and adequacy of the data for the problem under study. The question of
possible bias should also be examined. Whether the purpose for which the original
organization collected the data had a particular orientation? Has the study been made to
promote the organization’s own interest? How the study was conducted? These are
important clues. The researcher must be on guard when the source does not report the
methodology and sampling design. Then it is not possible to determine the adequacy of
the secondary data for the researcher’s study.
The source of the data may be suitable and reliable but the data may not be adequate for
the proposed enquiry. The original data may cover a bigger or narrow geographical
region or the data may not cover suitable periods. For example, per capita income of a
country or a state which divided after the data collection date (like Pakistan prior to 1971
and recently Sudan and division of some north eastern states of India, Up, Bihar etc in
recent past) is inadequate for reference during the subsequent periods as they separated
into divisions with considerable variation of revenues and expenditure thus affecting
standard of living.
===============================================================
Q.6 What are the differences between observation and interviewing as methods of
data collection? Give two specific examples of situations where either observation or
interviewing would be more appropriate.
Answer: Observation means viewing or seeing. Observation may be defined as a
systematic viewing of a specific phenomenon in its proper setting for the specific purpose
of gathering data for a particular study. Observation is classical method of scientific
study.
I. Observation as a method of data collection has certain characteristics.
1. It is both a physical and a mental activity:
The observing eye catches many things that are present. But attention is focused
on data that are pertinent to the given study.
2. Observation is selective:
A researcher does not observe anything and everything, but selects the range of
things to be observed on the basis of the nature, scope and objectives of his study.
For example, suppose a researcher desires to study the causes of city road
accidents and also formulated a tentative hypothesis that accidents are caused by
violation of traffic rules and over speeding. When he observed the movements of
vehicles on the road, many things are before his eyes; the type, make, size and
colour of the vehicles, the persons sitting in them, their hair style, etc. All such
things which are not relevant to his study are ignored and only over speeding and
traffic violations are keenly observed by him.
3. Observation is purposive and not casual: It is made for the specific purpose
of noting things relevant to the study. It captures the natural social context in
which persons behavior occur. It grasps the significant events and occurrences
that affect social relations of the participants.
4. Observation should be exact and be based on standardized tools of research
and such as observation schedule, social metric scale etc., and precision
instruments, if any.
II. Interviewing is one of the prominent methods of data collection. It may be defined as
a two way systematic conversation between an investigator and an informant, initiated for
obtaining information relevant to a specific study. It involves not only conversation, but
also learning from the respondent’s gesture, facial expressions and pauses, and his
environment. Interviewing requires face to face contact or contact over telephone and
calls for interviewing skills. It is done by using a structured schedule or an unstructured
guide.
Interviewing may be used either as a main method or as a supplementary one in studies of
persons. Interviewing is the only suitable method for gathering information from illiterate
or less educated respondents. It is useful for collecting a wide range of data from factual
demographic data to highly personal and intimate information relating to a person’s
opinions, attitudes, values, beliefs past experience and future intentions. When qualitative
information is required or probing is necessary to draw out fully, and then interviewing is
required. Where the area covered for the survey is a compact, or when a sufficient
number of qualified interviewers are available, personal interview is feasible.
Interview is often superior to other data-gathering methods. People are usually more
willing to talk than to write. Once report is established, even confidential information
may be obtained. It permits probing into the context and reasons for answers to questions.
Interview can add flesh to statistical information. It enables the investigator to grasp the
behavioral context of the data furnished by the respondents.
There are several advantages to personal interviewing.
First the greatest value of this method is the depth and detail of information that can be
secured. When used with well conceived schedules, an interview can obtain a great deal
of information. It far exceeds mail survey in amount and quality of data that can be
secured.
Second, the interviewer can do more to improve the percentage of responses and the
quality of information received than other method. He can note the conditions of the
interview situation, and adopt appropriate approaches to overcome such problems as the
respondent’s unwillingness, incorrect understanding of questions, suspicion, etc.
Third, the interviewer can gather other supplemental information like economic level,
living conditions etc. through observation of the respondent’s environment.
Fourth, the interviewer can use special scoring devices, visual materials and the like in
order to improve the quality of interviewing.
Fifth, the accuracy and dependability of the answers given by the respondent can be
checked by observation and probing.
Last, interview is flexible and adaptable to individual situations. Even more, control can
be exercised over the interview situation.
Situation where observation is appropriate:
Observations make it possible to capture the whole event as it occurs. For example only
observation can provide an insight into all the aspects of the process of negotiation
between union and management representatives.
To study the Reading habits of newspaper/magazines readers etc.
Observation is suitable for a variety of research purposes. It may be used for studying
(a) The behavior of human beings in purchasing goods and services.: life style, customs,
and manner, interpersonal relations, group dynamics, crowd behavior, leadership styles,
managerial style, other behaviors and actions;
(b) The behavior of other living creatures like birds, animals etc.
(c) Physical characteristics of inanimate things like stores, factories, residences etc.
(d) Flow of traffic and parking problems
(e) movement of materials and products through a plant.
Situation where interview method is appropriate:
The interview method is more appropriate when a direct conversation with the
respondents is preferred. When interviewer wishes to have a direct rapport with the
interviewee and collect first hand information from the original source without using any
mediatory.
For example, in case of a job interview, the HR manager (selector) wishes to interview
the candidate directly to assess the candidate keenly and personally. The aim is to get
answers to the interview questions directly and instantly from the job seeker. In this
method, the interviewer can assess the capabilities of the candidate in terms of subject
knowledge, intelligence, area of expertise or experience, communication skills, level of
understanding etc.
Another example, when a new product/service or a brand is introduced in the market,
the company which introduced the product adopt various methods like survey method,
questionnaire etc. But the direct interview with the distributors, more importantly, with
the customers is much preferred and considered as reliable source of information. The
sales personnel or the surveyors directly get into touch with the customers in shopping
malls and market place to check their comments and opinions about the newly introduced
products. The consumers’ views and comments from the basis of information
highlighting the pros and cons of the product or service.
During the trade shows of products, say car exhibition, the media people or the company
representatives approach the visitors directly to know their interest and opinion about the
products.
We also watch on TV quite often, when the media people interviewing the celebraties
from different field to have first hand information directly from the concerned person.
So in situations where the interviewer wishes to have direct and unbiased information,
comments and views from the interviewer, the interview method is preferred.
===============================================================