1Q16 Form 10Q V23-Final No Indicate by check mark whether the registrant has submitted...
33
UNITED STATES SECURITIES AND EXCHANGE COMMISSION Washington, D.C. 20549 FORM 10-Q (Mark One) QUARTERLY REPORT PURSUANT TO SECTION 13 OR 15(d) OF THE SECURITIES EXCHANGE ACT OF 1934 For the quarterly period ended March 31, 2016 TRANSITION REPORT PURSUANT TO SECTION 13 OR 15(d) OF THE SECURITIES EXCHANGE ACT OF 1934 For the transition period from to Commission File Number 0-28240 EXACTECH, INC. (Exact name of registrant as specified in its charter) FLORIDA 59-2603930 (State or other jurisdiction of incorporation or organization) (I.R.S. Employer Identification No.) 2320 NW 66TH COURT GAINESVILLE, FL 32653 (Address of principal executive offices) (352) 377-1140 (Registrant’s telephone number, including area code) Indicate by check mark whether the registrant (1) has filed all reports required to be filed by Section 13 or 15(d) of the Securities Exchange Act of 1934 during the preceding 12 months (or for such shorter period that the registrant was required to file such reports), and (2) has been subject to such filing requirements for the past 90 days. Yes No Indicate by check mark whether the registrant has submitted electronically and posted on its corporate Web site, if any, every Interactive Data File required to be submitted and posted pursuant to Rule 405 of Regulation S-T (§232.405 of this chapter) during the preceding 12 months (or for such shorter period that the registrant was required to submit and post such files). Yes No Indicate by check mark whether the registrant is a large accelerated filer, an accelerated filer, a non-accelerated filer, or a smaller reporting company. See definition of “large accelerated filer”, “accelerated filer”, and “smaller reporting company” in Rule 12b-2 of the Exchange Act. Large Accelerated Filer Accelerated Filer Non-Accelerated Filer Smaller Reporting Company Indicate by check mark whether the registrant is a shell company (as defined in Rule 12b-2 of the Exchange Act). Yes No Indicate the number of shares outstanding of each of the issuer’s classes of common stock, as of the latest practicable date. Class Outstanding at April 25, 2016 Common Stock, $.01 par value 14,096,402
Transcript of 1Q16 Form 10Q V23-Final No Indicate by check mark whether the registrant has submitted...

UNITED STATES SECURITIES AND EXCHANGE COMMISSION
Washington, D.C. 20549
FORM 10-Q
(Mark One) QUARTERLY REPORT PURSUANT TO SECTION 13 OR 15(d) OF THE SECURITIES
EXCHANGE ACT OF 1934
For the quarterly period ended March 31, 2016
TRANSITION REPORT PURSUANT TO SECTION 13 OR 15(d) OF THE SECURITIES EXCHANGE ACT OF 1934
For the transition period from to
Commission File Number 0-28240
EXACTECH, INC. (Exact name of registrant as specified in its charter)
FLORIDA 59-2603930 (State or other jurisdiction of
incorporation or organization) (I.R.S. Employer
Identification No.)
2320 NW 66TH COURT GAINESVILLE, FL 32653
(Address of principal executive offices)
(352) 377-1140 (Registrant’s telephone number, including area code)
Indicate by check mark whether the registrant (1) has filed all reports required to be filed by Section 13 or 15(d) of the Securities Exchange Act of 1934 during the preceding 12 months (or for such shorter period that the registrant was required to file such reports), and (2) has been subject to such filing requirements for the past 90 days. Yes No
Indicate by check mark whether the registrant has submitted electronically and posted on its corporate Web site, if any, every Interactive Data File required to be submitted and posted pursuant to Rule 405 of Regulation S-T (§232.405 of this chapter) during the preceding 12 months (or for such shorter period that the registrant was required to submit and post such files). Yes No
Indicate by check mark whether the registrant is a large accelerated filer, an accelerated filer, a non-accelerated filer, or a smaller reporting company. See definition of “large accelerated filer”, “accelerated filer”, and “smaller reporting company” in Rule 12b-2 of the Exchange Act.
Large Accelerated Filer Accelerated Filer Non-Accelerated Filer Smaller Reporting Company
Indicate by check mark whether the registrant is a shell company (as defined in Rule 12b-2 of the Exchange Act). Yes No
Indicate the number of shares outstanding of each of the issuer’s classes of common stock, as of the latest practicable date.
Class Outstanding at April 25, 2016
Common Stock, $.01 par value 14,096,402

EXACTECH, INC.
INDEX
Page
Number
PART 1. FINANCIAL INFORMATION
Item 1. Condensed Consolidated Financial Statements
Condensed Consolidated Balance Sheets as of March 31, 2016 (unaudited) and December 31, 2015 2
Condensed Consolidated Statements of Income (unaudited) for the Three Month Periods Ended March 31, 2016 and March 31, 2015 3
Condensed Consolidated Statements of Comprehensive Income (unaudited) for the Three Month Periods Ended March 31, 2016 and March 31, 2015 4
Condensed Consolidated Statements of Cash Flows (unaudited) for the Three Month Periods Ended March 31, 2016 and March 31, 2015 5
Notes to Condensed Consolidated Financial Statements (unaudited) for the Three Month Periods Ended March 31, 2016 and March 31, 2015 6
Item 2. Management’s Discussion and Analysis of Financial Condition and Results of Operations 18
Item 3. Quantitative and Qualitative Disclosures About Market Risk 24
Item 4. Controls and Procedures 25
PART II. OTHER INFORMATION
Item 1. Legal Proceedings 26
Item 1A. Risk Factors 26
Item 2. Unregistered Sales of Equity Securities and Use of Proceeds 26
Item 6. Exhibits 27
Signatures 28

2
Item 1. Financial Statements
EXACTECH, INC. AND SUBSIDIARIES CONDENSED CONSOLIDATED BALANCE SHEETS
(in thousands)
(unaudited) (audited) March 31, December 31, 2016 2015
ASSETS CURRENT ASSETS:
Cash and cash equivalents $ 9,114 $ 12,713 Accounts receivable, net of allowances of $1,075 and $1,011 54,763 52,442 Prepaid expenses and other assets, net 4,105 2,552 Income taxes receivable 389 486 Inventories – current 72,577 71,429
Total current assets 140,948 139,622 PROPERTY AND EQUIPMENT:
Land 4,515 4,494 Machinery and equipment 37,580 37,008 Surgical instruments 132,149 123,533 Furniture and fixtures 4,685 4,655 Facilities 21,368 20,348 Projects in process 1,218 1,218
Total property and equipment 201,515 191,256 Accumulated depreciation (100,584 ) (96,713)
Net property and equipment 100,931 94,543 OTHER ASSETS:
Deferred financing and deposits, net 879 858 Non-current inventories 12,359 8,995 Product licenses and designs, net 11,047 11,121 Patents and trademarks, net 1,360 1,426 Customer relationships, net 644 92 Goodwill 22,561 18,850
Total other assets 48,850 41,342 TOTAL ASSETS $ 290,729 $ 275,507
LIABILITIES AND SHAREHOLDERS’ EQUITY CURRENT LIABILITIES:
Accounts payable $ 17,129 $ 13,932 Income taxes payable 2,296 603 Accrued expenses and other liabilities 11,104 9,498 Other current liabilities 2,851 792
Total current liabilities 33,380 24,825 LONG-TERM LIABILITIES:
Deferred tax liabilities 806 443 Line of credit 16,000 16,000 Other long-term liabilities 6,255 5,850
Total long-term liabilities 23,061 22,293 Total liabilities 56,441 47,118
SHAREHOLDERS’ EQUITY: Common stock 143 142 Additional paid-in capital 83,929 81,963 Treasury Stock (3,042 ) — Accumulated other comprehensive loss (9,414 ) (11,986)Retained earnings 162,672 158,270
Total shareholders’ equity 234,288 228,389 TOTAL LIABILITIES AND SHAREHOLDERS’ EQUITY $ 290,729 $ 275,507
See notes to condensed consolidated financial statements

3
EXACTECH, INC. AND SUBSIDIARIES CONDENSED CONSOLIDATED STATEMENTS OF INCOME
(in thousands, except per share amounts) (Unaudited)
Three Month Periods Ended
March 31, 2016 2015
NET SALES $ 65,298 $ 61,376 COST OF GOODS SOLD 20,368 18,642
Gross profit 44,930 42,734 OPERATING EXPENSES:
Sales and marketing 23,319 21,850 General and administrative 5,914 5,847 Research and development 5,070 4,529 Depreciation and amortization 4,324 4,442
Total operating expenses 38,627 36,668 INCOME FROM OPERATIONS 6,303 6,066 OTHER INCOME (EXPENSE):
Interest income 4 2 Other income 40 28 Interest expense (262 ) (302)Foreign currency gain (loss), net 494 (202)
Total other income (expense) 276 (474)INCOME BEFORE INCOME TAXES 6,579 5,592 PROVISION FOR INCOME TAXES 2,177 1,480 NET INCOME $ 4,402 $ 4,112
BASIC EARNINGS PER SHARE $ 0.31 $ 0.30
DILUTED EARNINGS PER SHARE $ 0.31 $ 0.29
See notes to condensed consolidated financial statements

4
EXACTECH, INC. AND SUBSIDIARIES CONDENSED CONSOLIDATED STATEMENTS OF COMPREHENSIVE INCOME (LOSS)
(in thousands) (Unaudited)
Three Month Periods Ended
March 31, 2016 2015
Net Income $ 4,402 $ 4,112 Other comprehensive income (loss), net of tax:
Change in fair value of cash flow hedge — (18)Change in currency translation 2,572 (3,274)
Other comprehensive income (loss), net of tax 2,572 (3,292)Comprehensive income $ 6,974 $ 820
See notes to condensed consolidated financial statements

5
EXACTECH, INC. AND SUBSIDIARIES CONDENSED CONSOLIDATED STATEMENTS OF CASH FLOWS
(in thousands) (Unaudited)
Three Month Periods Ended
March 31, 2016 2015
OPERATING ACTIVITIES: Net income $ 4,402 $ 4,112 Adjustments to reconcile net income to net cash provided by (used in) operating activities:
Provision for allowance for doubtful accounts and sales returns 64 59 Inventory allowance 1,355 38 Depreciation and amortization 4,660 4,842 Restricted common stock issued for services 97 116 Compensation cost of stock awards 617 493 Loss on disposal of equipment 312 910 Foreign currency option loss (gain) — (406)Foreign currency exchange (gain) loss (726 ) 608 Deferred income taxes 201 (873)
Changes in assets and liabilities, net of business combination effect, which provided (used) cash:
Accounts receivable (2,432 ) (2,331)Prepaids and other assets (1,518 ) (817)Inventories (4,608 ) 2,187 Accounts payable 3,157 432 Income taxes receivable/payable 1,808 1,595 Accrued expense & other liabilities 775 106 Net cash provided by operating activities 8,164 11,071
INVESTING ACTIVITIES: Purchases of property and equipment (9,292 ) (6,220)Purchase of business, net of cash acquired (833 ) (2,566)Proceeds from sale of property and equipment 2 — Net cash used in investing activities (10,123 ) (8,786)
FINANCING ACTIVITIES: Principal payments on debt — (750)Payments of contingency consideration (339 ) — Payments on capital leases (15 ) (18)Debt issuance costs — (15)Repurchase of common stock (3,042 ) — Proceeds from issuance of common stock 1,672 923
Net cash (used in) provided by financing activities (1,724 ) 140 Effect of foreign currency translation on cash and cash equivalents 84 (210)NET (DECREASE) INCREASE IN CASH AND CASH EQUIVALENTS (3,599 ) 2,215 CASH AND CASH EQUIVALENTS, BEGINNING OF PERIOD 12,713 10,051 CASH AND CASH EQUIVALENTS, END OF PERIOD $ 9,114 $ 12,266
SUPPLEMENTAL DISCLOSURES OF CASH FLOW INFORMATION:
Cash paid during the period for: Interest $ 88 $ 208 Income taxes 1,270 873
Non-cash investing and financing activities: Cash flow hedge gain, net of tax — (18)Capitalized lease additions 29 — Business combination, contingent consideration payable 1,626 7,218
See notes to condensed consolidated financial statements

6
EXACTECH, INC. AND SUBSIDIARIES NOTES TO CONDENSED CONSOLIDATED FINANCIAL STATEMENTS
FOR THE THREE AND NINE MONTH PERIODS ENDED MARCH 31, 2016 AND 2015 (Unaudited)
1. BASIS OF PRESENTATION
The accompanying unaudited condensed consolidated financial statements of Exactech, Inc. and its subsidiaries (the “Company” or “Exactech”), which are for interim periods, have been prepared in accordance with the rules and regulations of the Securities and Exchange Commission relating to interim financial statements. These unaudited condensed consolidated financial statements do not include all disclosures provided in the Company's audited annual financial statements. The condensed financial statements should be read in conjunction with the audited financial statements and notes contained in Exactech's Annual Report on Form 10-K for the year ended December 31, 2015, as filed with the Securities and Exchange Commission.
In the opinion of management, all adjustments considered necessary for a fair presentation have been included, consisting of normal recurring adjustments. Our subsidiaries, Exactech Asia, Exactech UK, Exactech Japan, Exactech France, Exactech Taiwan, Exactech Deutschland, Exactech Ibérica, Exactech International Operations, Blue Ortho, Exactech Australia and Exactech U.S., are consolidated for financial reporting purposes, and all intercompany balances and transactions have been eliminated. Results of operations for the three month period ended March 31, 2016 are not necessarily indicative of the results to be expected for the full year.
Certain amounts reported for prior periods have been reclassified to be consistent with the current period presentation.
During the first quarter of 2016, we changed the classification of surgical instrumentation not yet placed in service, from non-current inventory in the other assets category to surgical instrumentation in the property, plant and equipment category. In order to present comparable financial statements, we reclassified $14.4 million of non-current inventory in the December 31, 2015 balance sheet to property, plant and equipment. We also reclassified the effect of the classification change on the cash flow statement for the three months ended March 31, 2015 by reducing cash used for inventory by $1.2 million in cash flow from operations and increasing the cash used for property, plant and equipment in cash flow from investing. The prior period reclassification had no impact on our condensed consolidated statements of income or equity in the condensed consolidated balance sheets. 2. NEW ACCOUNTING PRONOUNCEMENTS AND STANDARDS
In March 2016, the Financial Accounting Standards Board (“FASB”) issued updated guidance related to accounting for employee share-based payments. The guidance simplifies the accounting for employee share-based payment transactions, including the accounting for income taxes, forfeitures, and statutory tax withholding requirements, as well as classification in the statement of cash flows. The guidance is effective for annual and interim periods beginning after December 15, 2016, and early adoption is permitted. We are currently assessing the impact of adopting this guidance on our financial statements.
In February 2016, the FASB issued updated guidance on leases. The new standard requires all lessees to recognize a lease liability and a right-of-use asset, measured at the present value of the future minimum lease payments, at the lease commencement date. Lessor accounting remains largely unchanged under the new guidance. A modified retrospective approach should be applied for leases existing at the beginning of the earliest comparative period presented in the financial statements. The guidance is effective for annual and interim periods beginning after December 15, 2018, and early adoption is permitted. We are currently assessing the impact of adopting this guidance on our financial statements.
In November 2015, the FASB issued amended guidance on income taxes, which simplifies the classification of deferred income tax liabilities and assets in a classified statement of financial position. The amendment requires entities that present a classified balance sheet to classify all deferred tax liabilities and assets as a noncurrent amount. The amendment is effective for fiscal years and interim periods within those years beginning after December 15, 2016, and may be early adopted on a prospective basis or on a retrospective

7
basis to all periods presented. In the current quarter we adopted the amended guidance on a retrospective basis, and reclassified $1.7 million of current deferred tax assets to non-current deferred tax liabilities as of December 31, 2015.
In September 2015, the FASB issued guidance on business combination provisional adjustments during the measurement period. The new standard requires that an acquirer recognize adjustments to provisional amounts that are identified during the measurement period in the reporting period in which the adjustment amounts are determined. The guidance is effective for annual and interim periods beginning on or after December 15, 2017, and early application is permitted. We are currently assessing the impact of adopting this guidance on our financial statements; however, we do not expect the adoption of this guidance to have a material impact on our financial position or results of operations.
In May 2014, the FASB issued new revenue recognition guidance that supersedes the existing revenue recognition guidance and most industry-specific guidance applicable to revenue recognition. The new guidance is based on the principle that revenue is recognized upon the transfer of goods or services to customers in an amount that reflects the consideration to which the entity expects to be entitled in exchange for those goods or services. The guidance will also result in enhanced disclosures about revenue, provide guidance for transactions that were not previously addressed comprehensively, and clarify guidance for multiple-element arrangements. In July 2015, the FASB delayed the effective date of this guidance by one year. The guidance is effective for the first fiscal quarter of 2018, and early application is not permitted earlier than January 1, 2015. We are currently assessing the impact of adopting this guidance on our financial statements. 3. FAIR VALUE MEASURES
Our financial instruments include cash and cash equivalents, trade receivables, debt, and foreign currency hedges. The carrying amounts of cash and cash equivalents, and trade receivables approximate fair value due to their short maturities. The carrying amount of debt approximates fair value due to the variable rate associated with the debt. The fair values of foreign currency hedges are based on dealer quotes.
The table below provides information on our liabilities that are measured at fair value on a recurring basis:
(In Thousands) Total Fair Value
Quoted Pricesin Active Markets (Level 1)
Significant Other Observable
Inputs (Level 2)
Significant Unobservable
Inputs (Level 3)
March 31, 2016
Liabilities Contingent consideration $ 8,844 $ — $ — $ 8,844Total: $ 8,844 $ — $ — $ 8,844
December 31, 2015
Liabilities Contingent consideration $ 6,222 $ — $ — $ 6,222Total: $ 6,222 $ — $ — $ 6,222
The fair value of our contingent consideration liability is management's best estimate based on the present value of estimated payment scenarios, which is determined based on inputs not observable in the market. We use assumptions we believe would be made by a market participant. We evaluate our estimates on a quarterly basis, as additional data impacting the assumptions is obtained, and will recognize any changes in the unaudited condensed consolidated statements of income. See Note 12, Business Acquisition, for further discussion on the contingent consideration.

8
4. GOODWILL AND OTHER INTANGIBLE ASSETS
Goodwill – The following table provides the changes to the carrying value of goodwill for the three month period ended March 31, 2016:
(in thousands) Extremities Knee Hip Biologics and Spine Other Total
Balance as of December 31, 2015 $ 4,461 $ 5,132 $ 904 $ 7,553 $ 800 $ 18,850 Acquired goodwill 927 1,545 463 — 154 3,089 Foreign currency translation effects 249 254 76 — 43 622 Balance as of March 31, 2016 $ 5,637 $ 6,931 $ 1,443 $ 7,553 $ 997 $ 22,561
We test goodwill for impairment annually as of the 1st of October. Our impairment analysis as of October 1, 2015 indicated no impairment to goodwill.
Other Intangible Assets – The following table summarizes the carrying values of our other intangible assets at March 31, 2016 and December 31, 2015:
(in thousands) Carrying Value AccumulatedAmortization
Net Carrying Value
Weighted AvgAmortization
Period
Balance at March 31, 2016 Product licenses and designs $ 16,949 $ 5,902 $ 11,047 11.0 Patents and trademarks 4,678 3,318 1,360 14.2 Customer relationships 3,542 2,898 644 6.9
Balance at December 31, 2015 Product licenses and designs $ 16,675 $ 5,554 $ 11,121 11.0 Patents and trademarks 4,678 3,252 1,426 14.2 Customer relationships 2,923 2,831 92 6.9
5. HEDGING ACTIVITIES AND FOREIGN CURRENCY TRANSLATION
Foreign Currency Transactions
The following table provides information on the components of our foreign currency activities recognized in the unaudited condensed consolidated statements of income:
(in thousands) Three Months Ended
March 31, 2016 2015
Foreign currency transactions gain (loss) $ 726 $ (608)Foreign currency option (loss) gain (232 ) 406 Foreign currency gain (loss), net $ 494 $ (202)
Foreign Currency Transactions – Gains and losses resulting from our transactions and our subsidiaries’ transactions that are made in currencies different from our and their own are included in income as they occur and as other income (expense) in the condensed consolidated statements of income.
Foreign Currency Options – During the first quarter of 2016, we entered into foreign currency forward contracts as economic hedges against the continued strengthening of the U.S. Dollar (USD) against the Euro (EUR) and the Japanese Yen (JPY). During the three months ended March 31, 2016, we recognized losses of $0.2 million related to these instruments. The recognized losses are recorded in other income (expense) in the unaudited condensed consolidated statements of income related to the fair value of these currency options based upon a dealer's quotes.

9
During the first quarter of 2015, we entered into foreign currency forward contracts as economic hedges against the continued strengthening of the USD against the EUR and the JPY. During the quarter ended March 31, 2015, we recognized a gain of $0.4 million on the condensed consolidated statements of income related to the fair value of these currency options based upon a dealer's quotes.
Foreign Currency Translation
We are exposed to market risk related to changes in foreign currency exchange rates. The functional currency of substantially all of our international subsidiaries is their local currency. Transactions are translated into USD, and translation gains and losses are recognized in “Other comprehensive income (loss)”. Fluctuations in exchange rates affect our financial position and results of operations. The majority of our foreign currency exposure is to the EUR, British Pound (GBP), Australian Dollar (AUD) and JPY. During the three months ended March 31, 2016, translation gains were $2.6 million, which were primarily due to the strengthening of the JPY and the AUD against the USD. During the three months ended March 31, 2015, translation losses were $3.3 million, which were primarily due to the weakening of the JPY against the USD, offset partially by the strengthening of the EUR and GBP against the USD. While we may experience translation gains and losses during the balance of the year ending December 31, 2016, these gains and losses are not expected to have a material adverse effect on our financial position, results of operations or cash flows.
Hedging Activities
We do not enter into or hold derivative instruments for trading or speculative purposes. During December 2015, we terminated our interest rate swap, which we had entered into to eliminate variability in future cash flows by converting LIBOR-based variable-rate interest payments into fixed-rate interest payments. The fair value of our interest rate swap agreement was based on dealer quotes. The change in fair value during the three months ended March 31, 2015 of $18,000 was recorded as accumulated other comprehensive loss in the consolidated balance sheets. 6. INVENTORIES
Inventories are valued at the lower of cost or net realizable value and include implants consigned to customers and agents. We also loan a significant amount of implant inventory to non-distributor customers. The consigned or loaned inventory remains our inventory until we are notified of implantation. We are also required to maintain substantial levels of inventory, as it is necessary to maintain all sizes of each component to fill customer orders. The size of the component to be used for a specific patient is typically not known with certainty until the time of surgery. Due to this uncertainty, a minimum of one of each size of each component in the system to be used must be available to each sales representative at the time of surgery. As a result of this need to maintain substantial levels of inventory, we are subject to the risk of inventory obsolescence. In the event that a substantial portion of our inventory becomes obsolete, it would have a material adverse effect on the Company. Allowance charges for obsolete and slow moving inventories are recorded based upon an analysis of specific identification of obsolete inventory items and quantification of slow moving inventory items. For slow moving inventory, this analysis compares the quantity of inventory on hand to the historical sales of such inventory. As a result of this analysis, we record an estimated allowance for slow moving inventory. Due to the nature of the slow moving inventory, this allowance may fluctuate up or down, as a charge or recovery. Allowance charges for the three months ended March 31, 2016 and 2015 were $1,355,000 and $38,000, respectively; which increased as a result of our inventory builds for new and existing product. We also test our inventory levels for the amount of inventory that we expect to sell within one year. At certain times, such as when we stock new subsidiaries, add consignment locations, and launch new products, the level of inventory can exceed the forecasted level of cost of goods expected to be sold for the next twelve months. We classify such inventory as non-current.
10
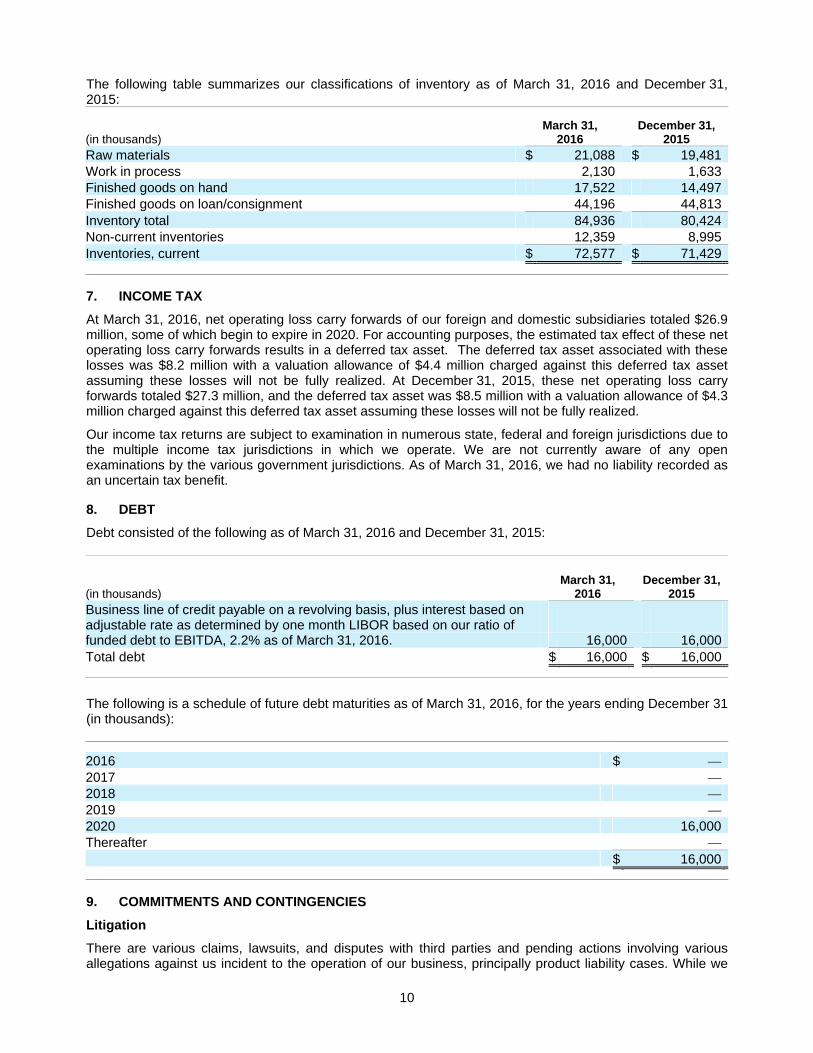
The following table summarizes our classifications of inventory as of March 31, 2016 and December 31, 2015:
(in thousands) March 31,
2016 December 31,
2015 Raw materials $ 21,088 $ 19,481 Work in process 2,130 1,633 Finished goods on hand 17,522 14,497 Finished goods on loan/consignment 44,196 44,813 Inventory total 84,936 80,424 Non-current inventories 12,359 8,995 Inventories, current $ 72,577 $ 71,429
7. INCOME TAX
At March 31, 2016, net operating loss carry forwards of our foreign and domestic subsidiaries totaled $26.9 million, some of which begin to expire in 2020. For accounting purposes, the estimated tax effect of these net operating loss carry forwards results in a deferred tax asset. The deferred tax asset associated with these losses was $8.2 million with a valuation allowance of $4.4 million charged against this deferred tax asset assuming these losses will not be fully realized. At December 31, 2015, these net operating loss carry forwards totaled $27.3 million, and the deferred tax asset was $8.5 million with a valuation allowance of $4.3 million charged against this deferred tax asset assuming these losses will not be fully realized.
Our income tax returns are subject to examination in numerous state, federal and foreign jurisdictions due to the multiple income tax jurisdictions in which we operate. We are not currently aware of any open examinations by the various government jurisdictions. As of March 31, 2016, we had no liability recorded as an uncertain tax benefit. 8. DEBT
Debt consisted of the following as of March 31, 2016 and December 31, 2015:
(in thousands) March 31,
2016 December 31,
2015 Business line of credit payable on a revolving basis, plus interest based on adjustable rate as determined by one month LIBOR based on our ratio of funded debt to EBITDA, 2.2% as of March 31, 2016. 16,000 16,000 Total debt $ 16,000 $ 16,000
The following is a schedule of future debt maturities as of March 31, 2016, for the years ending December 31 (in thousands):
2016 $ — 2017 — 2018 — 2019 — 2020 16,000 Thereafter — $ 16,000
9. COMMITMENTS AND CONTINGENCIES
Litigation
There are various claims, lawsuits, and disputes with third parties and pending actions involving various allegations against us incident to the operation of our business, principally product liability cases. While we

11
believe that the various claims are without merit, we are unable to predict the ultimate outcome of such litigation. We therefore maintain insurance, subject to self-insured retention limits, for all such claims, and establish accruals for product liability and other claims based upon our experience with similar past claims, advice of counsel and the best information reasonably available. At March 31, 2016 and December 31, 2015, we had $125,000 and $100,000 accrued, respectively, for product liability claims. These product liability claims are subject to various uncertainties, and it is possible that they may be resolved unfavorably to us. While it is not possible to predict with certainty the outcome of the various cases, it is the opinion of management that, upon ultimate resolution, the cases will not have a material adverse effect on our consolidated financial position, results of operations or cash flows.
Our insurance policies covering product liability claims must be renewed annually. Although we have been able to obtain insurance coverage for product liability claims at a cost and on other terms and conditions that have been acceptable to us, we may not be able to procure acceptable policies in the future.
Purchase Commitments
At March 31, 2016, we had outstanding commitments for the purchase of inventory, raw materials and supplies of $20.8 million and outstanding commitments for the purchase of capital equipment of $18.5 million. Purchases under our distribution agreements were $0.8 million during the three months ended March 31, 2016.
Our Taiwanese subsidiary, Exactech Taiwan, entered into a license agreement with the Industrial Technology Research Institute (ITRI) and the National Taiwan University Hospital (NTUH) for the rights to technology and patents related to the repair of cartilage lesions. As of March 31, 2016, we have paid approximately $2.1 million for the licenses, patents, and equipment related to this license agreement, and we will make royalty payments when the technology becomes marketable. Using the technology, we plan to launch a cartilage repair program that will include a device and method for the treatment and repair of cartilage in the knee joint. It is expected that the project will require us to complete human clinical trials under the guidance of the Food & Drug Administration in order to obtain pre-market approval for the device in the United States. The agreement terms include a license fee based on the achievement of specific, regulatory milestones and a royalty arrangement based on sales once regulatory clearances are established. 10. SEGMENT INFORMATION
We evaluate our operating segments by our major product lines: extremity implants, knee implants, hip implants, biologics and spine, and other products. The “other products” segment includes miscellaneous sales categories, such as surgical instruments held for sale, bone cement, instrument rental fees, shipping charges, and other implant product lines. Evaluation of the performance of operating segments is based on their respective incomes from operations before taxes, interest income and expense, and nonrecurring items. Intersegment sales and transfers are not significant. The accounting policies of the reportable segments are the same as those described in Note 2 of the notes to our audited consolidated financial statements included in our Annual Report on Form 10-K for the year ended December 31, 2015.
Total assets not identified with a specific segment are listed as “corporate” and include cash and cash equivalents, accounts receivable, income taxes receivable, deposits and prepaid expenses, deferred tax assets, land, facilities, office furniture and computer equipment, notes receivable, and other investments. Depreciation and amortization on corporate assets is allocated to the product segments for purposes of evaluating the income (loss) from operations, and capitalized surgical instruments are allocated to the appropriate product line supported by those assets.

12
Summarized information concerning our reportable segments is shown in the following table (in thousands):
Three Months Ended March 31, Extremity Knee Hip Biologics& Spine Other Corporate Total
2016 Net sales $ 24,160 $ 19,387 $ 11,335 $ 5,394 $ 5,022 $ — $ 65,298 Segment profit (loss) 4,924 988 213 129 49 276 6,579 Total assets, net 40,933 73,144 38,818 23,857 11,713 102,264 290,729 Capital expenditures 1,252 1,208 1,002 264 4,139 1,456 9,321 Depreciation and Amortization 712 1,988 669 262 172 857 4,660 2015 Net sales $ 21,080 $ 18,438 $ 10,951 $ 5,140 $ 5,767 $ — $ 61,376 Segment profit (loss) 4,537 1,216 536 140 (363 ) (474) 5,592 Total assets, net 33,337 68,748 33,502 22,564 13,676 100,715 272,542 Capital expenditures 1,052 2,062 917 66 238 649 4,984 Depreciation and Amortization 707 2,050 725 283 138 939 4,842
Geographic distribution of our long-lived assets and inventory is shown in the following table (in thousands):
As of: March 31, 2016 December 31, 2015 Domestic International Domestic International
Long lived assets, gross $ 168,128 $ 58,556 $ 161,672 $ 53,859 Accumulated depreciation and amortization (91,698) (21,004) (88,958 ) (19,391)Long lived assets, net 76,430 37,552 72,714 34,468 Inventory $ 47,124 $ 37,812 $ 43,725 $ 36,699
Geographic distribution of our sales is summarized in the following table (in thousands):
Three Months Ended March 31, 2016 2015 % Inc/Decr
Domestic sales $ 44,573 $ 41,248 8.1 International sales 20,725 20,128 3.0
Total sales $ 65,298 $ 61,376 6.4
11. SHAREHOLDERS’ EQUITY
The following is a reconciliation of the numerators and denominators of the basic and diluted EPS computations for net income and net income available to common shareholders:
Income
(Numerator)Shares
(Denominator)Per
Share Income
(Numerator) Shares
(Denominator)Per
Share Three Months Ended Three Months Ended (in thousands, except per share amounts) March 31, 2016 March 31, 2015 Net income $ 4,402 $ 4,112 Basic EPS: Net income available to common shareholders $ 4,402 14,057 $ 0.31 $ 4,112 13,916 $ 0.30
Effect of dilutive securities: Stock options 116 258
Diluted EPS: Net income available to common shareholders plus assumed conversions $ 4,402 14,173 $ 0.31 $ 4,112 $ 14,174 $ 0.29
For the three months ended March 31, 2016, weighted average options to purchase 503,978 shares of common stock were outstanding but were not included in the computation of diluted EPS because the options were antidilutive under the treasury stock method. For the three months ended March 31, 2015,

13
weighted average options to purchase 201,668 shares of common stock were not included in the computation of diluted EPS because the options were antidilutive under the treasury stock method.
Changes in Shareholders’ Equity:
The following is a summary of the changes in shareholders’ equity for the three months ended March 31, 2016:
Common Stock Additional
Paid-
Common Stock
Held in Retained
Accumulated Other
Comprehensive (in thousands) Shares Amount In Capital Treasury Earnings Income (Loss) Total
Balance December 31, 2015 14,154 $ 142 $ 81,963 $ — $158,270 $ (11,986) $228,389 Net income — — — — 4,402 — 4,402 Other comprehensive income (loss), net of tax — — — — — 2,572 2,572 Exercise of stock options 88 1 1,493 — — — 1,494 Issuance of restricted common stock for services 5 — 97 — — — 97 Issuance of common stock under Employee Stock Purchase Plan 11 — 178 — — — 178 Repurchase of common stock — — — (3,042) — — (3,042)Compensation cost of stock options — — 617 — — — 617 Tax impact on stock awards — — (419) — — — (419)Balance March 31, 2016 14,258 $ 143 $ 83,929 $ (3,042) $162,672 $ (9,414) $234,288
Treasury Stock:
In December 2015, our Board of Directors authorized the repurchase of up to 1.0 million shares of our common stock over a two year period. During the first quarter of 2016, we reacquired 163,529 shares of our common stock at an average price of $18.60 per share, or an aggregate of $3.0 million.
Stock-based Compensation Awards:
We sponsor an Executive Incentive Compensation Plan, which provides for the award of stock-based compensation, including options, stock appreciation rights, restricted stock and other stock-based incentive compensation awards to key employees, directors and independent agents and consultants. We implemented a comprehensive, consolidated incentive compensation plan upon shareholder approval at our Annual Meeting of Shareholders on May 7, 2009, which was amended and restated at our 2014 Annual Meeting of Shareholders, held on May 8, 2014, to increase the maximum number of shares issuable under the 2009 Plan by 500,000. We refer to this plan, as amended, as the 2009 Plan. The maximum number of common shares issuable under the 2009 Plan is 1,500,000 plus (a) the number of shares with respect to awards previously granted under our preexisting plans that terminate without being exercised, expire, are forfeited or canceled, plus (b) the number of shares that remain available for future issuance under our preexisting plans plus (c) the number of shares that are surrendered in payment of any awards or any tax withholding with respect thereto. Common stock issued upon exercise of stock options is settled with authorized but unissued shares available. Under the 2009 Plan, the exercise price of option awards equals the market price of our common stock on the date of grant, and each award has a maximum term of ten years. As of March 31, 2016, there were 438,644 total shares remaining issuable under the 2009 Plan.
The aggregate compensation cost charged against income with respect to awards issued under the 2009 Plan and the 2009 Employee Stock Purchase Plan, referred to as the 2009 ESPP, was $0.6 million and $0.5 million for the three months ended March 31, 2016 and 2015, respectively. Income tax benefit on exercises of non-qualified stock options was $0.2 million and $0.1 million for the three months ended March 31, 2016 and 2015, respectively. As of March 31, 2016, total unrecognized compensation cost related to unvested awards was $1.5 million and is expected to be recognized over a weighted-average period of 1.7 years.
14
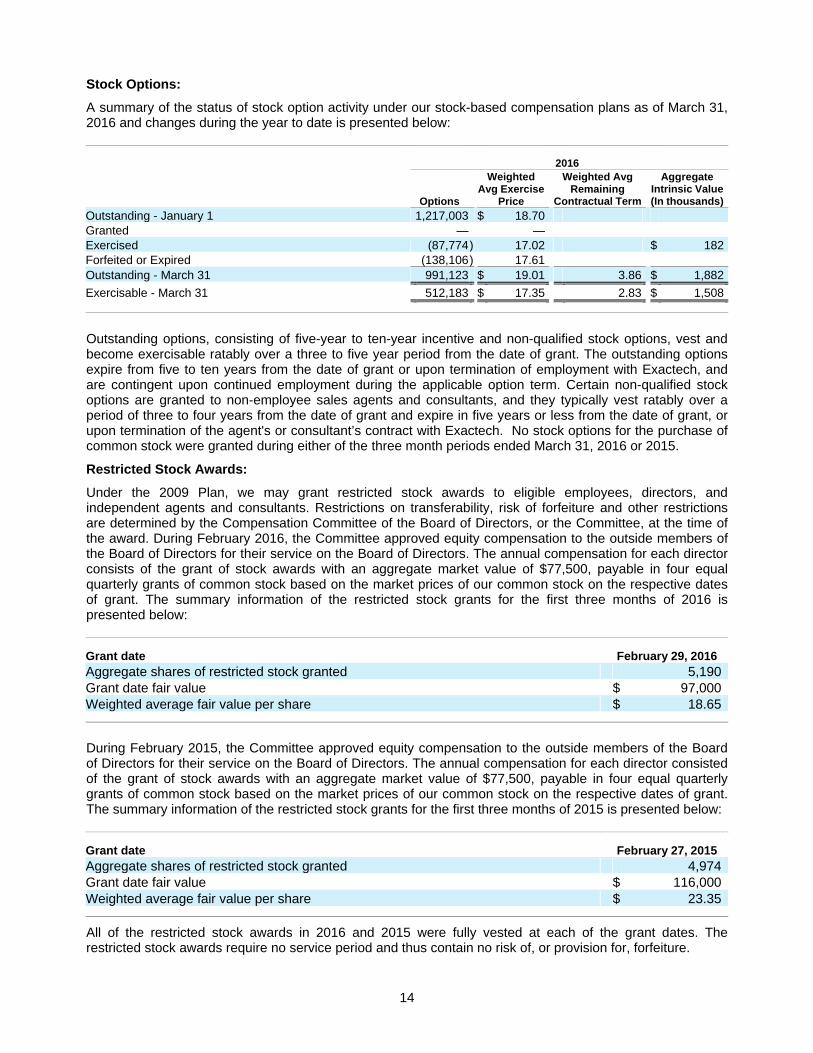
Stock Options:
A summary of the status of stock option activity under our stock-based compensation plans as of March 31, 2016 and changes during the year to date is presented below:
2016
Options
Weighted Avg Exercise
Price
Weighted Avg Remaining
Contractual Term
Aggregate Intrinsic Value(In thousands)
Outstanding - January 1 1,217,003 $ 18.70 Granted — — Exercised (87,774) 17.02 $ 182Forfeited or Expired (138,106) 17.61 Outstanding - March 31 991,123 $ 19.01 3.86 $ 1,882
Exercisable - March 31 512,183 $ 17.35 2.83 $ 1,508
Outstanding options, consisting of five-year to ten-year incentive and non-qualified stock options, vest and become exercisable ratably over a three to five year period from the date of grant. The outstanding options expire from five to ten years from the date of grant or upon termination of employment with Exactech, and are contingent upon continued employment during the applicable option term. Certain non-qualified stock options are granted to non-employee sales agents and consultants, and they typically vest ratably over a period of three to four years from the date of grant and expire in five years or less from the date of grant, or upon termination of the agent's or consultant’s contract with Exactech. No stock options for the purchase of common stock were granted during either of the three month periods ended March 31, 2016 or 2015.
Restricted Stock Awards:
Under the 2009 Plan, we may grant restricted stock awards to eligible employees, directors, and independent agents and consultants. Restrictions on transferability, risk of forfeiture and other restrictions are determined by the Compensation Committee of the Board of Directors, or the Committee, at the time of the award. During February 2016, the Committee approved equity compensation to the outside members of the Board of Directors for their service on the Board of Directors. The annual compensation for each director consists of the grant of stock awards with an aggregate market value of $77,500, payable in four equal quarterly grants of common stock based on the market prices of our common stock on the respective dates of grant. The summary information of the restricted stock grants for the first three months of 2016 is presented below:
Grant date February 29, 2016 Aggregate shares of restricted stock granted 5,190 Grant date fair value $ 97,000 Weighted average fair value per share $ 18.65
During February 2015, the Committee approved equity compensation to the outside members of the Board of Directors for their service on the Board of Directors. The annual compensation for each director consisted of the grant of stock awards with an aggregate market value of $77,500, payable in four equal quarterly grants of common stock based on the market prices of our common stock on the respective dates of grant. The summary information of the restricted stock grants for the first three months of 2015 is presented below:
Grant date February 27, 2015Aggregate shares of restricted stock granted 4,974 Grant date fair value $ 116,000 Weighted average fair value per share $ 23.35
All of the restricted stock awards in 2016 and 2015 were fully vested at each of the grant dates. The restricted stock awards require no service period and thus contain no risk of, or provision for, forfeiture.

15
Employee Stock Purchase Plan:
On February 18, 2009, our board of directors adopted the 2009 ESPP, and our shareholders approved the 2009 ESPP at our Annual Meeting of Shareholders on May 7, 2009. Under the 2009 ESPP, employees are able to purchase shares of our common stock at a fifteen percent (15%) discount via payroll deduction, up to a maximum number of shares issuable under the 2009 ESPP of 300,000. During February 2016, our Board of Directors adopted an amendment to the 2009 ESPP, to increase the maximum number of shares issuable under the 2009 ESPP to 450,000, which is subject to shareholder approval at our Annual Meeting of Shareholders to be held on May 2, 2016. There are four offering periods during an annual period. As of March 31, 2016, 27,641 shares remained available for purchase under this 2009 ESPP. The fair value of the employees' purchase rights is estimated using the Black-Scholes model. Purchase information and fair value assumptions are presented in the following table:
Three Months Ended March 31, 2016 2015Shares purchased 11,538 10,102 Dividend yield — — Expected life 1 year 1 year Expected volatility 33 % 31%Risk free interest rates 0.7 % 0.2%Weighted average per share fair value $ 3.91 $ 4.80
12. BUSINESS ACQUISITION
Exactech Australia
On February 1, 2016, we completed the acquisition of all of the outstanding capital stock of Exactech Australia Pty Ltd, an Australia-based company. Exactech Australia has been our independent importer and distribution partner in Australia for the past four years. The acquisition was accomplished to further the partnership between us and the team at Exactech Australia and to further service customers in the Asia Pacific area.
The aggregate purchase price for Exactech Australia will range from $3.1 million AUD to $7.6 million AUD, of which $1.6 million AUD, or $1.1 million USD at a 0.7034 AUD:USD exchange rate, was paid to the Exactech Australia shareholders in cash at the closing of the acquisition, and the remainder will be paid to such shareholders contingent on the achievement of certain future milestones. We expect the contingent payment to be paid over the next two years. Consideration also included $2.0 million USD in forgiven accounts receivable that were owed to us as of February 1, 2016. We are currently awaiting finalization of Exactech Australia’s closing balance sheet to complete purchase accounting. The estimated fair value of the contingent consideration was determined using the following assumptions: discount rates of 3.7%, probability levels of milestone range of outcomes, and expected timing of achievement of contingent consideration earn-out amounts. We financed the acquisition from our operating cash flows.
Upon completion of the acquisition, we effectively concluded a pre-existing distribution agreement for the distribution of our products, which was stated at fair value therefore no impact to the statement of income was recognized. The accounting for our acquisition of Exactech Australia is preliminary, pending final results of operations and deferred tax liability determination. The preliminary goodwill is determined as the excess of the consideration over the fair value of the net assets acquired, and was due to the synergies we obtained in the extended service in the Asia Pacific area. Goodwill was allocated to the knee, extremity and hip segments based on expected sales for the segments. Pro forma revenue and earnings for the business combination have not been presented because the effects, both individually and in the aggregate, were not material to our results of operations.

16
The following table summarizes the preliminary purchase price allocation and determination of goodwill, which is not deductible for tax purposes, as of February 1, 2016 (in thousands):
Amounts at Acquisition
Consideration: Cash $ 1,152 Fair value of contingent consideration 2,435 Total Purchase Price 3,587 Forgiveness of pre-existing debt 2,006 5,593 Acquisition related expenses - incurred as of March 31, 2016 $ 131 Preliminary identifiable assets acquired and liabilities assumed: Current assets acquired 1,616 Property and equipment 722 Current liabilities assumed (208)Deferred tax liability assumed (161)Identifiable intangible assets 535 2,504 Goodwill 3,089 Net assets acquired $ 5,593
The identifiable intangible assets are being amortized using the straight-line method using estimated ten year useful lives, and are recorded net of accumulated amortization in Customer relationships on the unaudited condensed consolidated balance sheet.
Blue Ortho
On January 15, 2015, we completed the acquisition of all of the outstanding capital stock of Blue Ortho SAS, a France-based company. Blue Ortho is the computer-assisted surgical technology development and manufacturing firm that partnered with the Company to develop the ExactechGPS® Guided Personalized Surgery system. We acquired Blue Ortho to further the partnership between us and the team at Blue Ortho and expand the development of ExactechGPS to other segments of our portfolio.
The aggregate purchase price for Blue Ortho is a maximum of €10.0 million, of which €2.0 million, or $2.3 million at a 1.16 USD exchange rate at closing, was paid to the Blue Ortho shareholders in cash at the closing of the acquisition, and the remainder will be paid to such shareholders contingent on the achievement of certain future surgical case milestones. The estimated fair value of the contingent consideration was determined using the following assumptions: discount rates of 4.5-6.5%, probability levels of milestone range of outcomes, and expected timing of achievement of contingent consideration earn-out amounts. We expect the contingent consideration to be paid over the next five to ten years. We financed the acquisition from our operating cash flows.
Upon completion of the acquisition, we effectively terminated a pre-existing development agreement for the development of the ExactechGPS. We acquired tangible assets of $1.5 million, assumed liabilities of $2.9 million, intangible assets, comprising product licenses and designs, of $7.5 million, and goodwill of $6.5 million. Pro forma revenue and earnings for the business combination have not been presented because the effects, both individually and in the aggregate, were not material to our results of operations.

17
The following table summarizes the contingent consideration balance and activity for the period ended March 31, 2016 (in thousands):
Beginning fair value of contingent liability, December 31, 2015 $ 6,222 Period change in valuation 48 Payments (327)Foreign currency translation effects 217 Contingent liability balance, March 31, 2016 6,160 Current liability (1,403)Non-current liability $ 4,757
Due to our expected timing of earn-out payments, a portion of the contingent consideration is classified in other current liabilities on our unaudited condensed consolidated balance sheets. The remainder is classified as other non-current liabilities. The change in the contingent consideration during the three months ended March 31, 2016 was recognized as interest expense in the unaudited condensed consolidated statements of income.

18
Item 2. Management’s Discussion and Analysis of Financial Condition and Results of Operations
The following discussion should be read in conjunction with the unaudited condensed consolidated financial statements and related notes appearing elsewhere in this report.
Overview of the Company
We develop, manufacture, market and sell orthopaedic implant devices, related surgical instrumentation, supplies and biologic materials to hospitals and physicians in the United States and internationally. Our revenues are principally derived from sales of knee, hip, and extremity joint replacement systems and spinal fusion products. We believe that our continuing research and development projects will enable us to continue the introduction of new joint replacement systems, product line extensions, and other products and services.
Our operating expenses consist of sales and marketing expenses, general and administrative expenses, research and development expenses, and depreciation expenses. The largest component of operating expenses, sales and marketing expenses, primarily consists of payments made to independent sales representatives for their services to hospitals and surgical facilities on our behalf. These expenses tend to vary and generally relate to our sales volume. Research and development expenses primarily consist of expenditures on projects concerning knee, extremities, spine and hip implant product lines and biologic materials and services.
In marketing our products, we use a combination of traditional targeted media marketing together with our primary marketing focus, direct customer contact and service to orthopaedic surgeons. Because surgeons are important decision makers when it comes to the choice of products and services that best meet the needs of their patients, we focus our marketing strategy on meeting the needs of the orthopaedic surgeon community. In addition to surgeon’s preference, hospitals and buying groups, as the economic customers, actively participate with physicians in the choice of implants and services.
Overview of the Three Months Ended March 31, 2016
During the quarter ended March 31, 2016, sales increased 6% to $65.3 million from $61.4 million in the quarter ended March 31, 2015, with an 8% increase in the domestic sales, partially as a result of improvements in our domestic sales organization. Our international sales increased 3%, which continued to reflect the impact of foreign currency fluctuations. On a constant currency basis, international sales increased 6%, which we calculated by translating current period sales at the average historical exchange rates for the same period prior year. We believe reporting constant currency sales changes assist in the understanding of actual sales fluctuations. Worldwide gross margins decreased to 69% in the first quarter of 2016 from 70% for the same quarter in 2015. Operating expenses increased 5% when compared to the quarter ended March 31, 2015, however as a percentage of sales, operating expenses decreased to 59% during the first quarter of 2016 compared to 60% during the first quarter of 2015. Net income for the quarter ended March 31, 2016 increased 7%, and diluted earnings per share was $0.31 as compared to $0.29 in the same quarter last year, which was primarily a result of the increase in our sales.
During the three months ended March 31, 2016, we acquired $9.3 million in property and equipment, including a facility in Australia, equipment and surgical instrumentation. As of March 31, 2016, cash outlays for our February 2016 acquisition of Exactech Australia, our independent distributor in Australia, were $1.2 million. Net cash flow from operations was $8.2 million for the three months ended March 31, 2016, as compared to net cash flow from operations of $11.1 million during the three months ended March 31, 2015. The decrease was primarily due to increased purchases of inventory, which was partially offset by higher accounts payable in the first three months of 2016, as compared to the first three months of 2015.

19
The following table includes the net sales and percentage of net sales, as well as a comparison of net sales change to net sales change calculated on a constant currency basis, for each of our product lines, which are also our reportable segments, for the three month periods ended March 31, 2016 and March 31, 2015:
Sales by Product Line ($ in 000’s)
Three Months Ended Inc (decr)
March 31, 2016 March 31, 2015 2016 - 2015
Constant Currency
Extremity $ 24,160 37.0 %$ 21,080 34.4 % 14.6 % 15.3 %Knee 19,387 29.7 18,438 30.0 5.1 6.3 Hip 11,335 17.4 10,951 17.8 3.5 5.1 Biologics and Spine 5,394 8.2 5,140 8.4 4.9 6.6 Other 5,022 7.7 5,767 9.4 (12.9 ) (11.9)Total $ 65,298 100.0 %$ 61,376 100.0 % 6.4 % 7.5 %
The following table includes the net sales, percentage of net sales, net sales change, and net sales change calculated on a constant currency basis, for our geographic distribution for the three month periods ended March 31, 2016 and March 31, 2015:
Sales by Geographic Distribution ($ in 000’s)
Three Months Ended Inc (decr)
March 31, 2016 March 31, 2015 2016 - 2015 Constant Currency
Domestic Sales $ 44,573 68.3% $ 41,248 67.2% 8.1 % 8.1%International Sales 20,725 31.7% 20,128 32.8% 3.0 % 6.3%Total $ 65,298 100.0% $ 61,376 100.0% 6.4 % 7.5%
The following table includes items from the unaudited condensed consolidated statements of income for the three months ended March 31, 2016 as compared to the three months ended March 31, 2015, the dollar and percentage change from period to period and the percentage relationship to net sales (dollars in thousands):
Comparative Statement of Income Data
Three Months March 31, 2016 – 2015 Inc (decr) % of Sales 2016 2015 $ % 2016 2015
Net sales $ 65,298 $ 61,376 3,922 6.4 100.0 % 100.0 %Cost of goods sold 20,368 18,642 1,726 9.3 31.2 30.4
Gross profit 44,930 42,734 2,196 5.1 68.8 69.6 Operating expenses:
Sales and marketing 23,319 21,850 1,469 6.7 35.7 35.6 General and administrative 5,914 5,847 67 1.1 9.1 9.5 Research and development 5,070 4,529 541 11.9 7.8 7.4 Depreciation and amortization 4,324 4,442 (118) (2.7 ) 6.6 7.2
Total operating expenses 38,627 36,668 1,959 5.3 59.2 59.7 Income from operations 6,303 6,066 237 3.9 9.6 9.9 Other income (expense), net 276 (474) 750 158.2 0.4 (0.8) Income before taxes 6,579 5,592 987 17.7 10.0 9.1 Provision for income taxes 2,177 1,480 697 47.1 3.3 2.4 Net income $ 4,402 $ 4,112 290 7.1 6.7 % 6.7 %

20
Three Months Ended March 31, 2016 Compared to Three Months Ended March 31, 2015
Sales
For the quarter ended March 31, 2016, sales increased 6% to $65.3 million from $61.4 million in the quarter ended March 31, 2015, as a result of the improvements in our domestic sales organization and international growth. International sales growth of 3% continued to be adversely impacted by continued weakening of the EUR and GBP against the USD, as compared to the year earlier. On a constant currency basis, international sales increased 6%. Domestic sales increased 8% as we began to deliver benefits from our sales organization changes over the last couple of years. Sales of our extremity products increased 15% to $24.2 million as compared to $21.1 million for the same period in 2015, as our Equinoxe® platform shoulder system with its reverse components has continued to gain market share as a result of its clinical performance in improving patient outcomes. Sales of knee implant products increased 5% to $19.4 million for the quarter ended March 31, 2016, as compared to $18.4 million for the same quarter in 2015, primarily as a result of contributions from our continuing rollout of our Optetrak Logic® system, as well as the recently released revision system. Hip implant sales of $11.3 million during the quarter ended March 31, 2016 increased 4% from $11.0 million during the quarter ended March 31, 2015, as our new Alteon® hip system, featuring both wedge and monobloc revision stems, continued to gain market acceptance. Sales from biologics and spine increased 5% during the quarter ended March 31, 2016 to $5.4 million from $5.1 million in the comparable quarter in 2015, primarily as a result of contributions from spine implant system launches. Sales of all other products decreased to $5.0 million as compared to $5.8 million in the same quarter last year, primarily as a result of lower instrumentation sales in international markets.
Gross Profit
Gross profit increased to $44.9 million in the quarter ended March 31, 2016 from $42.7 million in the quarter ended March 31, 2015. As a percentage of sales, gross profit decreased slightly to 69% during the quarter ended March 31, 2016 from 70% for the quarter ended March 31, 2015. The decrease in the three months of 2016 was primarily a result of continued pricing pressures in both domestic and international markets. Looking forward to the remainder of 2016, we expect gross profit, as a percentage of sales, to decrease approximately 0.20-0.80% on a comparative basis.
Operating Expenses
Total operating expenses increased 5% to $38.6 million in the quarter ended March 31, 2016 from $36.7 million in the quarter ended March 31, 2015. As a percentage of sales, total operating expenses decreased to 59% for the quarter ended March 31, 2016, as compared to 60% for the same quarter in 2015, as a result of our continued focus on controlling general operating expenses, and partially offset by increased research and development spending.
Sales and marketing expenses, the largest component of total operating expenses, increased 7% for the quarter ended March 31, 2016 to $23.3 million from $21.9 million in the same quarter last year. Sales and marketing expenses, as a percentage of sales, remained constant at 36% for each of the quarters ended March 31, 2016 and 2015. The increase for the three months ended March 31, 2016 was partially related to operating expenses of our newly acquired Australian distributor, as well as increased variable selling costs. Looking forward, sales and marketing expenditures, as a percentage of sales, are expected to be in the range of 35.5% to 36.5% for the remainder of 2016.
General and administrative expenses increased 1% to $5.9 million for the quarter ended March 31, 2016. As a percentage of sales, general and administrative expenses decreased to 9% for the quarter ended March 31, 2016, as compared to 10% for the same quarter of 2015. The decrease in the percentage of sales was a result of our efforts to control operating expenses. General and administrative expenses for the remainder of 2016 are expected to be in the range of 8.5% to 9.5% of sales.
Research and development expenses increased 12% for the quarter ended March 31, 2016 to $5.1 million from $4.5 million in the same quarter last year. As a percentage of sales, research and development expenses increased to 8% for the quarter ended March 31, 2016 as compared to 7% for the quarter ended March 31, 2015. The increase in research and development expenses was a result of continuing product development costs to support new product launches. We expect research and development expenses ranging from 7.5% to 8.5% of sales for the remainder of 2016.
Depreciation and amortization decreased 3% to $4.3 million for the quarter ended March 31, 2016 from $4.4 million during the same quarter in 2015. As a percentage of sales, depreciation and amortization expense

21
remained relatively flat at 7% during each of the quarters ended March 31, 2016 and 2015. We placed $7.9 million of surgical instrumentation, $0.8 million in facility additions, and $0.5 million of equipment in service during the first quarter of 2016.
Income from Operations
Our income from operations increased 4% to $6.3 million, or 10% of sales, in the quarter ended March 31, 2016 from $6.1 million, or 10% of sales, in the quarter ended March 31, 2015. The increase in our income from operations for the three months ended March 31, 2016 was primarily a result of our sales increase, which was offset by only a modest increase in operating expenses. Looking forward, we expect operating expenses for the remainder of 2016 to grow approximately 5-8%, and together with an anticipated increase in revenue of 2-6%, we anticipate income from operations, as a percentage of sales, to increase by 0.5-1.0% for the remainder of 2016.
Other Income and Expenses
We had other income, net of other expense, of $0.3 million during the quarter ended March 31, 2016, compared to other expenses, net of other income of $0.5 million in the quarter ended March 31, 2015. The change for the quarter was primarily a result of net foreign currency gains of $0.5 million for the quarter ended March 31, 2016, as compared to net foreign currency losses of $0.2 million for the same quarter of 2015. The increase in currency gains in the quarter ended March 31, 2016 was primarily due to the strengthening of the Australian Dollar (AUD) and the JPY against the USD on intercompany debt during the quarter ended March 31, 2016, as compared to the strengthening of the USD against the EUR and JPY during the quarter ended March 31, 2015. Net interest expense was $0.3 million for each of the quarters ended March 31, 2016 and 2015.
Taxes and Net Income
Income before provision for income taxes increased 18% to $6.6 million in the quarter ended March 31, 2016 from $5.6 million in the quarter ended March 31, 2015, primarily due to the impact of sales growth and foreign currency gains. The effective tax rate, as a percentage of income before taxes, was 33% for the quarter ended March 31, 2016, compared to 26% for the same quarter in 2015, primarily as a result of the change in the mix of income in the different tax jurisdictions and an elimination of a tax valuation allowance in Spain in the quarter ended March 31, 2015. As a result of the foregoing, we realized net income of $4.4 million in the quarter ended March 31, 2016, an increase of 7% from $4.1 million in the quarter ended March 31, 2015. As a percentage of sales, net income remained constant at 7% for each of the quarters ended March 31, 2016 and 2015. Earnings per share, on a diluted basis, increased to $0.31 for the quarter ended March 31, 2016, from $0.29 for the quarter ended March 31, 2015.
Liquidity and Capital Resources
We have financed our operations primarily through a combination of commercial debt financing and cash flows from our operating activities. At March 31, 2016, we had working capital of $107.6 million, a 6.3% decrease from $114.8 million at the end of 2015. Working capital in 2016 decreased as a result of the reduction in our cash and increase in accounts payable balances.
We expect that cash flows from operating activities, borrowings under our line of credit, and the issuance of equity securities in connection with both stock purchases under the 2009 ESPP and the exercise of stock option awards under the 2009 Plan will be sufficient to meet our commitments and cash requirements in the next twelve months. If not, we will seek additional funding through any number of possible combinations of additional debt, additional issuance of equity or convertible debt. As of March 31, 2016, $5.8 million of our cash balance was held outside the United States. Our foreign cash holdings vary depending on operating cash needs of our foreign subsidiaries and the timing of reimbursements to the United States. There are currently no restrictions against repatriation of this cash.
Operating Activities – Operating activities provided net cash of $8.2 million in the three months ended March 31, 2016, as compared to net cash from operations of $11.1 million during the three months ended March 31, 2015. This decrease in the first three months of 2016 was primarily related to the increase in inventory, which used cash of $4.6 million for the three months ended March 31, 2016, offset partially by an increase in accounts payable of $3.2 million, in contrast to a decrease in inventory purchases providing $2.2 million and a $0.4 million increase in cash flow from accounts payable. Accounts receivable used net cash of $2.4 for the three months ended March 31, 2016 compared to use of net cash of $2.3 million for the three months ended March 31, 2015. The change in total accounts receivable was due to increased sales during the first quarter of 2016. Our allowance for doubtful accounts and sales returns increased to $1.1 million at March 31, 2016 from $1.0 million

22
at December 31, 2015. The total days sales outstanding (DSO) ratio, based on average accounts receivable balances, was 74 for the three month period ended March 31, 2016, as compared to 75 for the three month period ended March 31, 2015, as we continued to see improvement in accounts receivable payment terms in the United States. However, as we continue to expand our operations internationally, our DSO ratio could increase because credit terms outside of the United States tend to be relatively longer than those in the United States.
Investing Activities - Investing activities used net cash of $10.1 million in the three months ended March 31, 2016, as compared to $8.8 million used in the three months ended March 31, 2015. A contributor to the increase was our increased cash outlays for surgical instrumentation, facility and manufacturing equipment, which were $9.2 million during the three month period ended March 31, 2016, as compared to cash outlays of $4.7 million for purchases of surgical instrumentation and manufacturing equipment during the same period of 2015.
In February 2016, we acquired Exactech Australia and paid cash consideration of $1.2 million at closing and recognized a preliminary contingent consideration of $2.4 million, which we expect to be paid over the next two years. We funded our acquisition from cash flow from operations. We acquired $1.6 million in current assets, $0.7 million in property and equipment, $0.5 million in identifiable intangible assets, assumed $0.2 million in current liabilities and assumed preliminary deferred taxes of $0.2 million. We have recognized a preliminary goodwill amount of $3.1 million. Our accounting for the acquisition is preliminary and pending final pre-acquisition results and asset valuations. As of March 31, 2016, $1.3 million of the $2.7 million contingent consideration balance was classified in current liabilities due to the expected timing of the earn-out payments.
In January 2015, we acquired Blue Ortho and paid cash consideration of $2.3 million at closing and recognized contingent consideration of $7.1 million, which we expect to pay over the next five to ten years. We funded our acquisition from cash flow from operations. We acquired $1.3 million in current assets, $0.2 million in property and equipment, $7.5 million in identifiable intangible assets, assumed $0.4 million in current liabilities and assumed deferred taxes of $2.5 million. We have recognized a goodwill amount of $6.5 million. We finalized our accounting for the acquisition during the fourth quarter of 2015. As of March 31, 2016 we had $6.2 million of contingent consideration liability in our unaudited condensed consolidated balance sheets, of which $1.4 million is classified in other current liabilities, due to our expected timing of earn-out payments. The remaining $4.8 million preliminary contingent liability is classified as other non-current liabilities.
Financing Activities - Financing activities used net cash of $1.7 million in the three months ended March 31, 2016, as compared to $0.1 million in net cash provided for the three months ended March 31, 2015. In the first three months of 2016, we had no change in our debt balance, as compared to net repayments of $0.8 million in the first three months of 2015, due to payments on our previous term loan. During the first three months of 2016, we paid contingent consideration payments to the former shareholders of Blue Ortho of $0.3 million, and we used cash of $3.0 million for the repurchase of our common stock. Proceeds from the exercise of stock options provided cash of $1.7 million during the three months ended March 31, 2016, as compared to $0.9 million during the three months ended March 31, 2015, and we used the proceeds to fund general working capital.
Long-term Debt
In December 2015, we entered into a new revolving credit line for a maximum aggregate principal amount of $150.0 million, referred to as the Credit Agreement, with JP Morgan Chase Bank, as Administrative Agent, JP Morgan Securities, as Lead Arranger and Lead Bookrunner, and Compass Bank as Syndication Agent. The Credit Agreement is composed of a revolving credit line in an aggregate principal amount of up to $150.0 million, of which, a portion is a $5.0 million swingline facility and portion is a $5.0 million facility for the issuance of letters of credit. Interest on the outstanding balance under the Credit Agreement is based, at our election, on a base rate, a LIBOR Rate or an index rate, in each case plus an applicable margin. The Credit Agreement expires on December 16, 2020. The Credit Agreement contains financial covenants requiring that we maintain a leverage ratio of not greater than 3.00 to 1.00 and a fixed charge coverage ratio of not less than 1.50 to 1.00. As of March 31, 2016, we were in compliance with all financial covenants. For additional information regarding the Credit Agreement, please see note 6 - Debt to our audited consolidated financial statements contained in our Annual Report on Form 10-K for the year ended December 31, 2015.
Other Commitments and Contingencies
At March 31, 2016, we had outstanding commitments for the purchase of inventory, raw materials and supplies of $20.8 million and outstanding commitments for the purchase of capital equipment of $18.5 million. Purchases under our distribution agreements were $0.8 million during the three months ended March 31, 2016.
23
CAUTIONARY STATEMENT RELATING TO FORWARD LOOKING STATEMENTS
This report contains various “forward looking statements” within the meaning of Section 27A of the Securities Act of 1933, as amended, and Section 21E of the Securities Exchange Act of 1934, as amended (the "Exchange Act"), which represent the Company’s expectations or beliefs concerning future events, including, but not limited to, statements regarding growth in sales of the Company’s products, profit margins and the sufficiency of the Company’s cash flow for its future liquidity and capital resource needs. When used in this report, the terms “anticipate,” “believe,” “estimate,” “expect” and “intend” and words or phrases of similar import, as they relate to the Company or its subsidiaries or its management, are intended to identify forward-looking statements. These forward-looking statements are further qualified by important factors that could cause actual results to differ materially from those in the forward-looking statements. These factors include, without limitation, the effect of competitive pricing, the Company’s dependence on the ability of its third-party suppliers to produce components on a cost-effective basis to the Company, significant expenditures of resources to maintain high levels of inventory, market acceptance of the Company’s products, the impact of the medical device excise tax, the outcome of litigation, the effects of governmental regulation, potential product liability risks and risks of securing adequate levels of product liability insurance coverage, and the availability of reimbursement to patients from health care payers for procedures in which the Company’s products are used. Results actually achieved may differ materially from expected results included in these statements as a result of these or other factors, including those factors discussed under “Risk Factors” in our annual report on Form 10-K for the year ended December 31, 2015 and this quarterly report on Form 10-Q. Exactech undertakes no obligation to update, and the Company does not have a policy of updating or revising, these forward-looking statements. Except where the context otherwise requires, the terms, “we”, “us”, “our”, “the Company,” or “Exactech” refer to the business of Exactech, Inc. and its consolidated subsidiaries.

24
Item 3. Quantitative and Qualitative Disclosures About Market Risk
Interest Rate Risk
We are exposed to market risk from interest rates. For our cash and cash equivalents, a change in interest rates affects the amount of interest income that can be earned. For our debt instruments, changes in interest rates affect the amount of interest expense incurred. If our variable rates of interest increased by 1%, our debt service would increase by approximately $0.1 million for the remainder of 2016.
The table that follows provides information about our financial instruments that are sensitive to changes in interest rates, including debt obligations. The table presents principal cash flow by expected maturity dates and weighted average interest rates for our debt obligation. We believe that the amounts presented reasonably approximate the financial instrument's respective fair market value as of March 31, 2016, and the weighted average interest rate is that experienced during the three months ended March 31, 2016:
(in thousands, except percentages) 2016 2017 2018 2019 Thereafter Total
Liabilities Line of Credit at variable interest rate $ — $ — $ — $ — $ 16,000 $ 16,000 Weighted average interest rate 2.2%
Foreign Currency Risk
Foreign Currency Translations – We are exposed to market risk related to changes in foreign currency exchange rates. The functional currency of substantially all of our international subsidiaries is their local currency. Transactions are translated into U.S. Dollars (USD), and exchange gains and losses arising from translation are recognized in “Other comprehensive income (loss)”. Fluctuations in exchange rates affect our financial position and results of operations. The majority of our foreign currency exposure is to the Euro (EUR), British Pound (GBP), Japanese Yen (JPY) and Australian Dollar (AUD). During the three months ended March 31, 2016, translation gains were $2.6 million, which were primarily due to the strengthening of the JPY and AUD against the USD. During the three months ended March 31, 2015, translation losses were $3.3 million.
Foreign Currency Transactions – The USD is our primary currency, and transactions that are completed in a foreign currency are translated into USD and recorded in our consolidated financial statements. We recognized currency transaction gains of $0.7 million for the three months ended March 31, 2016, primarily due to the strengthening of the JPY and AUD as compared to the USD, and currency transaction losses of $0.6 million during the same period in 2015. We currently believe that our exchange rate risk exposure is not material to our operations.
Foreign Currency Options – During the first quarter of 2016, we had entered into foreign currency forward contracts as economic hedges against the continued strengthening of the USD against the EUR and the JPY. During the three months ended March 31, 2016, we recognized losses of $0.2 million, related to these instruments because the USD weakened against the EUR and the JPY. The recognized losses are recorded in other income (expense) in the unaudited condensed consolidated statements of income related to the fair value of these currency options based upon a dealer's quotes.
During the first quarter of 2015, we had entered into foreign currency forward contracts as economic hedges against the continued strengthening of the USD against the EUR and the JPY. As of March 31, 2015, we had two foreign currency forward contracts with six month terms. During the quarter ended March 31, 2015, we recognized a gain of $0.4 million on the condensed consolidated statements of income related to the fair value of these currency options based upon a dealer's quotes.

25
Item 4. Controls and Procedures
Disclosure Controls and Procedures
As of the end of the period covered by this report, we carried out an evaluation, under the supervision and with the participation of our management, including our Chief Executive Officer ("CEO") and our Chief Financial Officer ("CFO"), of the effectiveness of the design and operation of our disclosure controls and procedures, or “disclosure controls,” pursuant to Exchange Act Rule 13a-15(b). Disclosure controls are controls and procedures designed to reasonably ensure that information required to be disclosed in our reports filed under the Exchange Act, such as this quarterly report, is recorded, processed, summarized and reported within the time periods specified in the U.S. Securities and Exchange Commission’s rules and forms. Disclosure controls include, without limitation, controls and procedures designed to ensure that information required to be disclosed in our reports filed under the Exchange Act is accumulated and communicated to our management, including our CEO and CFO, or persons performing similar functions, as appropriate, to allow timely decisions regarding required disclosure. Our disclosure controls include some, but not all, components of our internal control over financial reporting. Based upon that evaluation, our CEO and CFO concluded that our disclosure controls and procedures were effective as of March 31, 2016.
Changes in Internal Control over Financial Reporting
There have not been any changes in our internal control over financial reporting identified in connection with the evaluation required by paragraph (d) of Exchange Act Rules 13a-15 or 15d-15 during the three months ended March 31, 2016, that have materially affected, or are reasonably likely to materially affect, our internal control over financial reporting.

26
PART II. OTHER INFORMATION
Item 1. Legal Proceedings
There are various claims, lawsuits, and disputes with third parties and pending actions involving various allegations against us incident to the operation of our business, principally product liability cases. While we believe that the various claims are without merit, we are unable to predict the ultimate outcome of such litigation. We therefore maintain insurance, subject to self-insured retention limits, for all such claims, and establish accruals for product liability and other claims based upon our experience with similar past claims, advice of counsel and the best information reasonably available. At March 31, 2016 and December 31, 2015, we had $125,000 and $100,000 accrued, respectively, for product liability claims. These product liability claims are subject to various uncertainties, and it is possible that they may be resolved unfavorably to us. While it is not possible to predict with certainty the outcome of the various cases, it is the opinion of management that, upon ultimate resolution, the cases will not have a material adverse effect on our consolidated financial position, results of operations or cash flows.
Our insurance policies covering product liability claims must be renewed annually. Although we have been able to obtain insurance coverage for product liability claims at a cost and on other terms and conditions that have been acceptable to us, we may not be able to procure acceptable policies in the future.
Item 1A. Risk Factors
There have been no material changes to the risk factors set forth in Part I, Item 1A, of our Annual Report on Form 10-K for the year ended December 31, 2015.
Item 2. Unregistered Sales of Equity Securities and Use of Proceeds
The table below contains information with respect to shares of our common stock we repurchased during the three months ended March 31, 2016.
Period
Total Shares Repurchased
(#)
Avg Price per Share
($)
Total Number of Shares Purchased as Part of Publicly Announced Plans
or Programs (#)
Total Number of Shares That May Yet Be
Purchased Under The Program (#)(1)
January 1 – March 31, 2016 163,529 18.60 163,529 836,471
(1) In December 2015, our Board of Directors authorized the repurchase of up to 1.0 million shares of our common stock over a two year period.

27
Item 6. Exhibits (a) Exhibit Description
31.1 Certification pursuant to Section 302 of the Sarbanes-Oxley Act of 2002.
31.2 Certification pursuant to Section 302 of the Sarbanes-Oxley Act of 2002.
32.1 Certification of Chief Executive Officer pursuant to 18 USC Section 1350.
32.2 Certification of Chief Financial Officer pursuant to 18 USC Section 1350.
101.INS XBRL Instance Document
101.SCH XBRL Taxonomy Extension Schema
101.CAL XBRL Taxonomy Extension Calculation Linkbase
101.DEF XBRL Taxonomy Extension Definition Linkbase
101.LAB XBRL Taxonomy Extension Label Linkbase
101.PRE XBRL Taxonomy Extension Presentation Linkbase
28
SIGNATURES
Pursuant to the requirements of the Securities Exchange Act of 1934, the registrant has duly caused this report to be signed on its behalf by the undersigned thereunto duly authorized. Exactech, Inc. Date: April 29, 2016 By: /s/ David Petty David Petty
Chief Executive Officer (principal executive officer) and President
Date: April 29, 2016 By: /s/ Joel C. Phillips Joel C. Phillips
EVP, Chief Financial Officer (principal financial officer and principal accounting officer) and
Treasurer

Exhibit 31.1
CERTIFICATION
I, David Petty, certify that:
1. I have reviewed this quarterly report on Form 10-Q of Exactech, Inc.;
2. Based on my knowledge, this report does not contain any untrue statement of a material fact or omit to state a material fact necessary to make the statements made, in light of the circumstances under which such statements were made, not misleading with respect to the periods covered by this report;
3. Based on my knowledge, the financial statements, and other financial information included in this report, fairly present in all material respects the financial condition, results of operations and cash flows of the registrant as of, and for, the periods presented in this report;
4. The registrant’s other certifying officer and I are responsible for establishing and maintaining disclosure controls and procedures (as defined in Exchange Act Rules 13a-15(e) and 15d-15(e)) and internal control over financial reporting (as defined in Exchange Act Rules 13a-15(f) and 15d-15(f)) for the registrant and we have:
a) designed such disclosure controls and procedures, or caused such disclosure controls and procedures to be designed under our supervision, to ensure that material information relating to the registrant, including its consolidated subsidiaries, is made known to us by others within those entities, particularly during the period in which this report is being prepared; and
b) designed such internal control over financial reporting, or caused such internal control over financial reporting to be designed under our supervision, to provide reasonable assurance regarding the reliability of financial reporting and the preparation of financial statements for external purposes in accordance with generally accepted accounting principles; and
c) evaluated the effectiveness of the registrant’s disclosure controls and procedures and presented in this report our conclusions about the effectiveness of the disclosure controls and procedures, as of the end of the period covered by this report based on such evaluation; and
d) disclosed in this report any change in the registrant’s internal control over financial reporting that occurred during the registrant’s most recent fiscal quarter (the registrant’s fourth fiscal quarter in the case of an annual report) that has materially affected, or is reasonably likely to materially affect, the registrant’s internal control over financial reporting.
5. The registrant’s other certifying officer and I have disclosed, based on our most recent evaluation of the internal control over financial reporting, to the registrant’s auditors and the audit committee of registrant’s board of directors (or persons performing the equivalent function):
a) all significant deficiencies and material weaknesses in the design or operation of internal controls over financial reporting which are reasonably likely to adversely affect the registrant’s ability to record, process, summarize and report financial information; and
b) any fraud, whether or not material, that involves management or other employees who have a significant role in the registrant’s internal controls over financial reporting.
Date: April 29, 2016 /s/ David Petty David Petty Chief Executive Officer, President and
Director
Exhibit 31.2
CERTIFICATION
I, Joel C. Phillips, certify that:
1. I have reviewed this quarterly report on Form 10-Q of Exactech, Inc.;
2. Based on my knowledge, this report does not contain any untrue statement of a material fact or omit to state a material fact necessary to make the statements made, in light of the circumstances under which such statements were made, not misleading with respect to the periods covered by this report;
3. Based on my knowledge, the financial statements, and other financial information included in this report, fairly present in all material respects the financial condition, results of operations and cash flows of the registrant as of, and for, the periods presented in this report;
4. The registrant’s other certifying officer and I are responsible for establishing and maintaining disclosure controls and procedures (as defined in Exchange Act Rules 13a-15(e) and 15d-15(e)) and internal control over financial reporting (as defined in Exchange Act Rules 13a-15(f) and 15d-15(f)) for the registrant and we have:
a) designed such disclosure controls and procedures, or caused such disclosure controls and procedures to be designed under our supervision, to ensure that material information relating to the registrant, including its consolidated subsidiaries, is made known to us by others within those entities, particularly during the period in which this report is being prepared; and
b) designed such internal control over financial reporting, or caused such internal control over financial reporting to be designed under our supervision, to provide reasonable assurance regarding the reliability of financial reporting and the preparation of financial statements for external purposes in accordance with generally accepted accounting principles; and
c) evaluated the effectiveness of the registrant’s disclosure controls and procedures and presented in this report our conclusions about the effectiveness of the disclosure controls and procedures, as of the end of the period covered by this report based on such evaluation; and
d) disclosed in this report any change in the registrant’s internal control over financial reporting that occurred during the registrant’s most recent fiscal quarter (the registrant’s fourth fiscal quarter in the case of an annual report) that has materially affected, or is reasonably likely to materially affect, the registrant’s internal control over financial reporting.
5. The registrant’s other certifying officer and I have disclosed, based on our most recent evaluation of the internal control over financial reporting, to the registrant’s auditors and the audit committee of registrant’s board of directors (or persons performing the equivalent function):
a) all significant deficiencies and material weaknesses in the design or operation of internal controls over financial reporting which are reasonably likely to adversely affect the registrant’s ability to record, process, summarize and report financial information; and
b) any fraud, whether or not material, that involves management or other employees who have a significant role in the registrant’s internal controls over financial reporting.
Date: April 29, 2016 /s/ Joel C. Phillips Joel C. Phillips Executive Vice President, Chief Financial
Officer and Treasurer

Exhibit 32.1
CERTIFICATION PURSUANT TO
18 U.S.C. SECTION 1350,
AS ADOPTED PURSUANT TO
SECTION 906 OF THE SARBANES-OXLEY ACT OF 2002 In connection with the Quarterly Report on Form 10-Q of Exactech, Inc. (the “Company”) for the period ended March 31, 2016 as filed with the Securities and Exchange Commission on the date hereof (the “Report”), I, David Petty, Chief Executive Officer of the Company, certify, pursuant to 18 U.S.C. § 1350, as adopted pursuant to § 906 of the Sarbanes-Oxley Act of 2002, that:
(1) The Report fully complies with the requirements of section 13(a) or 15(d) of the Securities Exchange Act of 1934; and
(2) The information contained in the Report fairly present, in all material respects, the financial condition and results of operations of the Company.
/s/ David Petty David Petty Chief Executive Officer April 29, 2016

Exhibit 32.2
CERTIFICATION PURSUANT TO
18 U.S.C. SECTION 1350,
AS ADOPTED PURSUANT TO
SECTION 906 OF THE SARBANES-OXLEY ACT OF 2002 In connection with the Quarterly Report on Form 10-Q of Exactech, Inc. (the “Company”) for the period ended March 31, 2016 as filed with the Securities and Exchange Commission on the date hereof (the “Report”), I, Joel C. Phillips, Chief Executive Officer of the Company, certify, pursuant to 18 U.S.C. § 1350, as adopted pursuant to § 906 of the Sarbanes-Oxley Act of 2002, that:
(1) The Report fully complies with the requirements of section 13(a) or 15(d) of the Securities Exchange Act of 1934; and
(2) The information contained in the Report fairly present, in all material respects, the financial condition and results of operations of the Company.
/s/ Joel C. Phillips Joel C. Phillips Chief Financial Officer April 29, 2016