1Q11 Results Conference Call
16
1Q11 Earnings Conference Call
-
Upload
pineriweb -
Category
Economy & Finance
-
view
55 -
download
0
Transcript of 1Q11 Results Conference Call
1Q11
Earnings Conference Call
Content
Financial Information
1Q11 Highlights Page 4
1Q11 Highlights – Corporate Business Page 5
Credit Portfolio Page 6
Credit Portfolio Profile Page 7
Credit Portfolio Quality Page 8
2/16Investor Relations| 1Q11 |
Credit Portfolio Quality Page 8
Payroll Deductible Loan Portfolio Page 9
Funding Page 10
Funding and Credit Portfolio Maturities Page 11
Capital Adequacy Ratio (BIS) Page 12
Other Highlights
2011 Guidance – BR GAAP Page 14
1Q11 Events and Highlights Page 15
1Q11 – Financial Information
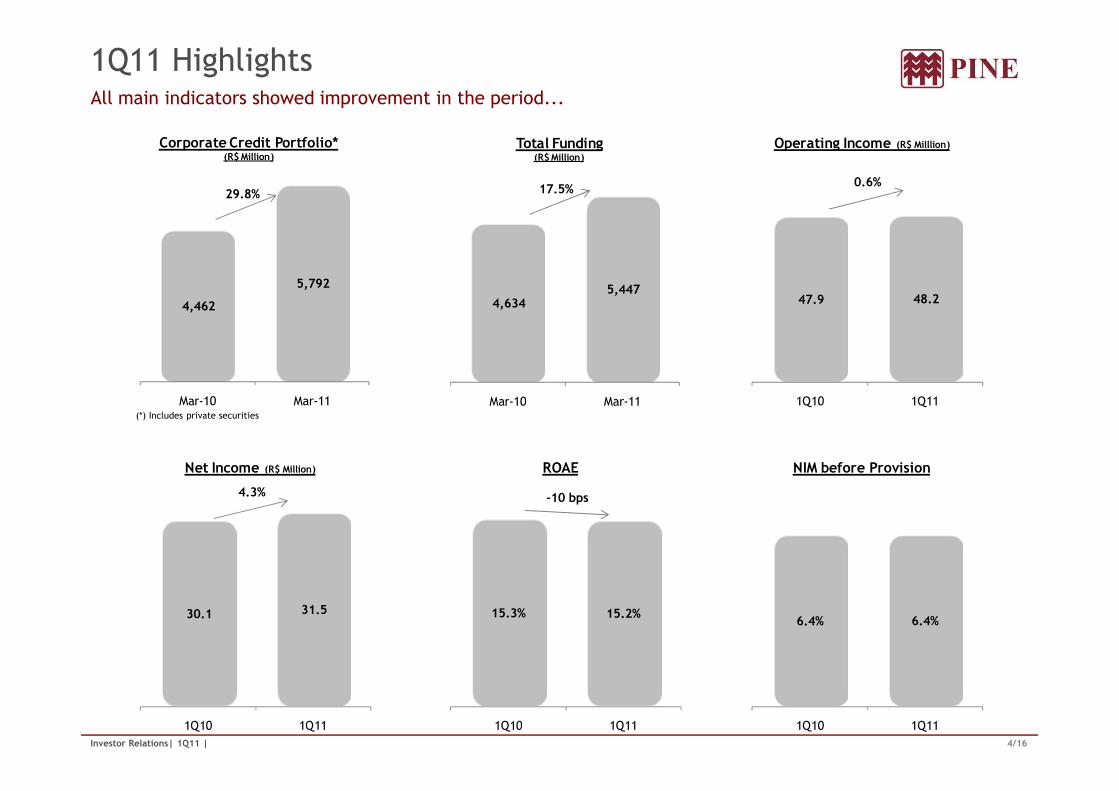
1Q11 HighlightsAll main indicators showed improvement in the period...
4,462
5,792
Mar-10 Mar-11
Corporate Credit Portfolio*(R$ Million)
29.8%
4,634 5,447
Mar-10 Mar-11
Total Funding(R$ Million)
17.5%
47.9 48.2
1Q10 1Q11
Operating Income (R$ Milllion)
0.6%
4/16Investor Relations| 1Q11 |
(*) Includes private securities
Mar-10 Mar-11 Mar-10 Mar-11 1Q10 1Q11
30.1 31.5
1Q10 1Q11
Net Income (R$ Million)
4.3%
15.3% 15.2%
1Q10 1Q11
ROAE
-10 bps
6.4% 6.4%
1Q10 1Q11
NIM before Provision
1Q11 Highlights - Corporate... with highlight for the Corporate business earnings.
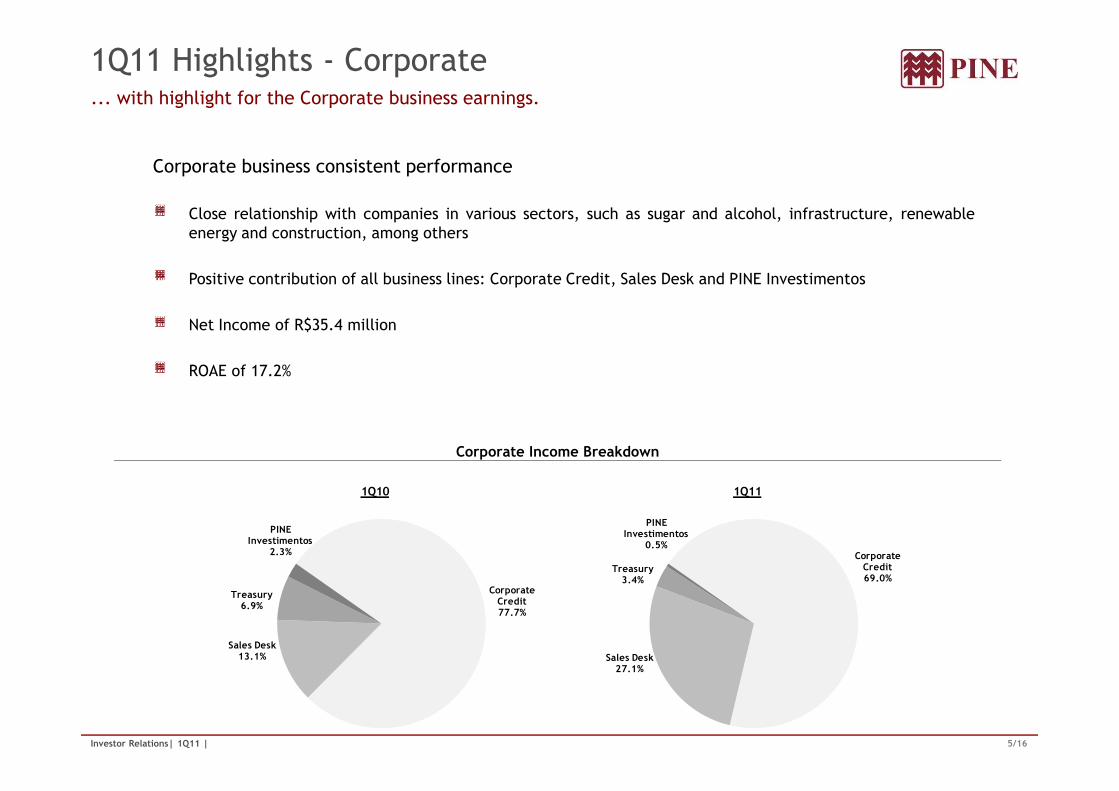
Corporate business consistent performance
Close relationship with companies in various sectors, such as sugar and alcohol, infrastructure, renewableenergy and construction, among others
Positive contribution of all business lines: Corporate Credit, Sales Desk and PINE Investimentos
Net Income of R$35.4 million
ROAE of 17.2%
5/16Investor Relations| 1Q11 |
Corporate Income Breakdown
Corporate Credit77.7%
Sales Desk13.1%
Treasury6.9%
PINE Investimentos
2.3%
1Q10
Corporate Credit69.0%
Sales Desk27.1%
Treasury3.4%
PINE Investimentos
0.5%
1Q11
Credit PortfolioPositive credit portfolio development...
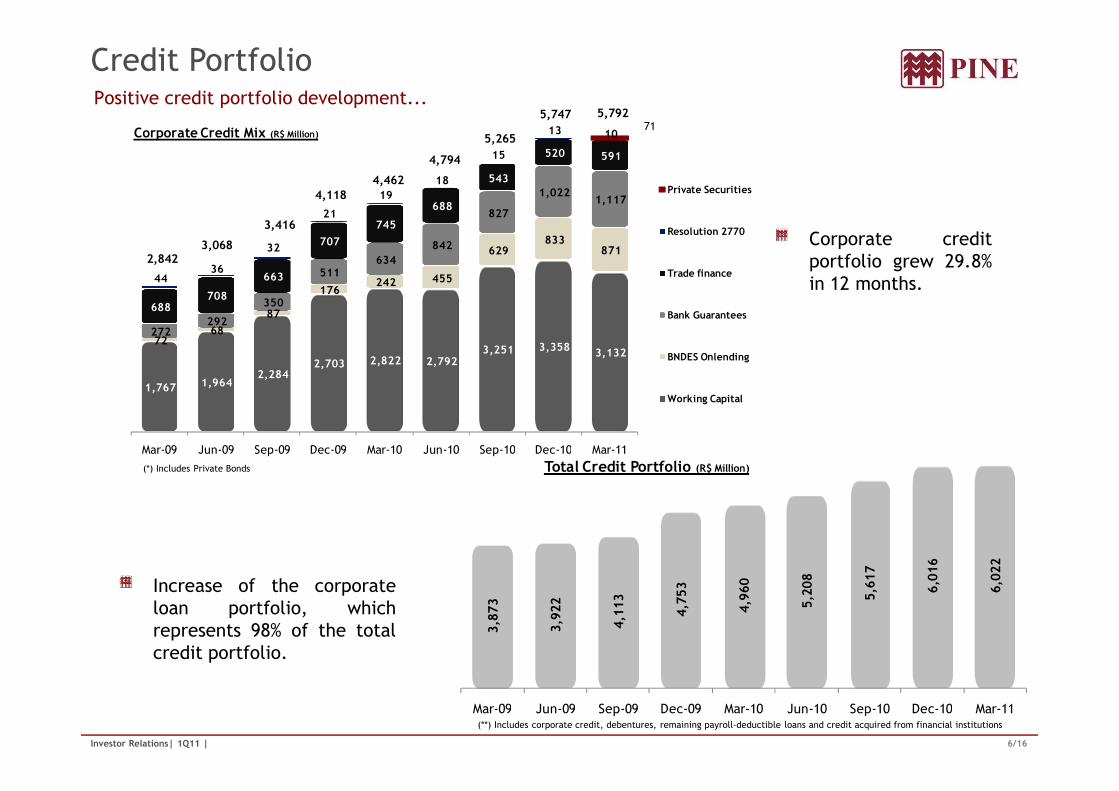
Corporate creditportfolio grew 29.8%in 12 months.
1,767 1,964 2,284
2,703 2,822 2,792 3,251 3,358
3,132 72
68
87
176 242 455
629 833
871
272 292
350
511 634
842
827
1,022 1,117
688 708
663
707
745
688
543
520 591
44 36
32
21
19
18
15
13 10 Corporate Credit Mix (R$ Million)
Private Securities
Resolution 2770
Trade finance
Bank Guarantees
BNDES Onlending
Working Capital
2,8423,068
3,416
4,1184,462
4,794
5,265
5,747 5,79271
6/16Investor Relations| 1Q11 |
Increase of the corporateloan portfolio, whichrepresents 98% of the totalcredit portfolio.
(*) Includes Private Bonds
(**) Includes corporate credit, debentures, remaining payroll-deductible loans and credit acquired from financial institutions
3,873
3,922
4,113
4,753
4,960
5,208
5,617
6,016
6,022
Mar-09 Jun-09 Sep-09 Dec-09 Mar-10 Jun-10 Sep-10 Dec-10 Mar-11
Total Credit Portfolio (R$ Million)Mar-09 Jun-09 Sep-09 Dec-09 Mar-10 Jun-10 Sep-10 Dec-10 Mar-11
Working Capital
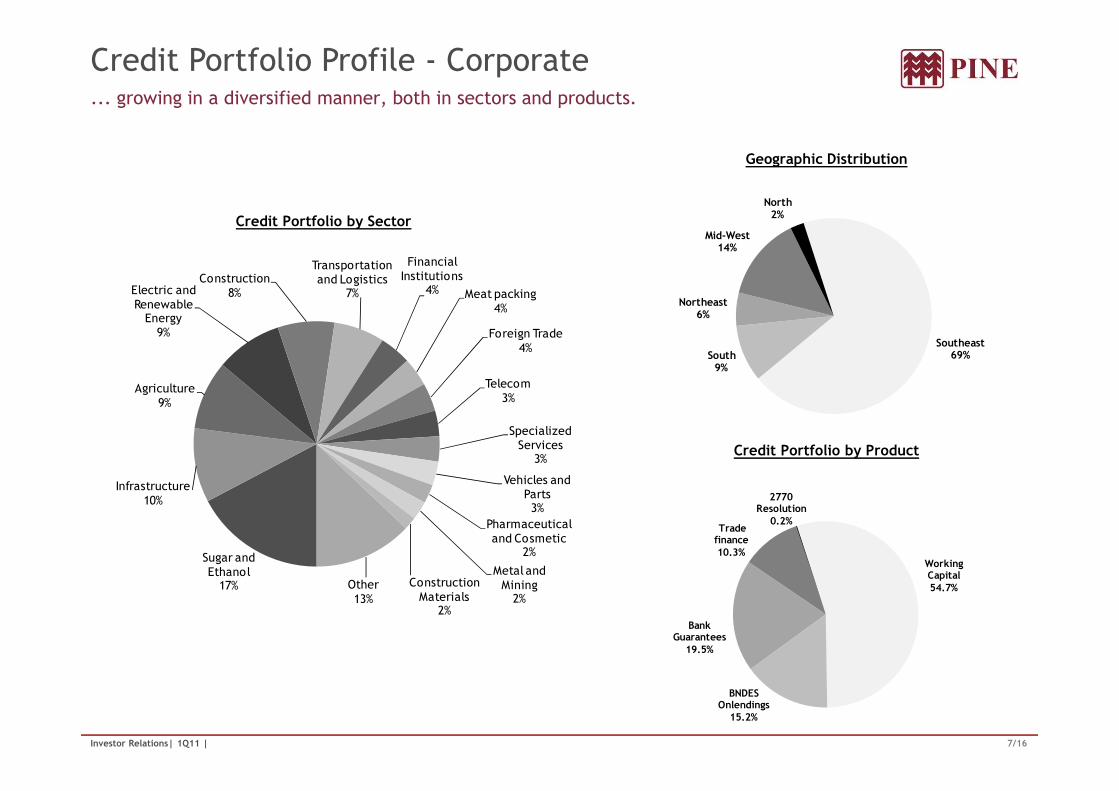
Credit Portfolio Profile - Corporate... growing in a diversified manner, both in sectors and products.
Credit Portfolio by Sector
Geographic Distribution
Agriculture9%
Electric and Renewable Energy9%
Construction8%
Transportation and Logistics
7%
Financial Institutions
4% Meat packing4%
Foreign Trade4%
Telecom3%
Southeast69%South
9%
Northeast6%
Mid-West14%
North2%
7/16Investor Relations| 1Q11 |
Credit Portfolio by Product
Sugar and Ethanol17%
Infrastructure10%
9% 3%
Specialized Services
3%
Vehicles and Parts3%
Pharmaceutical and Cosmetic
2%
Metal and Mining2%
Construction Materials
2%
Other13%
Working Capital54.7%
BNDES Onlendings
15.2%
Bank Guarantees
19.5%
Trade finance 10.3%
2770 Resolution
0.2%
Credit Portfolio Quality
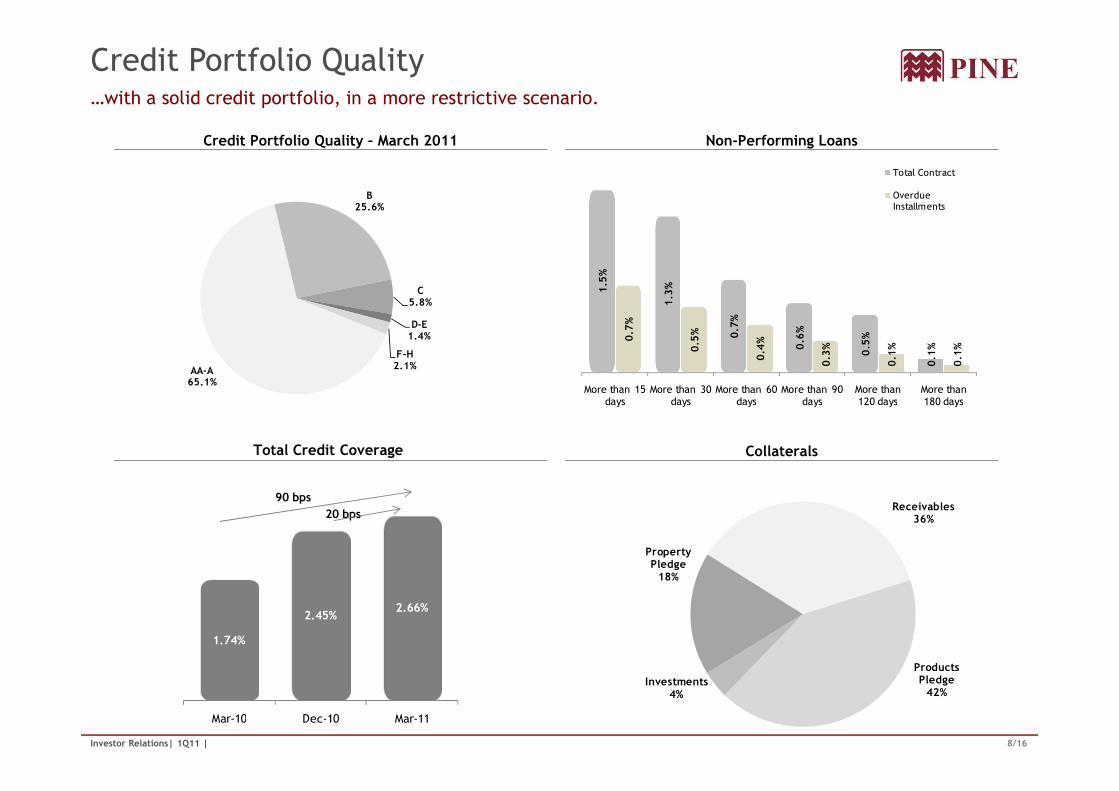
Credit Portfolio Quality – March 2011 Non-Performing Loans
…with a solid credit portfolio, in a more restrictive scenario.
1.5%
1.3%
0.7%
0.6%
0.5%
0.1%
0.7%
0.5%
0.4%
0.3%
0.1%
0.1%
More than 15 days
More than 30 days
More than 60 days
More than 90 days
More than 120 days
More than 180 days
Total Contract
Overdue Installments
AA-A65.1%
B25.6%
C5.8%
D-E1.4%
F-H2.1%
8/16Investor Relations| 1Q11 |
Total Credit Coverage Collaterals
More than 15 days
More than 30 days
More than 60 days
More than 90 days
More than 120 days
More than 180 days
1.74%
2.45%2.66%
Mar-10 Dec-10 Mar-11
90 bps
20 bpsReceivables
36%
Products Pledge42%
Investments4%
Property Pledge18%
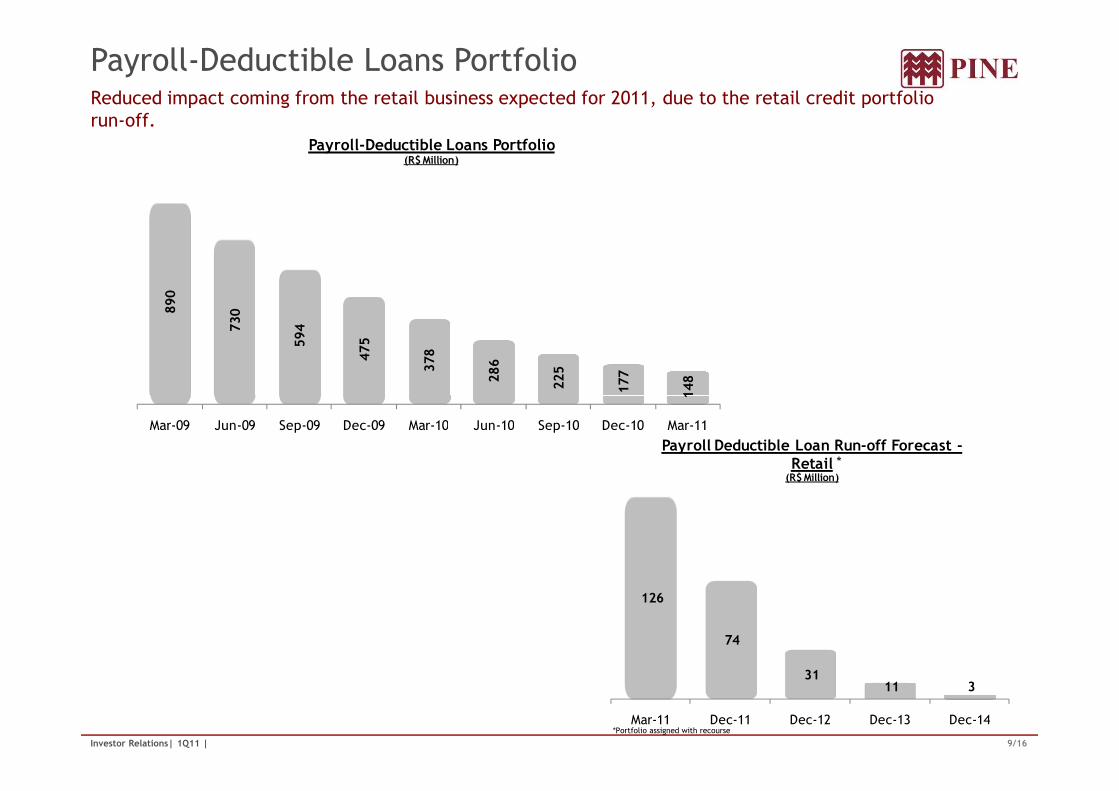
Payroll-Deductible Loans PortfolioReduced impact coming from the retail business expected for 2011, due to the retail credit portfolio run-off.
890
730
594
475
378
286
225
177
148
Payroll-Deductible Loans Portfolio(R$ Million)
9/16Investor Relations| 1Q11 |
148
Mar-09 Jun-09 Sep-09 Dec-09 Mar-10 Jun-10 Sep-10 Dec-10 Mar-11
126
74
31 11 3
Mar-11 Dec-11 Dec-12 Dec-13 Dec-14
Payroll Deductible Loan Run-off Forecast -Retail
(R$ Million)
*
*Portfolio assigned with recourse
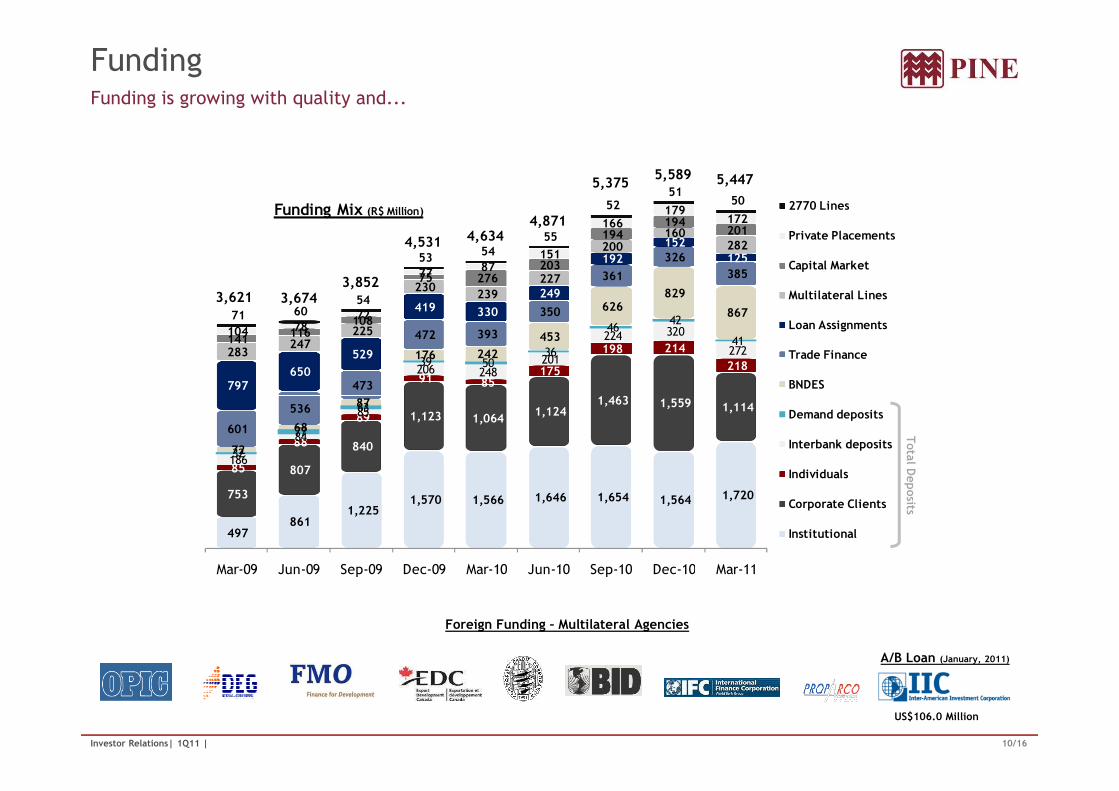
FundingFunding is growing with quality and...
1,463 1,559
91 85 175
198 214
218 206 248 201
224 320
272 39 50
36
46 42
41
87
176 242
453
626 829
867
473
472 393
350
361
326
385
797 650
529
419 330
249
192
152
125
283 247
225
230 239
227
200 160
282
141 116
108
75 276 203
194 194
201
104 78 72
77 87 151
166 179
172
71 60 54
53 54
55
52 51
50 Funding Mix (R$ Million) 2770 Lines
Private Placements
Capital Market
Multilateral Lines
Loan Assignments
Trade Finance
BNDES
5,375
4,8714,6344,531
3,8523,6743,621
5,589 5,447
10/16Investor Relations| 1Q11 |
Foreign Funding – Multilateral Agencies
US$106.0 Million
A/B Loan (January, 2011)
Total D
eposits
497 861
1,225 1,570 1,566 1,646 1,654 1,564 1,720 753
807
840
1,123 1,064 1,124
1,463 1,559 1,114
85
88
89
186
84
85
32
77
63
72
68
87
601
536
Mar-09 Jun-09 Sep-09 Dec-09 Mar-10 Jun-10 Sep-10 Dec-10 Mar-11
Demand deposits
Interbank deposits
Individuals
Corporate Clients
Institutional
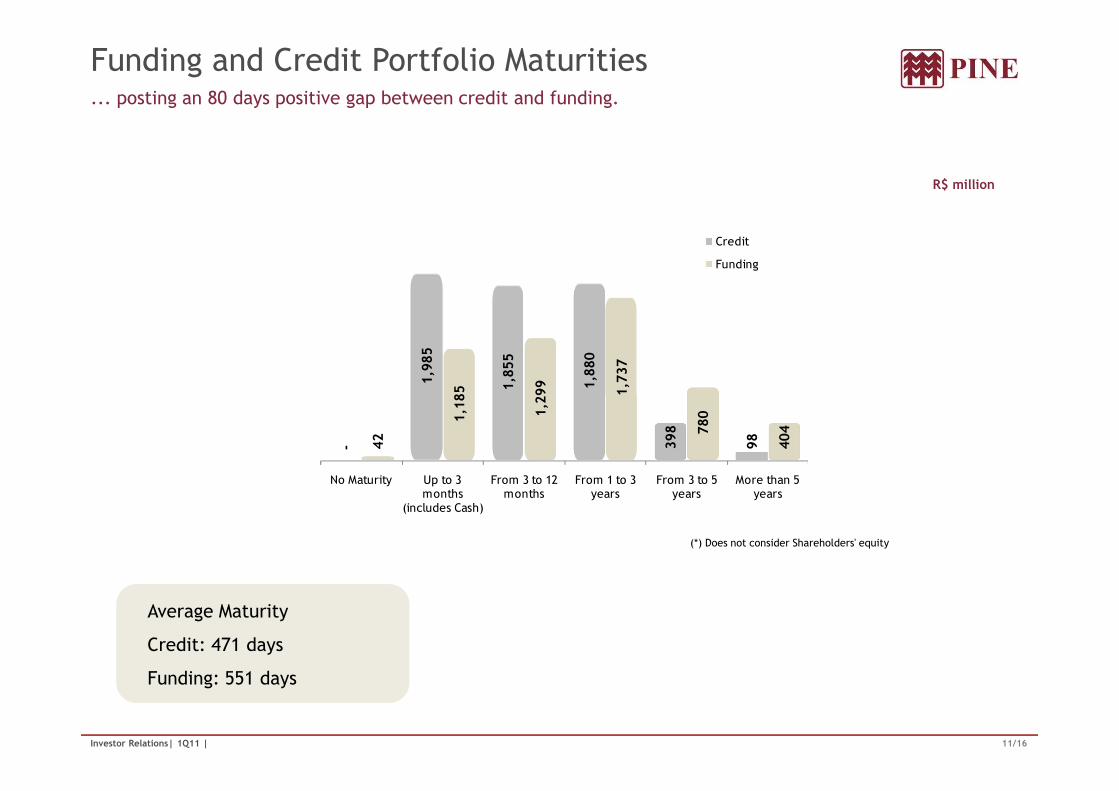
Funding and Credit Portfolio Maturities ... posting an 80 days positive gap between credit and funding.
R$ million
1,985
1,855
1,880
1,185
1,299
1,737
Credit
Funding
11/16Investor Relations| 1Q11 |
Average Maturity
Credit: 471 days
Funding: 551 days
(*) Does not consider Shareholders' equity
- 398
98
42
1,185
1,299
1,737
780
404
No Maturity Up to 3 months
(includes Cash)
From 3 to 12 months
From 1 to 3 years
From 3 to 5 years
More than 5 years
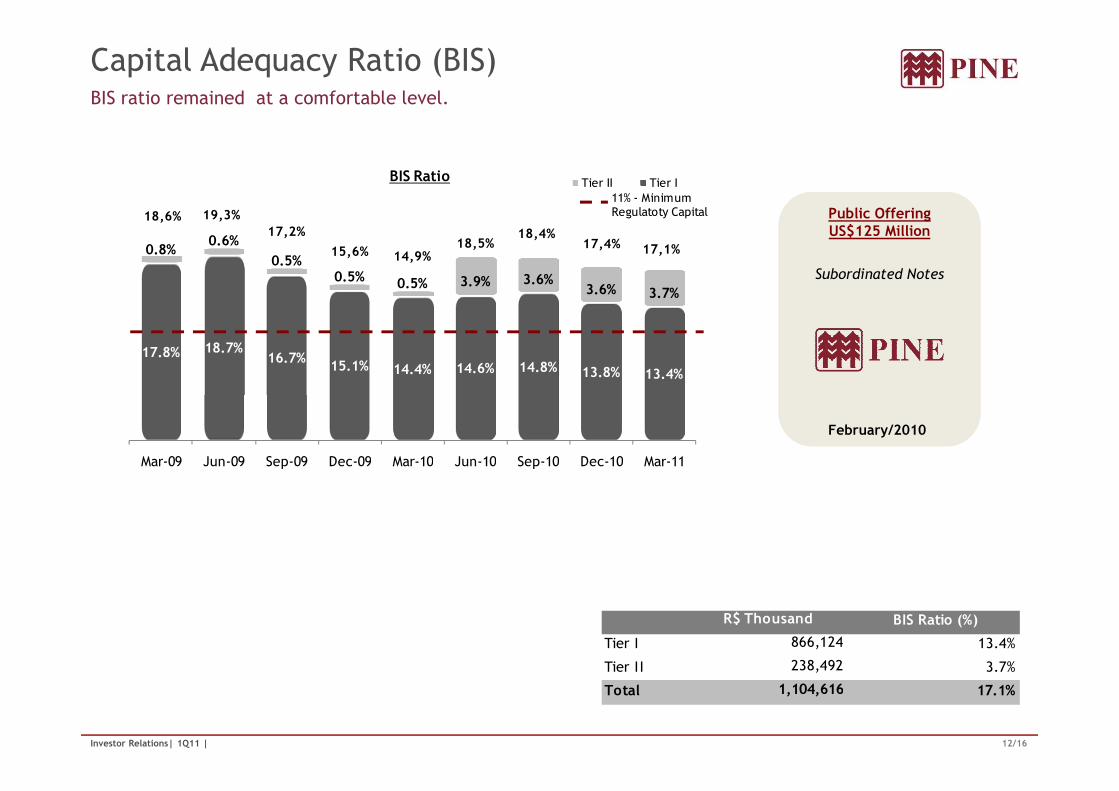
Capital Adequacy Ratio (BIS)BIS ratio remained at a comfortable level.
Subordinated Notes
Public OfferingUS$125 Million
17.8% 18.7%16.7%
15.1% 14.4% 14.6% 14.8% 13.8% 13.4%
0.8%0.6%
0.5%0.5% 0.5% 3.9% 3.6%
3.6% 3.7%
BIS Ratio Tier II Tier I
18,6% 19,3%17,2%
15,6% 14,9%18,5%
18,4%17,4%
11% - Minimum Regulatoty Capital
17,1%
12/16Investor Relations| 1Q11 |
February/2010
Tier I 13.4%
Tier II 3.7%
Total 17.1%
866,124
238,492
1,104,616
R$ Thousand BIS Ratio (%)
Mar-09 Jun-09 Sep-09 Dec-09 Mar-10 Jun-10 Sep-10 Dec-10 Mar-11

Other Highlights
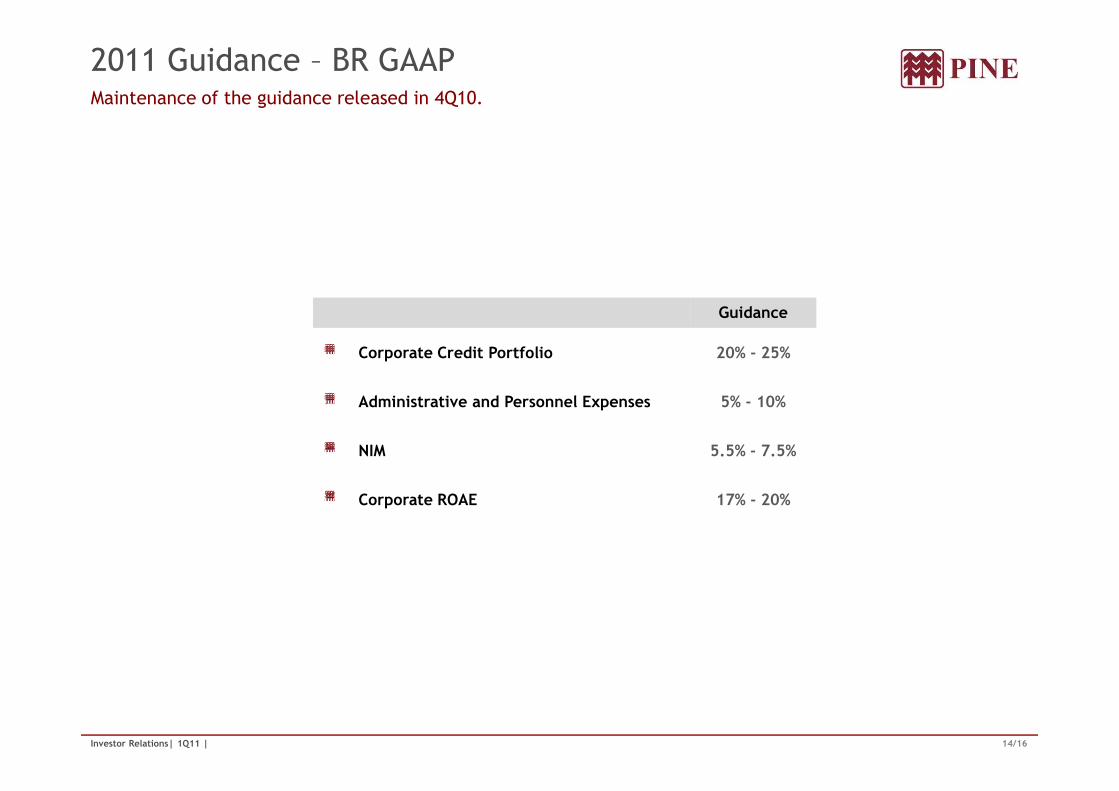
2011 Guidance – BR GAAPMaintenance of the guidance released in 4Q10.
Guidance
Corporate Credit Portfolio 20% - 25%
Administrative and Personnel Expenses 5% - 10%
14/16Investor Relations| 1Q11 |
Administrative and Personnel Expenses 5% - 10%
NIM 5.5% - 7.5%
Corporate ROAE 17% - 20%
1Q11 Events and HighlightsMarket Recognition.
PINE is ranked the 13th largest bank in Cetip’s overall derivatives ranking and the 3rd largest incommodities hedge for clients
On April 6th, PINE’s corporate credit FIDC transaction was successfully completed. The amountof the transaction was R$ 300 million, with a AA+ rating attributed by S&P
PINE was considered, for the second consecutive year, the best commercial bank in Brazil in theWorld Finance Banking Awards. The award was created by British magazine World Finance.Some of the most important criteria were: solutions for clients and optimization of
15/16Investor Relations| 1Q11 |
Some of the most important criteria were: solutions for clients and optimization ofrelationships, innovation and flexibility, and staying ahead of the competition

Investor Relations
Norberto Zaiet Junior
CFO
Nira Bessler
Head of Investor Relations
Alexandre Cavalcanti
16/16Investor Relations| 1Q11 |
This presentation contains forward-looking statements relating to the prospects of the business, estimates for operating and financial results, and those related to growth prospects of Banco Pine. These aremerely projections and, as such, are based exclusively on the expectations of Banco Pine’s management concerning the future of the business and its continued access to capital to fund the Company’sbusiness plan. Such forward-looking statements depend, substantially, on changes in market conditions, government regulations, competitive pressures, the performance of the Brazilian economy and theindustry, among other factors and risks disclosed in Banco Pine’s filed disclosure documents and are, therefore, subject to change without prior notice.
Investor Relations Manager
Alejandra Hidalgo
Investor Relations Analyst
Phone: +55-11-3372-5553 / 5552
www.bancopine.com.br/ir