1Q FY 2021-22 FINANCIAL RESULTS
54
1Q FY 2021-22 FINANCIAL RESULTS
Transcript of 1Q FY 2021-22 FINANCIAL RESULTS

1Q FY 2021-22FINANCIAL RESULTS
Forward Looking Statement
2
This presentation contains forward-looking statements which may be identified by their use of words like
“plans,” “expects,” “will,” “anticipates,” “believes,” “intends,” “projects,” “estimates” or other words of similar
meaning. All statements that address expectations or projections about the future, including, but not limited
to, statements about the strategy for growth, product development, market position, expenditures, and
financial results, are forward-looking statements.
Forward-looking statements are based on certain assumptions and expectations of future events. The
companies referred to in this presentation cannot guarantee that these assumptions and expectations are
accurate or will be realized. The actual results, performance or achievements, could thus differ materially
from those projected in any such forward-looking statements. These companies assume no responsibility to
publicly amend, modify or revise any forward looking statements, on the basis of any subsequent
developments, information or events, or otherwise.
3
Consolidated Financial Results

1Q FY22 – Key Highlights
Resilient business model with multiple growth engines mitigates second wave impact4
➢ Record quarterly EBITDA led by strong operating performance from O2C and Digital Services
▪ Consolidated EBITDA at ₹ 27,550 crore, up 27.6% YoY
➢ Net profit at ₹ 13,806 crore up 66.7% YoY, with normalised tax provision
➢ O2C – Fourth sequential quarter of growth, significantly lower impact of second wave on demand and margins
▪ Demand recovery on track to achieve pre-covid levels in 1-2 quarters
➢ Retail – Impacted by restricted store operations
▪ Ramped up digital commerce to serve customer needs
➢ Digital Services – Good traction in subscriber addition and data usage, unaffected by second wave
▪ Superior network, high customer engagement aiding traction
➢ Oil & Gas – Turnaround led by ramp-up in KG D6 production
➢ All strategic growth initiatives on course
Consolidated Financial Results : 1Q FY22
Strong operating performance despite pandemic-imposed challenges
5
(₹ crore) 1Q FY22 4Q FY21
Change
QoQ 1Q FY21
Change
YoY
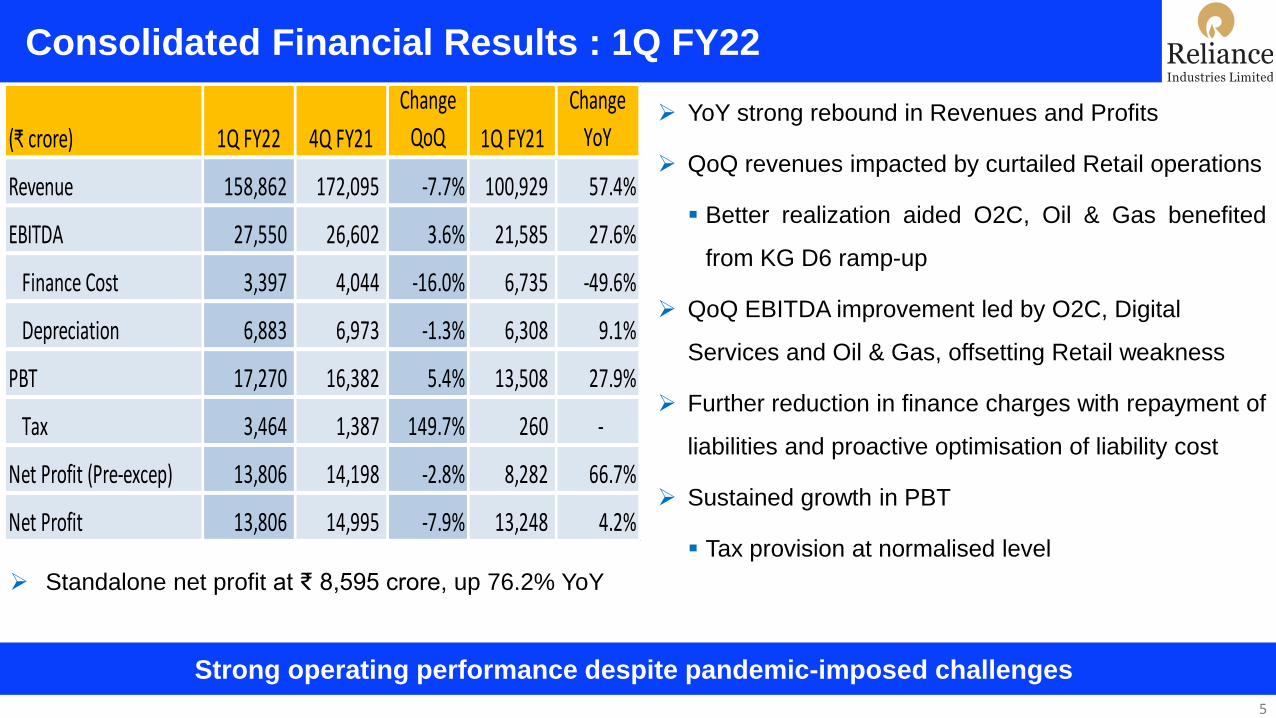
Revenue 158,862 172,095 -7.7% 100,929 57.4%
EBITDA 27,550 26,602 3.6% 21,585 27.6%
Finance Cost 3,397 4,044 -16.0% 6,735 -49.6%
Depreciation 6,883 6,973 -1.3% 6,308 9.1%
PBT 17,270 16,382 5.4% 13,508 27.9%
Tax 3,464 1,387 149.7% 260 -
Net Profit (Pre-excep) 13,806 14,198 -2.8% 8,282 66.7%
Net Profit 13,806 14,995 -7.9% 13,248 4.2%
➢ YoY strong rebound in Revenues and Profits
➢ QoQ revenues impacted by curtailed Retail operations
▪ Better realization aided O2C, Oil & Gas benefited
from KG D6 ramp-up
➢ QoQ EBITDA improvement led by O2C, Digital
Services and Oil & Gas, offsetting Retail weakness
➢ Further reduction in finance charges with repayment of
liabilities and proactive optimisation of liability cost
➢ Sustained growth in PBT
▪ Tax provision at normalised level
➢ Standalone net profit at ₹ 8,595 crore, up 76.2% YoY

Consolidated EBITDA : 1Q FY22
Diversified portfolio of industry leading businesses driving record quarterly EBITDA
6
(₹ crore) 1Q FY22 4Q FY21
Change
QoQ 1Q FY21
Change
YoY
O2C 12,231 11,407 7.2% 8,166 49.8%
Retail 1,953 3,623 -46.1% 1,088 79.5%
Digital Services 9,268 8,945 3.6% 7,803 18.8%
Oil & Gas 797 480 66.0% -32 -
Others 1,545 1,308 18.1% 1,658 -6.8%
Segment EBITDA 25,794 25,763 0.1% 18,683 38.1%
Total EBITDA 27,550 26,602 3.6% 21,585 27.6%
➢ Strong operational performance leading to record
EBITDA
➢ QoQ O2C chain benefited from favorable margins,
feedstock and energy cost optimisation
➢ QoQ sharply lower earnings for Retail on the back of
restricted store operations and lower footfalls; partially
compensated by good traction in omni-channel
➢ Digital Services maintained strong subscriber addition
with reduced churn
➢ Oil & Gas turnaround led by KG D6 ramp-up

Robust Balance Sheet with High Liquidity
Robust cash flows and balance sheet to support growth initiatives and deliver long term value
7
(in ₹ Crore) Jun-21 Mar-21
Gross Debt 253,855 251,811
Cash & cash equivalent 257,716 254,019
Net Debt (3,861) (2,208)
➢ Robust balance sheet with investment grade ratings from S&P, Moody’s and Fitch
▪ Strong business profile with market leading positions
▪ Diversified cash flow from a mix of Energy and Consumer businesses
➢ Significant reduction in finance cost through deleveraging
O2C – Recovery Continuing with Economic Rebound
Global recovery, firm margins and high operating rates supported EBITDA growth8
Demand and Margin Environment
➢ Strength in global demand supporting prices and margins
▪ Improving transportation fuel cracks, at 4-6 quarter high
▪ Continued strength in downstream chemicals margins with recovery in global demand
➢ QoQ domestic demand for fuels and downstream chemicals impacted by lockdowns
▪ Strong YoY demand growth across products on low base
Operational Excellence
➢ Fourth consecutive quarter of sequential growth, EBITDA at ₹ 12,231 crore, up 7.2% QoQ and 49.8% YoY
➢ Feedstock throughput at 19.0 MMT, up 1.6% QoQ
▪ Optimised light feed cracking on favorable economics
➢ Swiftly flexed business model from domestic to exports; ensuring full utilization and smooth product placement
➢ Energy cost optimization with improved availability of domestic gas

Digital Services - Strong Customer Traction
Customer first approach driving growth9
Customer Engagement
➢ Connectivity business sustains momentum despite Covid 2nd wave
▪ Total customer base of 440.6 million as of June 2021; net addition 14.3 million in 1Q FY22
▪ Monthly churn saw a further decline to 0.95%
▪ Overall data traffic on Jio’s network crosses 20 Exabytes for the quarter
▪ Average data consumption per user per month increased sharply by 18% to 15.6 GB
➢ Infrastructure ramp up and focus on customer support minimized Covid related disruption
Financial Performance
➢ ARPU of ₹ 138 with improving subscriber mix and better seasonality offset by Covid impact
➢ JPL Revenue of ₹ 18,952 crore driven by underlying growth of ~18% YoY in RJIL Revenue
➢ JPL EBITDA up 21.3% YoY to ₹ 8,892 crore, with 46.9% EBITDA margin
Retail - Healthy Performance in Challenging Operating Context
Revenue and profit momentum adversely impacted by COVID Wave 2 10
Operating Context
➢ Significant restrictions disrupts stores and logistical operations
➢ Footfalls at 46% of pre-COVID levels; consumer sentiment reviving but cautious
➢ Thrust on store expansion continues with >100 stores opened; 700+ stores fit out ready
➢ Safety of people and operations was a priority – 99%+ of Retail team vaccinated
Financial Performance
➢ Gross Revenues at ₹ 38,547 crore, up 22% YoY with EBITDA at ₹ 1,941 crore, up 80% YoY
▪ Electronics and Fashion drive growth in revenue and EBITDA on better trading conditions compared to last year
▪ Scaled up digital commerce and merchant partnerships; together these contributed ~20% of retail sales

11
Digital Services

Quarterly Highlights
12
Proactive customer first approach drives growth in tough macro
2. Sustained momentum in Connectivity Business
▪ Total customer base of 440.6 million as of June 2021; net addition 14.3 million in 1QFY22
▪ Overall data traffic on Jio’s network crosses 20 Exabytes for the quarter
2. ARPU stable at ₹ 138.4 with improving subscriber mix and better seasonality offset by
Covid impact
3. Focus on infrastructure ramp-up and customer initiatives to minimize disruption
4. Strong financial performance despite Covid related challenges
▪ JPL Revenue of ₹ 18,952 crore underlying growth of ~19% YoY
▪ JPL EBITDA up 21.3% YoY to ₹8,892 crore, with 46.9% EBITDA margin
1
2
3
4

Cloud Partnerships with Google and Microsoft
Partnering with world’s best for cutting edge cloud solutions
13
➢ Jio will use Google Cloud’s cutting-edge technologies to power Jio’s 5G Solutions and for
powering Reliance Retail, JioMart, JioSaavn and JioHealth
▪ Edge Cloud infrastructure from Google Cloud to provide an open, highly scalable and high-
performing platform to Jio
▪ Jio and Google Cloud will collaborate to bring a portfolio of 5G edge computing solutions
across gaming, healthcare, education, and video entertainment
➢ Jio and Microsoft have operationalized an initial 10MW capacity of Jio-Azure cloud data centers
across Jamnagar and Nagpur
▪ Currently onboarding pilot customers with our offerings for SMEs and start-ups
▪ Further enhancement of capacity in subsequent quarters
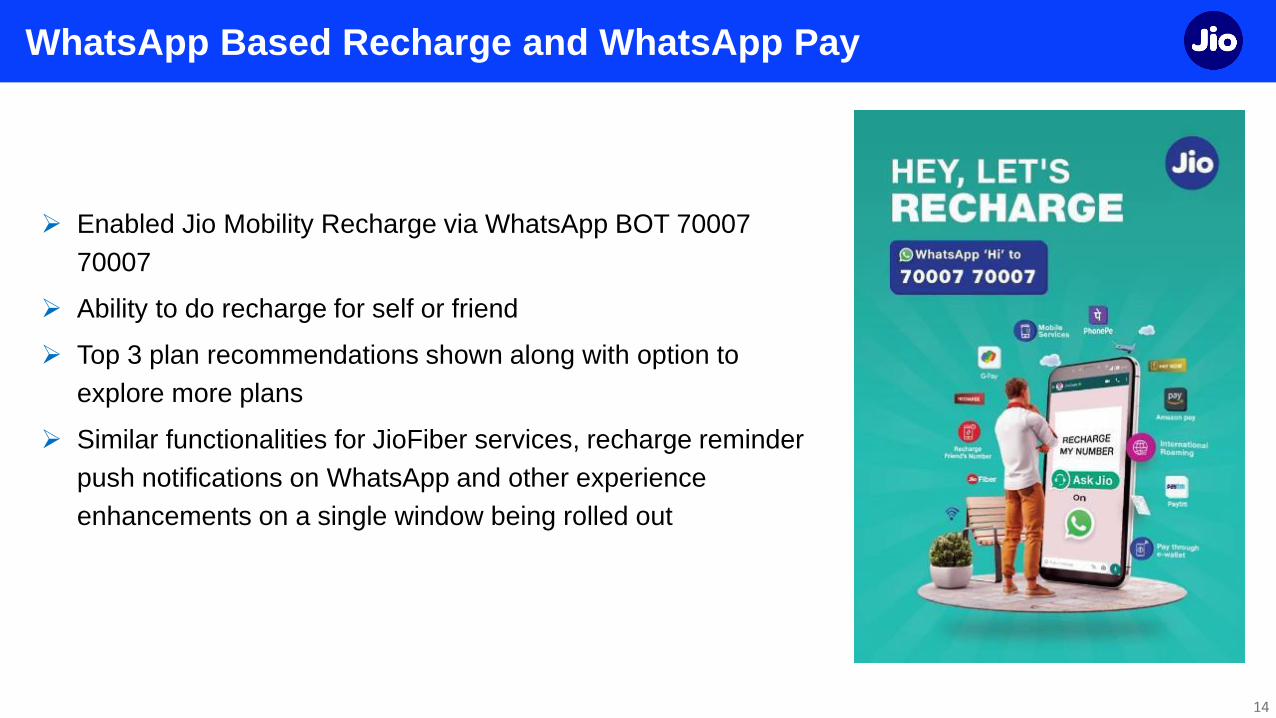
WhatsApp Based Recharge and WhatsApp Pay
➢ Enabled Jio Mobility Recharge via WhatsApp BOT 70007
70007
➢ Ability to do recharge for self or friend
➢ Top 3 plan recommendations shown along with option to
explore more plans
➢ Similar functionalities for JioFiber services, recharge reminder
push notifications on WhatsApp and other experience
enhancements on a single window being rolled out
14
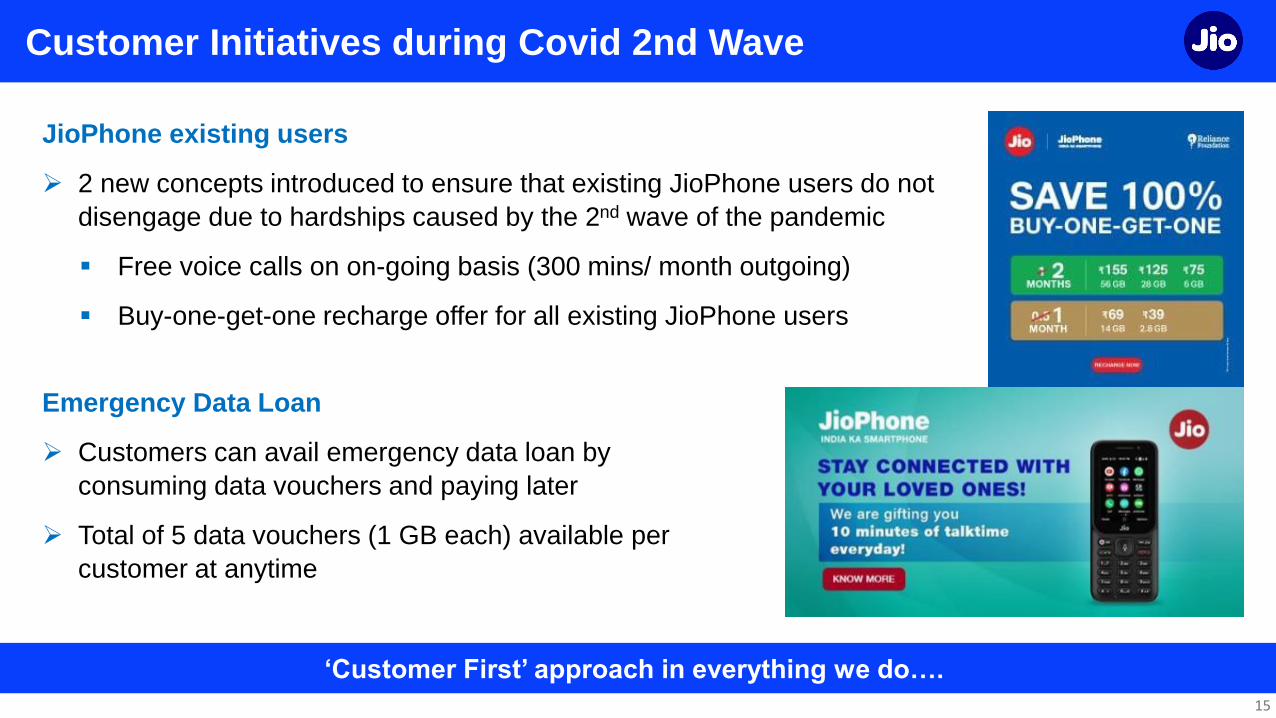
Customer Initiatives during Covid 2nd Wave
15
JioPhone existing users
➢ 2 new concepts introduced to ensure that existing JioPhone users do not
disengage due to hardships caused by the 2nd wave of the pandemic
▪ Free voice calls on on-going basis (300 mins/ month outgoing)
▪ Buy-one-get-one recharge offer for all existing JioPhone users
‘Customer First’ approach in everything we do….
Emergency Data Loan
➢ Customers can avail emergency data loan by
consuming data vouchers and paying later
➢ Total of 5 data vouchers (1 GB each) available per
customer at anytime

Enhancing The Best-In-Class Network
Spectrum footprint supports future needs for 5G
16
➢ Step up in network capacity further enhances customer experience on the world’s best network
▪ Customer experience > 10 Mbps being offered consistently across the network
➢ Recently acquired spectrum is being deployed rapidly
▪ Fully automated network, platform approach and homogeneous network architecture drives
efficiency
➢ Network performance continues to grow stronger with higher per capita data consumption
▪ Jio’s leadership evident across indoor coverage, download speeds and video experience
▪ 26% YoY increase in per capita consumption to 15.6 GB/ month
➢ Spectrum investments have created capacity to onboard the next 200 million customers on
Jio’s network
Jio Leading the March Towards 5G Yukt India
Jio will be the first to launch full fledged 5G services in India
17
➢ Jio 5G is 100% home-grown and comprehensive 5G solution which is fully cloud native,
software defined and digitally managed
➢ Necessary approvals and trial spectrum received for initiating 5G field trials
▪ 100 MHz in 3GPP band n78 allocated by DoT for trials
▪ 5G Standalone Network installed in our data centers across the country
➢ Converged and future-proof architecture would enable Jio's network to quickly and seamlessly
upgrade from 4G to 5G
➢ Creating applications across Healthcare, Education, Entertainment and Retail
▪ Developing 5G enabled ‘connected ambulance’ with Sir H. N. Reliance Foundation Hospital
▪ Interactive AR/ VR content for students and classrooms with Reliance Foundation Schools
Jio Fiber Continues to Build Traction
Very strong traction for JioFiber services across the country
18
➢ Despite on-the-ground challenges, JioFiber now has over 3 million connected homes with
improving momentum in recent months
▪ Each of the connected home has end-to-end fiber connectivity
➢ Infrastructure provisioning has been ramped-up to address strong latent demand for high
quality fiber services across the country
▪ Jio's optical-fiber network is physically present outside more than 12 million premises
➢ Engagement metrics have improved steadily across the customer base
▪ Average home consumes almost 300 GB of data per month and trending upwards
▪ Jio STB has average usage of over 5 hours per day
▪ Number of connected devices at 6 per home

Sustained Momentum In Connectivity Platform
➢ Subscriber addition continues at a healthy pace despite 2nd wave of Covid
➢ Jio remains the preferred broadband connectivity provider with a sharp 38% YoY increase in data traffic
during 1QFY22
Customer Base (million) Data Traffic (Crore GBs)
19
Strong growth in usage across mobility and FTTH
1,469 1,524 1,586 1,668
2,034
Jun-20 Sep-20 Dec-20 Mar-21 Jun-21
398.3 405.6
410.8
426.2
440.6
Jun-20 Sep-20 Dec-20 Mar-21 Jun-21

RJIL – Key Operating Metrics
Data usage shows a sharp increase; customer addition remains stable
20
➢ Healthy gross additions during the
quarter despite challenges on the
ground
▪ Net customer addition at 14.3 million
➢ Data traffic up 38% YoY to over 20
Exabytes during the quarter
➢ Per capita data and voice usage was
strong at 15.6 GB and 818 mins per
month
1Q’ 21-22 4Q’ 20-21 1Q’ 20-21
Total Customer base
(million)440.6 426.2 398.3
Net Customer addition
(million)14.3 15.4 9.9
ARPU
(Rs/ month)138.4 138.2 140.3
Total Data Consumption
(crore GB) 2,034 1,668 1,469
Per Capita Data Consumption
(GB/ month)15.6 13.3 12.4
Voice on Network
(crore mins per day)1,169 1,148 978
Per Capita Voice Consumption
(mins/ month)818 823 754
RJIL – Key Financials
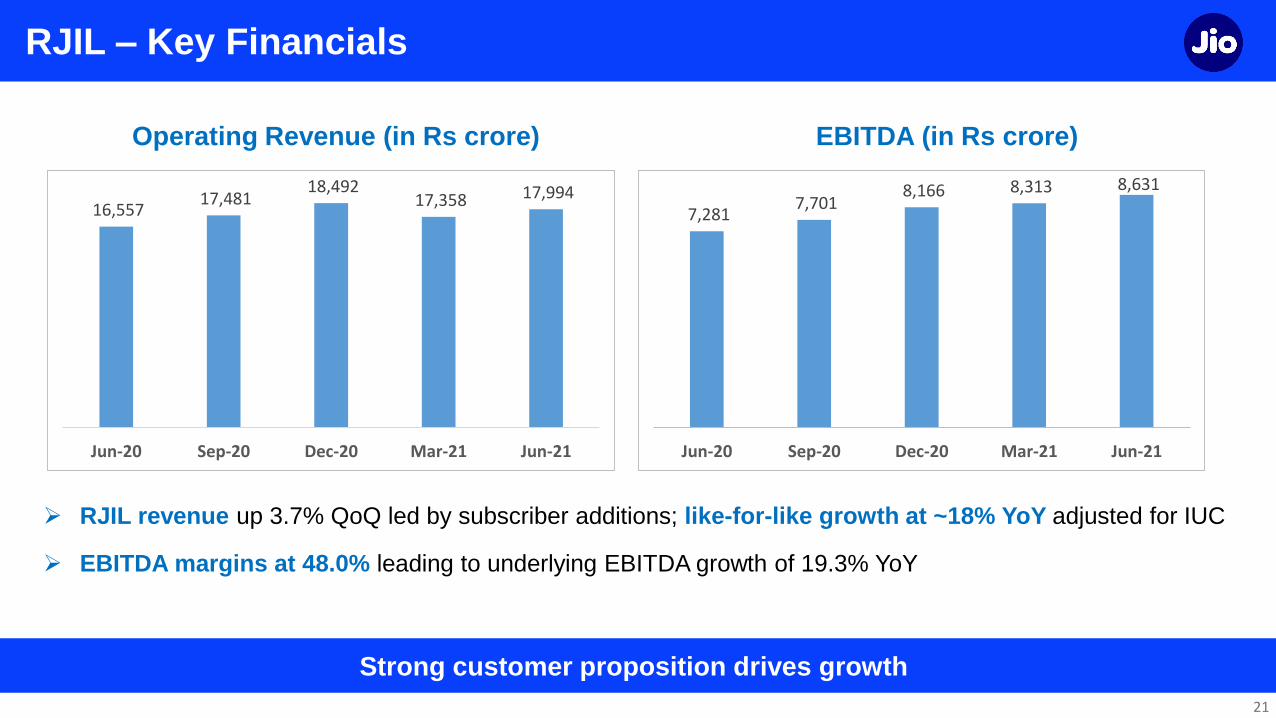
➢ RJIL revenue up 3.7% QoQ led by subscriber additions; like-for-like growth at ~18% YoY adjusted for IUC
➢ EBITDA margins at 48.0% leading to underlying EBITDA growth of 19.3% YoY
Operating Revenue (in Rs crore) EBITDA (in Rs crore)
21
Strong customer proposition drives growth
16,557 17,481
18,492 17,358 17,994
Jun-20 Sep-20 Dec-20 Mar-21 Jun-21
7,281 7,701
8,166 8,313 8,631
Jun-20 Sep-20 Dec-20 Mar-21 Jun-21
Jio Platforms Limited - Key Financials
Growth driven by connectivity platform
22
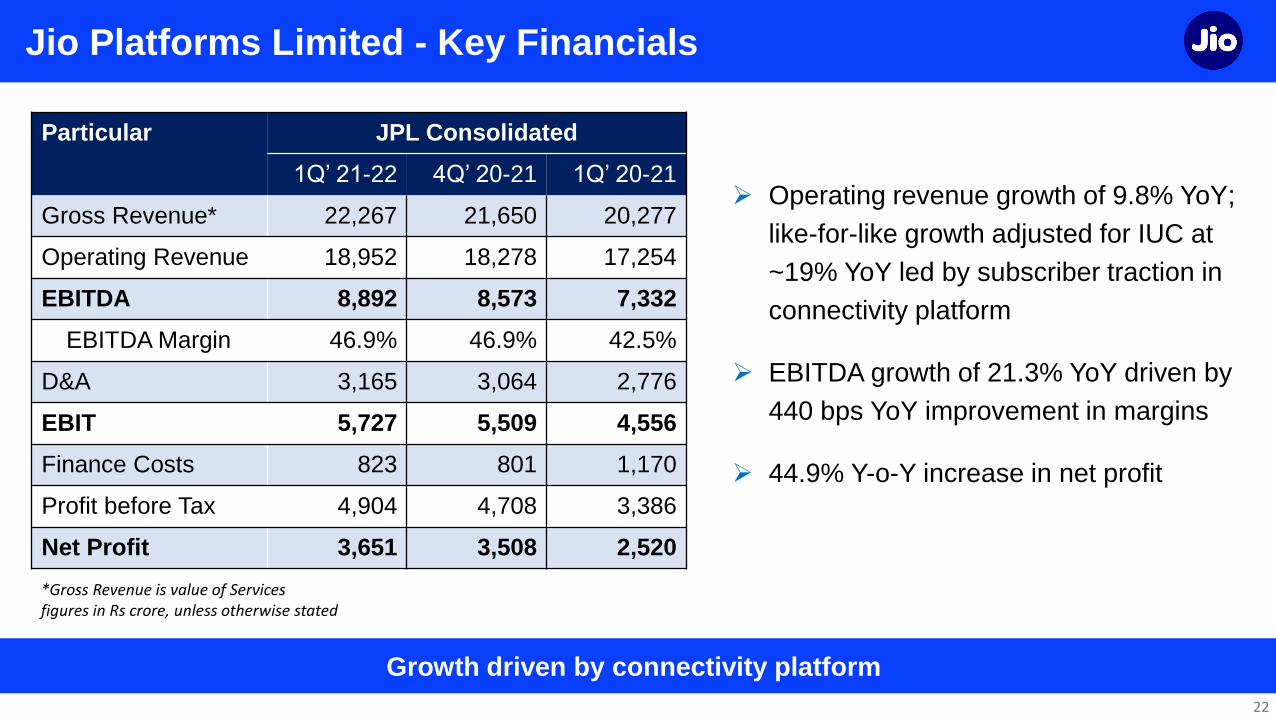
➢ Operating revenue growth of 9.8% YoY;
like-for-like growth adjusted for IUC at
~19% YoY led by subscriber traction in
connectivity platform
➢ EBITDA growth of 21.3% YoY driven by
440 bps YoY improvement in margins
➢ 44.9% Y-o-Y increase in net profit
*Gross Revenue is value of Servicesfigures in Rs crore, unless otherwise stated
Particular JPL Consolidated
1Q’ 21-22 4Q’ 20-21 1Q’ 20-21
Gross Revenue* 22,267 21,650 20,277
Operating Revenue 18,952 18,278 17,254
EBITDA 8,892 8,573 7,332
EBITDA Margin 46.9% 46.9% 42.5%
D&A 3,165 3,064 2,776
EBIT 5,727 5,509 4,556
Finance Costs 823 801 1,170
Profit before Tax 4,904 4,708 3,386
Net Profit 3,651 3,508 2,520

Long Term Opportunity Intact and Reinforced
23
➢ Covid and related economic disruptions have delayed execution
▪ Challenges in ramp-up of customer additions for Homes & Enterprises
▪ Delay in incremental monetization of Connectivity and Digital platforms
➢ Long and significant runway for growth in Mobility business
▪ Network capacity and Device strategy in place for next 200 million Jio customers
▪ Jio’s 5G rollout to usher the next phase of digital revolution in India
➢ Overall demand remains intact
▪ Need for high quality fixed broadband evident from inbound queries
▪ Accelerated adoption of digital platforms across Commerce, Education, Entertainment and
Healthcare
▪ Jio’s mobility coverage and network experience continues to drive market share gains
Robust business model for sustainable growth

24
Reliance Retail

25
Challenging Operating Context, Though Improving
➢ Significant restrictions particularly in latter April and May; signs of easing in June
▪ Business (incl. digital commerce) confined to essential items for the most part
▪ Seamless logistics impacted due to constraints
➢ 26% stores fully open, 35% partially (Grocery 71%; Non-Grocery 29%)
➢ Operating store hours were at 70%, 25% & 38% for April, May and June
respectively
➢ Footfalls drop to 46% (4Q FY21: 88%) of pre-COVID levels
➢ Consumer sentiment while cautious, reviving over time
Situation still uncertain
50%
85%96% 94%
61%
43%
75% 75%
88%
46%
Q1 FY21 Q2 FY21 Q3 FY21 Q4 FY21 1Q FY22
Operational Stores (Full + Partial)
Footfalls (% Pre-Covid)
% Store Operational Days & Footfalls
26
1Q FY22: Key Messages
1. Decisive actions taken to secure people and operations; >99% of retail team vaccinated across the country
2. Significant up-tick of revenues at +32% YoY1; Grocery resilient; step up across all other consumption baskets
3. EBITDA at ~Rs. 2,000 Cr, up 80%, buoyed by Fashion & Lifestyle, Consumer Electronics, investment income
4. Expansion thrust continues – 123 new stores opened in the quarter; 700+ stores fit out ready
5. Continued scaling up of digital commerce and merchant partnerships
Securing people and operations, a foremost priority in quarter1. Revenue growth excluding Petro Retail
27
Revenue
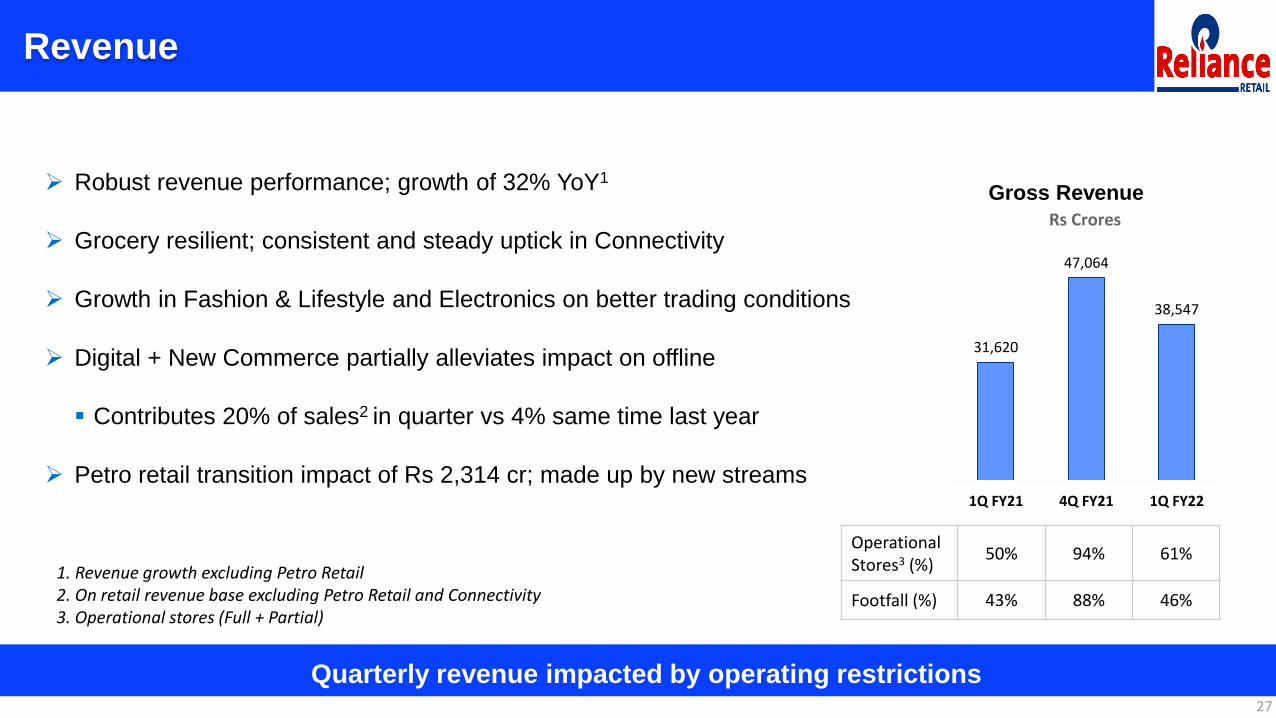
➢ Robust revenue performance; growth of 32% YoY1
➢ Grocery resilient; consistent and steady uptick in Connectivity
➢ Growth in Fashion & Lifestyle and Electronics on better trading conditions
➢ Digital + New Commerce partially alleviates impact on offline
▪ Contributes 20% of sales2 in quarter vs 4% same time last year
➢ Petro retail transition impact of Rs 2,314 cr; made up by new streams
Quarterly revenue impacted by operating restrictions
31,620
47,064
38,547
1Q FY21 4Q FY21 1Q FY22
Gross Revenue
Rs Crores
1. Revenue growth excluding Petro Retail2. On retail revenue base excluding Petro Retail and Connectivity3. Operational stores (Full + Partial)
OperationalStores3 (%)
50% 94% 61%
Footfall (%) 43% 88% 46%

28
Profit
➢ EBITDA at ~Rs. 2,000 crore, up 80% YoY
▪ Fashion & Lifestyle and Electronics grow faster on better trading
conditions
▪ Focus on managing fixed and discretionary costs sustained
▪ Boost from higher investment income
Healthy EBITDA delivery in a tough context where revenue was constrained
1,079
3,617
1,941
1Q FY21 4Q FY21 1Q FY22
Total EBITDA
Rs Crores
29
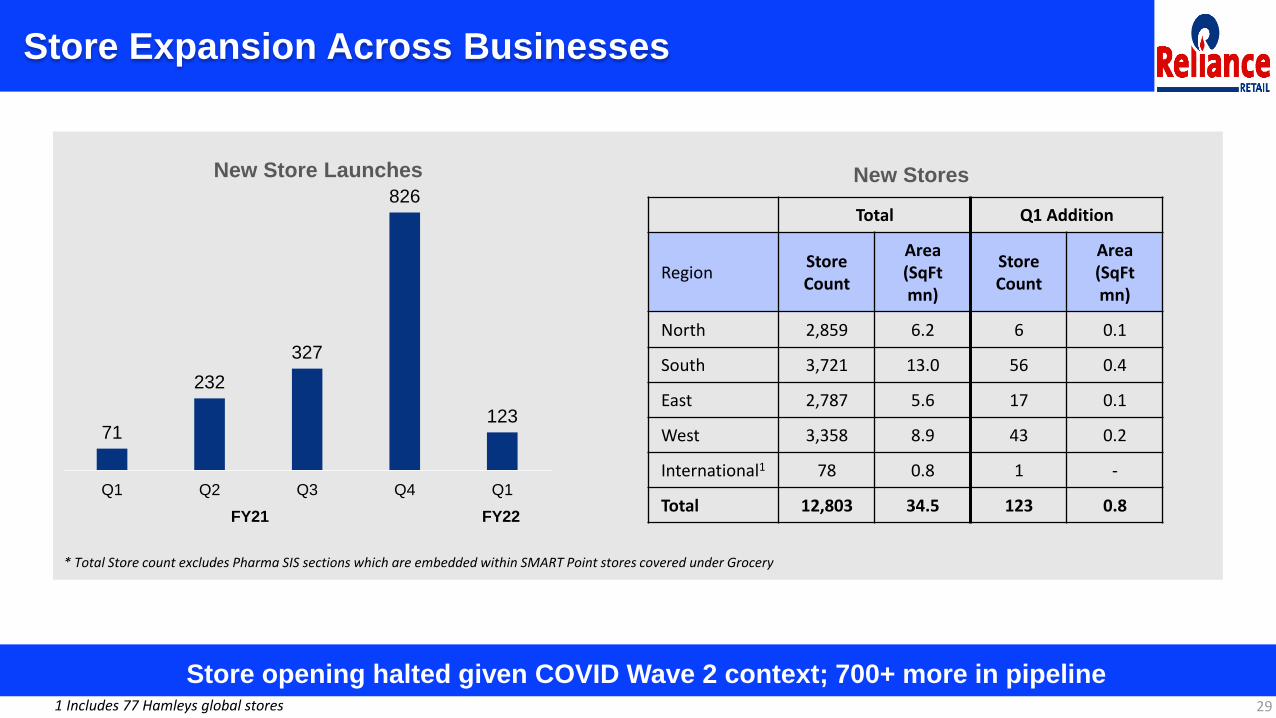
Store Expansion Across Businesses
Store opening halted given COVID Wave 2 context; 700+ more in pipeline
71
232
327
826
123
Q1 Q2 Q3 Q4 Q1
New Store Launches New Stores
* Total Store count excludes Pharma SIS sections which are embedded within SMART Point stores covered under Grocery
1 Includes 77 Hamleys global stores
Total Q1 Addition
RegionStore Count
Area (SqFtmn)
Store Count
Area (SqFtmn)
North 2,859 6.2 6 0.1
South 3,721 13.0 56 0.4
East 2,787 5.6 17 0.1
West 3,358 8.9 43 0.2
International1 78 0.8 1 -
Total 12,803 34.5 123 0.8FY21 FY22
30
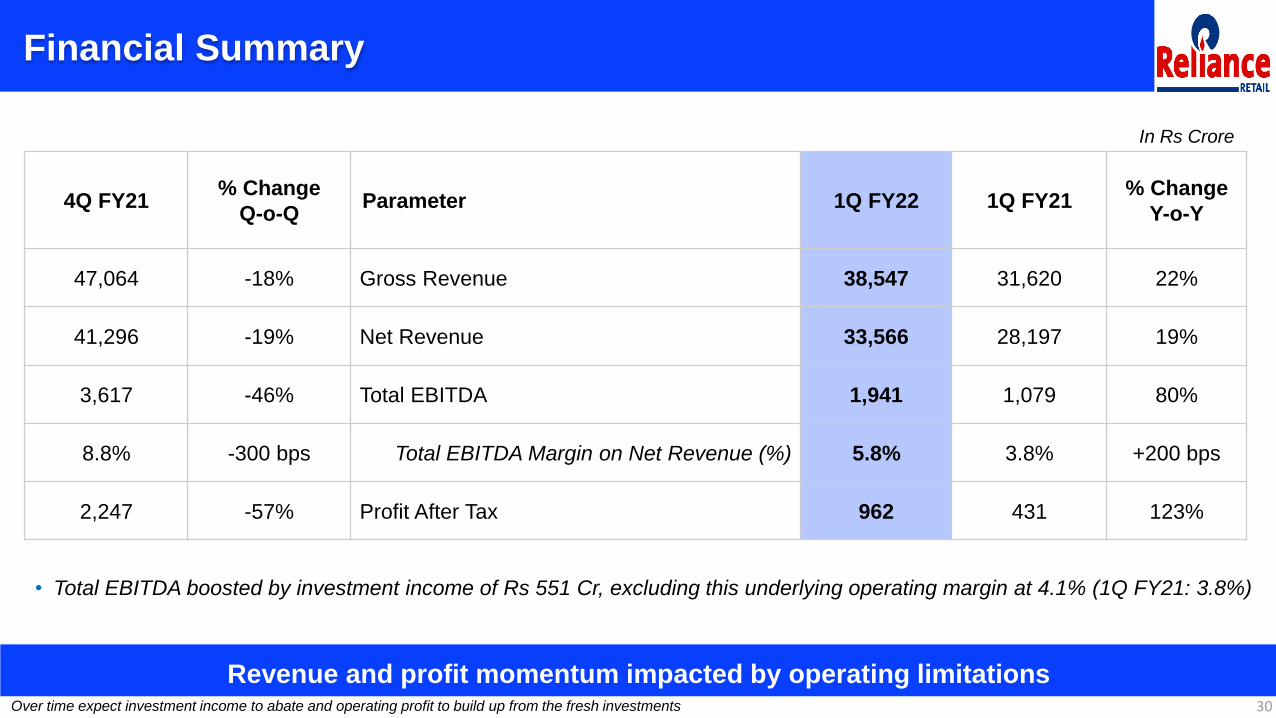
Financial Summary
Revenue and profit momentum impacted by operating limitations
In Rs Crore
4Q FY21% Change
Q-o-QParameter 1Q FY22 1Q FY21
% Change
Y-o-Y
47,064 -18% Gross Revenue 38,547 31,620 22%
41,296 -19% Net Revenue 33,566 28,197 19%
3,617 -46% Total EBITDA 1,941 1,079 80%
8.8% -300 bps Total EBITDA Margin on Net Revenue (%) 5.8% 3.8% +200 bps
2,247 -57% Profit After Tax 962 431 123%
• Total EBITDA boosted by investment income of Rs 551 Cr, excluding this underlying operating margin at 4.1% (1Q FY21: 3.8%)
Over time expect investment income to abate and operating profit to build up from the fresh investments

31
Performance Highlights – Consumer Electronics
Bolstered Digital Commerce & maximized extraction from operational stores
➢ Revenue up 1.8X YoY; highest ever quarterly sales from reliancedigital.in
➢ Lower footfalls in the quarter partly offset by higher conversions and larger
ticket sizes
➢ Omnichannel promotions, financing tie-ups, exchange offers and new
launches boost sales
➢ Broad based double-digit growth across categories; good early execution on
air care
➢ Own brands business scaled up; Counters +20% QoQ; BPL, Kelvinator
portfolio extended
32
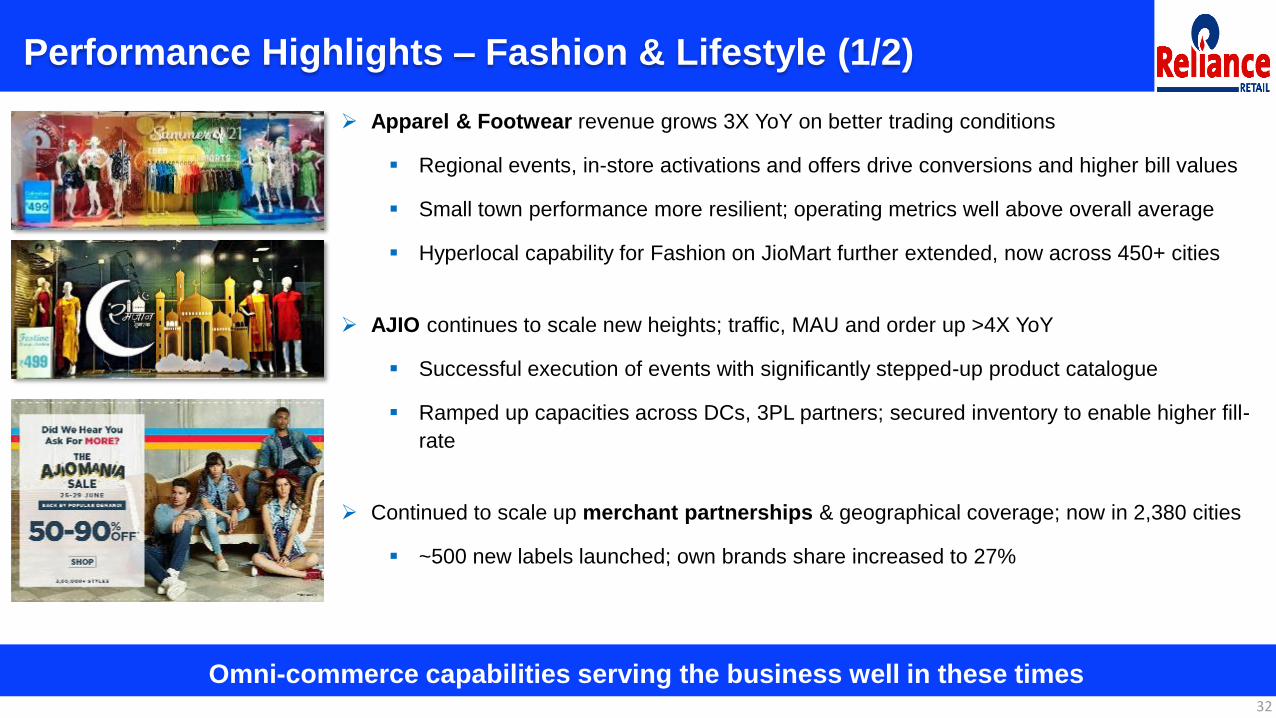
Performance Highlights – Fashion & Lifestyle (1/2)
Omni-commerce capabilities serving the business well in these times
➢ Apparel & Footwear revenue grows 3X YoY on better trading conditions
▪ Regional events, in-store activations and offers drive conversions and higher bill values
▪ Small town performance more resilient; operating metrics well above overall average
▪ Hyperlocal capability for Fashion on JioMart further extended, now across 450+ cities
➢ AJIO continues to scale new heights; traffic, MAU and order up >4X YoY
▪ Successful execution of events with significantly stepped-up product catalogue
▪ Ramped up capacities across DCs, 3PL partners; secured inventory to enable higher fill-
rate
➢ Continued to scale up merchant partnerships & geographical coverage; now in 2,380 cities
▪ ~500 new labels launched; own brands share increased to 27%
33
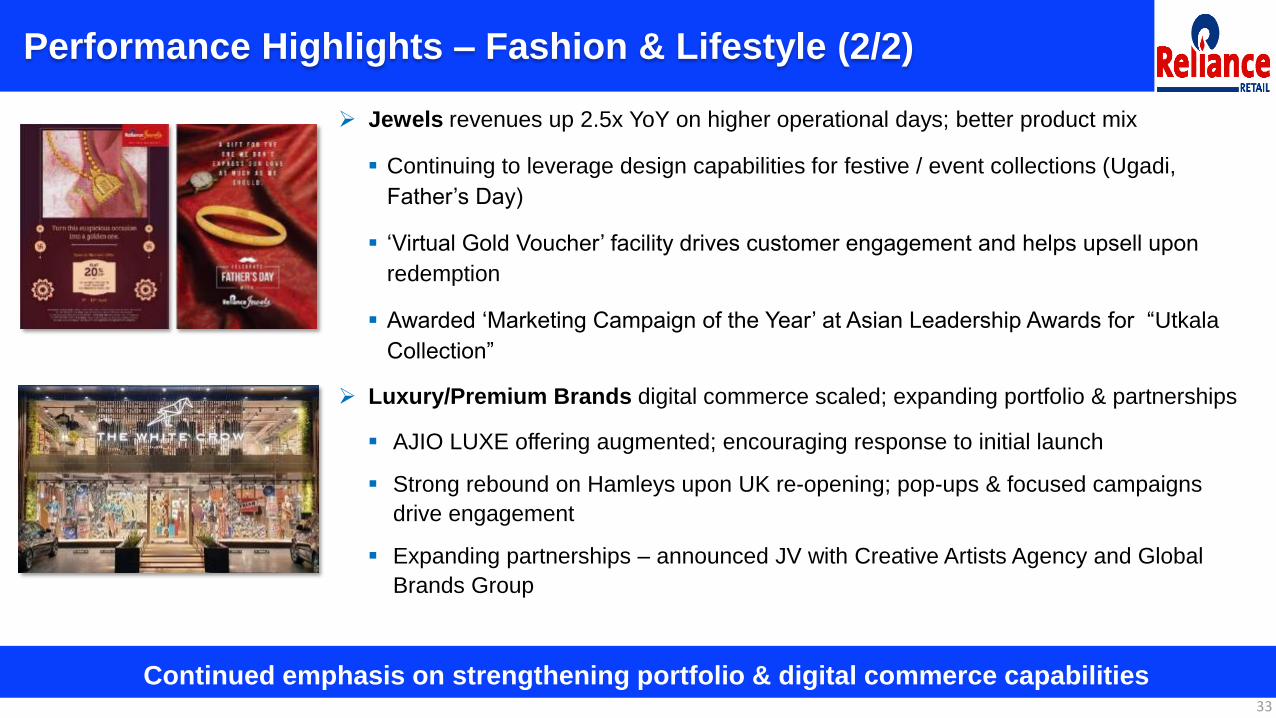
Performance Highlights – Fashion & Lifestyle (2/2)
Continued emphasis on strengthening portfolio & digital commerce capabilities
➢ Jewels revenues up 2.5x YoY on higher operational days; better product mix
▪ Continuing to leverage design capabilities for festive / event collections (Ugadi,
Father’s Day)
▪ ‘Virtual Gold Voucher’ facility drives customer engagement and helps upsell upon
redemption
▪ Awarded ‘Marketing Campaign of the Year’ at Asian Leadership Awards for “Utkala
Collection”
➢ Luxury/Premium Brands digital commerce scaled; expanding portfolio & partnerships
▪ AJIO LUXE offering augmented; encouraging response to initial launch
▪ Strong rebound on Hamleys upon UK re-opening; pop-ups & focused campaigns
drive engagement
▪ Expanding partnerships – announced JV with Creative Artists Agency and Global
Brands Group
34
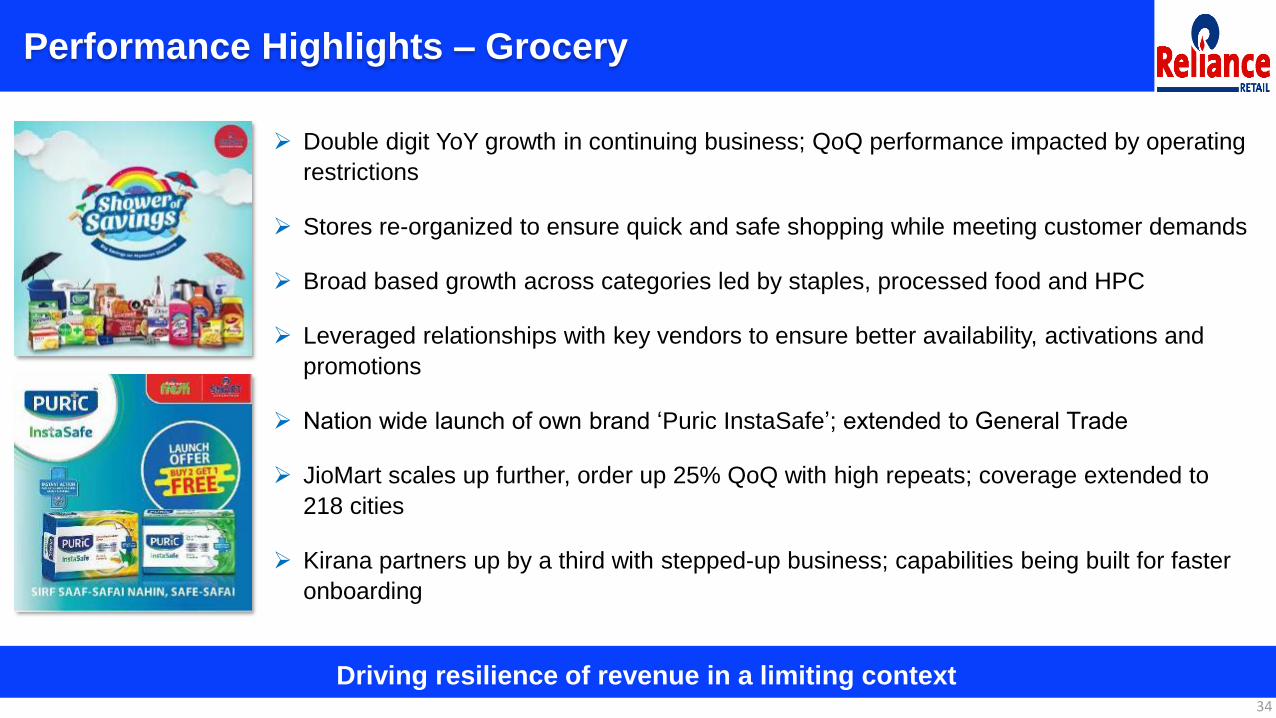
Performance Highlights – Grocery
Driving resilience of revenue in a limiting context
➢ Double digit YoY growth in continuing business; QoQ performance impacted by operating
restrictions
➢ Stores re-organized to ensure quick and safe shopping while meeting customer demands
➢ Broad based growth across categories led by staples, processed food and HPC
➢ Leveraged relationships with key vendors to ensure better availability, activations and
promotions
➢ Nation wide launch of own brand ‘Puric InstaSafe’; extended to General Trade
➢ JioMart scales up further, order up 25% QoQ with high repeats; coverage extended to
218 cities
➢ Kirana partners up by a third with stepped-up business; capabilities being built for faster
onboarding

35
Looking Ahead
Vaccinating employee / family / partners and securing operations a foremost priority
1. Accelerate new store opening
2. Scale up Digital Commerce; expand category play on JioMart
3. Grow New Commerce merchant partnerships across businesses and geographies
4. Launch/scale up new businesses – JioMart Digital, Subscription, Marketplace, Beauty, Urban Ladder, Zivame
5. Expand design centres, develop vendor ecosystem and fast track supply chain infrastructure augmentation
6. Complete Just Dial acquisition and initiate actions on business plans
Funnel of initiatives in progress on expansion and activation

36
Oil & Gas

Oil & Gas Segment – Key Highlights
37
Flawless commissioning and ramp-up of 2 ultra-deepwater fields despite Covid constraints
➢ Significant turnaround in Oil & Gas business with start-up of new production system in KG D6
➢ 1Q FY22 domestic production (RIL share) at 35.83 BCFE, almost at par with FY20 levels
➢ Revenue at 10-quarter high; EBITDA at 22-quarter high
➢ Commenced production from Satellite cluster in Apr’21, ahead of plan (R-Cluster was commissioned in Dec’20)
▪ Achieved aggregate production of >18 MMSCMD, ahead of plan
➢ 3 rounds of bidding completed for KG D6 gas – successfully contracted 18 MMSCMD of gas in domestic market
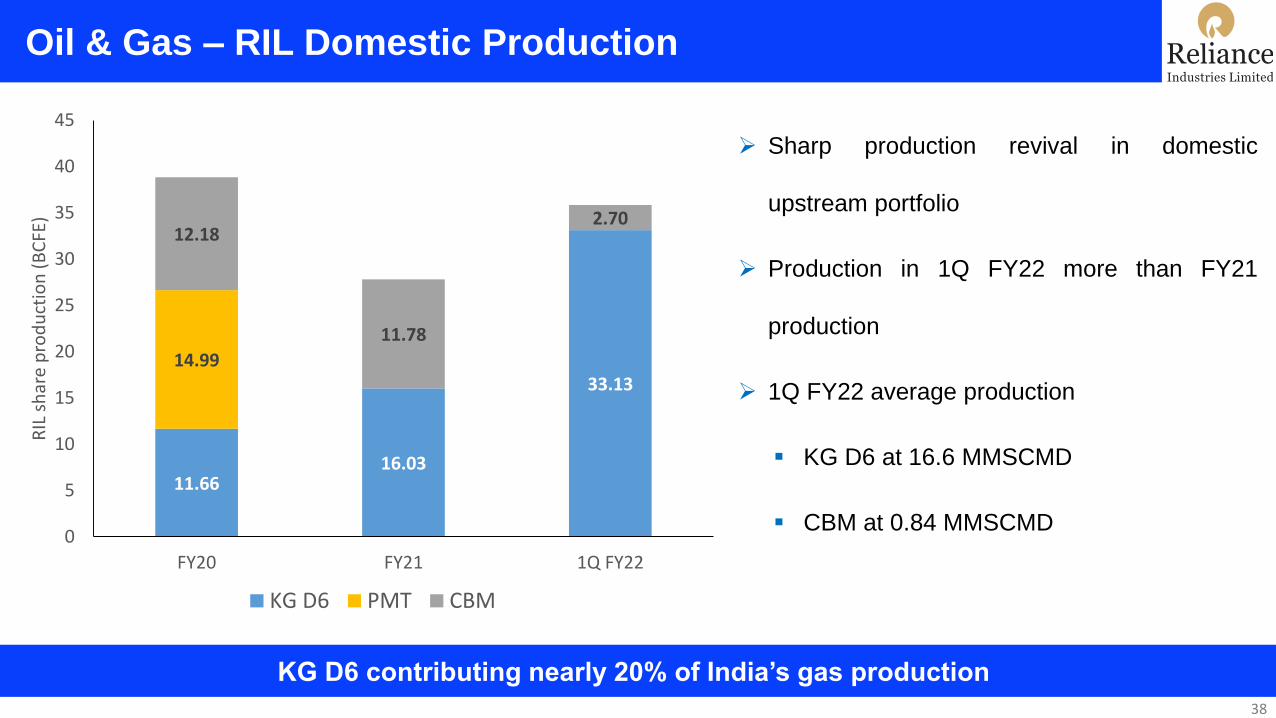
Oil & Gas – RIL Domestic Production
38
KG D6 contributing nearly 20% of India’s gas production
➢ Sharp production revival in domestic
upstream portfolio
➢ Production in 1Q FY22 more than FY21
production
➢ 1Q FY22 average production
▪ KG D6 at 16.6 MMSCMD
▪ CBM at 0.84 MMSCMD
11.6616.03
33.1314.99
12.18
11.78
2.70
0
5
10
15
20
25
30
35
40
45
FY20 FY21 1Q FY22
RIL
sh
are
pro
du
ctio
n (
BC
FE)
KG D6 PMT CBM
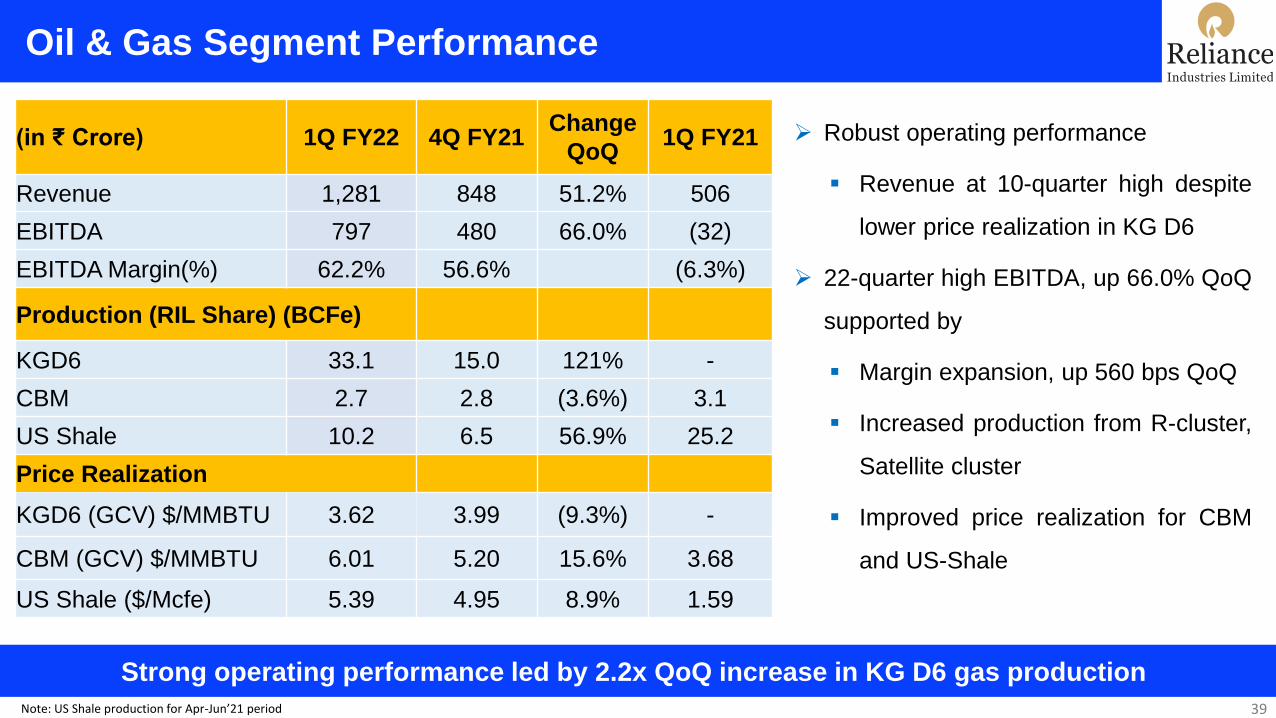
Oil & Gas Segment Performance
39
Strong operating performance led by 2.2x QoQ increase in KG D6 gas production
(in ₹ Crore) 1Q FY22 4Q FY21Change
QoQ1Q FY21
Revenue 1,281 848 51.2% 506
EBITDA 797 480 66.0% (32)
EBITDA Margin(%) 62.2% 56.6% (6.3%)
Production (RIL Share) (BCFe)
KGD6 33.1 15.0 121% -
CBM 2.7 2.8 (3.6%) 3.1
US Shale 10.2 6.5 56.9% 25.2
Price Realization
KGD6 (GCV) $/MMBTU 3.62 3.99 (9.3%) -
CBM (GCV) $/MMBTU 6.01 5.20 15.6% 3.68
US Shale ($/Mcfe) 5.39 4.95 8.9% 1.59
➢ Robust operating performance
▪ Revenue at 10-quarter high despite
lower price realization in KG D6
➢ 22-quarter high EBITDA, up 66.0% QoQ
supported by
▪ Margin expansion, up 560 bps QoQ
▪ Increased production from R-cluster,
Satellite cluster
▪ Improved price realization for CBM
and US-Shale
Note: US Shale production for Apr-Jun’21 period
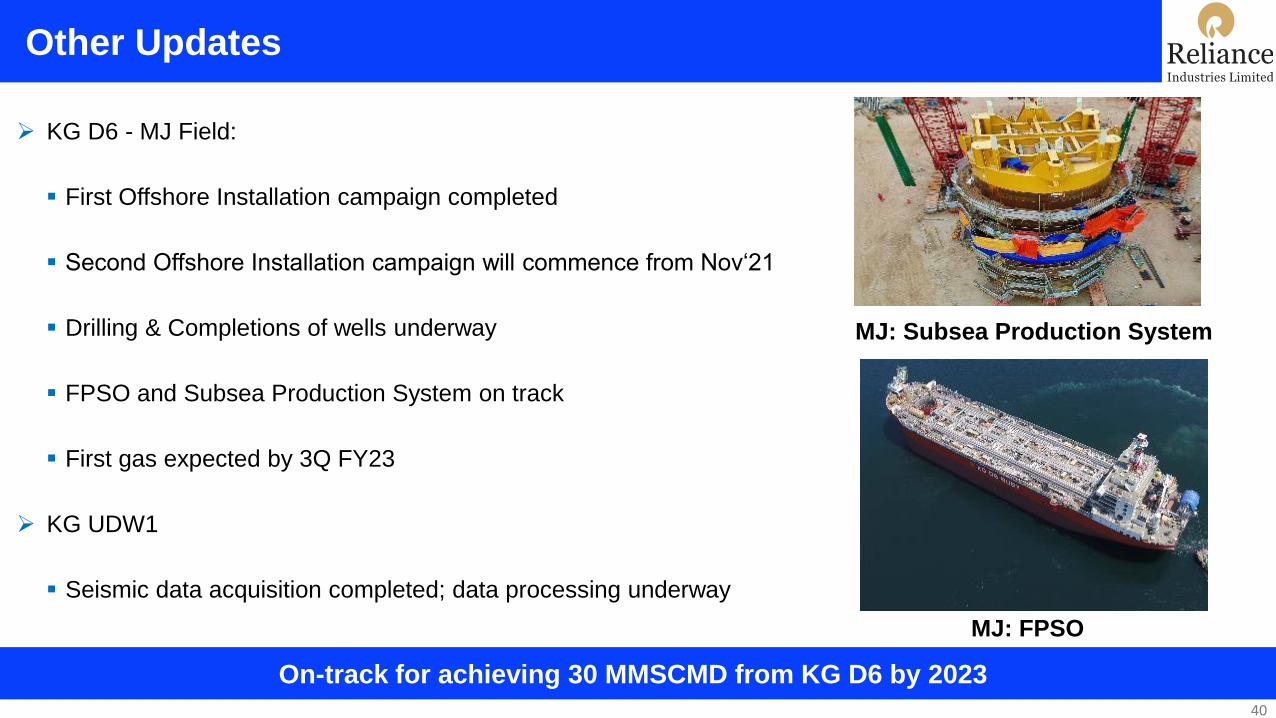
Other Updates
40
MJ: Subsea Production System
➢ KG D6 - MJ Field:
▪ First Offshore Installation campaign completed
▪ Second Offshore Installation campaign will commence from Nov‘21
▪ Drilling & Completions of wells underway
▪ FPSO and Subsea Production System on track
▪ First gas expected by 3Q FY23
➢ KG UDW1
▪ Seismic data acquisition completed; data processing underway
MJ: FPSO
On-track for achieving 30 MMSCMD from KG D6 by 2023
41
Oil to Chemicals (O2C)

Business Environment - 1Q FY22 (1/2)
42
O2C chain benefiting from continuing demand revival and increased mobility
Demand Environment:
➢ Rising consumer sentiment, global vaccination drive and supportive monetary policy aiding demand growth
▪ Global oil demand rose by 1.2 mb/d QoQ to 94.7 mb/d on steady demand growth in the West and China
▪ Healthy global demand growth for Polymers and Polyesters on the back of economic revival in US and Europe
➢ Global mobility levels in June at 88% of pre-pandemic level vs. 60% at beginning of the year
➢ QoQ domestic demand impacted by second-wave led lockdowns, strong YoY recovery on low base
▪ Oil product demand at 48.5 MMT, up 18.8% YoY
▪ Polymer demand up 28% YoY; Polyester demand up 203% YoY
Operating Rates:
➢ Global cracker operating rates remained healthy at 82% during 1QFY22 (vs. 81% in previous quarter)
➢ Global refinery operating rates at 76% vs. 74% in previous quarter
Source: Research Reports
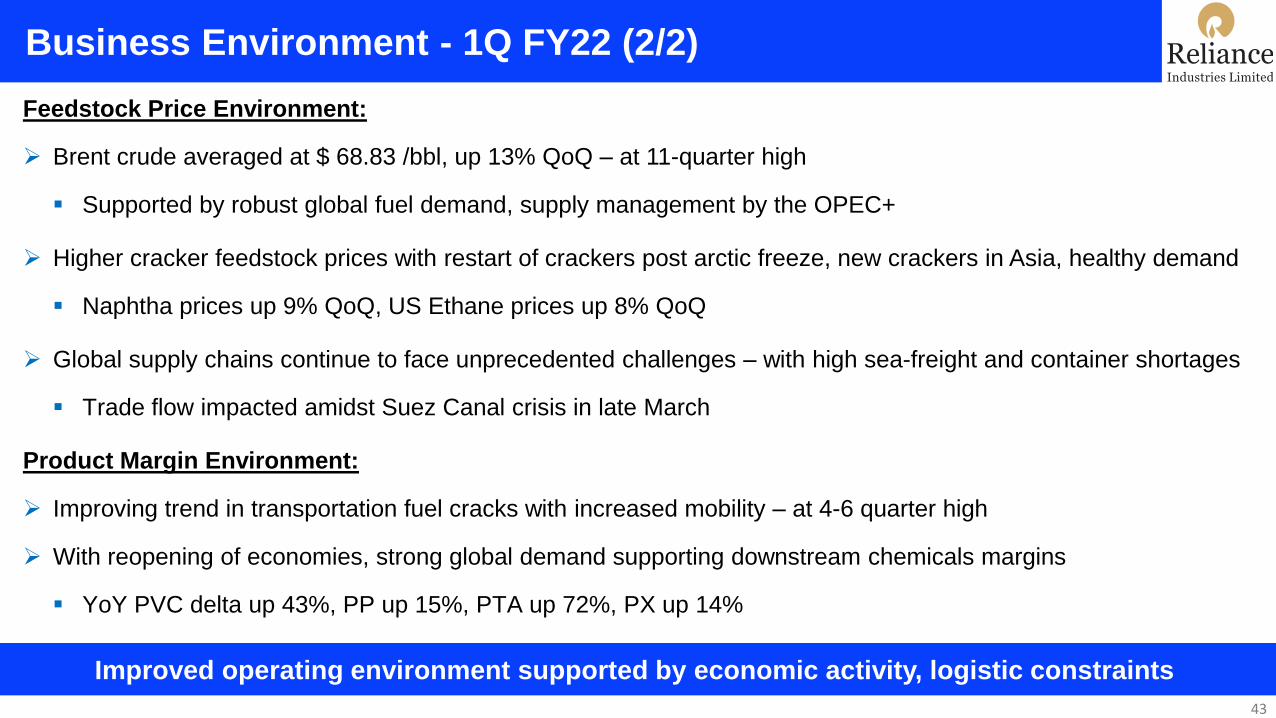
Business Environment - 1Q FY22 (2/2)
Improved operating environment supported by economic activity, logistic constraints
43
Feedstock Price Environment:
➢ Brent crude averaged at $ 68.83 /bbl, up 13% QoQ – at 11-quarter high
▪ Supported by robust global fuel demand, supply management by the OPEC+
➢ Higher cracker feedstock prices with restart of crackers post arctic freeze, new crackers in Asia, healthy demand
▪ Naphtha prices up 9% QoQ, US Ethane prices up 8% QoQ
➢ Global supply chains continue to face unprecedented challenges – with high sea-freight and container shortages
▪ Trade flow impacted amidst Suez Canal crisis in late March
Product Margin Environment:
➢ Improving trend in transportation fuel cracks with increased mobility – at 4-6 quarter high
➢ With reopening of economies, strong global demand supporting downstream chemicals margins
▪ YoY PVC delta up 43%, PP up 15%, PTA up 72%, PX up 14%
Business Environment – Polymers
44
Strong consumption momentum to sustain demand growth
0
100
200
300
400
500
600
700
800
0%
20%
40%
60%
80%
100%
120%
140%
4QFY20 1QFY21 4QFY21 1QFY22 2QFY22E
De
lta
(U
S$
/MT
)
Ind
ex
ed
Do
me
sti
c D
em
an
d
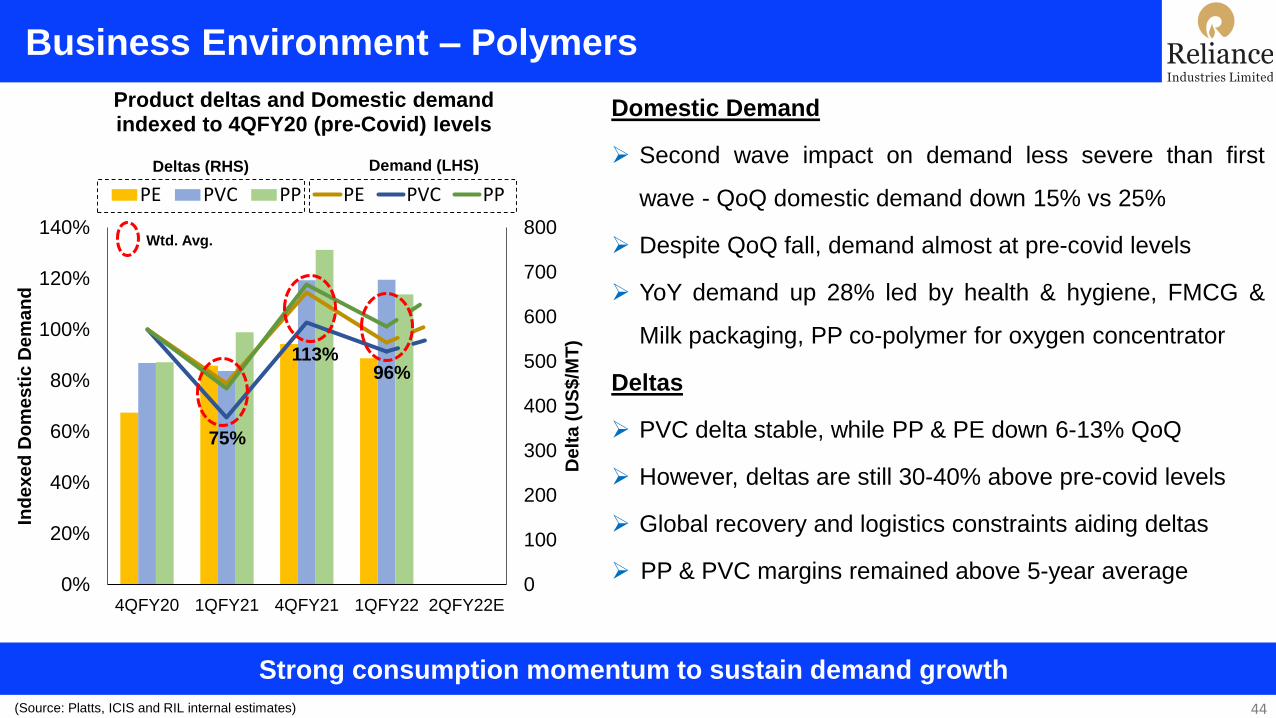
Product deltas and Domestic demand indexed to 4QFY20 (pre-Covid) levels
PE PVC PP PE PVC PP
Domestic Demand
➢ Second wave impact on demand less severe than first
wave - QoQ domestic demand down 15% vs 25%
➢ Despite QoQ fall, demand almost at pre-covid levels
➢ YoY demand up 28% led by health & hygiene, FMCG &
Milk packaging, PP co-polymer for oxygen concentrator
Deltas
➢ PVC delta stable, while PP & PE down 6-13% QoQ
➢ However, deltas are still 30-40% above pre-covid levels
➢ Global recovery and logistics constraints aiding deltas
➢ PP & PVC margins remained above 5-year average
(Source: Platts, ICIS and RIL internal estimates)
Deltas (RHS) Demand (LHS)
75%
96%113%
Wtd. Avg.
Business Environment – Polyesters
45
Chain margins supported by demand revival despite high feedstock prices
530 540
612 622
0
100
200
300
400
500
600
700
0%
20%
40%
60%
80%
100%
120%
140%
4QFY20 1QFY21 4QFY21 1QFY22 2QFY22ED
elt
as
(U
S$/M
T)
Ind
ex
ed
Do
me
sti
c D
em
an
d
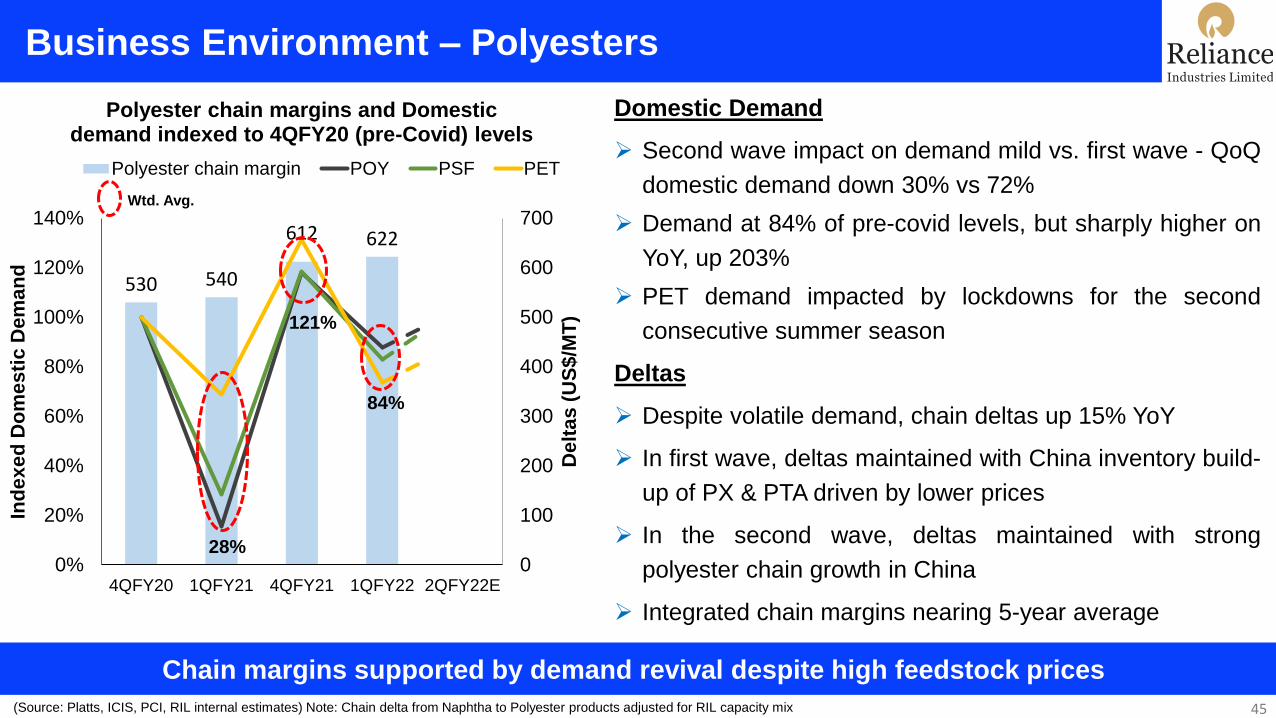
Polyester chain margins and Domestic demand indexed to 4QFY20 (pre-Covid) levels
Polyester chain margin POY PSF PET
Domestic Demand
➢ Second wave impact on demand mild vs. first wave - QoQ
domestic demand down 30% vs 72%
➢ Demand at 84% of pre-covid levels, but sharply higher on
YoY, up 203%
➢ PET demand impacted by lockdowns for the second
consecutive summer season
Deltas
➢ Despite volatile demand, chain deltas up 15% YoY
➢ In first wave, deltas maintained with China inventory build-
up of PX & PTA driven by lower prices
➢ In the second wave, deltas maintained with strong
polyester chain growth in China
➢ Integrated chain margins nearing 5-year average
(Source: Platts, ICIS, PCI, RIL internal estimates) Note: Chain delta from Naphtha to Polyester products adjusted for RIL capacity mix
28%
121%
84%
Wtd. Avg.
Global Mobility & Fuel Demand Trend
46
Economies reopening support demand growth despite high oil prices; Jet demand recovery crucial
(Source: Research Report, Energy Aspects, Platts)
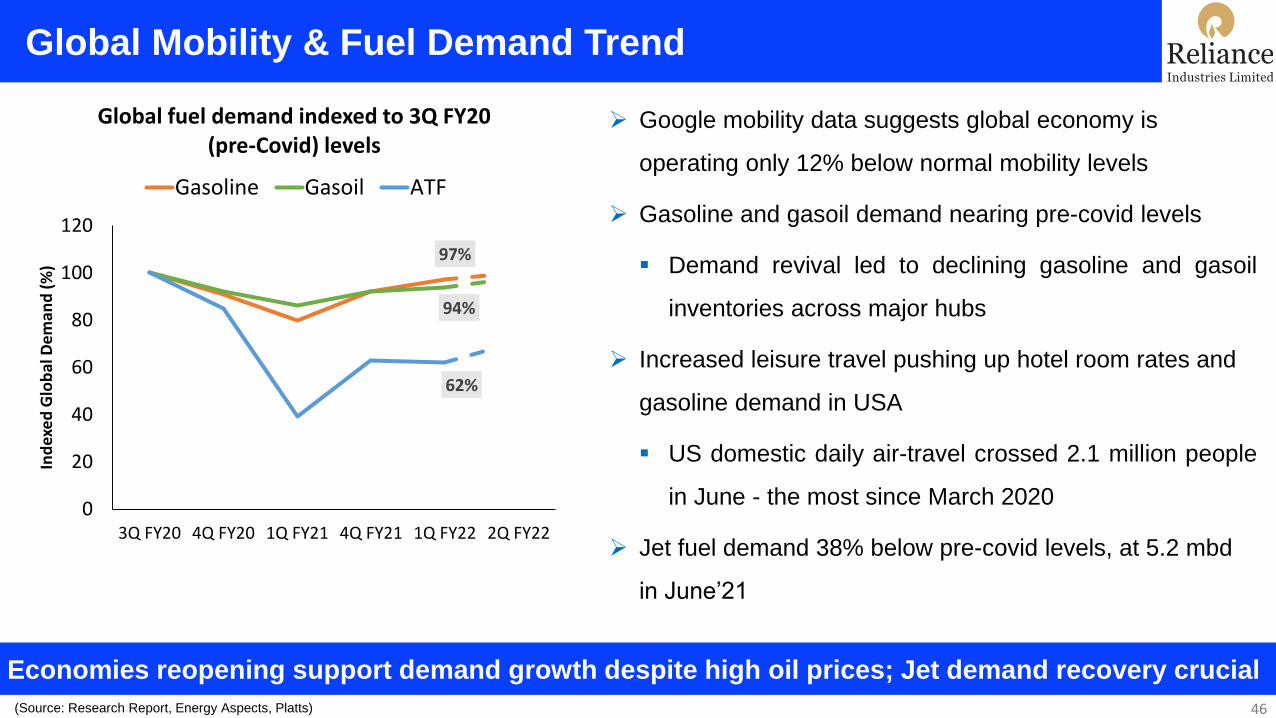
➢ Google mobility data suggests global economy is
operating only 12% below normal mobility levels
➢ Gasoline and gasoil demand nearing pre-covid levels
▪ Demand revival led to declining gasoline and gasoil
inventories across major hubs
➢ Increased leisure travel pushing up hotel room rates and
gasoline demand in USA
▪ US domestic daily air-travel crossed 2.1 million people
in June - the most since March 2020
➢ Jet fuel demand 38% below pre-covid levels, at 5.2 mbd
in June’21
97%
94%
62%
0
20
40
60
80
100
120
3Q FY20 4Q FY20 1Q FY21 4Q FY21 1Q FY22 2Q FY22
Ind
exe
d G
lob
al D
em
and
(%
)
Global fuel demand indexed to 3Q FY20 (pre-Covid) levels
Gasoline Gasoil ATF
Cracks Improving with Increased Mobility Demand
Global mobility surges back to near normal, led by USA and Europe
47Source: Research Reports & Google Mobility Report (avg of retail/recreation, workplace and transit stations)
-2
3
8
13
18
23
02/20 04/20 06/20 08/20 10/20 12/20 02/21 04/21 06/21
US
$/b
bl
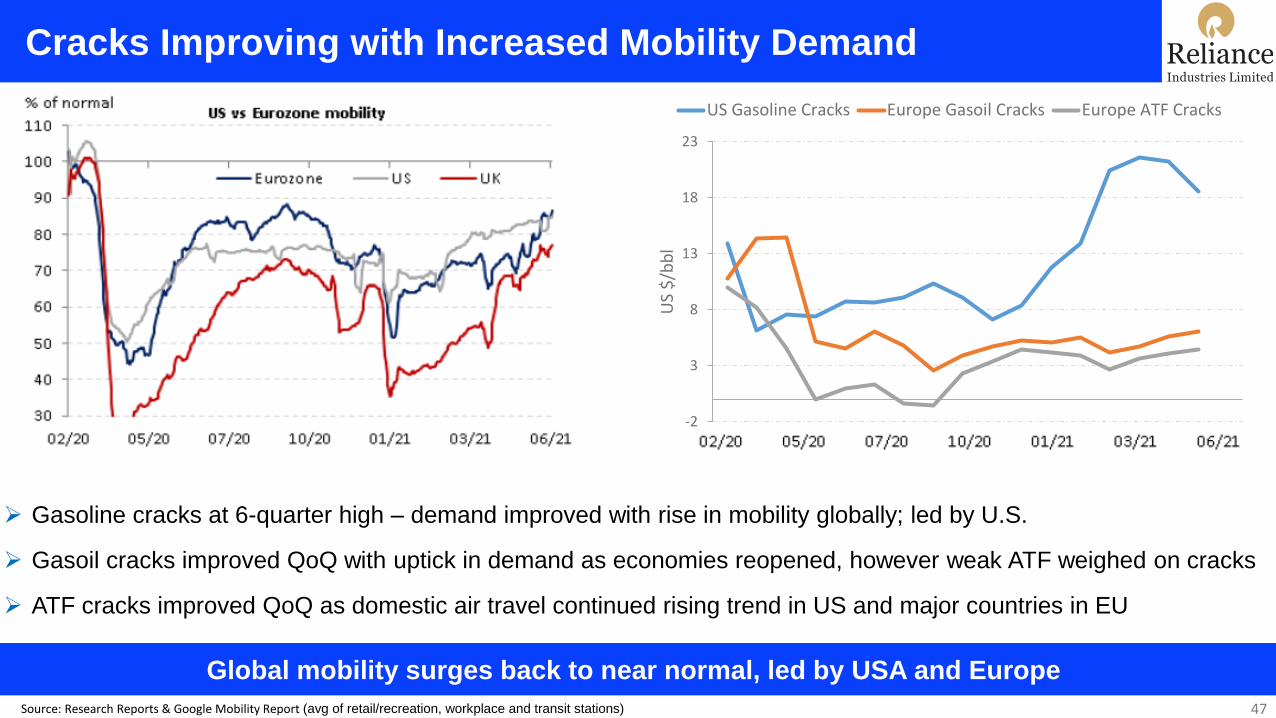
US Gasoline Cracks Europe Gasoil Cracks Europe ATF Cracks
➢ Gasoline cracks at 6-quarter high – demand improved with rise in mobility globally; led by U.S.
➢ Gasoil cracks improved QoQ with uptick in demand as economies reopened, however weak ATF weighed on cracks
➢ ATF cracks improved QoQ as domestic air travel continued rising trend in US and major countries in EU

O2C – 1Q FY22 – Performance Highlights
O2C continues to deliver strong performance despite weak domestic markets
48
➢Robust QoQ performance – EBITDA margins up 60 bps
➢Margin expansion across key products on the back of
strong global demand and reopening of economies
▪ Recovery in transportation fuel cracks
▪ Healthy QoQ improvement in downstream deltas –
PX up 25%, PET up 18%, POY up 20%
▪ Feedstock flexibility (Naphtha vs. Ethane) helped
optimize margins
▪ Enhanced domestic gas availability reduced energy cost
➢RIL continued to operate at near full capacity
▪ Quickly flexed business model from domestic to exports
to ensure full product placements
(in ₹ Crore) 1Q FY22 4Q FY21Change
QoQ1Q FY21
Revenue 103,212 101,080 2.1% 58,906
EBITDA 12,231 11,407 7.2% 8,166
EBITDA Margin (%) 11.9% 11.3% 13.9%

O2C Operating Performance
Sustained high operating rates supported by superior product placement capabilities
➢Sustained high operating rates across sites through the quarter
▪ Throughput higher by 1.6 % QoQ
▪ Maximized SRFO, other arbitrage barrels to optimize cost
➢Unplanned outage of FCCU marginally impacted gasoline, PE, PP
▪ FCCU restarted and has stabilized with normal throughput
➢ Jet-fuel production increased in line with better demand
➢Efficient placement in export market based on higher margins
mitigated lower consumption in domestic market
49
1Q FY22 4Q FY21
Throughput 19.0 18.7
1Q FY22 4Q FY21
Transportation Fuels 9.8 9.9
Polymers 1.4 1.5
Fiber Intermediates 1.1 1.1
Polyesters 0.6 0.6
Chemicals and Others 3.6 3.5
Total 16.5 16.6
(Vol in MMT)Feedstock
(Vol in MMT)Production meant for sale
Medical Grade Oxygen
➢ Increased ASU operations and curtailed gasifier operations to maximise Oxygen production
➢Substituted energy requirement by imported LNG
➢Oxygen loading facility of 1,000 TPD developed in just 17 days; met daily requirement of 100,000 patients
during peak of Covid
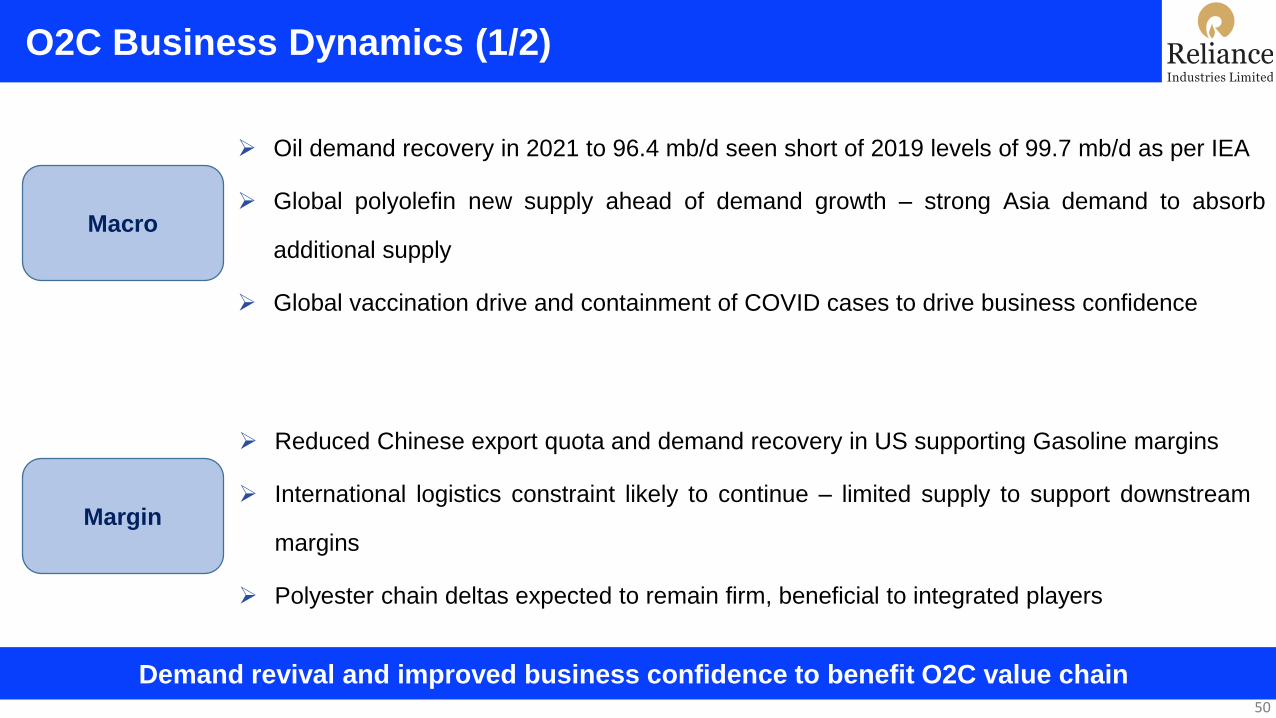
O2C Business Dynamics (1/2)
50
➢ Oil demand recovery in 2021 to 96.4 mb/d seen short of 2019 levels of 99.7 mb/d as per IEA
➢ Global polyolefin new supply ahead of demand growth – strong Asia demand to absorb
additional supply
➢ Global vaccination drive and containment of COVID cases to drive business confidence
➢ Reduced Chinese export quota and demand recovery in US supporting Gasoline margins
➢ International logistics constraint likely to continue – limited supply to support downstream
margins
➢ Polyester chain deltas expected to remain firm, beneficial to integrated players
Margin
Macro
Demand revival and improved business confidence to benefit O2C value chain

O2C Business Dynamics (2/2)
51
Challenges
➢ Fresh lockdowns with rise in cases in SEA with new variants restricting demand recovery
➢ Any fresh restrictions may delay demand recovery to pre-covid levels
➢ Crude markets tightening, high oil prices can potentially impact demand and margins
➢ Improving trends in road and air mobility to lift transportation fuel demand
➢ Healthy domestic demand growth expected from key segments – healthcare, food
packaging, oil and liquid packaging, FMCG
➢ Favorable policy initiatives to boost PE and PVC pipe demand
Demand
Drivers
Domestic economic revival to aid in demand recovery across sectors

52
Summary
Summary
53
Diversified portfolio across consumption baskets underpin robust growth outlook
➢ Record EBITDA, minimal impact of second wave on operating and financial performance
➢ With improving global mobility, fuel and downstream chemicals demand expected to remain firm
▪ Constructive outlook for margin across O2C chain
➢ Oil & Gas poised to be a source of significant value and sustained earnings growth in the coming years
➢ Jio to continue its leadership position with new offerings - JioPhone Next, JioFiber and Enterprise business
➢ Retail positioned for strong recovery led by digital commerce, store additions and revival in consumer sentiments
➢ Focusing on an accelerated start to Clean and Green Energy business initiative
54
Growth is Life . . .