1Q 2021 Highlights - firstpacific.com
11
1
Transcript of 1Q 2021 Highlights - firstpacific.com

1

2
1Q 2021 Highlights
1Q 2021 Core Net Income of Php540 million, 5x higher than 1Q 2020’s
Php103 million due higher metal prices.
Favorable metal prices and production sustained the increased of
Operating Revenues by 38% to Php2.370 billion.
Reported net income reached Php560 million.
EBITDA for 1Q 2021 increased to Php1.011 billion from Php419 million
1Q 2020.
Repayment of USD4 million Parent Company debt
Timely Covid-19 response and consistent implementation of IATF-
DOH health protocols contained the local transmission at Padcal Mine
3
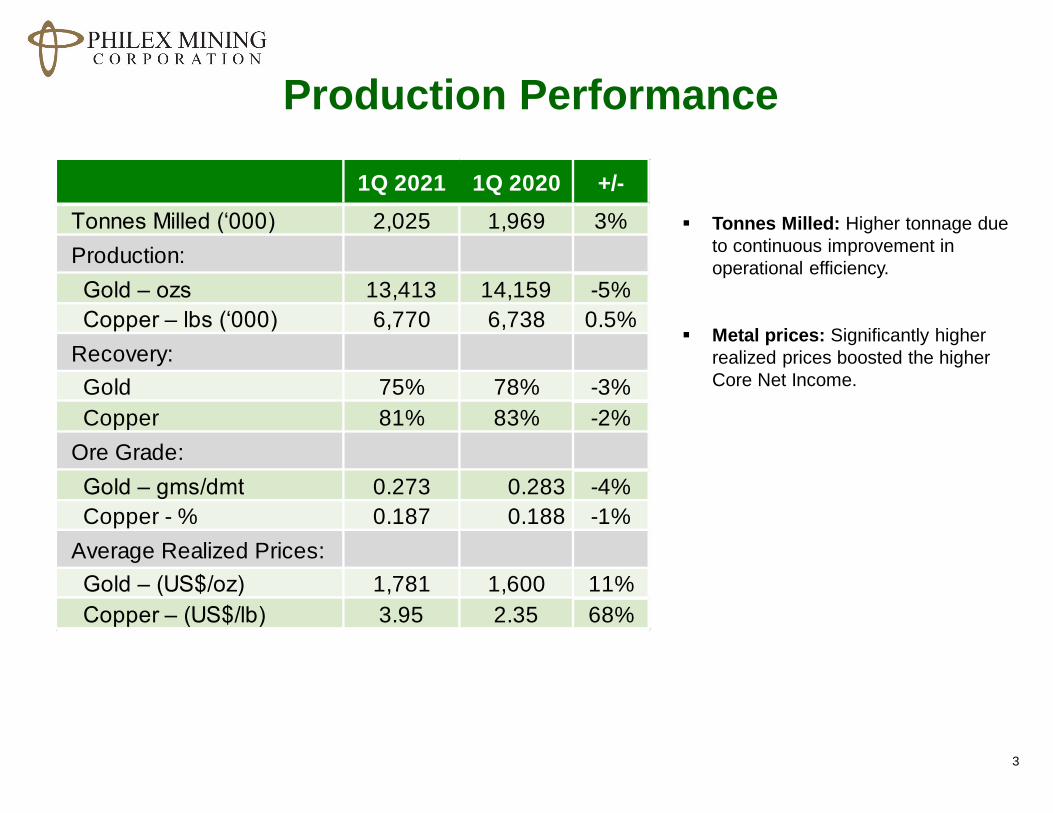
Production Performance
1Q 2021 1Q 2020 +/-
Tonnes Milled (‘000) 2,025 1,969 3%
Production:
Gold – ozs 13,413 14,159 -5%
Copper – lbs (‘000) 6,770 6,738 0.5%
Recovery:
Gold 75% 78% -3%
Copper 81% 83% -2%
Ore Grade:
Gold – gms/dmt 0.273 0.283 -4%
Copper - % 0.187 0.188 -1%
Average Realized Prices:
Gold – (US$/oz) 1,781 1,600 11%
Copper – (US$/lb) 3.95 2.35 68%
Tonnes Milled: Higher tonnage due
to continuous improvement in
operational efficiency.
Metal prices: Significantly higher
realized prices boosted the higher
Core Net Income.

4
Financial Results Summary
(in Php million) 1Q 2021 1Q 2020 +/-
Gross Revenues 2,530 1,860 36%
Smelting Charges 160 147 9%
Net Revenues 2,370 1,713 38%
Costs and Expenses 1,647 1,552 6%
Operating Income 723 161 350%
Other Charges (209) (42) 399%
Net Income 560 102 447%
Core Net Income 540 103 425%
Core EBITDA 1,011 419 141%
Margins:
EBITDA Margin (%) 40% 23% 77%
Net Income Margin (%) 22% 6% 302%
Operating Revenues: Favorable
metal prices and sustained
production increased Operating
Revenues by 38% to Php2.370 B.
Core Net Income: Core net income
of Php540 M, 5x higher than
1Q2020’s Php103 M mainly due to
higher metal prices.

• Q1 2021 Capex of Php214 million spent on Padcal’s sustaining
capex for mine development, new equipment and tailings storage
facility works
Some programs pushed given the continuing impact of the
Covid19 pandemic
• Silangan Project: For predevelopment works; awaiting entry of
strategic partners
5
Capital Expenditures

• Total Assets: Deferred Exploration Cost for Silangan Project accounts
for 64% of Total Assets
• Short-Term Debt: 10% decrease in balance from continuing
implementation of the Company’s Loan Repayment Program.
6
Balance Sheets (in Php million) 31-Mar-21 31-Dec-20 +/-
Cash & Cash Equivalents 826 1,191 -31%
Receivables & Others 3,207 2,253 42%
Total Current Assets 4,033 3,445 17%
Property, Plant & Equipment 2,871 3,043 -6%
Deferred Exploration Costs 27,515 27,365 1%
Others 5,076 5,086 0%
Total Assets 39,495 38,939 1%
Short-Term Debt 1,598 1,777 -10%
Others 2,959 2,444 21%
Total Current Liabilities 4,557 4,221 8%
Bonds Payable 8,281 8,182 1%
Deferred Tax Liabilities & Others 1,862 2,310 -19%
Total Liabilities 14,700 14,713 0%
Total Equity 24,795 24,226 2%
PXP Energy Corporation
Financial Highlights and
Operational Updates
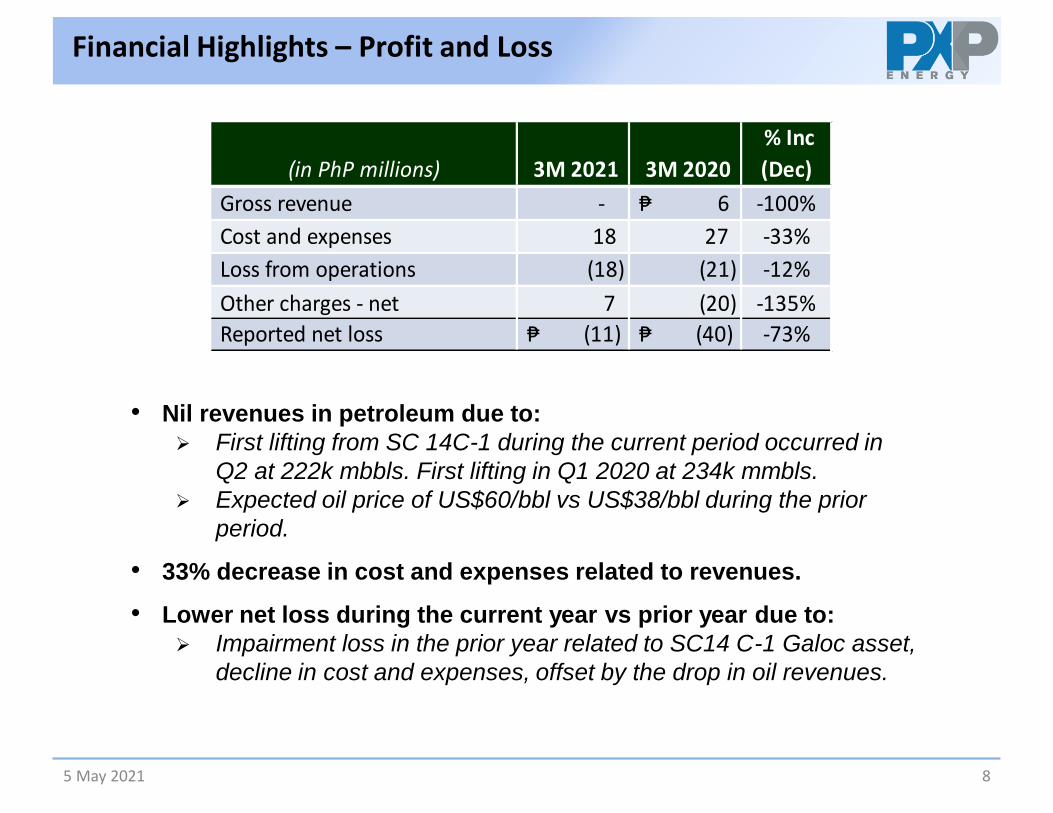
Financial Highlights – Profit and Loss
8 5 May 2021
• Nil revenues in petroleum due to:
First lifting from SC 14C-1 during the current period occurred in
Q2 at 222k mbbls. First lifting in Q1 2020 at 234k mmbls.
Expected oil price of US$60/bbl vs US$38/bbl during the prior
period.
• 33% decrease in cost and expenses related to revenues.
• Lower net loss during the current year vs prior year due to:
Impairment loss in the prior year related to SC14 C-1 Galoc asset,
decline in cost and expenses, offset by the drop in oil revenues.
(in PhP millions) 3M 2021 3M 2020
% Inc
(Dec)
Gross revenue - ₱ 6 -100%
Cost and expenses 18 27 -33%
Loss from operations (18) (21) -12%
Other charges - net 7 (20) -135%
Reported net loss ₱ (11) ₱ (40) -73%
9 5 May 2021
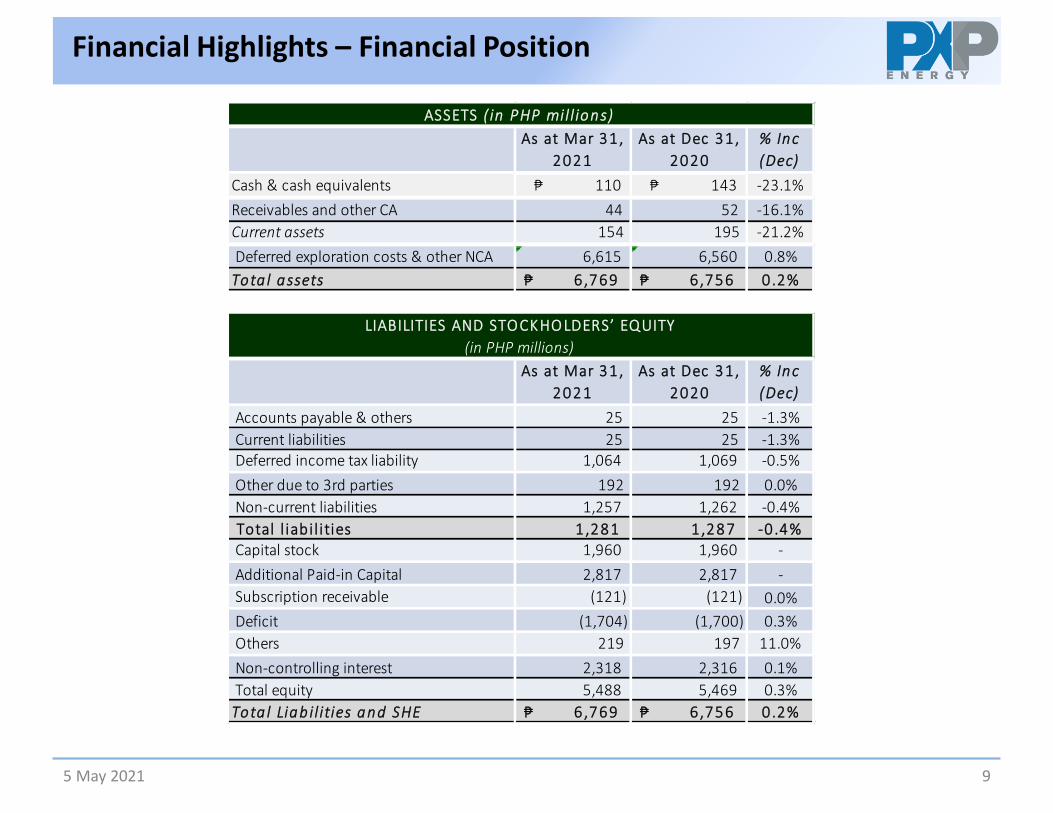
Financial Highlights – Financial Position
As at Mar 31 ,
2021
As at Dec 31 ,
2020
% Inc
(Dec)
Cash & cash equivalents ₱ 110 ₱ 143 -23.1%
Receivables and other CA 44 52 -16.1%
Current assets 154 195 -21.2%
Deferred exploration costs & other NCA 6,615 6,560 0.8%
Tota l assets ₱ 6 ,769 ₱ 6 ,756 0.2%
As at Mar 31 ,
2021
As at Dec 31 ,
2020
% Inc
(Dec)
Accounts payable & others 25 25 -1.3%
Current liabilities 25 25 -1.3% Deferred income tax liability 1,064 1,069 -0.5%
Other due to 3rd parties 192 192 0.0%
Non-current liabilities 1,257 1,262 -0.4%
Total l iabi l ities 1 ,281 1 ,287 -0 .4% Capital stock 1,960 1,960 -
Additional Paid-in Capital 2,817 2,817 -
Subscription receivable (121) (121) 0.0%
Deficit (1,704) (1,700) 0.3%
Others 219 197 11.0%
Non-controlling interest 2,318 2,316 0.1%
Total equity 5,488 5,469 0.3%
Tota l Liab i l ities and SHE ₱ 6 ,769 ₱ 6 ,756 0.2%
ASSETS ( in PHP mil l ions)
LIABILITIES AND STO CKHO LDERS’ EQUITY
(in PHP millions)
5 May 2021
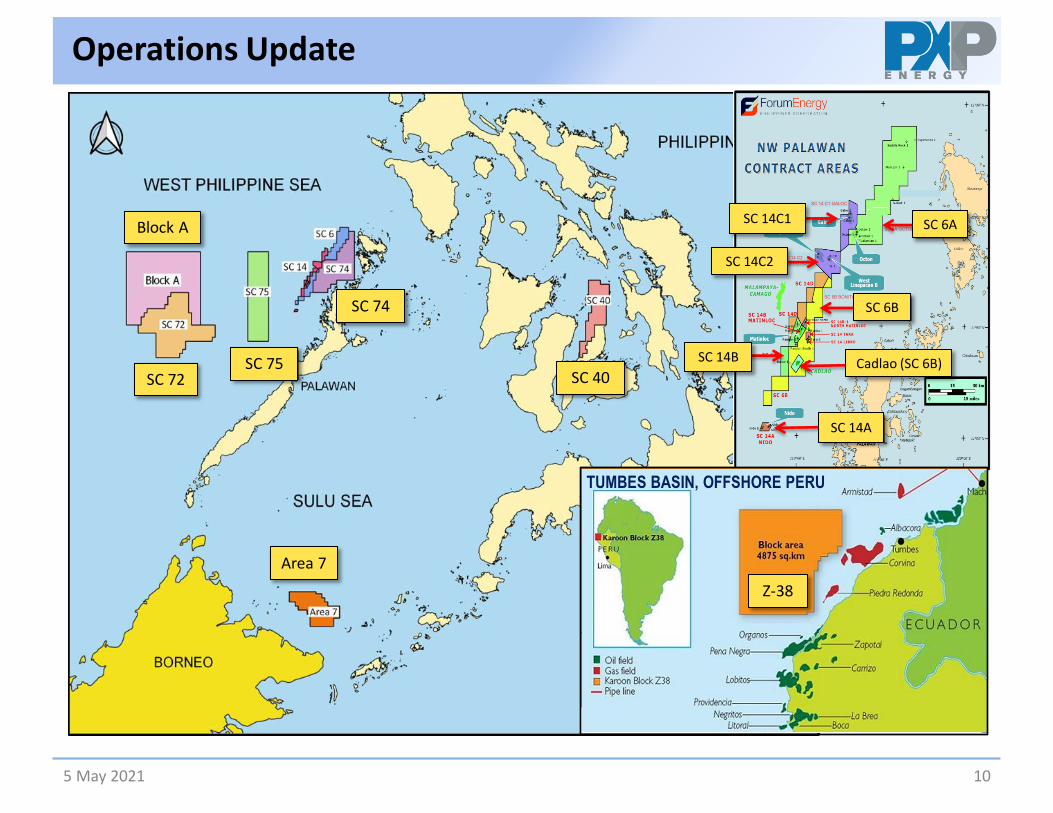
SC 14C2
SC 6A
Cadlao (SC 6B)
SC 6B
SC 14C1
SC 14B
SC 14A
TUMBES BASIN, OFFSHORE PERU
Operations Update
10
SC 72 SC 75
SC 74
SC 40
Area 7
Block A
Z-38
SC 72 Recto Bank (Forum 70%) Ongoing preparations to drill two wells before June 2022.
SC 75 NW Palawan (PXP 50%) Ongoing preparations to acquire new 3D seismic survey of at least 1,000 sq. km before April
2022.
SC 74 Linapacan (PXP 70%) Ongoing Geological and Geophysical (G&G studies) including 3D seismic interpretation which
incorporates the results of the Quantitative Interpretation (QI) study that was completed in 3Q 2020.
The final report on Biostratigraphy and Geochemistry Study was completed in March 2021.
SC 40 North Cebu (Forum 66.67%) Reduction, processing, and Stage 1 interpretation of gravity data acquired in Q1 2020 is
completed.
Gravity profile locations are being adjusted after incorporating the results of the 2020 survey. Basement modeling based on the new profiles will commence this month.
SC 14 C-1 Galoc (Forum 3.2103%) Year 2020 average production rate: 1900 BOPD. January to March 2021 average: 1,804 BOPD
Cargo 68 was completed on 01 April 2021 with a parcel size of 222,038 barrels.
Two more liftings are expected in 2021 with parcel size of 220,000 barrels each.
Operations Update
11 05 May 2021