
1Q 2018 Results 27th April 2018 - caixabank.com · (1) Insurance revenues including life-risk...
44
1Q 2018 Results 27 th April 2018
Transcript of 1Q 2018 Results 27th April 2018 - caixabank.com · (1) Insurance revenues including life-risk...

1Q 2018 Results 27th April 2018
2
Disclaimer
The purpose of this presentation is purely informative and should not be considered as a service or offer of any financial product, service or advice, nor should it be interpreted as, an offer to sell or exchange or acquire, oran invitation for offers to buy securities issued by CaixaBank, S.A. (“CaixaBank”) or any of the companies mentioned herein. The information contained herein is subject to, and must be read in conjunction with, all otherpublicly available information. Any person at any time acquiring securities must do so only on the basis of such person’s own judgment as to the merits or the suitability of the securities for its purpose and only on suchinformation as is contained in such public information set out in the relevant documentation filed by the issuer in the context of such specific issue having taken all such professional or other advice as it considers necessaryor appropriate in the circumstances and not in reliance on the information contained in this presentation.
CaixaBank cautions that this presentation might contain forward-looking statements concerning the development of our business and economic performance. Particularly, the financial information from CaixaBank Group forthe year 2017 related to results from investments has been prepared mainly based on estimates. While these statements are based on our current projections, judgments and future expectations concerning thedevelopment of our business, a number of risks, uncertainties and other important factors could cause actual developments and results to differ materially from our expectations. Such factors include, but are not limited tothe market general situation, macroeconomic factors, regulatory, political or government guidelines and trends, movements in domestic and international securities markets, currency exchange rates and interest rates,changes in the financial position, creditworthiness or solvency of our customers, debtors or counterparts.
Statements as to historical performance, historical share price or financial accretion are not intended to mean that future performance, future share price or future earnings for any period will necessarily match or exceedthose of any prior year. Nothing in this presentation should be construed as a profit forecast. In addition, it should be noted that although this presentation has been prepared based on accounting registers kept byCaixaBank and by the rest of the Group companies it may contain certain adjustments and reclassifications in order to harmonize the accounting principles and criteria followed by such companies with those followed byCaixaBank. Accordingly, and particularly in the case of Banco Português de Investimento (“BPI”), the relevant data included in this presentation may differ from those included in the relevant financial information aspublished by BPI.
In particular, regarding the data provided by third parties, neither CaixaBank, nor any of its administrators, directors or employees, , either explicitly or implicitly, guarantees that these contents are exact, accurate,comprehensive or complete, nor are they obliged to keep them updated, nor to correct them in the case that any deficiency, error or omission were to be detected. Moreover, in reproducing these contents in by anymeans, CaixaBank may introduce any changes it deems suitable, may omit partially or completely any of the elements of this document, and in case of any deviation between such a version and this one, CaixaBank assumesno liability for any discrepancy.
In relation to Alternative Performance Measures (APMs) as defined in the guidelines on Alternative Performance Measures issued by the European Securities and Markets Authority on 30 June 2015 (ESMA/2015/1057), thisreport uses certain APMs, which have not been audited, for a better understanding of the company's financial performance. These measures are considered additional disclosures and in no case replace the financialinformation prepared under the International Financial Reporting Standards (IFRS). Moreover, the way the Group defines and calculates these measures may differ to the way similar measures are calculated by othercompanies. Accordingly, they may not be comparable. Please refer to the Glossary section for a list of the APMs used along with the relevant reconciliation between certain indicators.
This document has not been submitted to the Comisión Nacional del Mercado de Valores (CNMV – the Spanish Stock Markets regulatory authority) for review or for approval. Its content is regulated by the Spanish lawapplicable at the date hereto, and it is not addressed to any person or any legal entity located in any other jurisdiction. For this reason it may not necessarily comply with the prevailing norms or legal requisites as required inother jurisdictions.
Notwithstanding any legal requirements, or any limitations imposed by CaixaBank which may be applicable, permission is hereby expressly refused for any type of use or exploitation of the content of this presentation, andfor any use of the signs, trademarks and logotypes contained herein. This prohibition extends to any kind of reproduction, distribution, transmission to third parties, public communication or conversion by any other mean,for commercial purposes, without the previous express consent of CaixaBank and/or other respective proprietary title holders. Any failure to observe this restriction may constitute a legal offence which may be sanctionedby the prevailing laws in such cases.

3
Profitability reaches 2018 targets
1Q 2018 Highlights
Core revenues and lower impairments contribute to improve profitability
Better business mix and higher margins reflect strength of franchise
Continuing decline in NPAs with increased coverage
Strong solvency and liquidity
Net income up 75% yoy to €704 M and Group RoTE (trailing 12M) at 9.8%
(1) Insurance revenues including life-risk premia, equity accounted income from SegurCaixa Adeslas and other bancassurance stakes from BPI.(2) In Spain.
Note: Group data unless otherwise noticed. Hereinafter “CABK” refers to CaixaBank stand-alone while “CABK Group” or “Group” refers to CaixaBank Group
CET1 FL
11.6%
Total capital FL
16.1%
Liquid assets
€73 Bn
LCR (12M average)
194%
NPLs
-4.3% ytd
CoR Trailing 12M
29 bps
RE sales(2)
+3.4% yoy
NPL coverage
55%
NII
+4.3% yoy
Fee + insur. rev.(1)
+10.2% yoy
Core revenues
+6.5% yoy
Total provisions
-69.4% yoy
+0.6% qoq +3.8% qoq +1.8% qoq -25.0% qoq
AuM & insur. funds
+0.9% ytd
Consumer loans(2)
+5.3% ytd
FB lending yieldsPayroll depositsmarket share(2)
+13 bps vs. 1Q17 +61 bps yoy
Capital gains: 16%-5 bps ytd +5 pp ytdNPL ratio: 5.8%, -21 bps ytd

4
COMMERCIALACTIVITY
FINANCIAL RESULTS
BALANCE SHEET
FINALREMARKS
1. 2. 3. 4.

5
Customer funds grow in a quarter with adverse seasonality
(1) Includes retail debt securities amounting to €528M (Group) and €500M (CABK) at 31st March 2018.(2) Including SICAVs and managed portfolios.
Commercial activity
Customer funds
31st March 2018 % ytd
I. On balance-sheet funds 250.0 1.0
Demand deposits 162.0 2.0
Time deposits(1) 33.2 (7.2)
Subordinated liabilities 2.0 0.0
Insurance 50.6 1.3
Other funds 2.1 113.9
II. Assets under management 97.2 0.6
Mutual funds(2) 67.6 1.0
Pension plans 29.6 (0.3)
III. Other managed resources 4.2 (20.8)
Total customer funds 351.4 0.6
Breakdown, in €Bn
Continued migration from time deposits to long-term saving products fuels structural growth in insurance and AuM
On B/S funds grow in a quarter with adverse seasonality in demand deposits
AuM also up as net inflows more than offset negative market impacts (c.€1.1Bn for CABK)
Other managed resources reflect calendar effects
+0.9% +1.9% -7.2% +0.6%
Customer funds evolution ytd
1.3
2.03.3
(2.6)
Insurance+ AuM
Demanddeposits &
other
Time deposits Total
In €Bn and %

6
The long-term savings and protection business exhibits steady growth
Commercial activity
(1) Includes pension plans, own and third-party mutual funds, SICAVs and managed portfolios.(2) Net inflows into life-saving insurance and AuM (pension plans and mutual funds, SICAVs and managed portfolios) excluding the market impact on AuM.(3) Includes pension plans, own mutual funds and an estimate for life-saving insurance. (4) Sources: Inverco, ICEA. Latest available data.
Long-term savings products Life-risk insurance Non-life insurance
56
6978
104 108
140
148
1Q12 1Q13 1Q14 1Q15 1Q16 1Q17 1Q18
Life-savings insurance + AuM(1), in €Bn SegurCaixa Adeslas premia, in €M
Market share Life-risk premia (Spain)(4)
Production 1Q18, yoy
Market share Long-term savings (Spain)(3)(4)
Net inflows(2)
1Q18 (Spain)Premia% growth FY14-FY17
% new productionthrough bancassurance
network, FY 2017
€2.4 Bn
21%
+24%
19%
26%
+5%
vs. 11% sector
70%
170 181211
249278
322
398
1Q12 1Q13 1Q14 1Q15 1Q16 1Q17 1Q18
+24%
529
651708
778841
931
987
1Q12 1Q13 1Q14 1Q15 1Q16 1Q17 1Q18
+6%
Premia VidaCaixa, in €M

7
Technology continues to provide us with a competitive advantage
Commercial activity
Innovative offerings Adapting to changing client needs
of our clients are digital(1)56%
Wall Ready to Buy
Launch of Smart Money in March 2018
Online-based advisory service in investments (Roboadvisor)
Easy and quick process
Only available online
Low minimum investment of €1,000
Other innovations :
Boosting commercial effectiveness
New virtual assistant for employees
Based on artificial intelligence (Watson)
Immediate responses to complex matters
Solving 80% of FAQs
Implemented in 1Q 2018
Using Watson for Trade Finance advisory since 2016
100%4.9 M clients active in mobile banking(1)
New CaixaBank app
Over 1M clients now using mobile-only imaginBank
Launched in January 2016
120,000 clients active/day
Interacting with the bank every 3 days
20% credit cards active through mobile
>1M clients
(1) Individual customers aged 20-74 years old with at least one digital transaction in the last 12 months.
employees have smart PCs

8
Stable performing loan-book
Commercial activity
Loan book
Continued growth in consumer lending increasing its weight in the loan book
Lending to businesses reflects seasonality and large ticket volatility
RE developer and mortgage deleveraging continues albeit at a slower pace
Improved quality of the portfolio with continued decline in NPLs
(1) Unsecured loans to individuals, excluding those for home purchases. Includes personal loans from CaixaBank, MicroBank and CaixaBank Consumer Finance, as well as revolving credit cards (CaixaBank Payments) except for float.
31st March 2018 % ytd
I. Loans to individuals 128.0 (0.4)
Residential mortgages 93.6 (0.7)
Other loans to individuals 34.4 0.4
o/w: CABK consumer loans(1) 10.5 5.3
II. Loans to businesses 82.3 (1.4)
Corporates and SMEs 75.3 (1.4)
Real Estate developers 7.0 (1.7)
Loans to individuals & businesses 210.3 (0.8)
III. Public sector 13.0 8.0
Total loans 223.2 (0.3)
Performing loans 210.1 (0.0)
Performing loan book
In €Bn and % ytd
210.2 210.1
(0.6) +0.5 (0.4) (0.6) +1.0
-0.05%
MortgagesConsumer
SpainOther indiv.
BusinessesPublic sector
4Q17 1Q18
Consumer + business lending ex RE % over total performing loan book
38%(+2pp yoy)
Breakdown, in €Bn

9
Positive new lending dynamics
Commercial activity
Consumer lending Residential mortgages
New lending 1Q18, €Bn and % yoy
CABK
€2.1 BnNew lending 1Q18, €Bn and % yoy
CABK
€1.6 Bn
New consumer lending (CABK), €Bn
81,000
114,000 2,412
TV & cell phones at 0%
Cars commercialisedat the branch
Cell phones financed
Strategic alliances and commercial agreements at the point-of-sale, 1Q18
Key assets are customer intimacy and agile solutions
+13.3% yoy Stable yoy
New mortgage lending (CABK), €Bn
Fixed rates protect customers against eventual rate rises
60%
of new residential mortgages at fixed rate
1.1
1.4
1.9
2.1
1Q17 1Q181Q161Q15
0.8
1.4
1.6 1.6
1Q17 1Q181Q161Q15

10
COMMERCIALACTIVITY
FINANCIAL RESULTS
BALANCE SHEET
FINALREMARKS
1. 2. 3. 4.

11
Strong profitability improvement on higher revenues and lower impairments
Group(1) CABK
1Q18 1Q17 % yoy % qoq % yoy
Net interest income 1,203 1,153 4.3 0.6 2.2
Net fees and commissions 625 588 6.4 (0.9) 1.1
Income and exp. from insurance(2) 138 110 24.9 17.4 24.9
Other revenues 296 42
Trading 136 43 55.8
Dividends and equity accounted 271 93
Other operating income/expenses (111) (94) 17.1 (55.6) 13.1
Gross income 2,262 1,893 19.5 30.7 10.0
Recurring operating expenses (1,149) (1,091) 5.4 2.3 1.8
Extraordinary operating expenses (3) (10) (73.2)
Pre-impairment income 1,110 792 40.1 83.2 21.6
LLPs (139) (249) (44.3) (1.2) (45.4)
Other provisions (50) (370) (86.3) (54.9) (86.3)
Gains/losses on disposals and other (2) 278 (99.0)
Pre-tax income 919 451 104.1 82.7
Income tax, minority interest & others (215) (48)
Profit attributable to the Group 704 403 74.7 51.6
Consolidated Income Statement
(1) 1Q17 and 1Q18 not comparable in terms of scope as BPI consolidated from 1st February 2017.(2) Equity accounted income from SegurCaixa Adeslas and other bancassurance stakes from BPI are included in “Dividends and equity accounted”.(3) Net (post minorities and taxes) attributable to the Group. BFA contributed €100M of equity accounted income in 1Q18 (€76M post minorities and taxes) of which €79M (€60M post minorities and taxes) are estimated to be non-recurrent
(refer to Appendix for additional detail). The revaluation of the Viacer stake to the agreed sale price contributes €66M to trading gains (€54M post minorities and taxes).
In €M
Financial results
Sustained core revenue growth
• NII +2.2% yoy CABK, +0.6% qoq Group
• Fees +1.1% yoy CABK; -0.9% qoq Group reflecting adverse market impacts on CIB and AM
• Life-risk insurance inc. +24.9% yoy/+17.4% qoq
Non-core revenues boosted by one-offs (BFA €60M; Viacer €54M)(3) and ALCO capital gains
Recurrent costs (+1.8% yoy CABK) impacted by seasonal property taxes and in line with guidance
Steep fall in total provisions: -69.6% yoy CABK/
-25.0% qoq Group
Net income grows 75% yoy Group (52% yoy CABK)
RoTE, (ttm) 9.8%

12
Core business momentum reflects the strength of our model
Core revenue contribution to total revenues
Financial results
2,603
2,5182,582
2,688
2,888
3,141
3,301
3,4203,486
2,853
3,056
3,156 3,184
3,232
1Q16 2Q16 3Q16 4Q16 1Q17 2Q17 3Q17 4Q17 1Q18
Group
CABK
Core operating income(2)
Trailing 12 months, in €M
1Q18 Core operating income
€859 MGroup +8.2% yoy
+1.3% qoq
+21%
+13%
Core revenues(1)
6,6346,530 6,576
6,683
6,970
7,350
7,641
7,887
8,011
6,858
7,0667,178 7,219
7,285
1Q16 2Q16 3Q16 4Q16 1Q17 2Q17 3Q17 4Q17 1Q18
Group
CABK
Trailing 12 months, in €M
+15%
93%
89%
+6%
1Q18 Core revenues
€1,835MCABK +3.7% yoy
+2.9% qoq
1Q17
1Q18
Trailing 12 months, in % of gross income
Gradually improving the quality of revenues€2,008MGroup +6.5% yoy
+1.8% qoq
€804 MCABK +6.3% yoy
+3.9% qoq
(1) Includes NII, net fees and other revenues from insurance (life-risk premia and equity accounted income from SegurCaixa Adeslas. Since 4Q17 it also includes equity accounted income from BPI insurance companies).(2) Core revenues minus recurrent costs.
13
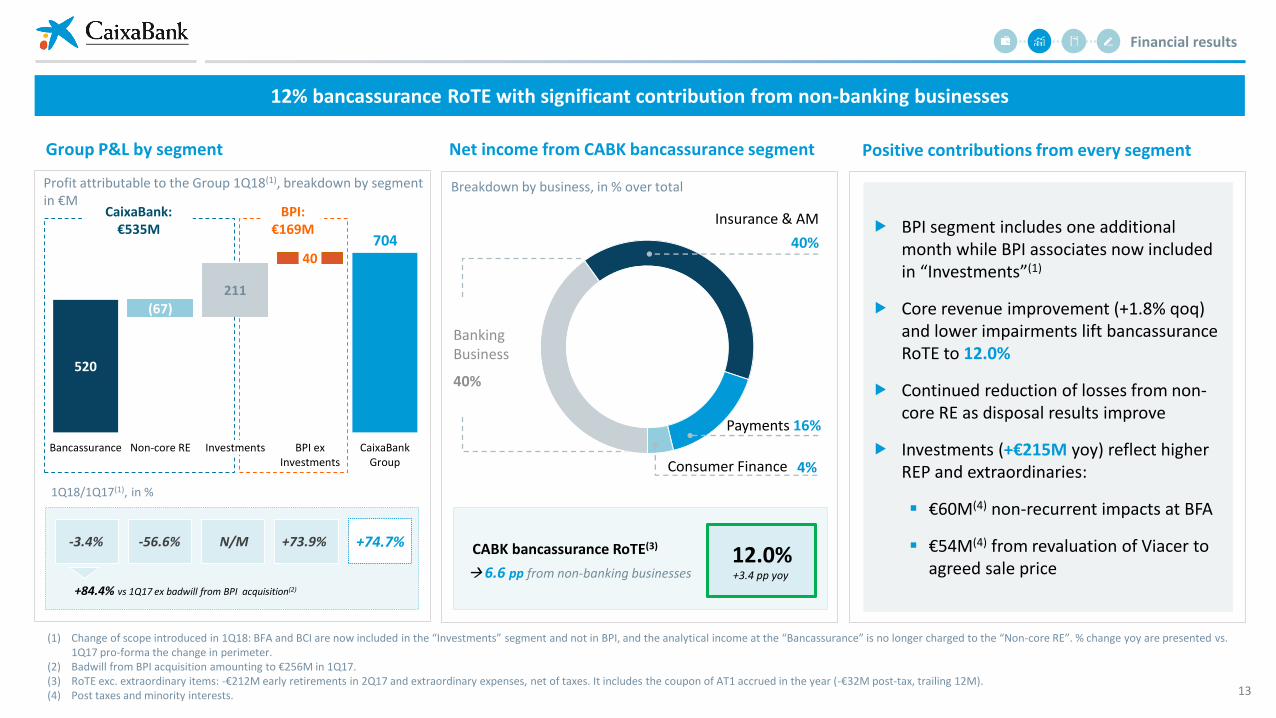
12% bancassurance RoTE with significant contribution from non-banking businesses
Group P&L by segment
BPI segment includes one additional month while BPI associates now included in “Investments”(1)
Core revenue improvement (+1.8% qoq) and lower impairments lift bancassuranceRoTE to 12.0%
Continued reduction of losses from non-core RE as disposal results improve
Investments (+€215M yoy) reflect higher REP and extraordinaries:
€60M(4) non-recurrent impacts at BFA
€54M(4) from revaluation of Viacer to agreed sale price
Financial results
(1) Change of scope introduced in 1Q18: BFA and BCI are now included in the “Investments” segment and not in BPI, and the analytical income at the “Bancassurance” is no longer charged to the “Non-core RE”. % change yoy are presented vs. 1Q17 pro-forma the change in perimeter.
(2) Badwill from BPI acquisition amounting to €256M in 1Q17.(3) RoTE exc. extraordinary items: -€212M early retirements in 2Q17 and extraordinary expenses, net of taxes. It includes the coupon of AT1 accrued in the year (-€32M post-tax, trailing 12M).(4) Post taxes and minority interests.
520
704
(67)211
40
Bancassurance Non-core RE Investments BPI exInvestments
CaixaBankGroup
1Q18/1Q17(1), in %
Profit attributable to the Group 1Q18(1), breakdown by segment in €M
CaixaBank: €535M
BPI: €169M
Net income from CABK bancassurance segment
BankingBusiness
40%
Insurance & AM
40%
Payments 16%
CABK bancassurance RoTE(3)12.0%
6.6 pp from non-banking businesses
Consumer Finance 4%
+3.4 pp yoy
-3.4% -56.6% +73.9%N/M +74.7%
+84.4% vs 1Q17 ex badwill from BPI acquisition(2)
Breakdown by business, in % over total
Positive contributions from every segment

14
Improvement in BPI contribution affected by changes in scope
Financial results
(1) 1Q18 data impacted by the sale of BPI Vida e Pensoes to VidaCaixa (-€7M in NII vs. 4Q17) and by change in accounting criteria affecting NII (-€5M in 1Q18 that are now reported as trading gains in “other revenues”). Moreover, revenues from BPI associates are now reported within “Investments” in segment reporting, with 2017 figures being restated.
(2) BPI consolidated from 1 February 2017 so 1Q17 included only 2 months.(3) Consumer lending and other credit to individuals.(4) Credit to businesses in Portugal.
Activity in Portugal
Segment P&L, in €M
BPI segment P&L
1Q18(1) 1Q17(2)
Net interest income 97 69
Net fees and commissions 75 43
Other revenues 16 9
Gross income 188 121
Recurring operating expenses (118) (78)
Extraordinary operating expenses (3) (10)
Pre-impairment income 67 33
Impairment losses & other provisions - 5
Gains/losses on disposals and other - -
Pre-tax income 67 38
Income tax, minority interest & others (27) (16)
Net attributable profit 40 22
Mortgage lending
Consumer lending(3)
Credit to businesses(4)
Client deposits
+0.4%
+4.0%
+3.1%
+3.5%
Contribution to the Group impacted by change in scope and accounting criteria(1)
not fully comparable to previous quarters
Positive operating trends continue in 1Q
Source: INE Portugal.
Portugal: Macroeconomic dynamics
Solid macroeconomic recovery supports gradual business improvement
8.1%
Unemployment rate, %
16.9%
-1.73%
2.38%
2Q13 2Q14 2Q15 2Q16 2Q17
GDP growth, % yoy
4Q17
As reported by BPI, % ytd

15
NII evolution
In €M(1)(2)
1,084 1,098 1,099 1,088 1,108
69 98 102 108 95
1,1531,196 1,201 1,196 1,203
1Q17 2Q17 3Q17 4Q17 1Q18
NII improvement underpinned by higher loan and lower wholesale funding yields
Financial results
(1) 1Q17 includes 2 months of BPI and impact of FV adjustments. Since 2Q17, included, BPI contributes a full quarter, also impacted by FV adjustments.(2) The breakdown CABK-BPI reflects the acquisition of BPI Vida e Pensoes by VidaCaixa (no impact at Group level). (3) After application of IFRS 9 from January 1st 2018.(4) 1Q18 data impacted by the sale of BPI Vida e Pensoes to VidaCaixa (-€7M in NII vs. 4Q17) and by change in accounting criteria affecting NII (-€5M in 1Q18 that are now reported as trading gains).
Group NII grows qoq on higher yields with yoy also impacted by one more month of BPI
CABK NII improves as:
Cheaper wholesale funding, higher-yield loan mix and NPL accrual(3) more than offset…
…still negative Euribor resets and lower average loan/ALCO volumes
BPI NII reflects one additional month (yoy), Q4 sale of businesses to CABK, and changes in accounting criteria(4)
CABK BPI
1,196 1,203 1,203
4Q17 1Q18
NII bridge
+4.3%
+0.6%
Client yields
Client volumes
Wholesale funding, ALCO & other
qoq(2), in €M
+25 -12 +7
+0.6%
+2.2% yoy +1.8% qoq
CABK
-13
BPI

16
Increased client NII as higher loan yields offset lower volumes
Financial results
Deposit repricing Loan yields Loan volumes
FB yields up on mix shift and pricing discipline
BB yields up mainly on NPL accrual(4) and
accretive FB (continued mix-shift) offsetting negative Euribor resets
15
109
6
9
1Q17 2Q17 3Q17 4Q17 1Q18
0 0 1 4 1
Time deposits: front book vs. back book yield(1), in bps
Limited potential for re-pricing as back book approaches front book
BB uptick qoq mainly driven by F/X deposit impacts
Loans: front book vs. back book yield(3), in bps Average loan balance (net), in €Bn
Loan volumes reflect continued deleveraging
(2)
(1) Front book CABK including only deposits in Euros. Back book Group, including all deposits.(2) 1Q Group time deposit and asset yields, as well as average balance BPI, calculated on 2 months of BPI contribution.(3) Front book CABK excluding public sector. Back book Group, including all loans.(4) After application of IFRS 9 from January 1st 2018.
311303
327
301
324
223 221 219 219
228
1Q17 2Q17 3Q17 4Q17 1Q18
206 211 210 209 208
1Q17 2Q17 3Q17 4Q17 1Q18
-0.8%
BBFB
(2) (2)
BBFB

17
27.6 27.5 29.7 29.5 30.0
Mar'17 Jun'17 Sep'17 Dec'17 Mar'18
Cheaper wholesale funding compensates for lower ALCO contribution
Wholesale funding costs
Duration, yrs
Average life, yrs
Yield, %
Duration, yrs
Average life, yrs
Yield, %
141140
141
126120
CABK wholesale funding back-book(1) in €Bn and spread over 6M Euribor in bps, as of 31 March 2018
Book falls as market opportunities are seized
Higher duration reflects disposals of previously swapped positions
BB -6 bps qoq/-21 bps yoy as expensive maturities more than compensate for new issuances
Liquidity ALCO book increased in the quarter
Duration around TLTRO maturity
(1) Includes securitisations placed with investors and self-retained multi-issuer covered bonds. It does not include the AT1 issued in June 2017 and in March 2018.(2) Securities at amortised cost.
12.4 13.9 14.6 13.410.9
3.53.1 3.1
2.94.5
16.017.0 17.8
16.3 15.4
Mar-17 Jun-17 Sep-17 Dec-17 Mar-18
FV-OCI
AC
3.5 2.9 4.6 3.87.4
6.0 6.09.4 9.4
11.09.5 8.9
14.0 13.2
18.4
Mar-17 Jun-17 Sep-17 Dec-17 Mar-18
FV-OCIAC
Volume
Spread
2.0
4.8
2.5
2.2 2.02.5 2.3
4.8 4.94.5 4.6
0.2 0.2 0.20.1 0.1
3.2 2.9 3.32.6 2.5
3.2
Financial results
Structural ALCO portfolio ALCO liquidity management portfolio
Group, in €Bn Group, in €Bn(2) (2)
1.5 1.41.5 1.7 3.1 2.82.5 2.4

18
Both customer spread and NIM improve in the quarter
Financial results
(1) 1Q17 includes 2 months of BPI and impact of FV adjustments. Since 2Q17, included, BPI contributes a full quarter, also impacted by FV adjustments.(2) The cost of customer funds reflects the cost of both demand and time deposits, as well as repos with retail clients. Excludes the cost of institutional issuance and subordinated liabilities.(3) After application of IFRS 9 from January 1st 2018.
Customer spread
Net loansClient funds(2)
Customer spread NIM
2.17 2.17 2.15 2.162.24
1Q17 2Q17 3Q17 4Q17 1Q18
0.06 0.04 0.04 0.03 0.04
2.23 2.21 2.19 2.19 2.28
Group customer spread(1), in %
1.30 1.30 1.271.22
1.29
1Q17 2Q17 3Q17 4Q17 1Q18
Group NIM(1), in %
+7 bps+8 bps
Better spreads are main contributor to NII
Customer spread growth qoq:
Low and stable client fund costs
Higher lending yields: positives from production skewed to higher yielding segments, margin defence and NPL accrual(3) more than offset Euribor repricing
Higher qoq NIM reflects NII improvement and lower cash balances (denominator effect)Numerator: Denominator: +0.6%
qoq-2.6%
qoq
19
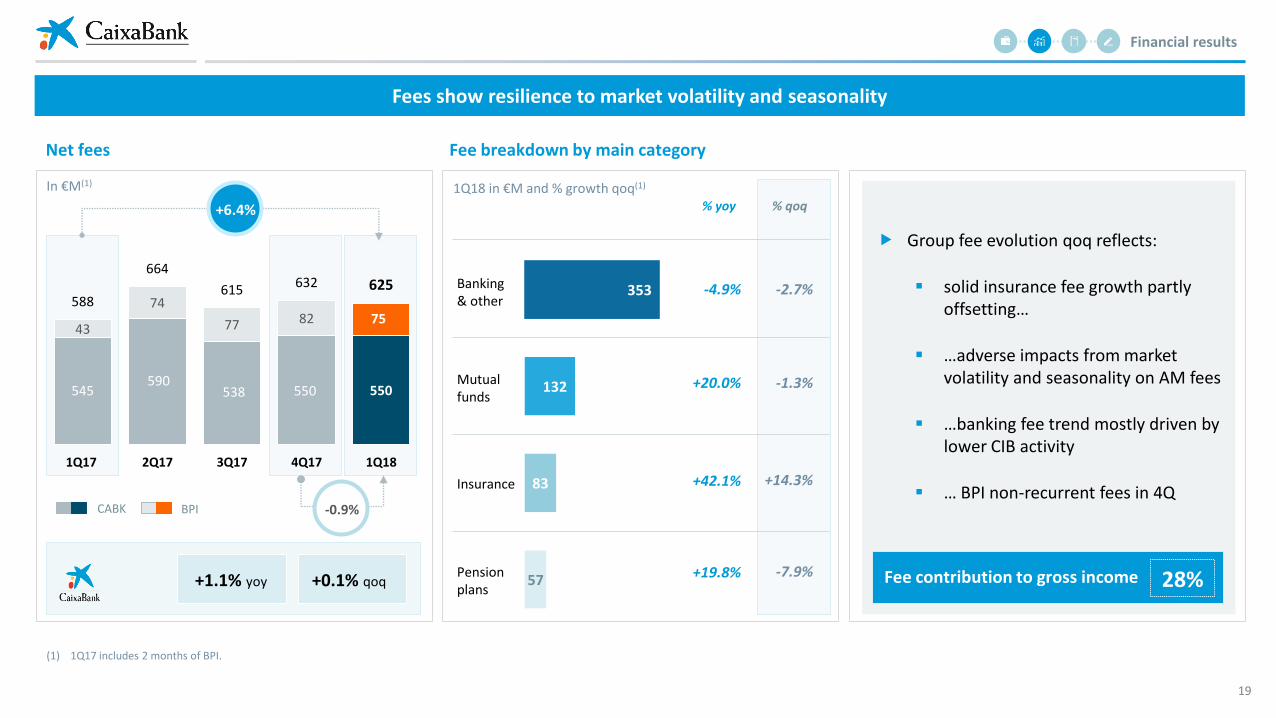
Fees show resilience to market volatility and seasonality
Financial results
Net fees
In €M(1)
Fee breakdown by main category
1Q18 in €M and % growth qoq(1)
Group fee evolution qoq reflects:
solid insurance fee growth partly offsetting…
…adverse impacts from market volatility and seasonality on AM fees
…banking fee trend mostly driven by lower CIB activity
… BPI non-recurrent fees in 4Q
Fee contribution to gross income 28%
545590
538 550 550
43
74
77 82 75588
664
615632 625
1Q17 2Q17 3Q17 4Q17 1Q18
+6.4%
-0.9%
353
132
83
57
Banking & other
Mutual funds
Insurance
Pension plans
-4.9% -2.7%
+20.0% -1.3%
+42.1% +14.3%
+19.8% -7.9%+1.1% yoy +0.1% qoq
(1) 1Q17 includes 2 months of BPI.
CABK BPI
% yoy % qoq

20
Insurance and asset management remain key contributors to CABK bancassurance earnings
Financial results
Insurance and AM revenues
336
374
393400
429
492508 504
523
408
458470 466
489
1Q16 2Q16 3Q16 4Q16 1Q17 2Q17 3Q17 4Q17 1Q18
Group
CABK
In €M(1)
+21.9%
+19.9%
% qoq +4.5%+3.4%Group CABK
Contribution to bancassurance revenues
Insurance + AM revenues(1), in % of CABK bancassurance rev.
1Q17
1Q18 25%
22%
Non-traditional banking businesses mitigate effect of low rates
Bancassurance P&L: contribution from insurance
Insurance net income grows at double digits
Bancassur.o/w
Insurance(2)Insur.% yoy
Net interest income 1,147 72 4.3
Net fees and commissions 551 (40) 21.2
Income and exp. insurance 138 138 25.5
Income from associates 52 41 24.2
Other revenues 38 3
Gross income 1,926 214 13.8
Recurring operating expenses (1,001) (27) (6.9)
Pre-impairment income 925 187 17.6
LLPs & other provisions (205)
Gains/losses on disp. & other (4)
Pre-tax income 716 187 17.6
Income tax (196) (43) 19.4
Net attributed profit 520 144 17.1
In €M
(1) Excludes trading and other operating income and expenses.(2) Does not include the fees paid by SCA to the bancassurance business for non-life insurance distribution.
21
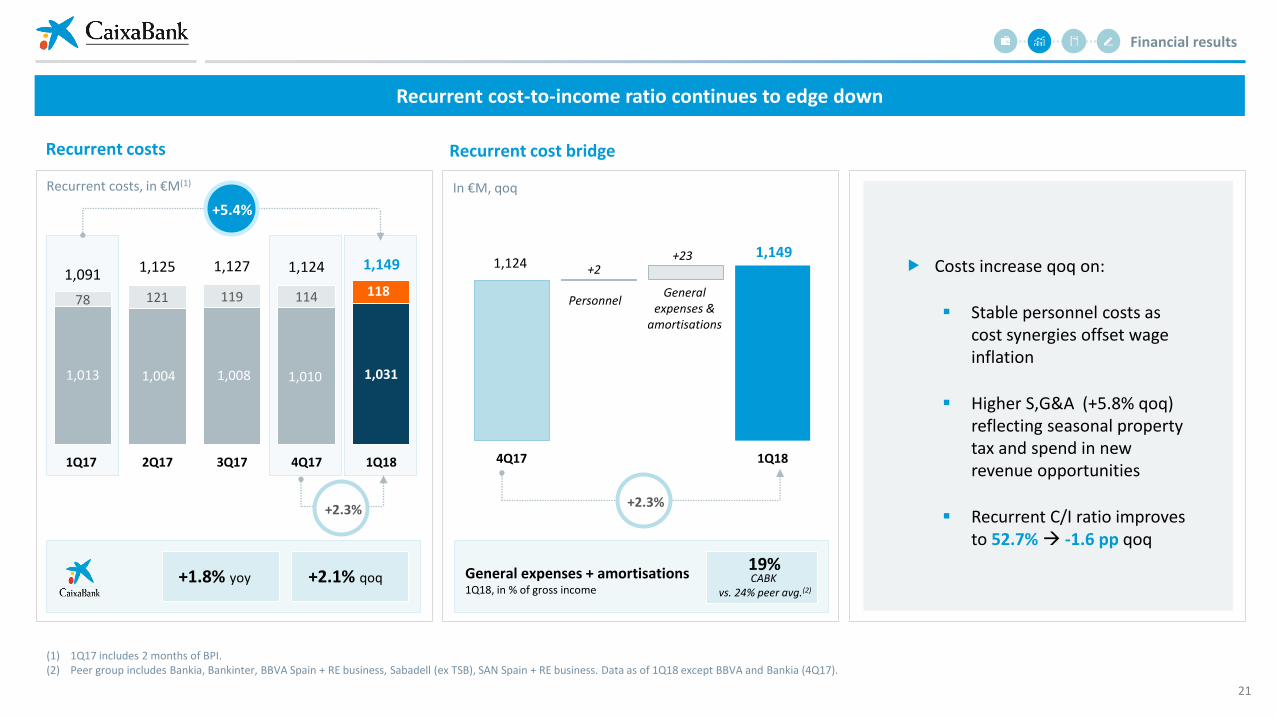
Recurrent cost-to-income ratio continues to edge down
Financial results
Recurrent costs
Recurrent costs, in €M(1)
Recurrent cost bridge
In €M, qoq
Costs increase qoq on:
Stable personnel costs as cost synergies offset wage inflation
Higher S,G&A (+5.8% qoq) reflecting seasonal property tax and spend in new revenue opportunities
Recurrent C/I ratio improves to 52.7% -1.6 pp qoq
(1) 1Q17 includes 2 months of BPI.(2) Peer group includes Bankia, Bankinter, BBVA Spain + RE business, Sabadell (ex TSB), SAN Spain + RE business. Data as of 1Q18 except BBVA and Bankia (4Q17).
1,013 1,004 1,008 1,010 1,031
78 121 119 114 1181,091 1,125 1,127 1,124 1,149
1Q17 2Q17 3Q17 4Q17 1Q18
+5.4%
+1.8% yoy +2.1% qoq
+2.3%
General expenses + amortisations1Q18, in % of gross income
CABK vs. 24% peer avg.(2)
19%
1,1241,149
4Q17 1Q18
+2.3%
PersonnelGeneral
expenses & amortisations
+2+23

22
Steady decline in LLPs with CoR(1) down to 29 bps
LLPs Annualised quarterly CoR
249
223
186
141 139
1Q17 2Q17 3Q17 4Q17 1Q18
o/w CABK, in €M
255 228 200 148 139
Loan-loss provisions(2), in €M
-44.3%
-1.2%
(1) Trailing 12 months.(2) 1Q17 includes only 2 months of BPI.
CoR trailing 12M
0.46%
0.44%
0.41%
0.34%
0.29%
1Q17 2Q17 3Q17 4Q17 1Q18
In %(2)
-17 pp
Financial results
0.45%
0.37%
0.31%
0.24% 0.24%
1Q17 2Q17 3Q17 4Q17 1Q18
-21 pp
Group CoR shows another steady improvement in 1Q
Annualised quarterly CoR remains stable at very low levels
In % (2)

23
Capital gains on RE disposals continue to offset OREO provisioning
Capital gains from RE sales
CABK, in % of net book value
Financial results
Net RE result
Gains/losses on asset disposals (CABK), in €M
Capital gains offset impairments and produce a small profit
-16.0%
4.0%
15.0% 16.0%
1Q15 1Q16 1Q17 1Q18
1Q18 1Q17 4Q17
Results from RE sales 40 35 108
Other RE gains/losses (38) (10) (149)
Net RE result 2 25 (41)
Other non-RE related (4) 253 (75)
Gains/losses on asset disposals and others (2) 278 (116)
€256M from BPI business combination
RE sales1Q18
+3.4% yoy€306M
Positive trend in capital gains continues

24
COMMERCIALACTIVITY
FINANCIAL RESULTS
BALANCE SHEET
FINALREMARKS
1. 2. 3. 4.

25
NPLs continue to decline while coverage grows after IFRS 9
Asset quality
NPL stock and ratio
6.7%
6.5% 6.4%
6.0%5.8%
16.1
15.5 15.3
14.3
13.7
1Q17 2Q17 3Q17 4Q17 1Q18
o/w BPI, in €Bn
1.5 1.4 1.4 1.2 1.1
NPL coverage
NPL stock (1) in €Bn and NPL ratio in % In %
Group CABK BPI
1Q18
4Q17
55% 52% 92%
50% 46% 87%
CABK NPL/coverage breakdown by collateral, 31 March 2018
32% 68%
1Q18
CABK
Coverage
80%
Coverage including appraised collateral
107%
Uncollateralised Collateralised
(1) Includes non-performing contingent liabilities (€501M in 1Q18, including BPI). Calculations factoring in the credit of BPI Vida under the BPI perimeter to provide a more accurate analysis of organic performance.(2) Portfolio sale of €104M NPLs in 1Q18.
NPL ratio down 90 bps in one year
NPL stock -4.3% ytd on continued asset quality improvement and portfolio sales(2)
NPL coverage up 5pp ytd with initial application of IFRS 9 in January lifting stock of provision funds by 11% (€758M)
-4.3%

26
Non-performing RE declines in a quarter with no block sales
Non-performing RE exposure RE inflows
6.3 6.3 6.1 5.9 5.8
1.3 1.1 1.1 0.9 0.9
7.67.4 7.2 6.9 6.7
1Q17 2Q17 3Q17 4Q17 1Q18
OREO portfolio
RE developers NPLs
CABK non-performing RE exposure(1), in €Bn net of provisions
-2.6%
OREO book coverage ratio 58%
Coverage w/accounting provisions only
50%
-11.8%
RE sales
Inflows (net of provisions) to OREO portfolio, in €M (CABK)
RE inflows down 11% yoy in a declining trend
RE sales +3.4% yoy on organic disposals
Portfolio sale to Testa (€228M) to be executed from 2Q
(1) CABK OREO portfolio net of provisions and non-performing RE developer loans net of specific provisions. BPI OREO portfolio net of provisions amounts to €47M as of 31st March 2018.
292
239212
1Q16 1Q17 1Q18
-11.3%
277
296306
1Q16 1Q17 1Q18
Asset quality
+3.4%
OREO sales, in €M (CABK)
-1.2%

27
Liquidity position remains strong with successful and continued access to the markets
Liquidity
HQLA Other assets eligibleas ECB collateral
Liquid assets
7319
54
Other liquidity metrics, as of 31 March 2018
14 12 13 15 14
3346
49 49 51
47
5863 64
65
Mar-17 Jun-17 Sep-17 Dec-17 Mar-18
Group liquidity metrics
Total liquid assets (Group), as of 31 March 2018 in €Bn
CABK liquidity metrics
Total liquid assets (CABK), in €Bn
HQLAs
Other assets eligible as ECB collateral
Recent issuances
(1) Average 12 months.(2) Including €2Bn from BPI. All TLTRO 2 except for €637 M TLTRO 1 from BPI.
Wholesale funding market issuances in 1Q18
158%
LCR (end of period)LTDLCR(1) TLTRO(2)
Intense activity in wholesale markets continues107%194% €28.8 Bn 206%
Issued in 1Q18€3.6 Bn
€1Bn @ SPGB -48 bps
10yr CoveredBond
€0.375Bn @ SPGB -48 bps
15yr CoveredBond
€1Bn @ SPGB +37 bps
5yr Senior Preferred
€1.25Bn @ 5.35% yield
AT1

28
Solvency metrics reinforced after AT1 and limited IFRS9 impact
Solvency
CET1 FL ratio evolution Capital ratios
(1) CABK CET1 phase-in ratio on a solo basis as of 31 March 2018 is 13.2%. BPI CET1 ratio as of 31 March 2018 is 11.4%, fully loaded and phase-in (11.9% on a solo basis). BPI figures exclude retained 1Q P&L.(2) Tier 1 capital ratio includes €1.25 Bn AT1 notes issued in March 2018, pending regulatory approval for eligibility as own funds. Total Capital ratio does not include €1.0 Bn Tier 2 notes issued in April 2018.(3) Transitional period not applied.(4) With no impact on 1Q solvency since it was already incorporated in YE2017 capital ratios.
Group(1)(2), in % as of 31 March 2018Group, in %, ytd
11.7% 11.6%(15 bps)
+24 bps (17 bps)
Dec-17 Mar-18
IFRS 9 Organic capital
generation
Val. Adj. & other
RWAs 148.6
CET1 17.3 17.2
148.3
In €Bn
Phase-in Fully loaded
CET1
Total Capital
Leverage ratio
Tier 1
T. Capital + SNPMREL-subordinated instr.
11.8% 11.6%
13.3% 13.1%
16.3% 16.1%
17.5% 17.2%
5.8% 5.7%
Strong organic capital generation…
… partly offsets impact from IFRS 9(3)
and other valuation adjustments, including AKZ devaluation
€1.25Bn AT1 issuance in March fills the 1.5% AT1 layer with cost-effective capital
Improved ratings from S&P, DBRS and Moody’s reflect CaixaBank’screditworthiness
Final dividend of 0.08€ p.s. paid in April for a total payout of 53% in 2017(4)

29
COMMERCIALACTIVITY
FINANCIAL RESULTS
BALANCE SHEET
FINALREMARKS
1. 2. 3. 4.
30
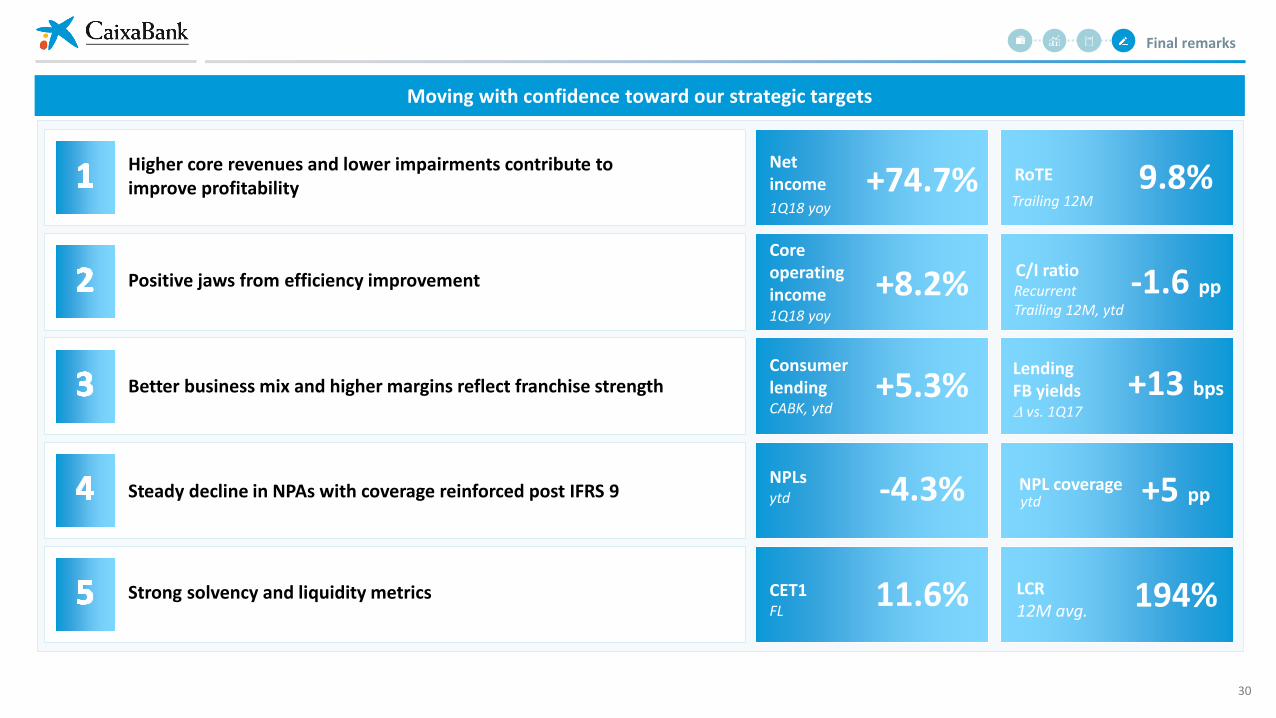
Moving with confidence toward our strategic targets
Final remarks
Higher core revenues and lower impairments contribute to improve profitability
Strong solvency and liquidity metrics
Better business mix and higher margins reflect franchise strength
Steady decline in NPAs with coverage reinforced post IFRS 9
Positive jaws from efficiency improvement
Net income +74.7% RoTE 9.8%
Core operating income +8.2%
C/I ratio -1.6 pp
Consumer lendingCABK, ytd
+5.3%LendingFB yields vs. 1Q17
+13 bps
NPLs ytd -4.3% NPL coverage +5 pp
CET1FL
11.6% LCR12M avg.
194%
1Q18 yoy
1Q18 yoy Trailing 12M
Recurrent Trailing 12M, ytd
ytd

31
[Appendix]

32
Reconciliation between BPI reported P&L and BPI Segment contribution to the Group
Appendix
P&L in €M
1Q18 reported by BPI
Consolidation adjustments
1Q18 BPI contributionto CABK Group
BPI segment
Investments segment
Net interest income 102 (7) 95 97 (2)
Dividends 0 0 0
Income from investments & associates (equity method) 109 (1) 108 2 106
Net fees and commissions 69 6 75 75
Trading income 67 10 77 17 60
Other operating income & expenses (1) (2) (3) (3)
Gross income 346 6 352 188 164
Operating expenses (111) (7) (118) (118)
Extraordinary operating expenses (3) (3) (3)
Pre-impairment income 232 (1) 231 67 164
Pre-impairment income without extraordinary expenses 235 (1) 234 70 164
Impairment losses 10 (10)
Other provisions
Gains/losses on asset disposals & others 0
Pre-tax income 242 (11) 231 67 164
Income tax (35) 6 (29) (18) (11)
Income from investments & associates 3 (3) 0
Profit for the period 210 (8) 202 49 153
Minority interests & other 33 33 9 24
Net income 210 (41) 169 40 129

33
Bancassurance segment
Customer funds
31st March2018
% ytd
I. On balance-sheet funds 229.3 1.1
Demand deposits 149.9 2.2
Time deposits 24.7 (9.2)
Subordinated liabilities 2.0 0.0
Insurance 50.6 1.3
Other funds 2.1
II. Assets under management 91.2 0.8
Mutual funds 61.6 1.3
Pension plans 29.6 (0.3)
III. Other managed resources 2.2 (30.8)
Total customer funds 322.7 0.7
Breakdown, in €Bn 31st March2018
% ytd
I. Loans to individuals 115.4 (0.5)
Residential mortgages 82.4 (0.8)
Other loans to individuals 33.0 0.2
II. Loans to businesses 72.1 (1.9)
Corporates and SMEs 66.9 (2.1)
Real Estate developers 5.1 0.7
Loans to individuals & businesses 187.5 (1.1)
III. Public sector 11.5 9.4
Total loans 199.0 (0.5)
Loan book
1Q18 % yoy
Net interest income 1,147 0.3
Net fees and commissions 551 1.5
Income and exp. from insurance 138 24.9
Other revenues 90 22.1
Trading 59 55.9
Dividends and equity accounted 52 14.3
Other income/expenses (21)
Gross income 1,926 2.9
Recurring operating expenses (1,001) 1.7
Extraordinary operating expenses
Pre-impairment income 925 4.6
LLPs (160) (40.9)
Other provisions (45) (79.2)
Gains/losses on disp. & other (4)
Pre-tax income 716 10.8
Income tax, minority interest & others (196) 81.5
Net attributed profit 520 (3.4)
Income Statement
In €M
Appendix
Breakdown, in €Bn

34
BPI segment
Customer funds
31st March2018
% ytd
I. On balance-sheet funds 20.6 (0.4)
Demand deposits 12.0 (0.1)
Time deposits 8.5 (0.8)
Subordinated liabilities (100.0)
Insurance
Other funds 0.1
II. Assets under management 6.0 (1.1)
Mutual funds 6.0 (1.1)
Pension plans
III. Other managed resources 2.0 (5.8)
Total customer funds 28.6 (1.0)
Breakdown, in €Bn 31st March2018
% ytd
I. Loans to individuals 12.6 0.7
Residential mortgages 11.1 0.3
Other loans to individuals 1.5 4.0
II. Loans to businesses 8.6 4.9
Corporates and SMEs 8.4 5.0
Real Estate developers 0.3 (0.4)
Loans to individuals & businesses 21.2 2.3
III. Public sector 1.4 (1.9)
Total loans 22.7 2.1
Loan book
1Q18 % qoq
Net interest income 97 (11.0)
Net fees and commissions 75 (8.5)
Income and exp. from insurance
Other revenues 16
Trading 17
Dividends and equity accounted 2
Other income/expenses (3)
Gross income 188 (0.5)
Recurring operating expenses (118) 3.5
Extraordinary operating expenses (3)
Pre-impairment income 67 (10.7)
LLPs
Other provisions
Gains/losses on disp. & other
Pre-tax income 67 (16.3)
Income tax, minority interest & others (27)
Net attributed profit 40 (11.1)
Income Statement
In €M
Appendix
Breakdown, in €Bn

35
Additional information on BFA contribution
1Q18 4Q17 3Q17 2Q17 1Q17In €M
Share of profit/(loss) of entities accounted for using the equity method 100 (68) 64 58 (57)
Stripping out extraordinary impacts(1) 21 51 64 58 40
Extraordinary impacts(1) 79 (119) (97)
Other (6)
Contribution by BFA before tax and minority interest 94 (68) 64 58 (57)
Attributable net contribution after tax and minority interest 72 (52) 49 44 (65)
Other impacts after tax on the equity of the Group(2) (132) 80 83
Appendix
(1) 1Q17 includes the attributable result deriving from BPI’s sale of 2% of its stake in BFA (€-97 million), largely the result of valuation adjustments due to conversion differences, previously reported in equity. 4Q17 includes, in accordance with IAS 29, an impact of €-76 million after applying the accumulative inflationary effects of the Angolan economy during the year to BFA’s financial statements. In 1Q18, the inflation impact was considered part of the non-extraordinary results reported by BFA.
(2) The amount in 1Q17 derives from valuation adjustments due to conversion differences, transferred to P&L at the moment of the sale by BPI of the 2% stake in BFA. 4Q17 includes among other effects, the impact of the inflationary effects of Angola’s economy (€76 million, gross). In 1Q18, the heading includes the impact of the devaluation of the Angolan currency, among other factors.

36
Refinanced loans
Appendix
As of 31 March, 2018 (€Bn) Group
Total O/W NPLs
Individuals(1) 6.0 3.9
Businesses (ex-RE) 4.6 2.7
RE developers 1.2 0.9
Public Sector 0.3 0.0
Total 12.0 7.6
Of which: Total Non-RE 10.8 6.7
Provisions 3.1 2.8
(1) Including self-employed.
37
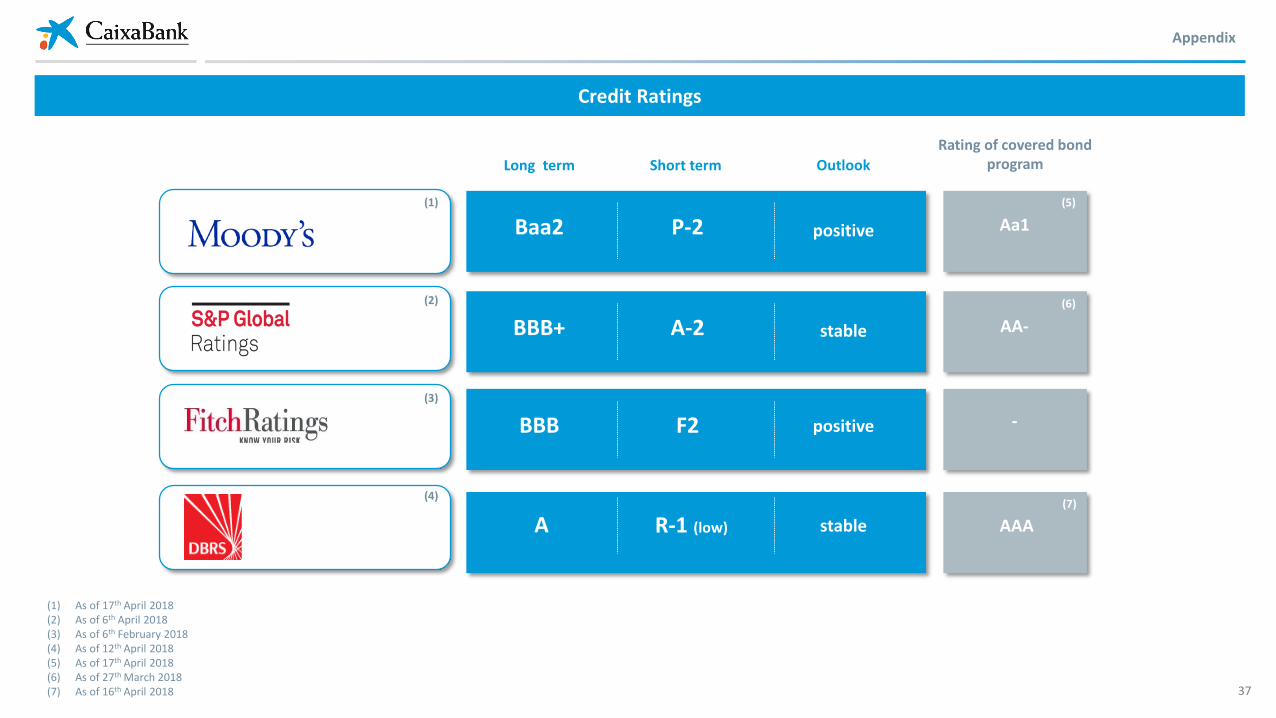
Credit Ratings
Appendix
(1) As of 17th April 2018(2) As of 6th April 2018(3) As of 6th February 2018(4) As of 12th April 2018(5) As of 17th April 2018(6) As of 27th March 2018(7) As of 16th April 2018
Baa2
BBB+
BBB
P-2
A-2
F2
positive
positive
Long term Short term Outlook
stable
A R-1 (low) stable
(2)
(1)
(3)
(4)
AAA
Rating of covered bond program
Aa1
AA-
-
(6)
(5)
(7)
38
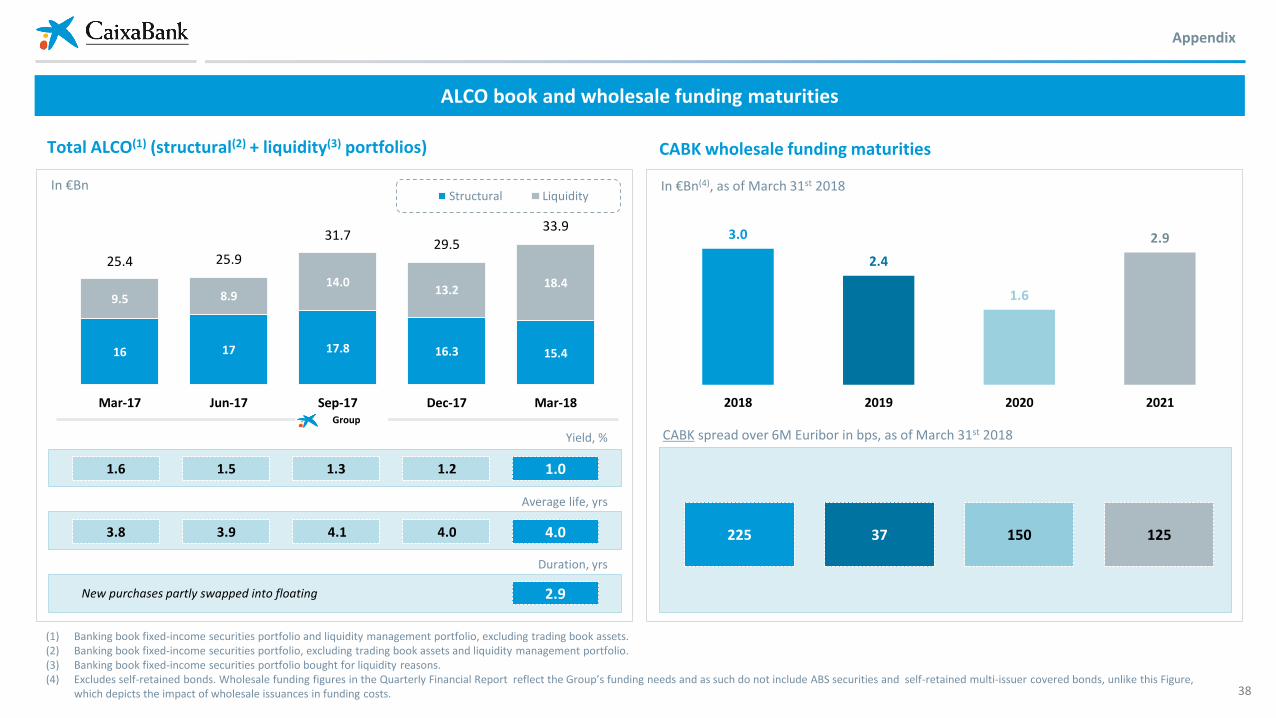
ALCO book and wholesale funding maturities
Appendix
16 17 17.8 16.3 15.4
9.5 8.914.0
13.218.4
25.4 25.9
31.729.5
33.9
Mar-17 Jun-17 Sep-17 Dec-17 Mar-18
Structural Liquidity
Yield, %
Duration, yrs
New purchases partly swapped into floating 2.9
Average life, yrs
1.51.6 1.01.3
3.93.8 4.1
Group
(1) Banking book fixed-income securities portfolio and liquidity management portfolio, excluding trading book assets.(2) Banking book fixed-income securities portfolio, excluding trading book assets and liquidity management portfolio.(3) Banking book fixed-income securities portfolio bought for liquidity reasons.(4) Excludes self-retained bonds. Wholesale funding figures in the Quarterly Financial Report reflect the Group’s funding needs and as such do not include ABS securities and self-retained multi-issuer covered bonds, unlike this Figure,
which depicts the impact of wholesale issuances in funding costs.
Total ALCO(1) (structural(2) + liquidity(3) portfolios)
1.2
4.0 4.0
CABK wholesale funding maturities
3.0
2.4
1.6
2.9
2018 2019 2020 2021
CABK spread over 6M Euribor in bps, as of March 31st 2018
225 37 150 125
In €Bn In €Bn(4), as of March 31st 2018

39
In addition to the financial information prepared in accordance with International Financial Reporting Standards (IFRS), this document includes certain Alternative Performance Measures (APMs) as defined in the guidelines on Alternative Performance Measures issued by the European Securities and Markets Authority on 30 June 2015 (ESMA/2015/1057) (the “ESMA Guidelines”). CaixaBank uses certain APMs, which have not been audited, for a better understanding of the company's financial performance. These measures are considered additional disclosures and in no case replace the financial information prepared under IFRSs. Moreover, the way the Group defines and calculates these measures may differ to the way similar measures are calculated by other companies. Accordingly, they may not be comparable. ESMA guidelines define an APM as a financial measure of historical or future performance, financial position, or cash flows, other than a financial measure defined or specified in the applicable financial reporting framework. In accordance with these guidelines, following is a list of the APMs used, along with a reconciliation between certain management indicators and the indicators presented in the consolidated financial statements prepared under IFRS.
Glossary (I/V)
Term Definition
AFS Available for sale
ALCO Asset – Liability Committee
ALCO liquidity portfolio Banking book fixed-income securities portfolio bought for liquidity reasons
ALCO structural portfolio Banking book fixed-income securities portfolio, excluding trading book assets and liquidity management portfolio
AT1 Additional Tier 1
AuM / AM Assets under Management including mutual funds and pension plans
B/S Balance sheet
BoS Bank of Spain
C/I ratio Cost-to-income ratio: administrative expenses, depreciation and amortisation divided by gross income (last 12 months)
C/I ratio (recurrent) Cost-to-income ratio stripping out extraordinary expenses: administrative expenses, depreciation and amortisation stripping out extraordinary expenses divided by gross income (last 12 months)
CAGR Compound Annual Growth Rate
CET1 Common Equity Tier 1
CIB Corporate and Institutional Banking division
Consumer loans Loans to individuals with personal guarantee, excluding those for home purchases. Includes personal loans from CaixaBank, MicroBank and CaixaBank Consumer Finance as well as credit cards (CaixaBank Payments) except for float.
CoR Cost of risk: total allowances for insolvency risk divided by average of gross loans plus contingent liabilities, using management criteria
Core operating income Core revenues minus recurrent costs
Core revenues Sum of NII, Fees and other revenues from insurance (life-risk premia and equity accounted income from SegurCaixa Adeslas). Since 4Q17 it also includes equity accounted income from insurance companies of BPI
Appendix
40
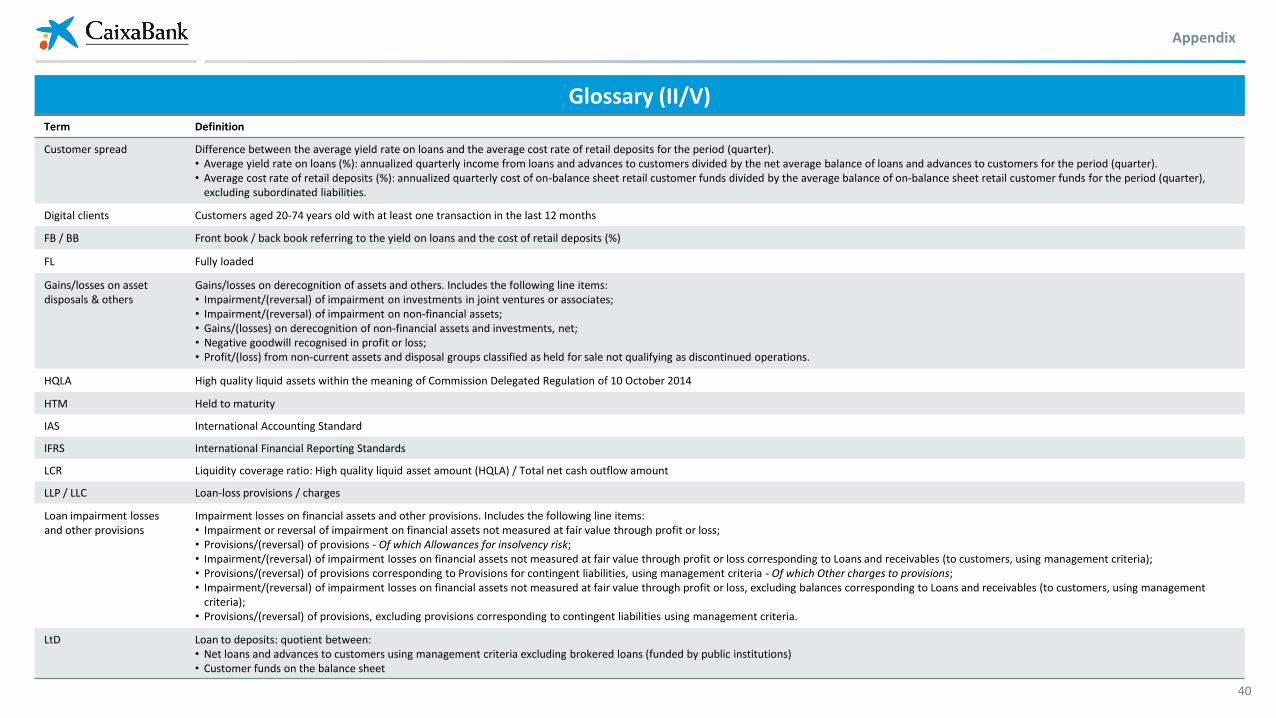
Glossary (II/V)Term Definition
Customer spread Difference between the average yield rate on loans and the average cost rate of retail deposits for the period (quarter).• Average yield rate on loans (%): annualized quarterly income from loans and advances to customers divided by the net average balance of loans and advances to customers for the period (quarter).• Average cost rate of retail deposits (%): annualized quarterly cost of on-balance sheet retail customer funds divided by the average balance of on-balance sheet retail customer funds for the period (quarter),
excluding subordinated liabilities.
Digital clients Customers aged 20-74 years old with at least one transaction in the last 12 months
FB / BB Front book / back book referring to the yield on loans and the cost of retail deposits (%)
FL Fully loaded
Gains/losses on asset disposals & others
Gains/losses on derecognition of assets and others. Includes the following line items:• Impairment/(reversal) of impairment on investments in joint ventures or associates;• Impairment/(reversal) of impairment on non-financial assets;• Gains/(losses) on derecognition of non-financial assets and investments, net;• Negative goodwill recognised in profit or loss;• Profit/(loss) from non-current assets and disposal groups classified as held for sale not qualifying as discontinued operations.
HQLA High quality liquid assets within the meaning of Commission Delegated Regulation of 10 October 2014
HTM Held to maturity
IAS International Accounting Standard
IFRS International Financial Reporting Standards
LCR Liquidity coverage ratio: High quality liquid asset amount (HQLA) / Total net cash outflow amount
LLP / LLC Loan-loss provisions / charges
Loan impairment losses and other provisions
Impairment losses on financial assets and other provisions. Includes the following line items:• Impairment or reversal of impairment on financial assets not measured at fair value through profit or loss;• Provisions/(reversal) of provisions - Of which Allowances for insolvency risk;• Impairment/(reversal) of impairment losses on financial assets not measured at fair value through profit or loss corresponding to Loans and receivables (to customers, using management criteria);• Provisions/(reversal) of provisions corresponding to Provisions for contingent liabilities, using management criteria - Of which Other charges to provisions;• Impairment/(reversal) of impairment losses on financial assets not measured at fair value through profit or loss, excluding balances corresponding to Loans and receivables (to customers, using management
criteria);• Provisions/(reversal) of provisions, excluding provisions corresponding to contingent liabilities using management criteria.
LtD Loan to deposits: quotient between:• Net loans and advances to customers using management criteria excluding brokered loans (funded by public institutions)• Customer funds on the balance sheet
Appendix

41
Glossary (III/V)Term Definition
Minority interests & other Profit/(loss) attributable to minority interests and others. Includes the following line items:• Profit/(loss) after tax from discontinued operations; • Profit/(loss) for the period attributable to minority interests (non-controlling interests).
MREL Minimum Requirement for own funds and Eligible Liabilities
Mutual funds Includes own and third-party funds, SICAVs and managed portfolios
N/M Non meaningful.
Net fees and commissions Net fee and commission income. Includes the following line items:• Fee and commission income;• Fee and commission expenses
NII Net interest income
NIM Net interest margin, also Balance sheet spread: difference between the average return rate on assets and the average cost of fund rate for the period (quarter).• Average return rate on assets (%): annualized quarterly interest income divided by average total assets for the period (quarter).• Average cost of fund rate (%): annualized quarterly interest expenses divided by average total liabilities for the period (quarter).
Non-performing RE exposure
OREO portfolio net of provisions and non-performing RE developer loans net of provisions
NPA Non-performing assets: including non-performing loans and repossessed real estate assets available for sale (gross book value)
NPA coverage ratio Quotient between:• Sum of impairment allowances on loans to customers and contingent liabilities, using management criteria, plus total OREO coverage (sum of loan write-downs at the foreclosure plus accounting provisions of
OREO assets)• Sum of total gross loans to customers and contingent liabilities, using management criteria, plus debt cancelled at the foreclosure (sum of net book value and total coverage of OREO assets )
NPL coverage ratio Quotient between:• Impairment allowances on loans to customers and contingent liabilities, using management criteria• Non-performing loans and advances to customers and contingent liabilities, using management criteria
NPL ratio Non-performing loan ratio: quotient between:• Non-performing loans and advances to customers and contingent liabilities, using management criteria• Total gross loans to customers and contingent liabilities, using management criteria
OCI Other comprehensive income is those revenues, expenses, gains, and losses under both Generally Accepted Accounting Principles and International Financial Reporting Standards that are excluded from net income on the income statement. Instead it is registered under the equity section of the balance sheet
Appendix

42
Glossary (IV/V)Term Definition
Operating expenses Includes the following line items:• Administrative expenses;• Depreciation and amortisation.
OREO Other Real Estate Owned: repossessed real estate assets available for sale
OREO coverage ratio Quotient between:• Gross cancelled debt at foreclosure minus current net book value of real estate assets• Gross cancelled debt at foreclosure
OREO coverage ratio with accounting provisions
Quotient between:• Accounting provision: charges to provisions of foreclosed assets• Book value of the foreclosed asset: sum of net carrying amount and the accounting provision
P&L Profit and Loss Account
Pre-impairment income (+) Gross income;(-) Operating expenses
RE Real Estate
ROTE Return on tangible equity: profit attributable to the Group divided by average equity less, where applicable, intangible assets using management criteria (last 12 months).The value of intangible assets under management criteria is the value of Intangible assets in the public balance sheet, plus the intangible assets and goodwill associated with investees, net of impairment allowances, recognised in Investments in joint ventures and associates in the public balance sheet.Profit attributable to the Group adjusted to reflect the amount of the Additional Tier1 coupon, after tax, registered in equity.
RWAs Risk Weighted Assets
SMEs Small and medium enterprises
SNP Senior non preferred debt
SPGB Spanish Government Bonds
SREP Supervisory Review and Evaluation Process
TLTRO Targeted long-term refinancing operation conducted by the European Central Bank
Total liquid assets sum of HQLAs (High Quality Liquid Assets within the meaning of Commission Delegated Regulation of 10 October 2014) plus the available balance under the facility with the Central Bank (non-HQLA).
Appendix

43
Glossary (V/V)Term Definition
Trading income Gains/(losses) on financial assets and liabilities and others. Includes the following line items: • Gains/(losses) on derecognition of financial assets and liabilities not measured at fair value through profit or loss, net;• Gains/(losses) on financial assets and liabilities held for trading, net;• Gains/(losses) from hedge accounting, net;• Exchange rate differences, gains/(losses), net.
VIF Value-in-force reinsurance contract with Berkshire Hathaway (started in November 2012 and finalized in November 2016)
Appendix

44
+34 93 411 75 03
Av. Diagonal, 621-629 - BarcelonaPº Castellana, 51 - Madrid
Investor Relations
Pintor Sorolla, 2-446002 Valencia
www.CaixaBank.com