1Q 2017 Investor Update - Amazon Web Services · 1Q 2017 Investor Update. ... RKI E&P. 92,000...
27
Rick Muncrief, Chairman and Chief Executive Officer May 4, 2017 1Q 2017 Investor Update
Transcript of 1Q 2017 Investor Update - Amazon Web Services · 1Q 2017 Investor Update. ... RKI E&P. 92,000...

Rick Muncrief, Chairman and Chief Executive OfficerMay 4, 2017
1Q 2017 Investor Update

Foundation in Place for Enhancing and Accelerating Value
► POSITIONED
► PRUDENT
► FLEXIBLE
► DISCIPL INED
WILLISTON BASIN
DELAWARE BASIN
SAN JUAN BASIN
HEADQUARTERS: TULSA
2
1Q Highlights
3
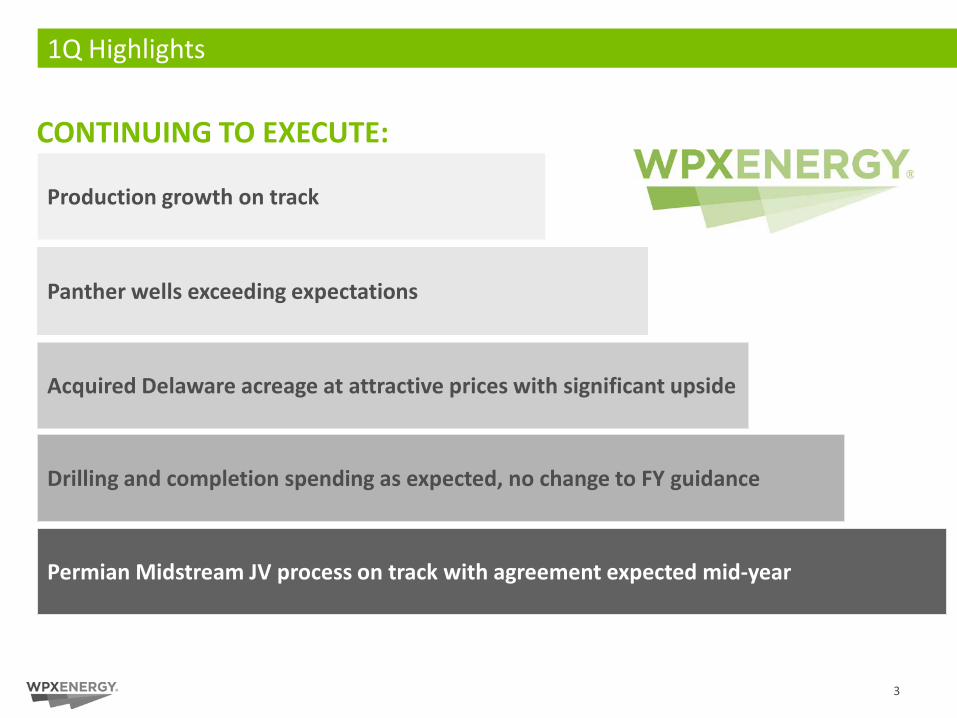
Panther wells exceeding expectations
Acquired Delaware acreage at attractive prices with significant upside
Drilling and completion spending as expected, no change to FY guidance
Permian Midstream JV process on track with agreement expected mid-year
CONTINUING TO EXECUTE:
Production growth on track
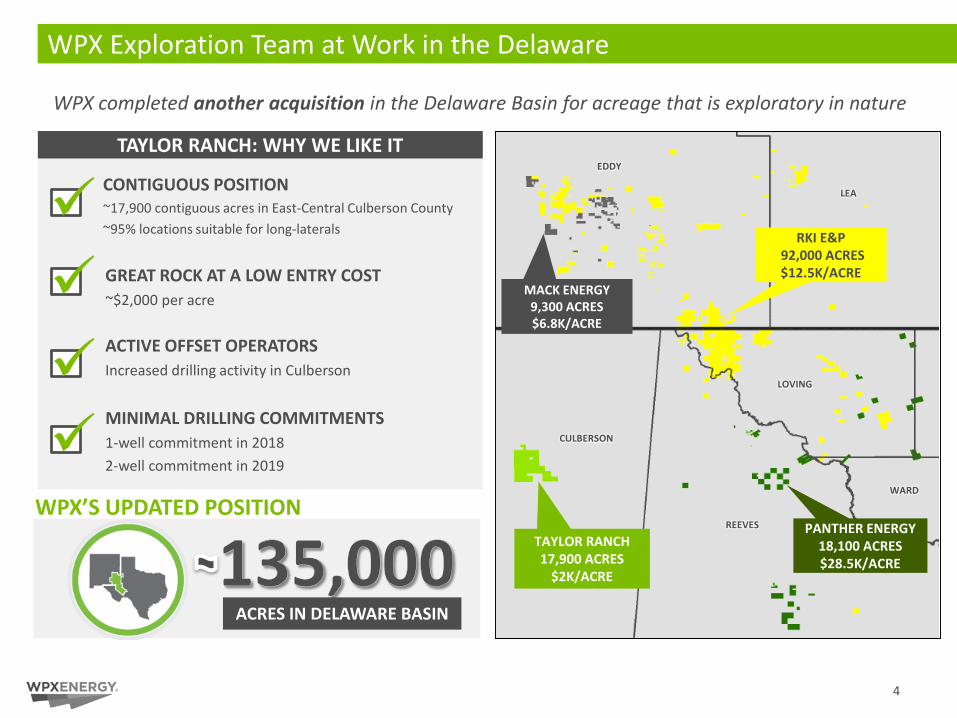
WPX completed another acquisition in the Delaware Basin for acreage that is exploratory in nature
4
WPX Exploration Team at Work in the Delaware
GREAT ROCK AT A LOW ENTRY COST~$2,000 per acre
MINIMAL DRILLING COMMITMENTS1-well commitment in 20182-well commitment in 2019
CONTIGUOUS POSITION ~17,900 contiguous acres in East-Central Culberson County~95% locations suitable for long-laterals
TAYLOR RANCH: WHY WE LIKE IT
ACRES IN DELAWARE BASIN
WPX’S UPDATED POSITION
ACTIVE OFFSET OPERATORS Increased drilling activity in Culberson
RKI E&P92,000 ACRES$12.5K/ACRE
PANTHER ENERGY 18,100 ACRES$28.5K/ACRE
MACK ENERGY 9,300 ACRES$6.8K/ACRE
TAYLOR RANCH17,900 ACRES
$2K/ACRE
CULBERSON
LEA
EDDY
WARD
REEVES
LOVING

Clay Gaspar, Chief Operating Officer
Operational Update

6
Delaware Basin: Encouraging Early Results from CBR Spacing Test
10H 11H 12H 13H 15H 17H
• Best representation of full section development and the tightest spacing for Wolfcamp A pad development
• Vertically and laterally bounded wells in both landing zones
• WPX will use the results of the spacing test to maximize its Wolfcamp A development program
• 30-day production averaging 1,538 BOE/D per well1 and total cumulative production exceeds 250,000 bbls of oil to date
• Initial flowing tubing pressure of ~3,000 PSI per well.
• Minimal fracture interference between the nine wells or with offset wells during testing
CBR SPACING TEST UPDATE
CBR 9 WELL SPACING TEST: LOVING COUNTY, TX
WOLFCAMP B
LOWER WOLFCAMP A
UPPER WOLFCAMP A
WOLFCAMP X/Y
1 MILE
350
FT
10H 11H 12H 13H 15H 17H
14H 16H 18H
1 On a three-stream basis, post cleanout
•

1. MAC STATE: 30 DAY AVG: 2,234 BOE/D1,2 (56% OIL)
2. LOUIS STATE: 30 DAY AVG: 2,173 BOE/D1,2 (55% OIL)
3. FIVER STATE: 30 DAY AVG: 1,914 BOE/D1,2 (55% OIL)
4. TITAN STATE: 30 DAY AVG: 1,987 BOE/D1,2 (53% OIL)
7
Central Reeves Wolfcamp A Outperforming
REEVES
12
34
1000 MBOE EUR (WOLFCAMP A)
MAC STATE LOUIS STATE TITAN STATEFIVER STATE
LOVING
WARD
N E W M E X I C O
T E X A S
1 One-mile laterals on a three-stream basis 2 Post cleanout

Williston Basin: Strong, Consistent Results
BEHR PAD AVERAGE
CARIBOU PAD AVERAGE
850 MBOE EUR
GRIZZLY PAD AVERAGE
FIRST QUARTER WELL RESULTS
BEHR PAD AVG 30 DAY RATE: 1,375 BOE/D (80% oil)
GRIZZLY PAD AVG 30 DAY RATE: 1,703 BOE/D (80% oil)
CARIBOU PAD AVG 30 DAY RATE: 2,145 BOE/D (80% oil)
STRONG INITIAL RESULTS1
The highest single well peak rate among the nine was 3,343 BOE/D (81% oil) on the Grizzly 24-13HG
0
20
40
60
80
100
120
140
0 30 60 90 120
CUM
MBO
E
DAYS ON
1 On a three-stream basis, post cleanout 8

SAN JUAN GALLUP ACTIVITY UPDATE
• Focused development in 2017 in the West Lybrook Unit• 58 approved drilling permits in Gallup Oil• 2 additional units (12,000 acres) in the approval process• 26 miles of pipeline installed YTD (oil/gas/water)
• New basin drilling record • 6,258-ft lateral drilled in a 24-hour period• 5.8 day 1.5 mile lateral well drilling record
• 14 new spuds for 2017 (utilizing 2 and 6-well pads)• 5 wells completed in April and bringing on production• 713H initial production: 1,410 BOE/D (74% oil)
9
2016: “6 WELL PAD”
DRILLING LATERALSWAITING ON DRILL OUT
WEST LYBROOK UNITAverage lateral length: 7,790’
WELLS ARE PRODUCING
SAN JUAN
SANDOVAL
RIO ARRIBA
San Juan Basin: Getting Back to Work

Kevin Vann, Chief Financial Officer
Financial Update
1Q YTD2017 2016 2017 2016
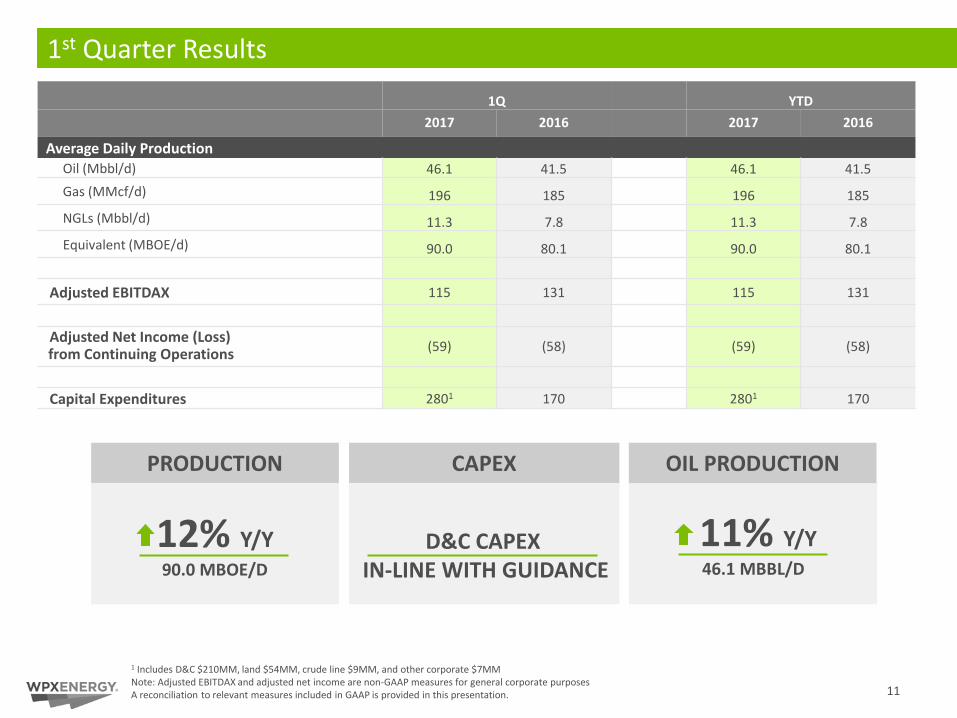
Average Daily ProductionOil (Mbbl/d) 46.1 41.5 46.1 41.5 Gas (MMcf/d) 196 185 196 185 NGLs (Mbbl/d) 11.3 7.8 11.3 7.8 Equivalent (MBOE/d) 90.0 80.1 90.0 80.1
Adjusted EBITDAX 115 131 115 131
Adjusted Net Income (Loss) from Continuing Operations (59) (58) (59) (58)
Capital Expenditures 2801 170 2801 170
Dollars in millions, except production numbers1st Quarter Results
1 Includes D&C $210MM, land $54MM, crude line $9MM, and other corporate $7MMNote: Adjusted EBITDAX and adjusted net income are non-GAAP measures for general corporate purposesA reconciliation to relevant measures included in GAAP is provided in this presentation.
PRODUCTION
12% Y/Y90.0 MBOE/D
CAPEX
11% Y/Y46.1 MBBL/D
11
D&C CAPEX IN-LINE WITH GUIDANCE
OIL PRODUCTION
0%
20%
40%
60%
80%
100%
Oil Natural Gas
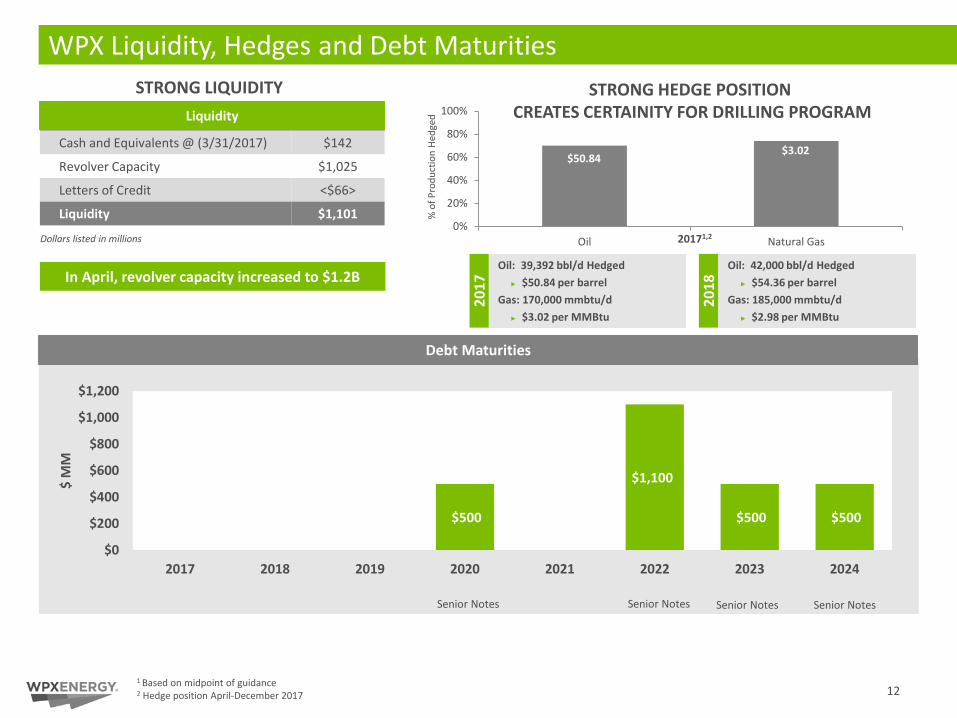
WPX Liquidity, Hedges and Debt Maturities
Cash and Equivalents @ (3/31/2017) $142
Revolver Capacity $1,025
Letters of Credit <$66>
Liquidity $1,101
Debt Maturities
Senior Notes Senior Notes Senior NotesSenior Notes
$50.84
% o
f Pro
duct
ion
Hedg
ed $3.93
1 Based on midpoint of guidance2 Hedge position April-December 2017
20171,2
STRONG HEDGE POSITION CREATES CERTAINITY FOR DRILLING PROGRAM
Oil: 42,000 bbl/d Hedged► $54.36 per barrel
Gas: 185,000 mmbtu/d► $2.98 per MMBtu
Oil: 39,392 bbl/d Hedged► $50.84 per barrel
Gas: 170,000 mmbtu/d► $3.02 per MMBtu
2018
2017
Liquidity
Dollars listed in millions
STRONG LIQUIDITY
$3.02
12
$500
$1,100
$500 $500
$0
$200
$400
$600
$800
$1,000
$1,200
2017 2018 2019 2020 2021 2022 2023 2024
$ M
M
In April, revolver capacity increased to $1.2B

13
TRACK RECORD OF EXECUTION

Appendix

Production FY 2017
Oil Mbbl/d 52.0 – 56.0Natural Gas MMcf/d 220 – 230NGL Mbbl/d 14.0 – 19.0Total MBOE/d 103 – 113
Expenses FY 2017
$ per BOELOE $4.75 – $5.25GP&T 2.00 – 2.50
Production Tax 2.25 – 2.75
Cash Operating $9.00 – $10.50
DD&A $20.00 – $21.00
$ in MillionsG&A – Cash $110 – $120G&A – Non Cash $30 – $40Exploration7 $30 – $40 Interest Expense $185 – $195
2017 Full-Year Guidance
Tax Rate FY 2017
Tax Provision6 33% – 37%
Net Realized Price5 FY 2017
NGL – % of WTI 23% – 28%
Cap Ex ($ in Millions) FY 2017
Delaware $480 – $510Williston 240 – 260San Juan 150 – 170Total D&C Capital2 $870 – $940Delaware Infrastructure 35 – 45Total3 $905 – $985
1 Based on the mid-point of guidance. 2 Includes non-operated wells and wells which include additional science work.3 Excludes any acquisition and land capital.4 Average price differentials ranges for oil and natural gas exclude hedges, but include basis differential and revenue adjustments.5 Percentage of realized price ranges for NGLs excludes hedges, but includes basis differential and revenue adjustments.6 Rate does not reflect potential valuation allowance on deferred tax assets.7 Excludes impairments and lease expiration expense.
Avg. Price Differentials4 FY 2017
Oil – WTI per barrel ($6.00) – ($7.00)NYMEX – Nat. Gas (Mcf) ($0.60) – ($0.80)
15
D&C96%
Infrastructure4%
TOTAL CAPITAL EXPENDITURES1
$905-$985 MM
TOTAL D&C CAPITAL1
$870-$940 MM
Delaware55%San Juan
18%
Williston27%
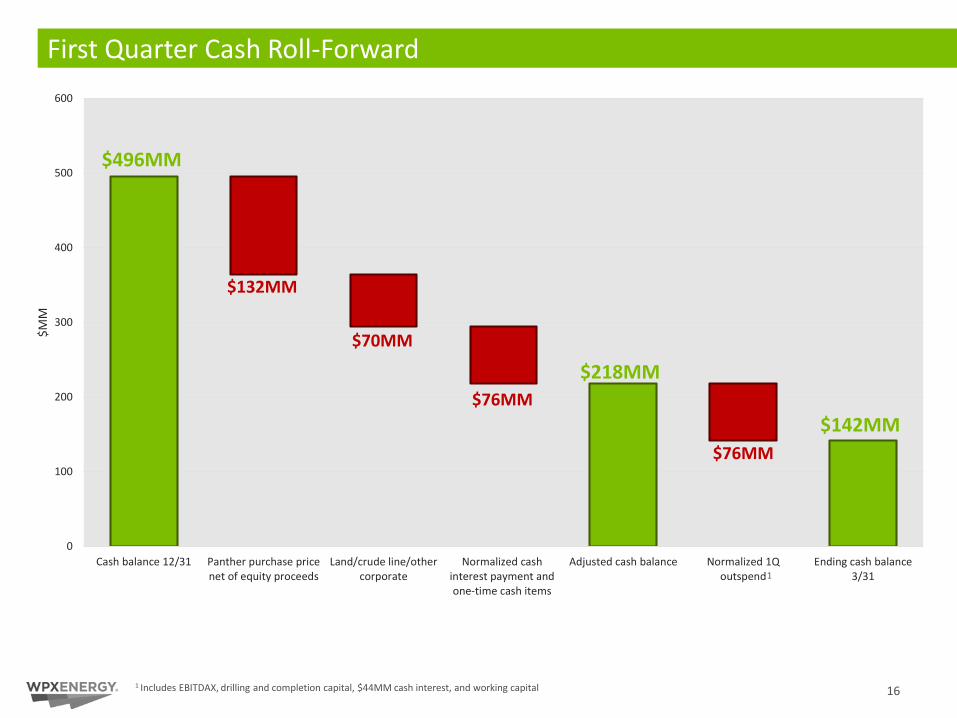
0
100
200
300
400
500
600
Cash balance 12/31 Panther purchase pricenet of equity proceeds
Land/crude line/othercorporate
Normalized cashinterest payment andone-time cash items
Adjusted cash balance Normalized 1Qoutspend
Ending cash balance3/31
$MM
16
First Quarter Cash Roll-Forward
$496MM
$218MM
$142MM
$132MM
$70MM
$76MM
$76MM
1 Includes EBITDAX, drilling and completion capital, $44MM cash interest, and working capital
1
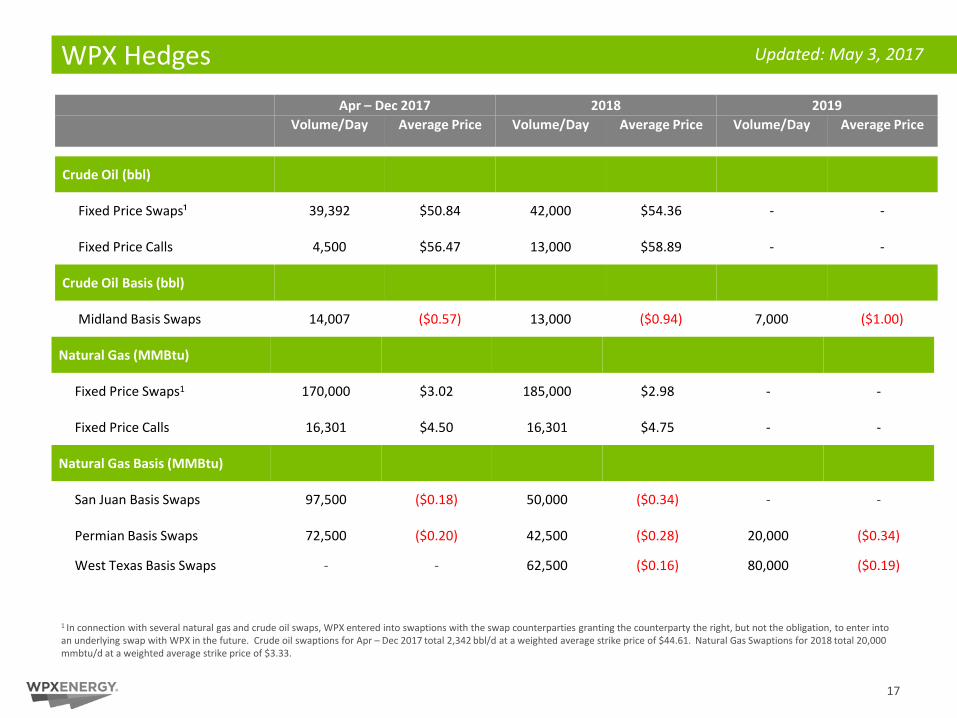
WPX Hedges Apr – Dec 2017 2018 2019
Volume/Day Average Price Volume/Day Average Price Volume/Day Average Price
1 In connection with several natural gas and crude oil swaps, WPX entered into swaptions with the swap counterparties granting the counterparty the right, but not the obligation, to enter into an underlying swap with WPX in the future. Crude oil swaptions for Apr – Dec 2017 total 2,342 bbl/d at a weighted average strike price of $44.61. Natural Gas Swaptions for 2018 total 20,000 mmbtu/d at a weighted average strike price of $3.33.
Natural Gas (MMBtu)
Fixed Price Swaps1 170,000 $3.02 185,000 $2.98 - -
Fixed Price Calls 16,301 $4.50 16,301 $4.75 - -
Natural Gas Basis (MMBtu)
San Juan Basis Swaps 97,500 ($0.18) 50,000 ($0.34) - -
Permian Basis Swaps 72,500 ($0.20) 42,500 ($0.28) 20,000 ($0.34)
West Texas Basis Swaps - - 62,500 ($0.16) 80,000 ($0.19)
Crude Oil (bbl)
Fixed Price Swaps¹ 39,392 $50.84 42,000 $54.36 - -
Fixed Price Calls 4,500 $56.47 13,000 $58.89 - -
Crude Oil Basis (bbl)
Midland Basis Swaps 14,007 ($0.57) 13,000 ($0.94) 7,000 ($1.00)
Updated: May 3, 2017
17
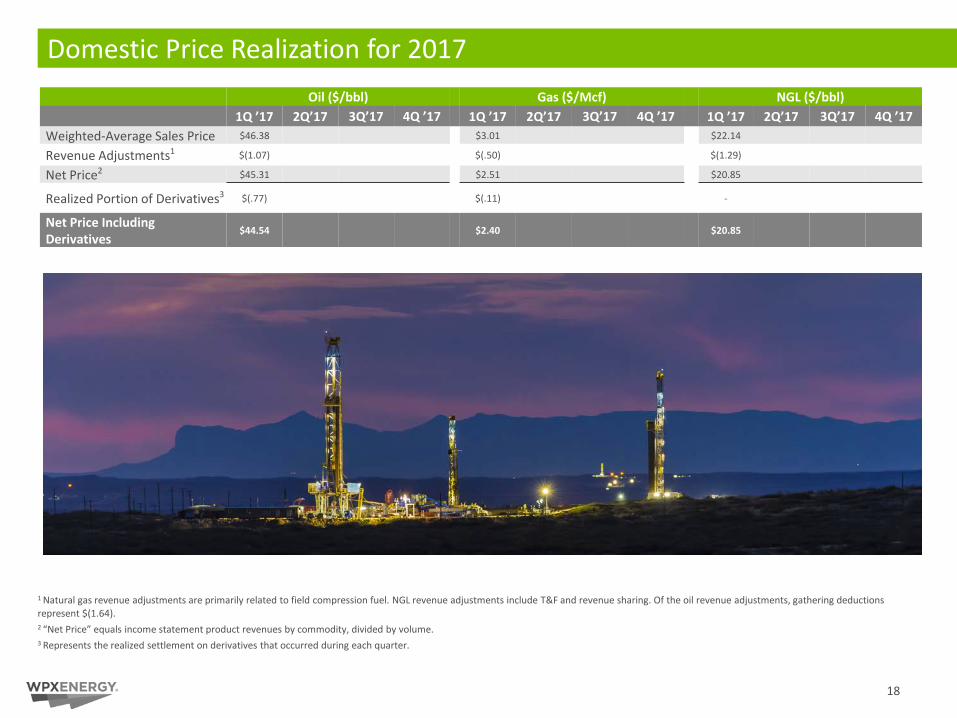
Domestic Price Realization for 2017Oil ($/bbl) Gas ($/Mcf) NGL ($/bbl)
1Q ’17 2Q’17 3Q’17 4Q ’17 1Q ’17 2Q’17 3Q’17 4Q ’17 1Q ’17 2Q’17 3Q’17 4Q ’17 Weighted-Average Sales Price $46.38 $3.01 $22.14
Revenue Adjustments1 $(1.07) $(.50) $(1.29)
Net Price2 $45.31 $2.51 $20.85
Realized Portion of Derivatives3 $(.77) $(.11) -
Net Price Including Derivatives
$44.54 $2.40 $20.85
1 Natural gas revenue adjustments are primarily related to field compression fuel. NGL revenue adjustments include T&F and revenue sharing. Of the oil revenue adjustments, gathering deductions represent $(1.64).2 “Net Price” equals income statement product revenues by commodity, divided by volume.3 Represents the realized settlement on derivatives that occurred during each quarter.
18

1 Does not include Taylor Ranch locations2 Includes non-op and operated locations3 Based on FY2016 Production4 Includes 1st sales from Panther acquisition
► ~135,000 net acres
► ~6,400+ gross locations1,2
► Commodity mix3
► 54% oil► 30% natural gas► 16% NGLs
► Available sales outlets► Holley Frontier’s Artesia, NM Refinery ► Western’s El Paso Refinery ► Gulf Coast► Cushing► Midland
Delaware Overview
19
26-32
3Q’17
14
1Q’17
15-18
2Q’17
30-36
4Q’17EXPECTED WELLS ON 1ST SALES4 CULBERSON
LEA
EDDY
WARD
REEVES
LOVING
PECOS
WINKLER
CHAVES
WPX OPERATED ACREAGE
NON-OP ACREAGE
N E W M E X I C O
T E X A S

Williston Basin
20
WILLIAMS
MOUNTRAIL
MCKENZIE
DUNN
MCLEAN
MERCER
► ~85,000 net acres
► ~570 gross locations► ~500 operated locations► ~70 non-op locations
► Commodity mix1
► 83% oil► 9% natural gas► 8% NGLs
► Available sales outlets► Clearbrook, Minn. (WTI)► Guernsey, Wyo. (WTI)► Local refining markets► Rail to all coastal markets
(Brent, LLS, WTI)
1 Based on FY2016 production
DIVIDE BURKE
WPX OPERATED ACREAGE
NON-OP ACREAGE
11-14
3Q’17
9
1Q’17
11-14
2Q’17
8-10
4Q’17EXPECTED WELLS ON 1ST SALES

San Juan Basin
21
LA PLATA
RIO ARRIBA
SAN JUAN
ARCHULETA
C O L O R A D O
N E W M E X I C O
SANDOVAL
OIL WINDOW~105,000 acres~3352 locations
GAS WINDOW1
~130,000 acres~4,300 locations
► ~235,000 net acres► Oil window: ~105,000 acres► Gas window: ~130,000 acres1
► ~4,635 total gross locations1
► Oil window: ~3352
► Gas window: ~4,300
► Commodity mix3
► Oil window► Oil: 47%► NGLs: 22%► Gas: 31%
► Available sales outlets► Oil: Local refining markets or rail
(WTI, Brent, LLS)► Gas: Blanco Hub
1 Includes non-op and operated 2 Assumes average lateral length of 7,000' 3 Based on FY2016 production
► Gas window► Natural gas: 99%► NGLs: 1%
WPX OPERATED ACREAGE
NON-OP ACREAGE
12-14
3Q’17
0
1Q’17
10-12
2Q’17
10-12
4Q’17EXPECTED WELLS ON 1ST SALES

22
Consolidated Statement of Operations (GAAP)2016 2017
(Dollars in millions) 1Q 2Q 3Q 4Q YTD 1Q 2Q 3Q 4Q YTD
Revenues:Product revenues:
Oil sales $ 97 $ 142 $ 139 $ 173 $ 551 $ 188 $ 188 Natural gas sales 25 24 37 39 125 44 44 Natural gas liquid sales 5 10 12 19 46 21 21
Total product revenues 127 176 188 231 722 253 253 Net gain (loss) on derivatives 57 (154) 38 (148) (207) 203 203 Gas management 31 116 25 5 177 5 5 Other 1 - - - 1 - -
Total revenues 216 138 251 88 693 461 461
Costs and expenses:Depreciation, depletion and amortization 152 163 150 158 623 147 147 Lease and facility operating 42 41 40 40 163 48 48
Gathering, processing and transportation 16 20 19 21 76 21 21 Taxes other than income 11 16 14 19 60 19 19 Exploration 9 12 10 11 42 39 39 General and administrative 53 55 51 55 214 43 43 Gas management 39 132 31 6 208 5 5 Net (gain) loss on sales of assets and divestment of transportation contracts (198) (4) 227 (3) 22 (35) (35)Other-net 2 2 10 2 16 4 4
Total costs and expenses 126 437 552 309 1,424 291 291
Operating income (loss) 90 (299) (301) (221) (731) 170 170
Interest expense (57) (53) (49) (48) (207) (47) (47)
Investment income and other 2 (1) - - 1 2 2
Income (loss) from continuing operations before income taxes $ 35 $ (353) $ (350) $ (269) $ (937) $ 125 $ 125
Provision (benefit) for income taxes 35 (130) (132) (98) (325) 31 31
Income (loss) from continuing operations $ - $ (223) $ (218) $ (171) $ (612) $ 94 $ 94
Income (loss) from discontinued operations (12) 25 (1) (1) 11 (2) (2)
Net income (loss) $ (12) $ (198) $ (219) $ (172) $ (601) $ 92 $ 92
Less: Dividends on preferred stock 5 6 4 3 18 4 4
Less: Loss on induced conversion of preferred stock - - 22 - 22 - -
Net income (loss) available to WPX Energy, Inc. common stockholders $ (17) $ (204) $ (245) $ (175) $ (641) $ 88 $ 88
Amounts available to WPX Energy, Inc. common stockholders:
Income (loss) from continuing operations $ (5) $ (229) $ (244) $ (174) $ (652) $ 90 $ 90
Income (loss) from discontinued operations (12) 25 (1) (1) 11 (2) (2)
Net income (loss) $ (17) $ (204) $ (245) $ (175) $ (641) $ 88 $ 88

Reconciliation-Adjusted Income (Loss) from Continuing Operations (Unaudited)
2016 2017
(Dollars in millions, except per share amounts) 1Q 2Q 3Q 4Q YTD 1Q 2Q 3Q 4Q YTD
Income (loss) from continuing operations available to WPX Energy, Inc. common stockholders $ (5) $ (229) $ (244) $ (174) $ (652) $ 90 $ 90
Income (loss) from continuing operations - diluted earnings per share $ (0.02) $ (0.76) $ (0.72) $ (0.51) $ (2.08) $ 0.22 $ 0.22
Pre-tax adjustments:
Impairments reported in exploration expense $ - $ - $ - $ - $ - $ 23 $ 23
Impairments- exploratory related and inventory $ - $ - $ 4 $ - $ 4 $ - $ -
Net (gain) loss on sales of assets and divestment of transportation contracts $ (198) $ (4) $ 227 $ (3) $ 22 $ (35) $ (35)
Accrual for Denver office lease $ - $ - $ 5 $ - $ 5 $ - $ -
Costs related to severance and relocation $ 3 $ 7 $ 3 $ 2 $ 15 $ - $ -
Previously capitalized costs expensed following credit facility amendment $ 4 $ - $ - $ - $ 4 $ - $ -
(Gain) loss on retirement of debt $ (3) $ 3 $ - $ 1 $ 1 $ - $ -
Unrealized MTM (gain) loss $ 76 $ 223 $ 20 $ 190 $ 509 $ (208) $ (208)
Total pre-tax adjustments $ (118) $ 229 $ 259 $ 190 $ 560 $ (220) $ (220)
Less tax effect for above items $ 43 $ (85) $ (96) $ (71) $ (208) $ 83 $ 83
Impact of state deferred tax rate change $ 14 $ - $ - $ 1 $ 15 $ (6) $ (6)
Impact of state tax valuation allowance $ 8 $ - $ - $ - $ 8 $ (6) $ (6)
Loss on induced conversion of preferred stock $ - $ - $ 22 $ - $ 22 $ - $ -
Total after-tax adjustments $ (53) $ 144 $ 185 $ 120 $ 397 $ (149) $ (149)
Adjusted loss from continuing operations available to common stockholders $ (58) $ (85) $ (59) $ (54) $ (255) $ (59) $ (59)
Adjusted diluted loss per common share $ (0.21) $ (0.28) $ (0.17) $ (0.16) $ (0.82) $ (0.15) $ (0.15)
Diluted weighted-average shares (millions) 276.1 300.7 341.5 344.6 313.3 410.4 410.4
Adjusted diluted weighted-average shares (millions) (1) 276.1 300.7 341.5 344.6 313.3 386.3 386.3
23
1 Adjusted diluted weighted-average shares excludes the impact of dilutive securities due to the adjusted loss from continuing operations available to common stockholders for the period.

Reconciliation – EBITDAX (Unaudited)
2016 2017(Dollars in millions) 1Q 2Q 3Q 4Q YTD 1Q 2Q 3Q 4Q YTD
Adjusted EBITDAX
Reconciliation to net income (loss):
Net income (loss) $ (12) $ (198) $ (219) $ (172) $ (601) $ 92 $ 92
Interest expense 57 53 49 48 207 47 47
Provision (benefit) for income taxes 35 (130) (132) (98) (325) 31 31
Depreciation, depletion and amortization 152 163 150 158 623 147 147
Exploration expenses 9 12 10 11 42 39 39
EBITDAX 241 (100) (142) (53) (54) 356 356
Accrual for Denver office lease - - 5 - 5 - -Net (gain) loss on sales of assets and divestment of transportation contracts (198) (4) 227 (3) 22 (35) (35)
Impairment of inventory - - 4 - 4 - -
Net (gain) loss on derivatives (57) 154 (38) 148 207 (203) (203)
Net cash received (paid) related to settlement of derivatives 133 69 58 42 302 (5) (5)
(Income) loss from discontinued operations 12 (25) 1 1 (11) 2 2
Adjusted EBITDAX $ 131 $ 94 $ 115 $ 135 $ 475 $ 115 $ 115
24

DisclaimerThe information contained in this summary has been prepared to assist you in making your own evaluation of the Company and does not purport to contain all of the information you may consider important in deciding whether to invest in shares of the Company’s common stock. In all cases, it is your obligation to conduct your own due diligence. All information contained herein, including any estimates or projections, is based upon information provided by the Company. Any estimates or projections with respect to future performance have been provided to assist you in your evaluation but should not be relied upon as an accurate representation of future results. No persons have been authorized to make any representations other than those contained in this summary, and if given or made, such representations should not be considered as authorized.
Certain statements, estimates and financial information contained in this summary constitute forward-looking statements or information. Such forward-looking statements or information involve known and unknown risks and uncertainties that could cause actual events or results to differ materially from the results implied or expressed in such forward-looking statements or information. While presented with numerical specificity, certain forward-looking statements or information are based (1) upon assumptions that are inherently subject to significant business, economic, regulatory, environmental, seasonal, competitive uncertainties, contingencies and risks including, without limitation, the ability to obtain debt and equity financings, capital costs, construction costs, well production performance, operating costs, commodity pricing, differentials, royalty structures, field upgrading technology, and other known and unknown risks, all of which are difficult to predict and many of which are beyond the Company's control, and (2) upon assumptions with respect to future business decisions that are subject to change.
There can be no assurance that the results implied or expressed in such forward-looking statements or information or the underlying assumptions will be realized and that actual results of operations or future events will not be materially different from the results implied or expressed in such forward-looking statements or information. Under no circumstances should the inclusion of the forward-looking statements or information be regarded as a representation, undertaking, warranty or prediction by the Company or any other person with respect to the accuracy thereof or the accuracy of the underlying assumptions, or that the Company will achieve or is likely to achieve any particular results. The forward-looking statements or information are made as of the date hereof and the Company disclaims any intent or obligation to update publicly or to revise any of the forward-looking statements or information, whether as a result of new information, future events or otherwise. Recipients are cautioned that forward-looking statements or information are not guarantees of futureperformance and, accordingly, recipients are expressly cautioned not to put undue reliance on forward-looking statements or information due to the inherent uncertainty therein.
25

Reserves DisclaimerThe SEC requires oil and gas companies, in filings made with the SEC, to disclose proved reserves, which are those quantities of oil and gas, which, by analysis of geoscience and engineering data, can be estimated with reasonable certainty to be economically producible – from a given date forward, from known reservoirs, under existing economic conditions, operating methods, and governmental regulations. The SEC permits the optional disclosure of probable and possible reserves. We have elected to use in this presentation “probable” reserves and “possible” reserves, excluding their valuation. The SEC defines “probable” reserves as “those additional reserves that are less certain to be recovered than proved reserves but which, together with proved reserves, are as likely as not to be recovered.” The SEC defines “possible” reserves as “those additional reserves that are less certain to be recovered than probable reserves.” The Company has applied these definitions in estimating probable and possible reserves. Statements of reserves are only estimates and may not correspond to the ultimate quantities of oil and gas recovered. Any reserve estimates provided in this presentation that are not specifically designated as being estimates of proved reserves may include estimated reserves not necessarily calculated in accordance with, or contemplated by, the SEC’s reserves reporting guidelines. Investors are urged to consider closely the disclosure regarding our business that may be accessed through the SEC’s website at www.sec.gov.
The SEC’s rules prohibit us from filing resource estimates. Our resource estimations include estimates of hydrocarbon quantities for (i) new areas for which we do not have sufficient information to date to classify as proved, probable or even possible reserves, (ii) other areas to take into account the low level of certainty of recovery of the resources and (iii) uneconomic proved, probable or possible reserves. Resource estimates do not take into account the certainty of resource recovery and are therefore not indicative of the expected future recovery and should not be relied upon. Resource estimates might never be recovered and are contingent on exploration success, technical improvements in drilling access, commerciality and other factors.
26

WPX Non-GAAP DisclaimerThis presentation may include certain financial measures, including adjusted EBITDAX (earnings before interest, taxes, depreciation, depletion, amortization and exploration expenses), that are non-GAAP financial measures as defined under the rules of the Securities and Exchange Commission.
This presentation is accompanied by a reconciliation of these non-GAAP financial measures to their nearest GAAP financial measures. Management uses these financial measures because they are widely accepted financial indicators used by investors to compare a company’s performance. Management believes that these measures provide investors an enhanced perspective of the operating performance of the company and aid investor understanding. Management also believes that these non-GAAP measures provide useful information regarding our ability to meet future debt service, capital expenditures and working capital requirements. These non-GAAP financial measures should not be considered in isolation or as substitutes for a measure of performance prepared in accordance with United States generally accepted accounting principles.
27