1H2017 Financial Results...1H2017 Financial Results 4 August 2017 2 • COMPANY OVERVIEW • 1H2017...
33
1H2017 Financial Results 4 August 2017
Transcript of 1H2017 Financial Results...1H2017 Financial Results 4 August 2017 2 • COMPANY OVERVIEW • 1H2017...

1H2017 Financial Results
4 August 2017

2
• COMPANY OVERVIEW
• 1H2017 RESULTS OVERVIEW
• OPERATION HIGHLIGHTS

• Founded in 1963, listed on the Singapore Exchange in 1964
Three core businesses:
- Property development (residential units for sale)
- Property investments (offices, retail malls and serviced suites)
- Hotel operations (owned and/or managed hotels)
• Award-winning developer noted for architectural and design
excellence
• Together with hotel subsidiary, Pan Pacific Hotels Group
Limited, UOL owns and/or manages over 30 hotels, resorts and
serviced suites in Asia, Oceania and North America
under two acclaimed brands: “Pan Pacific” and PARKROYAL
• Total Assets of $11.77 billion as at 30 June 2017
3

Stable Management
Team
Nimble & Focused on Strategic Fit
Proven Track Record
Design & Quality
Excellence
Well Diversified Portfolio
Strong Capital
Position
4

5
UOL GROUP
LIMITED
Property
Development
Property
Investments
Hotel
Operations
Investments
Management
Services
*Listed company
Wholly-owned projects
Joint-venture projects
*United Industrial Corporation Limited (UIC) (45%)
Marina Centre Holdings Pte Ltd (23%)
Residential Developments
Wholly-owned properties
Joint-venture properties
Commercial Properties/Serviced Suites
Joint-venture hotels
Aquamarina Hotel Private Limited (25%)
Wholly-owned hotels
Hotel Investments
Investments in Securities
Facilities Management
Project Management
Hotel and Other Management

Singapore, Malaysia, Thailand, Indonesia, Philippines, Vietnam,
Myanmar, Australia, China, Bangladesh, UK, USA & Canada
Operates in 13 countries around the world
6

20.6
59.1
11.6
8.4 0.3
Total Assets** (%)
Property development Property investments Hotel operations Investments Others
15.3
65.4
11.4
7.40.5
Total Assets** (%)(as at 31 Dec 2016)
11.1
56.5
23.9
6.1 2.4
Adjusted EBITDA* (%)(FY2016)
Contribution by Business Segments
*Excludes unallocated costs, other gains/losses and
fair value gains/losses on investment properties
**Excludes unallocated assets
7

RESIDENTIAL PROJECTS
Asia Pacific Property Awards 2017-2018
• The Clement Canopy
• Park Eleven
International Property Awards 2016
• Principal Garden
FIABCI Singapore Property Awards 2016
• Archipelago
HOTEL PROPERTIES
16th SIA Architectural Design Awards 2016
• PARKROYAL on Pickering
World Travel Awards 2016
• Pan Pacific Orchard
• Pan Pacific Serviced Suites Orchard
8

1H2017 RESULTS OVERVIEW
9

10
$m 2Q2017 2Q2016
%
Change 1H2017 1H2016
%
Change
Revenue 399.1 363.6 10 749.8 693.7 8
Share of profit of
associated and joint
venture companies
45.4 38.1 19 79.8 72.2 11
Profit before fair value and
other gains/(losses) and
income tax
118.8 105.8 12 215.5 199.3 8
Fair value (losses)/gains on
associated and joint
venture companies’
investment properties
(1.1) 9.1 (112) (1.1) 9.1 (112)
Fair value gains/(losses) on
the Group’s investment
properties
13.2 (28.7) 146 13.2 (28.7) 146
Profit before income tax 132.4 79.3 67 230.0 173.0 33
Net attributable profit 109.4 68.8 59 189.7 145.9 30
Earnings per share (cents) 13.59 8.64 57 23.57 18.31 29

11
As at
30.06.17
As at
31.12.16% Change
Net tangible asset value per share $10.24 $10.07 2
Total equity $8,876m $8,635m 3
Cash $269m $302m -11
Net debt $2,120m $2,108m 1
Gearing ratio 0.24 0.24 0
Propertydevelopment
Propertyinvestments
Hoteloperations
Managementservices
Investments
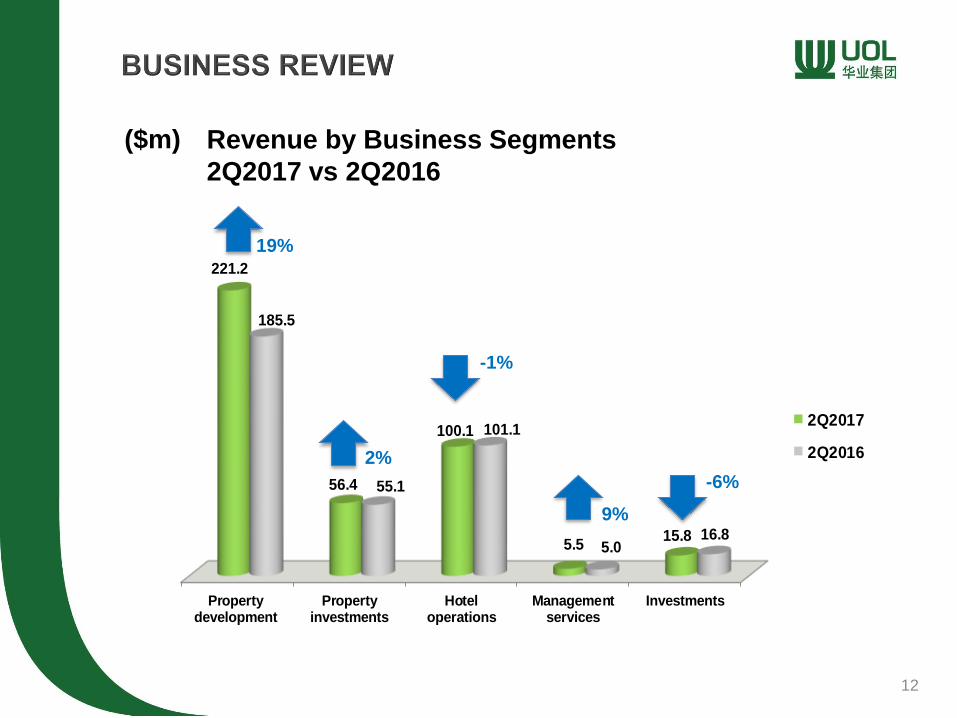
221.2
56.4
100.1
5.515.8
185.5
55.1
101.1
5.016.8
2Q2017
2Q2016
($m) Revenue by Business Segments
2Q2017 vs 2Q2016
12
19%
2%
-1%
9%
-6%

Revenue Contribution by Business Segments
2Q2017 vs 2Q2016
13
Property development
51%
Property investments
15%
Hotel operations
28%
Management services
1%
Investments5%
2Q2016
Property development
55%Property
investments14%
Hotel operations
26%
Management services
1%
Investments4%
2Q2017

Propertydevelopment
Propertyinvestments
Hoteloperations
Managementservices
Investments
404.5
112.9
204.7
11.8 15.8
349.8
110.6
206.0
10.4 16.8
1H2017
1H2016
($m) Revenue by Business Segments
1H2017 vs 1H2016
14
16%
2%
-1%
-6%
13%
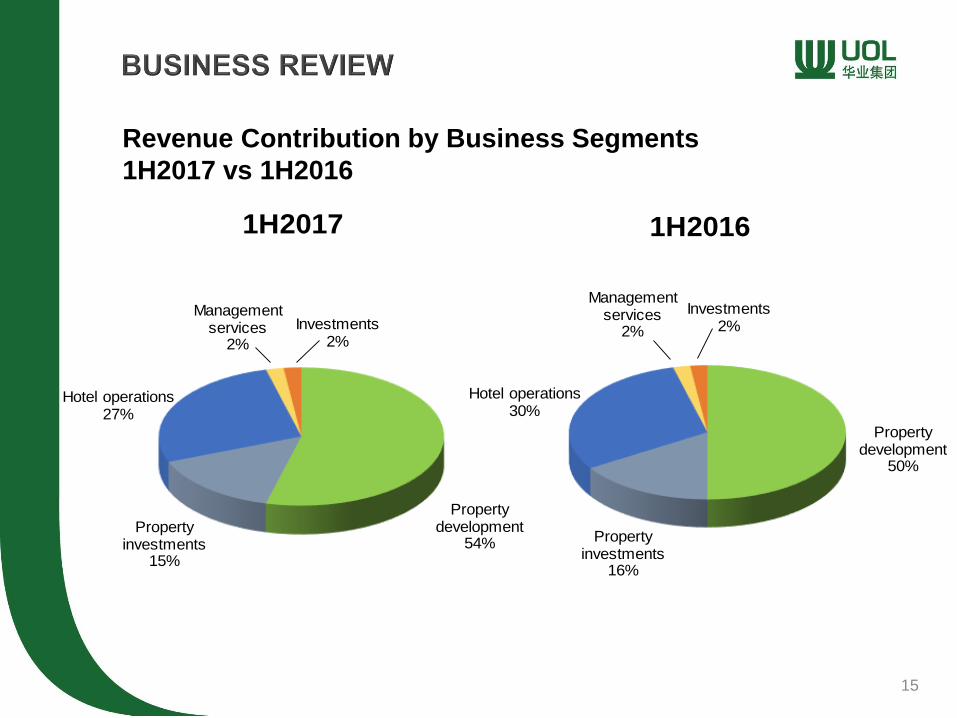
Revenue Contribution by Business Segments
1H2017 vs 1H2016
15
Property development
50%
Property investments
16%
Hotel operations30%
Management services
2%
Investments2%
1H2016
Property development
54%Property
investments15%
Hotel operations27%
Management services
2%
Investments2%
1H2017

OPERATION HIGHLIGHTS
16

Site at 45 Amber Road
• Freehold residential site in District 15
• Site area of 6,490 sqm;estimated
140-unit project
• 100% stake
• Close to upcoming Marine Parade
and Tanjong Katong MRT stations
• Target to launch in 2018
17
Image source: The Straits Times

En-bloc purchase of residential site
at Potong Pasir Ave 1
• En-bloc tender of former HUDC
estate, Raintree Gardens in
October 2016
• Site area of 18,711 sqm;
estimated 750-unit project
• 50:50 joint venture with UIC
• Next to Kallang River and near
Potong Pasir MRT station
• Target to launch in 2018
18
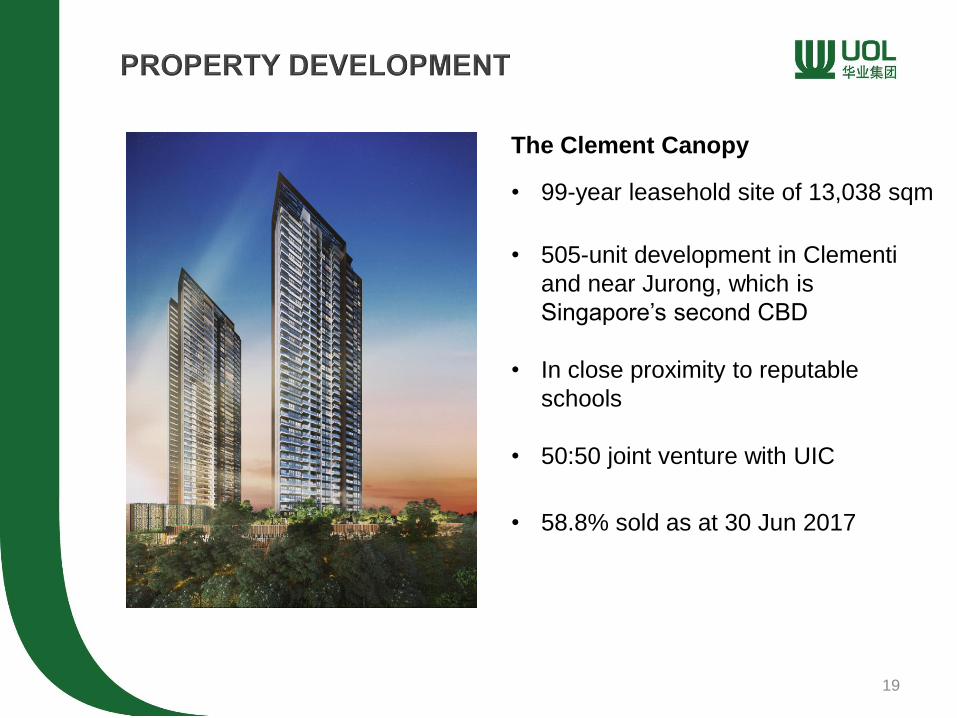
The Clement Canopy
• 99-year leasehold site of 13,038 sqm
• 505-unit development in Clementi
and near Jurong, which is
Singapore’s second CBD
• In close proximity to reputable
schools
• 50:50 joint venture with UIC
• 58.8% sold as at 30 Jun 2017
19

Principal Garden
• 99-year leasehold site at Prince Charles Crescent
• 663-unit development near Redhill MRT station
• 70:30 joint venture with Kheng Leong
• 71.8% sold as at 30 Jun 2017
20

Botanique at Bartley
• 99-year leasehold site along Upper Paya Lebar Road
• 797-unit condominium near Bartley MRT station
• 100% stake
• 99.5% sold as at 30 Jun 2017
21

• In Sengkang West Way, near
Layar LRT, Punggol Reservoir
and Seletar Aerospace Park
• A 555-unit, four 19-storey blocks
project
• 100% stake
• First-of-its-kind bicycle-sharing
facility for residents
• 98.7% sold as at 30 Jun 2017
22
Riverbank@Fernvale

Park Eleven, Shanghai
• Mixed development located within
the Changfeng Ecological Business
Park, about 5 km to the north-east
of the Hongqiao Transportation Hub
and less than 10 km from The Bund
• 398 residential units and 4,000 sqm
of net lettable area of retail
• 40:30:30 joint venture between
UOL, UIC and Kheng Leong
• Sold 142 units out of the 168 units
approved for release in first phase
in 3Q16
• Target to launch second phase in
2H201723
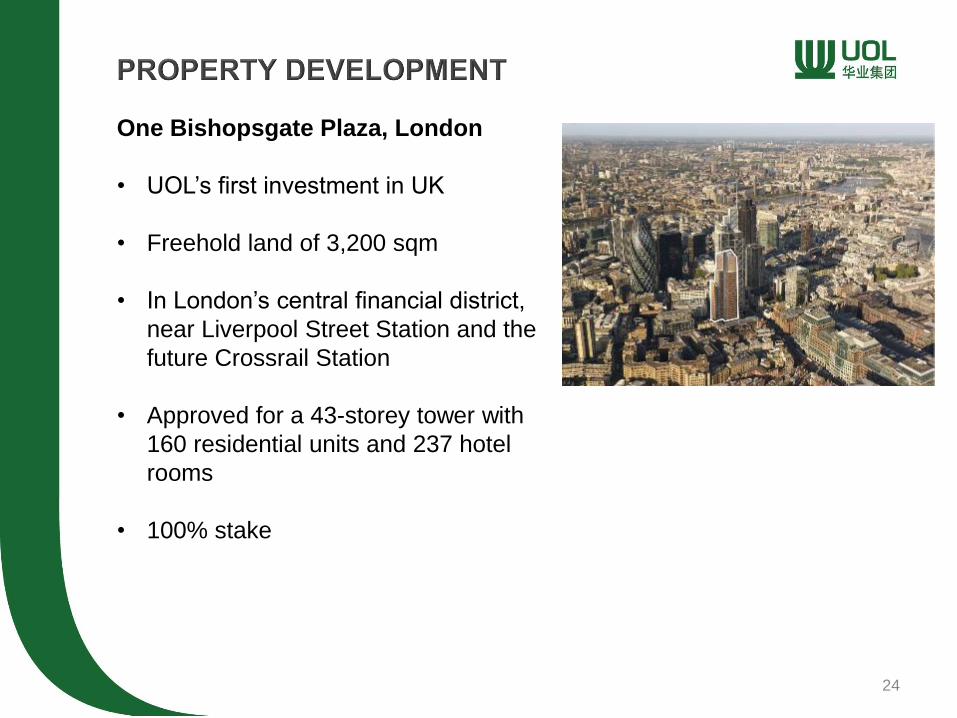
One Bishopsgate Plaza, London
• UOL’s first investment in UK
• Freehold land of 3,200 sqm
• In London’s central financial district,
near Liverpool Street Station and the
future Crossrail Station
• Approved for a 43-storey tower with
160 residential units and 237 hotel
rooms
• 100% stake
24

Profit recognition of launched projects
Project Name %
Equity
Stake
No. of
Units
Saleable
Area
(sqm)
% Sold(as at 30.06.17)
%
Completed(as at 30.06.17)
TOP Date
Completed
Riverbank@Fernvale 100 555 48,345 98.7 100 TOP
Ongoing
Park Eleven, Shanghai* 40 398 78,526 35.7 95 Est. 2Q2018
Principal Garden 70 663 50,665 71.8 50 Est. 4Q2018
Botanique at Bartley 100 797 55,419 99.5 62 Est. 1Q2019
The Clement Canopy 50 505 44,949 58.8 24 Est. 2Q2019
* Profit recognition will be on a completed contract basis expected in 2018
25

Singapore residential pipeline
* Mixed development with 160 residential units, 237 hotel rooms and a retail component
Project Name/Location Tenure
of Land
Site Area
(sqm)
Est.
Saleable
Area (sqm)
Est. No.
of Units
%
Owned
Target
Launch
45 Amber Road site Freehold 6,490 13,370 140 100 2018
Potong Pasir Ave 1 site 99 18,711 51,605 750 50 2018
Total 25,201 64,975 890
Overseas residential pipeline
Project Name/Location Site Area
(sqm)
Est. Saleable
Area (sqm)
Est. No.
of Units
%
Owned
Target
Launch
Site at Bishopsgate, London* 3,200 13,551 160 100 2018
26
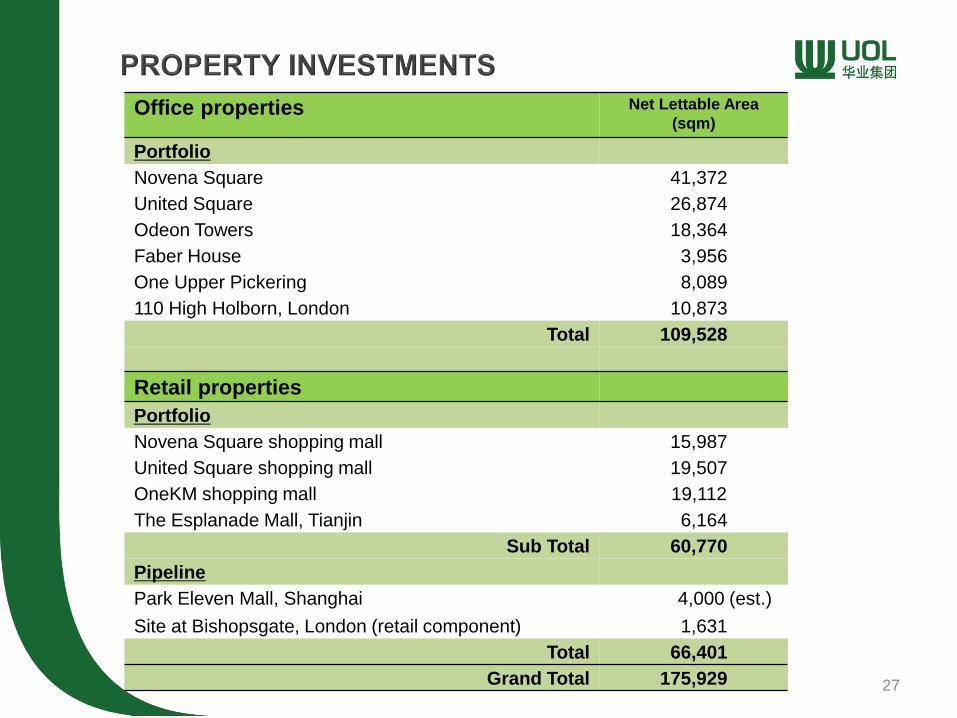
Office properties Net Lettable Area
(sqm)
Portfolio
Novena Square 41,372
United Square 26,874
Odeon Towers 18,364
Faber House 3,956
One Upper Pickering 8,089
110 High Holborn, London 10,873
Total 109,528
Retail properties
Portfolio
Novena Square shopping mall 15,987
United Square shopping mall 19,507
OneKM shopping mall 19,112
The Esplanade Mall, Tianjin 6,164
Sub Total 60,770
Pipeline
Park Eleven Mall, Shanghai 4,000 (est.)
Site at Bishopsgate, London (retail component) 1,631
Total 66,401
Grand Total 175,929 27

Owned Serviced Suites Properties Rooms
Portfolio
Pan Pacific Serviced Suites Orchard, Singapore 126
Pan Pacific Serviced Suites Beach Road, Singapore 180
PARKROYAL Serviced Suites Beach Road, Singapore 90
PARKROYAL Serviced Suites Kuala Lumpur 287
Total 683
28
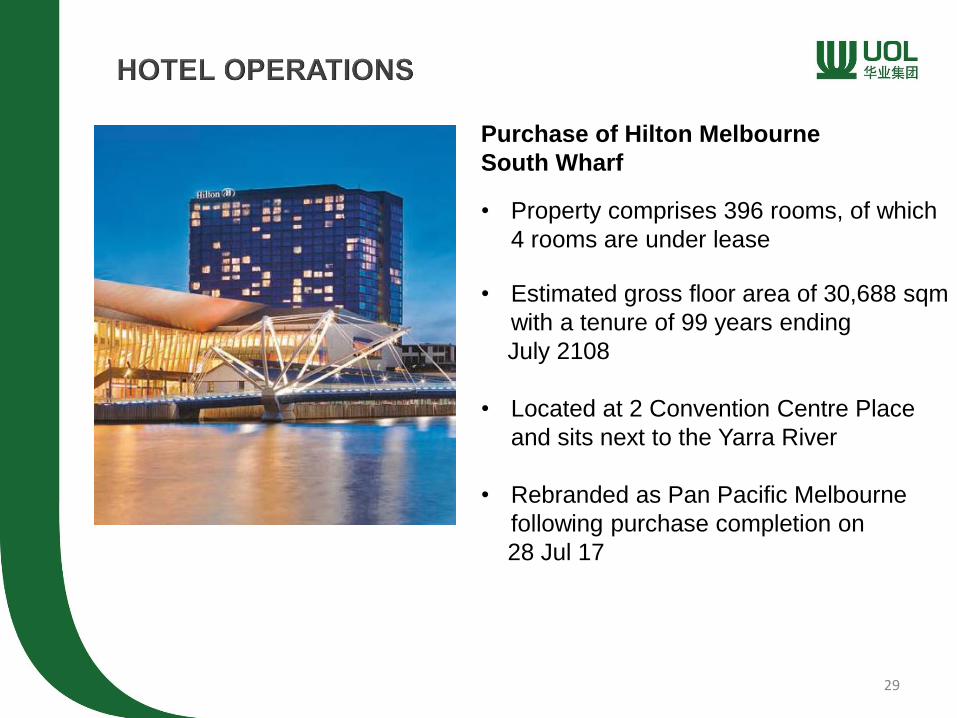
Purchase of Hilton Melbourne
South Wharf
• Property comprises 396 rooms, of which
4 rooms are under lease
• Estimated gross floor area of 30,688 sqm
with a tenure of 99 years ending
July 2108
• Located at 2 Convention Centre Place
and sits next to the Yarra River
• Rebranded as Pan Pacific Melbourne
following purchase completion on
28 Jul 17
29
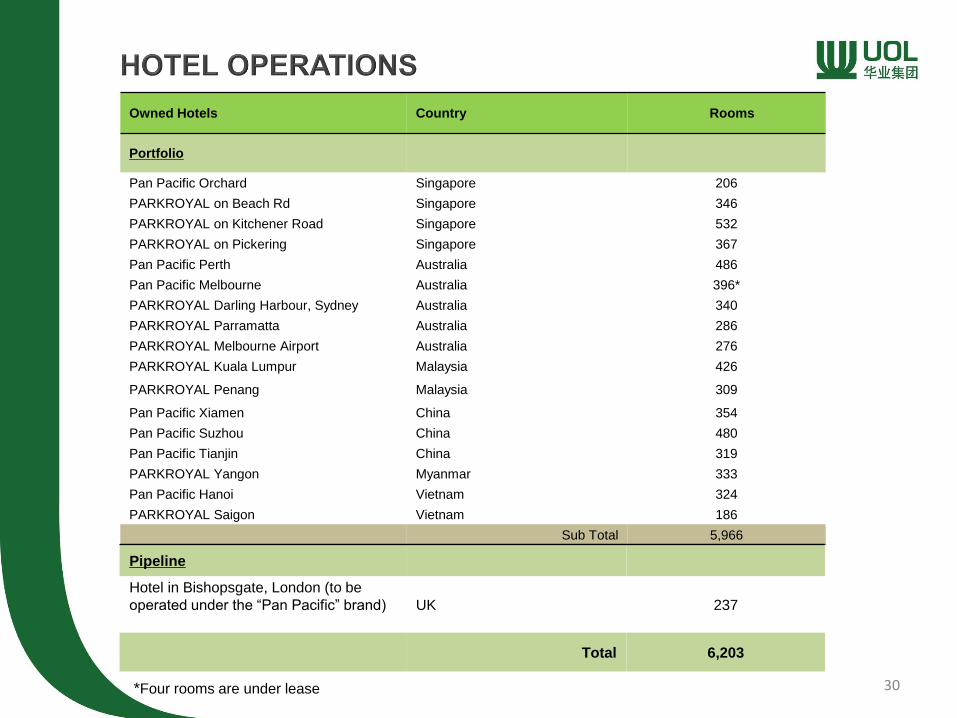
Owned Hotels Country Rooms
Portfolio
Pan Pacific Orchard Singapore 206
PARKROYAL on Beach Rd Singapore 346
PARKROYAL on Kitchener Road Singapore 532
PARKROYAL on Pickering Singapore 367
Pan Pacific Perth Australia 486
Pan Pacific Melbourne Australia 396*
PARKROYAL Darling Harbour, Sydney Australia 340
PARKROYAL Parramatta Australia 286
PARKROYAL Melbourne Airport Australia 276
PARKROYAL Kuala Lumpur Malaysia 426
PARKROYAL Penang Malaysia 309
Pan Pacific Xiamen China 354
Pan Pacific Suzhou China 480
Pan Pacific Tianjin China 319
PARKROYAL Yangon Myanmar 333
Pan Pacific Hanoi Vietnam 324
PARKROYAL Saigon Vietnam 186
Sub Total 5,966
30
Pipeline
Hotel in Bishopsgate, London (to be
operated under the “Pan Pacific” brand) UK 237
Total 6,203
*Four rooms are under lease

Note: Serviced suites are included in the above tally
Existing Pipeline
No. of Hotels No. of Rooms No. of Hotels No. of Rooms
By Brand
Pan Pacific 19 5,954 6 1,754
PARKROYAL 13 3,868 2 748
Total 32 9,822 8 2,502
By Ownership Type
Owned 20 6,253 2 633
Managed 12 3,569 6 1,869
Total 32 9,822 8 2,502
31

This presentation may contain forward-looking statements or financial information. Such forward-looking statements
and financial information may involve known and unknown risks, uncertainties, assumptions and other factors which
may cause the actual results, performance or achievements of UOL Group Limited, or industry results, to be materially
different from any future results, performance or achievements expressed or implied by such forward-looking
statements and financial information.
Such forward-looking statements and financial information are based on assumptions including (without limitation) UOL
Group Limited’s present and future business strategies, general industry and economic conditions, interest rate trends,
cost of capital and capital availability, availability of real estate properties, competition from other companies, shifts in
customer demands, customers and partners, changes in operating expenses (including employee wages, benefits and
training), governmental and public policy changes and the continued availability of financing in the amounts and the
terms necessary to support future business activities.
You are advised not to place undue reliance on these forward-looking statements and financial information, which are
based on UOL Group Limited’s current views concerning future events.
UOL Group Limited expressly disclaims any obligation or undertaking to release publicly any updates or revisions to
any forward-looking statements or financial information contained in this presentation to reflect any change in UOL
Group Limited’s expectations with regard thereto or any change in events, conditions or circumstances on which any
such statement or information is based, subject to compliance with all applicable laws and regulations and/or the rules
of the SGX-ST and/or any other regulatory or supervisory body.
This presentation may include market and industry data and forecasts. You are again advised that there can be no
assurance as to the accuracy or completeness of such included information. While UOL Group Limited has taken
reasonable steps to ensure that the information is extracted accurately and in its proper context, UOL Group Limited
has not independently verified any of the data or ascertained the underlying assumptions relied upon therein.
Q&A