
1H FY20 Investor Presentation. Investor Relations...Janison is gaining recognition as a rapidly...
22
JAN.ASX February 2020
Transcript of 1H FY20 Investor Presentation. Investor Relations...Janison is gaining recognition as a rapidly...

1H FY20 Investor PresentationJAN.ASXFebruary 2020

JAN.ASX 2
Janison is gaining recognition as a rapidly growing global EdTech company, delivering 59% shareholder return this financial year
JAN.ASX
Share price at listing $0.30
Share price at 31 Jan 2019 $0.46
JAN Share price growth since listing +53%
JAN Share price growth FY20 (1-Jul-19 to 31-Jan- 20) +59%
JAN Share price growth LTM (at 31-Jan-20) +44%
ASX Small Ords Accum. Index Growth (LTM) 1 +15%
Free Float (up 17% from last year)
Founders & Directors
Shareholder Mix
Average Monthly Volumes (LTM, shares) 2.0M
Current market cap (31 Jan 2020) $84M
Cash on hand (31 December 2019) $4.0M
Enterprise value $80M
1 https://au.investing.com/indices/asx-small-ordinaries-accum
Trading volumes (JAN.ASX) 000s
52%48%
$0.25
$0.30
$0.35
$0.40
$0.45
$0.50JAN.ASX
ASX Small Ords
- 500 1,000 1,500 2,000
Jun-19 Jul-19 Aug-19 Sep-19 Oct-19 Nov-19 Dec-19 Jan-20

JAN.ASX 3
The business model has transformed to generate high recurring revenue and significantly improved margins
56% growth in ARR1 to $14.3m (as at 31 December 2019 vs. 31 December 2018)
14% growth in Total Reported Revenue for the six months to 31 December 2019 (1H FY20 vs. 1H FY19)
Gross Margin up 21 percentage points to 46% for 1H FY20 (vs. 24% 1H FY19)
EBITDA up 16 percentage points to 9% for 1H FY202 (vs. a loss of 7% in 1H FY19)
$2.8m Positive Operating Cash Flow (for the six months to 31 December 2019)
$4.2m Cash on hand, no Debt
1H FY20 Key Financial Highlights:
1 “ARR” = Annualised Recurring Revenue2 Pre-AASB16 adjustments. EBITDA increased to 11% post-AASB16 adjustments

JAN.ASX
Market Opportunity
Partnerships
Products and Clients
Profitability
4
Leadership
Outlook

JAN.ASX
FY16 FY17 FY18 FY19 FY20E
5
Online Assessment platform for digitising pen and paper exams
Online Learning platform and content for transforming corporate learning
Working with its valued clients, Janison has invested $30m+ building two products and unique intellectual property
Revenue by Segment Products & Services
$14m
$17m
$23m
$10mExam Management Services for higher education and professional associations

JAN.ASX
Janison Insights is now a complete product which provides an end-to-end online assessment solution
6

JAN.ASX
Market Opportunity
Partnerships
Products and Clients
Profitability
7
Leadership
Outlook

JAN.ASX 8
Janison partners with publishers, education companies, accreditation bodies and departments of education with recognised brands and distribution channels to grow the business globally

JAN.ASX 9
OECD is an example of a partner enabling Janison to grow globally and leverage its brand, reputation and distribution
TAM 3 Yr 1 Janison Share 2
Country SignedDate Signed
Yr 1 Test Commences
No. of 15 year oldstudents 1
No. of 15 year old
students 1
% Market Share of students
Total Yr 1 Licence
Revenue 2
1 Brazil Jun 2019 Dec 2019 3.1m 60,000 1.9% 197$ 2 Spain Sep 2019 Jan 2020 0.5m 2,400 0.5% - $ 3 Russia Sep 2019 Nov 2019 1.3m 80,000 6.0% 197$ 4 United States Oct 2019 Jan-Mar 2020 4.1m 6,000 0.1% 700$ 5 Portugal Jan 2020 Apr 2020 0.1m 6,000 5.3% 100$
All other PISA countries (members & partners) 26.7mTotal 35.9m 154,400 0.4% $ 1,194
OECD Platform Fee Apr 2019 n/a n/a n/a n/a 100$ Total (including OECD Platform Licence Fee) $ 1,294
1 The PBTS and PISA tests are for 15 year-old students only2 Estimated, and based on EUR:AUD exchange rates at the time of invoicing3 "TAM" = Total Addressable Market of PISA-aged students based on the 2018 PISA assessment

JAN.ASX
Market Opportunity
Partnerships
Products and Clients
Profitability
10
Leadership
Outlook

JAN.ASX 11
Janison’s total addressable market is immense and continues to grow as education is digitised
By 2025 there will be 0.5bn more school and university graduates in the world than today, driven primarily by population growth in developing countries.
Expenditure on education and training from governments, parents, individuals and corporates continues to grow tohistoric levels and is expected to reach USD$10T by 2030 from approximately USD$6T today.
However, the sector is grossly under digitised, with less than 3% of overall expenditure allocated to digital
education, presenting a challenge and also a significant opportunity given the scale of what’s to come.
Whilst the education sector is predicted to grow over the next 15 years, expenditure on education technology globally is forecast to grow at a
significantly greater rate - more than doubling by 2025
Janison’s platforms service these key market sectors (and their 2030 estimated market size); Schools K-12 ($5.5T), Post Secondary or ‘Higher Ed’ ($2.5T), and Corporate ($0.6T).
JAN.ASX
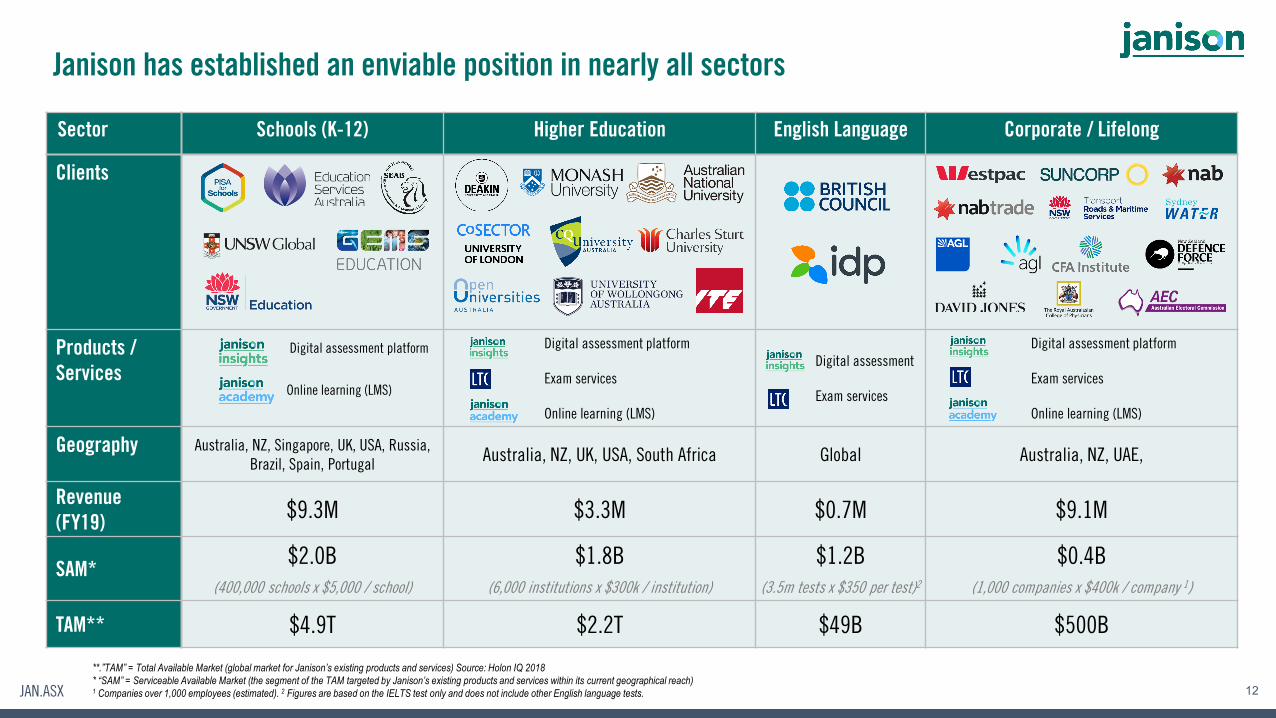
Sector Schools (K-12) Higher Education English Language Corporate / Lifelong
Clients
Products / Services
Digital assessment platform
Online learning (LMS)
Digital assessment platform
Exam services
Online learning (LMS)
Digital assessment
Exam services
Digital assessment platform
Exam services
Online learning (LMS)
Geography Australia, NZ, Singapore, UK, USA, Russia, Brazil, Spain, Portugal Australia, NZ, UK, USA, South Africa Global Australia, NZ, UAE,
Revenue (FY19) $9.3M $3.3M $0.7M $9.1M
SAM* $2.0B(400,000 schools x $5,000 / school)
$1.8B(6,000 institutions x $300k / institution)
$1.2B(3.5m tests x $350 per test)2
$0.4B(1,000 companies x $400k / company 1)
TAM** $4.9T $2.2T $49B $500B
12
Janison has established an enviable position in nearly all sectors
**.”TAM” = Total Available Market (global market for Janison’s existing products and services) Source: Holon IQ 2018* “SAM” = Serviceable Available Market (the segment of the TAM targeted by Janison’s existing products and services within its current geographical reach)1 Companies over 1,000 employees (estimated). 2 Figures are based on the IELTS test only and does not include other English language tests.

JAN.ASX
Market Opportunity
Partnerships
Products and Clients
Profitability
13
Leadership
Outlook

JAN.ASX
In 1H FY20 Janison increased its half-year revenue by 14% and ARR by 56% on pcp1
14
3.7m5.3m 5.3m 6.3m
2.8m
3.5m3.2m
4.7m
2.3m
$7.2m$8.4m
$10.0m$11.4m
1H 1H 1H 1H
FY17 FY18 FY19 FY20
First-Half Reported Revenue Recurring Platform RevenueExam ServicesProject Services
$7.1m
$10.3m$9.2m
$14.3m
Dec 2016 Dec 2017 Dec 2018 Dec 2019
ARR (Annualised Recurring Revenue)
1 “PCP” = Prior Corresponding Period

JAN.ASX
Janison is increasing margins and will improve further with scale
15
46%
39%35%
46%
25%
50%
FY17 A FY18 A FY19 A FY20 E
GROUP GM%
“GM%” = Gross Margin percentage of total revenue

JAN.ASX
In 1H FY20 Gross Margin & EBITDA increased significantly to 46% and 9%
16
▪ Operating expenses increased due to sales and marketing investment, also includes $300k one-off expenses not recurring in 2H FY20.
▪ Accounting standard changes: AASB16 was introduced for the first time in FY20. The impact of AASB16 in this first half was the capitalisation of all long-term office leases and the removal of current year rental expenses (c.$0.3m in 1H FY20), replaced with a lease depreciation expense and a deemed interest expense (shown below EBITDA).
First-Half Revenue & EBITDA (FY17-FY20)
$7.2m$8.4m
$10.0m$11.4m
$1.6m $2.1m
$(0.7)m
$1.3m
1H 1H 1H 1H
FY17 FY18 FY19 FY20
RevenueEBITDA
INCOME STATEMENT - FIRST HALF RESULT
(A$m) 1H FY20 Reported
AASB16 Adjustments
1H FY20 Pre-Adjustments
1H FY19 Reported
$ Growth
% Growth
Recurring Revenue 6.3 - 6.3 5.3 1.0 +19%Services Revenue 5.1 - 5.1 4.7 0.4 +9%Group Revenue 11.4 - 11.4 10.0 1.4 +14%
Cost of Sales 6.2 - 6.2 7.5 (1.4) (18)%Gross Profit 5.2 - 5.2 2.4 2.8 +114%GM% 46% -- 46% 24% + 21pps
Operating Expenses 3.9 (0.3) 4.2 3.1 1.1 +35%EBITDA 1.3 0.3 1.0 (0.7) 1.7 NMEBITDA % 11% -- 9% (7)% + 16pps
Growth adjusted for AASB16Six months ending

JAN.ASX
Market Opportunity
Partnerships
Products and Clients
Profitability
17
Leadership
Outlook

JAN.ASX
Experienced and committed Executive Leadership Team
18
Tom Richardson Derek Welsh Stuart Halls George Gorman Fiona Ward Carly Daff Pippa Lennon Rebecca NiemiecCHIEF EXECUTIVE OFFICER
COO CFO CTO HEAD OF LEARNING HEAD OF PRODUCT
HEAD OF PEOPLE MANAGING DIRECTOR – LTC
19 Years within Education Technology industry
18 Years within Education Technology industry
20 Years within Finance
21 Years within Technology industry
12 Years within Learning industry
10 Years in Product
15 Year in People & Recruitment
12 Years in the Education industry
Founder & CEO –Latitude Learning Academy
Chief Information Officer – JobfindCentre Australia
CFO & COO –AHAlife (AHL.ASX)
Principal Partner in Transformation Practice –Red2Green Consulting
General Manager of Learning – Ascender HCM
Product Director –Keepsake
Recruitment & Engagement Manager – Vamp
MD and Exams Manager LTC (9 yrs)
Partner at Deloitte and Founder – Deloitte Leadership Academy (DLA)
Executive General Manager – SumTotal Australia & New Zealand
CFO & COO –Recreational Tourism Group
2iC to CIO – Qantas Loyalty
Global Services Delivery Manager –Talent2
Head of Product –Stan
Talent Acquisition Manager – Prospa
International Student Compliance –University of Canberra
BBus, CPA, AICD, MBA BA, BAI, MMSc Portfolio Manager Ironbridge Capital
Program Director –Opal Open Loop Payments
Group IM (Sustainable Learning) – BHP Billiton
Product Manager –Foxtel
Strategic Talent Sourcing Lead -CoreLogic
BA Int’l Studies, Grad Dip BS
BA(Hons) ACC, CIMA, MBA
BA(Hons), MSc BID BSc. Comp Science

JAN.ASX
Governed by an experienced, professional Board
19
CEO of Janison until 2015
25 years in the Education industry
Managing Partner –EduWorld
Managing Partner –JWT Education

JAN.ASX
Market Opportunity
Partnerships
Products and Clients
Profitability
20
Leadership
Outlook

21
Despite investing in growth, Gross Margin is expected to exceed 45% and EBITDA to exceed $4.0m for FY20 with positive operating cash flow
>45%Gross Margin
>$4.0mEBITDA
>$4mOperating Cash Flow
>25%Full Year ARR Growth

Tom [email protected]+61 421 029 620