1H FY19 RESULTS - ASX...2019/02/21 · market maturity and off a significantly reduced expense base...
27
1H F19 RESULTS 1H FY19 RESULTS 21 FEBRUARY 2019 Dr. Adir Shiffman, Executive Chairman Mark Hall, Chief Financial Officer 1 For personal use only
Transcript of 1H FY19 RESULTS - ASX...2019/02/21 · market maturity and off a significantly reduced expense base...

1H F19 RESULTS
1H FY19 RESULTS21 FEBRUARY 2019
Dr. Adir Shiffman, Executive ChairmanMark Hall, Chief Financial Officer
1
For
per
sona
l use
onl
y

1H F19 RESULTS2
KEY MESSAGES
Subscription software is at the heart of our business
Most of the core elite revenue and growth is associated with subscription software
The first half was strong delivering continued high subscription growth, high margins and low churn
For
per
sona
l use
onl
y

1H F19 RESULTS
WE EXIST TO BUILD ANDIMPROVE THE PERFORMANCE OF ATHLETES AND TEAMS.
1H F19 RESULTS3
1H F19 RESULTS3
For
per
sona
l use
onl
y

1H F19 RESULTS
OWN THE PERFORMANCE TECHNOLOGY STACK FOR ELITE TEAM SPORT
COMPANY STRATEGY
21
4
(LEVERAGE TEAM INTO CONSUMER TO) BUILD A SUCCESSFUL CONSUMER BUSINESS
2
WEARABLE TECHNOLOGY
VIDEOANALYSIS
ATHLETEMANAGEMENT
For
per
sona
l use
onl
y
1H F19 RESULTS
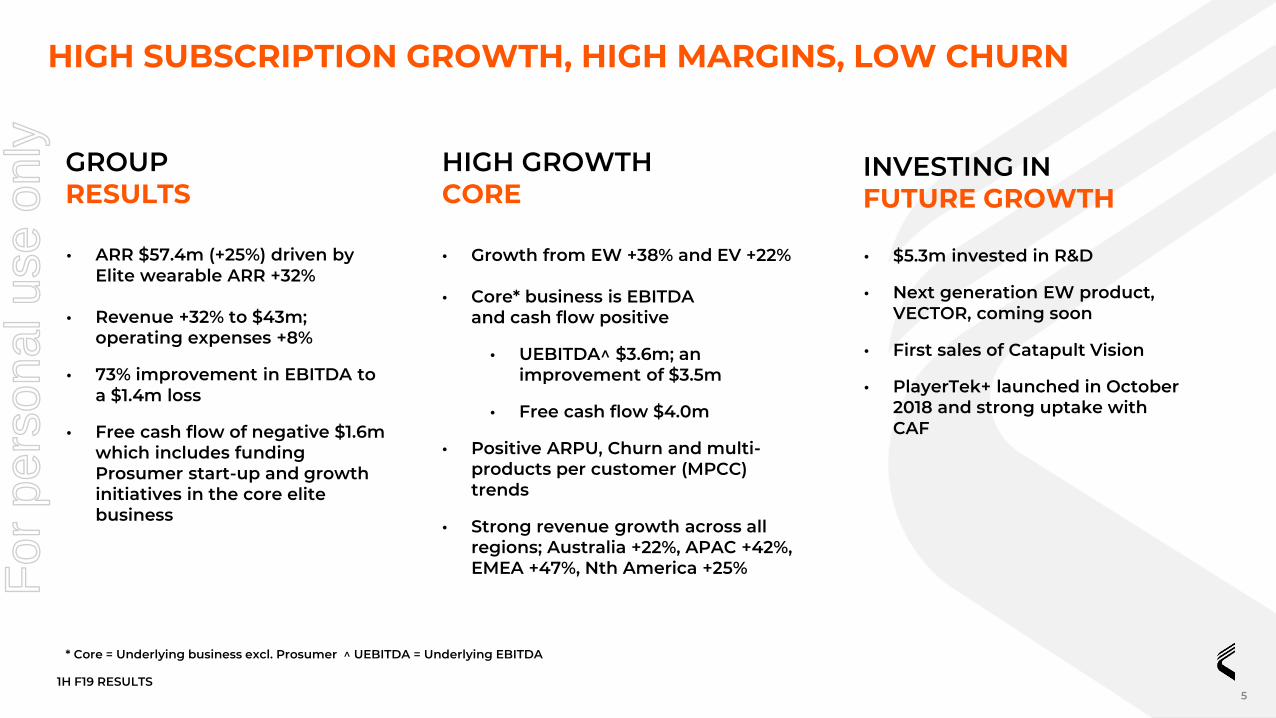
GROUPRESULTS
INVESTING IN FUTURE GROWTH
• ARR $57.4m (+25%) driven by Elite wearable ARR +32%
• Revenue +32% to $43m; operating expenses +8%
• 73% improvement in EBITDA to a $1.4m loss
• Free cash flow of negative $1.6m which includes funding Prosumer start-up and growth initiatives in the core elite business
• Growth from EW +38% and EV +22%
• Core* business is EBITDA and cash flow positive
• UEBITDA^ $3.6m; an improvement of $3.5m
• Free cash flow $4.0m
• Positive ARPU, Churn and multi-products per customer (MPCC) trends
• Strong revenue growth across all regions; Australia +22%, APAC +42%, EMEA +47%, Nth America +25%
• $5.3m invested in R&D
• Next generation EW product, VECTOR, coming soon
• First sales of Catapult Vision
• PlayerTek+ launched in October 2018 and strong uptake with CAF
* Core = Underlying business excl. Prosumer ^ UEBITDA = Underlying EBITDA
5
HIGH GROWTH CORE
HIGH SUBSCRIPTION GROWTH, HIGH MARGINS, LOW CHURNF
or p
erso
nal u
se o
nly

1H F19 RESULTS
0
2
4
6
8
10
12
14
FY18 FY19
Underlying EBITDA $m
1H 2H
FY19 guidance range is $11m to $13m
• Implied minimum second half based on FY19 guidance range is $7.4m
• Implied maximum second half based on FY19 guidance range is $9.4m
• FY18 2H18 was $7.9m
CORE BUSINESSGROWING, PROFITABLE AND ON TRACK FOR FY19 GUIDANCE
6
For
per
sona
l use
onl
y

1H F19 RESULTS
CORE BUSINESSMORE THAN 2,500 TEAMS NOW WORKING WITH CATAPULT
7
RECENT MAJOR WINS INCLUDE
AMONG HUNDREDS OF OTHER NEW TEAMS WHO HAVE RECENTLY JOINED CATAPULTFor
per
sona
l use
onl
y

1H F19 RESULTS
80
85
90
95
100
105
110
115
120
Jun 17 Dec 17 Jun 18 Dec 18
EW ARPU ($) PER MONTH PER DEVICE 18.3K ELITE WEARABLES SUBSCRIPTION UNITS
• +17% in device numbers since Dec ‘17• 1.8k subscription devices sold in 1H19• Subs to capital mix (excl. PlayerTek+) 58:42
Excludes AMS
CORE BUSINESSEW SUBSCRIPTION ARPU AND SUBSCRIPTION UNIT GROWTH
8
1,837
17,098
18,293
FY14 FY15 FY16 FY17 FY18 1H19
Note 1H19 reflects 6 months growth. All other points are 12 months growth.
For
per
sona
l use
onl
y

1H F19 RESULTS
0
20
40
60
Dec 17 Dec 18
Video +18% Wearables +32%
ARR IS GROWING STRONGLY +25%
$m
CORE BUSINESSPOSITIVE SUBSCRIPTION REVENUE AND CHURN
9
0
3
6
9
Dec 17 Jun 18 Dec 18
EW CHURN %
For
per
sona
l use
onl
y

1H F19 RESULTS
Developed over five years in conjunction with some of the world’s leading performance practitioners, Catapult Vector delivers new levels of accuracy, usability and efficiency to inform critical decisions around performance, injury risk, and return-to-play.
Vector delivers a range of new features, benefits and innovations, including:
● Leading in-stadium performance● Combined indoor and outdoor tracking● Enhanced live experience● Fast, efficient and logical workflows● Integrated heart rate monitoring● Miniaturised device● FIFA and World Rugby compliance● Evolution of the user experience
PRODUCT INNOVATION IN ELITE CONTINUES
10
VECTORPlayertek+ offers a lower cost elite device that allows sub-elite teams to transition to a more elite offering with an advanced technological solution that includes heart rate monitoring, live tracking functionality and enhanced software features designed for improved analysis, a charge case for easy post-session downloading and premium garment design.
PLAYERTEK+
Providing a fast and intuitive workflow for tagging, editing and presenting video analysis, Catapult VISION helps you to communicate clear, powerful coaching messages.
VISION
For
per
sona
l use
onl
y

1H F19 RESULTS11
PROSUMER - KEY MESSAGES
Unit sales growth of 2.1x
This sales growth was below forecast milestones – as a result cash costs for FY19 will be ~$3 million lower than anticipated
Catapult believes in the long-term potential of the Prosumer business and is committed to driving sustainable growth at a rate more consistent with current market maturity and off a significantly reduced expense base
Projected growth in unit sales for FY19 revised to between 1.5x and 2x FY18 volume of 14k units
In addition to the ~$3 million of cash cost reductions in FY19 the Board also anticipates further cash cost reductions for the Prosumer business in FY20.F
or p
erso
nal u
se o
nly

1H F19 RESULTS12
PLAYR DRIVING GROWTH IN PROSUMER VOLUMESF
or p
erso
nal u
se o
nly

1H F19 RESULTS
1H19$m
Reported
1H18$m
Reported
% changeYoY
Capital revenue 11.6 8.2 41%
Subscription revenue 30.9 23.7 30%
Other revenue 0.5 0.5 -
Total revenue 43.0 32.4 32%
Cost of Goods Sold (11.7) (7.4) (58%)
Gross margin 73% 77% (4%)
Employee expenses (22.5) (20.0) (13%)
Travel, marketing and promotion expenses (4.4) (3.6) (22%)
Other operating expenses (5.8) (6.6) 12%
Total Operating expenses (32.7) (30.2) (8%)
Statutory EBITDA (1.4) (5.2) 73%
Underlying EBITDA (0.7) (3.9) 82%
Elite Wearables ARR 27.6 20.9 32%
Elite Video ARR 29.1 24.6 18%
Prosumer Wearables ARR 0.7 0.4 75%
Group ARR 57.4 45.9 25%
• Revenue growth driven by strong result in elite wearables (includes Playertek + ) (up 38%)
• Higher capital revenue contribution impacted by $1.4m increase in Prosumer sales
• Elite subscription revenue as a % of total elite revenue 73%
• Total opex grew 8% down from 26% on pro-forma basis in H1FY18
• Employee expenses grew 13% down from 39% on pro-forma basis in H1FY18. Increased employee expenses largely driven by investment in sales and marketing
PROFIT AND LOSS STATEMENT
13
For
per
sona
l use
onl
y

1H F19 RESULTS
UNDERPINNED BY GROWTH IN RECURRING REVENUE
Subs. 23.7
Other8.7
1H18 REVENUE
3.7
Subscription
1.3
Subscription PROSUMER
0.53.0
Subs. 30.4
Other12.6
1H19 REVENUE
Capital sales
Hardware
0.7
73% of elite revenue growth and 63% of total revenue growth driven by growth in elite products recurring revenue
$43.0m
$32.4m
Other
ELITE WEARABLES
1.4
ELITE VIDEO
REVENUE GROWTH
14
For
per
sona
l use
onl
y

1H F19 RESULTS
EXPENSE GROWTH BELOW REVENUE GROWTH
OPEX +8% SCALED FOR GROWTH(STAFF NUMBERS)
OPERATING EXPENSES
15
0
5
10
15
20
25
30
35
1H18 1H19
Labour Non-labour
$m
Headcount by region
Americas APAC EMEA
125
288311
349
FY16 FY17 FY18 1H19For
per
sona
l use
onl
y

1H F19 RESULTS
POSITIVE EBITDA CONTRIBUTION FROM ELITE WEARABLES AND ELITE VIDEO
1H19 ($m) Wearables Elite Video New Products Corporate Costs Total
Revenue – external customers 19.6 20.7 2.7 - 43.0
Segment EBITDA 4.3 5.4 (3.6) (7.5) (1.4)
1H18 ($m)
Revenue – external customers 14.2 16.9 1.3 - 32.4
Segment EBITDA 1.4 4.3 (3.3) (7.6) (5.2)
• Core underlying EBITDA* $3.6m entirely attributable to H1FY19 (increase of $3.5m H1FY18)
• New products revenue $2.7m comprises PLAYERTEK and PLAYR
* Core underlying EBITDA (EW + EV + 90% allocation of corp. costs less underlying adjustments)
SEGMENTS
16
For
per
sona
l use
onl
y

1H F19 RESULTS
CASH FLOW
• Group cash receipts from customers up
22% to $55.5m
• Group negative free cash flow -$1.6m;
core underlying free cash flow $4.0m
17
$31.7m
$55.5m
-$50.4m$27.1m
-$6.9M -$3.0m
CASH BALANCE 30/6/2018
RECEIPTS FROM
CUSTOMERS
PAYMENTS TO SUPPLIERS & EMPLOYEES
INVESTMENT IN PPE & OTHER
FINANCING & FX
CASH BALANCE
31/12/18
Net operating cash flow +$5.3m
Free cash flow -$1.6m
OTHER
$0.2m
For
per
sona
l use
onl
y

1H F19 RESULTS
Assets31-Dec-18
$m30-Jun-18
$m
Cash and cash equivalents 27.1 31.7
Trade and other receivables 21.4 31.1
Inventory 5.8 3.8
PP&E 8.7 8.7
Goodwill 59.2 56.7
Other intangibles 42.5 42.1
Other assets 10.4 10.3
Total Assets 175.1 184.4
Liabilities
Trade and other payables 10.7 11.2
Employee benefits 6.7 8.9
Contract liabilities 26.7 26.2
Other liabilities 7.8 11.0
Total liabilities 51.9 57.3
Total Equity 123.2 127.1
• Trade and other receivables balance down 31% from FY18.
• Goodwill and other intangibles associated with transformational XOS and PLAYERTEK acquisitions
• Contract liabilities balance represents invoiced subscription contracts.
1 Current assets less current liabilities
STRONGER BALANCE SHEET PROVIDES PLATFORM FOR GROWTH
18
For
per
sona
l use
onl
y

1H F19 RESULTS1H F19 RESULTS19
For
per
sona
l use
onl
y

1H F19 RESULTS
$9.7m
-$7.5m
$0.7m
-$3.6m
$0.7m $3.6m
-$0.7m -$0.7m
ELITE WEARABLE & VIDEO EBITDA
CORP. COSTS EMPLOYEE SHARE PLAN
COSTS
NEW PRODUCT SHARE OF
CORP. COSTS
CORE UNDERLYING
EBITDA
NEW PRODUCTS
EBITDA
NEW PRODUCTS SHARE OF
CORP COSTS
GROUP UNDERLYING
EBITDA
PROFITABLE CORE: EBITDA RECONCILIATION
20
For
per
sona
l use
onl
y

1H F19 RESULTS
$3.6m
$0.7m
$1.8m
H1FY19 GROUP FCF
NEW BUSINESS
CAPEX
NEW PRODUCT SHARE OF
CORP. COSTS
NEW PRODUCTS
EBITDA
FY19 CORE FCF
-$1.6m
$4.0m
-$0.5m
OTHER WORKING CAPITAL
CASHFLOW POSITIVE CORE
21
For
per
sona
l use
onl
y

1H F19 RESULTS1H F19 RESULTS1H F19 RESULTS22
For
per
sona
l use
onl
y

1H F19 RESULTS23
CEO RECRUITMENT PROCESS
Joe Powell resigned as CEO on 7 February 2019, providing 6 months’ notice
The Board has delegated a sub-committee to appoint a new CEO
The Company has commenced a global executive search for a new CEO
For
per
sona
l use
onl
y

1H F19 RESULTS
Wearables
Video
AMS
>2,100Current Catapult
Organisations and 2,500 teams
c. 10,000 teams1
Plus, we think an additional 10,000 teams will push up into this market over time
1 Based on bottom-up management
analysis
2 Current addressable market based
on management estimates
3 HTF Market Report September 2018
GROWING ADDRESSABLE MARKETUNDERPENETRATED MARKET
$450m-$550m2
Industry growth ~40% CAGR
through to 20223
LARGE AND GROWING ADDRESSABLE MARKET
24
For
per
sona
l use
onl
y

1H F19 RESULTS
Measure FY18 base FY19 Guidance Comment
Elite Core Revenue** $73.4m Between $86m and $88m Implies growth between 17% and 20%
Underlying Core EBITDA*** $8.0m Between $11m and $13m Implies growth between 37% and 63%
Annualised recurring revenue (ARR) $53.4m Growth above 20% Accelerating growth
All guidance assumes AUD to USD of 75 cents across all USD denominated transactions and no material impacts arising from the adoption of AASB15** Excludes Prosumer*** Excludes Prosumer, investment in tactical analytics software and employee share plan expense
In-line with The Group’s long term guidance provided in March 2018 Catapult is on track to generate positive cash flow at the Group level by FY21. In addition a body of work is being undertaken by management and the Board to explore the possibility of delivering positive cash flow sooner.
REAFFIRMING FY19 GUIDANCE
25
For
per
sona
l use
onl
y

PLAY SMART
1H F19 RESULTS
26F
or p
erso
nal u
se o
nly

27
Disclaimer - Forward-looking statementsAny forward-looking statements, opinions and estimates provided in this announcement rely on variouscontingencies and assumptions. Various factors and risks, both known and unknown, many of which areoutside the control of Catapult, may impact upon the performance of Catapult and cause actualperformance to vary significantly from expected results. There can be no guarantee that Catapult willachieve its stated objectives or that forward looking statements or forecasts will prove to be accurate.
For
per
sona
l use
onl
y