1H FY07/3 Financial Results and Outlook - Renesas … · 1H FY07/3 Financial Results and Outlook...
24
1 1H FY07/3 Financial Results and Outlook Toshio Nakajima President and CEO October 25, 2006 NEC Electronics Corporation http://www.necel.com/ir/en/
Transcript of 1H FY07/3 Financial Results and Outlook - Renesas … · 1H FY07/3 Financial Results and Outlook...

1
1H FY07/3Financial Results and Outlook
Toshio NakajimaPresident and CEO
October 25, 2006NEC Electronics Corporation
http://www.necel.com/ir/en/

2© NEC Electronics Corporation
CAUTIONARY STATEMENTS:The statements in this presentation with respect to the plans, strategies and forecasts of NEC Electronics and its consolidated subsidiaries (collectively “we”) are forward-looking statements involving risks and uncertainties. We caution you in advance that actual results could differ materially from such forward-looking statements due to several factors. The important factors that could cause actual results to differ materially from such statements include, but are not limited to, general economic conditions in our markets, which are primarily Japan, North America, Asia and Europe; demand for, and competitive pricing pressure on, our products and services in the marketplace; our ability to continue to win acceptance of its products and services in these highly competitive markets; and movements in currency exchange rates, particularly the rate between the yen and the U.S. dollar. Among other factors, aworsening of the world economy; a worsening of financial conditions in the world markets, and a deterioration in the domestic and overseas stock markets, would cause actual results to differ from the projected results forecast.

3© NEC Electronics Corporation
Agenda
I. 1H FY07/3 Financial Results
II. FY07/3 Financial Forecasts
III. Progress on Measures to Improve Performance

4© NEC Electronics Corporation
+ 24.9% points
+ 82.9
+ 23.1
+5.1% points
+ 16.6
+ 9.0
+ 10.0
HoH
1US$= ¥1151Euro= ¥145
-2.2%
-7.4
-5.6
-2.0%
-6.9
327.8
343.0
1H
-2.6%+ 0.3% points-0.7%-3.7%-0.9%Net Income Margin
FY07/3
+ 0.5
+ 8.1
+1.9% points
+ 5.2
+ 27.5
+ 30.1
YoY
Q2
FY06/3
Q1Previous Forecasts
1US$= ¥1151Euro= ¥147
-1.3
-0.8
-0.7%
-1.2
169.7
177.8
1US$= ¥1151Euro= ¥140
-9.0
-7.0
-1.4%
1US$= ¥1101Euro= ¥134
-1.6
-2.9
-1.4%
-2.3
160.0
166.8
Q2
1US$= ¥1151Euro= ¥142Exchange Rate
-6.1Net Loss
-4.8EBT
-3.5%Operating Margin
-5.0-5.8Operating Loss
330.0158.1Semiconductor Sales
345.0165.2Net Sales
JPY Bn
Note: Operating Income (loss) = Net Sales – COGS – R&D – SG&A
A Financial Snapshot

5© NEC Electronics Corporation
169.7
1.3
-9.8
179.1 181.2160.7 158.7 140.3
160.0156.8 162.0
158.1
-1.2-7.0
-16.6
-5.8
15.2 15.5
1.2-2.3
177.8
165.2170.3
162.7166.8
146.1
165.9165.3
191.2185.6
-1.4%
-9.7%
-3.5%
8.1%8.2%
-0.7%
-4.3%
0.7%0.8%
-6.7%
1Q 2Q 3Q 4Q 1Q 2Q 3Q 4Q 1Q 2Q
Expensed Assets
FY05/3
Semiconductor Sales
Other
Net Sales
OperatingMargin
JPY Bn
Operating Income (loss)
FY05/3 FY06/3
Note: Operating Income (loss) = Net Sales – COGS – R&D – SG&A
FY07/3
Trends in Quarterly Results

6© NEC Electronics Corporation
58.3 61.1
40.8 41.2
59.067.5
approx. 25.0approx. 24.0
0
40
80
120
160
200JPY Bn
158.1Semiconductor Sales
Display Driver ICs
Q1 Q2
Components•An increase in sales of discrete and optical semiconductors•An increase in sales of LCD drivers for small panels
MCU Platform•Sales for Auto and general-purpose MCUs remained flat
SOC Platform•An increase in sales due to launching shipments of LSIs for a new game console•An increase in sales of LSIs for printers and DVD drives due to seasonality factors•A decrease in sales of digital baseband LSIs for mobile handsets due to continued inventory adjustments in the Japanese market
169.7+7%
+14%
+1%
+5%
Q1-Q2 Revenue Growth by Platform
Growth Factors in Q1-Q2 Revenues
FY07/3

7© NEC Electronics Corporation
28.7
20.9
26.3
23.4
28.5
30.8
23.3
25.8
30.7
30.3
34.7
24.6158.1
169.7
Q1 Q2
+7%Semiconductor Sales
Discrete, Opt & Microwave
Auto & Industrial
Consumer Electronics
Computing & Peripherals
Communications
Multi-Market ICs
Q1-Q2 Revenue Growth by Application
FY07/3
-14%
+15%
+31%
-2%
+12%
+7%• Sales of discrete and chemical compound semiconductors increased
• Sales increased overall, including the All Flash microcontrollers
• Sales for automotive area remained flat
• Launched shipments of LSIs for a new game console• Shipments of LSIs for digital AV increased
• Sales of LSIs for DVD drives increased • Sales of LCD driver ICs for large panel remained flat
• Sales of digital baseband LSIs for mobile handsets decreased •Sales of LCD driver ICs for mobile handsets increased due to an increased share
Growth Factors in Q1-Q2 RevenuesJPY Bn

8© NEC Electronics Corporation
Changes in Q1-Q2 Profits
+7.6+6.853.1
(29.8%)46.3
(28.0%)Gross Profit
+1.2+4.6-1.2
(-0.7%)-5.8
(-3.5%)Operating
Losses
Q2Q1
JPY Bn
+1.3
+1.3
+0.9
+5.8
+11.7
+12.5
QoQ
+1.422.3
(12.6%)21.1
(12.8%)SG&A
Expenses
+5.031.9
(17.9%)31.0
(18.7%)R&D Expenses
26.8
118.9(72.0%)
158.1
165.2
(% Against Net sales)
-1.428.1Depreciation (CF)
+ Lease
+3.4124.7
(70.2%)Cost of Goods
Sold
+9.7169.7Semiconductor Sales
+10.9177.8Net Sales
YoY(% Against Net
sales)
Increased GP
Increased SG&A Expenses
IncreasedR&D Expenses
SemiconductorSales
Operating Loss
Q1 Q2
158.1169.7
-5.8 -1.2
+11.7
FY07/3
9© NEC Electronics Corporation
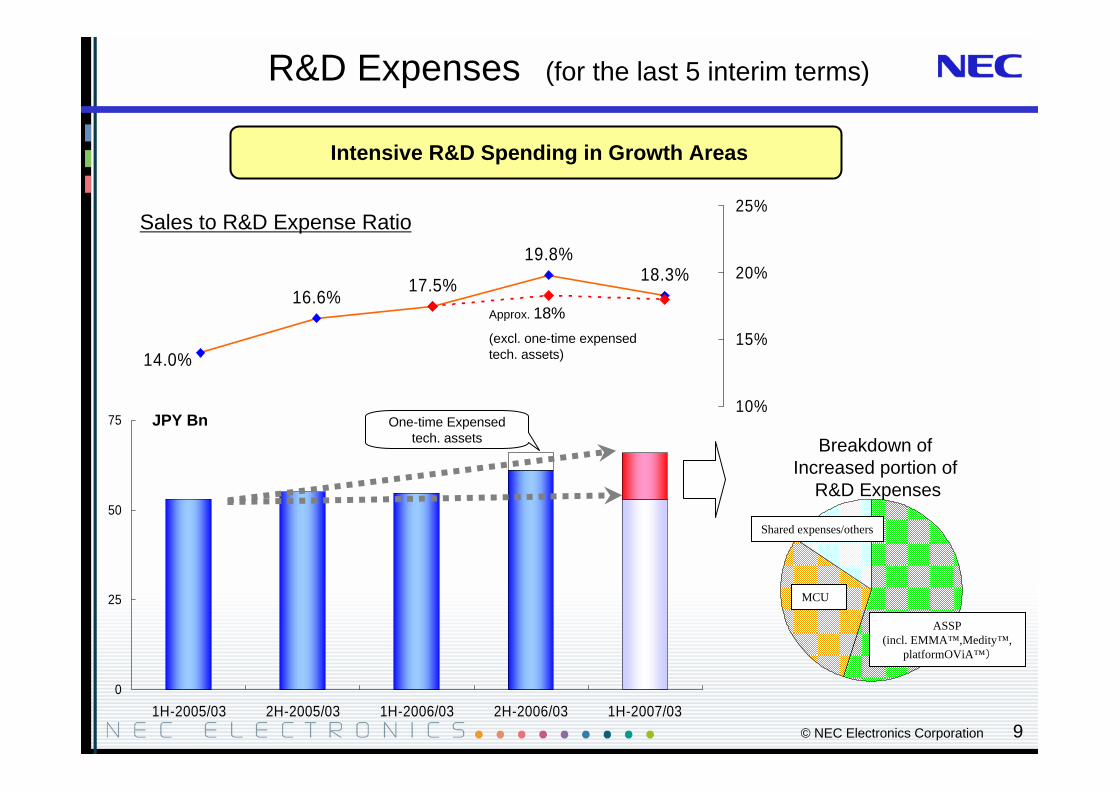
16.6% 17.5%
19.8%18.3%
14.0%
10%
15%
20%
25%
R&D Expenses (for the last 5 interim terms)
Sales to R&D Expense Ratio
Intensive R&D Spending in Growth Areas
0
25
50
75
1H-2005/03 2H-2005/03 1H-2006/03 2H-2006/03 1H-2007/03
JPY Bn One-time Expensed tech. assets Breakdown of
Increased portion of R&D Expenses
ASSP(incl. EMMA™,Medity™,
platformOViA™)
MCU
Shared expenses/others
Approx. 18%(excl. one-time expensed tech. assets)

10© NEC Electronics Corporation
Balance Sheet
40%0.49
299.2439.3155.1146.6137.5742.645.6
309.576.1
106.5204.8
06/6
38%49%Equity Ratio0.490.39D/E Ratio
298.0388.1Shareholders’ Equity
474.8407.7Liabilities159.5138.2Other Liabilities
146.0151.9Debt Payable
169.2117.5Accounts Payable
777.0799.7Total Assets
49.488.0Other Assets
305.9324.7PP&E
83.172.2Inventories
116.7113.3Accounts Receivable
222.0201.7Cash and Cash Equivalents
06/905/9JPY Bn

11© NEC Electronics Corporation
Cash Flows
-4.6
-12.4
7.8
Q1 Q21H
-19.5
-34.2
14.7
1H
13.4
-21.1
34.6
FY07/3
18.1Free Cash Flow
-8.7Cash Flows from Investing Activities
26.8Cash Flows from Operating Activities
FY06/3JPY Bn
Free cash flow turned black for the 1H FY07/3

12© NEC Electronics Corporation
Agenda
I. 1H FY07/3 Financial Results
II. FY07/3 Financial Forecasts
III. Progress on Measures to Improve Performance

13© NEC Electronics Corporation
Full Year
-¥145¥137-¥145¥135-¥145¥140¥1381Euro=
¥113
-5.0
0
5.0
680.0
705.0
Previous Forecasts
(as of April 25th)
¥115
Approx.
-17.6
Approx.
-13.4
0
Approx.
340.0
Approx.
350.0
2HForecasts
2H
-
+1.6
+1.4
-1.9
-2.2
-1.9
changes
¥115
-9.0
-7.0
-5.0
330.0
345.0
Previous Forecasts
(as of April 25th)
FY07/3
-¥110
4.0
7.0
10.0
350.0
360.0
Previous Forecasts
(as of April 25th)
Full Year1H
-25.0
-19.0
-7.0
667.8
695.0
Full YearForecasts
¥115
-20.0
-19.0
¥112
-98.2
-42.4
-35.7
619.1
646.0
FY06/3
changes1HResults
-
Approx.
-22.0
Approx.
-20.0
Approx.
-10.0
Approx.
-10.0
Approx.-10.0
¥1151US$=
-12.2327.8Semiconductor Sales
-7.4
-5.6
-6.9
343.0
Exchange Rates
Net Income (Loss)
EBT
-12.0Operating Income (Loss)
-10.0Net Sales
changes
JPY Bn
Note 1: Operating Income (loss) = Net Sales – COGS – R&D – SG&ANote 2: FY07/3 forecasts are as of October 25, 2006
FY07/3 Forecasts

14© NEC Electronics Corporation
•Expenses for closing the plant carried over•Expenses involving memory-related litigation•Expenses related to various reforms
•Expenses for closing the Ireland plant•Expenses for closing the Sagamihara 200mm pilot line
Non-operating Expenses
Non-operating Income
-7.0-12.0-5.0Approx.
-10.4Approx.
-13.4-3.0+3.3+1.3-2.0-6.7
Full Year
Previous Forecasts
(as of April 25th)
2HForecasts
2H
changes
•Gain on sale of marketable securities and others
Previous Forecasts
(as of April 25th)
FY07/3
Previous Forecasts
(as of April 25th)
Full Year1H
Full Year Forecasts
FY06/3
changes1HResults changes
JPY Bn
Non-Operating Income and Expenses
Note 1: Operating Income (loss) = Net Sales – COGS – R&D – SG&ANote 2: FY07/3 forecasts are as of October 25, 2006

15© NEC Electronics Corporation
JPY Bn
Operating Income
Semiconductor Sales
Changes in Exchange Rates
Approx. +4.0
Lower profits fromSales decline
Approx. -6.0
Previous Forecasts(as of April 25th)
Changes in Previous and Current 2H Forecasts
10.0
350.0340.0
Market slowdown and sales decline in the mobile handsets area drag down overall semiconductor sale
Lower-than-estimated profits from improving product mix~Refining product lines still underway
An increase in R&D expenses~strategic spending for future growth
Approx. -5.0
Approx. -5.0
Cutting SG&A Expenses
Approx. +2.0
-10.0Bn
Current Forecasts(as of Oct 25th)
0
Semiconductor Sales
Operating Income
16© NEC Electronics Corporation
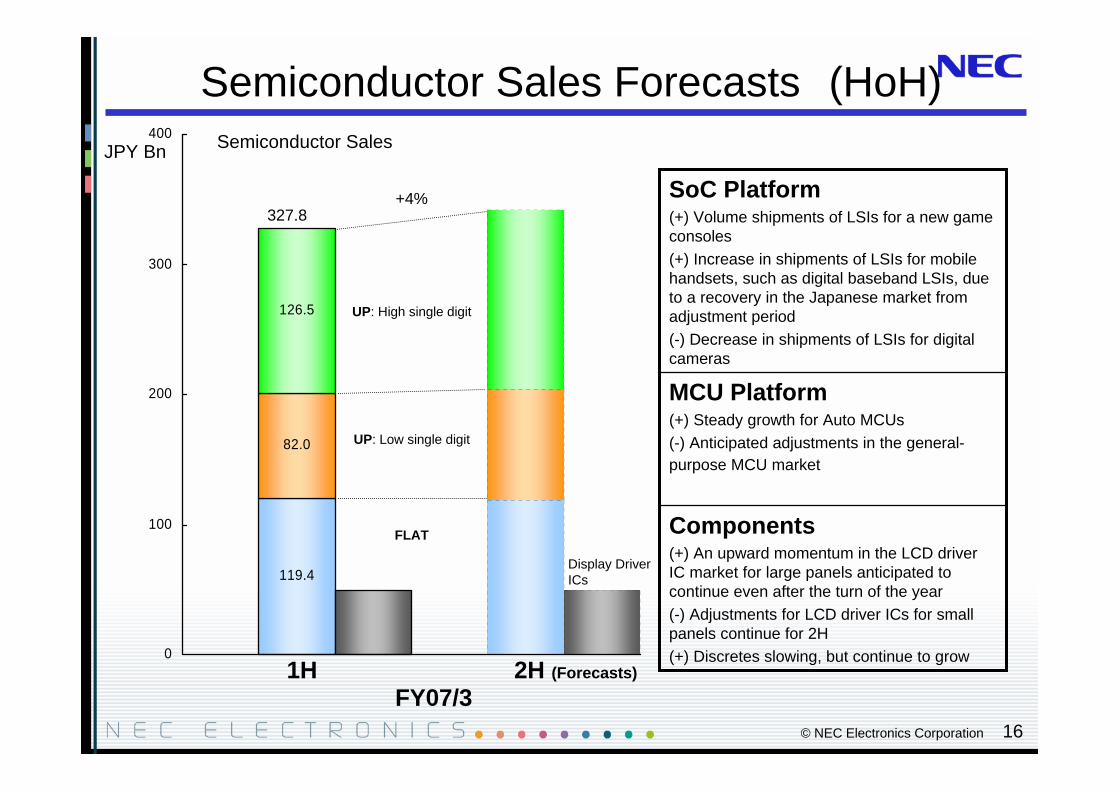
+4%
UP: High single digit
UP: Low single digit
FLAT
119.4
82.0
126.5
0
100
200
300
400JPY Bn
Display Driver ICs
1H 2H (Forecasts)
Components(+) An upward momentum in the LCD driver IC market for large panels anticipated to continue even after the turn of the year(-) Adjustments for LCD driver ICs for small panels continue for 2H(+) Discretes slowing, but continue to grow
MCU Platform(+) Steady growth for Auto MCUs(-) Anticipated adjustments in the general-purpose MCU market
SoC Platform(+) Volume shipments of LSIs for a new game consoles(+) Increase in shipments of LSIs for mobile handsets, such as digital baseband LSIs, due to a recovery in the Japanese market from adjustment period(-) Decrease in shipments of LSIs for digital cameras
Semiconductor Sales Forecasts (HoH)Semiconductor Sales
FY07/3
327.8

17© NEC Electronics Corporation
Operating Loss
Semiconductor Sales
Changes in 1H – 2H Operating Income (Loss)
Increased profitsfrom sales increase
Approx. +7.5
1H Results
Increase in R&D expenses
Depreciation & lease
Approx. -11.5
Approx. +12.2 Bn
2H Forecasts
0
-6.9
327.8340.0
Lower foundry rate
Approx. +4.5
Cutting SG&A Expenses
Approx. +2.0
Cost cutting effect
Approx. +4.5
JPY Bn
FY07/3
Approx.
+18.5
Operating Income

18© NEC Electronics Corporation
Capex, Depreciation and Lease expenses
Majority of Capex spent in 1H, Expenses increase in 2H
Capex Spending Depreciation & Lease expenses
1H
Front-end
Back-end
Depreciation
Lease
R&D Expenses,Others
(Tangible assets, delivery base)
JPY Bn
80
60
40
20
02H 1H 2H
FY06/3 FY07/31H
(Depreciation, Cash flow base)
2H 1H 2HFY06/3 FY07/3

19© NEC Electronics Corporation
Agenda
I. 1H FY07/3 Financial Results
II. FY07/3 Financial Forecasts
III. Progress on Measures to Improve Performance
20© NEC Electronics Corporation
Develop Stronger Products and Recover Profitability
Lower costs to sales ratio with capacity increase and higher utilization rate
Expanding orders and sales
Measures to Improve Performance
2nd Half FY07/3

21© NEC Electronics Corporation
0
100
200
300
80
90
100
Manufacturing Capacity (8-inch K wafers/ month, Average) Utilization Rate (Front-end)
(%)
Lower foundry usage rate
Manufacturing capacity is expected to increase by about 10% from 1H to 2H due to investments in the 300mm line at Yamagata and the OEE* activities, however, not enough orders to fill the lines *OEE (Overall Equipment Efficiency)
Lower foundry usage rate to maintain high in-house utilization rate
12% 7%
Foundry Usage Rate
Measures to Improve Performance
Lower costs to sales ratio with capacity increase and higher utilization rate
1H 2H 1H 2HFY06/3 FY07/3
1H 2H 1H 2HFY06/3 FY07/3
22© NEC Electronics Corporation
1500
2000
2500
3000
3500
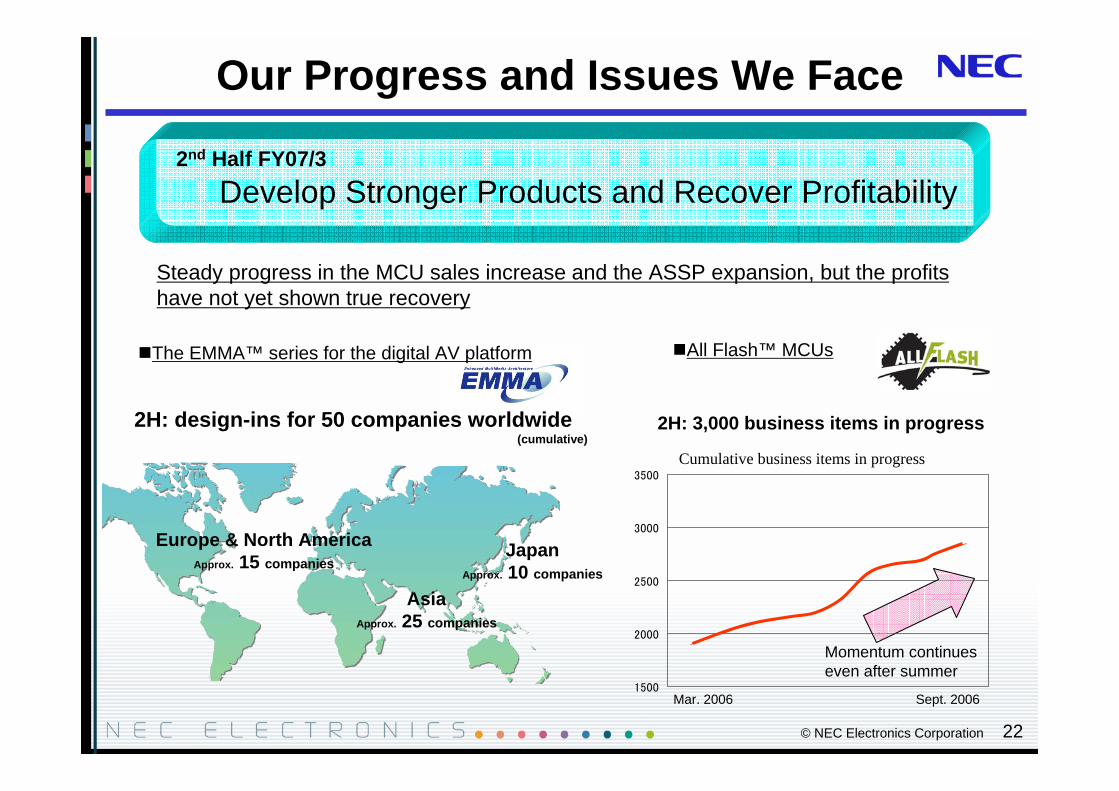
Our Progress and Issues We Face
Steady progress in the MCU sales increase and the ASSP expansion, but the profits have not yet shown true recovery
The EMMA™ series for the digital AV platform
2H: design-ins for 50 companies worldwide (cumulative)
2H: 3,000 business items in progress
Cumulative business items in progress
Mar. 2006 Sept. 2006
Momentum continues even after summer
Develop Stronger Products and Recover Profitability2nd Half FY07/3
All Flash™ MCUs
JapanApprox. 10 companies
AsiaApprox. 25 companies
Europe & North AmericaApprox. 15 companies

23© NEC Electronics Corporation
Develop Stronger Products and Recover Profitability
Lower costs to sales ratio with capacity increaseand higher utilization rate
Expanding orders and sales
Continue to work on sales & order expansion and cost cutting measures, while developing products to recover profitability
Measuring Our Progress
24© NEC Electronics Corporation